FY 2014 CAFR
241
BOARD OF EDUCATION OF SHELBY COUNTY, TENNESSEE (A COMPONENT UNIT OF SHELBY COUNTY, TENNESSEE) COMPREHENSIVE ANNUAL FINANCIAL REPORT For the Fiscal Year Ended June 30, 2014
-
Upload
alicia-lindsey-cpa-cgma -
Category
Documents
-
view
67 -
download
1
Transcript of FY 2014 CAFR

This will be the BackCover.pdf file that you will put in the Graphics folder. You don’t need to refer to this in the spreadsheet.
Back Cover
BOARD OF EDUCATION OFSHELBY COUNTY, TENNESSEE(A COMPONENT UNIT OF SHELBY COUNTY, TENNESSEE)
COMPREHENSIVEANNUAL FINANCIAL
REPORTFor the Fiscal Year Ended June 30, 2014


Board of Education
Shelby County, Tennessee
Comprehensive Annual Financial Report
For the Fiscal Year Ended
June 30, 2014
Prepared by:
Shelby County Board Of Education
Department of Finance


Table of Contents
INTRODUCTORY SECTIONLetter of Transmittal . . . . . . . . . . . . . . . . . . . . . . . . . . . . . . . . . . . . . . . . . . . . . . . . . . . . . . . . . . . . . . . . . . .3Shelby County Board of Education . . . . . . . . . . . . . . . . . . . . . . . . . . . . . . . . . . . . . . . . . . . . . . . . . . . . . .13Organizational Chart . . . . . . . . . . . . . . . . . . . . . . . . . . . . . . . . . . . . . . . . . . . . . . . . . . . . . . . . . . . . . . . . .14
FINANCIAL SECTIONIndependent Auditor’s Report . . . . . . . . . . . . . . . . . . . . . . . . . . . . . . . . . . . . . . . . . . . . . . . . . . . . . . . . . .17Management’s Discussion and Analysis . . . . . . . . . . . . . . . . . . . . . . . . . . . . . . . . . . . . . . . . . . . . . . . . . .21
BASIC FINANCIAL STATEMENTS
Government-wide Financial Statements:Statement of Net Position . . . . . . . . . . . . . . . . . . . . . . . . . . . . . . . . . . . . . . . . . . . . . . . . . . . . . . . . . . . . .41Statement of Activities . . . . . . . . . . . . . . . . . . . . . . . . . . . . . . . . . . . . . . . . . . . . . . . . . . . . . . . . . . . . . . . .42
Fund Financial Statements:Balance Sheet – Governmental Funds . . . . . . . . . . . . . . . . . . . . . . . . . . . . . . . . . . . . . . . . . . . . . . . . . . .44Reconciliation of the Governmental Funds Balance Sheet to the Government wide
Statement of Net Position . . . . . . . . . . . . . . . . . . . . . . . . . . . . . . . . . . . . . . . . . . . . . . . . . . . . . . . . . .45Statement of Revenues, Expenditures, and Changes in Fund Balances –
Governmental Funds . . . . . . . . . . . . . . . . . . . . . . . . . . . . . . . . . . . . . . . . . . . . . . . . . . . . . . . . . . . . .46Reconciliation of the Governmental Funds Statement of Revenues, Expenditures, and Changes In
Fund Balances to the Government wide Statement of Activities . . . . . . . . . . . . . . . . . . . . . . . . . . . . .47Statement of Revenues, Expenditures, and Changes in Fund Balance – Budget and Actual –
General Fund . . . . . . . . . . . . . . . . . . . . . . . . . . . . . . . . . . . . . . . . . . . . . . . . . . . . . . . . . . . . . . . . . . .48Statement of Revenues, Expenditures, and Changes in Fund Balance – Budget and Actual –
Special Revenue Categorically Aided Fund . . . . . . . . . . . . . . . . . . . . . . . . . . . . . . . . . . . . . . . . . . . .49Statement of Net Position – Proprietary Fund . . . . . . . . . . . . . . . . . . . . . . . . . . . . . . . . . . . . . . . . . . . . . .50Statement of Revenues, Expenses, and Changes in Net Position – Proprietary Fund . . . . . . . . . . . . . . .51Statement of Cash Flows – Proprietary Fund . . . . . . . . . . . . . . . . . . . . . . . . . . . . . . . . . . . . . . . . . . . . . .52Statement of Fiduciary Net Position . . . . . . . . . . . . . . . . . . . . . . . . . . . . . . . . . . . . . . . . . . . . . . . . . . . . .53Statement of Changes in Fiduciary Net Position – Fiduciary Funds . . . . . . . . . . . . . . . . . . . . . . . . . . . . .54
Notes to the Basic Financial Statements . . . . . . . . . . . . . . . . . . . . . . . . . . . . . . . . . . . . . . . . . . . . . . . . . . .55
REQUIRED SUPPLEMENTARY INFORMATIONSchedules of Funding Progress and Employer Contributions . . . . . . . . . . . . . . . . . . . . . . . . . . . . . . . . . .93Schedule of Investment Returns . . . . . . . . . . . . . . . . . . . . . . . . . . . . . . . . . . . . . . . . . . . . . . . . . . . . . . . .94Schedule of Changes in Net Pension Liability and Related Ratios . . . . . . . . . . . . . . . . . . . . . . . . . . . . . .95
COMBINING AND INDIVIDUAL FUND STATEMENTS AND SCHEDULESCombining Balance Sheet - Nonmajor Governmental Funds . . . . . . . . . . . . . . . . . . . . . . . . . . . . . . . . . .99Combining Statement of Revenues, Expenditures, and Changes in Fund Balances - Nonmajor
Governmental Funds . . . . . . . . . . . . . . . . . . . . . . . . . . . . . . . . . . . . . . . . . . . . . . . . . . . . . . . . . . . . .100Schedule of Revenues, Expenditures, and Changes in Fund Balance – Budget and Actual –
Capital Projects Fund . . . . . . . . . . . . . . . . . . . . . . . . . . . . . . . . . . . . . . . . . . . . . . . . . . . . . . . . . . . .101Schedule of Revenues, Expenditures and Changes in Fund Balance – Budget and Actual –
Food Service Fund . . . . . . . . . . . . . . . . . . . . . . . . . . . . . . . . . . . . . . . . . . . . . . . . . . . . . . . . . . . . . .102Combining Statement of Net Position – Internal Service Funds . . . . . . . . . . . . . . . . . . . . . . . . . . . . . . .105Combining Statement of Revenues, Expenses and Changes in Net Position –
Internal Service Funds . . . . . . . . . . . . . . . . . . . . . . . . . . . . . . . . . . . . . . . . . . . . . . . . . . . . . . . . . . .106Combining Statement of Cash Flows – Nonmajor and Internal Service Funds . . . . . . . . . . . . . . . . . . . .108Statement of Changes in Assets and Liabilities – Agency Fund . . . . . . . . . . . . . . . . . . . . . . . . . . . . . . . 113
Capital Assets InformationSchedule of General Capital Assets by Function and Activity . . . . . . . . . . . . . . . . . . . . . . . . . . . . . . . . . 114Schedule of Changes in General Capital Assets by Function and Activity . . . . . . . . . . . . . . . . . . . . . . . 116
i

Table of Contents (continued)
Debt InformationSchedule of General Long-Term Obligations . . . . . . . . . . . . . . . . . . . . . . . . . . . . . . . . . . . . . . . . . . . . . 118Schedule of General Long-Term Obligations Principal and Interest Requirements . . . . . . . . . . . . . . . . 120
STATISTICAL SECTION (Unaudited)Overview. . . . . . . . . . . . . . . . . . . . . . . . . . . . . . . . . . . . . . . . . . . . . . . . . . . . . . . . . . . . . . . . . . . . . . . . . . . . . . . . 123
Financial TrendsNet Position by Component . . . . . . . . . . . . . . . . . . . . . . . . . . . . . . . . . . . . . . . . . . . . . . . . . . . . . . . . . . 126Statement of Activities . . . . . . . . . . . . . . . . . . . . . . . . . . . . . . . . . . . . . . . . . . . . . . . . . . . . . . . . . . . . . . 128General Revenues and Total Changes in Net Position . . . . . . . . . . . . . . . . . . . . . . . . . . . . . . . . . . . . . 130Fund Balances, Governmental Funds . . . . . . . . . . . . . . . . . . . . . . . . . . . . . . . . . . . . . . . . . . . . . . . . . . 132Ten-Year Summary of Governmental Funds Revenues and Expenditures . . . . . . . . . . . . . . . . . . . . . . 134Ten-Year Comparison of General Fund Balance to Expenditures and Other Uses . . . . . . . . . . . . . . . . 136
Revenue CapacityAssessed Value and Estimated Actual Value of Taxable Property . . . . . . . . . . . . . . . . . . . . . . . . . . . . . 138Property Tax Rates and Levies . . . . . . . . . . . . . . . . . . . . . . . . . . . . . . . . . . . . . . . . . . . . . . . . . . . . . . . . 140Principal Property Tax Payers – Current Year and Nine Years Ago . . . . . . . . . . . . . . . . . . . . . . . . . . . . 142
Debt CapacityOutstanding Debt by Type . . . . . . . . . . . . . . . . . . . . . . . . . . . . . . . . . . . . . . . . . . . . . . . . . . . . . . . . . . . 147Ten-Year Comparison of Bonded Debt to Assessed Value, Estimated
Actual Value and Population . . . . . . . . . . . . . . . . . . . . . . . . . . . . . . . . . . . . . . . . . . . . . . . . . . . . . . 148Percentage of Debt Service to Non-Capital Expenditures – Last Ten Fiscal Years . . . . . . . . . . . . . . . . 149
Demographic and Economic InformationDemographic and Economic Statistics . . . . . . . . . . . . . . . . . . . . . . . . . . . . . . . . . . . . . . . . . . . . . . . . . . 153Principal Employers, Current Year and Nine Years Ago . . . . . . . . . . . . . . . . . . . . . . . . . . . . . . . . . . . . . 154
Operating InformationOperating Statistics . . . . . . . . . . . . . . . . . . . . . . . . . . . . . . . . . . . . . . . . . . . . . . . . . . . . . . . . . . . . . . . . . 158Weighted Full-time Equivalent Average Daily Attendance . . . . . . . . . . . . . . . . . . . . . . . . . . . . . . . . . . . 161Staff by Type . . . . . . . . . . . . . . . . . . . . . . . . . . . . . . . . . . . . . . . . . . . . . . . . . . . . . . . . . . . . . . . . . . . . . . 162Summary of Buildings and Sites . . . . . . . . . . . . . . . . . . . . . . . . . . . . . . . . . . . . . . . . . . . . . . . . . . . . . . . 164Schedule of Major Insurance Coverage . . . . . . . . . . . . . . . . . . . . . . . . . . . . . . . . . . . . . . . . . . . . . . . . . 210Graduation Information . . . . . . . . . . . . . . . . . . . . . . . . . . . . . . . . . . . . . . . . . . . . . . . . . . . . . . . . . . . . . . 211School Lunch Program . . . . . . . . . . . . . . . . . . . . . . . . . . . . . . . . . . . . . . . . . . . . . . . . . . . . . . . . . . . . . . 212Pupil Transportation . . . . . . . . . . . . . . . . . . . . . . . . . . . . . . . . . . . . . . . . . . . . . . . . . . . . . . . . . . . . . . . . 214
STATUTORY REPORTING SECTIONIndependent Auditors Report on Internal Control over Financial Reporting
and on Compliance and Other Matters . . . . . . . . . . . . . . . . . . . . . . . . . . . . . . . . . . . . . . . . . . . . . . 219Independent Auditor's Report on Compliance with Requirements
applicable to each Major Program and on Internal Control over Compliance in Accordance with OMB Circular A-133 . . . . . . . . . . . . . . . . . . . . . . . . . . . . . . . . . . . 222
Schedule of Expenditures of Federal, State and Other Awards . . . . . . . . . . . . . . . . . . . . . . . . . . . . . . . 224Notes to the Schedule of Expenditures of Federal Awards . . . . . . . . . . . . . . . . . . . . . . . . . . . . . . . . . . 229Schedule of Findings and Questioned Costs . . . . . . . . . . . . . . . . . . . . . . . . . . . . . . . . . . . . . . . . . . . . . 230Summary of Prior Year Findings . . . . . . . . . . . . . . . . . . . . . . . . . . . . . . . . . . . . . . . . . . . . . . . . . . . . . . . 231
ii

1
INTRODUCTORY SECTION
Introductory Section

2
This page left intentionally blank
3
Letter of Transmittal
160 S. Hollywood Street • Memphis, TN 38112 • (901) 416-5300 • www.SCSK12.org
December 15, 2014
Citizens and Shelby County Board of EducationShelby County, TN
State law requires that every general purpose local government publish, within six months of the close of each fiscal year, a complete set of audited financial statements. This report is published to fulfill that requirement for the fiscal year ended June 30, 2014.
Management assumes full responsibility for the completeness and reliability of the information contained in this report, based upon a comprehensive framework of internal control that it has established for this purpose. Because the cost of internal control should not exceed anticipated benefits, the objective is to provide reasonable, rather than absolute, assurance that the financial statements are free of any material misstatements.
Watkins Uiberall, PLLC and Banks, Finley, White & Co., has issued an unmodified (“clean”) opinion on the Shelby County Board of Education’s financial statement for the year ended June 30, 2014. The independent auditor’s report is located at the front of the financial section of this report.
Management’s discussion and analysis (MD&A) immediately follows the independent auditor’s report and provides a narrative introduction, overview, and analysis of the basic financial statements. MD&A complements this letter of transmittal and should be read in conjunction with it.
PROFILE OF THE SHELBY COUNTY BOARD OF EDUCATION
The first Shelby County-funded school opened in January 1871, and after five months of operation, the trustee for the school reported spending $554.20.
Shelby County Schools has grown from this modest beginning to now being the largest school system in the state of Tennessee and one of the largest districts in the nation.
During the last several years, Shelby County Schools (SCS) has experienced monumental change. On December 20, 2010, the Memphis City Board of Commissioners voted to surrender Memphis City Schools’ (MCS) Charter. Tennessee Code Annotated required that a referendum be held. Memphis voters ratified the Board’s decision to transfer the administration of Memphis City Schools to Shelby County Schools on March 8, 2011. Shelby County Schools filed a
160 S. Hollywood Street • Memphis, TN 38112 • (901) 416-5300 •SCSK12
4
complaint for declaratory judgment on February 11, 2011, and a U.S. District Judge ruled in August 2011 that Memphis City Schools would cease to exist at the conclusion of the 2012-13school year. In addition, the judge ruled that the pre-merged Shelby County School Board was “unconstitutional.” In order to cure the unconstitutionality of the County School Board, the parties agreed on a Memorandum of Understanding that allowed the Memphis City School Board members, the Shelby County School Board members and seven board members appointed by the Shelby County Board of Commissioners to govern both districts during the transition period.
The merger took place at the beginning of the 2013-2014 school year. At that time, MCS ceased.After the historic opening of the unified district, the final meeting of the 23-member unified Shelby County School Board was held in August 2013. In September 2013, a newly elected seven-member Board was seated, and its first major decision was the selection of a permanent superintendent.
Shelby County Schools – before the merger with the former Memphis City Schools - was the fourth largest school system in Tennessee. After the merger, Shelby County Schools became the largest school system in Tennessee. The District includes most of the public schools in the county – excluding those served by the Achievement School District (ASD). Prior to June 30, 2014, SCS included those schools inside and outside the corporate limits of the city of Memphis, and the schools located within the six (6) incorporated towns of Arlington, Bartlett, Collierville, Germantown, Lakeland, and Millington. SCS educated 141,814 students in grades K-12,including charter schools, in over 270 locations in fiscal year 2013-14.
During fiscal year 2013-14, the student demographic was 67.6 percent African American, 20.2percent Caucasian, 9.2 percent Hispanic and 3.0 percent other races and nationalities. TheDistrict had a composite ACT score of 17.7 compared to the State’s average of 19.3. The SCS graduation rate was 74.6 percent in 2014 compared to the State’s rate of 87.2.
Fiscal year 2013-14 was distinctive, as Memphis City Schools and Shelby County Schools were combined in the largest merger in the history of public education. During the next fiscal year, the landscape for SCS will shift again as it faces a “de-merger,” meaning the six suburban areas of Shelby County will form separate independent school districts.
Shelby County Schools is a component unit of Shelby County Government, which is defined as the oversight entity by GASB Codification Section 2100. Reporting for the SCS follows the criteria established by the Governmental Accounting Standards Board (GASB). During fiscal year 2014, the District was governed by a seven-member Shelby County Board of Education. The Board members elect a member to serve as Chairman and a member to serve as Vice Chairman of the Board for a one-year term.
PROFILE OF SHELBY COUNTY
Shelby County is located on the southwest corner of Tennessee, at the east bank of the Mississippi River. Shelby is the State’s largest county with the City of Memphis as the county seat. The corporate limits contain 783 square miles and include seven incorporated
5
municipalities: Arlington, Bartlett, Collierville, Germantown, Lakeland, Memphis and Millington. The County’s 2010 population was 940,764 with the 2013 population estimated at 939,465 according to the U.S. Census Bureau. The County is empowered to levy, without limit, a property tax on both real and personal property located within its boundaries.
Shelby County was incorporated in 1819. It currently operates under the Mayor-Commissionstyle of government with the Mayor as chief executive officer. The Mayor oversees the operations of the County’s six divisions. The 13 members of the Shelby County Board of Commissioners - as the legislative branch of government - reviews and approves county programs and budgets. The Mayor and each Commissioner serve four-year terms. The Assessor, Circuit Court Clerk, County Clerk, Criminal Court Clerk, General Sessions Court Clerk, Juvenile Court Clerk, Probate Court Clerk and Sheriff are also elected to four-year terms.
LOCAL ECONOMIC OUTLOOK
As of June 2014, the Memphis Statistical Area generally underperformed the nation in terms of annual employment growth, the unemployment rate, personal income growth, manufacturing forecasts and the issuance of building permits. The following points illustrate these assessments:
Based on the most recent (June, 2014) report prepared by the Eighth Federal Reserve District on economic conditions in the Memphis area at the close of March 2014, the annual growth of employment, building permits and housing prices was .2 percent, -4.1 percent, and 5.1 percent,respectively, in the Memphis Statistical Area (MSA) and 1.7 percent, zero percent and 11.4 percent, respectively, in the nation. At the same time, the annual growth of personal income was .2 percent in Tennessee and .6 percent in the nation. After remaining above 1.25 percent during most of 2011 and 2012, employment growth in the Memphis zone has slowed to less than .2 percent during the first quarter of 2014. Net job losses in the Government, Manufacturing and Natural Resources/Mining and Construction sectors have been the key drivers of this trend. Slow employment growth in the Memphis area has not been enough to surpass the nation’s rates, but did result in a slight decrease in local unemployment. The Memphis unemployment rate of 8.4 percent is 1.7 percent higher than the national rate.
Changes in Employment and Unemployment RateWith the exception of the third quarter of 2010, Memphis’ recession-related decline in employment – centered at approximately January 2009 – was similar to the nation’s decline. The State of Tennessee lost about 220,000 jobs in the economic downturn; Memphis lost 60,000. The state recouped one-fourth of its jobs, with Memphis recovering about one-sixth.
Measured against the previous year (March 2013), total non-farm employment only rose by .2 percent in the Memphis zone. In the Memphis Statistical Area, employment in the Trade, Transportation and Utilities (TTU) industry rose at a modest pace (1 percent). This sector represents approximately 27 percent of the labor force. Higher percentage gains were experienced in the Professional and Business Sectors at 2.75 percent and the Financial Activities Sectors at 3.75 percent – which account for 14 and 5 percent of the labor force, respectively. Other sectors in Memphis demonstrated employment losses that offset the modest growth in the TTU, Professional and Business Services, Leisure/Hospitality and Financial Activities sectors.
6
¹Current Economic Conditions in the Eighth Federal Reserve District Memphis Zone, Second Quarter 2014
For example, in comparison to the previous year, payrolls have declined by almost 3 percent in the Government sector, by 1.5 percent in Manufacturing and by 5 percent in the Natural Resources/Mining/Construction sector. Overall, the employment picture has improved slightly from March 2013 to March 2014.
Personal Income GrowthFor several quarters before the national recession, which started in 2007, personal income growth in Tennessee was less than the nation. Between the last quarter of 2013 and the first quarter of 2014, personal income grew .2 percent in Tennessee, compared with .6 percent in the nation.
Manufacturing ForecastsOn the manufacturing side, the Memphis area’s manufacturing employment declined 1.2 percent in the first quarter, as compared to a .6 percent increase in the U.S. and a .8 percent increase in the state of Tennessee. The durable goods sector experienced moderate employment growth in the State by 2.5 percent, while it declined by .4 percent in Memphis and only increased by .9 percent in the nation. The employment rate of non-durable goods sector experienced a decline of approximately 2 percent in Memphis and the state of Tennessee, while increasing by .2 percent nationally.
Building PermitsRelative to the same period last year, housing activity in the Memphis Zone has been weak in the first quarter of 2014. The number of building permits issued in the Memphis Zone during the first quarter of 2014 was significantly lower at 4.1 percent below the number issued during the same period in 2013. In comparison, national housing activity grew by zero percent.¹ Relative to the nation, Memphis area home prices increased at half the pace. While home prices increased in the Memphis area by 5.1 percent from March 2013 to March 2014, national home prices increased by 11.4 percent in the same period.
Projected EnrollmentThe District’s enrollment projections for fiscal year 2014-15 estimate that it will serve 117,269 students in grades kindergarten through grade 12. Of this estimated student population, 10,492are expected to enroll in one of the District’s 39 charter schools.
Charter SchoolsIn 2002, the State of Tennessee passed the Tennessee Public Charter Schools Act. The Act permits the Board to authorize the establishment of public charter schools with the primary purpose of improving the learning for all students and closing the achievement gap between high and low performing students. An agreement must be entered into between the sponsor of the charter school and the Board of Education. The charter is approved for an initial period of 10years, but can be revoked by the Board or the State if the school violates certain requirements of the Act. Each school must be operated by a not-for-profit organization with exemption from Federal taxation under 501(c) (3) of the Internal Revenue Code and is responsible for establishing its own governing body separate from that of the Board of Education. The charter schools are supported by the Board of Education as a pass-through from State and local funding sources.

7
Shelby County Schools operated 37 charter schools in fiscal year 2013-14. Metropolitan Nashville Public Schools had 19 charter schools and Chattanooga Public Schools had three in fiscal year 2013-14, per the Tennessee Charter School Center. Other charter schools in operation in the State of Tennessee are authorized by the ASD.
Charter schools started in Tennessee in 2003 as an alternative for students assigned to failing urban schools. Charter operators have flexibility to set their own hours and school calendar and hire whomever they want; however, teachers must be state-certified. Tax dollars for education follow the student to the charter school. Over the years, the law has become more liberal. With the amendment of T.C.A. § 49-13-113 in January 2011 (effective FY 2011-12), now any child may attend a charter school in Tennessee, regardless of family income or the academic standing, as determined by the state, of the child’s home school. There is no longer a limit on the number of charter schools permitted in a district.
Age of School BuildingsAs of June 30, 2014, the average age of the District’s school buildings is 49 years. ShelbyCounty Schools does not issue general obligation debt and relies upon the County of Shelby for financing its capital needs. The County of Shelby conducts its finances so that the amount of general obligation debt does not exceed 12 percent of the County’s taxable assessed valuation.
EDUCATIONAL PROGRAMS
Highlights:
Melissa Collins, a second grade teacher at John P. Freeman Optional School, was selected to participate in the National Education Association (NEA) 2014-15 Science Master Teacher Project.
Southwind High School is home to West Tennessee’s first Science, Technology, Engineering and Mathematics (STEM) Platform School. One of only six schools in the state, it was designated by an executive order of Governor Bill Haslam to promote and expand the teaching and learning of STEM in public schools across the region.
Marcus A. Johnson, Southwind High School senior, is one of only 23 students in the world to receive the prestigious Borlaug-Ruan Internship from the World Food Prize Foundation.
Chickasaw Middle School, Lanier Middle School and Memphis Health Careers Academy were awarded grants from the Laura Bush Foundation for America’s Libraries.
The National Merit Scholarship Corporation announced Houston High School senior Hailey Baker as a 2014 National Merit Scholarship recipient.
Craigmont High School, Hamilton High School, Memphis Health Careers Academy, Northside High School, Sheffield Career and Technology Center and Trezevant Career and Technology Center competed in the 2014 Cooking up Change challenge.

8
Education Consumers Foundation recognized Caldwell-Guthrie Elementary School, Donelson Elementary School, and Dexter Middle School for being the most effective schools in Tennessee in terms of student growth.
Six Shelby County Schools’ high school seniors were announced as 2014 National Achievement Scholarship recipients by the National Merit Scholarship Corporation. Victoria Roberson (Germantown High School), Haley Nichols and Lachanda Reid (Houston High School), Gregory Hairston (Millington Central High School), and Cameron Benson and Kristen Williams (White Station High School) were honored as the top three percent of African-American students in the United States based on their preliminary SAT scores.
The Memphis Virtual STEM Academy at East High School was awarded a $1.34 million grant from the National Science Foundation (NSF). This award is part of NSF’s Innovative Technology Experiences for Students and Teachers program and recognizes the Virtual STEM Academy as an innovative, pre-engineering strategies project for high school students in grades 9 – 12.
Although the District was committed to making the merger seamless for all stakeholders, the consistent focus was on student achievement. The unified Shelby County Schools had the following academic goals for the 2013 – 14 school year, based on the State of Tennessee’s Annual Measurable Objectives (AMOs):
� Increase the percentage of students who are Proficient or Advanced to at least 43.7 percent in third grade Reading/Language Arts.
� Increase the percentage of students who are Proficient or Advanced to at least 39.3 percent in seventh grade Reading/Language Arts.
� Increase the percentage of students who are Proficient or Advanced to at least 43.6 percent in grades 3 – 8 in Reading/Language Arts.
� Increase the percentage of students who are Proficient or Advanced to at least 49.6 percent in English II.
� Increase the percentage of students who are Proficient or Advanced to at least 30.9 percent in English III.
� Increase the percentage of students who are Proficient or Advanced to at least 53.1percent in third grade Mathematics.
� Increase the percentage of students who are Proficient or Advanced to at least 42.2 percent in seventh grade Mathematics.
� Increase the percentage of students who are Proficient or Advanced to at least 46.4 percent in grades 3 – 8 in Mathematics.
9
� Increase the percentage of students who are Proficient or Advanced to at least 50.0 percent in Algebra I.
� Increase the percentage of students who are Proficient or Advanced to at least 33.2 percent in Algebra II.
� Increase the graduation rate to 77.4 percent.
Through the Safe Harbor Program, Shelby County Schools met 10 of its 11 state achievement goals. Furthermore, the District met all five state achievement goals for literacy. District-wide, SCS remains a TVAAS level 5, the highest level for growth awarded.
Despite an unprecedented year of change with the merger and municipal movement, 15 schools earned their way off the State’s Priority list, 39 schools were placed on the Reward List, and iZone schools outpaced the state-run ASD.
The District provides the following programs: General education, special education, career and technical education, alternative education, J.R.O.T.C., charter school instruction, blended learning and virtual learning instruction.
FINANCIAL INFORMATION
SCS ended the fiscal year better than budgeted, primarily due to additional funding from the County of Shelby -- in addition to carefully controlled expenditures in the General Operating Fund. This year began with uncertain enrollment projections, so the District budgeted prudently and instituted fiscal controls. The District ended the fiscal year with total net position of $1,128.5million, an increase of approximately $941 million from FY 2013 due to the merger with Memphis City Schools. The former Memphis City Schools ended with a net position of $1,242,989,640 at June 30, 2013.
Budgetary Adoption and ControlsAccording to Board policy, the Board shall adopt a budget and appropriate funds for each fiscal year prior to the beginning of the fiscal year. The approval of the annual operating budget by the Board provides authorization to the Superintendent and the administrative staff to expend any or all of the amounts appropriated to the limit of each separate fund for the specific budget year. In accordance with state law, regulations and Board policy, the Superintendent and Chairman of the Board of Education will submit a budget to the State.
According to state law and Board policy, the District is required to operate under an annual balanced budget approved by resolution of the SCBE and the Shelby County Commission. The Board defines a “balanced budget” as when the sum of estimated revenues and appropriated fund balance is equal to expenditure appropriations. Revenues and expenditures are defined in accordance with generally accepted accounting principles.
Budgets are developed to support District goals, priorities, and strategic objectives. Budgets are prepared annually on a basis consistent with generally accepted accounting principles for the General Fund, Capital Projects Fund, Categorically-Aided Funds and Food Service Fund. The

10
adopted annual budget serves as the foundation for the District’s financial planning and control.The District begins its budgeting process in November each year by projecting enrollment for the upcoming school year. Enrollment projections drive staffing and expenditure allocations for schools. Enrollment projections are based on the second 20-day attendance count.
ExpendituresAllocations for each school are based on per-pupil allocations, instructional and administrative staffing allocations and other required operating and maintenance (O&M) service levels. Per-pupil allocation helps determine how much O&M funds each school will receive. The allocations to each school are considered discretionary funds. The discretionary funds for each school will be accounted for separately by way of Site-Based Budgets.
Each department is responsible for preparing supporting documentation. Before any budgets are submitted to Budget and Fiscal Planning, a line item justification must be completed which aligns to District goals and priorities. The support documents enable Budget and Fiscal Planning to determine if all cost allocations are justifiable and accurate. These documents also help the District to determine where cost savings can be maximized.
RevenuesThe estimation of revenues begins in October and is, in part, based upon enrollment projections which are developed by school and grade level. The projections take into account mobility factors, such as birth rates and housing changes.
State revenue estimates are generated through sales tax collections and are calculated using the Basic Education Program (BEP) formula. BEP revenues are a funding plan and not a spending plan. However, certain requirements must be met when using the funds. BEP estimates are not finalized until the State calculates average daily membership (ADM) and finalizes its budget.
SCS must submit its budget for approval each year to the following:
� Shelby County Board of Commissioners� State of Tennessee – Pursuant to Tennessee Code Annotated (TCA) §49-3-316 the
District has 30 days after the beginning of each fiscal year to submit to the Commissioner of Education a complete and certified copy of its entire school budget for the current school year. On or before August 1 of each year, the District must submit to the Commissioner of Education a correct and accurate financial report of the receipts and expenditures for all public school purposes of the District during the previous school year ending on June 30.
In the event that the local fiscal body has not adopted a budget for the operation of the public schools by July 1 of any year, the District budget for the year just ended shall continue in effect, by resolution, until a new District budget has been approved.
However, expenditures mandated by this part and implemented by rules, regulations and minimum standards of the State board shall be incorporated into this continuing budget. Any continuing budget adopted by the local fiscal body shall not be valid beyond October 1 of the
11
current fiscal year for purposes of the local fiscal body’s eligibility to receive school funds from the State.
Budget Administration and Management ProcessWhen unforeseen circumstances arise during the fiscal year which require an amendment to the final adopted operating budget, adjustments can be accomplished in the following manner.
The Superintendent or his designee is authorized to transfer budget amounts between line items of the same state functional classification and within the same major object type, i.e. salaries and benefits or discretionary account. A budget transfer shall be effective when the Superintendent or his designee has approved the item by signature. Budget revisions that increase the balance of a fund are taken by resolution before the Board and the Shelby County Board of Commissioners.
The monitoring of expenditures and revenues is a crucial component of the management of the budget. In the event of an unexpected decline in revenue, certain non-essential expenses would be the first to be identified and frozen to ensure a balanced budget at year-end.
Position ControlAn integral part of the District’s adopted budget is Position Control, which defines the approved budgeted positions. The purpose of Position Control is to ensure that the District’s staffing does not exceed its authorized positions. The Position control budget is maintained by Budget and Fiscal Planning.
Any salary increase that is requested for an employee by a department administrator for purposes of reclassification, equity or other circumstances must first be approved by the Human Resources Division of Compensation, and the Superintendent makes the final approval. The department administrator must identify funding for the increase as the department or division’s budget must remain budget neutral. Savings realized through vacancies cannot be used to fund salary increase requests.
Fund AccountingSCS reports its financial activities through the use of fund accounting. This is a system wherein transactions are reported in self-balancing sets of accounts to reflect the results of activities. (Seenote 1 of the Notes to the Basic Financial Statements for a summary of significant accounting policies and a description of fund types).
Internal Control
SCS has established a comprehensive internal control framework designed to protect the District’s assets from loss, theft or misuse. In addition, the District manages its accounting system to provide reasonable assurance regarding the reliability of financial records for preparing financial statements and maintaining accountability for assets. “Reasonable assurance” recognizes that the cost of a control should not exceed the benefits likely to be derived; and the evaluation of costs and benefits requires estimates and judgments by management. Our external auditors annually test the District’s compliance with its Internal Controls for each major program as required by OMB Circular A-133.
12
LONG-TERM FINANCIAL PLANNINGThe financial position of Shelby County Schools remains stable as a result of the District’s conservative budgeting methodology and its ability to maintain disciplined spending practices.To ensure that spending remains sound, SCS has implemented and continues to explore new opportunities for cost savings, cost avoidance and revenue generation. We are managing the District's footprint in the community, from a financial perspective, as the local education landscape continues to evolve.
The District has committed to developing and implementing a strategic budget and long-term financial plan to improve academic outcomes, focusing on raising pre-K reading levels to grade level for kindergartners, raising third grade reading levels to proficiency, increasing seventh grade proficiency in Math, and increasing the percentage of 11th grade students who meet college readiness benchmarks. These initiatives will be achieved by 2025 through the District’s80/90/100% Strategic Goals. The goals were established to ensure that by 2025, 80 percent of seniors are college and career ready, 90 percent of seniors graduate on time, and 100 percent of college and career ready graduates enroll in a post-secondary opportunity. With the SCBE approval of the District’s strategic goals focused around the mission of college and career readiness, SCS will make significant strides towards educational leadership. So by 2025, when this year’s second graders are graduating, Shelby County Schools expects 80 percent of them will pick up their diplomas and be immediately ready to succeed in college or in the 21st century workforce. Currently, the District is collaborating with community partners and other stakeholders to create the infrastructure necessary to accomplish these goals.
AcknowledgmentsThe preparation of this report was accomplished through the commitment, dedication, and tireless effort of the entire Department of Finance. We would also like to extend our thanks to other SCS and non-SCS personnel who assisted in the preparation of this report. Due credit is also given to all Board members for their interest in complete transparency and support in conducting the planning and operation of SCS.
Respectfully submitted,
Dorsey E. Hopson, II Esq. Alicia J. Lindsey, CPA, CGMA Angela R. Carr, CPA Superintendent of Schools Chief Financial Officer Director, Accounting &
Reporting

13
Shelby County Board of Education
Shelby CountyBoard of Education
Board of EducationJune 30, 2014
BOARD MEMBER DISTRICT TERM EXPIRATION
Kevin Woods, Chairman District 4 (Elected) 8/31/2016
Christopher Caldwell, Vice-Chairman District 1 (Elected) 8/31/2014
Teresa D. Jones District 2 (Elected) 8/31/2016
David Reaves District 3 (Elected) 8/31/2014
David A. Pickler District 5 (Elected) 8/31/2014
Shante Avant District 6 (Appointed) 8/31/2014
William “Billy” Orgel District 7 (Elected) 8/31/2014

14
Organizational Chart SHELBY COUNTYBOARD OF EDUCATION
ORGANIZATIONAL CHARTJune 30, 2014
General CounselDorsey Hopson II Esq.
Director, Internal AuditMelvin T. Burgess II
Board Members
SuperintendentDorsey E. Hopson II Esq.
General CounselValerie Speakman
Chief Internal AuditorMelvin T. Burgess II
Executive Director of CommunicationsVacant
Chief of Business OperationsHaria Hitesh
Chief of Staff Reginald Porter Jr.
Chief Innovation OfficerBradley Leon
Chief Financial OfficerAlicia Lindsey
Chief of Student ServicesGerald Darling
Chief of Human ResourcesTrinette Small
Chief Academic Officer Vacant

15
FINANCIAL SECTION
Financial Section

16

17
Independent Auditor’s Report
Watkins Uiberall, PLLC Certified Public Accountants & Financial Advisors
Independent Member of BKR International
BANKS,FINLEY,WHITE& CO.CERTIFIED PUBLIC ACCOUNTANTS
INDEPENDENT AUDITORS’ REPORT
To the Chairman and Members of the Shelby County Board of Education Memphis, Tennessee
We have audited the accompanying financial statements of the governmental activities, each major fund, the aggregate remaining fund information, and the budgetary comparison for the general fund and special revenue – categorically aided fund of the Board of Education of the Shelby County Schools (the Board) (a component unit of Shelby County, Tennessee) as of and for the year ended June 30, 2014, and the related notes to the financial statements, which collectively comprise the Board’s basic financial statements as listed in the table of contents.
Management’s Responsibility for the Financial Statements
Management is responsible for the preparation and fair presentation of these financial statements in accordance with accounting principles generally accepted in the United States of America; this includes the design, implementation, and maintenance of internal control relevant to the preparation and fair presentation of financial statements that are free from material misstatement, whether due to fraud or error.
Auditor’s Responsibility
Our responsibility is to express opinions on these financial statements based on our audit. We conducted our audit in accordance with auditing standards generally accepted in the United States of America and the standards applicable to financial audits contained in Government Auditing Standards, issued by the Comptroller General of the United States. Those standards require that we plan and perform the audit to obtain reasonable assurance about whether the financial statements and schedules are free of material misstatement.
An audit involves performing procedures to obtain audit evidence about the amounts and disclosures in the financial statements. The procedures selected depend on the auditor’s judgment, including the assessment of the risks of material misstatement of the financial statements, whether due to fraud or error. In making those risk assessments, the auditor considers internal control relevant to the entity’s preparation and fair presentation of the financial statements in order to design audit procedures that are appropriate in the circumstances, but not for the purpose of expressing an opinion on the effectiveness of the entity’s internal control. Accordingly, we express no such opinion. An audit also includes evaluating the appropriateness of accounting policies used and the reasonableness of significant accounting estimates made by management, as well as evaluating the overall presentation of the financial statements.
We believe that the audit evidence we have obtained is sufficient and appropriate to provide a basis for our opinions.
18
Opinions
In our opinion, the financial statements referred to above present fairly, in all material respects, the respective financial position of the governmental activities, each major fund, and aggregate remaining fund information of the Board of Education of the Shelby County Schools, as of June 30, 2014, and the respective changes in financial position and, where applicable, cash flows thereof and the budgetary comparisons for the general fund and special revenue – categorically aided fund for the year then ended in accordance with accounting principles generally accepted in the United States of America.
Other Matters
Required Supplementary Information
Accounting principles generally accepted in the United States of America require that the management’s discussion and analysis on pages 21 through 37, budgetary comparison information, and the schedules of funding progress and schedule of employer contributions be presented to supplement the basic financial statements. Such information, although not a part of the basic financial statements, is required by the Governmental Accounting Standards Board, who considers it to be an essential part of financial reporting for placing the basic financial statements in an appropriate operational, economic, or historical context. We have applied certain limited procedures to the required supplementary information in accordance with auditing standards generally accepted in the United States of America, which consisted of inquiries of management about the methods of preparing the information and comparing the information for consistency with management’s responses to our inquiries, the basic financial statements, and other knowledge we obtained during our audit of the basic financial statements. We do not express an opinion or provide any assurance on the information because the limited procedures do not provide us with sufficient evidence to express an opinion or provide any assurance.
Other Information
Our audit was conducted for the purpose of forming opinions on the financial statements that collectively comprise the Board’s basic financial statements. The introductory section, combining and individual fund statements and schedules, and statistical section, are presented for purposes of additional analysis and are not a required part of the financial statements. The accompanying schedule of expenditures of federal awards is presented for the purposes of additional analysis as required by the U.S. Office of Management and Budget Circular A-133, Audits of States, Local Governments, and Non-profit Organizations, and is also not a required part of the financial statements.
The combining and individual fund financial statements and schedules and the schedule of expenditures of federal awards are the responsibility of management and were derived from and relate directly to the underlying accounting and other records used to prepare the basic financial statements. Such information has been subjected to the auditing procedures applied in the audit of the basic financial statements and certain additional procedures, including comparing and reconciling such information directly to the underlying accounting and other records used to prepare the basic financial statements or to the basic financial statements themselves, and other additional procedures in accordance with auditing standards generally accepted in the United States of America. In our opinion, the combining and individual fund financial statements and the schedule of expenditures of federal awards are fairly stated in all material respects in relation to the basic financial statements as a whole.
The introductory and statistical sections have not been subjected to the auditing procedures applied in the audit of the basic financial statements and, accordingly, we do not express an opinion or provide any assurance on them.

19
Other Reporting Required by Government Auditing Standards
In accordance with Government Auditing Standards, we have also issued our report dated December 15, 2014, on our consideration of the Board of Education of the Shelby County Schools’ internal control over financial reporting and on our tests of its compliance with certain provisions of laws, regulations, contracts, and grant agreements and other matters. The purpose of that report is to describe the scope of our testing of internal control over financial reporting and compliance and the results of that testing, and not to provide an opinion on internal control over financial reporting or on compliance. That report is an integral part of an audit performed in accordance with Government Auditing Standards in considering the Board of Education of the Shelby County Schools’ internal control over financial reporting and compliance.
Memphis, Tennessee December 15, 2014

20
This page left intentionally blank

21
Management’s Discussion and Analysis
Shelby County Management Discussion and Analysis Board of Education
As management of Shelby County Board of Education (the Board), we offer readers of the school district’s financial statements this narrative overview and analysis of the financial activities of the Board for the fiscal year ended June 30, 2014. Comparative financial information is reported for the fiscal year ended June 30, 2013. The intent of this discussion and analysis is to look at the school district’s financial performance as a whole, or as an entire operating entity. Readers should also review the transmittal letter found at the front of this report in conjunction with basic financial statements and notes to enhance their understanding of the school district’s financial performance.
As stated in the Board’s 2013 subsequent events note, the merger with Memphis City Schools was effective at the beginning of the 2013-2014 school year. Thus, the assets and obligations of the former Memphis City Schools were transferred to Shelby County Board of Education and are included in the amounts reported for 2014. The amounts reported for 2013 and prior years are only those of Shelby County Board of Education.
Financial Highlights
� Total assets of the school district exceeded its liabilities at June 30, 2014, by $1,128.5 million (net position).
� Net position increased from fiscal year 2013 by $941.0 million or 501.81% primarily due to the inclusion of Memphis City Schools’ net position of $1,243.0 million.
� The school district’s unrestricted liabilities exceeded its unrestricted assets by $33.5 million primarily due to the OPEB annual required contribution (ARC).
� At June 30, 2014, the school district’s total general operating fund balance was $179.0 million or 15.31% of total general fund expenditures.
� Unassigned fund balance for the General Fund was $108.4 million or 9.27% of total General Fund expenditures, an increase of $104.0 million from the previous year. Fund balance transferred from Memphis City Schools accounted for $70.5 of the increase. The unassigned fund balance is available to balance future budgets.
� Fund balance in the Categorically Aided fund was $3.1 million, or 1.81% of expenditures, an increase of $3.1 million for the year.
� In fiscal year 2014, the Capital Projects fund was categorized as a nonmajor fund and thus reported with the Food Services fund. The fund balance for Nonmajor Funds was $35.1 million, or 39.97% of total expenditures. Additional information for the Capital Projects fund and Food Services fund is located in the Nonmajor fund section.

22
Shelby County Management Discussion and Analysis Board of Education
Overview of the Financial Statements
This discussion and analysis document is intended to serve as an introduction to the Board’s basic financial statements. The Board’s basic financial statements are comprised of three components: 1) government-wide financial statements; 2) fund financial statements, and 3) notes to the financial statements. This report also contains other supplementary information in addition to the basic financial statements themselves. The following graphic summarizes the components of the report:
Government-wide Financial Statements. The government-wide financial statements are designed to provide readers with a broad overview of the school district’s finances, in a manner similar to a private-sector business. The statements then proceed to provide an increasingly detailed look at specific financial activities.
The statement of net position provides information on the assets, deferred outflows of resources, liabilities, and deferred inflows of resources of the whole school district. Net position is the difference between the school district’s total assets and deferred outflows of resources and total liabilities and deferred inflows of resources, using the accrual basis of accounting used by most private sector companies. Over time, increases or decreases in net position may serve as a useful indicator of whether our financial position is improving or diminishing, respectively.
The statement of activities presents information showing how the school district’s net position changed during the most recent fiscal year. All changes in net position are reported as soon as the underlying event giving rise to the change occurs, regardless of the timing of the related cash flows. Thus, revenues and expenses are reported in this statement for some items that will only result in cash flows in future fiscal periods (e.g., uncollected taxes and earned but unused vacation leave).
Fund Financial Statements. A fund is a grouping of related accounts. Funds are used to maintain control over resources that have been segregated for specific activities or objectives. The Board, like other state and local governments, uses fund accounting to ensure and demonstrate compliance with finance-related legal requirements. The Board uses many funds to account for a multitude of financial transactions. All of the funds of the Board can be divided into three categories: governmental funds, proprietary funds, and fiduciary funds. These fund financial statements focus on the school district’s most significant funds.
Governmental Funds. Most of the Board’s activities are reported in governmental fund financial statements. These statements focus on how monies flow into and out of those funds and the balances left at year-end that are available for spending in the future periods. These funds are
Management’s Discussion
And Analysis
Government-WideFinancial Statements
Fund Financial Statements
Notes to the Basic Financial Statements
OtherRequired
Supplementary Information

23
Shelby County Management Discussion and Analysis Board of Education
reported using an accounting method called modified accrual accounting, which measures cash and all other financial assets that can readily be converted to cash. The governmental fund statements provide a detailed short-term view of the school district’s general government operations and the basic services it provides. Governmental fund information helps one determine whether there are more or less financial resources that can be spent in the near future to finance educational programs. Because the focus of governmental funds is narrower than that of the government-wide financial statements, it is useful to compare the information presented for governmental funds with similar information presented for governmental activities in the government-wide financial statements. By doing so, readers may better understand the long-term impact of the government’s near-term decisions. Both the governmental funds balance sheet and the governmental funds statement of revenues, expenditures, and changes in fund balances provide a reconciliation to facilitate this comparison between governmental funds and governmental activities.
The Board maintains four governmental funds. Information is presented separately in the governmental fund balance sheet and the governmental fund statement of revenues, expenditures, and changes in fund balances for the General Fund and Categorically Aided Fund. The Categorically Aided Fund is comprised of two categories – federal and non-federal. The school district has two nonmajor funds, which are Capital Projects and Food Service. Data from the nonmajor funds are combined into a single, aggregated presentation. Individual fund data for each of the nonmajor funds is provided in the form of combining statements. The Board adopts an annual appropriated budget for all its funds. Budgetary comparison statements have been provided to demonstrate compliance with budget.
Proprietary Funds. The Board maintains one type of proprietary fund, the Internal Service Fund. Internal Service Funds are an accounting device used to accumulate and allocate costs internally among the school district’s functions for its central services (printing and supply chain management), government services, health self-insurance and unemployment benefits. Because these services predominately benefit governmental rather than business-type functions, they have been included within governmental activities in the government-wide financial statements.
Fiduciary Funds. Fiduciary funds (or Trust and Agency Funds) are used to account for resources held for the benefit of parties outside the government. Fiduciary funds are not reflected in the government-wide financial statements because the resources of those funds are not available to support the school district’s own programs. The Board holds the Local Pensioner’s Retirement investment accounts and the individual schools’ Student Activity funds in a fiduciary capacity.
Notes to the Financial Statements. The notes provide additional information that is essential to a full understanding of the data provided in the government-wide and fund financial statements.
Supplemental Information. In addition to the basic financial statements and accompanying notes, this report also presents certain required supplementary information regarding funding progress for retirement and other post-retirement benefits.
24
Shelby County Management Discussion and Analysis Board of Education
Government-wide Financial Analysis
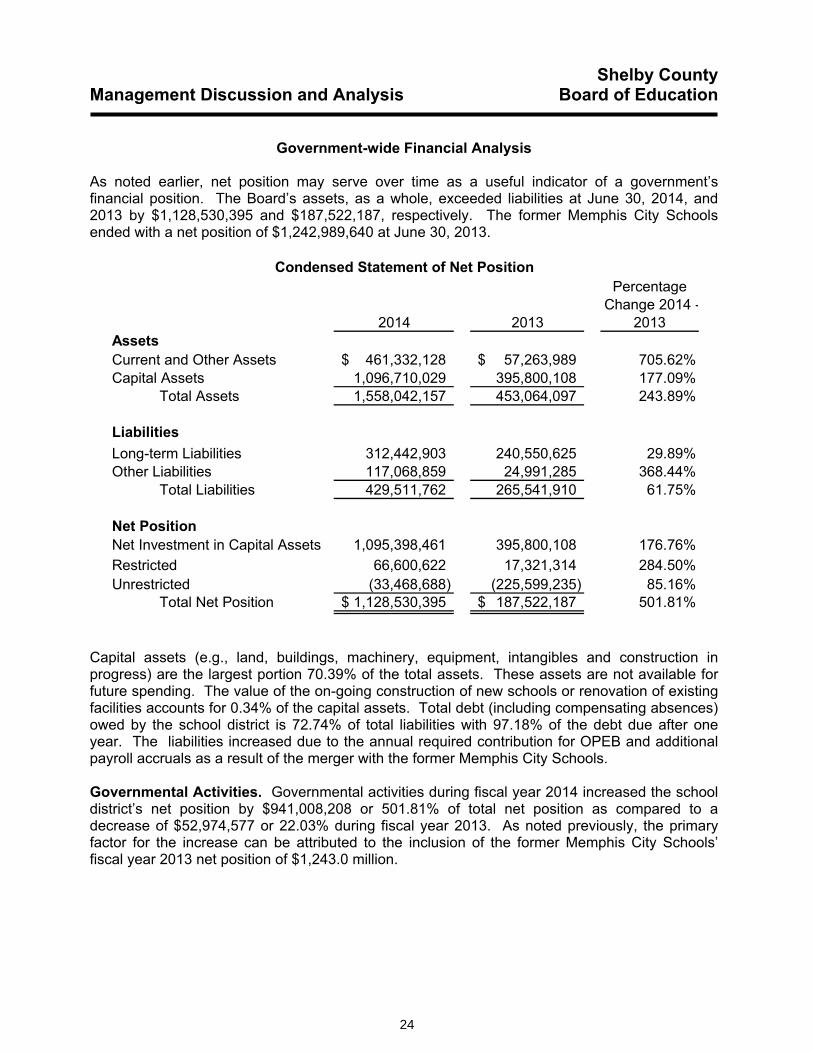
As noted earlier, net position may serve over time as a useful indicator of a government’s financial position. The Board’s assets, as a whole, exceeded liabilities at June 30, 2014, and 2013 by $1,128,530,395 and $187,522,187, respectively. The former Memphis City Schools ended with a net position of $1,242,989,640 at June 30, 2013.
Condensed Statement of Net Position
2014 2013
Percentage Change 2014 -
2013AssetsCurrent and Other Assets 461,332,128$ 57,263,989$ 705.62%Capital Assets 1,096,710,029 395,800,108 177.09%
Total Assets 1,558,042,157 453,064,097 243.89%
LiabilitiesLong-term Liabilities 312,442,903 240,550,625 29.89%Other Liabilities 117,068,859 24,991,285 368.44%
Total Liabilities 429,511,762 265,541,910 61.75%
Net PositionNet Investment in Capital Assets 1,095,398,461 395,800,108 176.76%Restricted 66,600,622 17,321,314 284.50%Unrestricted (33,468,688) (225,599,235) 85.16%
Total Net Position 1,128,530,395$ 187,522,187$ 501.81%
Capital assets (e.g., land, buildings, machinery, equipment, intangibles and construction in progress) are the largest portion 70.39% of the total assets. These assets are not available for future spending. The value of the on-going construction of new schools or renovation of existing facilities accounts for 0.34% of the capital assets. Total debt (including compensating absences) owed by the school district is 72.74% of total liabilities with 97.18% of the debt due after one year. The liabilities increased due to the annual required contribution for OPEB and additional payroll accruals as a result of the merger with the former Memphis City Schools.
Governmental Activities. Governmental activities during fiscal year 2014 increased the school district’s net position by $941,008,208 or 501.81% of total net position as compared to a decrease of $52,974,577 or 22.03% during fiscal year 2013. As noted previously, the primary factor for the increase can be attributed to the inclusion of the former Memphis City Schools’ fiscal year 2013 net position of $1,243.0 million.
25
Shelby County Management Discussion and Analysis Board of Education
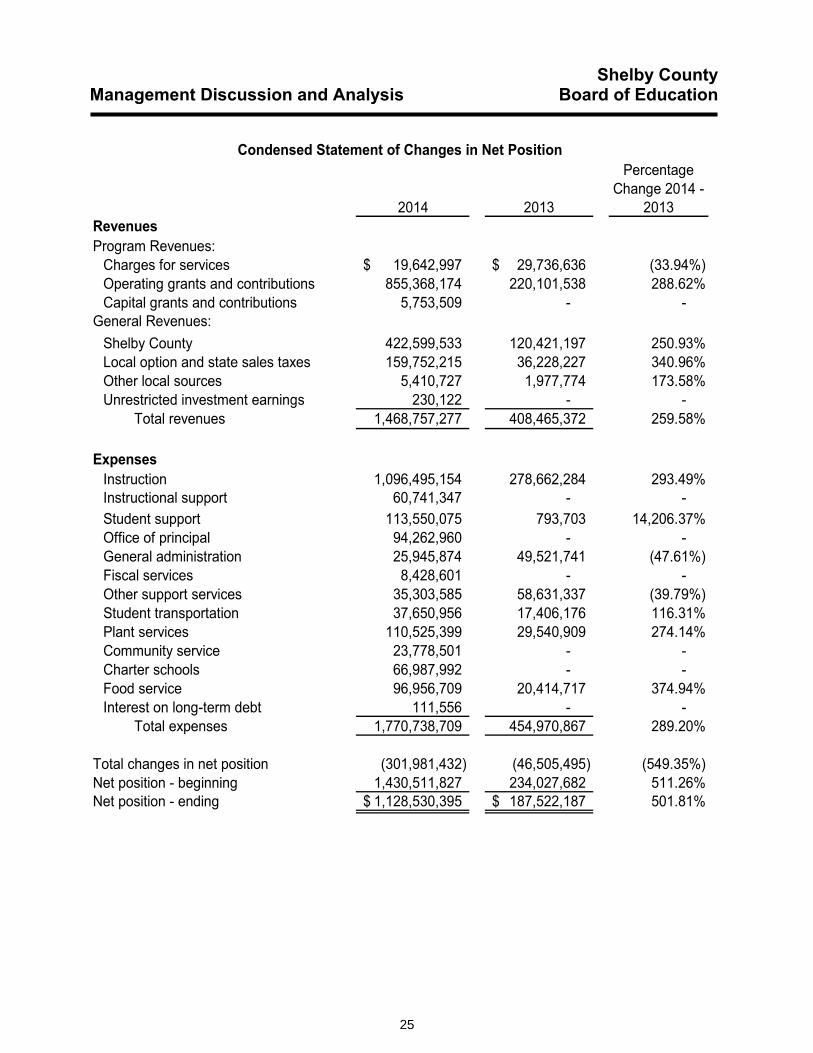
Condensed Statement of Changes in Net Position
2014 2013
Percentage Change 2014 -
2013RevenuesProgram Revenues:
Charges for services 19,642,997$ 29,736,636$ (33.94%)Operating grants and contributions 855,368,174 220,101,538 288.62%Capital grants and contributions 5,753,509 - -
General Revenues:Shelby County 422,599,533 120,421,197 250.93%Local option and state sales taxes 159,752,215 36,228,227 340.96%Other local sources 5,410,727 1,977,774 173.58%Unrestricted investment earnings 230,122 - -
Total revenues 1,468,757,277 408,465,372 259.58%
ExpensesInstruction 1,096,495,154 278,662,284 293.49%Instructional support 60,741,347 - - Student support 113,550,075 793,703 14,206.37%Office of principal 94,262,960 - - General administration 25,945,874 49,521,741 (47.61%)Fiscal services 8,428,601 - - Other support services 35,303,585 58,631,337 (39.79%)Student transportation 37,650,956 17,406,176 116.31%Plant services 110,525,399 29,540,909 274.14%Community service 23,778,501 - - Charter schools 66,987,992 - - Food service 96,956,709 20,414,717 374.94%Interest on long-term debt 111,556 - -
Total expenses 1,770,738,709 454,970,867 289.20%
Total changes in net position (301,981,432) (46,505,495) (549.35%)Net position - beginning 1,430,511,827 234,027,682 511.26%Net position - ending 1,128,530,395$ 187,522,187$ 501.81%

26
Shelby County Management Discussion and Analysis Board of Education
The statement of activities reflects the cost of program services and the charges for those services in addition to grants and contributions offset by those services. The following chart of governmental activities shows the total cost of services with the revenues directly supporting the services.
$0 $500 $1,000 $1,500
Interest and fees on long-term debt
Food service
Charter schools
Community service
Plant services
Student transportation
Other support services
Fiscal services
General administration
Office of principal
Student support
Instructional support
Instruction
Amount (millions)
Program Revenues and Expenses - Governmental Activities
Expenses Revenues
� Instructional expenses include activities directly linked to the teaching of pupils and the interaction between the teacher and pupil. The components include regular, exceptional children, alternative, vocational and adult instruction.
� Instructional support includes the activities involved in assisting instructional staff with the content and process of teaching to pupils. Support services provide administrative, supervisory support to facilitate and enhance instruction.
� Student support includes the activities assisting students in technical services (such as library, guidance, health, and alternative choices) and providing a safe school environment.
� Office of principal includes activities of directing and managing the operation of a particular school. Such activities include those performed by the principal and assistant principal while they supervise all operations of the school, evaluate staff, assign duties to staff, maintain the records of the school, and coordinate school instructional activities within the total school system. These activities also include the work of secretarial and clerical staff in support of the teaching and administrative duties.
� General administration includes the Board of Education and Office of the Superintendent. Activities are centered on establishing and administering policy for operating the Local

27
Shelby County Management Discussion and Analysis Board of Education
Education Agency (LEA). Other general services include commission fees assessed by the County Trustee for tax collection, external audit, legal services, communications, and administrative supervision of the Board.
� Fiscal services include: budgeting and financial reporting, financial and property accounting, payroll and tax reporting, managing of funds, purchasing, receipts and disbursements, and internal auditing.
� Other support services provide non-instructional services to students and staff by the Human Resources and Information Technology Divisions.
� Student transportation includes activities involved with the conveyance of students for regular, vocational and special educational instruction to and from school, as well as school activities, as provided by state and federal law.
� Plant services supports maintaining the school grounds, buildings, and equipment in an effective working condition and state of repair.
� Community services include community development programs for Shelby County Schools, which promote the Board and its objectives. It also includes Early Childhood Development, Parental Involvement, Volunteer Services and Innovation and Planning.
� In accordance with T.C.A.§49-13-106, charter schools are transferred state and local revenues based on an average daily membership of the Board. Thirty-nine charter schools were operational at the beginning of fiscal year 2014. Due to two school closures, thirty-seven charter schools were active at the end of school year 2014.
� Food service includes the preparation, delivery, and servicing of lunches, snacks and other incidental meals to students and school staff in connection with school activities.
� Interest on long-term debt provides for the payment of interest and other related charges of debt with the school district.
A major portion of the general revenues is not included above because the revenues are not directly identified as supporting a unique or specific activity. Instead, these revenues are general in their support for all activities. General revenues are primarily comprised of local tax revenues provided to support education as a whole. In contrast, State Basic Education Program and federal programs are directly supportive of specific activities. The dependence upon general tax revenues from the community for all governmental activities is clear. General tax revenues support 31.20% of the governmental activities. A breakdown of revenues by program is presented below.

28
Shelby County Management Discussion and Analysis Board of Education
Financial Analysis of the Government’s Funds As noted earlier, the Board uses fund accounting to ensure and demonstrate compliance with finance-related legal requirements.
Governmental Funds. The focus of the Board’s governmental funds is to provide information on near-term inflows, outflows, and balances of spendable resources. Such information is useful in assessing the school district’s financing requirements. In particular, unassigned fund balance may serve as a useful measure of a government’s net resources available for spending at the end of the fiscal year.
$0
$20,000
$40,000
$60,000
$80,000
$100,000
$120,000
Thou
sand
s
Governmental Fund BalancesJune 30, 2013 and 2014 (in thousands)
2013 2014
Food service5.25%
Community service1.43%
Plant services7.06%
Student transportation1.40%
Other support services0.09%
Fiscal services0.03%
General administration0.14%
Office of principal1.68%
Student support2.30%
Instructional support4.42%
Instruction36.16%
General revenues (non-restrictive)
40.02%
Unrestricted investment earnings
0.02%
Revenues by Program - Governmental Activities

29
Shelby County Management Discussion and Analysis Board of Education
As of June 30, 2014, and 2013 the school district’s governmental funds reported combined ending fund balances of $217,154,380 and $22,927,542, respectively; an increase of $194,226,838 in 2014 when compared with 2013. Approximately 49.90% of the total amount ($108,369,481) is comprised of unassigned fund balance, which is available for spending at the Board’s discretion. The remainder of the fund balance is either nonspendable, restricted or assigned to indicate that it is 1) not in spendable form ($14.0 million), 2) restricted for specific purposes ($60.3 million), or 3) assigned for specific purposes ($34.5 million). The components of the balances by funds are:
June 30, 2014 June 30, 2013
PercentageChange
2014 - 2013General Fund Nonspendable 7,636,851$ 2,811,900$ 171.59% Restricted 28,469,654 11,072,259 157.13% Assigned 34,547,426 - Unassigned 108,369,481 4,359,928 2385.58%Categorically Aided Fund Restricted 3,075,832 - Total, except Nonmajor Funds 182,099,244 18,244,087 898.13%Nonmajor Funds Nonspendable 6,330,708 688,959 818.88% Restricted 28,724,428 3,994,496 619.10% Total all government funds 217,154,380$ 22,927,542$ 847.13%
There was approximately an $163.9 million increase in fund balance excluding nonmajor funds that included an increase of $160.8 million in the general fund and an increase of $3.1 million in the Categorically Aided Fund. There was a $30.4 million increase in the Nonmajor funds. The changes are discussed in the following fund sections. Major Funds
General Fund
The General Fund is the general purpose and chief operating fund of the school district used to account for the ordinary operations and financial resources not accounted for in any other fund. Taxes, state equalization funding, and other general revenues finance the operations.
As a measure of liquidity, the General Fund unassigned fund balance was approximately $108.4 million or 9.27% of total fund expenditures, while total fund balance represents 15.31% of that same amount. This amount is available for future appropriation. The District planned to use $12.6 million of fund balance to balance the fiscal year 2014 budget. However, the funds were not used because the Board experienced expenditure savings of $18.1 million and higher than anticipated revenues of $14.0 million. As a result, fund balance increased by $21.0 million. Expenditures savings were realized in salaries and benefits due to lower than anticipated student enrollment and cost containment of district wide vacant positions. There were also expenditure savings in professional services, property maintenance, contracted services and supplies.
30
Shelby County Management Discussion and Analysis Board of Education
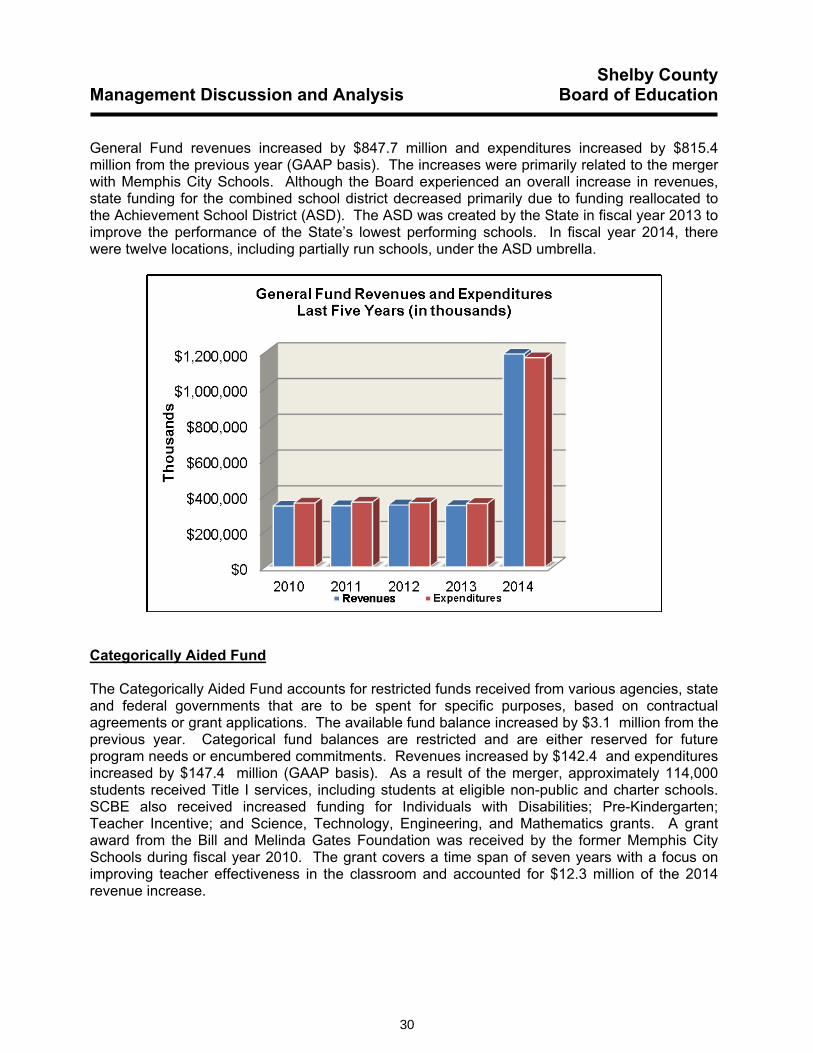
General Fund revenues increased by $847.7 million and expenditures increased by $815.4 million from the previous year (GAAP basis). The increases were primarily related to the merger with Memphis City Schools. Although the Board experienced an overall increase in revenues, state funding for the combined school district decreased primarily due to funding reallocated to the Achievement School District (ASD). The ASD was created by the State in fiscal year 2013 to improve the performance of the State’s lowest performing schools. In fiscal year 2014, there were twelve locations, including partially run schools, under the ASD umbrella.
Categorically Aided Fund
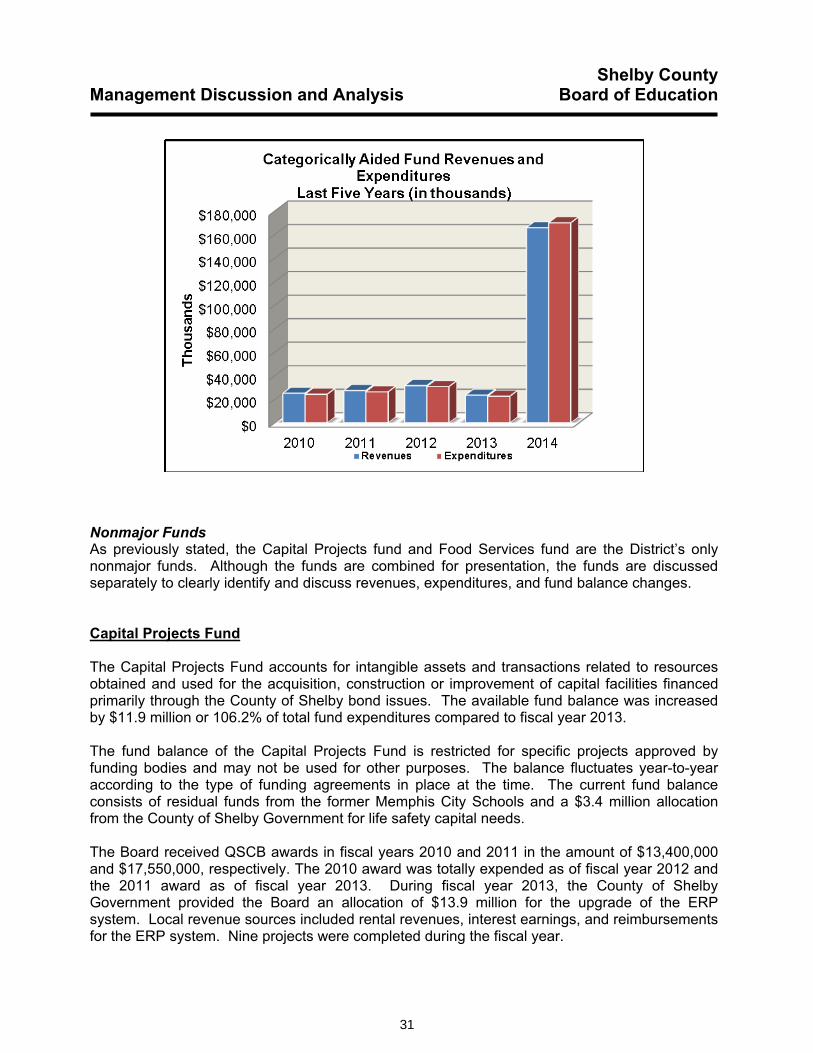
The Categorically Aided Fund accounts for restricted funds received from various agencies, state and federal governments that are to be spent for specific purposes, based on contractual agreements or grant applications. The available fund balance increased by $3.1 million from the previous year. Categorical fund balances are restricted and are either reserved for future program needs or encumbered commitments. Revenues increased by $142.4 and expenditures increased by $147.4 million (GAAP basis). As a result of the merger, approximately 114,000 students received Title I services, including students at eligible non-public and charter schools. SCBE also received increased funding for Individuals with Disabilities; Pre-Kindergarten; Teacher Incentive; and Science, Technology, Engineering, and Mathematics grants. A grant award from the Bill and Melinda Gates Foundation was received by the former Memphis City Schools during fiscal year 2010. The grant covers a time span of seven years with a focus on improving teacher effectiveness in the classroom and accounted for $12.3 million of the 2014 revenue increase.
31
Shelby County Management Discussion and Analysis Board of Education
Nonmajor Funds As previously stated, the Capital Projects fund and Food Services fund are the District’s only nonmajor funds. Although the funds are combined for presentation, the funds are discussed separately to clearly identify and discuss revenues, expenditures, and fund balance changes.
Capital Projects Fund
The Capital Projects Fund accounts for intangible assets and transactions related to resources obtained and used for the acquisition, construction or improvement of capital facilities financed primarily through the County of Shelby bond issues. The available fund balance was increased by $11.9 million or 106.2% of total fund expenditures compared to fiscal year 2013.
The fund balance of the Capital Projects Fund is restricted for specific projects approved by funding bodies and may not be used for other purposes. The balance fluctuates year-to-year according to the type of funding agreements in place at the time. The current fund balance consists of residual funds from the former Memphis City Schools and a $3.4 million allocation from the County of Shelby Government for life safety capital needs.
The Board received QSCB awards in fiscal years 2010 and 2011 in the amount of $13,400,000 and $17,550,000, respectively. The 2010 award was totally expended as of fiscal year 2012 and the 2011 award as of fiscal year 2013. During fiscal year 2013, the County of Shelby Government provided the Board an allocation of $13.9 million for the upgrade of the ERP system. Local revenue sources included rental revenues, interest earnings, and reimbursements for the ERP system. Nine projects were completed during the fiscal year.

32
Shelby County Management Discussion and Analysis Board of Education
$0$2,000$4,000$6,000$8,000
$10,000$12,000$14,000$16,000$18,000$20,000
2010 2011 2012 2013 2014
Thou
sand
s
Capital Projects Fund Revenues and ExpendituresLast Five Years (in thousands)
Revenues Expenditures
Food Service Fund
The Food Service Fund is used to designate cafeteria transactions of preparing and serving regular and incidental meals, breakfast, lunches and snacks in connection with non-instructional services. Revenue is provided primarily from governmental agencies, which is restricted for the cafeterias. The fund experienced increases of $18.5 million in fund balance, revenues of $59.3 million, and expenditures of $58.9 million. The revenues increased as a result of the school district merger and an additional $.06 per meal allowed by the USDA to certify menus and regulate meal pattern requirements. The Board also began serving breakfast and lunch daily to 10 Catholic schools. The USDA daily meal service included approximately 63,310 breakfasts via the National School Breakfast Program which included breakfast in the classroom. Breakfast in the classroom started in the former Memphis City Schools during the 2009-2010 school year with increasing numbers in the years that followed. In fiscal year 2014, there were 105 schools serving breakfast in the classroom with a plan of increasing this number of schools. Daily meal service also included 83,380 lunches via the National School Lunch Program.

33
Shelby County Management Discussion and Analysis Board of Education
The At Risk Supper Program operated the full year with the addition of the extended learning program; approximately 4,000 supper meals were served.
Proprietary Funds
Internal Service Funds
The school district’s internal service funds account for the Board’s central services, government services, health self-insurance and unemployment benefits. They provide the same type of information found in the government-wide financial statements (full accrual accounting based on economic substance of transactions), but in more detail. The net assets increased by $23.1 million from gains realized during the year in the Unemployment and Insurance Funds.
General Fund Budgetary Highlights
The school district planned to use $12.6 million of fund balance during the year. However, due to uncertain enrollment projections, the District enacted controlled spending and implemented a hiring freeze; the District increased fund balance by $21.0 million.
Actual day student enrollment of 141,814, based on the 40-day end-of-month membership count, was down 6,461 students from projected enrollment figures of 148,275. Actual membership declined 8,005 students from the previous year (149,819).
General operating revenues exceeded budget estimates by $14.0 million. Key factors contributing to the revenue variance include:
� The County of Shelby revenues exceeded forecasts by $19.5 million primarily from improved local sales tax collections.

34
Shelby County Management Discussion and Analysis Board of Education
� The District received $2.9 million more than projected from the State’s Basic Education
Program - net of the pass-through to the Achievement School District – due to revised average daily membership.
� Lease and rental income exceeded the revenue budget by $.8 million due to additional lease agreements with charter schools.
� The District benefited from a Special Education – Grants to States payment of $1.8 million accounted for in the Federal category – which was not budgeted.
� Revenues from the State of Tennessee for the Career Ladder Program, Extended Contracts and Other State Revenue did not meet the budgeted forecast by $6.1 million.
� Lower than expected indirect cost revenues related to both the Food Service Fund and Special Revenue Federal Programs Fund account for the $2.8 million variance in Federal Government category.
� Other charges for services, tuition and miscellaneous refund budgets were not realized. The Local category fell short of projections by $2.1 million.
The District experienced cost savings of $18.1 million in expenditures compared to the budget due to controlled spending. Key factors contributing to the expenditure variance include:
� Salaries and benefit savings of $9.8 million were realized from lapse-time created by firm cost containment of district-wide vacant positions, hiring freeze and a reduction in student membership. The District continued to provide Post 65 retirees with a Medicare supplement plan in fiscal year 2014. The expenditures exceeded budget forecast by $1.5 million.
� Benefit costs in the General Fund were 30.0% of salaries. Insurance costs account for approximately 43.4% of total benefits, consistent with the previous year. Salary and benefit costs were approximately 79.8% of total expenditures, relatively unchanged from a year ago. Due to the merger of MCS and SCS, salary expenditures increased by 192.14% and benefit expenditures increased by 245.05% compared to fiscal year 2013.
� The District restricted spending for non-essential items in April. As a result the District realized $3.3 million savings in capital outlay and $2.1 million in other charges.
� Information Technology reduced contracted services with consultants saving the District $2.9 million.
� Approximately $.9 million set aside for other potential uses in the Instructional function was not expended since the District did not receive additional revenues from unidentified sources.

35
Shelby County Management Discussion and Analysis Board of Education
� Plant Services utility savings of $.8 million were realized due to the installation of energy
efficient HVAC systems and a moderate winter.
� The school district budgeted for thirty-nine charter schools with an aggregate budget of $67.4 million. In accordance with state law, $67.0 million was transferred to the charter schools based on actual revenue proceeds distributed on a per pupil basis. Charter schools’ actual enrollment was less than projected due in part to two charter schools closing during the fiscal year, resulting in a $.4 million variance.
� Transportation costs exceeded budget estimates by $.6 million. The District operated a hybrid transportation model in fiscal year 2013-14. Most urban routes were outsourced and the suburban area routes were handled by in-house transportation bus drivers.
Capital Asset and Debt Administration
Capital Assets
The school district’s investment in capital assets for its governmental activities as of June 30, 2014, amounts to $1,096.7 million (net of accumulated depreciation). This investment in capital assets includes land, buildings, improvements, intangibles, machinery and equipment. Overall capital assets increased $700.9 million from fiscal year 2013 to fiscal year 2014. Accumulated depreciation increased by $619.1 million.
Condensed Statement of Capital Assets
PercentageGovernmental Activities Change
2014 Total 2013 2014 - 2013Land 45,600,887$ 23,325,374$ 95.50%Buildings and improvements 996,899,673 351,477,307 183.63%Machinery and Equipment 45,357,981 12,963,066 249.90%Intangible Assets 5,104,237 - Construction in progress 3,747,250 8,034,361 (53.36%)Total 1,096,710,028$ 395,800,108$ 177.09%
Additional information on the school district’s capital assets can be found in Note 8.
Long-term Debt
The Board incurred outstanding debt of $1,858,951 for the former Memphis City Schools. The total debt decreased by $547,383 during fiscal year 2014 resulting in an ending balance of $1,311,568.
36
Shelby County Management Discussion and Analysis Board of Education
Condensed Statement of Outstanding Debt
PercentageChange
2014 2013 2014 - 2013
Due to State of Tennessee 1,311,568$ -$
Governmental Activities
Additional information on the school district’s long-term obligations (debt) can be found in Note 6.
Economic Factors and Next Year’s Budgets
Fiscal Year 2013-14 was historic, as Memphis City Schools and Shelby County Schools were combined in the largest mergers in the history of public education. Next year’s budget development was bittersweet in that we faced the formation of municipal schools in the six suburban areas of Shelby County. We have moved forward with resolve to provide the best educational experience possible to the estimated 117,000 students remaining with Shelby County Schools.
The Shelby County Board of Education adopted the fiscal year 2014-15 General Fund budget in the amount of $953,926,872 including transfers to charter schools. The fiscal year 2014-15 budget is a reduction of approximately $234.7 million from the fiscal year 2013-14 budget. This decrease is directly related to the formation of six new municipal school districts and the Achievement School District (ASD) full takeover of two schools and partial takeover of three. Two new charter schools will open, bringing the total number of charter schools to thirty-nine, with an aggregate budget of $77.9 million. The fiscal year 2014-15 General Fund budget includes $9.5M in planned use of fund balance. State statute requires the District to set aside three percent of next year’s General Fund Expenditure Budget of $953,926,872 which equates to $28,617,806.
The Shelby County Board of Commissioners voted to approve the Shelby County Schools’ fiscal year 2014-15 budget provided that the revenues from all County sources shall not exceed $381,288,000 to all school districts within the County. The District’s share of the appropriation is impacted by the weighted full-time equivalent average daily attendance (WFTEADA) figures that are calculated among Shelby County Schools and the six municipal school districts in the County. Education’s share of the property tax levy is expected to remain at $2.14 of the $4.37 per $100 of assessed property value.
Student enrollment is the primary driver of instruction and school expenditure budgets. Shelby County Schools’ combined 40th day end-of-month enrollment is expected to decrease from 141,814 to 117,269 day students.

37
Shelby County Management Discussion and Analysis Board of Education
Requests for Information
This financial report is designed to provide a general overview of the school district’s finances for all those with an interest in the government’s finances. Questions concerning any of the information provided in this report or requests for additional financial information should be addressed to the Chief Financial Officer, Room 226, Shelby County Schools, 160 South Hollywood Street, Memphis, Tennessee 38112.

38
This page left intentionally blank

39
BASIC FINANCIAL STATEMENTSGovernment-wide Financial Statements:
Basic Financial Statements

40
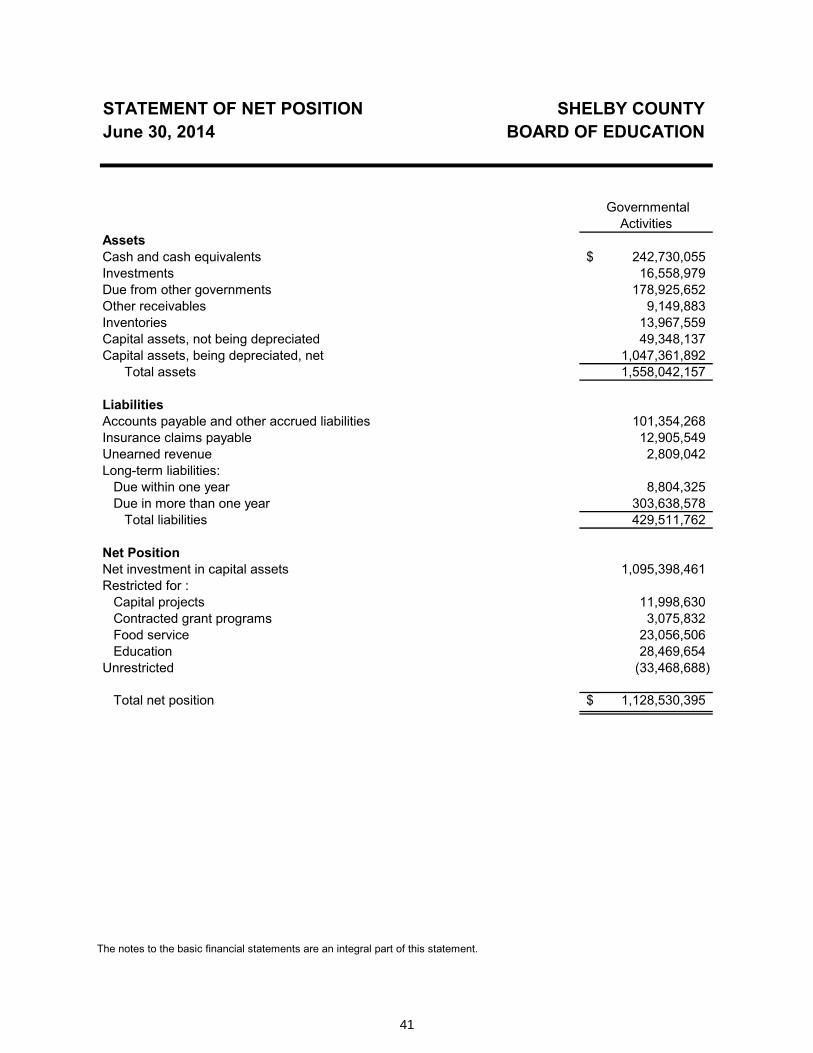
41
Statement of Net Position
The notes to the basic financial statements are an integral part of this statement.
STATEMENT OF NET POSITION SHELBY COUNTY June 30, 2014 BOARD OF EDUCATION
Governmental Activities
AssetsCash and cash equivalents 242,730,055$Investments 16,558,979Due from other governments 178,925,652Other receivables 9,149,883Inventories 13,967,559Capital assets, not being depreciated 49,348,137Capital assets, being depreciated, net 1,047,361,892
Total assets 1,558,042,157
LiabilitiesAccounts payable and other accrued liabilities 101,354,268Insurance claims payable 12,905,549Unearned revenue 2,809,042Long-term liabilities:
Due within one year 8,804,325Due in more than one year 303,638,578
Total liabilities 429,511,762
Net PositionNet investment in capital assets 1,095,398,461Restricted for :
Capital projects 11,998,630Contracted grant programs 3,075,832Food service 23,056,506Education 28,469,654
Unrestricted (33,468,688)
Total net position 1,128,530,395$
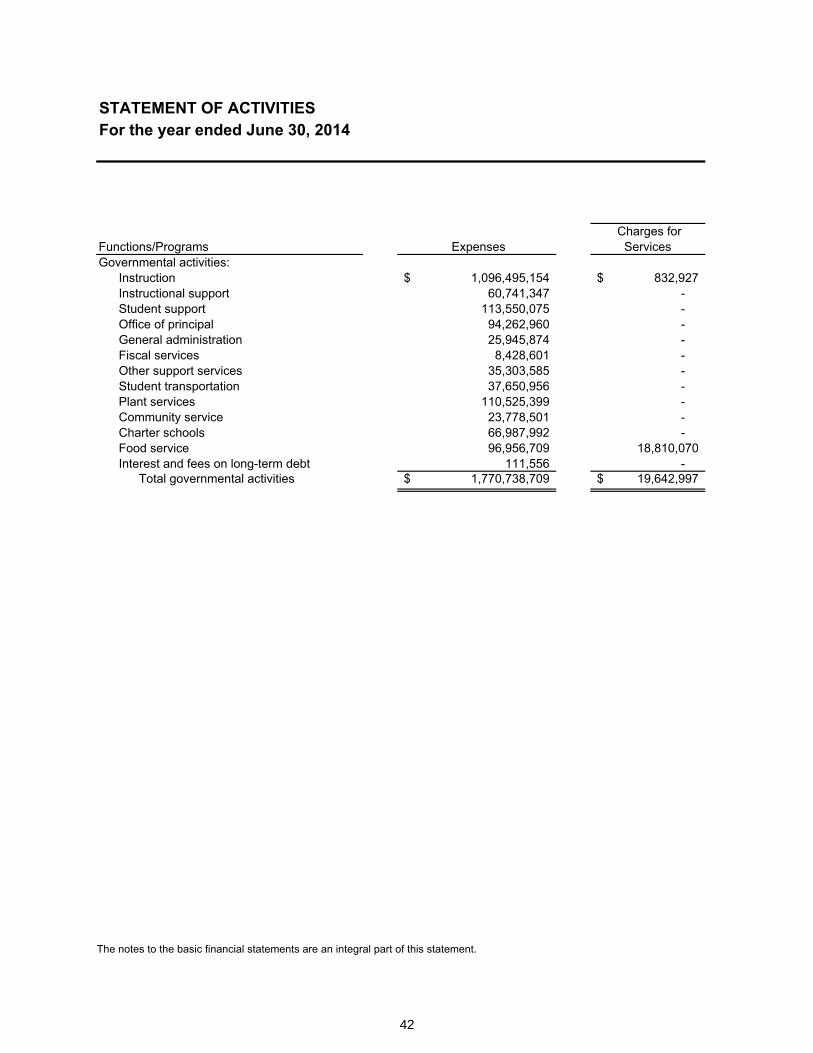
42
Statement of Activities
STATEMENT OF ACTIVITIESFor the year ended June 30, 2014
Functions/Programs Expenses Charges for
ServicesGovernmental activities:
Instruction 1,096,495,154$ 832,927$ Instructional support 60,741,347 - Student support 113,550,075 - Office of principal 94,262,960 - General administration 25,945,874 - Fiscal services 8,428,601 - Other support services 35,303,585 - Student transportation 37,650,956 - Plant services 110,525,399 - Community service 23,778,501 - Charter schools 66,987,992 - Food service 96,956,709 18,810,070 Interest and fees on long-term debt 111,556 -
Total governmental activities 1,770,738,709$ 19,642,997$
The notes to the basic financial statements are an integral part of this statement.

43
SHELBY COUNTY BOARD OF EDUCATION
Program Revenues
Net (Expense) Revenue and Changes in Net
Position Operating Grants and Contributions
Capital Grants and Contributions Total
530,446,090$ -$ (565,216,137)$ 64,860,058 - 4,118,711 33,792,538 - (79,757,537) 24,734,319 - (69,528,641)
2,040,439 - (23,905,435) 412,071 - (8,016,530)
1,367,383 - (33,936,202) 20,541,742 - (17,109,214) 97,960,601 5,753,509 (6,811,289) 20,932,425 - (2,846,076)
- - (66,987,992) 58,280,508 - (19,866,131)
- - (111,556) 855,368,174$ 5,753,509$ (889,974,029)$
General revenues:Shelby County 422,599,533 Local option and state sales taxes 159,752,215 Other local sources 5,410,727 Unrestricted investment earnings 230,122
Total general revenues 587,992,597 Changes in net position (301,981,432)
Net position - beginning 1,430,511,827
Net position - ending 1,128,530,395$

44
Fund Financial Statements:Balance Sheet – Governmental Funds
The notes to the basic financial statements are an integral part of this statement.
GOVERNMENTAL FUNDSBALANCE SHEET SHELBY COUNTY June 30, 2014 BOARD OF EDUCATION
SpecialRevenue
General Fund Categorically Aided Fund
Total Nonmajor
GovernmentalFunds
Total Governmental
Funds AssetsCash and cash equivalents 174,990,419$ -$ 30,424,160$ 205,414,579$Investments 16,258,979 - - 16,258,979Due from Shelby County 37,892,121 - - 37,892,121Due from other governments 55,299,088 38,382,467 1,789,752 95,471,307Other receivables 2,352,450 4,666,278 161,727 7,180,455Inventories 7,636,851 - 6,330,708 13,967,559Due from other funds 30,401,847 - - 30,401,847
Total assets 324,831,755$ 43,048,745$ 38,706,347$ 406,586,847$
Liabilities and Fund BalancesLiabilitiesAccounts payable and other accrued liabilities 90,741,041 7,712,415 3,545,284 101,998,740Due to other funds - 29,557,383 - 29,557,383Unearned revenue - other - 2,703,115 105,927 2,809,042
Total liabilities 90,741,041 39,972,913 3,651,211 134,365,165
Deferred Inflows of ResourcesUnavailable revenue - taxes 55,067,302 - - 55,067,302
Total deferred inflows of resources 55,067,302 - - 55,067,302
Fund balancesNonspendable 7,636,851 - 6,330,708 13,967,559Restricted 28,469,654 3,075,832 28,724,428 60,269,914Assigned 34,547,426 - - 34,547,426Unassigned 108,369,481 - - 108,369,481Total fund balances 179,023,412 3,075,832 35,055,136 217,154,380Total liabilities, deferred inflows of resources, and fund balances 324,831,755$ 43,048,745$ 38,706,347$ 406,586,847$
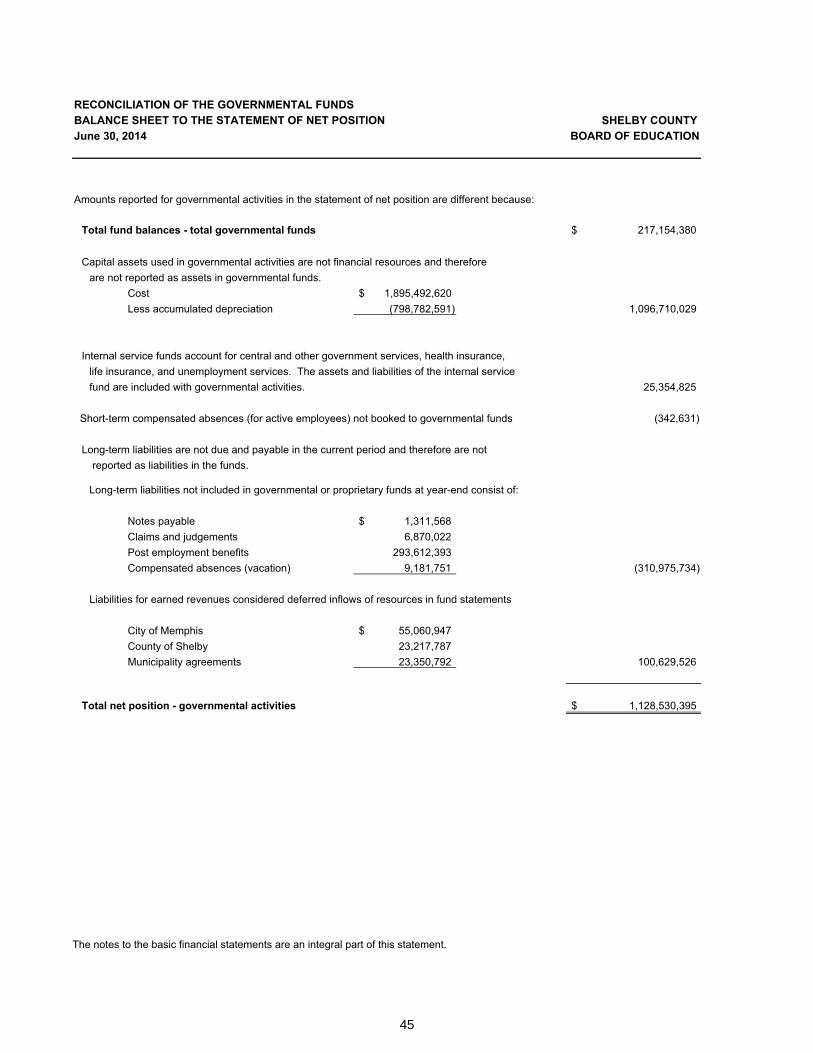
45
Reconciliation of the Governmental Funds Balance Sheet to the Government wide Statement of Net Position
RECONCILIATION OF THE GOVERNMENTAL FUNDSBALANCE SHEET TO THE STATEMENT OF NET POSITION SHELBY COUNTY June 30, 2014 BOARD OF EDUCATION
Amounts reported for governmental activities in the statement of net position are different because:
Total fund balances - total governmental funds 217,154,380$
Capital assets used in governmental activities are not financial resources and therefore are not reported as assets in governmental funds.
Cost 1,895,492,620$ Less accumulated depreciation (798,782,591) 1,096,710,029
Internal service funds account for central and other government services, health insurance, life insurance, and unemployment services. The assets and liabilities of the internal service fund are included with governmental activities. 25,354,825
Short-term compensated absences (for active employees) not booked to governmental funds (342,631)
Long-term liabilities are not due and payable in the current period and therefore are not reported as liabilities in the funds.
Long-term liabilities not included in governmental or proprietary funds at year-end consist of:
Notes payable 1,311,568$ Claims and judgements 6,870,022 Post employment benefits 293,612,393 Compensated absences (vacation) 9,181,751 (310,975,734)
Liabilities for earned revenues considered deferred inflows of resources in fund statements
City of Memphis 55,060,947$ County of Shelby 23,217,787 Municipality agreements 23,350,792 100,629,526
Total net position - governmental activities 1,128,530,395$
The notes to the basic financial statements are an integral part of this statement.

46
Statement of Revenues, Expenditures, and Changes in Fund Balances – Governmental Funds
GOVERNMENTAL FUNDSSTATEMENT OF REVENUES, EXPENDITURES,AND CHANGES IN FUND BALANCES SHELBY COUNTY For the year ended June 30, 2014 BOARD OF EDUCATION
SpecialRevenue
General Fund Categorically Aided Fund
TotalNonmajor
GovernmentalFunds
Total Governmental
FundsRevenuesCity of Memphis -$ 193,746$ -$ 193,746$ Shelby County 552,399,840 - 5,373,607 557,773,447 State of Tennessee 619,406,951 14,319,907 699,148 634,426,006 Federal Government 11,793,324 131,668,031 57,701,661 201,163,016 Other local sources 6,438,605 19,743,206 19,067,342 45,249,153
Total revenues 1,190,038,720$ 165,924,890$ 82,841,758$ 1,438,805,368$
ExpendituresCurrent:
Instruction 687,267,422 81,392,282 - 768,659,704 Instructional support 49,654,538 2,470,272 - 52,124,810 Student support 58,064,228 48,723,603 - 106,787,831 Office of principal 82,887,768 - - 82,887,768 General administration 15,450,357 11,038,112 - 26,488,469 Fiscal services 5,960,764 1,894,948 - 7,855,712 Other support services 32,614,286 1,007,107 - 33,621,393 Student transportation 33,941,399 982,673 - 34,924,072 Plant services 104,530,212 1,186,513 - 105,716,725 Community service 868,758 21,307,710 - 22,176,468 Charter school 66,987,992 - - 66,987,992 Retiree benefits 30,164,526 - - 30,164,526 Food service - 48,120 76,501,371 76,549,491
Debt Service:Principal 547,383 - - 547,383 Interest and fees 111,556 - - 111,556
Capital outlay - - 11,195,512 11,195,512
Total expenditures 1,169,051,189 170,051,340 87,696,883 1,426,799,412
Excess (deficiency) of revenuesover expenditures 20,987,531 (4,126,450) (4,855,125) 12,005,956
Fund balance - July 1, 2013 158,035,881 7,202,282 39,910,261 205,148,424
Fund balance - June 30, 2014 179,023,412$ 3,075,832$ 35,055,136$ 217,154,380$
The notes to the basic financial statements are an integral part of this statement.

47
Reconciliation of the Governmental Funds Statement of Revenues, Expenditures, and Changes In Fund Balances to the Government wide Statement of Activities
RECONCILIATION OF THE GOVERNMENTAL FUNDS STATEMENTOF REVENUES, EXPENDITURES, AND CHANGES IN FUNDBALANCES TO THE STATEMENT OF ACTIVITIES SHELBY COUNTY For the year ended June 30, 2014 BOARD OF EDUCATION
Amounts reported for governmental activities in the statement of activities are different because:
Total net change in fund balances - total governmental funds 12,005,956$
Capital outlays are reported in governmental funds as expenditures. However, in the statement of activities, the cost of those assets is allocated over their estimated useful lives asdepreciation expense.
Capital outlay 8,740,802$ Depreciation expense (68,389,491) (59,648,689)
Capital assets used in governmental activities are not reported as assets. The gain or loss on the disposal of the assets are also not reported. This is the amount by which cost of thedisposed assets exceeds the accumulated depreciation of the disposed assets inthe period. (231,615,708)
The repayment of the principal on long-term debt is reported in the governmental funds as an expenditure, but is reported as a reduction in long-term debt in the statement of net positionand does not affect the statement of activities. The amount of long-term debt principal payments in the current year is: 3,480,283
The schedule of general long-term obligations was increased by a legal claim obligatioincurred by the Board. The balance of this obligation is not reported in the governmental fundsas of use of funds. The statement of activities reports this item as a decrease in net assets. (6,870,022)
On the statement of activities the actual and projected long term expenditures for postemployment benefits are reported, whereas on the governmental funds only the actuaexpenditures are recorded for post employment benefits. (55,994,668)
Some expenses reported in the statement of activities do not require the use of currentfinancial resources and therefore are not reported as expenditures in governmental funds.The change in compensated absences totaled: (2,020,384)
An internal service fund is used by the Board's management to charge the costs of central services, government services, self-insurance health and unemployment claims to the individual funds. The net revenue of the internal service fund is reported with governmental activities. 8,729,891
Recognition of unavailable revenue from Shelby County, City of Memphis, and the Municipalities increased the Board's receivable from these entities. This amount is the net change during the period. 29,951,909
Change in net position of governmental activities (301,981,432)$
The notes to the basic financial statements are an integral part of this statement.

48
Statement of Revenues, Expenditures, and Changes in Fund Balance – Budget and Actual – General Fund
The notes to the basic financial statements are an integral part of this statement.
STATEMENT OF REVENUES, EXPENDITURES, AND CHANGES IN FUND BALANCE - BUDGET AND ACTUALGENERAL FUND SHELBY COUNTY For the year ended June 30, 2014 BOARD OF EDUCATION
Variance withActual Final Budget -
Original Final (Budgetary Basis) Positive (Negative)
RevenuesShelby County 532,908,604$ 532,959,924$ 552,399,840$ 19,439,916$ State of Tennessee 627,101,450 622,206,766 619,406,951 (2,799,815) Federal Government 13,347,550 13,347,550 11,793,324 (1,554,226) Other local sources 2,681,320 7,524,684 6,438,605 (1,086,079)
Total revenues 1,176,038,924 1,176,038,924 1,190,038,720 13,999,796
ExpendituresCurrent:
Instruction 701,072,942 699,666,415 688,422,223 11,244,192 Instructional support 48,304,672 48,938,055 49,593,987 (655,932) Student support 62,970,945 62,444,296 58,203,512 4,240,784 Office of principal 81,750,224 80,584,843 82,912,396 (2,327,553) General administration 13,771,351 13,688,712 14,217,272 (528,560) Fiscal services 6,780,108 6,851,037 5,843,281 1,007,756 Other support services 37,270,740 45,162,523 35,445,445 9,717,078 Student transportation 30,468,204 30,875,737 31,520,326 (644,589) Plant services 107,777,218 102,545,214 105,636,605 (3,091,391) Community service 1,846,162 1,255,734 971,087 284,647 Charter schools 67,406,809 67,406,809 66,987,992 418,817 Retiree benefits 28,636,084 28,636,084 30,164,526 (1,528,442)
Debt Service:Principal 547,384 547,384 547,383 1 Interest and fees 45,495 45,495 111,556 (66,061)
Total expenditures 1,188,648,338 1,188,648,338 1,170,577,591 18,070,747
Excess (deficiency) of revenuesover expenditures (12,609,414)$ (12,609,414)$ 19,461,129 32,070,543$
Change in reserve for encumbrances 1,526,402
Net change in fund balances (GAAP basis) 20,987,531
Fund balance - July 1, 2013 158,035,881
Fund balance - June 30, 2014 179,023,412$
Budgeted Amounts

49
Statement of Revenues, Expenditures, and Changes in Fund Balance – Budget and Actual – Special Revenue Categorically Aided Fund
STATEMENT OF REVENUES, EXPENDITURES, AND CHANGES IN FUND BALANCE - BUDGET AND ACTUALSPECIAL REVENUE - CATEGORICALLY AIDED FUND SHELBY COUNTY For the Year Ended June 30, 2014 BOARD OF EDUCATION
Variance withFinal Budget -
Original Final Actual Positive (Negative)
RevenuesCity of Memphis -$ 200,000$ 193,746$ (6,254)$ State of Tennessee 14,349,320 14,685,595 14,319,907 (365,688) Federal Government 131,920,824 238,445,377 123,859,441 (114,585,936) Other local sources 34,851,492 35,549,458 19,743,206 (15,806,252)
Total revenues 181,121,636 288,880,430 158,116,300 (130,764,130)
ExpendituresCurrent:
Instruction 77,552,593 140,479,983 83,073,788 57,406,195 Instructional support 191,890 27,220,888 2,470,272 24,750,616 Student support 52,784,406 70,078,197 39,205,979 30,872,218 General administration 26,384,208 26,404,168 13,261,932 13,142,236 Fiscal services 2,359,275 2,245,006 1,175,269 1,069,737 Other support services 89,157 39,032 1,007,107 (968,075) Student transportation 2,212,390 2,734,779 975,752 1,759,027 Plant services 1,106,883 1,923,802 1,002,722 921,080 Community service 21,899,696 24,040,566 21,323,255 2,717,311 Food service 28,467 72,664 47,186 25,478
Total expenditures 184,608,965 295,239,085 163,543,262 131,695,823
Excess (deficiency) of revenuesover expenditures (3,487,329)$ (6,358,655)$ (5,426,962) 931,693$
Change in reserve for encumbrances 1,300,512
Net change in fund balances (GAAP basis) (4,126,450)
Fund balance - July 1, 2013 7,202,282
Fund balance - June 30, 2014 3,075,832$
Budgeted Amounts
The notes to the basic financial statements are an integral part of this statement.

50
Statement of Net Position – Proprietary Fund
The notes to the basic financial statements are an integral part of this statement.
PROPRIETARY FUNDSSTATEMENT OF NET POSITION SHELBY COUNTY June 30, 2014 BOARD OF EDUCATION
Governmental Activities - Internal
Service FundsAssetsCurrent assets:
Cash and cash equivalents 37,315,476$Investments 300,000Other receivables 1,802,988Due from general fund 99,824
Total assets 39,518,288
LiabilitiesCurrent liabilities: Accounts payable 344,060
Insurance claims and premiums payable 12,905,549Due to general fund 777,848Accrued vacation 55,755
Noncurrent liabilities:Accrued vacation 80,251
Total liabilities 14,163,463
Net PositionUnrestricted 25,354,825$
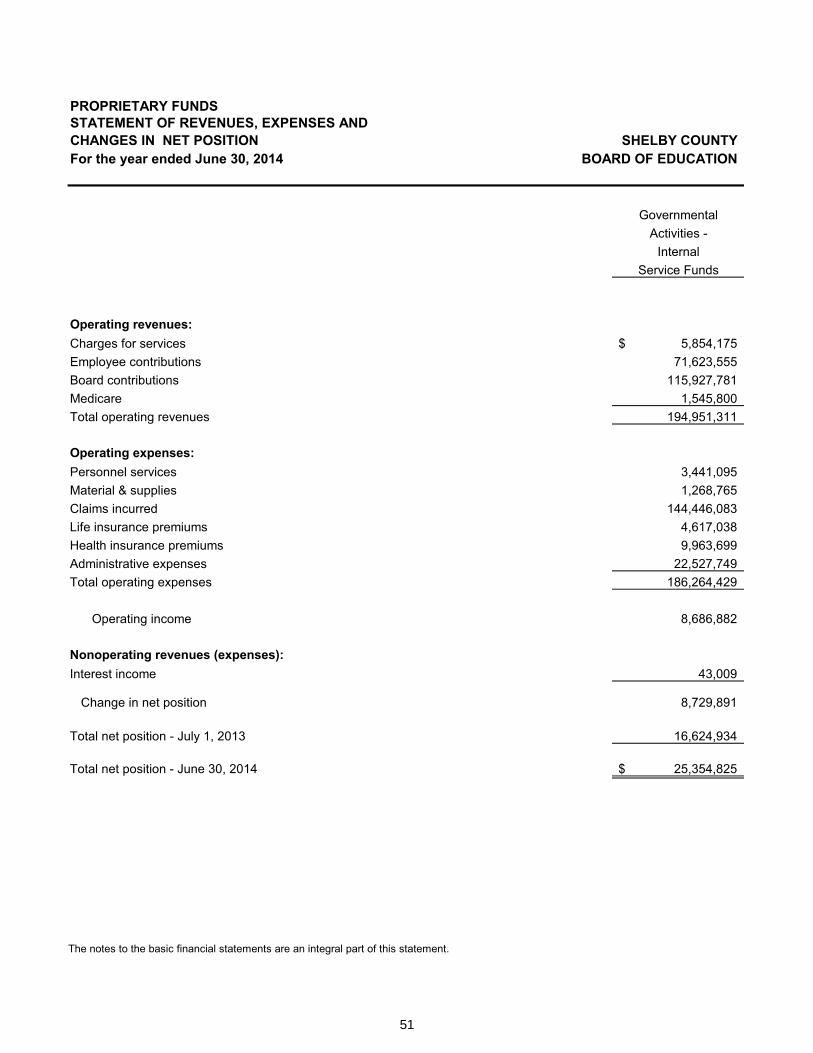
51
Statement of Revenues, Expenses, and Changes in Net Position – Proprietary Fund
The notes to the basic financial statements are an integral part of this statement.
PROPRIETARY FUNDSSTATEMENT OF REVENUES, EXPENSES ANDCHANGES IN NET POSITION SHELBY COUNTY For the year ended June 30, 2014 BOARD OF EDUCATION
GovernmentalActivities -
InternalService Funds
Operating revenues:Charges for services 5,854,175$ Employee contributions 71,623,555 Board contributions 115,927,781 Medicare 1,545,800 Total operating revenues 194,951,311
Operating expenses:Personnel services 3,441,095 Material & supplies 1,268,765 Claims incurred 144,446,083 Life insurance premiums 4,617,038 Health insurance premiums 9,963,699 Administrative expenses 22,527,749 Total operating expenses 186,264,429
Operating income 8,686,882
Nonoperating revenues (expenses):Interest income 43,009
Change in net position 8,729,891
Total net position - July 1, 2013 16,624,934
Total net position - June 30, 2014 25,354,825$
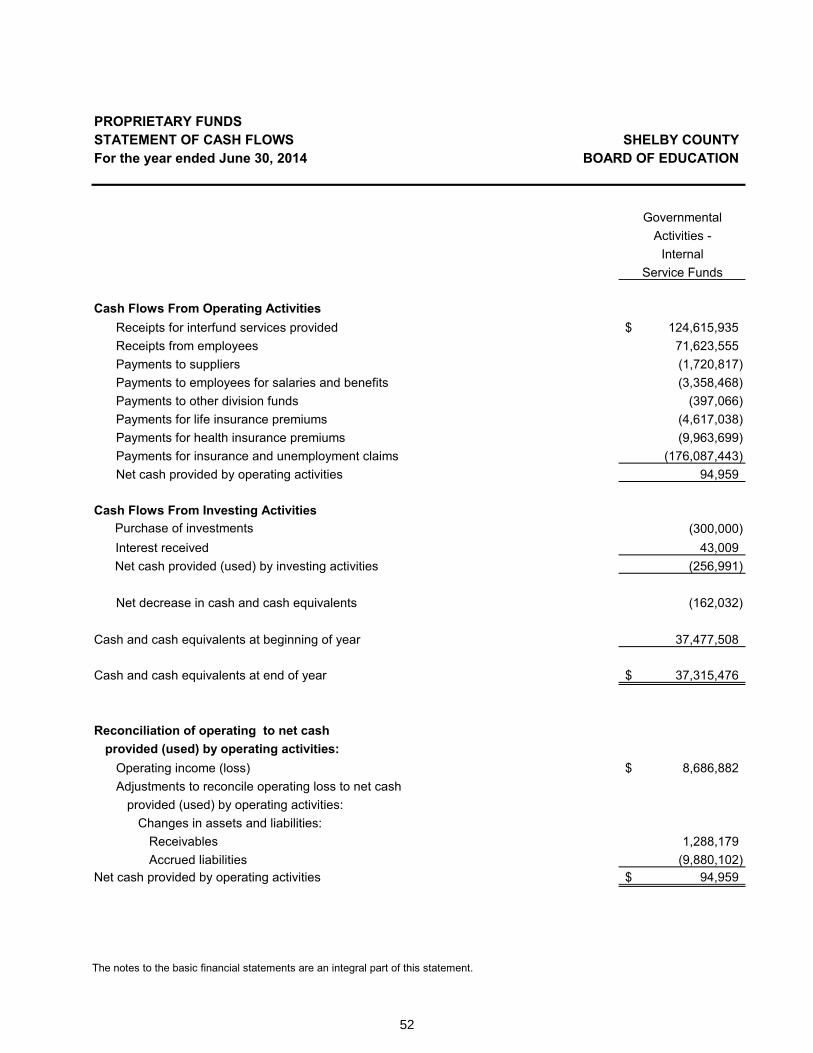
52
Statement of Cash Flows – Proprietary Fund
The notes to the basic financial statements are an integral part of this statement.
PROPRIETARY FUNDSSTATEMENT OF CASH FLOWS SHELBY COUNTY For the year ended June 30, 2014 BOARD OF EDUCATION
GovernmentalActivities -
InternalService Funds
Cash Flows From Operating ActivitiesReceipts for interfund services provided 124,615,935$ Receipts from employees 71,623,555 Payments to suppliers (1,720,817) Payments to employees for salaries and benefits (3,358,468) Payments to other division funds (397,066) Payments for life insurance premiums (4,617,038) Payments for health insurance premiums (9,963,699) Payments for insurance and unemployment claims (176,087,443) Net cash provided by operating activities 94,959
Cash Flows From Investing Activities Purchase of investments (300,000)
Interest received 43,009 Net cash provided (used) by investing activities (256,991)
Net decrease in cash and cash equivalents (162,032)
Cash and cash equivalents at beginning of year 37,477,508
Cash and cash equivalents at end of year 37,315,476$
Reconciliation of operating to net cashprovided (used) by operating activities:
Operating income (loss) 8,686,882$ Adjustments to reconcile operating loss to net cash
provided (used) by operating activities:Changes in assets and liabilities:
Receivables 1,288,179 Accrued liabilities (9,880,102)
Net cash provided by operating activities 94,959$

53
Statement of Fiduciary Net Position
FIDUCIARY FUNDSSTATEMENT OF FIDUCIARY NET POSITION SHELBY COUNTY June 30, 2014 BOARD OF EDUCATION
PensionTrust AgencyFund Fund
AssetsCash and cash equivalents -$ 13,191,409$ Other receivables 7,995 253,043 Investments, at fair value: Short-term securities 753,876 669,505 Common stocks 1,019,185 - Corporate bonds 55,618 - Total Investments 1,828,679 669,505 Inventories - 145,777 Total assets 1,836,674 14,259,734
LiabilitiesAccounts payable - 150,416 Due to general fund 166,440 - Due to student general fund - 8,560,312 Due to student groups - 5,549,006 Total liabilities 166,440 14,259,734
Net PositionHeld in trust for pension benefits 1,670,234$ -$
The notes to the basic financial statements are an integral part of this statement.

54
Statement of Changes in Fiduciary Net Position – Fiduciary Funds
The notes to the basic financial statements are an integral part of this statement.
FIDUCIARY FUNDSSTATEMENT OF CHANGES IN FIDUCIARY NET POSITION SHELBY COUNTY For the year ended June 30, 2014 BOARD OF EDUCATION
PensionTrustFund
AdditionsContributions: State reimbursements for benefit payments and insurance premiums 113,307$
Investment Earnings: Interest income 67,904 Net appreciation (depreciation) in fair value of investments 167,846
Net investment earnings 235,750
Total additions 349,057
DeductionsBenefit payments 424,456Administrative expenses 29,254
Total deductions 453,710
Change in net position (104,653)
Net PositionJuly 1, 2013 1,774,887
June 30, 2014 1,670,234$

55
Notes to the Basic Financial StatementsNOTES TO THE BASIC FINANCIAL STATEMENTS SHELBY COUNTY June 30, 2014 BOARD OF EDUCATION
NOTE 1 – SUMMARY OF SIGNIFICANT ACCOUNTING POLICIES
Determination of the Reporting Entity
The Shelby County Board of Education (the Board) is a component unit of Shelby County Government (the County), which is defined as the Primary Government (or oversight entity) when defining the Reporting Entity. In determining the reporting entity, the Board was determined to be a component unit based upon its financial accountability as a result of fiscal dependency on the County of Shelby and a financial benefit or burden relationship. The County levies taxes for the Board, approves its operating budget, is legally obligated to provide financial support, and issues debt for its capital projects. Therefore, the financial statements of the Board are included in the financial statements of the County of Shelby, TN, as a discretely presented governmental component unit.
Financial activities of the Board are recorded in the individual funds described below, each of which is deemed to be a separate accounting entity. The financial affairs and operations of each fund are accounted for in separate self-balancing entity accounts, which represent the funds’ assets, liabilities, equity, revenue and expenditures.
Government-Wide Financial Statements
The statement of net position and statement of activities display information about the reporting entity as a whole. They include all funds of the reporting entity except for fiduciary funds. Activities are generally financed through a share of tax revenue collected by Shelby County, grants, and other non-exchange revenues. For the most part, the effect of internal activity has been removed from these statements.
The statement of activities demonstrates the degree to which the direct expenses of a given function are offset by program revenues. Direct expenses are those that are clearly identifiable with a specific function or segment. Certain indirect costs are included in the program expense reported for individual functions and activities due to the allocation of overhead for certain grants. Program revenues include grants and contributions that are restricted to meeting the operational or capital requirements of a particular function. General revenues include internally dedicated resources, non-specific grants and contributions, and investment earnings.
Fund Financial Statements
Funds are organized into three major categories: governmental, proprietary, and fiduciary. An emphasis is placed on major funds within the governmental and proprietary categories. A fund is considered major if it is the primary operating fund of the Board or meets the following criteria:
a. Total assets, liabilities, revenues, or expenditures/expenses of that individual fund are at least 10 percent of the corresponding total for all funds of that category or type; and
b. Total assets, liabilities, revenues, or expenditures/expenses of that individual fund are at least five percent of the corresponding total for all funds.

56
NOTES TO THE BASIC FINANCIAL STATEMENTS SHELBY COUNTY June 30, 2014 BOARD OF EDUCATION
The funds of the financial reporting entity are described below:
Governmental Funds
General Fund
The General Fund is the general purpose and chief operating fund of the school district used to account for the ordinary operations and financial resources not accounted for in any other fund. Taxes, state equalization funding, and other general revenues finance the operations.
Special Revenue Funds
Transactions related to resources obtained and used under certain federal and state programs and from other sources, upon which legal restrictions are imposed, are accounted for in Special Revenue Funds. The Special Revenue Funds are:
Categorically Aided Fund: The Board receives funds from various agencies, state and federal governments that are to be spent for specified purposes based upon contractual agreements or grant applications. Thus, the funds are restricted and the Categorically Aided Fund is used to keep these funds segregated from other funds.
Food Service Fund: This fund is used to account for the operations of the cafeterias in preparing and serving regular and incidental meals, breakfast, lunches, and snacks in connection with non-instructional services. Revenue is provided primarily from governmental agencies, which is to be spent specifically for the cafeterias. Thus, the funds are restricted and the Food Service Fund is used to keep these funds segregated from other funds.
Capital Projects Fund
Transactions for intangibles and resources obtained and used for the acquisition, construction or improvement of capital facilities are accounted for in the Capital Projects Fund.
Proprietary Funds
Internal Service Funds
Internal service funds account for central and other government services, health insurance, life insurance, and unemployment services provided to other funds of the Board or the Achievement School District that are funded through charges for services, and employee and Board contributions.
Achievement School District—Services to support the Achievement School District including transportation, facilities, security, and special education services.
Central Services—Central service operations include printing and supply chain management services to the district.
Insurance—Insurance Fund accounts for the school district’s self - insurance for health and premiums for life insurance benefits for school district employees, their dependents, and retirees.
57
NOTES TO THE BASIC FINANCIAL STATEMENTS SHELBY COUNTY June 30, 2014 BOARD OF EDUCATION
Unemployment Compensation—Unemployment Compensation accounts for the school district’s self-insurance for unemployment benefits which may be due for employment benefits for school district employees.
Fiduciary Funds (Not included in government-wide statements)
Trust and Agency Funds consist of the following:
Pension Trust Fund—Retirement Fund: Transactions related to resources held in a fiduciary capacity as agent for participants in the Retirement System of the Shelby County Board of Education Schools are accounted for in the Retirement Fund. See Note 7 for additional information regarding this retirement plan.
Agency Fund—Internal School Fund: Transactions related to resources held in a fiduciary capacity as agent for the general school population, or in some cases, for a specific segment of the school population, are recorded in the Internal School Fund. Agency funds are purely custodial and thus do not involve measurement of results of operations.
Major and Nonmajor Funds
The General Fund and Categorically Aided Fund are classified as major funds. The Capital Projects Fund and Food Service Fund are classified as nonmajor funds. See above for descriptions.
Measurement Focus
Measurement focus is a term used to describe which transactions are recorded within the various financial statements.
The government-wide financial statements are presented using the economic resources measurement focus as defined in item b. below.
In the fund financial statements, the “current financial resources” measurement focus or the “economic resources” measurement focus is used as appropriate:
a. All governmental funds utilize a “current financial resources” measurement focus. Only current financial assets and liabilities are generally included on their balance sheets. Their operating statements present sources and uses of available spendable financial resources at the end of the period.
b. The proprietary and pension trust (fiduciary) funds utilize an “economic resources” measurement focus. The accounting objectives of this measurement focus are the determination of operating income, changes in net position (or cost recovery), financial position, and cash flows (only for proprietary fund). All assets and liabilities (whether current or noncurrent) associated with their activities are reported. Proprietary and pension fund equity is classified as net position.
c. Agency funds are not involved in the measurement of results of operations; therefore, measurement focus is not applicable to them.

58
NOTES TO THE BASIC FINANCIAL STATEMENTS SHELBY COUNTY June 30, 2014 BOARD OF EDUCATION
Budgeting and Budgetary Control
Revenue and expenditures accounted for in all funds with the exception of the health insurance and unemployment funds are controlled by a formal integrated budgetary accounting system in accordance with various legal requirements that govern the Board’s operations. The budgetary basis of accounting differs from generally accepted accounting principles because encumbrances have been recorded as expenditures. The District’s operating budget is subject to approval by the Board of Education and the Shelby County Board of Commissioners.
The District cannot exceed the total budgeted expenditures. The District can amend its operating budget between line items if the amendment does not increase the total budget. The Superintendent or his designee is authorized to transfer budget amounts between line items of the same state functional classification and within the same major object type, i.e., salaries and benefits or discretionary accounts. Budget revisions that increase the balance of a fund are taken by resolution before the Board and the Shelby County Board of Commissioners for approval.
Basis of Accounting
The government-wide financial statements are presented using the accrual basis of accounting. Under the accrual basis of accounting, revenues are recognized when earned and expenses are recorded when the liability is incurred or economic asset used. Revenues, expenses, gains, losses, assets, and liabilities resulting from exchange and exchange-like transactions are recognized when the exchange takes place.
The fund financial statements, General, Special Revenue, and Capital Projects Funds, are prepared on the modified accrual basis of accounting. Under this basis of accounting, revenues are recognized in the accounting period in which they become susceptible to accrual, which is defined as being both measurable and available to finance expenditures of the fiscal period. Expenditures are recognized on the modified accrual basis which is defined as when measurable and when the related liability is incurred. When both restricted and unrestricted resources are available for use, it is the Board’s policy to use restricted resources first, then unrestricted resources as they are needed. Revenue susceptible to accrual under the modified accrual basis is principally:
a. In determining availability, the Board considers property taxes associated with the current fiscal year to be available if they are collected within 30 days of the current fiscal year and sales taxes to be available if collected within two months of the end of the current fiscal year. The Board considers wheel taxes from the County associated with the current fiscal year to be available within one year of the end of the current fiscal year.
b. Grants and subsidies from other governments, to the extent measurable and available – recognized as revenue as soon as all the eligibility requirements by the provider have been met.
c. Interest earned on investments as of year-end.
The proprietary and pension funds utilizes the accrual basis of accounting. Under the accrual basis of accounting, revenue is recorded as earned and expenses are recorded when the liability is incurred or economic asset used. Operating revenues and expenses generally result from providing services in connection with a proprietary fund’s principal ongoing operations. All other revenue is considered

59
NOTES TO THE BASIC FINANCIAL STATEMENTS SHELBY COUNTY June 30, 2014 BOARD OF EDUCATION
nonoperating revenue. The agency fund utilizes the accrual basis of accounting for reporting of assets and liabilities only.
For budgetary reporting purposes, the encumbrance method of accounting for expenditures is used for the General, Special Revenue, and Capital Projects Funds. Under this method, commitments represented by purchase orders, contracts and repair authorizations, except for those related to inventory purchases, are recorded as expenditures in addition to actual expenditures incurred.
Outstanding encumbrances are classified as “Fund Balance—Assigned or Restricted” in the various funds. These amounts have been excluded from expenditures in all accompanying financial statements except for the statement which shows comparisons between actual expenditures (including encumbrances) and related budgeted amounts.
Receivables
Receivables consist primarily of grant funds receivable from the Federal Government and the State of Tennessee, and property taxes receivable from the City of Memphis and Shelby County. Outstanding balances between funds are reported as “due to/from other funds.” Transfers between funds are used to ensure current operations and programs are not interrupted.
Inventories
General Fund inventories consist of textbooks, maintenance and school supplies. Food Service Fund inventories consist of food and cafeteria supplies. Inventories are considered expenditures when issued from the central warehouse to the schools except food items, which are considered expenditures when issued (used) by the individual schools (Consumption Method). Inventories are reported in the balance sheet at average cost and are offset by a Fund Balance reserve of a like amount. Inventories in the Agency Fund are stated at cost determined by the first-in, first-out method.
Realty and Personal Property Taxes
The Board recognizes as revenue its net share of realty and personal property taxes collected by Shelby County (see Basis of Accounting above). The Board does not have any taxing authority. Consequently, it relies on a share of realty and personal property taxes collected by Shelby County. The Shelby County tax levy of $4.37 per $100 of assessed value included $2.14 for county schools.
Cash Equivalents
Shelby County maintains a cash pool, of which the County Trustee is custodian. This pool is generally available for use by all Shelby County funds and related entities. At June 30, 2014, cash and cash equivalents include amounts in the pool and demand deposits at various financial institutions. The Board considers all highly liquid investments with maturities of three-months or less when purchased to be cash equivalents.
Investments
Investments are stated at fair value. Fair value is based on quoted market prices, if available, or estimated using quoted market prices for similar securities. State statutes authorize the County Trustee to invest in obligations of the U.S. Treasury, obligations issued or guaranteed by any U.S.

60
NOTES TO THE BASIC FINANCIAL STATEMENTS SHELBY COUNTY June 30, 2014 BOARD OF EDUCATION
Government agency, certificates of deposits at Tennessee and federal chartered banks and savings and loan associations, repurchase agreements utilizing obligations of the United States or its agencies as underlying securities, prime banker’s acceptances and prime commercial paper. The maximum maturity is two years.
Unearned Revenue
Unearned revenue arises when assets are recognized before revenue recognition criteria have been satisfied.
Deferred Outflows/Inflows of Resources
In addition to assets, the statement of financial position will sometimes report a separate section for deferred outflows of resources. This separate financial statement element, deferred outflows of resources, represents a consumption of net position that applies to a future period(s) and so will not be recognized as an outflow of resources (expense/expenditure) until then.
In addition to liabilities, the statement of financial position will sometimes report a section for deferred inflow of resources. This separate financial statement element, deferred inflows of resources, represents an acquisition of net position that applies to a future period(s) and so will not be recognized as an inflow of resources (revenue) until that time. The Board has one type of item which arises under the accrual and modified accrual basis of accounting that qualify for reporting in this category. Accordingly, the item unavailable revenue is reported only in the governmental fund balance sheet. The Board reports unavailable revenue from property taxes. These amounts are deferred and recognized as an inflow of resources in the period that the amount becomes available.
Capital Assets
Capital assets, which include land, buildings and improvements, machinery and equipment, intangibles and construction in progress are reported in the government-wide financial statements.
Capital assets are valued at historical cost or estimated historical cost if actual is unavailable, except for donated capital assets, which are recorded at their estimated fair value at the date of donation. Estimated historical cost was used to value the majority of the assets acquired prior to June 30, 2001.
The District capitalizes assets with an initial cost of $5,000 or more. As a result of the merger, the District is carrying some items that do not meet the criteria because the former Memphis City Schools also capitalized sensitive items regardless of cost.
Depreciation of all exhaustible capital assets is recorded as an allocated expense in the Statement of Activities, with accumulated depreciation reflected in the Statement of Net Position. Depreciation is provided over the assets’ estimated useful lives using the straight-line method of depreciation. The range of estimated useful lives by type of asset is as follows:
- Buildings and Improvements 10-50 years - Machinery and Equipment 5-20 years
61
NOTES TO THE BASIC FINANCIAL STATEMENTS SHELBY COUNTY June 30, 2014 BOARD OF EDUCATION
Long-Term Obligations
All long-term obligations to be repaid from governmental resources are reported as liabilities in the government-wide financial statements. Long-term obligations consist primarily of notes payable, capital leases, and accrued compensated absences. Long-term debt for governmental funds is not reported as a liability in the fund financial statements. Debt proceeds are reported as other financing sources and payments of principal and interest are reported as expenditures.
Compensated Absences
The liability for accrued vacation is recorded as incurred in the government-wide and proprietary fund financial statements. The current portion of this obligation is estimated based on historical trends. In the fund financial statements, governmental funds report only the compensated absence liability payable from expendable available financial resources, and only the absences which have matured and are probable to be paid (i.e., unused reimbursable leave still outstanding following an employee’s resignation or retirement). In governmental funds no expenditure would be recognized for unpaid balances of compensated absences for an employee still in active service at the end of the reporting period.
Equity Classifications
In the government-wide financial statements, equity is classified as net position and displayed in three components:
a. Net Investment in capital assets – Consists of capital assets including restricted capital assets, net of accumulated depreciation and reduced by the outstanding balances of any borrowings that are attributable to the acquisition, construction, or improvement of those assets.
b. Restricted net position – Consists of net positions with constraints placed on the use either by (1) external groups such as creditors, grantors, contributors, or laws or regulations of other governments; or (2) law through constitutional provisions or enabling legislation.
c. Unrestricted net position – All other net positions that do not meet the definition of “restricted’ or “net investment in capital assets.”
Governmental fund balances are reported, in accordance with Governmental Accounting Standards Board Statement No. 54, Fund Balance Reporting and Governmental Fund Type Definitions, as either Nonspendable, Restricted, Committed, Assigned and/or Unassigned.
� Nonspendable fund balance includes amounts that are not in a spendable form such as inventory, prepaid amounts and the long-term amounts of loans and notes receivable, or are legally or contractually required to be maintained intact.
� Restricted fund balance includes amounts that can be spent only for the specific purposes stipulated by external resource providers such as grantors or enabling legislations. Restrictions may be changed or lifted only with the consent of the resource providers.

62
NOTES TO THE BASIC FINANCIAL STATEMENTS SHELBY COUNTY June 30, 2014 BOARD OF EDUCATION
� Committed fund balance includes amounts that can be used only for the specific purposes determined by formal action by the Shelby County Schools Board members, the Board’s highest level of decision making authority. Commitments may be changed or lifted only by the Shelby County Schools Board members taking the same formal action that imposed the constraint.
� Assigned fund balance includes amounts that the Board intends to use for a specific purpose, but are not restricted or committed. The intent shall be expressed by resolution of the Shelby County Board of Education or official to which the Board has delegated the authority, such as the Superintendent or his designee (e.g. legal contingencies).
� Unassigned fund balance is the residual classification for the General Fund and General Purpose School Fund. It includes amounts that are not contained in the other classifications. Unassigned amounts are the portion of fund balance that is not obligated or specifically designated and is available for any purpose. Any deficit balances in the other governmental fund types are reported as unassigned.
Minimum Fund Balance Policy
Shelby County Board of Education believes sound financial management principles require sufficient funds be retained by the District to provide a stable financial base at all times. To retain this stable financial base, the District needs to maintain a general fund balance sufficient to fund all cash flows of the District, to provide financial reserves for unanticipated expenditures and/or revenue shortfalls of an emergency nature, and to provide funds for all existing encumbrances.
In order to maintain and protect the long term financial capacity of Shelby County Schools, total fund balance restricted for education in the General Fund will be maintained at a level not less than required by Tennessee Code Annotated (TCA) 49-3-352. Should the restricted fund balance amount fall below the required level, the Board must approve and adopt a plan to restore this balance to the required level within 24 months. If restoration of the restricted fund balance cannot be accomplished within such period without severe hardship to the District, the Board will establish a different time period.
Order of Expenditure of Funds
In accordance with Governmental Accounting Standards Board Statement No. 54, when multiple categories of fund balances are available, such as restricted and unrestricted resources in the General Fund, Capital Projects Fund, and Special Revenue Funds, the District will start spending from the most restricted category and spend those funds first before moving down to the next category with available funds.
Post Employment Benefits
In addition to providing pension benefits, the Board provides health insurance coverage for current and future retirees as described in Note 14.

63
NOTES TO THE BASIC FINANCIAL STATEMENTS SHELBY COUNTY June 30, 2014 BOARD OF EDUCATION
NOTE 2 – GOVERNMENT COMBINATIONS
On December 20, 2010, the Memphis City Schools Board of Commissioners voted to surrender Memphis City Schools’ Charter. Tennessee Code Annotated requires a referendum be held. Memphis voters ratified the Board’s decision to transfer the administration of Memphis City Schools to County Schools on March 8, 2011. Shelby County Schools filed a complaint for declaratory judgment on February 11, 2011, and United States District Judge Samuel Mays ruled on August 8, 2011, that Memphis City Schools would cease to exist at the conclusion of the 2012-13 school year. As a result, the operations of Memphis City Schools, a legally separate entity, ceased to exist as of June 30, 2013. On July 1, 2013, the services formerly provided by Memphis City Schools were taken over by Shelby County Schools.
The following carrying values of the former Memphis City Schools were recognized and included in the Board’s Statement of Net Position as of July 1, 2013, the effective transfer date:
Governmental Activities
AssetsCash and cash equivalents 177,413,870$ Investments 30,165,682 Due from other governments 131,129,547 Other receivables 9,868,563 Inventories 12,478,785 Prepaids 2,151,672 Capital assets, not being depreciated 38,564,159 Capital assets, being depreciated, net 953,610,159
Total assets 1,355,382,437
LiabilitiesAccounts payable and other accrued liabilities 85,048,890 Insurance claims payable 13,226,954 Unearned revenue 2,126,279 Long-term liabilities:
Due within one year 3,664,210 Due in more than one year 8,326,464
Total liabilities 112,392,797
Net PositionNet investment in capital assets 990,315,367 Restricted for :
Capital projects 17,317,959 Contracted grant programs 7,202,282 Food service 17,908,847 Education 24,762,823
Unrestricted 185,482,362 Total net position 1,242,989,640$
64
NOTES TO THE BASIC FINANCIAL STATEMENTS SHELBY COUNTY June 30, 2014 BOARD OF EDUCATION
In anticipation of the merger, Shelby County Schools and Memphis City Schools synchronized accounting policies in fiscal year 2013 (the previous fiscal year). Therefore, there was no need to adjust for different accounting principles. There were no adjustments to the carrying values of capital assets because there were no impairments as a result of the merger.
NOTE 3 – CASH AND CASH EQUIVALENTS
Cash and cash equivalents (excluding fiduciary funds) at June 30, 2014, consist of the following:
Cash and cash equivalents include cash on hand, demand deposits, savings accounts and short-term investments with maturities of three months or less at the time of purchase. The County pools substantially all of its cash and cash equivalents. The Board owns a pro rata share in the pool. Investment earnings of the pool are allocated monthly to each fund based upon the average balance.
Deposits with the State Treasurer’s Local Government Investment Pool (LGIP) may be withdrawn with a maximum of one day’s notice, are classified as cash equivalents and are valued at cost. The LGIP is not registered with the SEC as an investment company. However, the LGIP has a policy that it will – and does – operate in a manner consistent with the SEC’s Rule 2a7 of the Investment Company Act of 1940. Rule 2a7 allows SEC-registered mutual funds to use amortized cost rather than fair value to report net assets to compute share prices if certain conditions are met. State statutes require the State Treasurer to administer the LGIP under the same terms and conditions, including collateral requirements, as required for other funds invested by the Treasurer. The reported value of the pool is the same as the fair value of the pool shares.
Custodial credit risk Bank deposits and certificates of deposit of the County, consistent with State statutes, are covered by federal depository insurance (FDIC) or are collateralized by a multiple financial institution collateral pool administered by the Treasurer of the State of Tennessee. On limited occasions the County may have deposits with financial institutions that do not participate in the State collateral pool; in these instances separate collateral equal to at least 105% of the uninsured deposit is collateralized and held in the County’s name by a third party.
Deposits and investments are classified into three categories of credit risk based upon the following:
Category Description
1 Insured or registered, or securities held by the Board or its agent in the Board’s name.
2 Uninsured or unregistered, with securities held by the counterparty’s trust department or agent in the Board’s name.
3 Uninsured and unregistered, with securities held by the counterparty, or by its trust department or agent, but not in the Board’s name.
Deposit accounts 221,109,379$ Investments in state's local government investment pool 21,620,676
242,730,055$

65
NOTES TO THE BASIC FINANCIAL STATEMENTS SHELBY COUNTY June 30, 2014 BOARD OF EDUCATION
At June 30, 2014, the deposits held were $ 250,024,659 . Deposit accounts are considered category 1 and other investments are not required to be classified. The cash of the Fiduciary fund is not included here.
NOTE 4 – INVESTMENTS
Investments as of June 30, 2014, are recorded at fair value and consist of the following:
Investment TypeGeneral
FundRetirement
Fund
Health Insurance
Fund
Student Activity Fund Total
Weighted Average Maturity in Years
CDARS 1,381,822$ - - - 1,381,822$ - CDs 12,574,120 - 300,000 - 12,874,120 - Agencies 2,303,037 - - - 2,303,037 - Common stocks - 1,019,185 - - 1,019,185 - Corporate bonds - 55,618 - - 55,618 0.93Short term investments - 753,876 - 669,505 1,423,381 -
16,258,979$ 1,828,679$ 300,000$ 669,505$ 19,057,163$
Shelby County Board of Education, except for the Retirement and Internal School Fund: The County Trustee invests monies on behalf of the Board. Investments are stated at fair value. Fair value is based on quoted market prices, if available, or estimated using quoted market prices for similar securities. State statutes authorize the County Trustee to invest in obligations of the U.S. Treasury, obligations issued or guaranteed by any U.S. Government agency, certificates of deposits at Tennessee and federal chartered banks and savings and loan associations, repurchase agreements utilizing obligations of the United States or its agencies as underlying securities, LGIP, prime banker’s acceptances and prime commercial paper. The maximum maturity is two years.
Custodial credit risk Bank deposits and certificates of deposit of the County, consistent with State statutes, are covered by federal depository insurance (FDIC) or are collateralized by a multiple financial institution collateral pool administered by the Treasurer of the State of Tennessee. On limited occasions
Shelby County Trustee
Shelby County Board of Education
Total Cash and Cash Equivalents
LGIP 21,615,626$ 5,050$ 21,620,676$ PFIC-BOA 20,730,739 - 20,730,739 PFDs-Regions 138,328,839 - 138,328,839 Liquid CDARs-Metropolitan 35,472,595 - 35,472,595 Liquid CDARs-Magna 6,910,246 - 6,910,246 MUNI NOW- SunTrust 17,643,365 - 17,643,365 Cash-Regions 7,695,256 - 7,695,256 Cash-BOA 1,620,918 - 1,620,918 Cash-First Tennessee - 2,025 2,025
250,017,584$ 7,075$ 250,024,659$

66
NOTES TO THE BASIC FINANCIAL STATEMENTS SHELBY COUNTY June 30, 2014 BOARD OF EDUCATION
the County may have deposits with financial institutions that do not participate in the State collateral pool; in these instances separate collateral equal to at least 105% of the uninsured deposit is collateralized and held in the County’s name by a third party.
Interest rate risk is the risk that changes in interest rates will adversely affect the fair value of an investment. Both State statutes and County's investment policy limit investment maturities as a means of managing its exposure to fair value losses arising from increasing interest rates.
Credit risk is the risk that an issuer or other counterparty to an investment will not fulfill its obligations. Both State statues and the County’s investment policy limit investment permissible investments or impose collateral and custody provisions as specified above. Shelby County Board of Education Retirement Fund (Local Pensioners): Investments are considered category 1 of the three categories of credit risk. The Board invests in various fixed income debt securities such as agency securities and corporate bonds. Credit quality distributions for investments in fixed income debt securities, with credit risk as a percentage of total investments (excluding Internal School Fund) are approximately as follows as of June 30, 2014:
Aa2 2.90% 52,980 Baa1 2.83% 51,740 Baa2 3.04% 55,568
The Board limits its exposure to interest rate risk by diversifying its investments by security type and institution.
Interest rate risk is the risk that changes in interest rates will adversely affect the fair value of an investment. State statutes and Board policy limit investment maturities to control its exposure to fair value losses arising from increasing interest rates. Final maturity on the date of investment is not to exceed forty-eight (48) months or that may be tendered by the holder to the issuer thereof, or an agent of the issuer, at not less than forty-eight (48) month intervals.
Credit risk is the risk that an issuer or other counterparty to an investment will not fulfill its obligations. Both State statutes and Board investment policy limit permissible investments or impose collateral and custody provisions as noted above or in Note 1 in order to limit credit risk.

67
NOTES TO THE BASIC FINANCIAL STATEMENTS SHELBY COUNTY June 30, 2014 BOARD OF EDUCATION
NOTE 5 – ACCOUNTS PAYABLE AND OTHER ACCRUED LIABILITIES
Payables as of year-end for the School Board’s individual major funds and nonmajor funds disaggregated are as follows:
General FundCategorically Aided Fund
NonmajorFunds
Total Governmental
Funds
Accounts payable 16,490,645$ 1,943,547$ 3,037,177$ 21,471,369$ Accrued payroll and payroll deductions 73,368,423 5,714,594 455,818 79,538,835 Accrued vacation 881,973 54,274 52,289 988,536 Total 90,741,041$ 7,712,415$ 3,545,284$ 101,998,740$
NOTE 6 – GENERAL LONG-TERM OBLIGATIONS
In 2013, Shelby County Board of Education had no long–term debt as the Board of Education is fiscally dependent on County of Shelby for the issuance of debt for its capital projects. Due to the merger with Memphis City Board of Education, Shelby County Board of Education became responsible for debt under the former specific agreements with the State of Tennessee, as well as additional compensated absences.
Former Agreement for General Long-Term Obligations
Due to the merger with Memphis City Schools, Shelby County Schools now has bond indebtedness as of June 30, 2014, with interest rates of 0%. The Shelby County Board of Education also pays administrative fees (required by County of Shelby) related to debt acquired by the county government on the Board’s behalf. Debt service requirements for principal and interest are paid from the General Fund and there are no designations of fund balance for debt service because each year’s debt service requirements are expected to be paid from that year’s revenue. Other long-term liabilities, compensated absences, and pension liabilities are also paid from the General Fund.
Future years’ debt service requirements for long-term obligations are as follows:
Year Ending ENA Claims Due to StateJune 30, Obligation of Tennessee Total
Principal:2015 6,870,022$ 547,384$ 7,417,406$ 2016 - 547,384 547,384 2017 - 72,267 72,267 2018 - 72,267 72,267 2019 - 72,266 72,266
Total 6,870,022$ 1,311,568$ 8,181,590$
Debt detailed in the above schedule is from Qualified Zone Academy Bonds (QZAB) that are interest free. There are administrative fees other than interest associated with QZAB bonds. All administrative fees for Qualified School Construction Bonds (QSCB) and QZAB Bonds are included in interest and fees expenditures in the general fund. The Shelby County Government is liable for the QSCB debt.
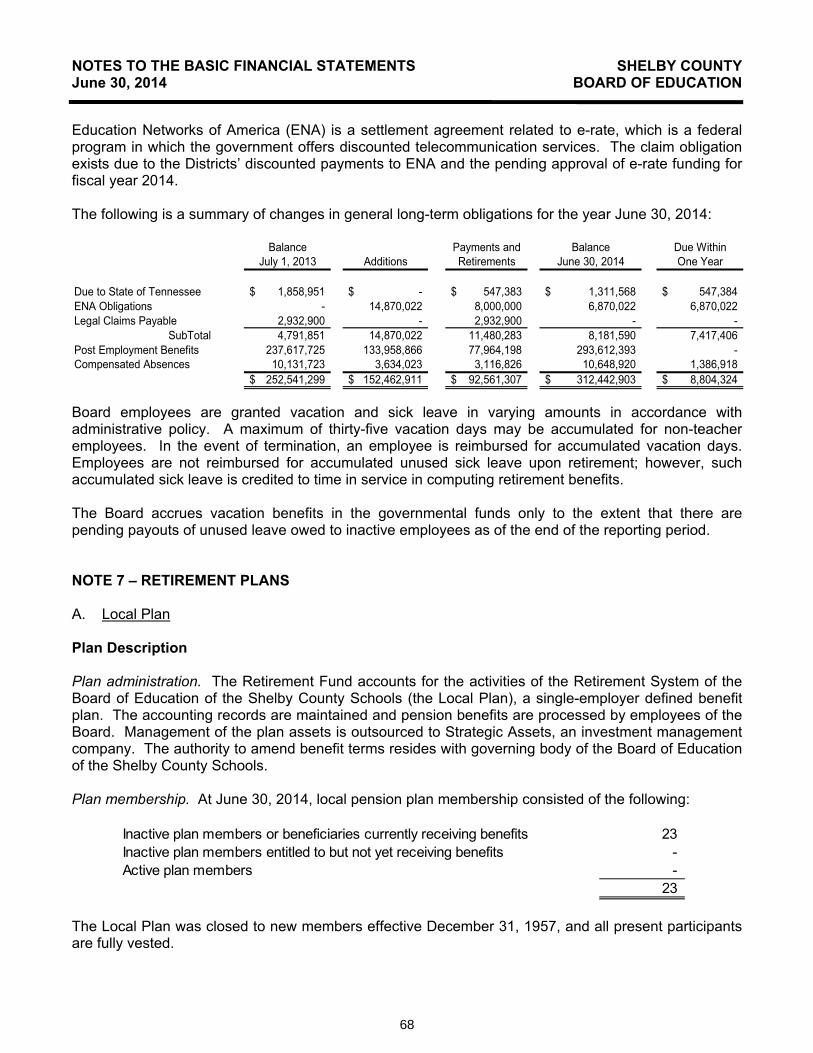
68
NOTES TO THE BASIC FINANCIAL STATEMENTS SHELBY COUNTY June 30, 2014 BOARD OF EDUCATION
Education Networks of America (ENA) is a settlement agreement related to e-rate, which is a federal program in which the government offers discounted telecommunication services. The claim obligation exists due to the Districts’ discounted payments to ENA and the pending approval of e-rate funding for fiscal year 2014.
The following is a summary of changes in general long-term obligations for the year June 30, 2014:
Balance Payments and Balance Due WithinJuly 1, 2013 Additions Retirements June 30, 2014 One Year
Due to State of Tennessee 1,858,951$ -$ 547,383$ 1,311,568$ 547,384$ ENA Obligations - 14,870,022 8,000,000 6,870,022 6,870,022 Legal Claims Payable 2,932,900 - 2,932,900 - -
SubTotal 4,791,851 14,870,022 11,480,283 8,181,590 7,417,406 Post Employment Benefits 237,617,725 133,958,866 77,964,198 293,612,393 - Compensated Absences 10,131,723 3,634,023 3,116,826 10,648,920 1,386,918
252,541,299$ 152,462,911$ 92,561,307$ 312,442,903$ 8,804,324$
Board employees are granted vacation and sick leave in varying amounts in accordance with administrative policy. A maximum of thirty-five vacation days may be accumulated for non-teacher employees. In the event of termination, an employee is reimbursed for accumulated vacation days. Employees are not reimbursed for accumulated unused sick leave upon retirement; however, such accumulated sick leave is credited to time in service in computing retirement benefits.
The Board accrues vacation benefits in the governmental funds only to the extent that there are pending payouts of unused leave owed to inactive employees as of the end of the reporting period.
NOTE 7 – RETIREMENT PLANS
A. Local Plan
Plan Description
Plan administration. The Retirement Fund accounts for the activities of the Retirement System of the Board of Education of the Shelby County Schools (the Local Plan), a single-employer defined benefit plan. The accounting records are maintained and pension benefits are processed by employees of the Board. Management of the plan assets is outsourced to Strategic Assets, an investment management company. The authority to amend benefit terms resides with governing body of the Board of Education of the Shelby County Schools.
Plan membership. At June 30, 2014, local pension plan membership consisted of the following:
Inactive plan members or beneficiaries currently receiving benefits 23 Inactive plan members entitled to but not yet receiving benefits - Active plan members -
23
The Local Plan was closed to new members effective December 31, 1957, and all present participants are fully vested.

69
NOTES TO THE BASIC FINANCIAL STATEMENTS SHELBY COUNTY June 30, 2014 BOARD OF EDUCATION
Benefits provided. The Board paid net benefits of $311,149 ($424,456 net of $113,307 reimbursements from the state) for employees covered by the Local Plan for the year ended June 30, 2014. As provided by State law, the State of Tennessee Consolidated Retirement System (TCRS) pays the Local Plan for distribution to its retired participants amounts necessary to equalize retiree benefits as if they had retired with TCRS benefits. Contributions to the Local Plan from the TCRS were $113,307 during the year ended June 30, 2014. The on-behalf payments by the state of fringe benefits and salaries for the local retirees were recognized as revenues and expenses.
Benefit terms provide for annual cost-of-living adjustments to each member’s retirement allowance subsequent to the member’s retirement date. These cost-of-living adjustments should correlate with the adjustments made by the TCRS.
Contributions. Employees were required to contribute 5% of their individual compensation for the first thirty-five years of service. The Board’s annual contribution could not be less than the aggregate employee contributions.
Investments
Investment Policy. The pension plan’s policy in regard to the allocation of invested assets is established and may be amended by the Board by a majority vote of its members. It is the policy of the Board to pursue an investment strategy that reduces risk through the prudent diversification of the portfolio across a broad selection of distinct asset classes.
Concentrations. As of June 30, 2014, the pension plan held five percent or more of the plan’s fiduciary net position (other than issued or explicitly guaranteed by the U.S. government) in the following:
Ishares Russell 2000 ETF 8.61% Ishares Russell Midcap ETF 5.38%
Rate of return. For the year ended June 30, 2014, the annual money-weighted rate of return on pension plan investments, net of pension plan investment expense, was 13.47 percent. The money-weighted rate of return expresses investment performance, net of investment expense, adjusted for the changing amounts actually invested.
The pension plan reported no receivables from long-term contracts with the Board for contributions. The pension plan had no allocated insurance contracts that are excluded from pension plan assets. The pension plan had no reserves and no deferred retirement option program.
Net Pension Liability of the Board
The components of the net pension liability of the Board at June 30, 2014 were as follows:
Total pension liability $ 1,902,191 Plan fiduciary net position (1,670,234)Board's net pension liability $ 231,957
Plan fiduciary net position as a percentage of the total pension liability 87.81%

70
NOTES TO THE BASIC FINANCIAL STATEMENTS SHELBY COUNTY June 30, 2014 BOARD OF EDUCATION
Actuarial assumptions. The total pension liability was determined by an actuarial valuation as of June 30, 2014, using the following actuarial assumptions applied to all periods included in the measurement:
Inflation 3.0 percent Investment rate of return 5.0 percent, net of pension plan investment expense Municipal bond index rate 4.35 percent Single equivalent interest rate 4.72 percent
Mortality rates were based on the RP-2000 Combined Mortality Table set forward three years for males and set forward one year for females based on Scale AA projection to 2025. The table is used for the period after retirement and for dependent beneficiaries. Representative values of the assumed rates of death after service retirements are as follows:
Discount rate. The discount rate used to measure the total pension liability was 4.72 percent. The pension plan’s fiduciary net position was projected to be available to make projected future benefit payments of current plan members until 2033. Therefore, the long-term expected rate of return on pension plan investments was applied to all periods of projected benefit payments through 2032 and a municipal bond index rate of 4.35 percent was applied to all periods of projected benefit payments after 2032. The Single Equivalent Interest Rate (SEIR) that discounts the entire projected benefit stream to the same amount as the sum of the present values of the two separate benefit payments streams was used to determine the total pension liability.
Sensitivity of the net pension liability to changes in the discount rate. The following presents the net pension liability of the System, calculated using the discount rate of 4.72 percent, as well as what the System’s net pension liability would be if it were calculated using a discount rate that is 1-percentage-point lower (3.72 percent) or 1-percentage-point higher (5.72 percent) than the current rate:
1% Decrease(3.72%)
CurrentDiscount
Rate(4.72%)
1% Increase(5.72%)
Shelby County Schools' net pension liability $ 392,461 $ 231,957 $ 98,520
Age Male Female65 1.2562% 0.9664%70 2.0825 1.639175 3.6640 2.533280 6.9785 4.260185 12.6336 7.431190 21.1384 13.414095 29.9904 19.5353100 37.3578 23.8786

71
NOTES TO THE BASIC FINANCIAL STATEMENTS SHELBY COUNTY June 30, 2014 BOARD OF EDUCATION
B. Tennessee Consolidated Retirement System (TCRS)-Non-teachers
1. Plan Description
Employees of Shelby County Schools are members of the Political Subdivision Pension Plan (PSPP), an agent multiple employer defined benefit pension plan administered by the Tennessee Consolidated Retirement System (TCRS). TCRS provides retirement benefits as well as death and disability benefits. Benefits are determined by a formula using the member’s high five-year average salary and years of service. Members become eligible to retire at the age of 60 with five years of service or at any age with 30 years of service. A reduced retirement benefit is available to vested members at the age of 55. Disability benefits are available to active members with five years of service who become disabled and cannot engage in gainful employment. There is no service requirement for disability that is the result of an accident or injury occurring while the member was in the performance of duty. Members joining the system after July 1, 1979 become vested after five years of service and members joining prior to July 1, 1979 were vested after four years of service. Benefit provisions are established in state statute found in Title 8, Chapter 34-37 of the Tennessee Code Annotated (TCA). State statutes are amended by the Tennessee General Assembly. Political subdivisions such as Shelby County Schools participate in the TCRS as individual entities and are liable for all costs associated with the operation and administration of their plan. Benefit improvements are not applicable to a political subdivision unless approved by the chief governing body. The TCRS issues a publicly available financial report that includes financial statements and required supplementary information for the PSPP. That report may be obtained by writing to Tennessee Treasury Department, Consolidated Retirement System, 15th Floor Andrew Jackson Building, Nashville, TN 37243-0230 or can be accessed at http://www.tn.gov/treasury/tcrs/PS/.
2. Funding Policy
Shelby County Schools requires employees to contribute five percent of earnable compensation. Shelby County Schools is required to contribute at an actuarially determined rate; the rate for the fiscal year ending June 30, 2014, was 8.99% of annual covered payroll. The contribution requirement of plan members is set by state statute. The contribution requirement for Shelby County Schools is established and may be amended by the TCRS Board of Trustees.
3. Annual Pension Cost
For the year ending June 30, 2014, Shelby County Schools’ annual pension cost of $15,158,220 to TCRS was equal to Shelby County Schools’ required and actual contributions. The required contribution was determined as part of the July 1, 2011, actuarial valuation using the frozen entry age actuarial cost method. Significant actuarial assumptions used in the valuation include (a) rate of return on investment of present and future assets of 7.5 percent a year compounded annually, (b) projected 3.0 percent annual rate of inflation, (c) projected salary increases of 4.75 percent (graded) annual rate (no explicit assumption is made regarding the portion attributable to the effects of inflation on salaries), (d) projected 3.5 percent annual increase in the Social Security wage base, and (e) projected post retirement increases of 2.5 percent annually. The actuarial value of assets was determined using techniques that smooth the effect of short-term volatility in the market value of total investments over a ten-year period. Shelby County Schools’ unfunded actuarial accrued liability is being amortized as a level dollar amount on a closed basis. The remaining amortization period at July 1, 2011 was 2 years. An actuarial valuation was performed as of July 1, 2011, which established contribution rates effective July 1, 2012.
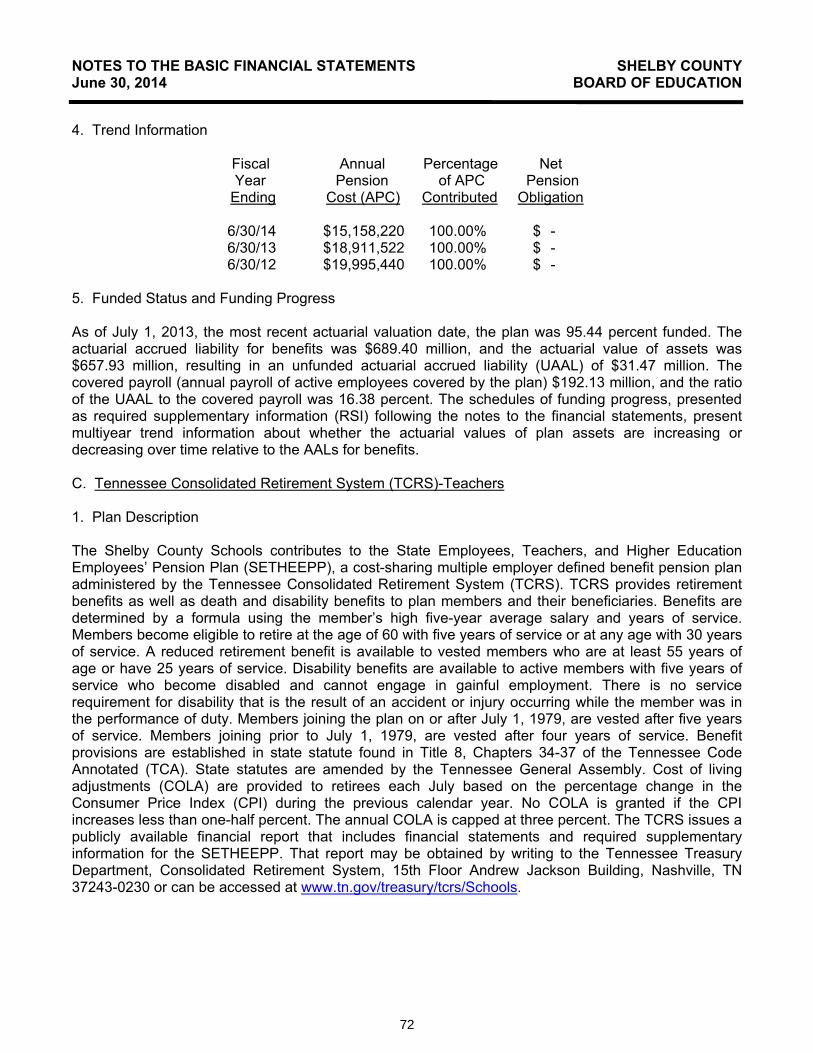
72
NOTES TO THE BASIC FINANCIAL STATEMENTS SHELBY COUNTY June 30, 2014 BOARD OF EDUCATION
4. Trend Information
Fiscal Annual Percentage Net Year Pension of APC Pension
Ending Cost (APC) Contributed Obligation
6/30/14 $15,158,220 100.00% $ - 6/30/13 $18,911,522 100.00% $ - 6/30/12 $19,995,440 100.00% $ -
5. Funded Status and Funding Progress
As of July 1, 2013, the most recent actuarial valuation date, the plan was 95.44 percent funded. The actuarial accrued liability for benefits was $689.40 million, and the actuarial value of assets was $657.93 million, resulting in an unfunded actuarial accrued liability (UAAL) of $31.47 million. The covered payroll (annual payroll of active employees covered by the plan) $192.13 million, and the ratio of the UAAL to the covered payroll was 16.38 percent. The schedules of funding progress, presented as required supplementary information (RSI) following the notes to the financial statements, present multiyear trend information about whether the actuarial values of plan assets are increasing or decreasing over time relative to the AALs for benefits.
C. Tennessee Consolidated Retirement System (TCRS)-Teachers
1. Plan Description
The Shelby County Schools contributes to the State Employees, Teachers, and Higher Education Employees’ Pension Plan (SETHEEPP), a cost-sharing multiple employer defined benefit pension plan administered by the Tennessee Consolidated Retirement System (TCRS). TCRS provides retirement benefits as well as death and disability benefits to plan members and their beneficiaries. Benefits are determined by a formula using the member’s high five-year average salary and years of service. Members become eligible to retire at the age of 60 with five years of service or at any age with 30 years of service. A reduced retirement benefit is available to vested members who are at least 55 years of age or have 25 years of service. Disability benefits are available to active members with five years of service who become disabled and cannot engage in gainful employment. There is no service requirement for disability that is the result of an accident or injury occurring while the member was in the performance of duty. Members joining the plan on or after July 1, 1979, are vested after five years of service. Members joining prior to July 1, 1979, are vested after four years of service. Benefit provisions are established in state statute found in Title 8, Chapters 34-37 of the Tennessee Code Annotated (TCA). State statutes are amended by the Tennessee General Assembly. Cost of living adjustments (COLA) are provided to retirees each July based on the percentage change in the Consumer Price Index (CPI) during the previous calendar year. No COLA is granted if the CPI increases less than one-half percent. The annual COLA is capped at three percent. The TCRS issues a publicly available financial report that includes financial statements and required supplementary information for the SETHEEPP. That report may be obtained by writing to the Tennessee Treasury Department, Consolidated Retirement System, 15th Floor Andrew Jackson Building, Nashville, TN 37243-0230 or can be accessed at www.tn.gov/treasury/tcrs/Schools.

73
NOTES TO THE BASIC FINANCIAL STATEMENTS SHELBY COUNTY June 30, 2014 BOARD OF EDUCATION
2. Funding Policy
Most teachers are required by state statute to contribute 5.0% of salary to the plan. The employer contribution rate for Shelby County Schools is established at an actuarially determined rate. The employer rate for the fiscal year ending June 30, 2014, was 8.88% of annual covered payroll. The employer contribution requirement for Shelby County Schools is established and may be amended by the TCRS Board of Trustees. The employer’s contributions to TCRS for the years ending June 30, 2014, 2013, and 2012 were $60,405,897, $62,167,415, $62,473,387, respectively, and equal to the required contributions for each year.
D. Other Employee Benefits
The Board provides certain health care and life insurance benefits for retired employees and their dependents/beneficiaries. As of the year ending June 30, 2014, a retiring employee hired before January 1, 2007, may continue health insurance coverage provided the employee has been covered for five consecutive years prior to retirement. A retiring employee hired after January 1, 2007, may continue health insurance coverage provided the employee has been covered for ten consecutive years prior to retirement. Retirement is defined as those who have reached age 60 and vested or 30 years of service, or age 55 with 25 years of service. The health care benefits were provided through a self-funded plan administered by an insurance company. The life insurance benefits were provided through an insurance company. Premiums for both are based on the benefits expected to be paid during the year. The cost of health care and life insurance benefits are classified as retiree benefits expenditure in the General Fund. For the years ended June 30, 2014, costs were $ 30,164,526 for 9,136 retirees, respectively. See Note 14 for information on Other Postemployment Benefits (OPEB).

74
NOTES TO THE BASIC FINANCIAL STATEMENTS SHELBY COUNTY June 30, 2014 BOARD OF EDUCATION
NOTE 8 – CAPITAL ASSETS
A summary of changes in capital assets follows:
Transfers toBalance 7/1/2013 Reclassifications Additions
Disposals and Adjustments
Municipal Schools
Balance 6/30/2014
Capital assets not being depreciated:Land 58,383,328$ -$ -$ (112,490)$ (12,669,951)$ 45,600,887$ Construction in Progress 11,540,566 (14,372,779) 6,579,463 - - 3,747,250
69,923,894 (14,372,779) 6,579,463 (112,490) (12,669,951) 49,348,137Capital assets being depreciated:
Buildings and Improvements 1,922,452,221 8,701,403 69,850 (4,133,267) (306,124,529) 1,620,965,678Machinery and Equipment 244,835,284 - 2,091,489 (21,972,080) (5,447,264) 219,507,429Intangible Assets - 5,671,376 - - - 5,671,376
2,167,287,505 14,372,779 2,161,339 (26,105,347) (311,571,793) 1,846,144,483Less accumulated depreciation:
Buildings and improvements (675,210,007) - (50,223,760) 3,433,150 97,934,612 (624,066,005)Machinery and Equipment (174,026,966) - (17,598,593) 14,371,581 3,104,530 (174,149,448)Intangible Assets - - (567,138) - - (567,138)
Total accumulated depreciation (849,236,973) - (68,389,492) 17,804,731 101,039,142 (798,782,591)Capital assets being depreciated, net 1,318,050,532 14,372,779 (66,228,153) (8,300,616) (210,532,651) 1,047,361,892Total capital assets, net 1,387,974,426$ -$ (59,648,690)$ (8,413,106)$ (223,202,602)$ 1,096,710,029$
Total capital assets, not being depreciated
Total capital assets, being depreciated
Depreciation expense was charged to governmental functions as follow:
Instruction 53,887,542$ Instructional Support 2,916,471 Student Support 400,631 Office of Principal 1,620,185 General Administration 1,932,983 Fiscal Services 84,769 Other Support Services 289,364 Student Transportation 1,643,784 Plant Services 1,536,754 Community Service 286,617 Food Service 3,790,391
68,389,491$
The estimated cost to complete construction in progress at June 30, 2014 is $2,342,095.
Settlement Agreement and Capital Asset Transfers
Governor Bill Haslam approved House Bill 1288 in April 2013 paving the way for the creation of six new municipal school districts in Shelby County. The voters approved the separate school districts in a special referendum held in July 2013. As a result, thirty-three Shelby County schools became part of the municipal school districts for the 2014-2015 school year. The Board reached agreements with each of the municipal school districts whereby payments over a twelve year period are to be submitted to the Board to reduce OPEB obligations incurred as of May 31, 2014. The $22,350,792 discounted value of the payments, utilizing a 2% discount rate, is included in due from other governments in the government-wide statements.

75
NOTES TO THE BASIC FINANCIAL STATEMENTS SHELBY COUNTY June 30, 2014 BOARD OF EDUCATION
In addition to the payments, the agreements provided for the transfer of assets on or after May 31, 2014. Assets were transferred on June 2, 2014 in accordance with the bill of sales. The transfers were comprised of land, building and improvements, and machinery and equipment with carrying values of $12,669,951, $208,189,197, $2,342,734, respectively.
Asset impairment
In accordance with GASB Statement No. 42, Accounting and Financial Reporting for Impairment of Capital Assets and for Insurance Recoveries, impaired capital assets that will no longer be used are reported at the lower of carrying value or fair value. The fair values of vacant buildings and unused land were estimated to be higher than the carrying values. Assets with a carrying value of approximately $5.9 million are considered to be idle assets at year-end.
NOTE 9 – COMMITMENTS AND CONTINGENCIES
The Board is a defendant in various lawsuits arising in the normal course of operations seeking awards for property damage, personal injury and certain personnel actions. In this regard, the Board has assigned $2,000,000 in the General Fund for any future legal claims. Although the monetary exposure, if any, related to the above lawsuits is not presently determinable, it is the Board’s opinion, after discussion with legal counsel, that ultimate settlement of these matters will not exceed the above assignment and, therefore, will not materially affect the financial condition of the Board.
The Board is exposed to various risks of loss related to torts, theft of, damage to and destruction of assets, errors and omissions, and natural disasters for which the Board carries commercial insurance. Amounts received or receivable from grantor agencies are subject to regulatory requirements, audit and adjustment by grantor agencies, principally the federal government. Any disallowed claims, including amounts previously recognized by the Board as revenue, would constitute a liability of the applicable funds.
The Board entered into the following multi-year contracts:
� Three year contract with Education Network of America (ENA) Services, LLC for internet services with an annual cost of $3,060,000.
� Two year contract with ENA Services, LLC for voice services with an annual cost of $3,828,000. � Three year contract with Lenovo Financial Services for learning devices at a yearly cost of
$3,558,024. � Two year contract with Educations Solutions Development (ESD) with an annual cost of
$480,000.
Subsequent to June 30, 2014, the Board has entered into school building improvement contracts totaling approximately $3,146,546.
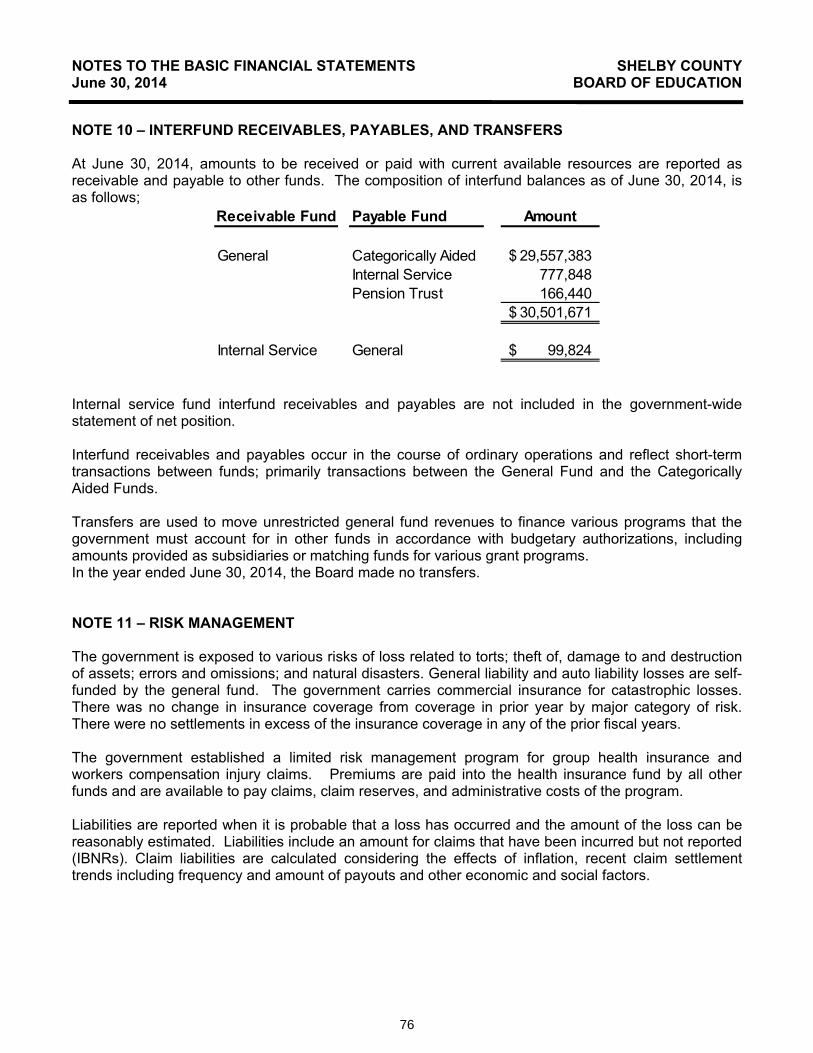
76
NOTES TO THE BASIC FINANCIAL STATEMENTS SHELBY COUNTY June 30, 2014 BOARD OF EDUCATION
NOTE 10 – INTERFUND RECEIVABLES, PAYABLES, AND TRANSFERS
At June 30, 2014, amounts to be received or paid with current available resources are reported as receivable and payable to other funds. The composition of interfund balances as of June 30, 2014, is as follows;
Receivable Fund Payable Fund Amount
General Categorically Aided 29,557,383$Internal Service 777,848 Pension Trust 166,440
30,501,671$
Internal Service General 99,824$
Internal service fund interfund receivables and payables are not included in the government-wide statement of net position.
Interfund receivables and payables occur in the course of ordinary operations and reflect short-term transactions between funds; primarily transactions between the General Fund and the Categorically Aided Funds.
Transfers are used to move unrestricted general fund revenues to finance various programs that the government must account for in other funds in accordance with budgetary authorizations, including amounts provided as subsidiaries or matching funds for various grant programs. In the year ended June 30, 2014, the Board made no transfers.
NOTE 11 – RISK MANAGEMENT
The government is exposed to various risks of loss related to torts; theft of, damage to and destruction of assets; errors and omissions; and natural disasters. General liability and auto liability losses are self-funded by the general fund. The government carries commercial insurance for catastrophic losses. There was no change in insurance coverage from coverage in prior year by major category of risk. There were no settlements in excess of the insurance coverage in any of the prior fiscal years.
The government established a limited risk management program for group health insurance and workers compensation injury claims. Premiums are paid into the health insurance fund by all other funds and are available to pay claims, claim reserves, and administrative costs of the program.
Liabilities are reported when it is probable that a loss has occurred and the amount of the loss can be reasonably estimated. Liabilities include an amount for claims that have been incurred but not reported (IBNRs). Claim liabilities are calculated considering the effects of inflation, recent claim settlement trends including frequency and amount of payouts and other economic and social factors.
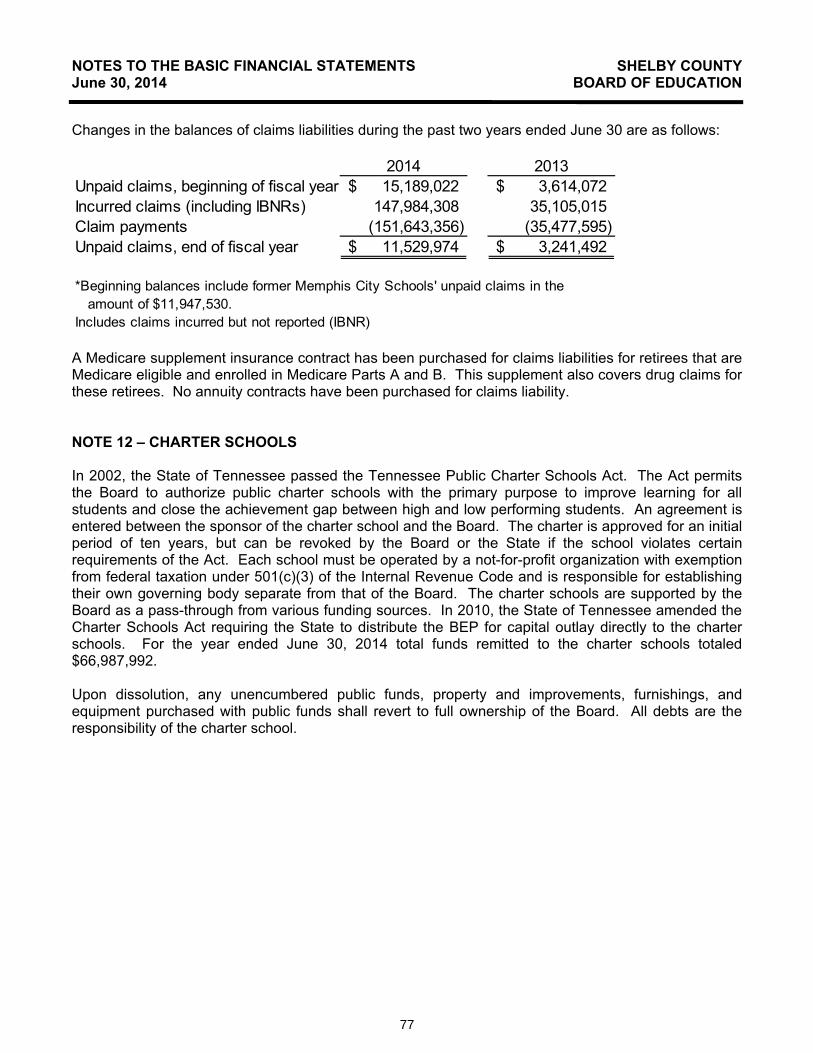
77
NOTES TO THE BASIC FINANCIAL STATEMENTS SHELBY COUNTY June 30, 2014 BOARD OF EDUCATION
Changes in the balances of claims liabilities during the past two years ended June 30 are as follows:
2014 2013Unpaid claims, beginning of fiscal year 15,189,022$ 3,614,072$ Incurred claims (including IBNRs) 147,984,308 35,105,015Claim payments (151,643,356) (35,477,595)Unpaid claims, end of fiscal year 11,529,974$ 3,241,492$
Includes claims incurred but not reported (IBNR)
*Beginning balances include former Memphis City Schools' unpaid claims in the amount of $11,947,530.
A Medicare supplement insurance contract has been purchased for claims liabilities for retirees that are Medicare eligible and enrolled in Medicare Parts A and B. This supplement also covers drug claims for these retirees. No annuity contracts have been purchased for claims liability.
NOTE 12 – CHARTER SCHOOLS
In 2002, the State of Tennessee passed the Tennessee Public Charter Schools Act. The Act permits the Board to authorize public charter schools with the primary purpose to improve learning for all students and close the achievement gap between high and low performing students. An agreement is entered between the sponsor of the charter school and the Board. The charter is approved for an initial period of ten years, but can be revoked by the Board or the State if the school violates certain requirements of the Act. Each school must be operated by a not-for-profit organization with exemption from federal taxation under 501(c)(3) of the Internal Revenue Code and is responsible for establishing their own governing body separate from that of the Board. The charter schools are supported by the Board as a pass-through from various funding sources. In 2010, the State of Tennessee amended the Charter Schools Act requiring the State to distribute the BEP for capital outlay directly to the charter schools. For the year ended June 30, 2014 total funds remitted to the charter schools totaled $66,987,992.
Upon dissolution, any unencumbered public funds, property and improvements, furnishings, and equipment purchased with public funds shall revert to full ownership of the Board. All debts are the responsibility of the charter school.
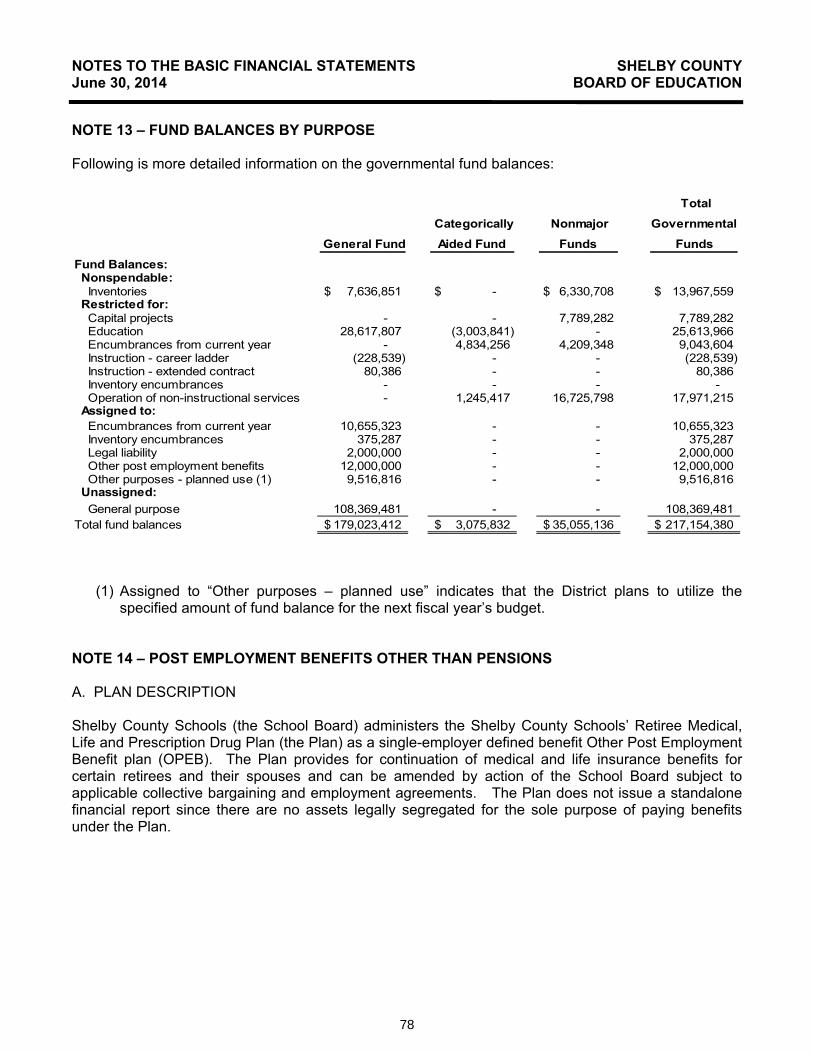
78
NOTES TO THE BASIC FINANCIAL STATEMENTS SHELBY COUNTY June 30, 2014 BOARD OF EDUCATION
NOTE 13 – FUND BALANCES BY PURPOSE
Following is more detailed information on the governmental fund balances:
General Fund
Categorically
Aided Fund
Nonmajor
Funds
Total
Governmental
Funds
Fund Balances: Nonspendable: Inventories 7,636,851$ -$ 6,330,708$ 13,967,559$ Restricted for: Capital projects - - 7,789,282 7,789,282 Education 28,617,807 (3,003,841) - 25,613,966 Encumbrances from current year - 4,834,256 4,209,348 9,043,604 Instruction - career ladder (228,539) - - (228,539) Instruction - extended contract 80,386 - - 80,386 Inventory encumbrances - - - - Operation of non-instructional services - 1,245,417 16,725,798 17,971,215 Assigned to: Encumbrances from current year 10,655,323 - - 10,655,323 Inventory encumbrances 375,287 - - 375,287 Legal liability 2,000,000 - - 2,000,000 Other post employment benefits 12,000,000 - - 12,000,000 Other purposes - planned use (1) 9,516,816 - - 9,516,816 Unassigned: General purpose 108,369,481 - - 108,369,481 Total fund balances 179,023,412$ 3,075,832$ 35,055,136$ 217,154,380$
(1) Assigned to “Other purposes – planned use” indicates that the District plans to utilize the specified amount of fund balance for the next fiscal year’s budget.
NOTE 14 – POST EMPLOYMENT BENEFITS OTHER THAN PENSIONS
A. PLAN DESCRIPTION
Shelby County Schools (the School Board) administers the Shelby County Schools’ Retiree Medical, Life and Prescription Drug Plan (the Plan) as a single-employer defined benefit Other Post Employment Benefit plan (OPEB). The Plan provides for continuation of medical and life insurance benefits for certain retirees and their spouses and can be amended by action of the School Board subject to applicable collective bargaining and employment agreements. The Plan does not issue a standalone financial report since there are no assets legally segregated for the sole purpose of paying benefits under the Plan.
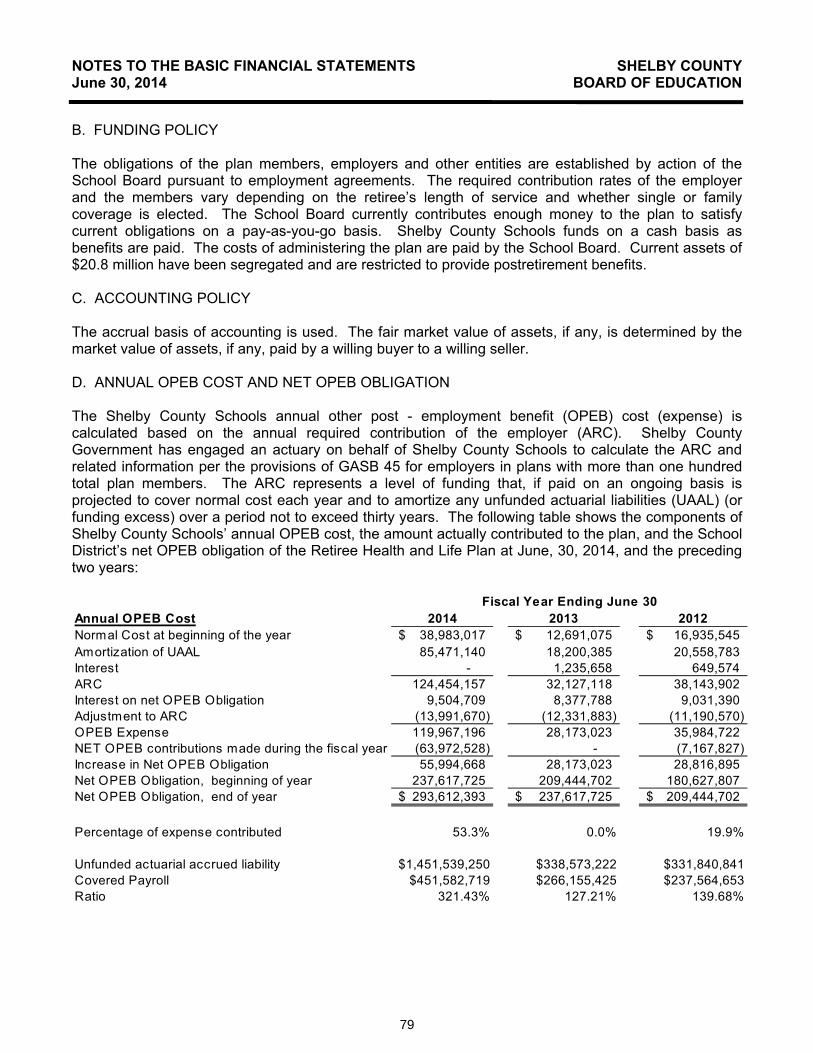
79
NOTES TO THE BASIC FINANCIAL STATEMENTS SHELBY COUNTY June 30, 2014 BOARD OF EDUCATION
B. FUNDING POLICY
The obligations of the plan members, employers and other entities are established by action of the School Board pursuant to employment agreements. The required contribution rates of the employer and the members vary depending on the retiree’s length of service and whether single or family coverage is elected. The School Board currently contributes enough money to the plan to satisfy current obligations on a pay-as-you-go basis. Shelby County Schools funds on a cash basis as benefits are paid. The costs of administering the plan are paid by the School Board. Current assets of $20.8 million have been segregated and are restricted to provide postretirement benefits.
C. ACCOUNTING POLICY
The accrual basis of accounting is used. The fair market value of assets, if any, is determined by the market value of assets, if any, paid by a willing buyer to a willing seller.
D. ANNUAL OPEB COST AND NET OPEB OBLIGATION
The Shelby County Schools annual other post - employment benefit (OPEB) cost (expense) is calculated based on the annual required contribution of the employer (ARC). Shelby County Government has engaged an actuary on behalf of Shelby County Schools to calculate the ARC and related information per the provisions of GASB 45 for employers in plans with more than one hundred total plan members. The ARC represents a level of funding that, if paid on an ongoing basis is projected to cover normal cost each year and to amortize any unfunded actuarial liabilities (UAAL) (or funding excess) over a period not to exceed thirty years. The following table shows the components of Shelby County Schools’ annual OPEB cost, the amount actually contributed to the plan, and the School District’s net OPEB obligation of the Retiree Health and Life Plan at June, 30, 2014, and the preceding two years:
Annual OPEB Cost 2014 2013 2012Normal Cost at beginning of the year 38,983,017$ 12,691,075$ 16,935,545$ Amortization of UAAL 85,471,140 18,200,385 20,558,783Interest - 1,235,658 649,574ARC 124,454,157 32,127,118 38,143,902Interest on net OPEB Obligation 9,504,709 8,377,788 9,031,390Adjustment to ARC (13,991,670) (12,331,883) (11,190,570)OPEB Expense 119,967,196 28,173,023 35,984,722NET OPEB contributions made during the fiscal year (63,972,528) - (7,167,827)Increase in Net OPEB Obligation 55,994,668 28,173,023 28,816,895Net OPEB Obligation, beginning of year 237,617,725 209,444,702 180,627,807Net OPEB Obligation, end of year 293,612,393$ 237,617,725$ 209,444,702$
Percentage of expense contributed 53.3% 0.0% 19.9%
Unfunded actuarial accrued liability $1,451,539,250 $338,573,222 $331,840,841Covered Payroll $451,582,719 $266,155,425 $237,564,653Ratio 321.43% 127.21% 139.68%
Fiscal Year Ending June 30

80
NOTES TO THE BASIC FINANCIAL STATEMENTS SHELBY COUNTY June 30, 2014 BOARD OF EDUCATION
E. FUNDED STATUS AND FUNDING PROGRESS
As of June 30, 2014, the actuarial accrued liability for benefits was $1,472,361,305 of which $1,451,539,250 was unfunded. The covered payroll (annual payroll of active employees covered by the plan) was $451,582,719, and the ratio of the unfunded actuarial accrued liability to the covered payroll was 321%.
The projection of future benefit payments for an ongoing plan involves estimates of the value of reported amounts and assumptions about the probability of occurrence of events far into the future.
Examples include assumptions about future employment, mortality, and the healthcare cost trend. Amounts determined regarding the funded status of the plan and the annual required contributions of the employer are subject to continual revision as actual results are compared with past expectations and new estimates are made about the future. The schedule of funding progress, presented as required supplementary information, presents multiyear trend information about whether the actuarial value of plan assets is increasing or decreasing over time relative to the actuarial accrued liabilities for benefits.
F. METHODS AND ASSUMPTIONS
Projections of benefits for financial reporting purposes are based on the substantive plan (the plan as understood by the employer and plan members) and include the types of benefits provided at the time of each valuation and the historical pattern of sharing of benefit costs between the employer and plan members to the point. The methods and assumptions used include techniques that are designed to reduce the effects of short-term volatility in actuarial accrued liabilities and the actuarial value of assets, consistent with the long-term perspective of the calculations. Since the prior valuation, the valuation’s demographic assumptions (e.g., rates of termination, mortality, disability, and retirement) have been revised to match the demographic assumptions used in the valuation of the Tennessee Consolidated Retirement System (TCRS). The methodology used to develop per capita costs of health care (including a change to the methodology used to relate health care costs between ages), the rates of health care inflation used to project the per capita costs, and the rates of the plan election of health care benefit options for future retirees have been revised since the previous valuation. Also, the payroll growth rate assumption of 3.50% has been replaced by the age-based salary increase assumption used the valuation of the TCRS. The following assumptions were made:
Valuation date June 30, 2014 Actuarial cost method Projected Unit Credit Amortization method Level Dollar, Closed Remaining amortization period 27 Years Asset valuation method Market Value of Assets Actuarial assumptions:
Investment Rate of Return* 4.00%
*Includes inflation at 4.00%
Pre-Medicare Medicare Health care cost trend rate 7.75% 5.75% Ultimate trend rate 5.00% 5.00% Year of Ultimate trend rate 2019 2017

81
NOTES TO THE BASIC FINANCIAL STATEMENTS SHELBY COUNTY June 30, 2014 BOARD OF EDUCATION
i. Actuarial Method
Costs were determined using the Projected Unit Credit (PUC) Actuarial Cost Method. Under this method, the present value of future benefits is pro-rated by accrued service over total service to decrement. Note that the most recent GASB exposure draft indicates a requirement to change the Actuarial Cost Method to Entry Age Normal (EAN) for fiscal years beginning after December 15, 2016.
ii. Health Care Cost Trend Rates
Following is a chart detailing the trend assumptions applied to annual per capita health care costs and contributions.
Year Beginning July 1
Medical and Prescription Cost Trend
CIGNA Plans Medicare Supplement
Plan2014 7.75% 5.75% 2015 6.75% 5.50% 2016 6.25% 5.25% 2017 5.75% 5.00% 2018 5.25% 5.00%
2019 and beyond 5.00% 5.00%
iii. Annual Expected Medical/RX Claims (Medical and RX are age adjusted to age 65)
Following is a chart detailing expected medical and prescription claims age adjusted to age 65 for adult coverage for the year following the valuation date. The assumed health care claims costs are based on the premium rates provided by the Shelby County Schools and are assumed to include administrative expenses.
ApplicabilityFuture
Retirees
Current Retirees
HRA OAP Basic OAP Plus
Memphis City SchoolsLegacy
Pre-Medicare $10,167 $10,456 $9,393 $10,653 $9,393
Medicare $3,394 $3,394 $3,394 $3,394 $9,393

82
NOTES TO THE BASIC FINANCIAL STATEMENTS SHELBY COUNTY June 30, 2014 BOARD OF EDUCATION
iv. Age Related Morbidity
Per capita health care costs are adjusted to reflect expected cost changes related to age. The increase to the net incurred claims was assumed to be:
Participant Age Annual Increase < 30
30 – 34 35 – 39 40 – 44 45 – 49 50 – 54 55 – 59 60 – 64 65 – 69 70 – 74 75 – 79 80 – 84 85 - 89
90 and over
0.0%1.0%1.5%2.0%2.6%3.3%3.6%4.2%3.0%2.5%2.0%1.0%0.5%0.0%
v. Spouse Coverage in Health Care Plans
Use of actual census data and current plan elections for spouses of current retirees. For spouses of future retirees, it is assumed that female spouses are four years younger than their male spouse.
vi. Anticipated Plan Participation
Since we were not provided census data to examine the retiree participation assumption, we have used assumptions consistent with the prior actuary’s report. This assumption should be examined for the next valuation. The assumed annual rates of future retiree participation and election of spouse coverage are as follows:
Benefit Retirees Spouses
Health Care 93% 25% of Participating Retirees
Life Insurance 97% N/A

83
NOTES TO THE BASIC FINANCIAL STATEMENTS SHELBY COUNTY June 30, 2014 BOARD OF EDUCATION
vii. Anticipated Plan Elections
The assumed rates of coverage elections for current retirees under age 65 and future retirees are as follows:
Plan Applicability Election
RateHRA Pre-Medicare 2% OAP Basic Pre-Medicare 60% OAP Plus Pre-Medicare 38% MedicareSupplement Medicare 100%
viii. Salary Increases
Salary increase rates vary by age. Representative values of the assumed rates of salary increase are as follows:
Attained Age Increase Per Year
20 8.97% 30 6.73 40 5.35 50 4.27 60 3.79 65 3.71
ix. Rates of Retirement, Mortality, Termination, and Disability
Taken from the Tennessee Consolidated Retirement System’s actuarial valuation report as of July 1, 2013. The rates of retirement, mortality, termination, and disability reflect an experience study conducted by the Tennessee Consolidated Retirement System (TCRS) for the period July 1, 2008 through June 30, 2012.
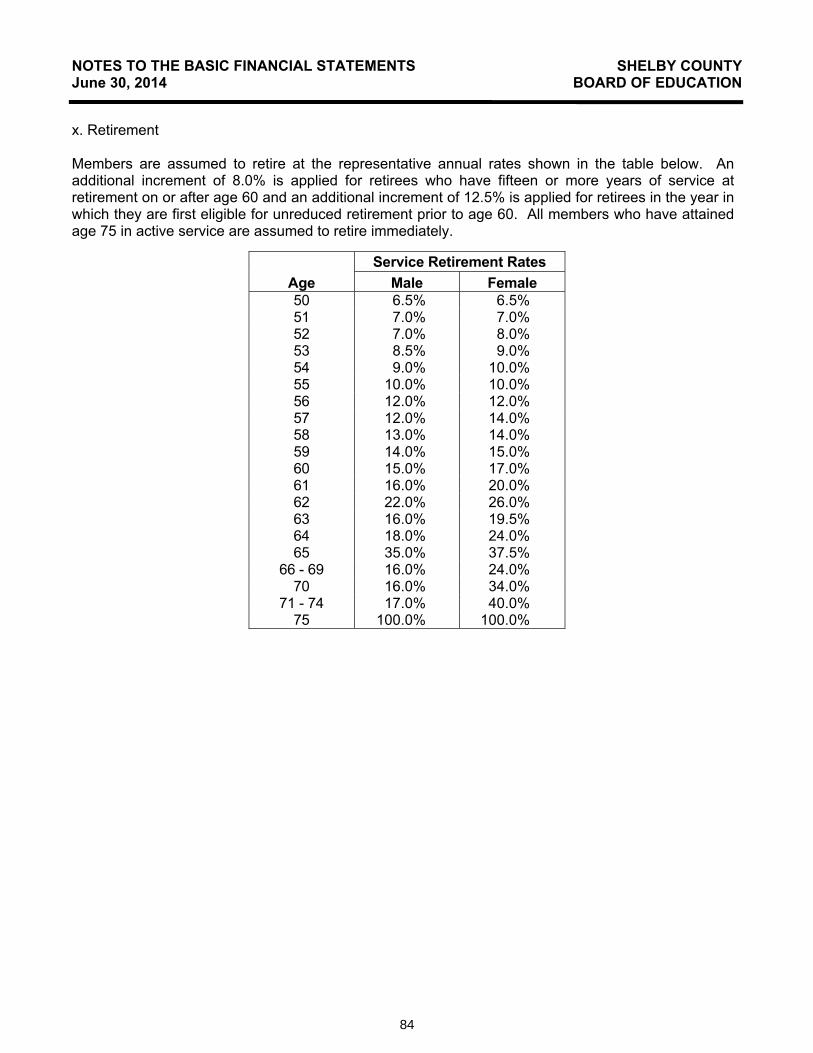
84
NOTES TO THE BASIC FINANCIAL STATEMENTS SHELBY COUNTY June 30, 2014 BOARD OF EDUCATION
x. Retirement
Members are assumed to retire at the representative annual rates shown in the table below. An additional increment of 8.0% is applied for retirees who have fifteen or more years of service at retirement on or after age 60 and an additional increment of 12.5% is applied for retirees in the year in which they are first eligible for unreduced retirement prior to age 60. All members who have attained age 75 in active service are assumed to retire immediately.
Age Service Retirement Rates
Male Female 50 6.5% 6.5% 51 7.0% 7.0% 52 7.0% 8.0% 53 8.5% 9.0% 54 9.0% 10.0% 55 10.0% 10.0% 56 12.0% 12.0% 57 12.0% 14.0% 58 13.0% 14.0% 59 14.0% 15.0% 60 15.0% 17.0% 61 16.0% 20.0% 62 22.0% 26.0% 63 16.0% 19.5% 64 18.0% 24.0% 65 35.0% 37.5%
66 - 69 16.0% 24.0% 70 16.0% 34.0%
71 - 74 17.0% 40.0% 75 100.0% 100.0%

85
NOTES TO THE BASIC FINANCIAL STATEMENTS SHELBY COUNTY June 30, 2014 BOARD OF EDUCATION
xi. Separations from Service
Representative values of the assumed rates of death, disability, and withdrawal are as follows:
Age
Annual Rate of
Death*
Disability
Withdrawal
Year 1 Year 2 Years 3+
Male Female Male Female 20 0.02% 0.01% 0.01% 18.00% 13.50% 10.00% 10.50% 25 0.03 0.01 0.01 18.00 13.50 8.50 10.00 30 0.04 0.02 0.01 18.00 13.50 6.00 7.60 35 0.07 0.04 0.03 18.00 13.50 3.60 4.60 40 0.09 0.05 0.08 18.00 13.50 2.00 2.30 45 0.11 0.07 0.14 18.40 13.50 1.50 1.10 50 0.13 0.11 0.17 19.70 14.20 2.00 1.60 55 0.18 0.20 0.17 22.10 16.80 3.10 3.80 60 0.32 0.34 0.00 25.50 21.60 4.70 5.00 65 0.52 0.51 0.00 28.00 23.50 0.00 0.00 70 0.66 0.66 0.00 28.00 23.50 0.00 0.00 75 1.69 1.45 0.00 28.00 23.50 0.00 0.00
*Pre-retirement mortality based upon the IRS 2012 Static Mortality Tables (male and female) for Non-Annuitants as provided for by the Pension Protection Act of 2008. This table is published by the IRS and includes projections of future mortality improvements for 15 years beyond the 2012 base year using Scale AA.

86
NOTES TO THE BASIC FINANCIAL STATEMENTS SHELBY COUNTY June 30, 2014 BOARD OF EDUCATION
xii. Deaths After Retirement
The mortality rates for non-disabled beneficiaries are the same as those used by TCRS, but with an additional 5 years of mortality improvements using the Society of Actuaries’ Scale AA. The mortality rates for disabled beneficiaries are the same as those used by TCRS and reflect the sex distinct table in IRS Revenue Ruling 96-7 for disabled lives, increased by 10%. Representative values of the assumed rates of beneficiary mortality are as follows:
Age
Annual Rate of Beneficiary Mortality Non-Disabled Disabled
Male Female Male Female 40 0.1% 0.1% 1.8% 1.4% 50 0.2 0.1 2.6 1.8 55 0.3 0.2 3.2 2.1 60 0.4 0.4 4.0 2.5 65 0.7 0.6 4.9 3.0 70 1.3 0.9 6.3 3.6 75 2.3 1.4 8.5 4.9 80 4.4 2.9 10.9 6.6 85 8.5 6.0 14.2 9.2 90 15.3 11.9 18.9 13.5 95 24.4 19.4 25.7 20.3
xiii. Eligibility and Benefits
At the time of retirement, participating employees of Shelby County Schools qualify for retiree health care benefits (including their spouses and current dependents) and life insurance coverage under the Plan if they have at least 15 years of service (5 years for Memphis City Schools Legacy employees hired prior to January 1, 2007 and 10 years of hired on or after January 1, 2007). Eligible participants are required to be receiving a benefit from the Tennessee Consolidated Retirement System.
Covered spouses and dependents qualify for health care benefits at the same contribution level as the member. Survivors qualify for health care benefits but must pay 100% of the premium.
Eligible retirees may continue life insurance coverage at no cost to the retiree. Coverage amount is the lesser of 50% of the active coverage amount or $50,000.
Pension plan specific eligibility and benefits are as follows:
Tennessee Consolidated Retirement System
Retirement: Employees who retire at age 55 with 5 years of credited service or at any age with 25 years of service will receive health care and life insurance benefits for life. Spouses of retirees may be covered at the retirees' option, provided the election is made on the date the employee leaves active service.
Termination: Current employees who terminate employment and are not eligible for a retirement or disability benefit are not eligible for health care or life insurance benefits at retirement. Some

87
NOTES TO THE BASIC FINANCIAL STATEMENTS SHELBY COUNTY June 30, 2014 BOARD OF EDUCATION
current deferred vested retirees were grandfathered and are receiving health care and life insurance benefits.
Disability: Employees who become disabled at any age with at least 5 years of service receive health care and life insurance benefits for life. Spouses of retirees may be covered at the retirees' option, provided the election is made on the date the employee leaves active service.
Death: Spouses of employees who die during active service and are not eligible for a retirement or disability benefit are not eligible for health care or life insurance benefits at retirement.
xiv. Affordable Care Act
The impact of the Affordable Care Act (ACA) was addressed in this valuation. Review of the information currently available did not identify any specific provisions of the ACA that are anticipated to significantly impact results. While the impact of certain provisions such as the excise tax on high-value health insurance plans beginning in 2018 (if applicable), mandated benefits and participation changes due to the individual mandate should be recognized in the determination of liabilities, overall future plan costs and the resulting liabilities are driven by amounts employers and retirees can afford (i.e., trend). The trend assumption forecasts the anticipated increase to initial per capita costs, taking into account health care cost inflation, increases in benefit utilization, plan changes, government-mandated benefits, and technological advances. Given the uncertainty regarding the ACA’s implementation (e.g., the impact of excise tax on high-value health insurance plans, changes in participation resulting from the implementation of state-based health insurance exchanges), continued monitoring of the ACA’s impact on the Plan’s liability will be required.
xv. Cost of Coverage
Monthly Health Care PremiumsThe following chart details the monthly health care premiums for retirees, spouses, and dependents as of January 1, 2014. Shelby County Schools subsidizes a portion of the full premium rates shown below. Retirees receive a subsidy in the amount of 75% of the HRA Plan premium rate for single coverage in the Cigna plans, and a total subsidy of 67% of the HRA Plan premium rate for Single + 1 and Family coverage. Legacy retirees of Shelby County Schools and their dependents receive a combined subsidy in the amount of 90% of the Medicare Supplement Plan rate. All other retirees and dependents receive a subsidy in the amount of 70% of the Medicare Supplement Plan rate. All surviving spouses are required to pay the full, applicable premium rate.
Medical Coverage Tier
Pre-Medicare Healthcare Plans OAP Plus OAP
BasicChoice
HRA Single $542.35 $514.08 $ 467.87
Single + One 1,084.69 1,028.15 935.74 Family 1,513.15 1,434.27 1,305.36
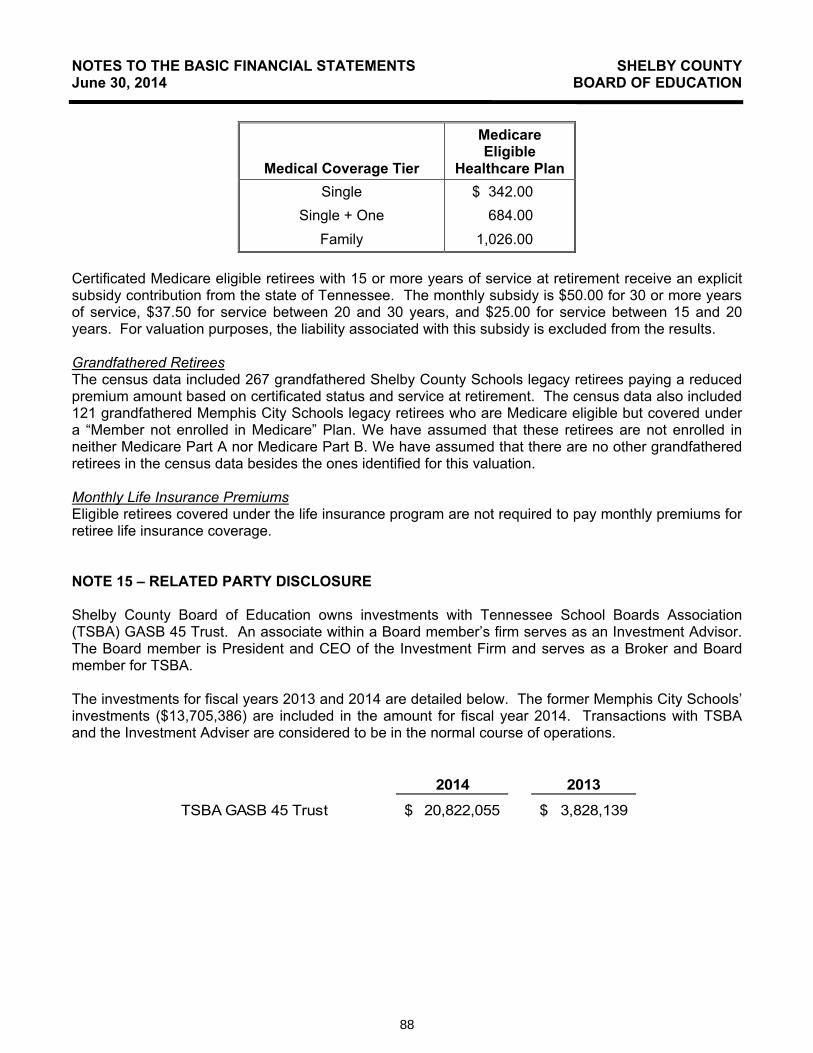
88
NOTES TO THE BASIC FINANCIAL STATEMENTS SHELBY COUNTY June 30, 2014 BOARD OF EDUCATION
Medical Coverage Tier
MedicareEligible
Healthcare Plan Single $ 342.00
Single + One 684.00 Family 1,026.00
Certificated Medicare eligible retirees with 15 or more years of service at retirement receive an explicit subsidy contribution from the state of Tennessee. The monthly subsidy is $50.00 for 30 or more years of service, $37.50 for service between 20 and 30 years, and $25.00 for service between 15 and 20 years. For valuation purposes, the liability associated with this subsidy is excluded from the results.
Grandfathered RetireesThe census data included 267 grandfathered Shelby County Schools legacy retirees paying a reduced premium amount based on certificated status and service at retirement. The census data also included 121 grandfathered Memphis City Schools legacy retirees who are Medicare eligible but covered under a “Member not enrolled in Medicare” Plan. We have assumed that these retirees are not enrolled in neither Medicare Part A nor Medicare Part B. We have assumed that there are no other grandfathered retirees in the census data besides the ones identified for this valuation.
Monthly Life Insurance PremiumsEligible retirees covered under the life insurance program are not required to pay monthly premiums for retiree life insurance coverage.
NOTE 15 – RELATED PARTY DISCLOSURE
Shelby County Board of Education owns investments with Tennessee School Boards Association (TSBA) GASB 45 Trust. An associate within a Board member’s firm serves as an Investment Advisor. The Board member is President and CEO of the Investment Firm and serves as a Broker and Board member for TSBA.
The investments for fiscal years 2013 and 2014 are detailed below. The former Memphis City Schools’ investments ($13,705,386) are included in the amount for fiscal year 2014. Transactions with TSBA and the Investment Adviser are considered to be in the normal course of operations.
2014 2013
TSBA GASB 45 Trust 20,822,055$ 3,828,139$
89
NOTES TO THE BASIC FINANCIAL STATEMENTS SHELBY COUNTY June 30, 2014 BOARD OF EDUCATION
NOTE 16 – DEFERRED INFLOWS OF RESOURCES
The former Memphis City Schools obtained a judgment in the amount of $57.4 million dollars from the City of Memphis in 2009. The judgment was affirmed by the Court of Appeals, but the Trial Court has withheld enforcement of the judgment pending resolution of a claim that the former Memphis City Schools owes the City approximately $160 million dollars. The Board believes the counterclaim has no merit. Since the Board has not received any money from the judgment against the City, the Board recorded $55.1 million dollars as deferred inflows at the fund level.

90
This page left intentionally blank

91
REQUIRED SUPPLEMENTARY INFORMATION
Required Supplementary Information

92
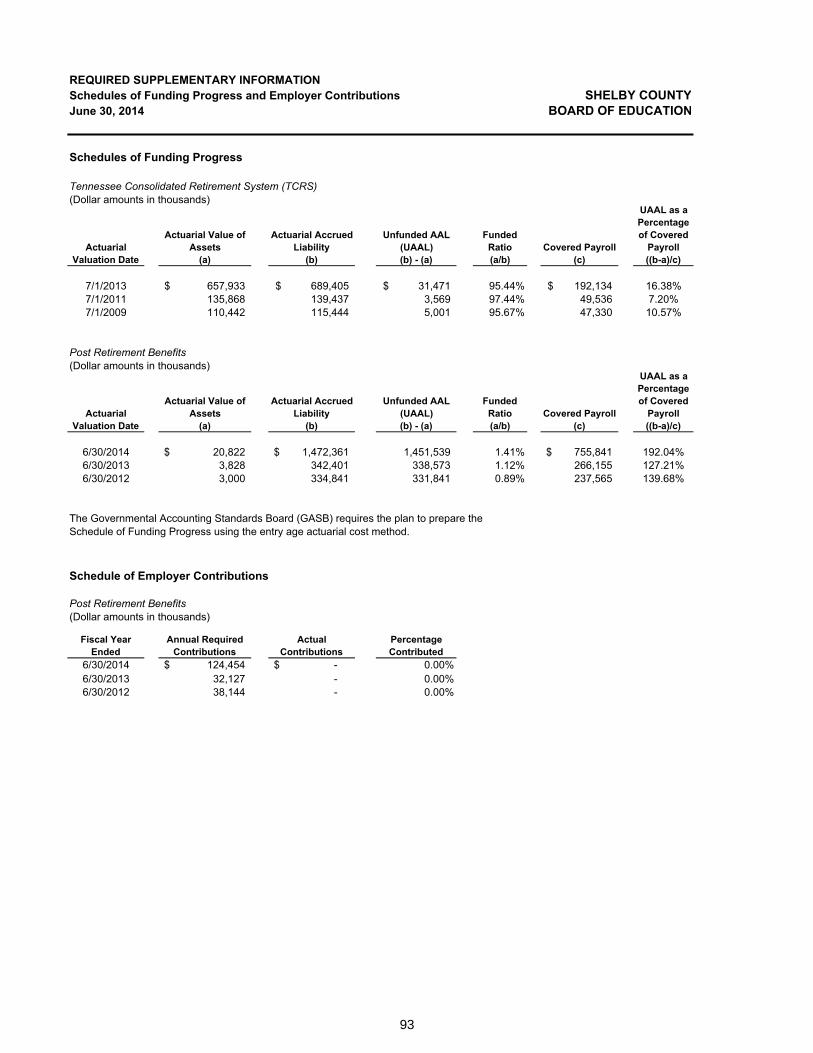
93
Schedules of Funding Progress and Employer Contributions
REQUIRED SUPPLEMENTARY INFORMATIONSchedules of Funding Progress and Employer Contributions SHELBY COUNTYJune 30, 2014 BOARD OF EDUCATION
Schedules of Funding Progress
Tennessee Consolidated Retirement System (TCRS)(Dollar amounts in thousands)
ActuarialValuation Date
Actuarial Value of Assets
(a)
Actuarial Accrued Liability
(b)
Unfunded AAL (UAAL)(b) - (a)
FundedRatio(a/b)
Covered Payroll(c)
UAAL as a Percentageof Covered
Payroll((b-a)/c)
7/1/2013 657,933$ 689,405$ 31,471$ 95.44% 192,134$ 16.38%7/1/2011 135,868 139,437 3,569 97.44% 49,536 7.20%7/1/2009 110,442 115,444 5,001 95.67% 47,330 10.57%
Post Retirement Benefits(Dollar amounts in thousands)
ActuarialValuation Date
Actuarial Value of Assets
(a)
Actuarial Accrued Liability
(b)
Unfunded AAL (UAAL)(b) - (a)
FundedRatio(a/b)
Covered Payroll(c)
UAAL as a Percentageof Covered
Payroll((b-a)/c)
6/30/2014 20,822$ 1,472,361$ 1,451,539 1.41% 755,841$ 192.04%6/30/2013 3,828 342,401 338,573 1.12% 266,155 127.21%6/30/2012 3,000 334,841 331,841 0.89% 237,565 139.68%
The Governmental Accounting Standards Board (GASB) requires the plan to prepare the Schedule of Funding Progress using the entry age actuarial cost method.
Schedule of Employer Contributions
Post Retirement Benefits(Dollar amounts in thousands)
Fiscal Year Ended
Annual Required Contributions
ActualContributions
PercentageContributed
6/30/2014 124,454$ -$ 0.00%6/30/2013 32,127 - 0.00%6/30/2012 38,144 - 0.00%

94
Schedule of Investment Returns
REQUIRED SUPPLEMENTARY INFORMATIONSchedule of Investment Returns Last 10 Fiscal Years SHELBY COUNTYJune 30, 2014 BOARD OF EDUCATION
Annual money-weighted rate of return, net of investment expense
2014
13.47%
The intent of this schedule is to fulfill the requirement to provide information for 10 years of historical data.However, until a full 10-year trend is compiled, the District is presenting information for the years available.

95
Schedule of Changes in Net Pension Liability and Related Ratios
REQUIRED SUPPLEMENTARY INFORMATIONSchedule of Changes in Net Pension Liability and Related Ratios SHELBY COUNTYJune 30, 2014 BOARD OF EDUCATION
2014Total pension liability Service cost -$Interest 92,830Benefit changes -Difference between expected and actual experience -Changes if assumptions -Benefit payments (311,149)Refunds of contributions -Net change in total pension liability (218,319)Total pension liability-beginning 2,120,510Total pension liability-ending 1,902,191$
Plan fiduciary net positionContributions - employer -$Contributions - member -Net investment income 235,750Benefit payments (311,149)Administrative expense (29,254)Refunds of contributions -Other -Net change in plan fiduciary net position (104,653)
Plan fiduciary net position - beginning 1,774,887Plan fiduciary net position - ending 1,670,234$
Net pension liability- ending 231,957$
Plan fiduciary net position as a percentage of the total pension liability 87.81%
Covered-employee payroll -
Net pension liability as a percentage of covered-employee payroll 0.00%
Notes to Schedule:Valuation DateJune 30, 2014
Methods and assumptions used to determine contribution rates: Actuarial cost method Entry Age Normal Actuarial Funding MethodInflation 3%Salary increases N/A Investment rate of Retirn 5%Municipal Bond Index Rate 4.35%Single Equivalent Interest Rate 4.72%
Mortality
The intent of this schedule is to fulfill the requirement to provide information for 10 years of historical data. However, until a full 10-year trend is compiled, the District is presenting information for the years available.
The RP-2000 Combined Mortality Table set forward three years for males and set forward one year for females and using a Scale AA projection to 2025 is used for the period after retirement and for dependent beneficiaries.

96
This page left intentionally blank

97
COMBINING AND INDIVIDUAL FUND STATEMENTS AND SCHEDULES
��������������� ���������������

98

99
Combining Balance Sheet - Nonmajor Governmental Funds
COMBINING BALANCE SHEETNONMAJOR GOVERNMENTAL FUNDS SHELBY COUNTY June 30, 2014 BOARD OF EDUCATION
SpecialRevenue Fund
Capital Projects Fund Food Service
TotalNon-Major
GovernmentalFunds
AssetsCash and cash equivalents 12,416,304$ 18,007,856$ 30,424,160$ Due from other governments - 1,789,752 1,789,752 Other receivables - 161,727 161,727 Inventories - 6,330,708 6,330,708
Total assets 12,416,304$ 26,290,043$ 38,706,347$
Liabilities and Fund BalancesLiabilitiesAccounts payable and other accrued liabilities 417,674 3,127,610 3,545,284 Unearned revenue - other - 105,927 105,927
Total liabilities 417,674 3,233,537 3,651,211
Fund balancesNonspendable - 6,330,708 6,330,708 Restricted 11,998,630 16,725,798 28,724,428
Total fund balances 11,998,630 23,056,506 35,055,136Total liabilities, deferred inflows of resources, and fund balances 12,416,304$ 26,290,043$ 38,706,347$
See independent auditor's report

100
Combining Statement of Revenues, Expenditures, and Changes in Fund Balances - Nonmajor Governmental Funds
See independent auditor's report
COMBINING STATEMENT OF REVENUES, EXPENDITURES,AND CHANGES IN FUND BALANCESNONMAJOR GOVERNMENTAL FUNDS SHELBY COUNTY For the year ended June 30, 2014 BOARD OF EDUCATION
Special Revenue Fund
Capital Projects Fund Food Service
Total Non-Major
GovernmentalFunds
RevenuesShelby County 5,373,607$ -$ 5,373,607$State of Tennessee - 699,148 699,148Federal Government - 57,701,661 57,701,661Other local sources 396,853 18,670,489 19,067,342
-Total revenues 5,770,460$ 77,071,298$ 82,841,758$
ExpendituresCurrent:
Food service - 76,501,371 76,501,371Capital outlay 11,195,512 - 11,195,512
Total expenditures 11,195,512 76,501,371 87,696,883
Excess (deficiency) of revenuesover expenditures (5,425,052) 569,927 (4,855,125)
Fund balance - July 1, 2013 17,423,682 22,486,579 39,910,261
Fund balance - June 30, 2014 11,998,630$ 23,056,506$ 35,055,136$
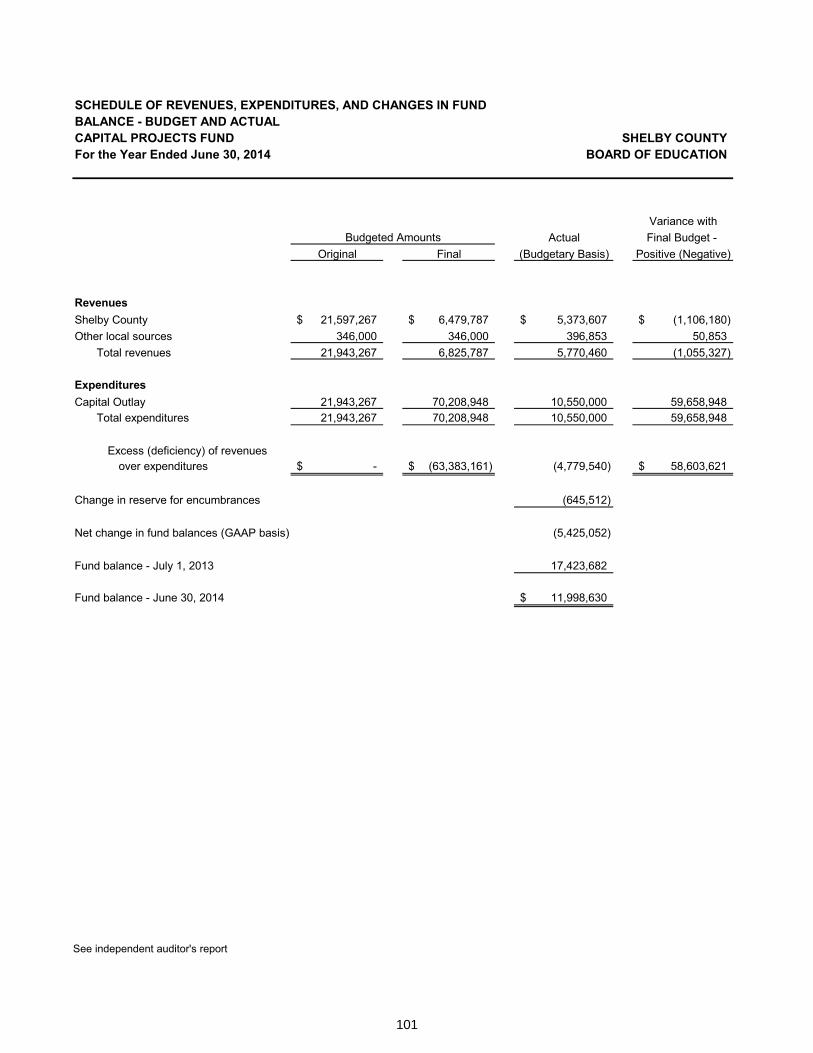
101
Schedule of Revenues, Expenditures, and Changes in Fund Balance – Budget and Actual – Capital Projects Fund
See independent auditor's report
SCHEDULE OF REVENUES, EXPENDITURES, AND CHANGES IN FUND BALANCE - BUDGET AND ACTUALCAPITAL PROJECTS FUND SHELBY COUNTY For the Year Ended June 30, 2014 BOARD OF EDUCATION
Variance withActual Final Budget -
Original Final (Budgetary Basis) Positive (Negative)
RevenuesShelby County 21,597,267$ 6,479,787$ 5,373,607$ (1,106,180)$Other local sources 346,000 346,000 396,853 50,853
Total revenues 21,943,267 6,825,787 5,770,460 (1,055,327)
ExpendituresCapital Outlay 21,943,267 70,208,948 10,550,000 59,658,948
Total expenditures 21,943,267 70,208,948 10,550,000 59,658,948
Excess (deficiency) of revenuesover expenditures -$ (63,383,161)$ (4,779,540) 58,603,621$
Change in reserve for encumbrances (645,512)
Net change in fund balances (GAAP basis) (5,425,052)
Fund balance - July 1, 2013 17,423,682
Fund balance - June 30, 2014 11,998,630$
Budgeted Amounts
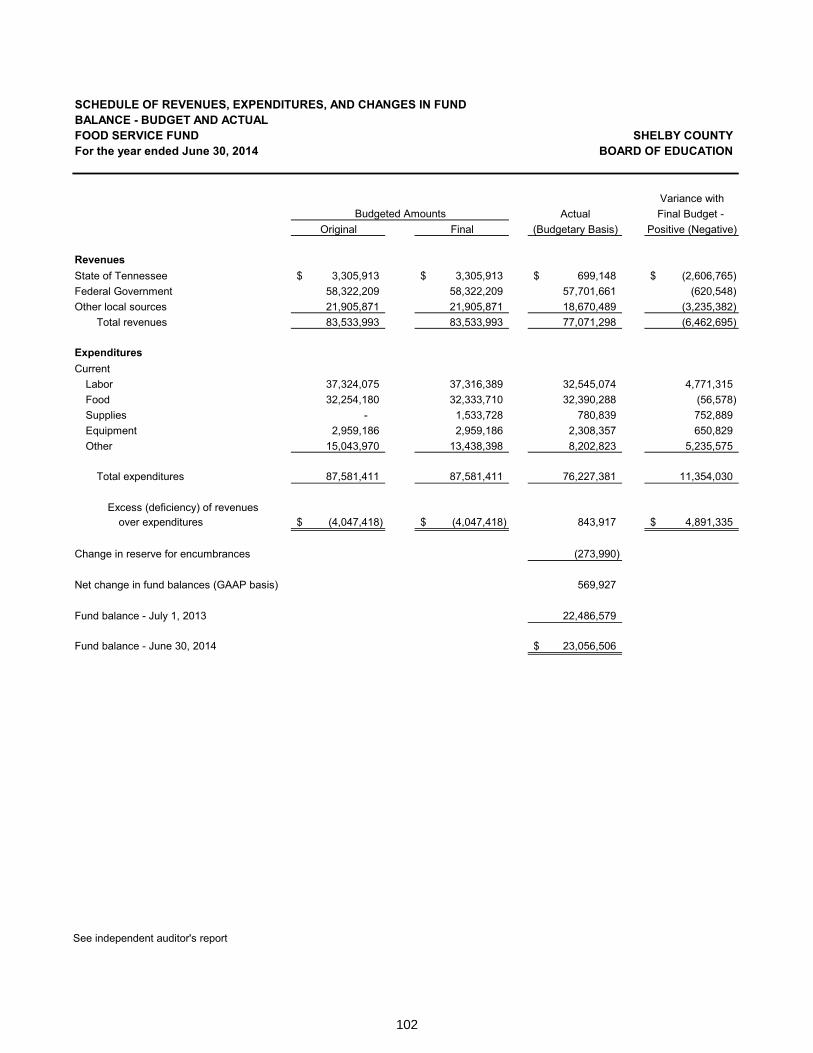
102
Schedule of Revenues, Expenditures and Changes in Fund Balance – Budget and Actual – Food Service Fund
See independent auditor's report
SCHEDULE OF REVENUES, EXPENDITURES, AND CHANGES IN FUND BALANCE - BUDGET AND ACTUALFOOD SERVICE FUND SHELBY COUNTY For the year ended June 30, 2014 BOARD OF EDUCATION
Variance withActual Final Budget -
Original Final (Budgetary Basis) Positive (Negative)
RevenuesState of Tennessee 3,305,913$ 3,305,913$ 699,148$ (2,606,765)$ Federal Government 58,322,209 58,322,209 57,701,661 (620,548) Other local sources 21,905,871 21,905,871 18,670,489 (3,235,382)
Total revenues 83,533,993 83,533,993 77,071,298 (6,462,695)
ExpendituresCurrent
Labor 37,324,075 37,316,389 32,545,074 4,771,315 Food 32,254,180 32,333,710 32,390,288 (56,578) Supplies - 1,533,728 780,839 752,889 Equipment 2,959,186 2,959,186 2,308,357 650,829 Other 15,043,970 13,438,398 8,202,823 5,235,575
Total expenditures 87,581,411 87,581,411 76,227,381 11,354,030
Excess (deficiency) of revenuesover expenditures (4,047,418)$ (4,047,418)$ 843,917 4,891,335$
Change in reserve for encumbrances (273,990)
Net change in fund balances (GAAP basis) 569,927
Fund balance - July 1, 2013 22,486,579
Fund balance - June 30, 2014 23,056,506$
Budgeted Amounts

103
��������������� ����� ����������������

104

105
Combining Statement of Net Position – Internal Service Funds
See independent auditor's report
COMBINING STATEMENT OF NET POSITIONINTERNAL SERVICE FUNDS SHELBY COUNTY June 30, 2014 BOARD OF EDUCATION
Group Supply AchievementInsurance Unemployment OPEB Printing Chain School District
Fund Fund Fund Fund Fund Fund Total
AssetsCurrent assets:
Cash and cash equivalents 32,849,262$ 3,955,734$ -$ 322,839$ 187,641$ -$ 37,315,476$Investments 300,000 - - - - - 300,000Due from general fund - - - - - - -Due to group insurance fund - - -Receivable from state - - - - - - -Receivable from other 1,006,864 - - - - 796,124 1,802,988Due from general fund 99,824 - 99,824Prepaid Items - - - - - - -
Total assets 34,156,126 3,955,734 - 322,839 287,465 796,124 39,518,288
LiabilitiesCurrent liabilities: Accounts payable and other accrued liabilities 112,634 165,969 - 19,804 45,653 - 344,060
Insurance claims and premiums payable 12,905,549 - - - - - 12,905,549Due to general fund - - - - 777,848 777,848Accrued vacation 3,926 268 - 11,415 40,146 - 55,755
Noncurrent liabilities: -Accrued vacation 9,613 4,447 - 26,045 40,146 - 80,251
Total liabilities 13,031,722 170,684 - 57,264 125,945 777,848 14,163,463
Net PositionUnrestricted 21,124,404$ 3,785,050$ -$ 265,575$ 161,520$ 18,276$ 25,354,825$

106
Combining Statement of Revenues, Expenses and Changes in Net Position – Internal Service Funds
See independent auditor's report
COMBINING STATEMENT OF REVENUES, EXPENSES AND CHANGES IN NET POSITIONINTERNAL SERVICE FUNDSFor the year ended June 30, 2014
GroupInsurance Unemployment OPEB
Fund Fund Fund
Operating revenuesCharges for services 424,113$ -$ -$Employee contributions 60,142,818 - 11,480,737Board contributions 67,064,862 4,821,779 44,041,140Medicare 1,545,800 - -Total operating revenues 129,177,593 4,821,779 55,521,877
Operating expensesPersonnel services 694,339 93,867 -Material and supplies - - -Claims incurred 110,733,264 5,660,262 28,052,557Life insurance premiums 3,176,064 - 1,440,974Health insurance premiums - - 9,963,699Administrative expenses 4,844,893 - 16,064,647Total operating expenses 119,448,560 5,754,129 55,521,877
Operating income (loss) 9,729,033 (932,350) -
Nonoperating revenues (expenses)Interest income 37,134 5,304 -
Change in net position 9,766,167 (927,046) -
Net positionJuly 1, 2013 11,358,237 4,712,096 -
June 30, 2014 21,124,404$ 3,785,050$ -$

107
SHELBY COUNTY BOARD OF EDUCATION
Supply AchievementPrinting Chain District
Fund Fund Fund Total
576,615$ 2,389,877$ 2,463,570$ 5,854,175$- - - 71,623,555- - - 115,927,781- - - 1,545,800
576,615 2,389,877 2,463,570 194,951,311
541,252 1,310,848 800,789 3,441,095147,190 651,984 469,591 1,268,765
- - - 144,446,083- - - 4,617,038- - - 9,963,699
16,545 426,750 1,174,914 22,527,749704,987 2,389,582 2,445,294 186,264,429
(128,372) 295 18,276 8,686,882
386 185 - 43,009
(127,986) 480 18,276 8,729,891
393,561 161,040 - 16,624,934
265,575$ 161,520$ 18,276$ 25,354,825$

108
Combining Statement of Cash Flows – Nonmajor and Internal Service Funds
See independent auditor's report
COMBINING STATEMENT OF CASH FLOWSINTERNAL SERVICE FUNDSFor the year ended June 30, 2014
GroupInsurance Unemployment
Fund Fund
Cash Flows From Operating ActivitiesReceipts for interfund services provided 71,218,902$ 4,821,779$ Receipts from employees 60,142,818 - Payments to suppliers - - Payments to employees for salaries and benefits (690,438) (98,582) Payments to other division funds - - Payments for life insurance premiums (3,176,064) - Payments for health insurance premiums - - Payments for insurance and unemployment claims (126,457,786) (5,512,453) Net cash provided (used) by operating activities 1,037,432 (789,256)
Cash Flows From Investing ActivitiesPurchase of investments (300,000) - Interest received 37,134 5,304 Net cash provided (used) by investing activities (262,866) 5,304
Net Increase (Decrease) in cash and cash equivalents 774,566 (783,952)
Cash and cash equivalents at beginning of year 32,074,696 4,739,686
Cash and cash equivalents at end of year 32,849,262$ 3,955,734$
Reconciliation of operating income (loss) to net cashprovided (used) by operating activities:
Operating gain (loss) 9,729,033$ (932,350)$ Adjustments to reconcile operating gain (loss) to net cash
provided (used) by operating activities:Changes in assets and liabilities:
Receivables 2,184,127 - Accrued liabilities (10,875,728) 143,094
Net cash provided (used) by operating activities 1,037,432$ (789,256)$

109
SHELBY COUNTY BOARD OF EDUCATION
Supply AchievementOPEB Printing Chain DistrictFund Fund Fund Fund Total
44,041,140$ 576,615$ 2,290,053$ 1,667,446$ 124,615,935$ 11,480,737 - - - 71,623,555
- (172,492) (1,078,734) (469,591) (1,720,817) - (540,509) (1,228,150) (800,789) (3,358,468) - - - (397,066) (397,066)
(1,440,974) - - - (4,617,038) (9,963,699) - - - (9,963,699)
(44,117,204) - - - (176,087,443) - (136,386) (16,831) - 94,959
- - - - (300,000) - 386 185 - 43,009 - 386 185 - (256,991)
- (136,000) (16,646) - (162,032)
- 458,839 204,287 - 37,477,508
-$ 322,839$ 187,641$ -$ 37,315,476$
-$ (128,372)$ 295$ 18,276$ 8,686,882$
- - (99,824) (796,124) 1,288,179 - (8,014) 82,698 777,848 (9,880,102) -$ (136,386)$ (16,831)$ -$ 94,959$

110
This page left intentionally blank

111
Other Supplementary Statements and Schedules

112
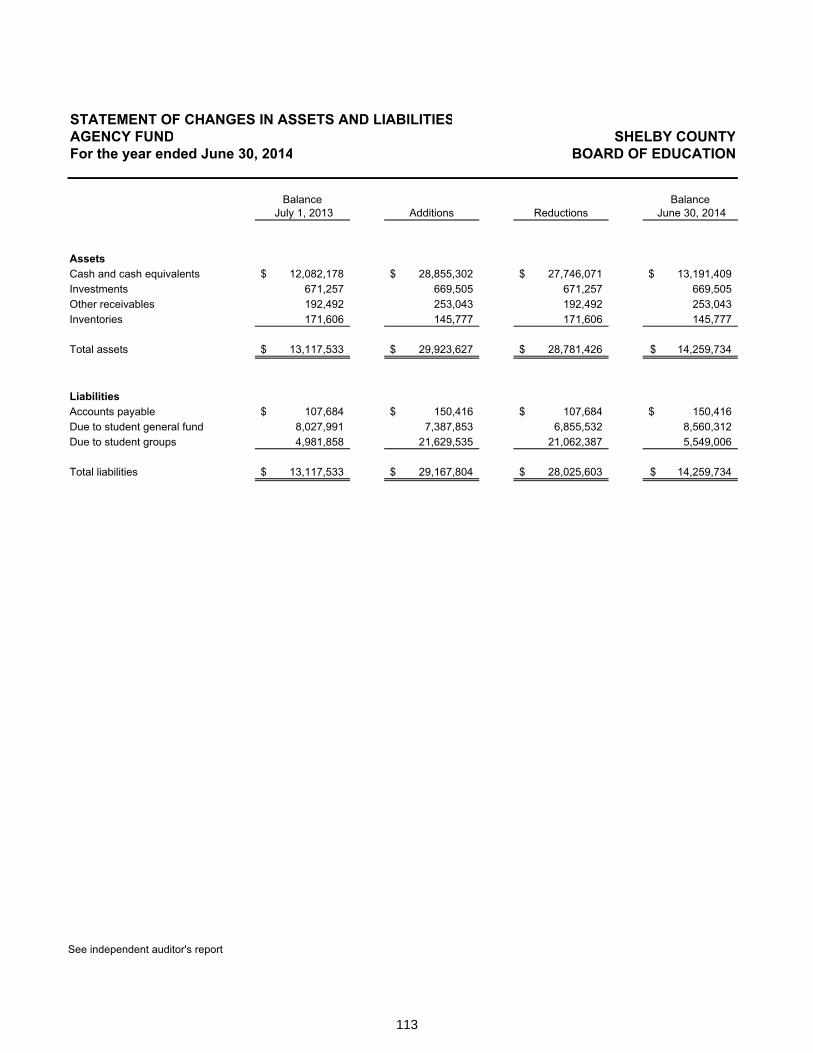
113
Statement of Changes in Assets and Liabilities – Agency Fund
STATEMENT OF CHANGES IN ASSETS AND LIABILITIESAGENCY FUND SHELBY COUNTYFor the year ended June 30, 2014 BOARD OF EDUCATION
Balance July 1, 2013 Additions Reductions
Balance June 30, 2014
AssetsCash and cash equivalents 12,082,178$ 28,855,302$ 27,746,071$ 13,191,409$ Investments 671,257 669,505 671,257 669,505 Other receivables 192,492 253,043 192,492 253,043 Inventories 171,606 145,777 171,606 145,777
Total assets 13,117,533$ 29,923,627$ 28,781,426$ 14,259,734$
LiabilitiesAccounts payable 107,684$ 150,416$ 107,684$ 150,416$ Due to student general fund 8,027,991 7,387,853 6,855,532 8,560,312 Due to student groups 4,981,858 21,629,535 21,062,387 5,549,006
Total liabilities 13,117,533$ 29,167,804$ 28,025,603$ 14,259,734$
See independent auditor's report
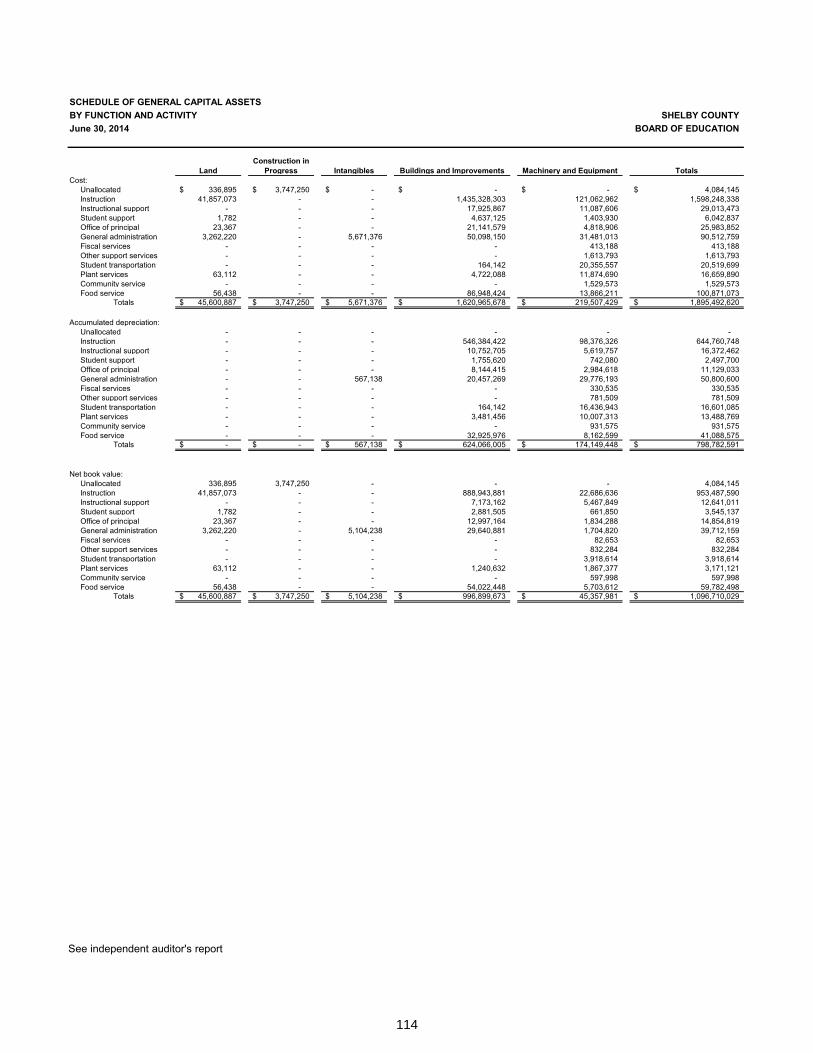
114
Capital Assets InformationSchedule of General Capital Assets by Function and Activity
See independent auditor's report
SCHEDULE OF GENERAL CAPITAL ASSETSBY FUNCTION AND ACTIVITY SHELBY COUNTY June 30, 2014 BOARD OF EDUCATION
LandConstruction in
Progress Intangibles Buildings and Improvements Machinery and Equipment TotalsCost:
Unallocated 336,895$ 3,747,250$ -$ -$ -$ 4,084,145$Instruction 41,857,073 - - 1,435,328,303 121,062,962 1,598,248,338Instructional support - - - 17,925,867 11,087,606 29,013,473Student support 1,782 - - 4,637,125 1,403,930 6,042,837Office of principal 23,367 - - 21,141,579 4,818,906 25,983,852General administration 3,262,220 - 5,671,376 50,098,150 31,481,013 90,512,759Fiscal services - - - - 413,188 413,188Other support services - - - - 1,613,793 1,613,793Student transportation - - - 164,142 20,355,557 20,519,699Plant services 63,112 - - 4,722,088 11,874,690 16,659,890Community service - - - - 1,529,573 1,529,573Food service 56,438 - - 86,948,424 13,866,211 100,871,073
Totals 45,600,887$ 3,747,250$ 5,671,376$ 1,620,965,678$ 219,507,429$ 1,895,492,620$
Accumulated depreciation:Unallocated - - - - - -Instruction - - - 546,384,422 98,376,326 644,760,748Instructional support - - - 10,752,705 5,619,757 16,372,462Student support - - - 1,755,620 742,080 2,497,700Office of principal - - - 8,144,415 2,984,618 11,129,033General administration - - 567,138 20,457,269 29,776,193 50,800,600Fiscal services - - - - 330,535 330,535Other support services - - - - 781,509 781,509Student transportation - - - 164,142 16,436,943 16,601,085Plant services - - - 3,481,456 10,007,313 13,488,769Community service - - - - 931,575 931,575Food service - - - 32,925,976 8,162,599 41,088,575
Totals -$ -$ 567,138$ 624,066,005$ 174,149,448$ 798,782,591$
Net book value:Unallocated 336,895 3,747,250 - - - 4,084,145Instruction 41,857,073 - - 888,943,881 22,686,636 953,487,590Instructional support - - - 7,173,162 5,467,849 12,641,011Student support 1,782 - - 2,881,505 661,850 3,545,137Office of principal 23,367 - - 12,997,164 1,834,288 14,854,819General administration 3,262,220 - 5,104,238 29,640,881 1,704,820 39,712,159Fiscal services - - - - 82,653 82,653Other support services - - - - 832,284 832,284Student transportation - - - - 3,918,614 3,918,614Plant services 63,112 - - 1,240,632 1,867,377 3,171,121Community service - - - - 597,998 597,998Food service 56,438 - - 54,022,448 5,703,612 59,782,498
Totals 45,600,887$ 3,747,250$ 5,104,238$ 996,899,673$ 45,357,981$ 1,096,710,029$

115
This page left intentionally blank

116
Schedule of Changes in General Capital Assets by Function and Activity
SCHEDULE OF CHANGES IN GENERAL CAPITAL ASSETSBY FUNCTION AND ACTIVITYFor the year ended June 30, 2014
FunctionBalance
July 1, 2013 Reclassifications AdditionsDisposals and Adjustments
BalanceJune 30, 2014
UnallocatedLand 449,385$ -$ -$ (112,490)$ 336,895$ Construction in Progress 11,540,566 (14,372,779) 6,579,463 - 3,747,250
Totals 11,989,951 (14,372,779) 6,579,463 (112,490) 4,084,145
InstructionLand 53,669,576 - - (11,812,501) 41,857,075 Buildings and Improvements 1,714,127,130 7,907,974 - (286,712,594) 1,435,322,510 Machinery and Equipment 134,145,633 - 1,089,884 (14,172,554) 121,062,963
Totals 1,901,942,339 7,907,974 1,089,884 (312,697,649) 1,598,242,548
Instructional supportBuildings and Improvements 17,925,867 - - - 17,925,867 Machinery and Equipment 12,427,486 - - (1,339,880) 11,087,606
Totals 30,353,353 - - (1,339,880) 29,013,473
Student supportLand 29,776 - - (27,994) 1,782 Buildings and Improvements 5,821,747 27,078 - (1,211,699) 4,637,126 Machinery and Equipment 3,009,760 - - (1,605,831) 1,403,929
Totals 8,861,283 27,078 - (2,845,524) 6,042,837
Office of principalLand 220,778 - - (197,411) 23,367 Buildings and Improvements 25,312,811 115,747 - (4,286,979) 21,141,579 Machinery and Equipment 5,938,963 - - (1,120,057) 4,818,906
Totals 31,472,552 115,747 - (5,604,447) 25,983,852
General administrationLand 3,262,220 - - - 3,262,220 Buildings and Improvements 50,149,834 - 69,850 (115,742) 50,103,942 Machinery and Equipment 33,005,173 - 10,754 (1,534,914) 31,481,013 Intangible Assets - 5,671,376 - - 5,671,376
Totals 86,417,227 5,671,376 80,604 (1,650,656) 90,518,551
Fiscal servicesMachinery and Equipment 498,545 - - (85,357) 413,188
Totals 498,545 - - (85,357) 413,188
Other support servicesMachinery and Equipment 1,988,725 - - (374,932) 1,613,793
Totals 1,988,725 - - (374,932) 1,613,793
Student transportationBuildings and Improvements 164,142 - - - 164,142 Machinery and Equipment 22,101,242 - - (1,745,685) 20,355,557
Totals 22,265,384 - - (1,745,685) 20,519,699
Plant servicesLand 63,112 - - - 63,112 Buildings and Improvements 4,722,088 - - - 4,722,088 Machinery and Equipment 13,256,598 - 390,490 (1,772,399) 11,874,689
Totals 18,041,798 - 390,490 (1,772,399) 16,659,889
Community serviceMachinery and Equipment 1,743,565 - - (213,992) 1,529,573
Totals 1,743,565 - - (213,992) 1,529,573
Food serviceLand 688,482 - - (632,045) 56,437 Buildings and Improvements 104,228,602 650,604 - (17,930,782) 86,948,424 Machinery and Equipment 16,719,593 - 600,361 (3,453,743) 13,866,211
Totals 121,636,677 650,604 600,361 (22,016,570) 100,871,072
Grand TotalsLand 58,383,329$ -$ -$ (12,782,441)$ 45,600,888$ Construction in progress 11,540,566 (14,372,779) 6,579,463 - 3,747,250 Buildings and Improvements 1,922,452,221 8,701,403 69,850 (310,257,796) 1,620,965,678 Machinery and Equipment 244,835,283 - 2,091,489 (27,419,344) 219,507,428 Intangible Assets - 5,671,376 - - 5,671,376
Totals 2,237,211,399$ -$ 8,740,802$ (350,459,581)$ 1,895,492,620$
See independent auditor's report

117
SHELBY COUNTY BOARD OF EDUCATION
BalanceJuly 1, 2013 Reclassifications Additions
Disposals and Adjustments
BalanceJune 30, 2014
Net book valueJune 30, 2014
-$ -$ -$ -$ -$ 336,895$ - - - - - 3,747,250 - - - - - 4,084,145
- - - - - 41,857,075 595,750,313 - 44,333,966 (93,699,857) 546,384,422 888,938,088
98,377,894 - 8,957,054 (8,958,623) 98,376,325 22,686,638 694,128,207 - 53,291,020 (102,658,480) 644,760,747 953,481,801
9,853,300 - 899,405 - 10,752,705 7,173,162 4,262,661 - 2,017,067 (659,971) 5,619,757 5,467,849
14,115,961 - 2,916,472 (659,971) 16,372,462 12,641,011
- - - - - 1,782 1,969,384 - 157,988 (371,752) 1,755,620 2,881,506 1,271,862 - 242,482 (772,264) 742,080 661,849 3,241,246 - 400,470 (1,144,016) 2,497,700 3,545,137
- - - - - 23,367 8,880,354 - 660,102 (1,396,041) 8,144,415 12,997,164 2,525,554 - 959,760 (500,696) 2,984,618 1,834,288
11,405,908 - 1,619,862 (1,896,737) 11,129,033 14,854,819
- - - - - 3,262,220 19,144,090 - 1,353,568 (40,389) 20,457,269 29,646,673 30,640,295 - 611,705 (1,475,807) 29,776,193 1,704,820
- - 567,138 - 567,138 5,104,238 49,784,385 - 2,532,411 (1,516,196) 50,800,600 39,717,951
299,831 - 84,769 (54,065) 330,535 82,653 299,831 - 84,769 (54,065) 330,535 82,653
719,069 - 289,364 (226,924) 781,509 832,284 719,069 - 289,364 (226,924) 781,509 832,284
164,142 - - - 164,142 - 16,196,061 - 1,643,784 (1,402,902) 16,436,943 3,918,614 16,360,203 - 1,643,784 (1,402,902) 16,601,085 3,918,614
- - - - - 63,112 3,364,527 - 116,929 - 3,481,456 1,240,632 9,884,353 - 1,419,824 (1,296,864) 10,007,313 1,867,376
13,248,880 - 1,536,753 (1,296,864) 13,488,769 3,171,120
736,377 - 286,617 (91,419) 931,575 597,998 736,377 - 286,617 (91,419) 931,575 597,998
- - - - - 56,437 36,083,897 - 2,701,802 (5,859,723) 32,925,976 54,022,448
9,113,008 - 1,086,167 (2,036,576) 8,162,599 5,703,612 45,196,905 - 3,787,969 (7,896,299) 41,088,575 59,782,497
-$ -$ -$ -$ -$ 45,600,888$ - - - - - 3,747,250
675,210,007 - 50,223,760 (101,367,762) 624,066,005 996,899,673 174,026,966 - 17,598,593 (17,476,111) 174,149,448 45,357,980
- - 567,138 - 567,138 5,104,238 849,236,973$ -$ 68,389,491$ (118,843,873)$ 798,782,591$ 1,096,710,029$
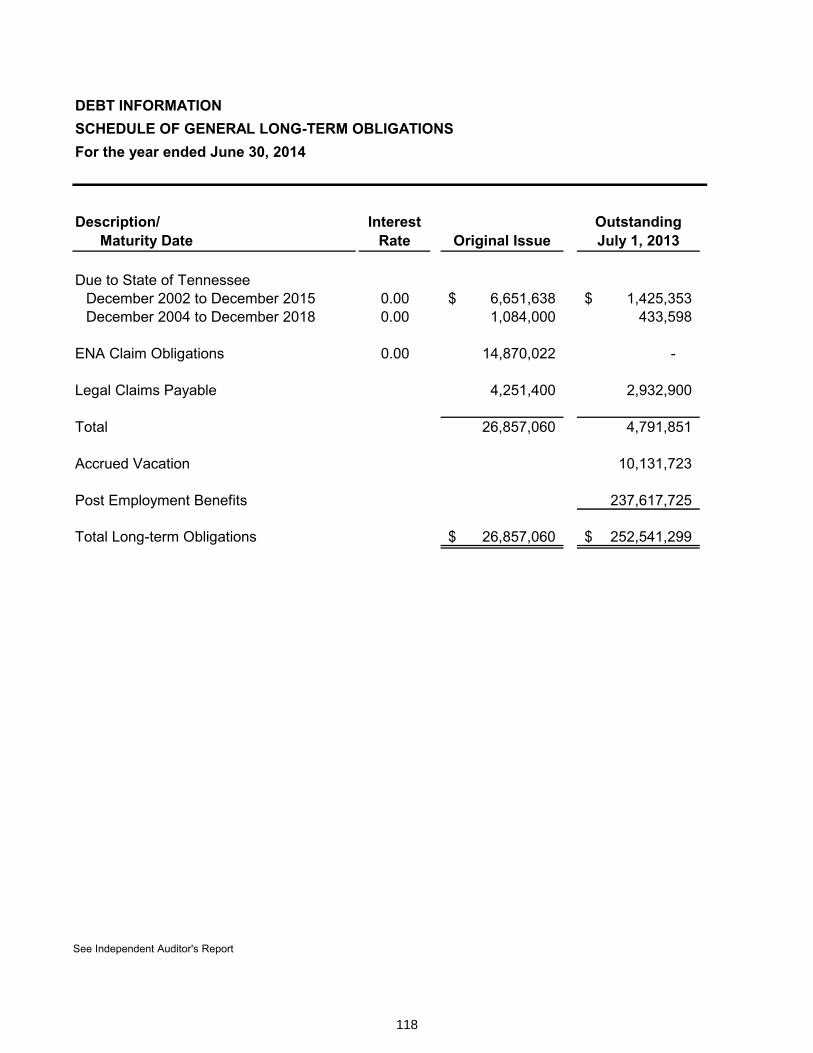
118
Debt InformationSchedule of General Long-Term Obligations
See Independent Auditor's Report
DEBT INFORMATIONSCHEDULE OF GENERAL LONG-TERM OBLIGATIONSFor the year ended June 30, 2014
Description/ Maturity Date
Interest Rate Original Issue
Outstanding July 1, 2013
Due to State of TennesseeDecember 2002 to December 2015 0.00 6,651,638$ 1,425,353$December 2004 to December 2018 0.00 1,084,000 433,598
ENA Claim Obligations 0.00 14,870,022 -
Legal Claims Payable 4,251,400 2,932,900
Total 26,857,060 4,791,851
Accrued Vacation 10,131,723
Post Employment Benefits 237,617,725
Total Long-term Obligations 26,857,060$ 252,541,299$
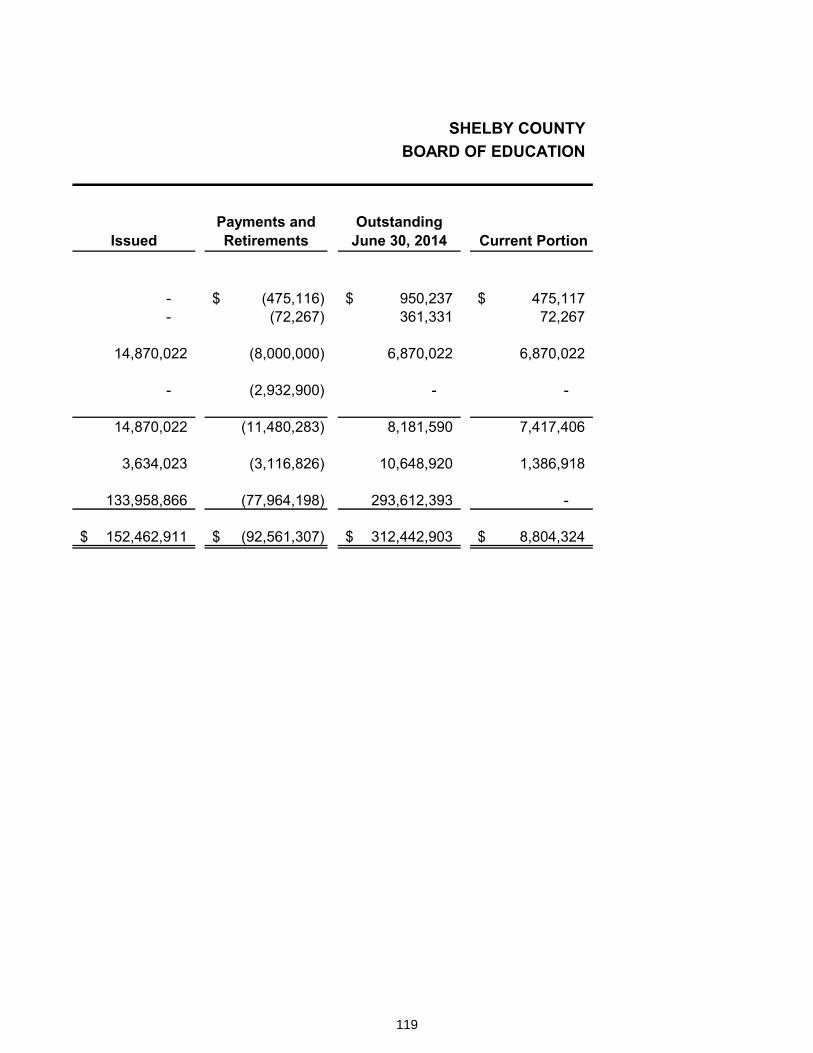
119
SHELBY COUNTY BOARD OF EDUCATION
IssuedPayments and Retirements
Outstanding June 30, 2014 Current Portion
- (475,116)$ 950,237$ 475,117$- (72,267) 361,331 72,267
14,870,022 (8,000,000) 6,870,022 6,870,022
- (2,932,900) - -
14,870,022 (11,480,283) 8,181,590 7,417,406
3,634,023 (3,116,826) 10,648,920 1,386,918
133,958,866 (77,964,198) 293,612,393 -
152,462,911$ (92,561,307)$ 312,442,903$ 8,804,324$

120
Schedule of General Long-Term Obligations Principal and Interest Requirements
DEBT INFORMATIONSCHEDULE OF GENERAL LONG-TERM OBLIGATIONSPRINCIPAL AND INTEREST REQUIREMENTS SHELBY COUNTY
BOARD OF EDUCATION
Year Ending ENA Claims Due to StateJune 30, Obligation of Tennessee Total
Principal:2015 6,870,022$ 547,384$ 7,417,406$2016 - 547,384 547,3842017 - 72,267 72,2672018 - 72,267 72,2672019 - 72,266 72,266
Total 6,870,022$ 1,311,568$ 8,181,590$
Note: Debt detailed in the above schedule is from Qualified Zone Academy Bonds (QZAB) that are interest free. There are administrative fees other than interest associated with QZAB bonds. All administrative fees for Qualified School Contruction Bonds (QSCB) and QZAB Bonds are included in interest and fees expenditures in the general fund. Shelby County Government is liable for the QSCB debt.
June 30, 2014
See independent auditor's report.

121
STATISTICAL SECTION (Unaudited)
Statistical Section (unaudited)

122
123
Overview STATISTICAL AND OTHER INFORMATION (UNAUDITED) OVERVIEW SHELBY COUNTY Year Ended June 30, 2014 BOARD OF EDUCATION
This part of the Shelby County Schools Comprehensive Annual Financial Report presents detailed information as a context for understanding what the information in the financial statements, note disclosures, and required supplementary information says about the School District’s overall financial health.
As stated in the Board’s 2013 subsequent events note, the merger with Memphis City Schools was effective at the beginning of the 2013-2014 school year. Thus, the assets and obligations of the former Memphis City Schools were transferred to Shelby County Board of Education and are included in the amounts reported for 2014. The amounts reported for 2013 and prior years are only those of Shelby County Board of Education.
Contents
Financial Trends These schedules contain trend information to help the reader understand how the School District’s financial performance has changed over time. Due to the merger in 2013, there is a disparity in year over year comparisons.
Revenue Capacity These schedules contain information to help the reader assess the factors affecting the School District’s ability to generate revenues through property taxes levied by other governmental agencies.
Debt Capacity These schedules present information to help the reader assess the affordability of the School District’s current levels of outstanding debt and the School District’s ability to issue additional debt in the future.
The School District does not have taxing authority and does not have a legal debt margin. Accordingly, schedules regarding legal debt margin and overlapping debt are not applicable. In addition, the School District does not have any pledged revenue.
Demographic and Economic Information These schedules offer demographic and economic indicators to help the reader understand the environment within which the School District’s financial activities take place and to help make comparisons over time and with other governments.
Operating Information These schedules contain information about the School District’s operations and resources to help the reader understand how the School District’s financial information relates to the services the School District provides and the activities it performs.
Sources
Unless otherwise noted, the information in these schedules is derived from the annual financial reports for the relevant year.

124
This page left intentionally blank

125
Financial Trends
Financial Trends

126
Net Position by Component
Source: Shelby County Schools Financial Statements
STATISTICAL AND OTHER INFORMATION (UNAUDITED)FINANCIAL TRENDSNet Position by ComponentAs of June 30
Net Position 2014 2013 2012 2011Net investment in capital assets 1,095,398,461$ 395,800,108$ 401,963,845$ 391,964,327$ Restricted for:
Capital projects 11,998,630 105,723 710,469 2,987,803 Insurance Claims - 2,254,559 3,976,350 9,886,051 Student Activities - - 6,344,750 5,954,246 Contracted grant programs 3,075,832 - - - Food service 23,056,506 3,888,773 3,710,791 3,117,887 Education 28,469,654 11,072,259 10,793,684 11,018,457
Unrestricted (33,468,688) (225,599,235) (187,003,125) (145,756,475) 1,128,530,395$ 187,522,187$ 240,496,764$ 279,172,296$
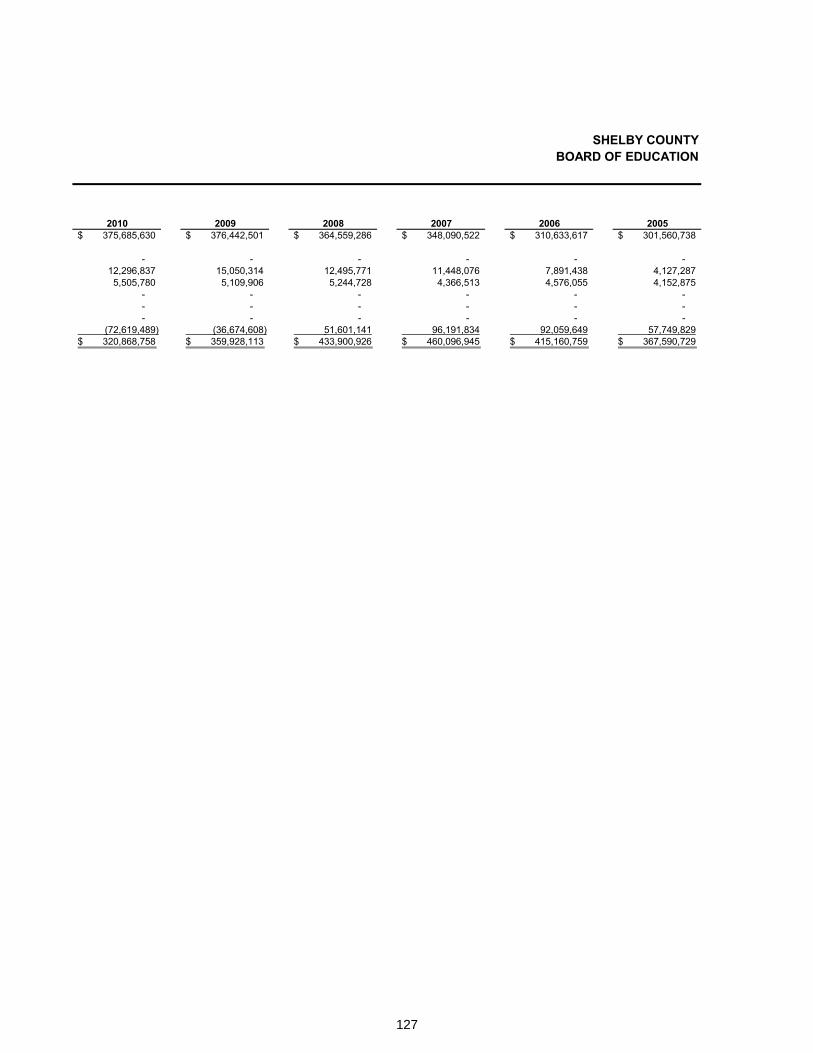
127
SHELBY COUNTYBOARD OF EDUCATION
2010 2009 2008 2007 2006 2005375,685,630$ 376,442,501$ 364,559,286$ 348,090,522$ 310,633,617$ 301,560,738$
- - - - - - 12,296,837 15,050,314 12,495,771 11,448,076 7,891,438 4,127,287 5,505,780 5,109,906 5,244,728 4,366,513 4,576,055 4,152,875
- - - - - - - - - - - - - - - - - -
(72,619,489) (36,674,608) 51,601,141 96,191,834 92,059,649 57,749,829 320,868,758$ 359,928,113$ 433,900,926$ 460,096,945$ 415,160,759$ 367,590,729$
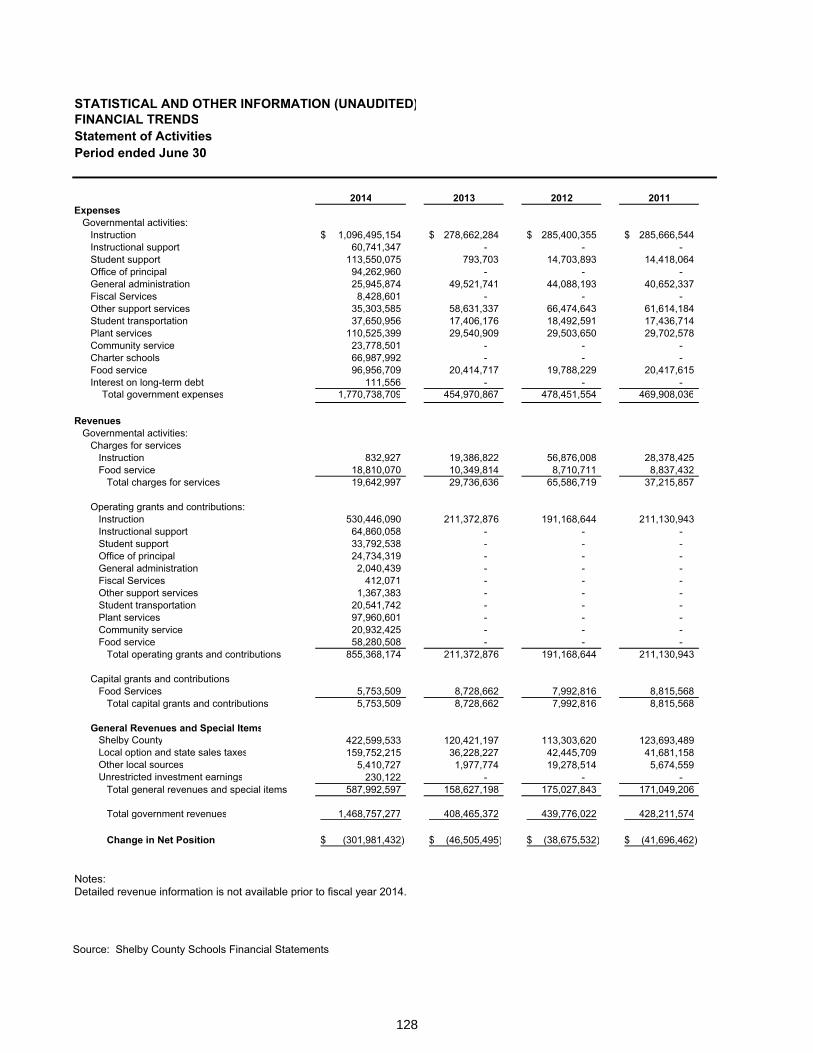
128
Statement of Activities
STATISTICAL AND OTHER INFORMATION (UNAUDITED)FINANCIAL TRENDSStatement of ActivitiesPeriod ended June 30
2014 2013 2012 2011Expenses
Governmental activities:Instruction 1,096,495,154$ 278,662,284$ 285,400,355$ 285,666,544$ Instructional support 60,741,347 - - - Student support 113,550,075 793,703 14,703,893 14,418,064 Office of principal 94,262,960 - - - General administration 25,945,874 49,521,741 44,088,193 40,652,337 Fiscal Services 8,428,601 - - - Other support services 35,303,585 58,631,337 66,474,643 61,614,184 Student transportation 37,650,956 17,406,176 18,492,591 17,436,714 Plant services 110,525,399 29,540,909 29,503,650 29,702,578 Community service 23,778,501 - - - Charter schools 66,987,992 - - - Food service 96,956,709 20,414,717 19,788,229 20,417,615 Interest on long-term debt 111,556 - - -
Total government expenses 1,770,738,709 454,970,867 478,451,554 469,908,036
RevenuesGovernmental activities:
Charges for servicesInstruction 832,927 19,386,822 56,876,008 28,378,425 Food service 18,810,070 10,349,814 8,710,711 8,837,432
Total charges for services 19,642,997 29,736,636 65,586,719 37,215,857
Operating grants and contributions:Instruction 530,446,090 211,372,876 191,168,644 211,130,943 Instructional support 64,860,058 - - - Student support 33,792,538 - - - Office of principal 24,734,319 - - - General administration 2,040,439 - - - Fiscal Services 412,071 - - - Other support services 1,367,383 - - - Student transportation 20,541,742 - - - Plant services 97,960,601 - - - Community service 20,932,425 - - - Food service 58,280,508 - - -
Total operating grants and contributions 855,368,174 211,372,876 191,168,644 211,130,943
Capital grants and contributionsFood Services 5,753,509 8,728,662 7,992,816 8,815,568
Total capital grants and contributions 5,753,509 8,728,662 7,992,816 8,815,568
General Revenues and Special ItemsShelby County 422,599,533 120,421,197 113,303,620 123,693,489 Local option and state sales taxes 159,752,215 36,228,227 42,445,709 41,681,158 Other local sources 5,410,727 1,977,774 19,278,514 5,674,559 Unrestricted investment earnings 230,122 - - -
Total general revenues and special items 587,992,597 158,627,198 175,027,843 171,049,206
Total government revenues 1,468,757,277 408,465,372 439,776,022 428,211,574
Change in Net Position (301,981,432)$ (46,505,495)$ (38,675,532)$ (41,696,462)$
Notes:Detailed revenue information is not available prior to fiscal year 2014.
Source: Shelby County Schools Financial Statements

129
SHELBY COUNTYBOARD OF EDUCATION
2010 2009 2008 2007 2006 2005
281,573,590$ 297,446,055$ 258,245,547$ 198,812,517$ 194,215,582$ 207,130,912$ - - - - - -
13,167,287 12,730,436 12,817,333 12,907,839 11,916,422 10,704,142 - - - - - -
37,749,659 38,336,298 65,180,856 33,412,849 31,139,434 28,564,889 - - - - - -
57,387,741 63,771,411 38,091,575 34,997,141 26,634,366 11,279,011 14,511,725 17,763,536 14,855,058 13,226,899 11,039,191 8,752,461 28,574,903 37,440,159 37,577,451 23,986,248 27,903,767 34,684,741
- - - - - - - - - - - -
18,655,802 22,641,606 16,948,161 13,733,335 13,816,592 14,787,683 - - - - - -
451,620,707 490,129,501 443,715,981 331,076,828 316,665,354 315,903,839
24,044,448 23,779,653 10,682,099 - - - 9,360,007 9,965,659 8,798,034 8,387,232 9,505,142 -
33,404,455 33,745,312 19,480,133 8,387,232 9,505,142 -
204,441,495 192,229,762 196,740,189 160,055,426 170,388,933 158,696,996 - - - - - - - - - - - - - - - - - - - - - - - - - - - - - - - - - - - - - - - - - - - - - - - - - - - - - - - - - - - -
204,441,495 192,229,762 196,740,189 160,055,426 170,388,933 158,696,996
7,725,811 6,856,395 6,028,044 5,139,767 4,693,463 9,799,372 7,725,811 6,856,395 6,028,044 5,139,767 4,693,463 9,799,372
115,749,031 130,350,062 144,980,432 151,672,646 129,656,278 110,573,651 40,354,509 41,371,984 41,552,519 42,089,107 42,134,312 38,775,666 6,686,244 11,603,173 8,738,645 8,668,836 4,363,255 5,593,329
- - - - - - 162,789,784 183,325,219 195,271,596 202,430,589 176,153,845 154,942,646
408,361,545 416,156,688 417,519,962 376,013,014 360,741,383 323,439,014
(43,259,162)$ (73,972,813)$ (26,196,019)$ 44,936,186$ 44,076,029$ 7,535,175$

130
General Revenues and Total Changes in Net Position
STATISTICAL AND OTHER INFORMATION (UNAUDITED)FINANCIAL TRENDSGeneral Revenues and Total Changes in Net PositionPeriod ended June 30
2014 2013 2012
Net (expense)/revenue:Total primary government net expense (889,974,029)$ (205,132,693)$ (213,703,375)$
General revenues and other changesin net position:
Governmental activities:Shelby County 422,599,533 120,421,197 113,303,620Local option and state sales taxes 159,752,215 36,228,227 42,445,709Other local sources 5,410,727 1,977,774 19,278,514Unrestricted investment earnings 230,122 - -
Total primary government 587,992,597 158,627,198 175,027,843 Changes in net position:
Total primary government (301,981,432)$ (46,505,495)$ (38,675,532)$
Source: Shelby County Schools Financial Statements

131
SHELBY COUNTYBOARD OF EDUCATION
2011 2010 2009 2008 2007 2006 2005
(212,745,668)$ (206,048,946)$ (257,298,032)$ (221,467,615)$ (157,494,403)$ (132,077,816)$ (147,407,471)$
123,693,489 115,749,031 130,350,062 144,980,432 151,672,646 129,656,278 110,573,65141,681,158 40,354,509 41,371,984 41,552,519 42,089,107 42,134,312 38,775,6665,674,559 6,686,244 11,603,173 8,738,645 8,668,836 4,363,255 5,593,329
- - - - - - -171,049,206 162,789,784 183,325,219 195,271,596 202,430,589 176,153,845 154,942,646
(41,696,462)$ (43,259,162)$ (73,972,813)$ (26,196,019)$ 44,936,186$ 44,076,029$ 7,535,175$
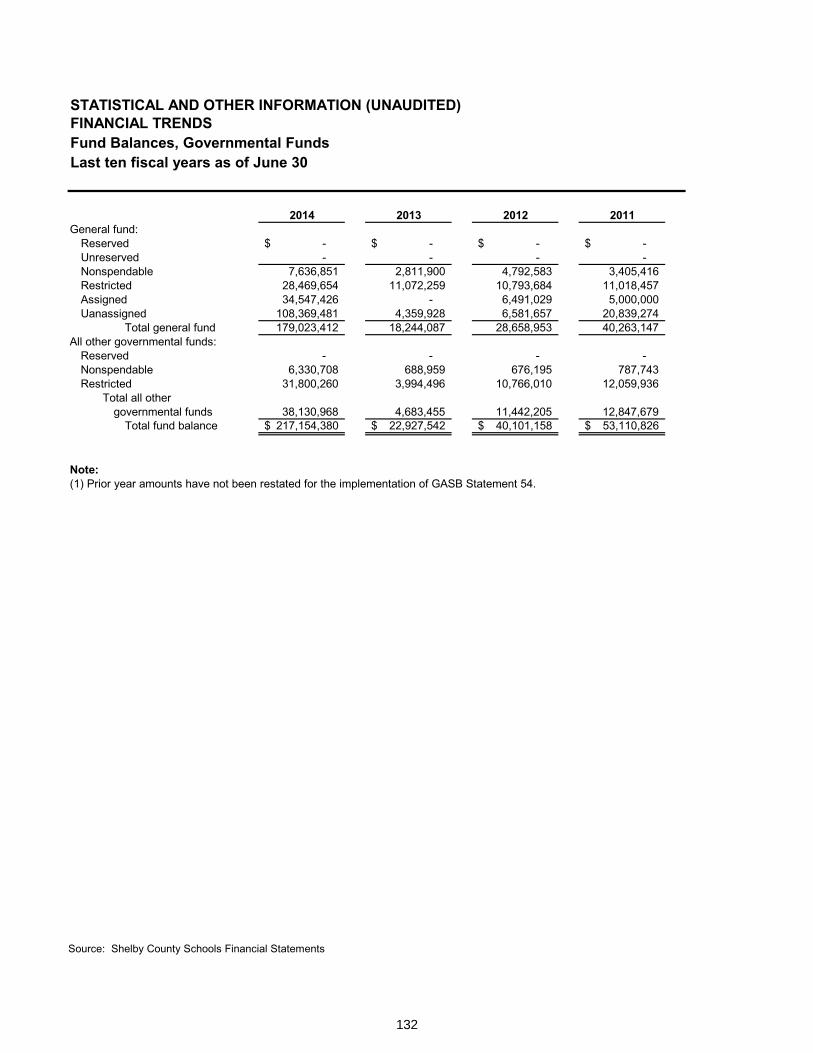
132
Fund Balances, Governmental Funds
Source: Shelby County Schools Financial Statements
STATISTICAL AND OTHER INFORMATION (UNAUDITED)FINANCIAL TRENDSFund Balances, Governmental FundsLast ten fiscal years as of June 30
2014 2013 2012 2011General fund:
Reserved -$ -$ -$ -$Unreserved - - - -Nonspendable 7,636,851 2,811,900 4,792,583 3,405,416Restricted 28,469,654 11,072,259 10,793,684 11,018,457Assigned 34,547,426 - 6,491,029 5,000,000Uanassigned 108,369,481 4,359,928 6,581,657 20,839,274
Total general fund 179,023,412 18,244,087 28,658,953 40,263,147All other governmental funds:
Reserved - - - -Nonspendable 6,330,708 688,959 676,195 787,743Restricted 31,800,260 3,994,496 10,766,010 12,059,936
Total all othergovernmental funds 38,130,968 4,683,455 11,442,205 12,847,679
Total fund balance 217,154,380$ 22,927,542$ 40,101,158$ 53,110,826$
Note:(1) Prior year amounts have not been restated for the implementation of GASB Statement 54.

133
SHELBY COUNTYBOARD OF EDUCATION
2010 (1) 2009 (1) 2008 (1) 2007 (1) 2006 (1) 2005 (1)
18,597,932$ 33,347,378$ 32,696,069$ 23,084,183$ 16,991,232$ 16,990,090$40,578,285 37,785,903 46,354,662 54,976,638 50,546,726 29,911,235
- - - - - -- - - - - -- - - - - -- - - - - -
59,176,217 71,133,281 79,050,731 78,060,821 67,537,958 46,901,325
17,927,077 23,952,700 30,009,892 22,471,705 23,421,171 9,471,698- - - - - -- - - - - -
17,927,077 23,952,700 30,009,892 22,471,705 23,421,171 9,471,69877,103,294$ 95,085,981$ 109,060,623$ 100,532,526$ 90,959,129$ 56,373,023$

134
Ten-Year Summary of Governmental Funds Revenues and Expenditures
Source: Shelby County Schools Financial Statements
STATISTICAL AND OTHER INFORMATION (UNAUDITED)FINANCIAL TRENDSGovernmental Funds Revenues and ExpendituresLast ten fiscal years ending June 30
2014 2013 2012 2011RevenuesCity of Memphis 193,746$ -$ -$ -$ Shelby County 557,773,447 121,482,108 128,191,254 124,721,112State of Tennessee 634,426,006 188,985,681 185,490,183 181,536,876Federal Government 201,163,016 31,115,853 40,212,975 36,918,593Other local sources 45,249,153 49,953,953 68,922,213 71,111,264
Total revenues and other financing sources 1,438,805,368 391,537,595 422,816,625 414,287,845
ExpendituresCurrent:
Instruction 768,659,704 241,436,952 245,510,326 241,646,844Instructional support 52,124,810 - - -Student support 106,787,831 - 13,298,824 13,737,572Office of principal 82,887,768 26,072,011 25,531,111 25,622,652General administration 26,488,469 9,907,762 9,411,529 10,551,602Fiscal services 7,855,712 5,471,541 4,810,908 4,506,823Other support services 33,621,393 51,488,014 55,757,634 53,469,473Student transportation 34,924,072 13,599,321 13,821,831 16,473,843Plant services 105,716,725 26,523,343 27,587,135 27,345,262Community service 22,176,468 1,156,041 1,232,331 1,191,489Charter school 66,987,992 - - -Retiree benefits 30,164,526 - - -Food service 76,549,491 17,668,835 16,145,023 17,174,955
Debt Service:Principal 547,383 - - -Interest 111,556 - - -
Capital outlay 11,195,512 9,038,510 23,510,909 27,234,560
Total expenditures and other financing uses 1,426,799,412 402,362,330 436,617,561 438,955,075
Net change in fund balances 12,005,956$ (10,824,735)$ (13,800,936)$ (24,667,230)$
Debt service as a percentage of noncapital expenditures 0.05% 0.00% 0.00% 0.00%
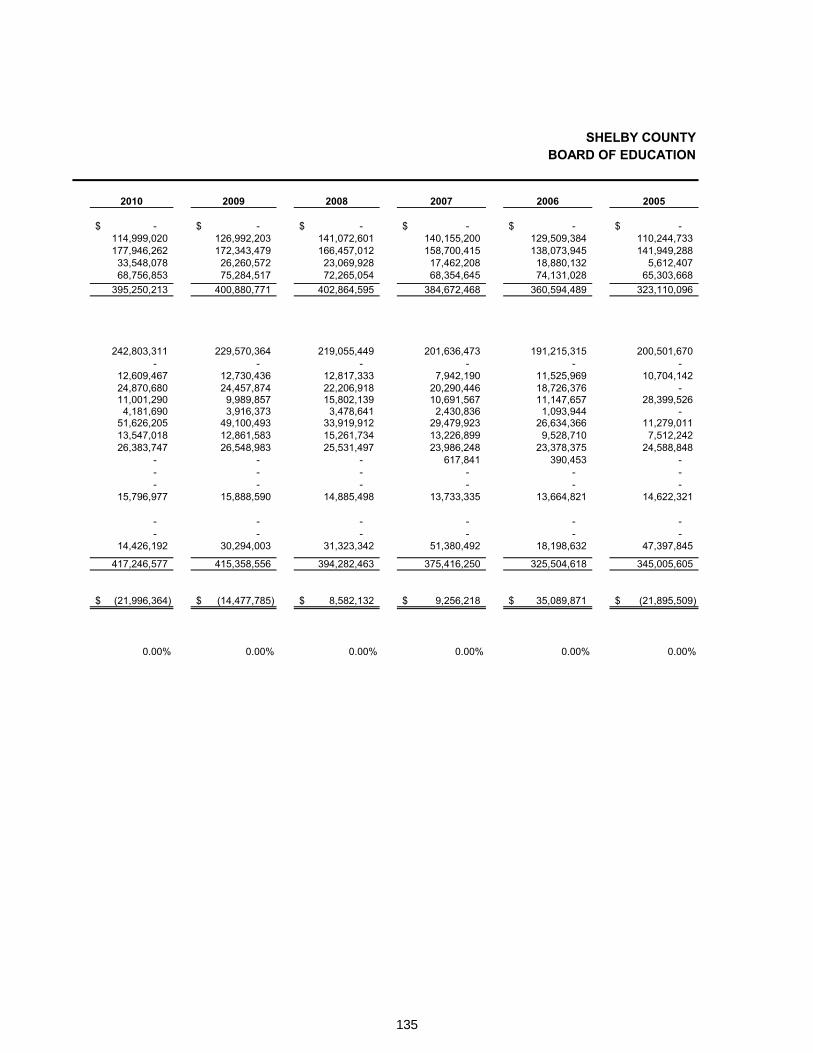
135
SHELBY COUNTYBOARD OF EDUCATION
2010 2009 2008 2007 2006 2005
-$ -$ -$ -$ -$ -$ 114,999,020 126,992,203 141,072,601 140,155,200 129,509,384 110,244,733177,946,262 172,343,479 166,457,012 158,700,415 138,073,945 141,949,28833,548,078 26,260,572 23,069,928 17,462,208 18,880,132 5,612,40768,756,853 75,284,517 72,265,054 68,354,645 74,131,028 65,303,668
395,250,213 400,880,771 402,864,595 384,672,468 360,594,489 323,110,096
242,803,311 229,570,364 219,055,449 201,636,473 191,215,315 200,501,670- - - - - -
12,609,467 12,730,436 12,817,333 7,942,190 11,525,969 10,704,14224,870,680 24,457,874 22,206,918 20,290,446 18,726,376 -11,001,290 9,989,857 15,802,139 10,691,567 11,147,657 28,399,5264,181,690 3,916,373 3,478,641 2,430,836 1,093,944 -
51,626,205 49,100,493 33,919,912 29,479,923 26,634,366 11,279,01113,547,018 12,861,583 15,261,734 13,226,899 9,528,710 7,512,24226,383,747 26,548,983 25,531,497 23,986,248 23,378,375 24,588,848
- - - 617,841 390,453 -- - - - - -- - - - - -
15,796,977 15,888,590 14,885,498 13,733,335 13,664,821 14,622,321
- - - - - -- - - - - -
14,426,192 30,294,003 31,323,342 51,380,492 18,198,632 47,397,845
417,246,577 415,358,556 394,282,463 375,416,250 325,504,618 345,005,605
(21,996,364)$ (14,477,785)$ 8,582,132$ 9,256,218$ 35,089,871$ (21,895,509)$
0.00% 0.00% 0.00% 0.00% 0.00% 0.00%

136
Ten-Year Comparison of General Fund Balance to Expenditures and Other Uses
Source: Shelby County Schools Financial Statements
STATISTICAL AND OTHER INFORMATION (UNAUDITED)FINANCIAL TRENDSComparison of General Fund Balanceto Expenditures and Other Uses SHELBY COUNTYLast ten fiscal years ending June 30 BOARD OF EDUCATION
Fiscal Year
Unreserved General Fund Balance (1)
Unassigned General Fund
Balance Expenditures and
other uses
Unreserved General Fund Balance as percentage of
expenditures and other uses
Unassigned General Fund Balance as a percentage of
expenditures and other uses 2005 29,911,235$ -$ 274,002,726$ 10.92%2006 50,546,726 - 269,220,440 18.78%2007 54,976,638 - 294,787,648 18.65%2008 46,354,662 - 322,811,112 14.36%2009 37,785,903 - 345,030,016 10.95%2010 40,578,285 - 356,569,488 11.38%2011 - 20,839,274 361,832,220 5.76%2012 - 6,581,657 357,903,038 1.84%2013 - 4,359,928 353,614,591 1.23%2014 - 108,369,481 1,169,051,189 9.27%
Note:(1) GASB 54 not retroactively applied to prior years.
137
Revenue Capacity
Revenue Capacity
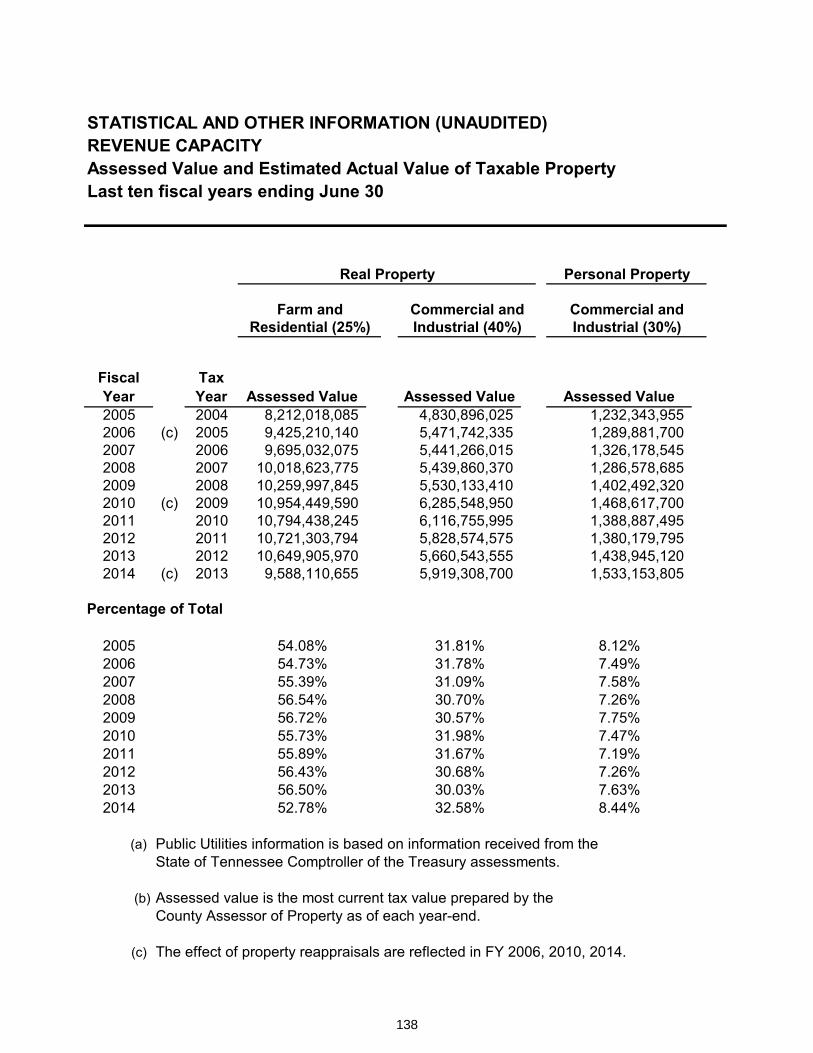
138
Assessed Value and Estimated Actual Value of Taxable Property
STATISTICAL AND OTHER INFORMATION (UNAUDITED)REVENUE CAPACITYAssessed Value and Estimated Actual Value of Taxable PropertyLast ten fiscal years ending June 30
Real Property Personal Property
Farm and Commercial and Commercial andResidential (25%) Industrial (40%) Industrial (30%)
Fiscal Year
Tax Year Assessed Value Assessed Value Assessed Value
2005 2004 8,212,018,085 4,830,896,025 1,232,343,955 2006 (c) 2005 9,425,210,140 5,471,742,335 1,289,881,700 2007 2006 9,695,032,075 5,441,266,015 1,326,178,545 2008 2007 10,018,623,775 5,439,860,370 1,286,578,685 2009 2008 10,259,997,845 5,530,133,410 1,402,492,320 2010 (c) 2009 10,954,449,590 6,285,548,950 1,468,617,700 2011 2010 10,794,438,245 6,116,755,995 1,388,887,495 2012 2011 10,721,303,794 5,828,574,575 1,380,179,795 2013 2012 10,649,905,970 5,660,543,555 1,438,945,120 2014 (c) 2013 9,588,110,655 5,919,308,700 1,533,153,805
Percentage of Total
2005 54.08% 31.81% 8.12%2006 54.73% 31.78% 7.49%2007 55.39% 31.09% 7.58%2008 56.54% 30.70% 7.26%2009 56.72% 30.57% 7.75%2010 55.73% 31.98% 7.47%2011 55.89% 31.67% 7.19%2012 56.43% 30.68% 7.26%2013 56.50% 30.03% 7.63%2014 52.78% 32.58% 8.44%
(a) Public Utilities information is based on information received from the State of Tennessee Comptroller of the Treasury assessments.
(b) Assessed value is the most current tax value prepared by the County Assessor of Property as of each year-end.
(c) The effect of property reappraisals are reflected in FY 2006, 2010, 2014.
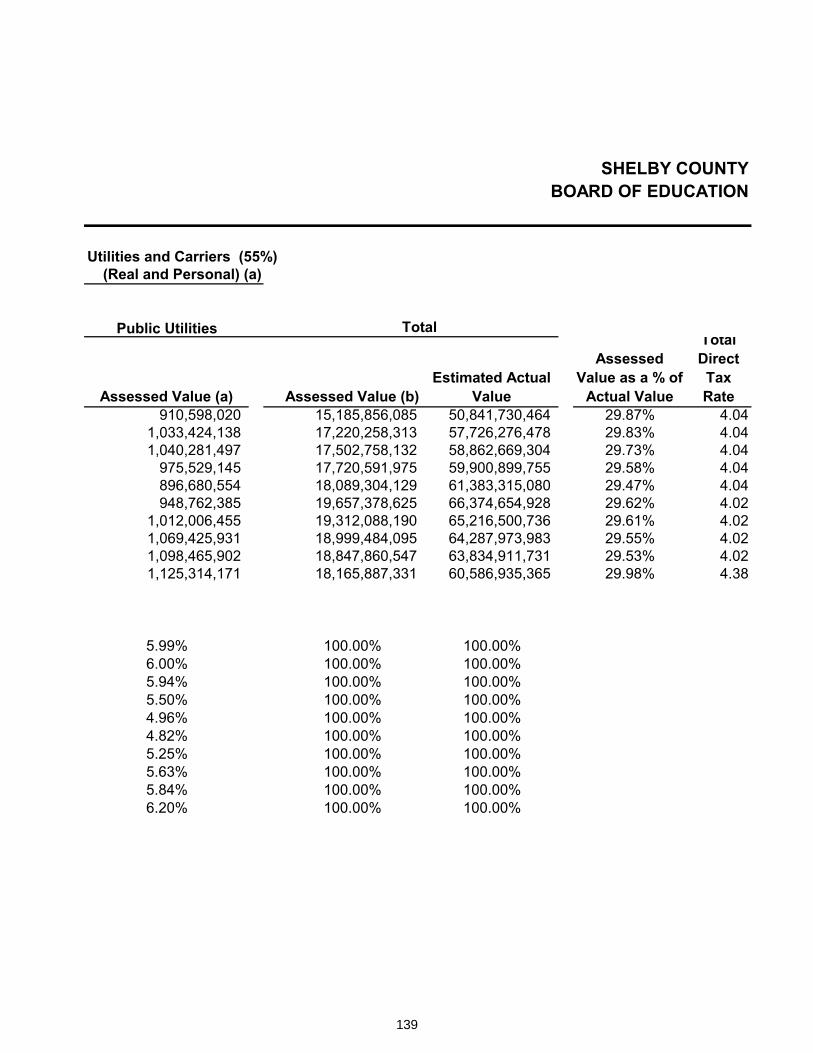
139
SHELBY COUNTY BOARD OF EDUCATION
Utilities and Carriers (55%)(Real and Personal) (a)
Public Utilities Total
Assessed Value (a) Assessed Value (b) Estimated Actual
Value
Assessed Value as a % of
Actual Value
Total Direct
Tax Rate
910,598,020 15,185,856,085 50,841,730,464 29.87% 4.041,033,424,138 17,220,258,313 57,726,276,478 29.83% 4.041,040,281,497 17,502,758,132 58,862,669,304 29.73% 4.04
975,529,145 17,720,591,975 59,900,899,755 29.58% 4.04896,680,554 18,089,304,129 61,383,315,080 29.47% 4.04948,762,385 19,657,378,625 66,374,654,928 29.62% 4.02
1,012,006,455 19,312,088,190 65,216,500,736 29.61% 4.021,069,425,931 18,999,484,095 64,287,973,983 29.55% 4.021,098,465,902 18,847,860,547 63,834,911,731 29.53% 4.021,125,314,171 18,165,887,331 60,586,935,365 29.98% 4.38
5.99% 100.00% 100.00%6.00% 100.00% 100.00%5.94% 100.00% 100.00%5.50% 100.00% 100.00%4.96% 100.00% 100.00%4.82% 100.00% 100.00%5.25% 100.00% 100.00%5.63% 100.00% 100.00%5.84% 100.00% 100.00%6.20% 100.00% 100.00%

140
Property Tax Rates and Levies
STATISTICAL AND OTHER INFORMATION (UNAUDITED)REVENUE CAPACITYProperty Tax Rates and Levies SHELBY COUNTYLast ten fiscal years ending June 30 BOARD OF EDUCATION
Tax Rates Per $100 Assessed Value
Fiscal Year Tax Year County
CountyAllocation to
Schools
Shelby County Schools Percent
of County Allocation County Total
2005 2004 4.04 2.03 27.91% 306,872,759 631,213,269 2006 2005 4.04 2.03 28.49% 677,268,537 1,058,215,881 2007 2006 4.04 2.02 29.18% 700,035,777 1,084,913,166 2008 2007 4.04 2.02 30.43% 712,198,714 1,104,675,925 2009 2008 4.04 2.02 30.78% 727,370,529 1,103,174,280 2010 2009 4.02 1.98 31.34% 756,953,165 1,146,300,203 2011 2010 4.02 1.90 30.94% 748,242,682 1,128,415,483 2012 2011 4.02 1.91 30.76% 748,024,787 1,124,747,905 2013 2012 4.02 1.91 31.06% 747,755,679 1,117,753,491 2014 2013 4.38 2.14 100.00% 775,676,738 775,676,738
Taxes are assessed as of January 1 and are due on October 1 for the County for Shelby County.
NOTE: Shelby County Schools does not have taxing authority and is not responsible for the collection or the monitoring of the collection of taxes.
Source: Shelby County Government Finance Department

141
This page left intentionally blank
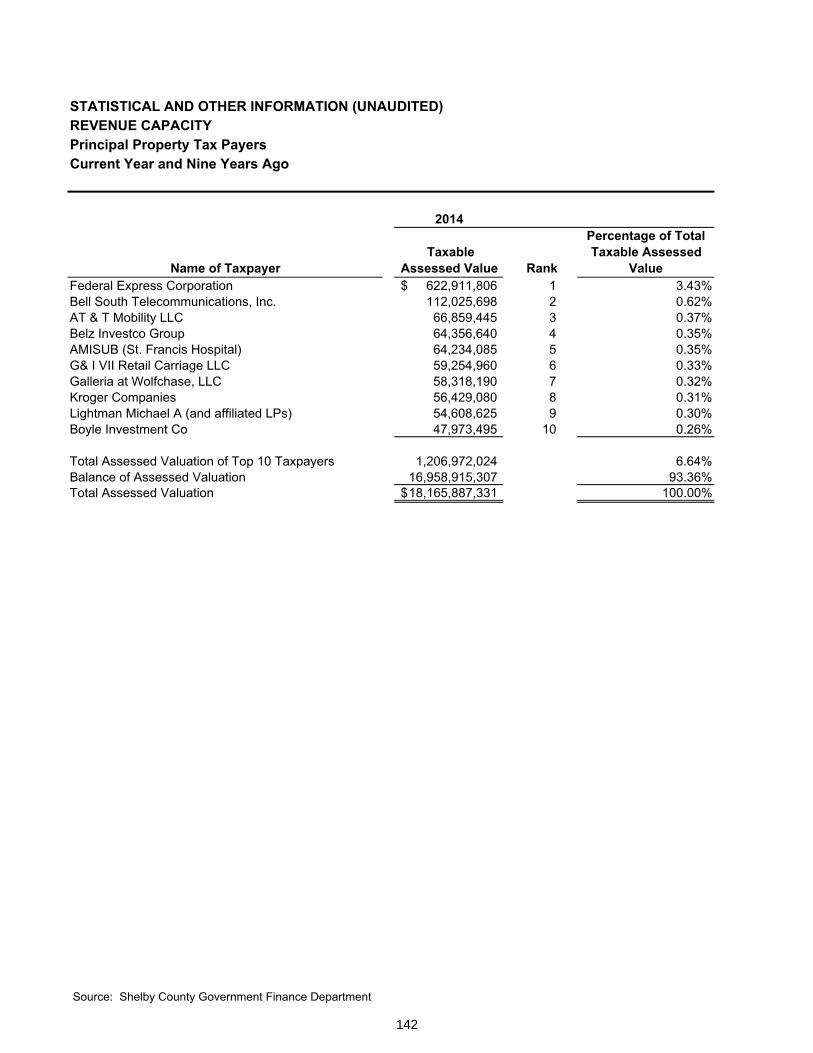
142
Principal Property Tax Payers – Current Year and Nine Years Ago
STATISTICAL AND OTHER INFORMATION (UNAUDITED)REVENUE CAPACITYPrincipal Property Tax PayersCurrent Year and Nine Years Ago
2014
Name of Taxpayer Taxable
Assessed Value Rank
Percentage of Total Taxable Assessed
ValueFederal Express Corporation 622,911,806$ 1 3.43%Bell South Telecommunications, Inc. 112,025,698 2 0.62%AT & T Mobility LLC 66,859,445 3 0.37%Belz Investco Group 64,356,640 4 0.35%AMISUB (St. Francis Hospital) 64,234,085 5 0.35%G& I VII Retail Carriage LLC 59,254,960 6 0.33%Galleria at Wolfchase, LLC 58,318,190 7 0.32%Kroger Companies 56,429,080 8 0.31%Lightman Michael A (and affiliated LPs) 54,608,625 9 0.30%Boyle Investment Co 47,973,495 10 0.26%
Total Assessed Valuation of Top 10 Taxpayers 1,206,972,024 6.64%Balance of Assessed Valuation 16,958,915,307 93.36%Total Assessed Valuation 18,165,887,331$ 100.00%
Source: Shelby County Government Finance Department
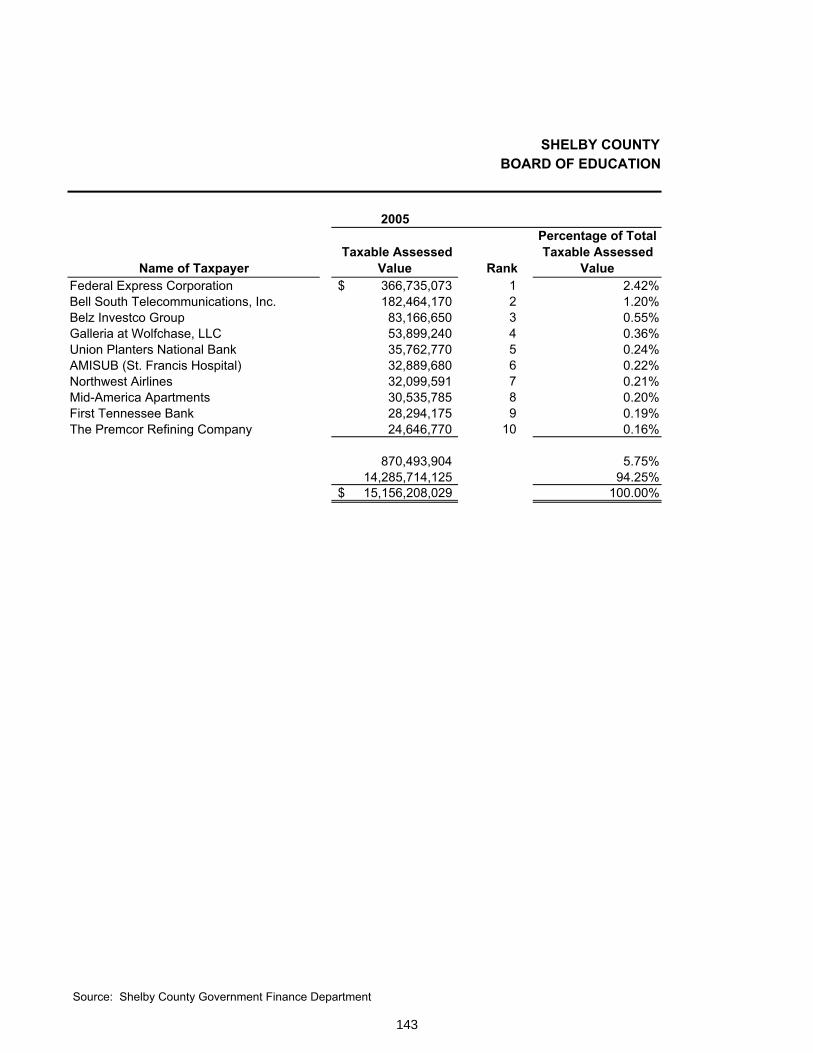
143
SHELBY COUNTY BOARD OF EDUCATION
2005
Name of Taxpayer Taxable Assessed
Value Rank
Percentage of Total Taxable Assessed
ValueFederal Express Corporation 366,735,073$ 1 2.42%Bell South Telecommunications, Inc. 182,464,170 2 1.20%Belz Investco Group 83,166,650 3 0.55%Galleria at Wolfchase, LLC 53,899,240 4 0.36%Union Planters National Bank 35,762,770 5 0.24%AMISUB (St. Francis Hospital) 32,889,680 6 0.22%Northwest Airlines 32,099,591 7 0.21%Mid-America Apartments 30,535,785 8 0.20%First Tennessee Bank 28,294,175 9 0.19%The Premcor Refining Company 24,646,770 10 0.16%
870,493,904 5.75%14,285,714,125 94.25%15,156,208,029$ 100.00%
Source: Shelby County Government Finance Department

144
This page left intentionally blank

145
Debt Capacity
Debt Capacity

146

147
Outstanding Debt by Type
STATISTICAL AND OTHER INFORMATION (UNAUDITED)DEBT CAPACITYOutstanding Debt by Type SHELBY COUNTYLast ten fiscal years ending June 30 BOARD OF EDUCATION
Governmental activities
Fiscalyear ENA Claims
State ofTennessee
QZAB Capital leasesTotal primary government
Percentage ofpersonalincome
Percapita
2014 6,870,022$ 1,311,568$ - 8,181,590$ N/A N/A
Notes: N/A = not available

148
Ten-Year Comparison of Bonded Debt to Assessed Value, Estimated Actual Value and PopulationSTATISTICAL AND OTHER INFORMATION (UNAUDITED)DEBT CAPACITYComparison of Bonded Debt to Assessed Value, Estimated Actual Value and Population SHELBY COUNTYLast ten fiscal years ending June 30 BOARD OF EDUCATION
Fiscalyear Bonded debt Assessed Value
Percent of bonded debt to assessed
valueEstimated Actual
Value
Percent of bonded debt to estimated actual value Population
Per capita bonded
debt2005 - 15,185,856,085 — 50,841,730,464 — 913,201 —2006 - 17,220,258,313 — 57,726,276,478 — 920,106 —2007 - 17,502,758,132 — 58,862,669,304 — 921,119 —2008 - 17,720,591,975 — 59,900,899,755 — 920,685 —2009 - 18,089,304,129 — 61,383,315,080 — 922,541 —2010 - 19,657,378,625 — 66,374,654,928 — 928,930 —2011 - 19,312,088,190 — 65,216,500,736 — 935,088 —2012 - 18,999,484,095 — 64,287,973,983 — 940,764 —2013 - 18,847,860,547 — 63,834,911,731 — 939,465 —2014 1,311,588 18,165,887,331 0.01 60,586,935,365 0.00 N/A N/A
Notes: N/A = not available
Source: Shelby County Goverment Finance Department

149
Percentage of Debt Service to Non-Capital Expenditures – Last Ten Fiscal Years
STATISTICAL AND OTHER INFORMATION (UNAUDITED)DEBT CAPACITYPercentage of Debt Service toNon-Capital Expenditures SHELBY COUNTYLast ten fiscal years ending June 30 BOARD OF EDUCATION
FiscalYear
Debt Service Expenditures
Non-CapitalExpenditures
Percentage of Debt Service to
Non-CapitalExpenditures
2005 -$ 307,482,006$ 0.00%2006 - 311,101,794 0.00%2007 - 280,716,492 0.00%2008 - 360,009,011 0.00%2009 - 324,388,914 0.00%2010 - 368,898,224 0.00%2011 - 405,372,539 0.00%2012 - 388,062,941 0.00%2013 - 370,786,207 0.00%2014 658,939 1,418,058,610 0.05%
Source: Shelby County Schools Financial Statements

150
This page left intentionally blank

151
Demographic and Economic Information
Demographic and Economic Information

152

153
Demographic and Economic Statistics
STATISTICAL AND OTHER INFORMATION (UNAUDITED)DEMOGRAPHIC AND ECONOMIC INFORMATIONDemographic and Economic Statistics SHELBY COUNTYLast ten fiscal years ending June 30 BOARD OF EDUCATION
Fiscal Year PopulationPersonal income (in thousands)
Per Capita Personal Income
UnemploymentRate
2004 909,643 33,095,510 36,383 6.1%2005 913,201 34,129,205 37,373 6.2%2006 920,106 36,103,204 39,238 5.7%2007 921,119 37,635,149 40,858 5.3%2008 920,685 37,507,530 40,739 7.0%2009 922,541 35,742,501 38,744 10.1%2010 928,930 37,057,190 39,892 10.0%2011 935,088 38,116,646 40,763 9.9%2012 940,764 39,896,975 42,409 9.1%2013 939,465 N/A N/A 9.7%2014 N/A N/A N/A N/A
Notes: N/A = not available
Source: Shelby County Government Financial Department

154
Principal Employers, Current Year and Nine Years Ago
STATISTICAL AND OTHER INFORMATION (UNAUDITED)DEMOGRAPHIC AND ECONOMIC INFORMATIONPrincipal EmployersCurrent Year and Nine Years Ago
2014
Name of Employer Employees Rank Percentage of Total
City EmploymentFederal Express Corporation 32,000 1 5.82%Shelby County Schools (a) 16,000 2 2.91%Tennessee State Government 14,400 3 2.62%United States Government 13,900 4 2.53%Methodist Le Bonheur Healthcare 10,175 5 1.85%Baptist Memorial Health Care Corp. 8,587 6 1.56%City of Memphis 6,848 7 1.25%Wal-Mart Stores, Inc. 6,000 8 1.09%Shelby County Government 5,662 9 1.03%Naval Support Activity Mid-South 4,600 10 0.84%Total 118,172 21.50%
Notes:(a) In 2013, Memphis City Schools and Shelby County Schools merged, and Memphis City Schools ceased.
Source: Shelby County Government Finance Department
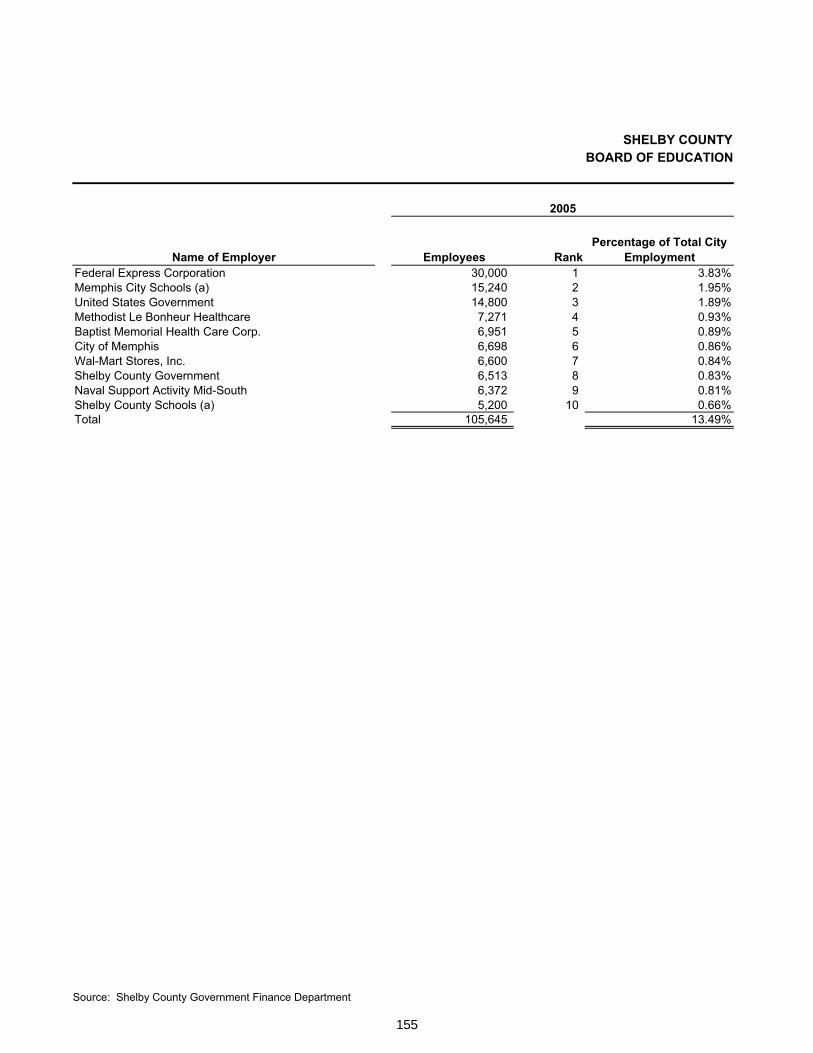
155
SHELBY COUNTY BOARD OF EDUCATION
2005
Name of Employer Employees Rank Percentage of Total City
EmploymentFederal Express Corporation 30,000 1 3.83%Memphis City Schools (a) 15,240 2 1.95%United States Government 14,800 3 1.89%Methodist Le Bonheur Healthcare 7,271 4 0.93%Baptist Memorial Health Care Corp. 6,951 5 0.89%City of Memphis 6,698 6 0.86%Wal-Mart Stores, Inc. 6,600 7 0.84%Shelby County Government 6,513 8 0.83%Naval Support Activity Mid-South 6,372 9 0.81%Shelby County Schools (a) 5,200 10 0.66%Total 105,645 13.49%
Source: Shelby County Government Finance Department

156
This page left intentionally blank

157
Operating Information
Operating Information

158
Operating Statistics
Source: Nonfinancial information from District records and Letter of Notification, State of Tennessee Financial information from District annual statements
STATISTICAL AND OTHER INFORMATION (UNAUDITED)OPERATING INFORMATIONOperating StatisticsLast ten fiscal years ending June 30
Fiscal Year
WeightedFull-time
Equivalent Average Daily
AttendanceOperating
ExpendituresCost Per
PupilPercentage
Change Expenses2005 53,435 297,607,760$ 5,570$ 6.50 315,903,839$2006 54,943 307,305,986 5,593 0.42 316,665,3542007 55,745 324,035,758 5,813 3.93 331,076,8282008 56,799 362,959,121 6,390 9.93 443,715,9812009 56,503 385,064,553 6,815 6.65 490,129,5012010 56,905 402,820,385 7,079 3.87 451,620,7072011 56,162 411,720,515 7,331 3.56 469,908,0362012 54,823 413,106,652 7,535 2.79 478,451,5542013 54,887 393,323,820 7,166 (4.90) 454,970,8672014 195,359 1,347,956,969 6,900 (3.71) 1,770,738,709
Notes: N/A = not availableOperating expenditures are total expenditures
less debt service, capital outlays and charter schools.

159
SHELBY COUNTYBOARD OF EDUCATION
Cost Per Pupil
Percentage Change Teaching Staff
Pupil-Teacher Ratio
5,912$ 11.39 2,608 20.495,764 (2.51) 2,689 20.435,939 3.05 2,825 19.747,812 31.54 2,944 19.298,674 11.04 2,998 18.857,936 (8.51) 3,066 18.568,367 5.43 3,036 18.508,727 4.30 3,040 18.038,289 (5.02) 2,930 18.739,064 9.35 5,002 39.06

160
This page left intentionally blank
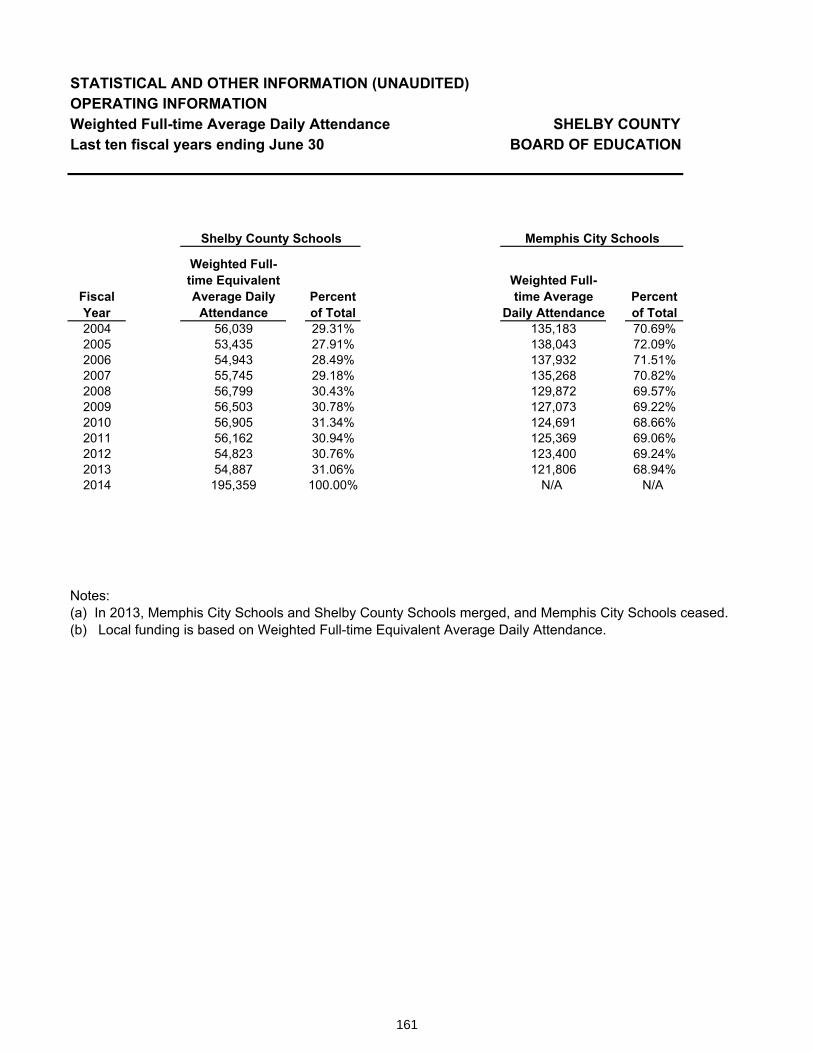
161
Weighted Full-time Equivalent Average Daily Attendance
STATISTICAL AND OTHER INFORMATION (UNAUDITED)OPERATING INFORMATIONWeighted Full-time Average Daily Attendance SHELBY COUNTYLast ten fiscal years ending June 30 BOARD OF EDUCATION
Shelby County Schools Memphis City Schools
FiscalYear
Weighted Full-time Equivalent Average Daily
AttendancePercentof Total
Weighted Full-time Average
Daily AttendancePercentof Total
2004 56,039 29.31% 135,183 70.69%2005 53,435 27.91% 138,043 72.09%2006 54,943 28.49% 137,932 71.51%2007 55,745 29.18% 135,268 70.82%2008 56,799 30.43% 129,872 69.57%2009 56,503 30.78% 127,073 69.22%2010 56,905 31.34% 124,691 68.66%2011 56,162 30.94% 125,369 69.06%2012 54,823 30.76% 123,400 69.24%2013 54,887 31.06% 121,806 68.94%2014 195,359 100.00% N/A N/A
Notes:(a) In 2013, Memphis City Schools and Shelby County Schools merged, and Memphis City Schools ceased. (b) Local funding is based on Weighted Full-time Equivalent Average Daily Attendance.

162
Staff by Type
STATISTICAL AND OTHER INFORMATION (UNAUDITED)OPERATING INFORMATIONStaff by TypeLast ten fiscal years ending June 30
2014 2013 2012 2011 2010
Full Time StaffOfficials/Administration/Management 154 29 28 23 161Principals 179 51 51 51 52Assistant Principals, Non-Teachers 193 119 121 120 123Elementary Classroom Teachers 2,542 2,063 2,145 2,141 2,199Secondary Classroom Teachers 2,056 836 868 867 835Other Classroom Teachers 2,210 31 28 28 32Guidance 250 125 123 122 122Psychological 72 9 9 9 9Librarian/Audiovisual 176 55 58 59 60Consultants/Supervisors 83 35 36 30 27Other Professional 375 186 186 152 153Teachers Aides 1,566 574 606 614 624Technicians 120 - - - -Clerical/Secretarial 689 320 384 354 360Service Workers 1,088 759 679 594 659Skilled Crafts 141 156 158 147 151Laborers Unskilled 268 - - - -
Totals 12,162 5,348 5,480 5,311 5,567
Part-Time StaffTotals 1,772 57 56 65 92
New HiresTotals 1,281 488 N/A N/A N/A
N/A - Not available

163
SHELBY COUNTY BOARD OF EDUCATION
2009 2008 2007 2006 2005
27 26 23 17 1951 51 48 48 46
124 117 107 109 1062,153 2,144 2,073 1,957 1,890
813 774 729 710 69231 27 23 22 27
118 105 92 92 878 8 7 7 8
58 56 52 53 4823 13 13 9 15
145 133 128 120 142607 553 518 462 435- - - - -361 338 337 238 233740 684 652 600 581151 155 155 145 150- - - - 274
5,410 5,184 4,957 4,589 4,753
94 84 56 56 57
N/A N/A N/A N/A N/A
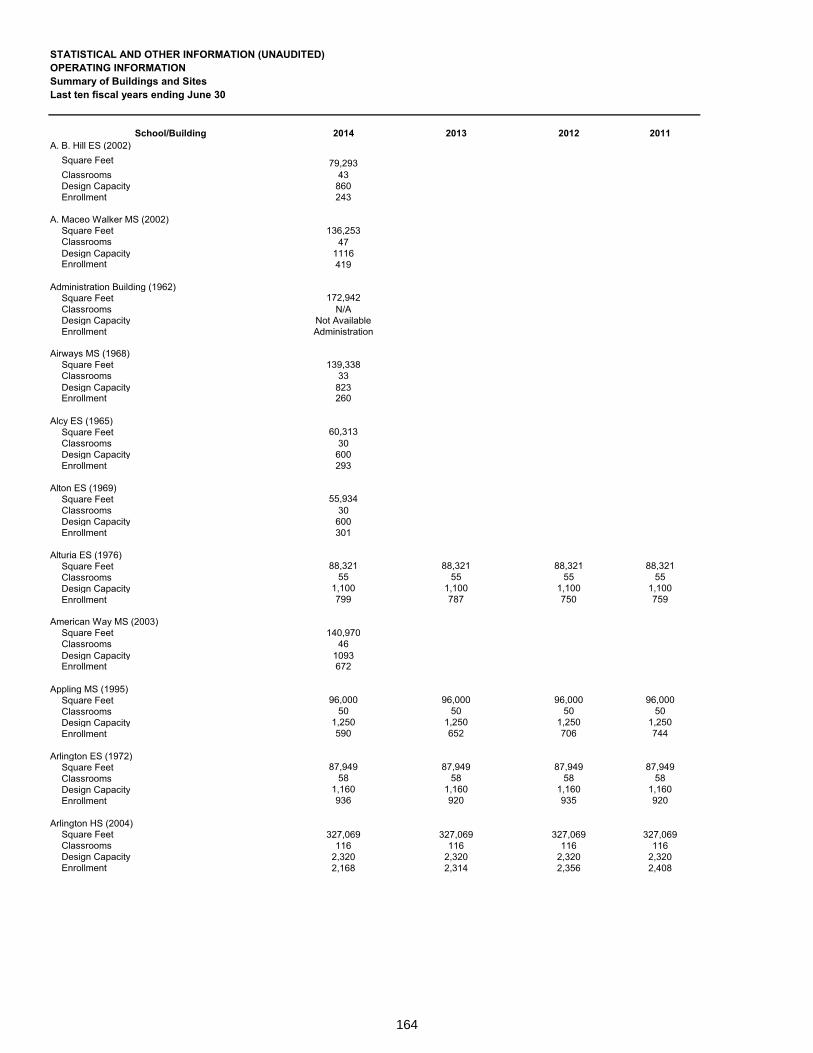
164
Summary of Buildings and SitesSTATISTICAL AND OTHER INFORMATION (UNAUDITED)OPERATING INFORMATIONSummary of Buildings and SitesLast ten fiscal years ending June 30
School/Building 2014 2013 2012 2011A. B. Hill ES (2002)
Square Feet 79,293Classrooms 43Design Capacity 860Enrollment 243
A. Maceo Walker MS (2002)Square Feet 136,253Classrooms 47Design Capacity 1116Enrollment 419
Administration Building (1962)Square Feet 172,942Classrooms N/ADesign Capacity Not AvailableEnrollment Administration
Airways MS (1968)Square Feet 139,338Classrooms 33Design Capacity 823Enrollment 260
Alcy ES (1965)Square Feet 60,313Classrooms 30Design Capacity 600Enrollment 293
Alton ES (1969)Square Feet 55,934Classrooms 30Design Capacity 600Enrollment 301
Alturia ES (1976)Square Feet 88,321 88,321 88,321 88,321Classrooms 55 55 55 55Design Capacity 1,100 1,100 1,100 1,100Enrollment 799 787 750 759
American Way MS (2003)Square Feet 140,970Classrooms 46Design Capacity 1093Enrollment 672
Appling MS (1995)Square Feet 96,000 96,000 96,000 96,000Classrooms 50 50 50 50Design Capacity 1,250 1,250 1,250 1,250Enrollment 590 652 706 744
Arlington ES (1972)Square Feet 87,949 87,949 87,949 87,949Classrooms 58 58 58 58Design Capacity 1,160 1,160 1,160 1,160Enrollment 936 920 935 920
Arlington HS (2004)Square Feet 327,069 327,069 327,069 327,069Classrooms 116 116 116 116Design Capacity 2,320 2,320 2,320 2,320Enrollment 2,168 2,314 2,356 2,408

165
SHELBY COUNTY BOARD OF EDUCATION
2010 2009 2008 2007 2006 2005
88,321 88,321 88,321 88,321 88,321 88,32155 55 55 55 55 55
1,100 1,100 1,100 1,100 1,100 1,100753 772 812 795 800 712
96,000 96,000 96,000 96,000 96,000 96,00050 50 50 50 50 50
1,250 1,250 1,250 1,250 1,250 1,250745 706 885 856 879 892
87,949 87,949 87,949 87,949 87,949 87,94958 58 58 58 58 58
1,160 1,160 1,160 1,160 1,160 1,160890 1,200 1,133 946 771 621
327,069 327,069 327,069 327,069 327,069 327,069116 116 116 116 116 116
2,320 2,320 2,320 2,320 2,320 2,3202,200 2,016 1,880 1,346 795 383
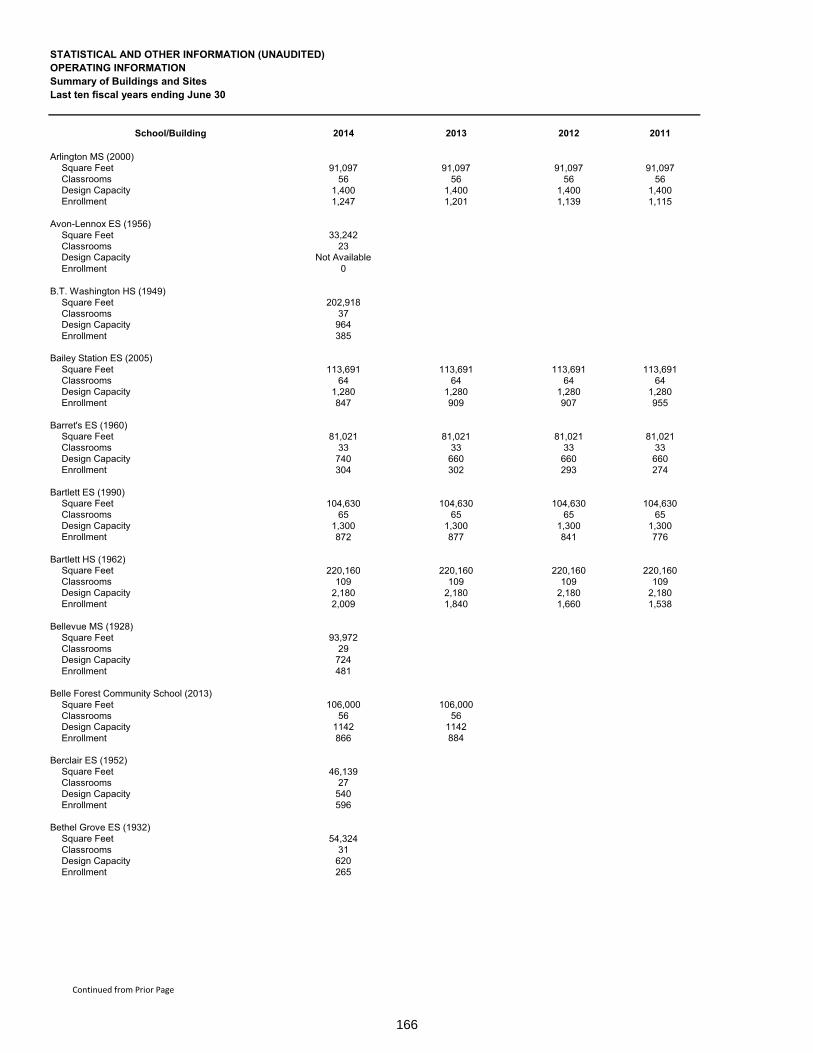
166
STATISTICAL AND OTHER INFORMATION (UNAUDITED)OPERATING INFORMATIONSummary of Buildings and SitesLast ten fiscal years ending June 30
School/Building 2014 2013 2012 2011
Arlington MS (2000)Square Feet 91,097 91,097 91,097 91,097Classrooms 56 56 56 56Design Capacity 1,400 1,400 1,400 1,400Enrollment 1,247 1,201 1,139 1,115
Avon-Lennox ES (1956)Square Feet 33,242Classrooms 23Design Capacity Not AvailableEnrollment 0
B.T. Washington HS (1949)Square Feet 202,918Classrooms 37Design Capacity 964Enrollment 385
Bailey Station ES (2005)Square Feet 113,691 113,691 113,691 113,691Classrooms 64 64 64 64Design Capacity 1,280 1,280 1,280 1,280Enrollment 847 909 907 955
Barret's ES (1960)Square Feet 81,021 81,021 81,021 81,021Classrooms 33 33 33 33Design Capacity 740 660 660 660Enrollment 304 302 293 274
Bartlett ES (1990)Square Feet 104,630 104,630 104,630 104,630Classrooms 65 65 65 65Design Capacity 1,300 1,300 1,300 1,300Enrollment 872 877 841 776
Bartlett HS (1962)Square Feet 220,160 220,160 220,160 220,160Classrooms 109 109 109 109Design Capacity 2,180 2,180 2,180 2,180Enrollment 2,009 1,840 1,660 1,538
Bellevue MS (1928)Square Feet 93,972Classrooms 29Design Capacity 724Enrollment 481
Belle Forest Community School (2013)Square Feet 106,000 106,000Classrooms 56 56Design Capacity 1142 1142Enrollment 866 884
Berclair ES (1952)Square Feet 46,139Classrooms 27Design Capacity 540Enrollment 596
Bethel Grove ES (1932)Square Feet 54,324Classrooms 31Design Capacity 620Enrollment 265
Continued from Prior Page

167
SHELBY COUNTY BOARD OF EDUCATION
2010 2009 2008 2007 2006 2005
91,097 91,097 91,097 91,097 91,097 91,09756 56 56 56 56 56
1,400 1,400 1,400 1,400 1,400 1,4001,098 1,094 1,359 1,278 1,134 958
113,691 113,691 113,691 113,691 113,69164 64 64 64 64
1,280 1,280 1,280 1,280 1,280901 860 871 835 653
81,021 81,021 81,021 81,021 81,021 81,02133 33 33 33 33 33660 660 660 660 660 660264 266 269 287 301 333
104,630 104,630 104,630 104,630 104,630 104,63065 65 65 65 65 65
1,300 1,300 1,300 1,300 1,300 1,300811 889 908 976 973 1,023
220,160 220,160 220,160 220,160 220,160 220,160109 109 109 109 109 109
2,180 2,180 2,180 2,180 2,180 2,1801,478 1,434 1,560 1,565 1,750 1,888
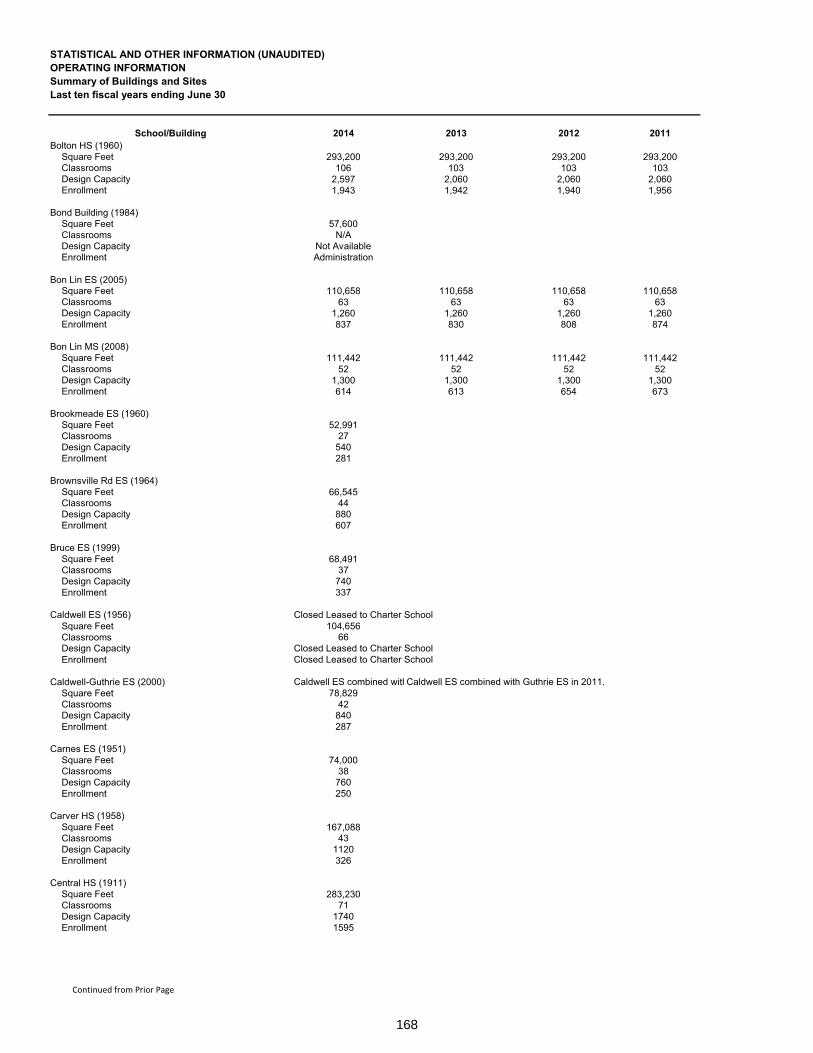
168
STATISTICAL AND OTHER INFORMATION (UNAUDITED)OPERATING INFORMATIONSummary of Buildings and SitesLast ten fiscal years ending June 30
School/Building 2014 2013 2012 2011Bolton HS (1960)
Square Feet 293,200 293,200 293,200 293,200Classrooms 106 103 103 103Design Capacity 2,597 2,060 2,060 2,060Enrollment 1,943 1,942 1,940 1,956
Bond Building (1984) Square Feet 57,600Classrooms N/ADesign Capacity Not AvailableEnrollment Administration
Bon Lin ES (2005)Square Feet 110,658 110,658 110,658 110,658Classrooms 63 63 63 63Design Capacity 1,260 1,260 1,260 1,260Enrollment 837 830 808 874
Bon Lin MS (2008)Square Feet 111,442 111,442 111,442 111,442Classrooms 52 52 52 52Design Capacity 1,300 1,300 1,300 1,300Enrollment 614 613 654 673
Brookmeade ES (1960)Square Feet 52,991Classrooms 27Design Capacity 540Enrollment 281
Brownsville Rd ES (1964)Square Feet 66,545Classrooms 44Design Capacity 880Enrollment 607
Bruce ES (1999)Square Feet 68,491Classrooms 37Design Capacity 740Enrollment 337
Caldwell ES (1956) Closed Leased to Charter SchoolSquare Feet 104,656Classrooms 66Design Capacity Closed Leased to Charter SchoolEnrollment Closed Leased to Charter School
Caldwell-Guthrie ES (2000) Caldwell ES combined withCaldwell ES combined with Guthrie ES in 2011. Square Feet 78,829Classrooms 42Design Capacity 840Enrollment 287
Carnes ES (1951)Square Feet 74,000Classrooms 38Design Capacity 760Enrollment 250
Carver HS (1958)Square Feet 167,088Classrooms 43Design Capacity 1120Enrollment 326
Central HS (1911)Square Feet 283,230Classrooms 71Design Capacity 1740Enrollment 1595
Continued from Prior Page

169
SHELBY COUNTY BOARD OF EDUCATION
2010 2009 2008 2007 2006 2005
293,200 293,200 293,200 293,200 293,200 293,200103 103 103 103 103 103
2,060 2,060 2,060 2,060 2,060 2,0601,847 1,877 1,975 2,129 2,267 2,371
110,658 110,658 110,658 110,658 110,65863 63 63 63 63
1,260 1,260 1,260 1,260 1,260833 766 762 741 694
111,442 111,44252 52
1,300 1,300669 549

170
STATISTICAL AND OTHER INFORMATION (UNAUDITED)OPERATING INFORMATIONSummary of Buildings and SitesLast ten fiscal years ending June 30
School/Building 2014 2013 2012 2011
Central Office East (1965)Square Feet 13,642 13,642 13,642 13,642Classrooms N/A N/A N/A N/ADesign Capacity Not Available Not Available Not Available Not AvailableEnrollment Administration Administration Administration Administration
Central Office Grays Creek (2012)Square Feet 225,586 225,586 225,586Classrooms N/A N/A N/ADesign Capacity Not Available Not Available Not AvailableEnrollment Administration Administration Administration
Central Office West (1968)Square Feet 27,364 27,364 27,364 27,364Classrooms N/A N/A N/A N/ADesign Capacity Not Available Not Available Not Available Not AvailableEnrollment Administration Administration Administration Administration
Charjean ES (1950)Square Feet 39,352Classrooms 24Design Capacity 480Enrollment 415
Cherokee ES (1951)Square Feet 61,286Classrooms 43Design Capacity 860Enrollment 431
Chickasaw MS (1971)Square Feet 138,044Classrooms 32Design Capacity 798Enrollment 472
Chimneyrock ESSquare Feet 90,611Classrooms 50Design Capacity 1,000Enrollment 809
Coleman ES (1910)Square Feet 118,617Classrooms 32Design Capacity 653Enrollment 449
Collierville ES (1968)Square Feet 114,081 114,081 114,081 114,081Classrooms 66 66 66 66Design Capacity 1,320 1,320 1,320 1,320Enrollment 759 754 762 775
Collierville HS (1975)Square Feet 281,172 281,172 281,172 281,172Classrooms 107 107 107 107Design Capacity 2,140 2,140 2,140 2,140Enrollment 1,922 1,973 1,939 1,884
Collierville MS (2011) New building constructed in 2011.Square Feet 114,865 114,865 114,865 114,865Classrooms 54 54 54 54Design Capacity 1,350 1,350 1,350 1,350Enrollment 843 890 878 901
Colonial MS (2009)Square Feet 153,438Classrooms 52Design Capacity 1,235Enrollment 1,043
Continued from Prior Page
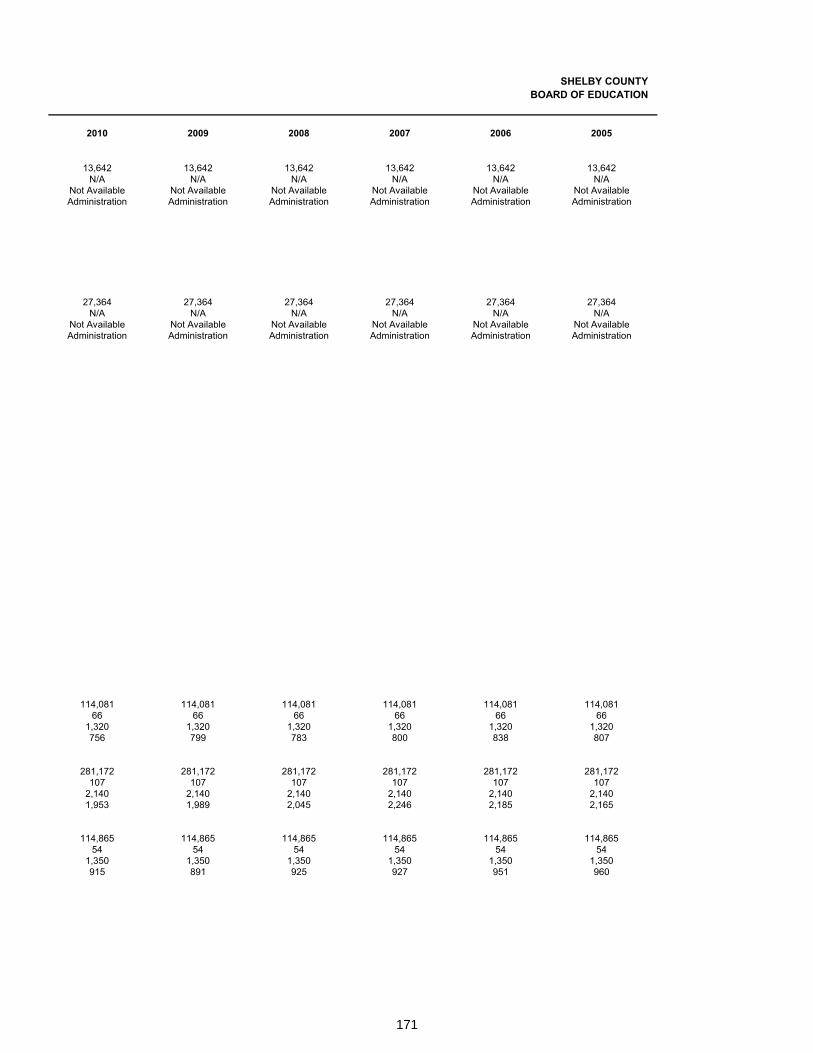
171
SHELBY COUNTY BOARD OF EDUCATION
2010 2009 2008 2007 2006 2005
13,642 13,642 13,642 13,642 13,642 13,642N/A N/A N/A N/A N/A N/A
Not Available Not Available Not Available Not Available Not Available Not AvailableAdministration Administration Administration Administration Administration Administration
27,364 27,364 27,364 27,364 27,364 27,364N/A N/A N/A N/A N/A N/A
Not Available Not Available Not Available Not Available Not Available Not AvailableAdministration Administration Administration Administration Administration Administration
114,081 114,081 114,081 114,081 114,081 114,08166 66 66 66 66 66
1,320 1,320 1,320 1,320 1,320 1,320756 799 783 800 838 807
281,172 281,172 281,172 281,172 281,172 281,172107 107 107 107 107 107
2,140 2,140 2,140 2,140 2,140 2,1401,953 1,989 2,045 2,246 2,185 2,165
114,865 114,865 114,865 114,865 114,865 114,86554 54 54 54 54 54
1,350 1,350 1,350 1,350 1,350 1,350915 891 925 927 951 960

172
STATISTICAL AND OTHER INFORMATION (UNAUDITED)OPERATING INFORMATIONSummary of Buildings and SitesLast ten fiscal years ending June 30
School/Building 2014 2013 2012 2011
Cordova ES (2002) Includes Middle School enrollment in early yearsSquare Feet 88,164Classrooms 46Design Capacity 920Enrollment 628
Cordova HS Annexed by the City of Memphis in 2005.Square Feet 278,000Classrooms 107Design Capacity 2,622Enrollment 1,694
Cordova MS (1993) Was K-8 until elementary school built in 2002-03Square Feet 147,873Classrooms 62Design Capacity 1,473Enrollment 784
Corning ES (1968) ASD SchoolSquare Feet 47,149Classrooms 22Design Capacity ASD SchoolEnrollment ASD School
Corry MS (1959)Square Feet 101,247Classrooms 34Design Capacity 813Enrollment 268
Craigmont HS (1973)Square Feet 324,517Classrooms 63Design Capacity 1,641Enrollment 984
Craigmont MS (2001)Square Feet 148,352Classrooms 48Design Capacity 1140Enrollment 663
Cromwell ES (1963)Square Feet 45,580Classrooms 39Design Capacity 780Enrollment 589
Crosswind ES (1993)Square Feet 90,629 90,629 90,629 90,629Classrooms 52 52 52 52Design Capacity 1,040 1,040 1,040 1,040Enrollment 722 711 733 770
Crump ES (1978)Square Feet 60,483Classrooms 49Design Capacity 980Enrollment 818
Cummings ES (1961)Square Feet 120,729Classrooms 38Design Capacity 760Enrollment 556
Cypress MS (1966)Square Feet 216,171Classrooms 56Design Capacity 1,338Enrollment 232
Continued from Prior Page
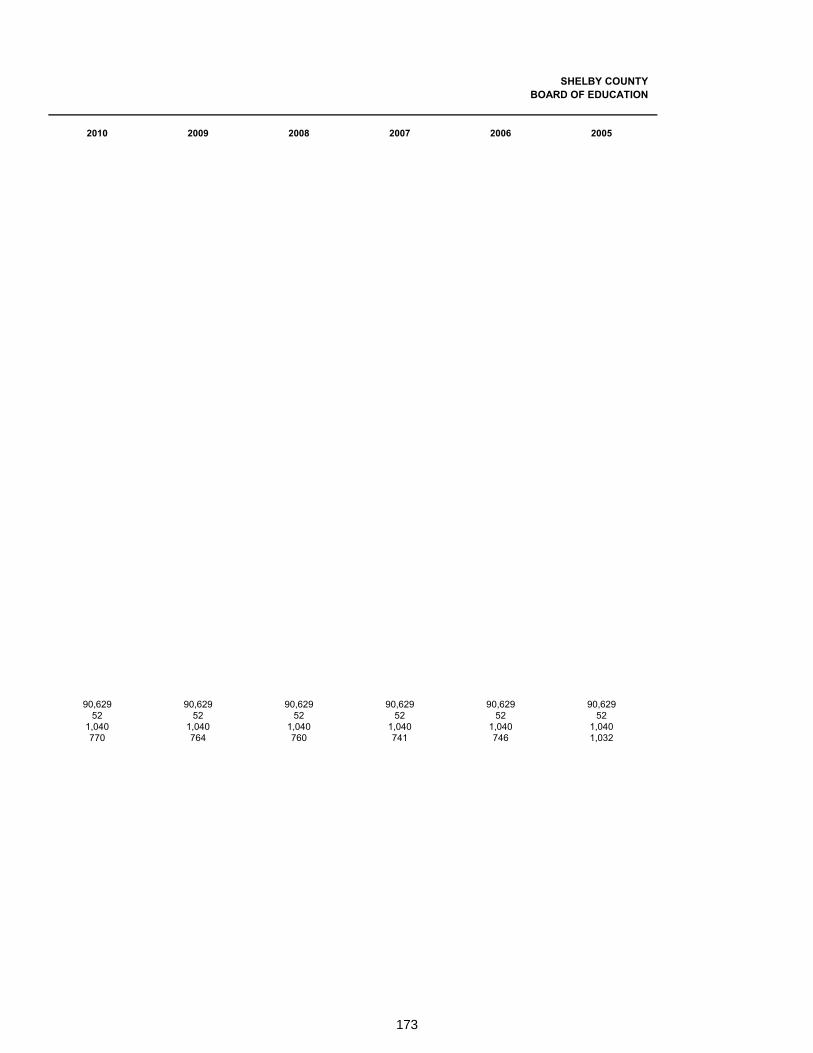
173
SHELBY COUNTY BOARD OF EDUCATION
2010 2009 2008 2007 2006 2005
90,629 90,629 90,629 90,629 90,629 90,62952 52 52 52 52 52
1,040 1,040 1,040 1,040 1,040 1,040770 764 760 741 746 1,032
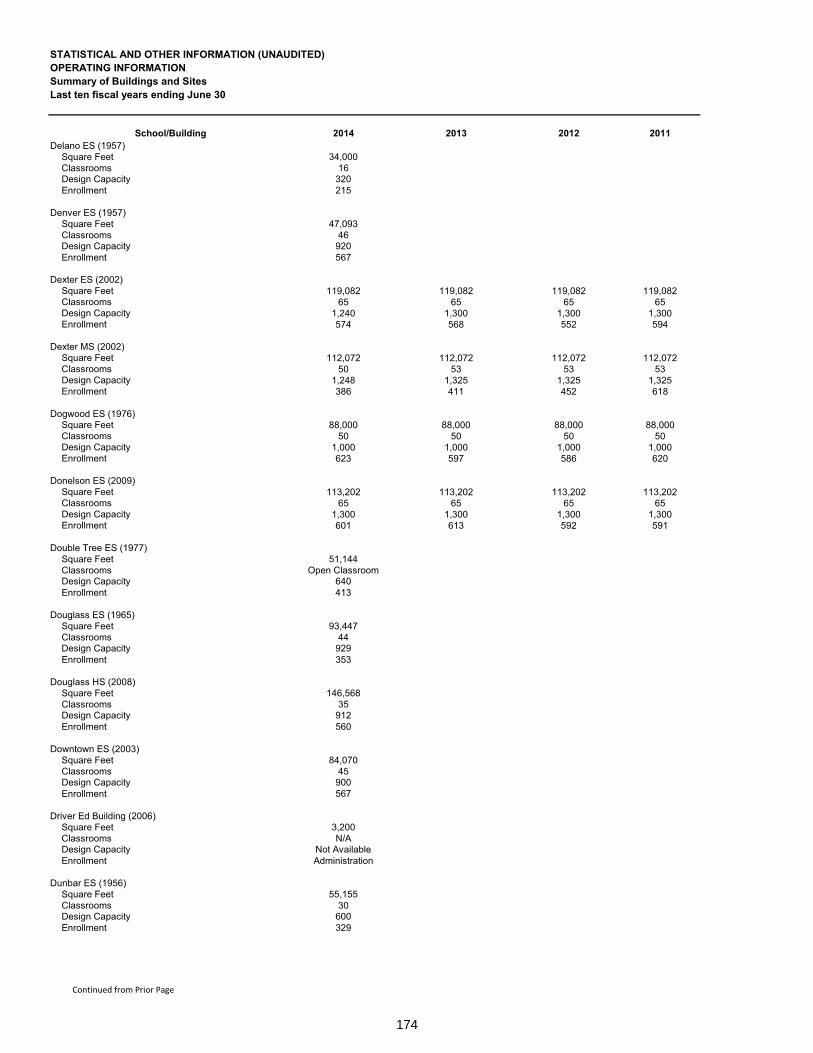
174
STATISTICAL AND OTHER INFORMATION (UNAUDITED)OPERATING INFORMATIONSummary of Buildings and SitesLast ten fiscal years ending June 30
School/Building 2014 2013 2012 2011Delano ES (1957)
Square Feet 34,000Classrooms 16Design Capacity 320Enrollment 215
Denver ES (1957)Square Feet 47,093Classrooms 46Design Capacity 920Enrollment 567
Dexter ES (2002)Square Feet 119,082 119,082 119,082 119,082Classrooms 65 65 65 65Design Capacity 1,240 1,300 1,300 1,300Enrollment 574 568 552 594
Dexter MS (2002)Square Feet 112,072 112,072 112,072 112,072Classrooms 50 53 53 53Design Capacity 1,248 1,325 1,325 1,325Enrollment 386 411 452 618
Dogwood ES (1976)Square Feet 88,000 88,000 88,000 88,000Classrooms 50 50 50 50Design Capacity 1,000 1,000 1,000 1,000Enrollment 623 597 586 620
Donelson ES (2009)Square Feet 113,202 113,202 113,202 113,202Classrooms 65 65 65 65Design Capacity 1,300 1,300 1,300 1,300Enrollment 601 613 592 591
Double Tree ES (1977)Square Feet 51,144Classrooms Open ClassroomDesign Capacity 640Enrollment 413
Douglass ES (1965)Square Feet 93,447Classrooms 44Design Capacity 929Enrollment 353
Douglass HS (2008)Square Feet 146,568Classrooms 35Design Capacity 912Enrollment 560
Downtown ES (2003)Square Feet 84,070Classrooms 45Design Capacity 900Enrollment 567
Driver Ed Building (2006)Square Feet 3,200Classrooms N/ADesign Capacity Not AvailableEnrollment Administration
Dunbar ES (1956)Square Feet 55,155Classrooms 30Design Capacity 600Enrollment 329
Continued from Prior Page
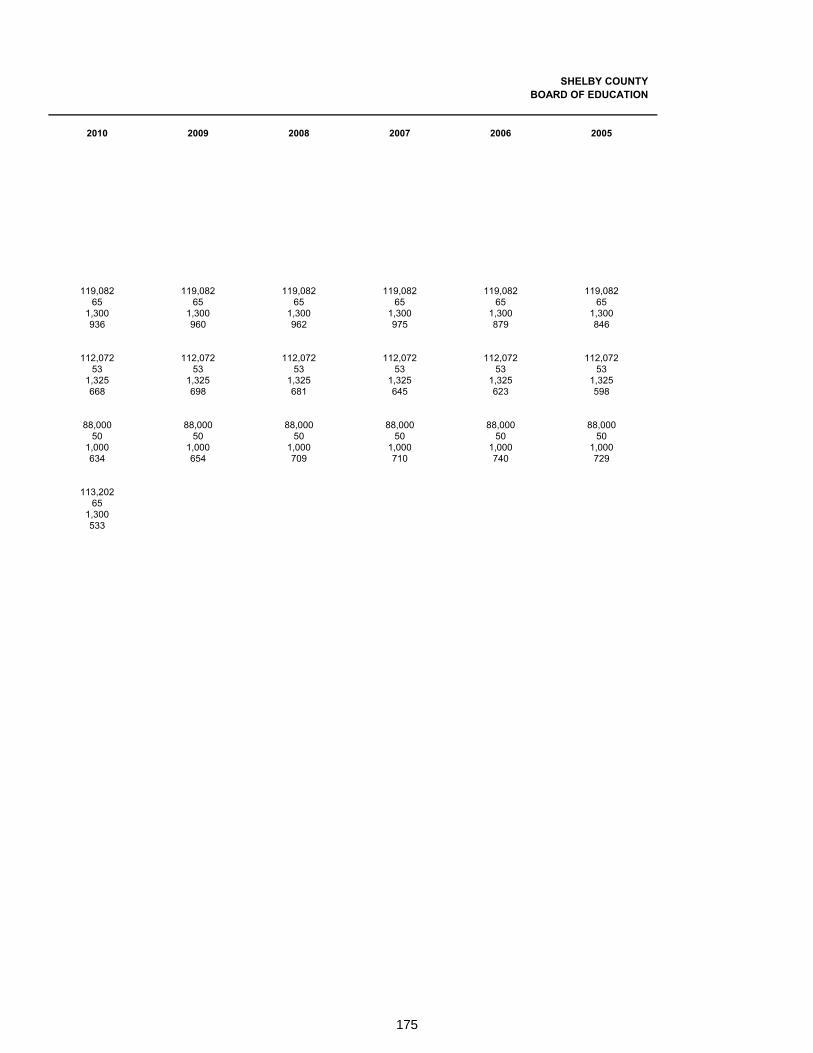
175
SHELBY COUNTY BOARD OF EDUCATION
2010 2009 2008 2007 2006 2005
119,082 119,082 119,082 119,082 119,082 119,08265 65 65 65 65 65
1,300 1,300 1,300 1,300 1,300 1,300936 960 962 975 879 846
112,072 112,072 112,072 112,072 112,072 112,07253 53 53 53 53 53
1,325 1,325 1,325 1,325 1,325 1,325668 698 681 645 623 598
88,000 88,000 88,000 88,000 88,000 88,00050 50 50 50 50 50
1,000 1,000 1,000 1,000 1,000 1,000634 654 709 710 740 729
113,20265
1,300533

176
STATISTICAL AND OTHER INFORMATION (UNAUDITED)OPERATING INFORMATIONSummary of Buildings and SitesLast ten fiscal years ending June 30
School/Building 2014 2013 2012 2011Dunn ES (1952)
Square Feet 41,233Classrooms 22Design Capacity Not AvailableEnrollment Vacant
East HS (1948)Square Feet 189,493Classrooms 61Design Capacity 1,589Enrollment 763
East Career & TechnologySquare Feet 53,200Classrooms 22Design Capacity Not AvailableEnrollment Not Available
Egypt ES (1964)Square Feet 57,636Classrooms 41Design Capacity 820Enrollment 623
Ellendale ES (1976)Square Feet 84,693 84,693 84,693 84,693Classrooms 53 53 53 53Design Capacity 1,060 1,060 1,060 1,060Enrollment 554 539 555 558
Elmore Park MS (1957)Square Feet 109,746 69,943 69,943 69,943Classrooms 52 52 52 52Design Capacity 1,300 1,300 1,300 1,300Enrollment 714 645 639 657
Evans ES (1966)Square Feet 67,246Classrooms 36Design Capacity 720Enrollment 591
Fairley ES (1960)Square Feet 69,501Classrooms 39Design Capacity 780Enrollment 349
Fairley HS (1968)Square Feet 189,299Classrooms 52Design Capacity 1,253Enrollment 684
Fairview MS (1930)Square Feet 95,345Classrooms 35Design Capacity 837Enrollment 280
Farmington ES (1973)Square Feet 73,908 73,908 73,908 73,908Classrooms 48 48 48 48Design Capacity 960 960 960 960Enrollment 753 752 740 736
Florida ES (1924)Square Feet Facility DemolishedClassrooms Facility DemolishedDesign Capacity Facility DemolishedEnrollment Facility Demolished
Continued from Prior Page
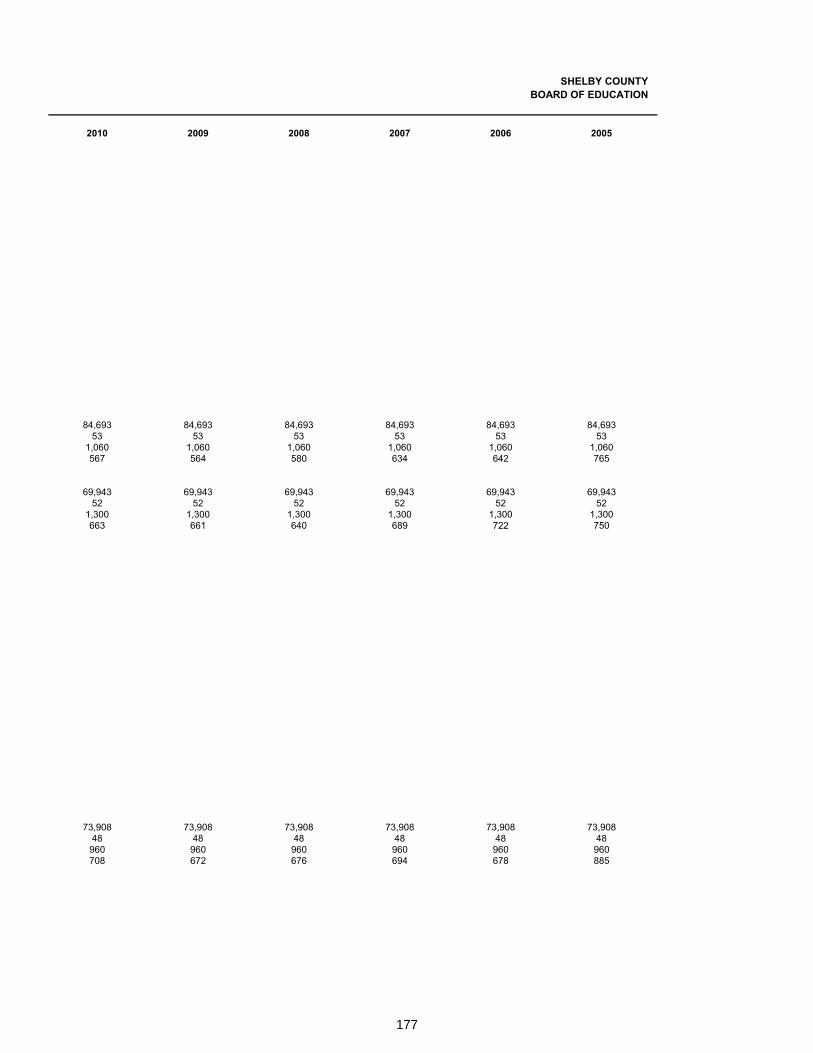
177
SHELBY COUNTY BOARD OF EDUCATION
2010 2009 2008 2007 2006 2005
84,693 84,693 84,693 84,693 84,693 84,69353 53 53 53 53 53
1,060 1,060 1,060 1,060 1,060 1,060567 564 580 634 642 765
69,943 69,943 69,943 69,943 69,943 69,94352 52 52 52 52 52
1,300 1,300 1,300 1,300 1,300 1,300663 661 640 689 722 750
73,908 73,908 73,908 73,908 73,908 73,90848 48 48 48 48 48960 960 960 960 960 960708 672 676 694 678 885

178
STATISTICAL AND OTHER INFORMATION (UNAUDITED)OPERATING INFORMATIONSummary of Buildings and SitesLast ten fiscal years ending June 30
School/Building 2014 2013 2012 2011
Florida-Kansas ES (1999)Square Feet 80,610Classrooms 47Design Capacity 940Enrollment 303
Ford Road ES (1952)Square Feet 78,213Classrooms 45Design Capacity 900Enrollment 476
Fox Meadows ES (1965)Square Feet 93,872Classrooms 46Design Capacity 920Enrollment 650
Frayser ES (1954) ASD SchoolSquare Feet 42,797Classrooms 26Design Capacity ASD SchoolEnrollment ASD School
Frayser HS (1938)Square Feet 189,648Classrooms 59Design Capacity 1,421Enrollment 548
Gardenview ES (1967)Square Feet 55,570Classrooms 35Design Capacity 714Enrollment 306
Geeter MS (1961)Square Feet 105,957Classrooms 36Design Capacity 898Enrollment 376
Georgia Avenue ES (1960)Square Feet 143,577Classrooms 72Design Capacity Not Available Enrollment Closed School
Georgian Hills ES (1951) ASD SchoolSquare Feet 44,786Classrooms 24Design Capacity ASD SchoolEnrollment ASD School
Georgian Hills MS (1959)Square Feet 87,069Classrooms 26Design Capacity 649Enrollment 323
Germanshire ES (2001)Square Feet 89,228Classrooms 46Design Capacity 920Enrollment 694
Germantown ES (1975)Square Feet 84,584 84,584 84,584 84,584Classrooms 42 42 42 42Design Capacity 920 840 840 840Enrollment 755 759 749 791
Continued from Prior Page

179
SHELBY COUNTY BOARD OF EDUCATION
2010 2009 2008 2007 2006 2005
84,584 84,584 84,584 84,584 84,584 84,58442 42 42 42 42 42840 840 840 840 840 840709 740 755 729 634 652
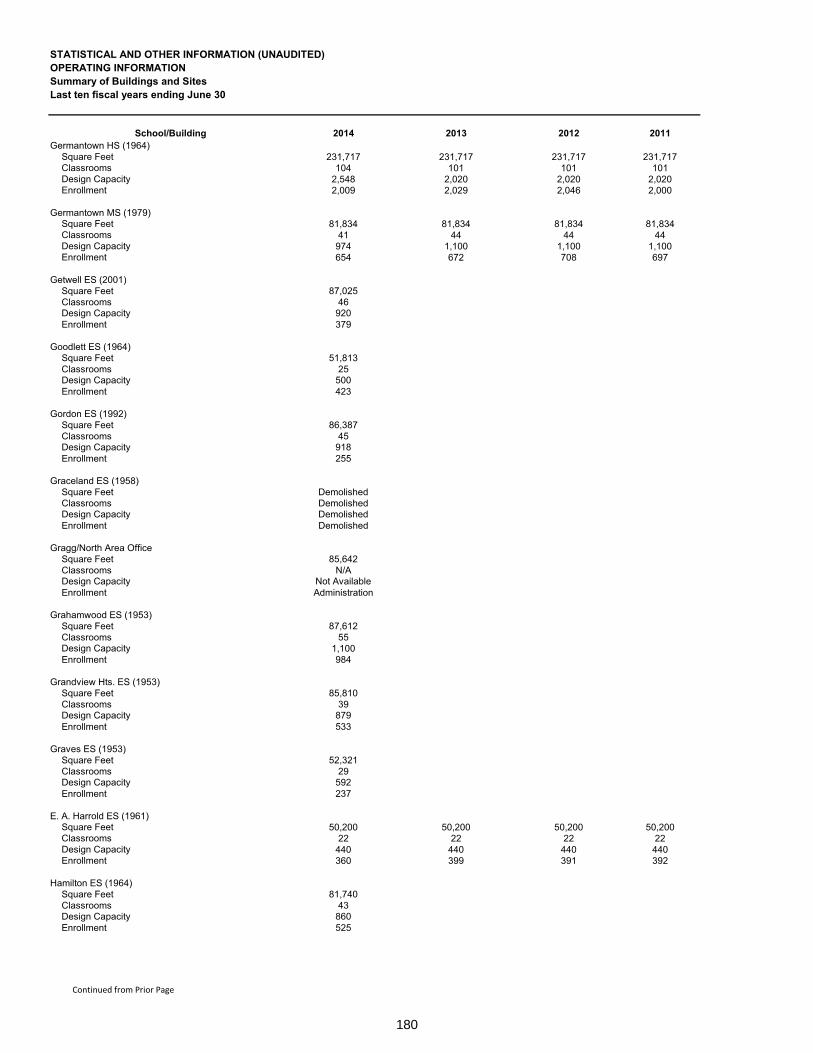
180
STATISTICAL AND OTHER INFORMATION (UNAUDITED)OPERATING INFORMATIONSummary of Buildings and SitesLast ten fiscal years ending June 30
School/Building 2014 2013 2012 2011Germantown HS (1964)
Square Feet 231,717 231,717 231,717 231,717Classrooms 104 101 101 101Design Capacity 2,548 2,020 2,020 2,020Enrollment 2,009 2,029 2,046 2,000
Germantown MS (1979)Square Feet 81,834 81,834 81,834 81,834Classrooms 41 44 44 44Design Capacity 974 1,100 1,100 1,100Enrollment 654 672 708 697
Getwell ES (2001)Square Feet 87,025Classrooms 46Design Capacity 920Enrollment 379
Goodlett ES (1964) Square Feet 51,813Classrooms 25Design Capacity 500Enrollment 423
Gordon ES (1992)Square Feet 86,387Classrooms 45Design Capacity 918Enrollment 255
Graceland ES (1958)Square Feet DemolishedClassrooms DemolishedDesign Capacity DemolishedEnrollment Demolished
Gragg/North Area OfficeSquare Feet 85,642Classrooms N/ADesign Capacity Not AvailableEnrollment Administration
Grahamwood ES (1953)Square Feet 87,612Classrooms 55Design Capacity 1,100Enrollment 984
Grandview Hts. ES (1953)Square Feet 85,810Classrooms 39Design Capacity 879Enrollment 533
Graves ES (1953)Square Feet 52,321Classrooms 29Design Capacity 592Enrollment 237
E. A. Harrold ES (1961)Square Feet 50,200 50,200 50,200 50,200Classrooms 22 22 22 22Design Capacity 440 440 440 440Enrollment 360 399 391 392
Hamilton ES (1964)Square Feet 81,740Classrooms 43Design Capacity 860Enrollment 525
Continued from Prior Page
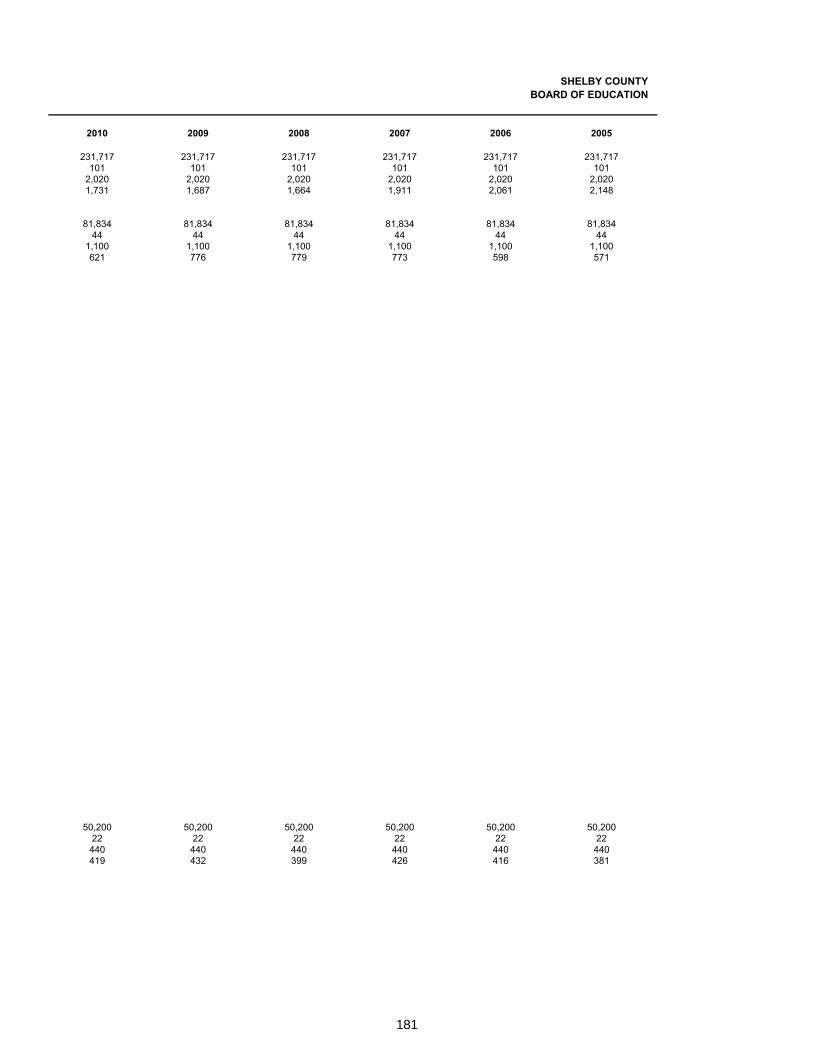
181
SHELBY COUNTY BOARD OF EDUCATION
2010 2009 2008 2007 2006 2005
231,717 231,717 231,717 231,717 231,717 231,717101 101 101 101 101 101
2,020 2,020 2,020 2,020 2,020 2,0201,731 1,687 1,664 1,911 2,061 2,148
81,834 81,834 81,834 81,834 81,834 81,83444 44 44 44 44 44
1,100 1,100 1,100 1,100 1,100 1,100621 776 779 773 598 571
50,200 50,200 50,200 50,200 50,200 50,20022 22 22 22 22 22440 440 440 440 440 440419 432 399 426 416 381

182
STATISTICAL AND OTHER INFORMATION (UNAUDITED)OPERATING INFORMATIONSummary of Buildings and SitesLast ten fiscal years ending June 30
School/Building 2014 2013 2012 2011Hamilton HS (1972)
Square Feet 336,151Classrooms 74Design Capacity 1,928Enrollment 808
Hamilton MS (1942)Square Feet 136,797Classrooms 64Design Capacity 413Enrollment 252
Hanley ES (1960) ASD SchoolSquare Feet 104,224Classrooms 57Design Capacity ASD SchoolEnrollment ASD School
Havenview MS (1960)Square Feet 104,745Classrooms 44Design Capacity 1,045Enrollment 792
Hawkins Mill ES (1965)Square Feet 67,350Classrooms 36Design Capacity 720Enrollment 326
Hickory Ridge ES (2001)Square Feet 83,060Classrooms 46Design Capacity 920Enrollment 799
Hickory Ridge MS (2001)Square Feet 139,685Classrooms 47Design Capacity 1,116Enrollment 814
Highland Oaks ES (1993)Square Feet 107,971 107,971 107,971 107,971Classrooms 66 66 66 66Design Capacity 1,260 1,320 1,320 1,320Enrollment 941 984 960 1,046
Highland Oaks MS (2009)Square Feet 118,130 118,130 118,130 118,130Classrooms 55 57 57 57Design Capacity 1,306 1,425 1,425 1,425Enrollment 835 895 947 952
Hillcrest HS (1962)Square Feet 169,973Classrooms 59Design Capacity 1,537Enrollment 561
Hollywood ES (1933)Square Feet 67,804Classrooms 34Design Capacity Not AvailableEnrollment Charter School
Holmes Road ES (2001)Square Feet 84,633Classrooms 46Design Capacity 920Enrollment 521
Continued from Prior Page
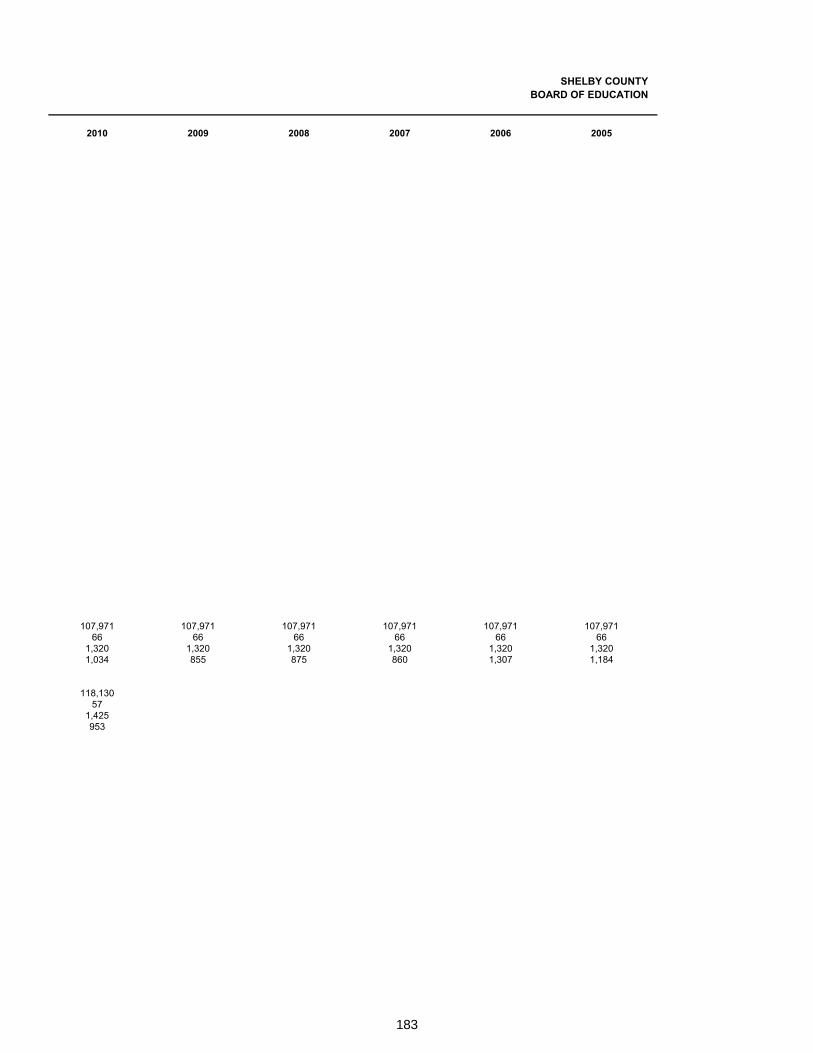
183
SHELBY COUNTY BOARD OF EDUCATION
2010 2009 2008 2007 2006 2005
107,971 107,971 107,971 107,971 107,971 107,97166 66 66 66 66 66
1,320 1,320 1,320 1,320 1,320 1,3201,034 855 875 860 1,307 1,184
118,13057
1,425953
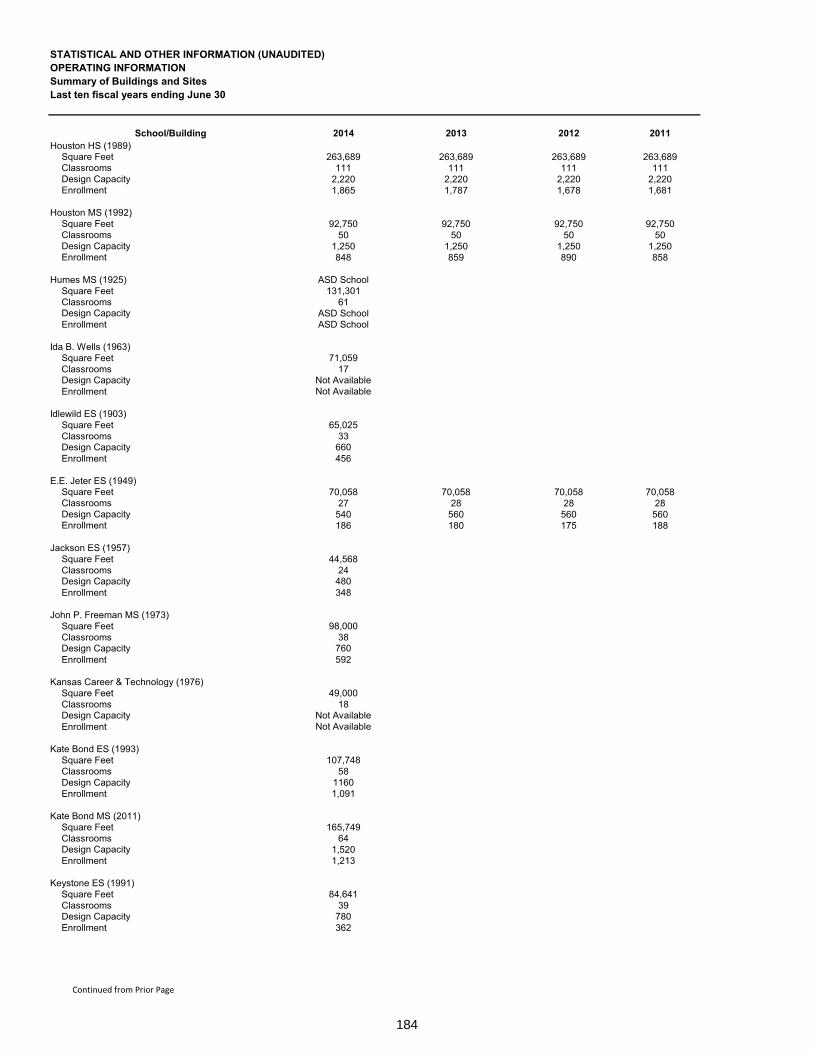
184
STATISTICAL AND OTHER INFORMATION (UNAUDITED)OPERATING INFORMATIONSummary of Buildings and SitesLast ten fiscal years ending June 30
School/Building 2014 2013 2012 2011Houston HS (1989)
Square Feet 263,689 263,689 263,689 263,689Classrooms 111 111 111 111Design Capacity 2,220 2,220 2,220 2,220Enrollment 1,865 1,787 1,678 1,681
Houston MS (1992)Square Feet 92,750 92,750 92,750 92,750Classrooms 50 50 50 50Design Capacity 1,250 1,250 1,250 1,250Enrollment 848 859 890 858
Humes MS (1925) ASD SchoolSquare Feet 131,301Classrooms 61Design Capacity ASD SchoolEnrollment ASD School
Ida B. Wells (1963)Square Feet 71,059Classrooms 17Design Capacity Not AvailableEnrollment Not Available
Idlewild ES (1903)Square Feet 65,025Classrooms 33Design Capacity 660Enrollment 456
E.E. Jeter ES (1949)Square Feet 70,058 70,058 70,058 70,058Classrooms 27 28 28 28Design Capacity 540 560 560 560Enrollment 186 180 175 188
Jackson ES (1957)Square Feet 44,568Classrooms 24Design Capacity 480Enrollment 348
John P. Freeman MS (1973)Square Feet 98,000Classrooms 38Design Capacity 760Enrollment 592
Kansas Career & Technology (1976)Square Feet 49,000Classrooms 18Design Capacity Not AvailableEnrollment Not Available
Kate Bond ES (1993)Square Feet 107,748Classrooms 58Design Capacity 1160Enrollment 1,091
Kate Bond MS (2011)Square Feet 165,749Classrooms 64Design Capacity 1,520Enrollment 1,213
Keystone ES (1991)Square Feet 84,641Classrooms 39Design Capacity 780Enrollment 362
Continued from Prior Page

185
SHELBY COUNTY BOARD OF EDUCATION
2010 2009 2008 2007 2006 2005
263,689 263,689 263,689 263,689 263,689 263,689111 111 111 111 111 111
2,220 2,220 2,220 2,220 2,220 2,2201,761 1,953 2,146 2,428 2,340 2,161
92,750 92,750 92,750 92,750 92,750 92,75050 50 50 50 50 50
1,250 1,250 1,250 1,250 1,250 1,250848 803 789 858 927 934
70,058 70,058 70,058 70,058 70,058 70,05828 28 28 28 28 28560 560 560 560 560 560212 213 226 238 230 223
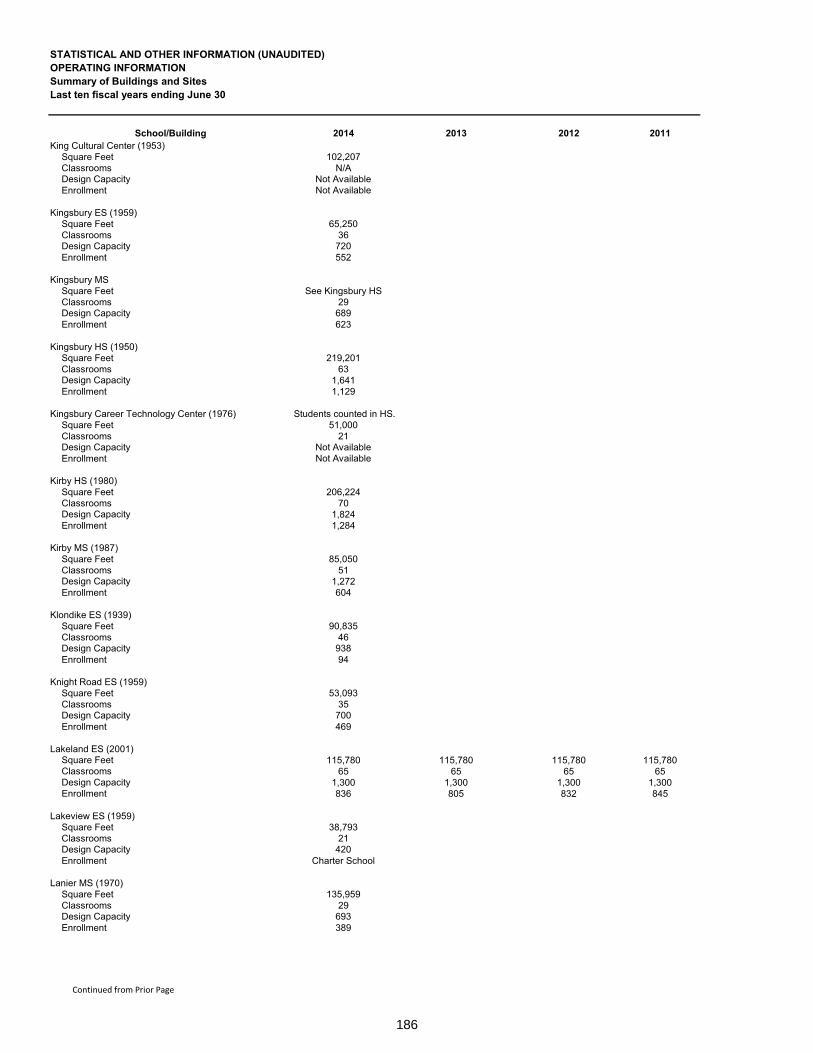
186
STATISTICAL AND OTHER INFORMATION (UNAUDITED)OPERATING INFORMATIONSummary of Buildings and SitesLast ten fiscal years ending June 30
School/Building 2014 2013 2012 2011King Cultural Center (1953)
Square Feet 102,207Classrooms N/ADesign Capacity Not AvailableEnrollment Not Available
Kingsbury ES (1959)Square Feet 65,250Classrooms 36Design Capacity 720Enrollment 552
Kingsbury MSSquare Feet See Kingsbury HSClassrooms 29Design Capacity 689Enrollment 623
Kingsbury HS (1950)Square Feet 219,201Classrooms 63Design Capacity 1,641Enrollment 1,129
Kingsbury Career Technology Center (1976) Students counted in HS.Square Feet 51,000Classrooms 21Design Capacity Not AvailableEnrollment Not Available
Kirby HS (1980)Square Feet 206,224Classrooms 70Design Capacity 1,824Enrollment 1,284
Kirby MS (1987)Square Feet 85,050Classrooms 51Design Capacity 1,272Enrollment 604
Klondike ES (1939)Square Feet 90,835Classrooms 46Design Capacity 938Enrollment 94
Knight Road ES (1959)Square Feet 53,093Classrooms 35Design Capacity 700Enrollment 469
Lakeland ES (2001)Square Feet 115,780 115,780 115,780 115,780Classrooms 65 65 65 65Design Capacity 1,300 1,300 1,300 1,300Enrollment 836 805 832 845
Lakeview ES (1959)Square Feet 38,793Classrooms 21Design Capacity 420Enrollment Charter School
Lanier MS (1970)Square Feet 135,959Classrooms 29Design Capacity 693Enrollment 389
Continued from Prior Page
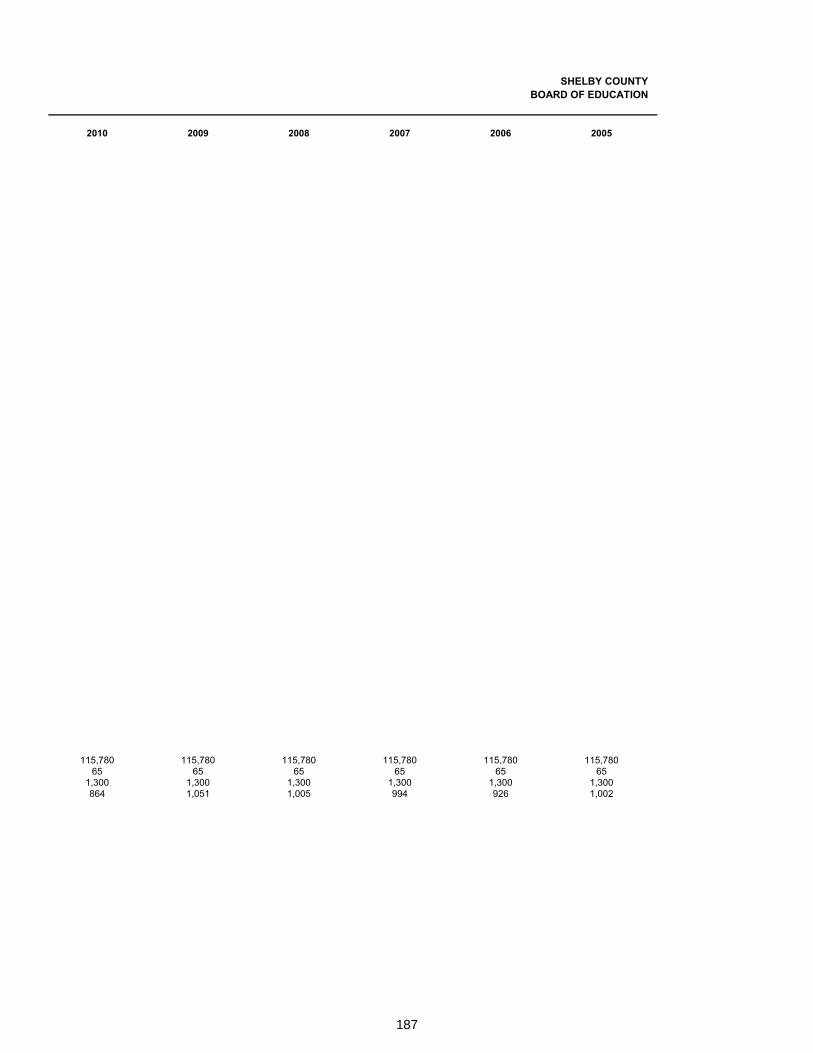
187
SHELBY COUNTY BOARD OF EDUCATION
2010 2009 2008 2007 2006 2005
115,780 115,780 115,780 115,780 115,780 115,78065 65 65 65 65 65
1,300 1,300 1,300 1,300 1,300 1,300864 1,051 1,005 994 926 1,002

188
STATISTICAL AND OTHER INFORMATION (UNAUDITED)OPERATING INFORMATIONSummary of Buildings and SitesLast ten fiscal years ending June 30
School/Building 2014 2013 2012 2011Larose ES (1963)
Square Feet 94,426Classrooms 34Design Capacity 680Enrollment 392
Lester ES (1955)Square Feet 107,896Classrooms 45Design Capacity 1130Enrollment 257
Levi ES (1992)Square Feet 71,179Classrooms 31Design Capacity 620Enrollment 340
Lincoln ES (1923)Square Feet 80,080Classrooms 39Design Capacity 620Enrollment 255
Lincoln MS (1922)Square Feet DemolishedClassrooms DemolishedDesign Capacity DemolishedEnrollment Demolished
Locke Elementary (1953)Square Feet DemolishedClassrooms DemolishedDesign Capacity DemolishedEnrollment Demolished
Longview MS (1954)Square Feet 76,211Classrooms 33Design Capacity Not AvailableEnrollment Closed
Lowrance ES (1995) School name changed from Southwind MS to Lowrance ES in 2010.Square Feet 112,374 112,374 112,374 112,374Classrooms 62 65 65 65Design Capacity 1,240 1,300 1,300 1,300Enrollment 912 897 896 896
Lucie E. Campbell ES (2003)Square Feet 84,740Classrooms 46Design Capacity 920Enrollment 352
Lucy ES (1921)Square Feet 102,446 102,446 102,446 102,446Classrooms 49 48 48 48Design Capacity 980 960 960 960Enrollment 686 687 630 558
Macon ES (1955)Square Feet 33,051Classrooms 17Design Capacity Not AvailableEnrollment Closed
Macon Hall ES (1997)Square Feet 10,481 93,481 93,481 93,481Classrooms 63 66 66 66Design Capacity 1,260 1,320 1,320 1,320Enrollment 1,208 1,151 1,148 1,188
Continued from Prior Page

189
SHELBY COUNTY BOARD OF EDUCATION
2010 2009 2008 2007 2006 2005
112,37465
1,300895
102,446 102,446 102,446 102,446 102,446 102,44648 48 48 48 48 48960 960 960 960 960 960554 570 580 586 631 507
93,481 93,481 93,481 93,481 93,481 93,48166 66 66 66 66 66
1,320 1,320 1,320 1,320 1,320 1,3201,110 1,065 1,051 1,018 1,146 1,047
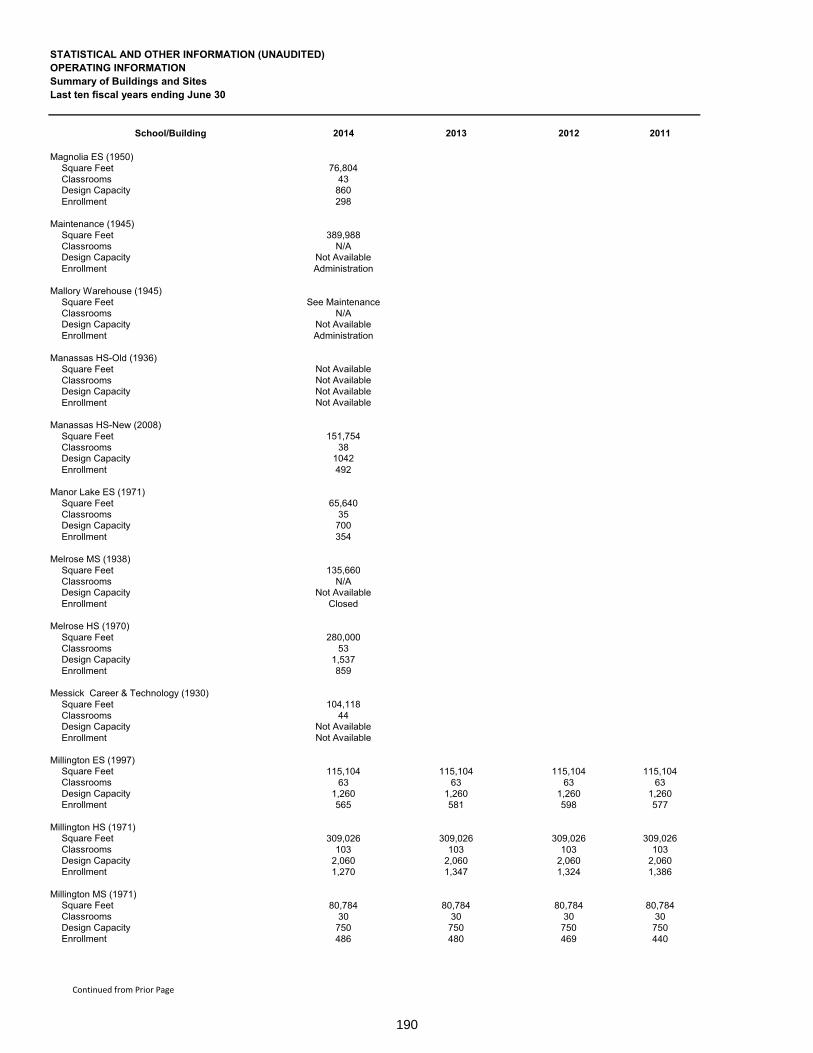
190
STATISTICAL AND OTHER INFORMATION (UNAUDITED)OPERATING INFORMATIONSummary of Buildings and SitesLast ten fiscal years ending June 30
School/Building 2014 2013 2012 2011
Magnolia ES (1950)Square Feet 76,804Classrooms 43Design Capacity 860Enrollment 298
Maintenance (1945)Square Feet 389,988Classrooms N/ADesign Capacity Not AvailableEnrollment Administration
Mallory Warehouse (1945)Square Feet See MaintenanceClassrooms N/ADesign Capacity Not AvailableEnrollment Administration
Manassas HS-Old (1936)Square Feet Not AvailableClassrooms Not AvailableDesign Capacity Not AvailableEnrollment Not Available
Manassas HS-New (2008)Square Feet 151,754Classrooms 38Design Capacity 1042Enrollment 492
Manor Lake ES (1971)Square Feet 65,640Classrooms 35Design Capacity 700Enrollment 354
Melrose MS (1938)Square Feet 135,660Classrooms N/ADesign Capacity Not AvailableEnrollment Closed
Melrose HS (1970)Square Feet 280,000Classrooms 53Design Capacity 1,537Enrollment 859
Messick Career & Technology (1930)Square Feet 104,118Classrooms 44Design Capacity Not AvailableEnrollment Not Available
Millington ES (1997)Square Feet 115,104 115,104 115,104 115,104Classrooms 63 63 63 63Design Capacity 1,260 1,260 1,260 1,260Enrollment 565 581 598 577
Millington HS (1971)Square Feet 309,026 309,026 309,026 309,026Classrooms 103 103 103 103Design Capacity 2,060 2,060 2,060 2,060Enrollment 1,270 1,347 1,324 1,386
Millington MS (1971)Square Feet 80,784 80,784 80,784 80,784Classrooms 30 30 30 30Design Capacity 750 750 750 750Enrollment 486 480 469 440
Continued from Prior Page

191
SHELBY COUNTY BOARD OF EDUCATION
2010 2009 2008 2007 2006 2005
115,104 115,104 115,104 115,104 115,104 115,10463 63 63 63 63 63
1,260 1,260 1,260 1,260 1,260 1,260625 617 638 679 782 769
309,026 309,026 309,026 309,026 309,026 309,026103 103 103 103 103 103
2,060 2,060 2,060 2,060 2,060 2,0601,456 1,522 1,625 1,580 1,688 1,560
80,784 80,784 80,784 80,784 80,784 80,78430 30 30 30 30 30750 750 750 750 750 750510 505 556 566 635 607
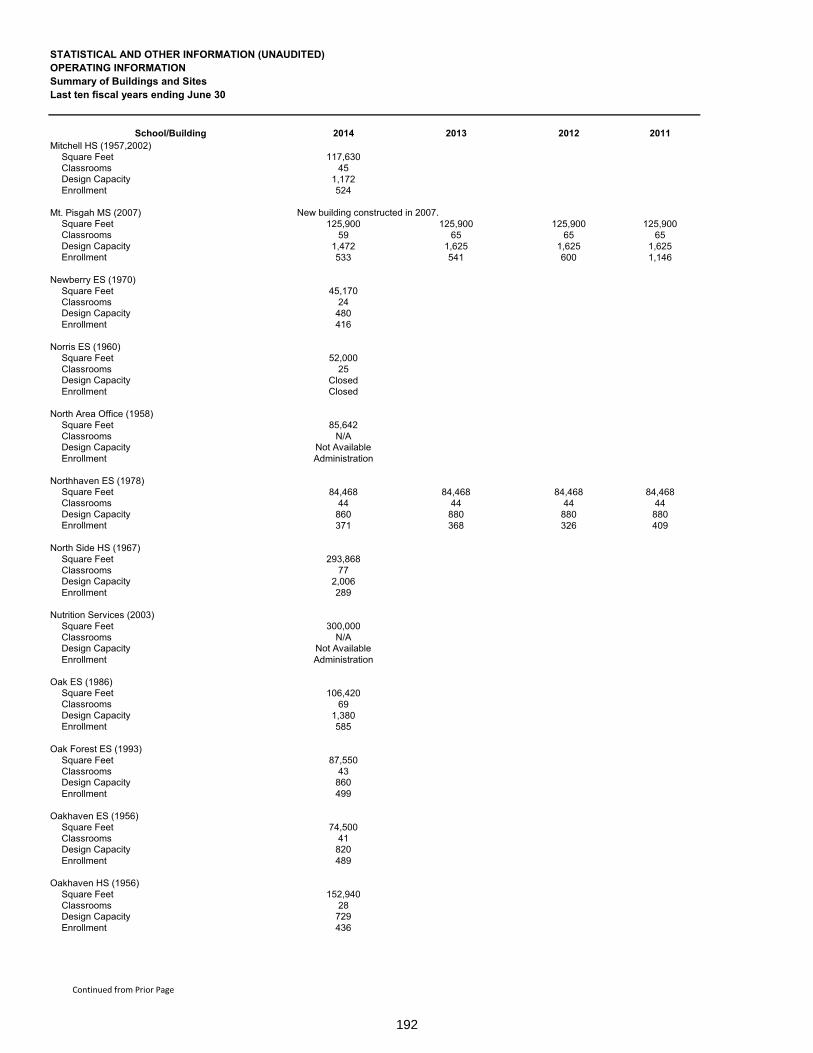
192
STATISTICAL AND OTHER INFORMATION (UNAUDITED)OPERATING INFORMATIONSummary of Buildings and SitesLast ten fiscal years ending June 30
School/Building 2014 2013 2012 2011Mitchell HS (1957,2002)
Square Feet 117,630Classrooms 45Design Capacity 1,172Enrollment 524
Mt. Pisgah MS (2007) New building constructed in 2007.Square Feet 125,900 125,900 125,900 125,900Classrooms 59 65 65 65Design Capacity 1,472 1,625 1,625 1,625Enrollment 533 541 600 1,146
Newberry ES (1970)Square Feet 45,170Classrooms 24Design Capacity 480Enrollment 416
Norris ES (1960)Square Feet 52,000Classrooms 25Design Capacity ClosedEnrollment Closed
North Area Office (1958)Square Feet 85,642Classrooms N/ADesign Capacity Not AvailableEnrollment Administration
Northhaven ES (1978)Square Feet 84,468 84,468 84,468 84,468Classrooms 44 44 44 44Design Capacity 860 880 880 880Enrollment 371 368 326 409
North Side HS (1967)Square Feet 293,868Classrooms 77Design Capacity 2,006Enrollment 289
Nutrition Services (2003)Square Feet 300,000Classrooms N/ADesign Capacity Not AvailableEnrollment Administration
Oak ES (1986)Square Feet 106,420Classrooms 69Design Capacity 1,380Enrollment 585
Oak Forest ES (1993)Square Feet 87,550Classrooms 43Design Capacity 860Enrollment 499
Oakhaven ES (1956)Square Feet 74,500Classrooms 41Design Capacity 820Enrollment 489
Oakhaven HS (1956)Square Feet 152,940Classrooms 28Design Capacity 729Enrollment 436
Continued from Prior Page

193
SHELBY COUNTY BOARD OF EDUCATION
2010 2009 2008 2007 2006 2005
125,900 125,900 125,900 125,900 125,900 125,90065 65 65 65 65 65
1,625 1,625 1,625 1,625 1,625 1,6251,288 1,232 1,242 1,262 1,250 1,125
84,468 84,468 84,468 84,468 84,468 84,46844 44 44 44 44 44880 880 880 880 880 880424 450 455 495 550 586
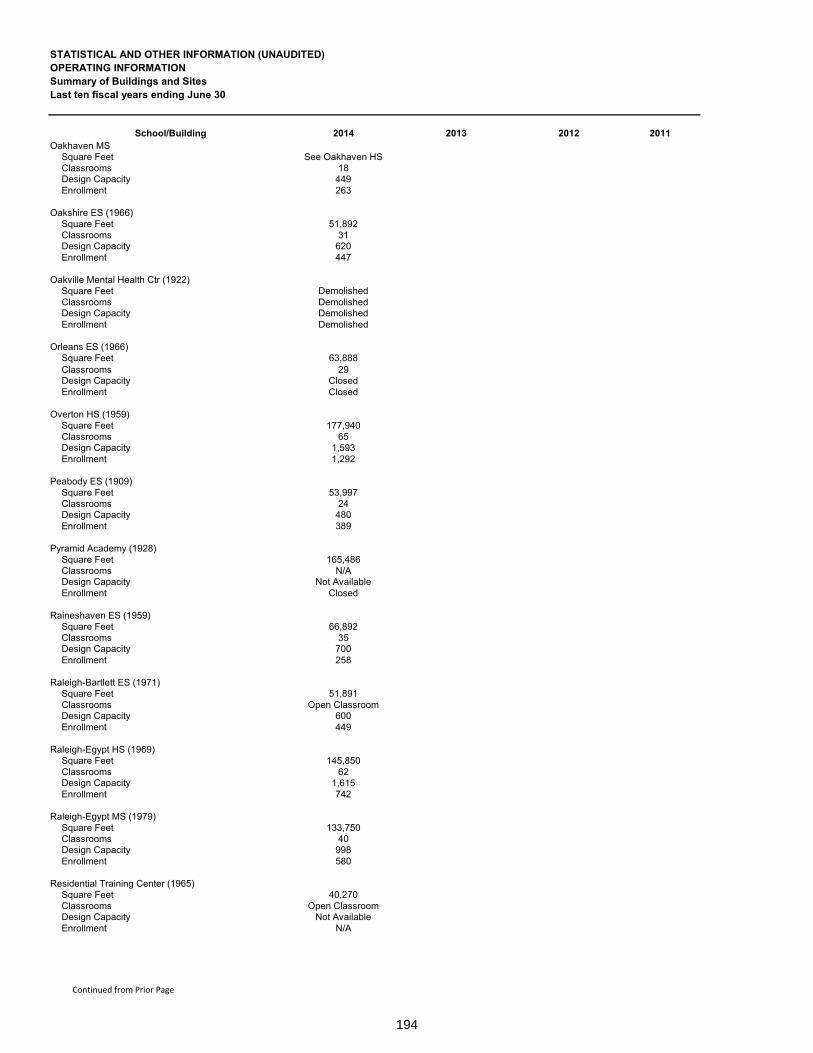
194
STATISTICAL AND OTHER INFORMATION (UNAUDITED)OPERATING INFORMATIONSummary of Buildings and SitesLast ten fiscal years ending June 30
School/Building 2014 2013 2012 2011Oakhaven MS
Square Feet See Oakhaven HSClassrooms 18Design Capacity 449Enrollment 263
Oakshire ES (1966)Square Feet 51,892Classrooms 31Design Capacity 620Enrollment 447
Oakville Mental Health Ctr (1922)Square Feet DemolishedClassrooms DemolishedDesign Capacity DemolishedEnrollment Demolished
Orleans ES (1966)Square Feet 63,888Classrooms 29Design Capacity ClosedEnrollment Closed
Overton HS (1959)Square Feet 177,940Classrooms 65Design Capacity 1,593Enrollment 1,292
Peabody ES (1909)Square Feet 53,997Classrooms 24Design Capacity 480Enrollment 389
Pyramid Academy (1928)Square Feet 165,486Classrooms N/ADesign Capacity Not AvailableEnrollment Closed
Raineshaven ES (1959)Square Feet 66,892Classrooms 35Design Capacity 700Enrollment 258
Raleigh-Bartlett ES (1971)Square Feet 51,891Classrooms Open ClassroomDesign Capacity 600Enrollment 449
Raleigh-Egypt HS (1969)Square Feet 145,850Classrooms 62Design Capacity 1,615Enrollment 742
Raleigh-Egypt MS (1979)Square Feet 133,750Classrooms 40Design Capacity 998Enrollment 580
Residential Training Center (1965)Square Feet 40,270Classrooms Open ClassroomDesign Capacity Not AvailableEnrollment N/A
Continued from Prior Page

195
SHELBY COUNTY BOARD OF EDUCATION
2010 2009 2008 2007 2006 2005

196
STATISTICAL AND OTHER INFORMATION (UNAUDITED)OPERATING INFORMATIONSummary of Buildings and SitesLast ten fiscal years ending June 30
School/Building 2014 2013 2012 2011Richland ES (1957)
Square Feet 59,833Classrooms 36Design Capacity 720Enrollment 783
Ridgeway/Balmoral ES (1970)Square Feet 38,940Classrooms 20Design Capacity 400Enrollment 319
Ridgeway ES (1969)Square Feet Merged with BalmoralClassrooms Merged with BalmoralDesign Capacity Merged with BalmoralEnrollment Merged with Balmoral
Ridgeway HS (1970)Square Feet 247,000Classrooms 60Design Capacity 1,563Enrollment 1,072
Ridgeway MS (2001)Square Feet 143,000Classrooms 47Design Capacity 1,116Enrollment 700
River City HighSquare Feet ClosedClassrooms ClosedDesign Capacity ClosedEnrollment Closed
Rivercrest ES (1998)Square Feet 109,536 109,536 109,536 109,536Classrooms 64 64 64 64Design Capacity 1,280 1,280 1,280 1,280Enrollment 615 654 695 912
Riverdale ES (1968)Square Feet 88,199 88,199 88,199 88,199Classrooms 45 45 45 45Design Capacity 900 900 900 900Enrollment 1,178 1,185 1,174 1,147
Riverview ES (1952)Square Feet 69,422Classrooms 45Design Capacity 900Enrollment 291
Riverview MS (1967)Square Feet 150,850Classrooms 35Design Capacity 780Enrollment 159
Riverwood ES (2010)Square Feet 107,565Classrooms 56Design Capacity 1,120Enrollment 1,022
Robert R. Church ES (2001)Square Feet 81,500Classrooms 45Design Capacity 900Enrollment 688
Continued from Prior Page

197
SHELBY COUNTY BOARD OF EDUCATION
2010 2009 2008 2007 2006 2005
109,536 109,536 109,536 109,536 109,536 109,53664 64 64 64 64 64
1,280 1,280 1,280 1,280 1,280 1,280978 1,025 1,035 965 941 1,102
88,199 88,199 88,199 88,199 88,199 88,19945 45 45 45 45 45900 900 900 900 900 900
1,085 1,076 1,034 1,039 1,009 1,009

198
STATISTICAL AND OTHER INFORMATION (UNAUDITED)OPERATING INFORMATIONSummary of Buildings and SitesLast ten fiscal years ending June 30
School/Building 2014 2013 2012 2011Ross ES (1976)
Square Feet 126,662Classrooms 71Design Capacity 1,420Enrollment 961
Rozelle ES (1914)Square Feet 58,750Classrooms 27Design Capacity 540Enrollment 263
Sea Isle ES (1955)Square Feet 79,703Classrooms 42Design Capacity 840Enrollment 444
Scenic Hills ES (1957)Square Feet 48,338Classrooms 27Design Capacity 540Enrollment 382
Schilling Farms MS (1999)Square Feet 97,250 97,250 97,250 97,250Classrooms 48 48 48 48Design Capacity 1,200 1,200 1,200 1,200Enrollment 990 1,004 1,044 1,077
Shadowlawn MS (1967)Square Feet 119,881 108,936 108,936 108,936Classrooms 57 57 57 57Design Capacity 1,425 1,425 1,425 1,425Enrollment Not Available 855 904 909
Shady Grove ES (1963)Square Feet 48,401Classrooms 25Design Capacity 500Enrollment 448
Shannon ES (1959)Square Feet 54,522Classrooms 34Design Capacity 694Enrollment 179
Sharpe ES (1955)Square Feet 47,130Classrooms 26Design Capacity 520Enrollment 496
Sheffield ES (1970)Square Feet 46,320Classrooms 31Design Capacity 620Enrollment 555
Sheffield HS (1966)Square Feet 193,236Classrooms 55Design Capacity 1,407Enrollment 828
Sheffield Career & Technology (1976)Square Feet 47,000Classrooms 21Design Capacity Not AvailableEnrollment Not Available
Continued from Prior Page
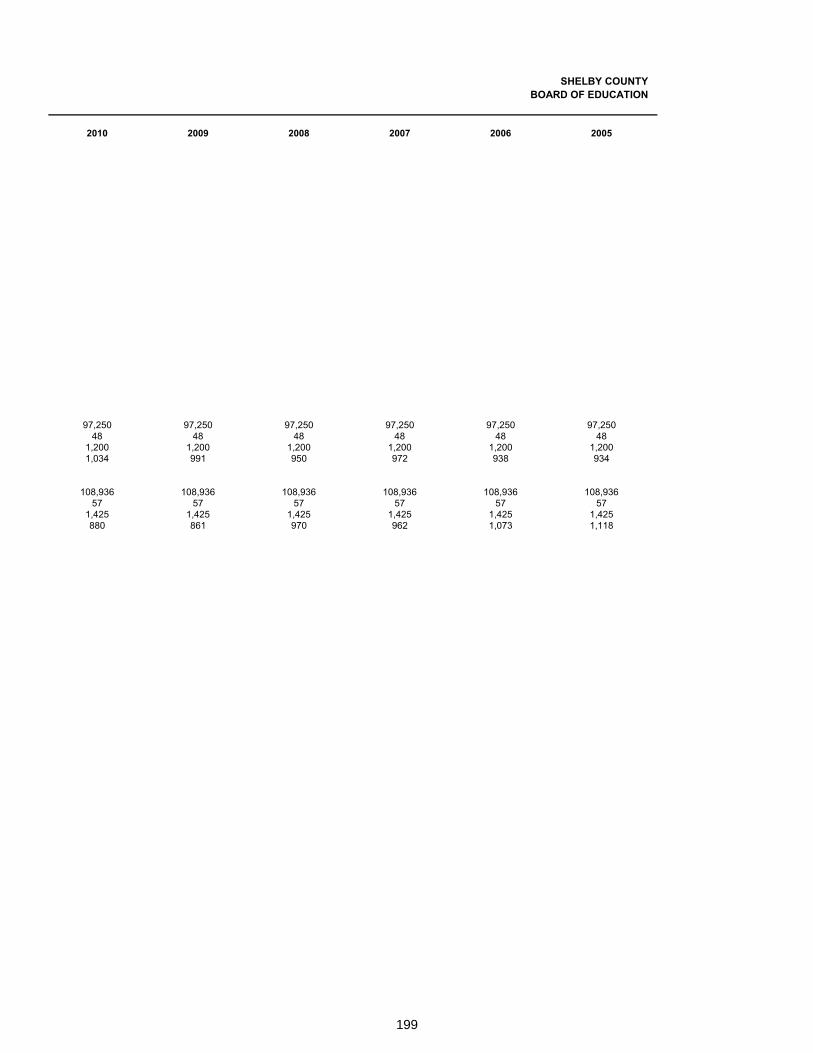
199
SHELBY COUNTY BOARD OF EDUCATION
2010 2009 2008 2007 2006 2005
97,250 97,250 97,250 97,250 97,250 97,25048 48 48 48 48 48
1,200 1,200 1,200 1,200 1,200 1,2001,034 991 950 972 938 934
108,936 108,936 108,936 108,936 108,936 108,93657 57 57 57 57 57
1,425 1,425 1,425 1,425 1,425 1,425880 861 970 962 1,073 1,118
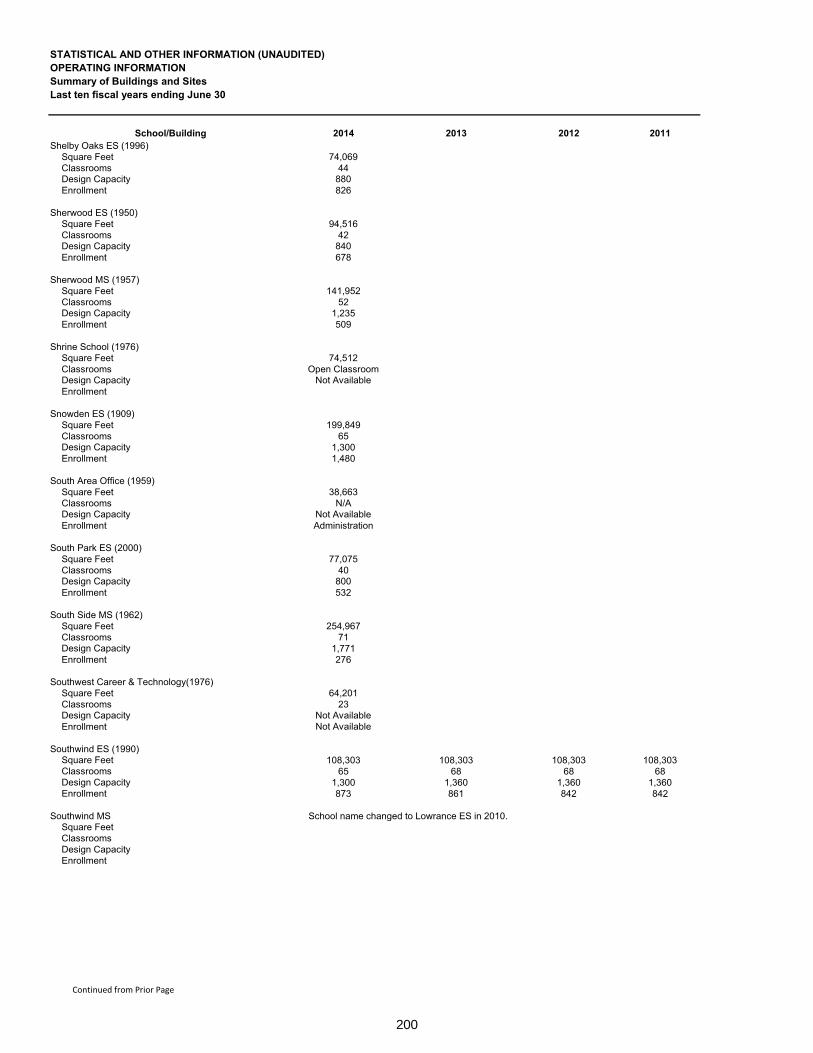
200
STATISTICAL AND OTHER INFORMATION (UNAUDITED)OPERATING INFORMATIONSummary of Buildings and SitesLast ten fiscal years ending June 30
School/Building 2014 2013 2012 2011Shelby Oaks ES (1996)
Square Feet 74,069Classrooms 44Design Capacity 880Enrollment 826
Sherwood ES (1950)Square Feet 94,516Classrooms 42Design Capacity 840Enrollment 678
Sherwood MS (1957)Square Feet 141,952Classrooms 52Design Capacity 1,235Enrollment 509
Shrine School (1976)Square Feet 74,512Classrooms Open ClassroomDesign Capacity Not AvailableEnrollment
Snowden ES (1909)Square Feet 199,849Classrooms 65Design Capacity 1,300Enrollment 1,480
South Area Office (1959)Square Feet 38,663Classrooms N/ADesign Capacity Not AvailableEnrollment Administration
South Park ES (2000)Square Feet 77,075Classrooms 40Design Capacity 800Enrollment 532
South Side MS (1962)Square Feet 254,967Classrooms 71Design Capacity 1,771Enrollment 276
Southwest Career & Technology(1976)Square Feet 64,201Classrooms 23Design Capacity Not AvailableEnrollment Not Available
Southwind ES (1990)Square Feet 108,303 108,303 108,303 108,303Classrooms 65 68 68 68Design Capacity 1,300 1,360 1,360 1,360Enrollment 873 861 842 842
Southwind MS School name changed to Lowrance ES in 2010.Square FeetClassroomsDesign CapacityEnrollment
Continued from Prior Page

201
SHELBY COUNTY BOARD OF EDUCATION
2010 2009 2008 2007 2006 2005
108,303 108,303 108,303 108,303 108,303 108,30368 68 68 68 68 68
1,360 1,360 1,360 1,360 1,360 1,360819 1,127 1,126 1,055 1,161 1,136
112,374 112,374 112,374 112,374 112,37465 65 65 65 65
1,300 1,300 1,300 1,300 1,3001,082 1,197 1,139 1,239 1,102

202
STATISTICAL AND OTHER INFORMATION (UNAUDITED)OPERATING INFORMATIONSummary of Buildings and SitesLast ten fiscal years ending June 30
School/Building 2014 2013 2012 2011Southwind HS (2007)
Square Feet 326,926 326,926 326,926 326,926Classrooms 104 116 116 116Design Capacity 2,548 2,320 2,320 2,320Enrollment 1,777 1,698 1,690 1,931
Spring Hill ES (1956)Square Feet 65,698Classrooms 35Design Capacity 700Enrollment 370
Springdale ES (1940)Square Feet 58,986Classrooms 24Design Capacity 480Enrollment 284
Sycamore ES (2000)Square Feet 127,627 127,627 127,627 127,627Classrooms 64 64 64 64Design Capacity 1,280 1,280 1,280 1,280Enrollment 796 823 794 791
Stafford ES (1965)Square Feet 56,216Classrooms 30Design Capacity Not AvailableEnrollment Not Available
Tara Oaks ES (1995)Square Feet 109,405 109,405 109,405 109,405Classrooms 69 69 69 69Design Capacity 1,380 1,380 1,380 1,380Enrollment 659 682 729 745
Teaching & Learning Academy (1958)Square Feet 57,803Classrooms N/ADesign Capacity Not AvailableEnrollment Administration
Treadwell ES (1985)Square Feet 55,512Classrooms 45Design Capacity 900Enrollment 677
Treadwell MS (HS Prior to 2010) (1948)Square Feet 145,870Classrooms 40Design Capacity 998Enrollment 372
Trezevant HS (1960)Square Feet 296,765Classrooms 67Design Capacity 1,745Enrollment 615
Trezevant Career & Technology (1976)Square Feet 62,546Classrooms 27Design Capacity Not AvailableEnrollment Not Available
Vance MS (1971)Square Feet 150,300Classrooms 36Design Capacity 860Enrollment 159
Continued from Prior Page

203
SHELBY COUNTY BOARD OF EDUCATION
2010 2009 2008 2007 2006 2005
326,926 326,926 326,926116 116 116
2,320 2,320 2,3201,884 1,473 1,038
127,627 127,627 127,627 127,627 127,627 127,62764 64 64 64 64 64
1,280 1,280 1,280 1,280 1,280 1,280834 788 704 691 630 784
109,405 109,405 109,405 109,405 109,405 109,40569 69 69 69 69 69
1,380 1,380 1,380 1,380 1,380 1,380780 770 834 893 935 973
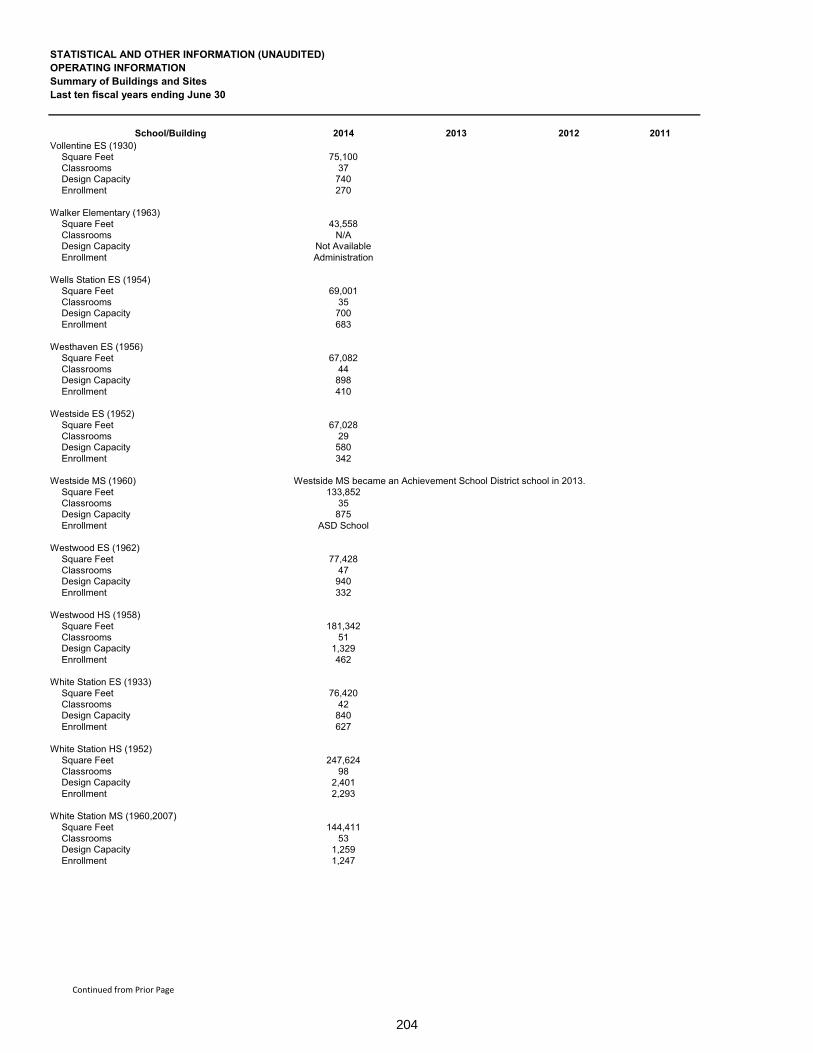
204
STATISTICAL AND OTHER INFORMATION (UNAUDITED)OPERATING INFORMATIONSummary of Buildings and SitesLast ten fiscal years ending June 30
School/Building 2014 2013 2012 2011Vollentine ES (1930)
Square Feet 75,100Classrooms 37Design Capacity 740Enrollment 270
Walker Elementary (1963)Square Feet 43,558Classrooms N/ADesign Capacity Not AvailableEnrollment Administration
Wells Station ES (1954)Square Feet 69,001Classrooms 35Design Capacity 700Enrollment 683
Westhaven ES (1956)Square Feet 67,082Classrooms 44Design Capacity 898Enrollment 410
Westside ES (1952)Square Feet 67,028Classrooms 29Design Capacity 580Enrollment 342
Westside MS (1960) Westside MS became an Achievement School District school in 2013.Square Feet 133,852Classrooms 35Design Capacity 875Enrollment ASD School
Westwood ES (1962)Square Feet 77,428Classrooms 47Design Capacity 940Enrollment 332
Westwood HS (1958)Square Feet 181,342Classrooms 51Design Capacity 1,329Enrollment 462
White Station ES (1933)Square Feet 76,420Classrooms 42Design Capacity 840Enrollment 627
White Station HS (1952)Square Feet 247,624Classrooms 98Design Capacity 2,401Enrollment 2,293
White Station MS (1960,2007)Square Feet 144,411Classrooms 53Design Capacity 1,259Enrollment 1,247
Continued from Prior Page

205
SHELBY COUNTY BOARD OF EDUCATION
2010 2009 2008 2007 2006 2005
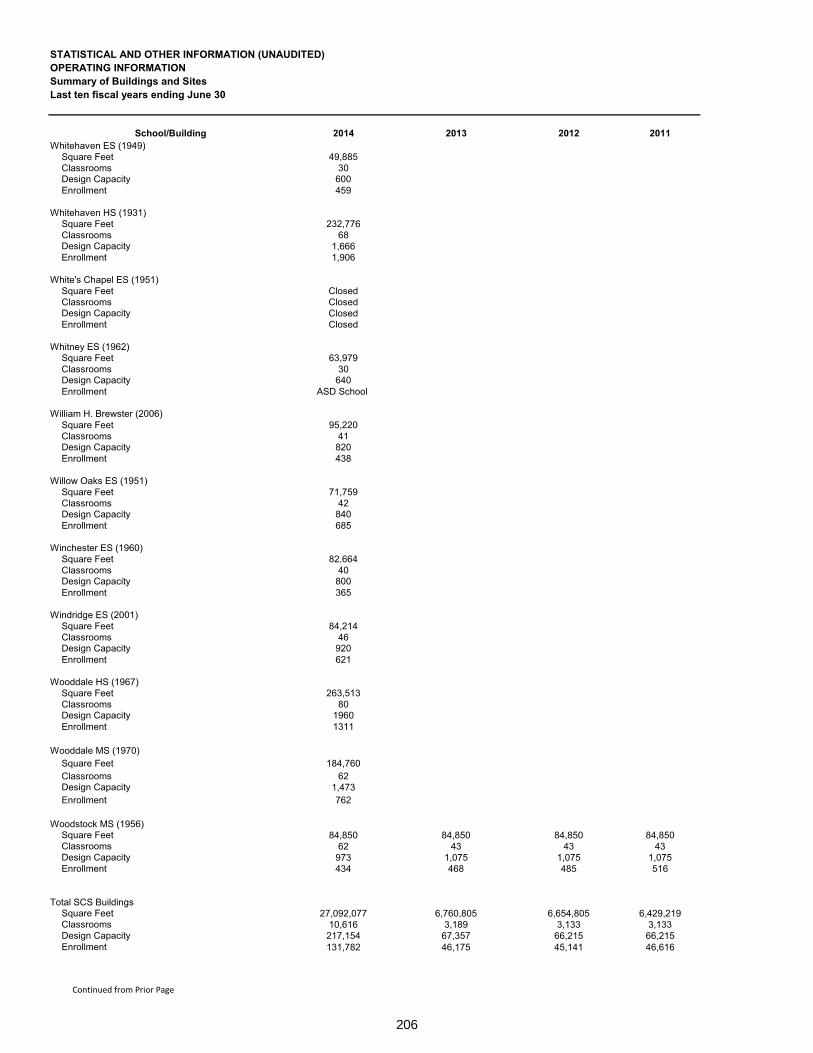
206
STATISTICAL AND OTHER INFORMATION (UNAUDITED)OPERATING INFORMATIONSummary of Buildings and SitesLast ten fiscal years ending June 30
School/Building 2014 2013 2012 2011Whitehaven ES (1949)
Square Feet 49,885Classrooms 30Design Capacity 600Enrollment 459
Whitehaven HS (1931)Square Feet 232,776Classrooms 68Design Capacity 1,666Enrollment 1,906
White's Chapel ES (1951)Square Feet ClosedClassrooms ClosedDesign Capacity ClosedEnrollment Closed
Whitney ES (1962)Square Feet 63,979Classrooms 30Design Capacity 640Enrollment ASD School
William H. Brewster (2006)Square Feet 95,220Classrooms 41Design Capacity 820Enrollment 438
Willow Oaks ES (1951)Square Feet 71,759Classrooms 42Design Capacity 840Enrollment 685
Winchester ES (1960)Square Feet 82,664Classrooms 40Design Capacity 800Enrollment 365
Windridge ES (2001)Square Feet 84,214Classrooms 46Design Capacity 920Enrollment 621
Wooddale HS (1967)Square Feet 263,513Classrooms 80Design Capacity 1960Enrollment 1311
Wooddale MS (1970)Square Feet 184,760Classrooms 62Design Capacity 1,473Enrollment 762
Woodstock MS (1956)Square Feet 84,850 84,850 84,850 84,850Classrooms 62 43 43 43Design Capacity 973 1,075 1,075 1,075Enrollment 434 468 485 516
Total SCS BuildingsSquare Feet 27,092,077 6,760,805 6,654,805 6,429,219Classrooms 10,616 3,189 3,133 3,133Design Capacity 217,154 67,357 66,215 66,215Enrollment 131,782 46,175 45,141 46,616
Continued from Prior Page

207
SHELBY COUNTY BOARD OF EDUCATION
2010 2009 2008 2007 2006 2005
84,850 84,850 84,850 84,850 84,850 84,85043 43 43 43 43 43
1,075 1,075 1,075 1,075 1,075 1,075520 553 562 637 692 695
6,429,219 6,197,887 6,086,445 5,759,519 5,759,519 5,535,1703,133 3,011 2,959 2,843 2,843 2,71666,215 63,490 62,190 59,870 59,870 57,33046,420 45,298 45,410 44,571 44,760 43,028

208
STATISTICAL AND OTHER INFORMATION (UNAUDITED)OPERATING INFORMATIONSummary of Buildings and SitesLast ten fiscal years ending June 30
School/Building 2014 2013 2012 2011
Schools on non-SCS property (enrollment) Campus Elementary 329 Hollis F. Price Middle College MCS Prep School - Southeast 197 Memphis Virtual School 93 Memphis Health Careers Academy 105 Middle College High (Relocated to Fairview in 2011) 198 Martin Luther King Transition Center 316 Alternative MS Alternative MS Highland Oaks Primary Students transferred to Highland Oaks ES in 2010.
Total non-SCS property (enrollment) 1,237 0 0 0
Charter Schools (enrollment) Arrow Academy of Excellence 29 Aurora Collegiate Academy 113 Circles of success 244 City University 314 City University Boys Prep 115 City University Girls Prep 37 DuBois Elementary School of Arts Technology 203 DuBois Elementary School of Entrepreneurship 179 DuBois High School of Arts Technology 74 DuBois Middle of Leadership Public Policy 104 DuBois Middle School of Arts Technology 140 Freedom Prep 367 KIPP Diamond (Became a charter school 2009) 846 KIPP Academy at Cypress 199 Memphis Academy of Health Sciences 311 Memphis Academy of Health Science High 389 Memphis Academy of Science & Engineering 360 Memphis Business Academy 428 Memphis Business Academy High 323 Memphis College Prep 212 Memphis Grizzlies Prep 157 Memphis School of Excellence 389 Memphis School Prep New Consortium of Law and Buisness 163 90 Omni Prep - North Pointe Lower 193 Omni Prep - North Pointe Middle 125 Power Center 605 Promise Academy 460 Soulsville Academy 588 Southern Avenue 364 Southern Avenue Middle 265 Star Academy 236 Thurgood Marshall High School 59 Thurgood Marshall Middle School 12 Veritas College Preparatory 192 Yo! Academy
Total Charter School Enrollments 8,795 90 0 0
District Total Enrollment 141,814 46,265 45,141 46,616Note: Enrollment is based on the 40th Day. Sources: Enrollment - District School Choice and Student Accounting Office
Continued from Prior Page

209
SHELBY COUNTY BOARD OF EDUCATION
2010 2009 2008 2007 2006 2005
1048
397 380 397
0 397 380 397 0 58
0 0 0 0 0 0
46,420 45,695 45,790 44,968 44,760 43,086

210
Schedule of Major Insurance Coverage
STATISTICAL AND OTHER INFORMATION (UNAUDITED)OPERATING INFORMATIONInsurance Coverage and Surety Bonds SHELBY COUNTYFiscal year ending June 30 BOARD OF EDUCATION
Type Policy Term Company Policy Number Costs
Student Athletic Accident 7/1/13 - 6/30/14 Monumental Life Insurance TN01 $276,900
Property Insurance 7/1/13 - 7/1/14 Travelers Indemnity KTKCMB1C6033913 $1,025,771
Flood Insurance - A. Maceo Walker 9/10/13 - 9/10/14 Homesite Insurance 3000015564 $2,878
Flood Insurance - American Way Middle 8/20/13 - 8/20/14 Homesite Insurance 3000017942 $1,439
Flood Insurance - North Area Office 10/30/13 - 10/30/14 Homesite Insurance 3000015542 $2,880
Flood Insurance - IT Bldg & Training Ctr. 10/30/13 - 10/30/14 Homesite Insurance 3000015539 $2,880
Vehicle Insurance Out of State 7/1/13 - 7/1/14 National Continental Insurance CTN 000-7325-412-4 $11,813
Bus Insurance 6/30/13 - 6/30/14 Indiana Insurance Co. BA 8957424 $624,293
Boiler and Machinery 7/1/13 - 7/1/14 Travelers Property & Casualty BME13D621191T1L13 $71,779
ROTC 7/1/13 - 7/1/14 Self Insured NA NA
Voluntary Student Insurance Participation voluntary 7/1/13 - 6/30/14 K&K Insurance
Indvidual Student Coverage
Surety Bond General Employees 7/1/13 - 7/1/14 Ohio Casualty Insurance 5105811 $20,000
Treasurer Bond- Pamela Anstey 7/1/13 - 6/30/14 Ohio Casualty Insurance 601061636 $22,159
Surety Bond Commissioners Teresa Jones 8/2/12 - 8/2/16 Fidelity and Deposit of Maryland 9038807 $100Kevin Woods 8/2/12 - 8/2/16 Fidelity and Deposit of Maryland 9038809 $100
Shante Avant 9/1/13 - Indefinite Fidelity and Deposit of Maryland 9038865 $100William Orgel 8/2/12 - 8/2/14 Fidelity and Deposit of Maryland 9038806 $100
Christopher Caldwell 8/2/12 - 8/2/14 Fidelity and Deposit of Maryland 9038805 $100David Reaves 9/1/10 - 9/1/14 Hartford Fire Insurance Co. 20BSBFV4067 $170David Pickler 9/1/10 - 9/1/14 Hartford Fire Insurance Co. 20BSBED7466 $100
Student Field Trip 3/18/14 - 3/18/15 Hartford Insurance 20-SR-145507 Paid by Schools
Medicare Section 111 Reporting 9/9/13 - 9/9/14 Gould & Lamb None $850 per month
Law Enforcement Liability Insurance 5/7/14 - 5/7/15 First Mercury Insurance SE-CGL-0000043224-01 $77,950

211
Graduation Information
STATISTICAL AND OTHER INFORMATION (UNAUDITED)OPERATING INFORMATIONGraduation Information SHELBY COUNTYLast ten fiscal years ending June 30 BOARD OF EDUCATION
FiscalYear
RegularDiploma
SpecialEducationCertificate Total
2008 3,179 130 3,3092009 2,912 88 3,0002010 2,891 51 2,9422011 3,172 34 3,2062012 3,510 95 3,6052013 3,142 53 3,1952014 8,925 166 9,091
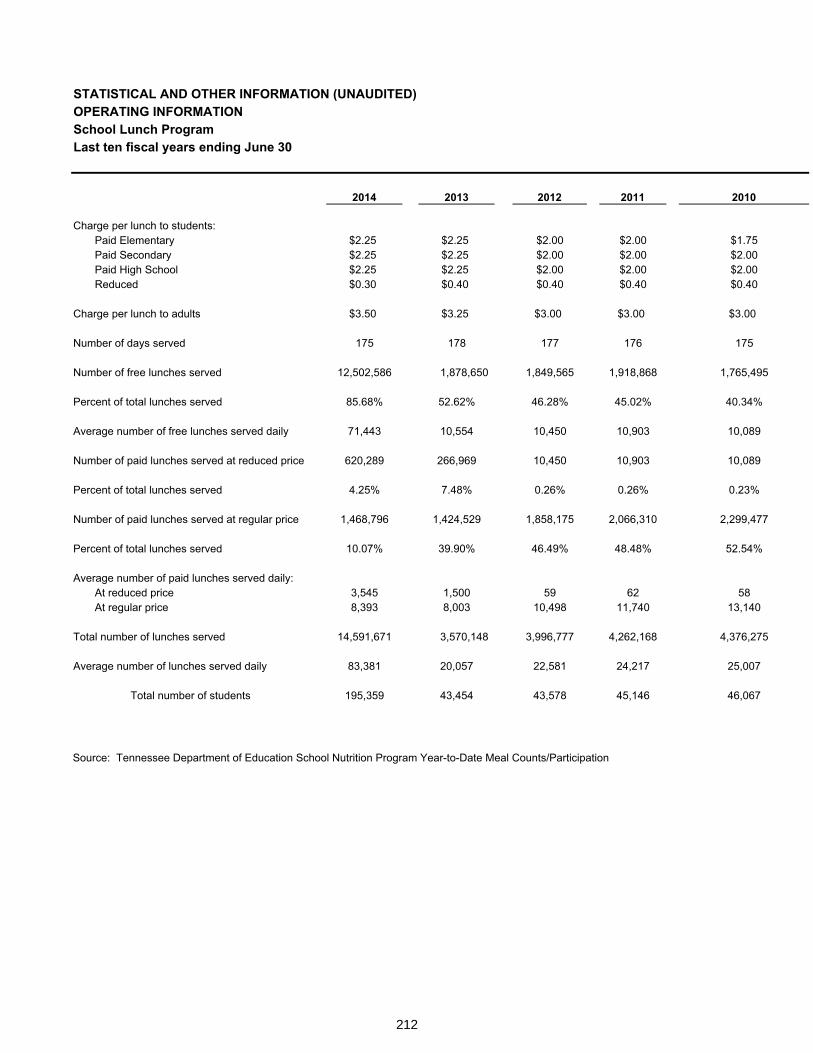
212
School Lunch Program
STATISTICAL AND OTHER INFORMATION (UNAUDITED)OPERATING INFORMATIONSchool Lunch ProgramLast ten fiscal years ending June 30
2014 2013 2012 2011 2010
Charge per lunch to students:Paid Elementary $2.25 $2.25 $2.00 $2.00 $1.75Paid Secondary $2.25 $2.25 $2.00 $2.00 $2.00Paid High School $2.25 $2.25 $2.00 $2.00 $2.00Reduced $0.30 $0.40 $0.40 $0.40 $0.40
Charge per lunch to adults $3.50 $3.25 $3.00 $3.00 $3.00
Number of days served 175 178 177 176 175
Number of free lunches served 12,502,586 1,878,650 1,849,565 1,918,868 1,765,495
Percent of total lunches served 85.68% 52.62% 46.28% 45.02% 40.34%
Average number of free lunches served daily 71,443 10,554 10,450 10,903 10,089
Number of paid lunches served at reduced price 620,289 266,969 10,450 10,903 10,089
Percent of total lunches served 4.25% 7.48% 0.26% 0.26% 0.23%
Number of paid lunches served at regular price 1,468,796 1,424,529 1,858,175 2,066,310 2,299,477
Percent of total lunches served 10.07% 39.90% 46.49% 48.48% 52.54%
Average number of paid lunches served daily:At reduced price 3,545 1,500 59 62 58At regular price 8,393 8,003 10,498 11,740 13,140
Total number of lunches served 14,591,671 3,570,148 3,996,777 4,262,168 4,376,275
Average number of lunches served daily 83,381 20,057 22,581 24,217 25,007
Total number of students 195,359 43,454 43,578 45,146 46,067
Source: Tennessee Department of Education School Nutrition Program Year-to-Date Meal Counts/Participation

213
SHELBY COUNTY BOARD OF EDUCATION
2009 2008 2007 2006 2005
$1.75 $1.75 $1.50 N/A N/A$2.00 $2.00 $1.75 N/A N/A$2.00 $2.00 $1.75 N/A N/A$0.40 $0.40 $0.40 N/A N/A
$3.00 $3.00 $2.50 N/A N/A
180 180 179 N/A N/A
1,581,974 1,461,637 1,305,209 N/A N/A
35.56% 32.40% 29.22% N/A N/A
8,789 8,120 7,292 N/A N/A
8,789 8,120 7,292 N/A N/A
0.20% 0.18% 0.16% N/A N/A
2,526,128 2,724,235 2,868,644 N/A N/A
56.78% 60.39% 64.23% N/A N/A
49 45 41 N/A N/A14,034 15,135 16,026 N/A N/A
4,448,631 4,510,970 4,466,504 N/A N/A
24,715 25,061 24,953 N/A N/A
45,017 45,270 44,333 N/A N/A
Source: Tennessee Department of Education School Nutrition Program Year-to-Date Meal Counts/Participation

214
Pupil Transportation
STATISTICAL AND OTHER INFORMATION (UNAUDITED)OPERATING INFORMATIONPupil TransportationLast ten fiscal years ending June 30
2014 2013 2012School Buses
Type I 642 312 311 Type II - - -
Total 642 312 311
Daily one-way miles traveled for all busesFrom residence to first pick-up 27,366 1,857 2,010 From first pick-up to last school served 26,964 12,416 8,470
Total 54,330 14,273 10,480
Pupils TransportedEnrolled
Regular 54,409 23,331 23,153Special Education 2,689 667 440
ADT 1 1/2 miles +Regular 43,721 22,320 22,496Special Education 2,232 623 396
InjuriesTreated and released 4 3 2
Type AccidentProperty damage 67 55 48 Personal injury 8 7 8

215
SHELBY COUNTY BOARD OF EDUCATION
2011 2010 2009 2008 2007 2006 2005
316 309 298 294 294 291 310 - - - - - - - 316 309 298 294 294 291 310
1,879 1,960 1,906 1,896 1,887 1,846 1,806 8,691 8,719 8,602 8,697 8,336 8,427 8,018
10,570 10,679 10,508 10,593 10,223 10,273 9,824
22,777 26,236 24,174 24,407 24,164 24,276 22,916370 337 352 394 450 574 512
22,188 23,833 23,673 23,897 24,164 24,276 22,336343 307 345 381 450 574 415
3 - 19 5 82 25 2
52 66 59 63 57 59 63 2 7 11 6 6 14 3

216
This page left intentionally blank

217
STATUTORY REPORTING SECTION
Statutory Reporting Section

218
219
Independent Auditors Report on Internal Control over Financial Reporting and on Compliance and Other Matters
Watkins Uiberall, PLLC Certified Public Accountants & Financial Advisors
Independent Member of BKR International
BANKS,FINLEY,WHITE& CO.CERTIFIED PUBLIC ACCOUNTANTS
INDEPENDENT AUDITOR’S REPORT ON INTERNAL CONTROL OVER FINANCIAL REPORTING AND ON COMPLIANCE AND OTHER MATTERS BASED ON AN AUDIT OF FINANCIAL STATEMENTS
PERFORMED IN ACCORDANCE WITH GOVERNMENT AUDITING STANDARDS
To the Chairman and Members of the Shelby County Board of Education Memphis, Tennessee
We have audited, in accordance with auditing standards generally accepted in the United States of America and the standards applicable to financial audits contained in Government Auditing Standards, issued by the Comptroller General of the United States, the financial statements of the governmental activities, each major fund, the aggregate remaining fund information and the budgetary comparison of the general fund and special revenue – categorically aided fund of the Board of Education of the Shelby County Schools (the Board) (a component unit of Shelby County, Tennessee) as of and for the year ended June 30, 2014, and the related notes to the financial statements, which collectively comprise the Board’s basic financial statements, and have issued our report thereon dated December 15, 2014.
Internal Control Over Financial Reporting
In planning and performing our audit of the financial statements, we considered the Board's internal control over financial reporting (internal control) to determine the audit procedures that are appropriate in the circumstances for the purpose of expressing our opinions on the financial statements, but not for the purpose of expressing an opinion on the effectiveness of the Board’s internal control. Accordingly, we do not express an opinion on the effectiveness of the Board’s internal control.
A deficiency in internal control exists when the design or operation of control does not allow management or employees, in the normal course of performing their assigned functions, to prevent, or detect and correct, misstatements on a timely basis. A material weakness is a deficiency, or a combination of deficiencies, in internal control, such that there is a reasonable possibility that a material misstatement of the entity’s financial statements will not be prevented, or detected and corrected on a timely basis. A significantdeficiency is a deficiency, or a combination of deficiencies, in internal control that is less severe than a material weakness, yet important enough to merit attention by those charged with governance.
Our consideration of internal control was for the limited purpose described in the first paragraph of this section and was not designed to identify all deficiencies in internal control that might be material weaknesses or significant deficiencies. Given these limitations, during our audit we did not identify any deficiencies in internal control that we consider to be material weaknesses. However, material weaknesses may exist that have not been identified.
220
Compliance and Other Matters
As part of obtaining reasonable assurance about whether the Board’s financial statements are free of material misstatement, we performed tests of its compliance with certain provisions of laws, regulations, contracts, and grant agreements, noncompliance with which could have a direct and material effect on the determination of financial statement amounts. However, providing an opinion on compliance with those provisions was not an objective of our audit, and accordingly, we do not express such an opinion. The results of our tests disclosed no instances of noncompliance or other matters that are required to be reported under Government Auditing Standards.
Purpose of this Report
The purpose of this report is solely to describe the scope of our testing of internal control and compliance and the results of that testing, and not to provide an opinion on the effectiveness of the entity’s internal control or on compliance. This report is an integral part of an audit performed in accordance with Government Auditing Standards in considering the entity’s internal control and compliance. Accordingly, this communication is not suitable for any other purpose.
Memphis, Tennessee December 15, 2014
�

221
This page left intentionally blank

222
Independent Auditor's Report on Compliance with Requirements applicable to each Major Program and on Internal Control over Compliance in Accordance with OMB Circular A-133
Watkins Uiberall, PLLC Certified Public Accountants & Financial Advisors
Independent Member of BKR International
BANKS,FINLEY,WHITE& CO.CERTIFIED PUBLIC ACCOUNTANTS
INDEPENDENT AUDITOR’S REPORT ON COMPLIANCE FOR EACH MAJOR PROGRAM AND ON INTERNAL CONTROL OVER COMPLIANCE REQUIRED BY OMB CIRCULAR A-133
To the Chairman and Members of the Shelby County Board of Education Memphis, Tennessee
Report on Compliance for Each Major Federal Program
We have audited the Board of Education of the Shelby County Schools’ (the Board) (a component unit of Shelby County, Tennessee) compliance with the types of compliance requirements described in the OMBCircular A-133 Compliance Supplement that could have a direct and material effect on each of the Board’s major federal programs for the year ended June 30, 2014. The Board's major federal programs are identified in the summary of auditor’s results section of the accompanying schedule of findings and questioned costs.
Management’s Responsibility
Management is responsible for compliance with the requirements of laws, regulations, contracts and grants applicable to its federal programs.
Auditor’s Responsibility
Our responsibility is to express an opinion on compliance for each of the Board's major federal programs based on our audit of the types of compliance requirements referred to above. We conducted our audit of compliance in accordance with auditing standards generally accepted in the United States of America; the standards applicable to financial audits contained in Government Auditing Standards, issued by the Comptroller General of the United States; and OMB Circular A-133, Audits of States, Local Governments, and Non-Profit Organizations. Those standards and OMB Circular A-133 require that we plan and perform the audit to obtain reasonable assurance about whether noncompliance with the types of compliance requirements referred to above that could have a direct and material effect on a major federal program occurred. An audit includes examining, on a test basis, evidence about the Board's compliance with those requirements and performing such other procedures as we considered necessary in the circumstances.
We believe that our audit provides a reasonable basis for our opinion on compliance for each major federal program. However, our audit does not provide a legal determination of the Board's compliance.
Opinion on Each Major Federal Program
In our opinion, the Board complied, in all material respects, with the types of compliance requirements referred to above that could have a direct and material effect on each of its major federal programs for the year ended June 30, 2014.

223
Report on Internal Control Over Compliance
Management of the Board is responsible for establishing and maintaining effective internal control over compliance with the types of compliance requirements referred to above. In planning and performing our audit of compliance, we considered the Board's internal control over compliance with the requirements that could have a direct and material effect on a major federal program to determine the auditing procedures that are appropriate in the circumstances for the purpose of expressing an opinion on compliance for each major federal program and to test and report on internal control over compliance in accordance with OMB Circular A-133, but not for the purpose of expressing an opinion on the effectiveness of internal control over compliance. Accordingly, we do not express an opinion on the effectiveness of the Board’s internal control over compliance.
A deficiency in internal control over compliance exists when the design or operation of a control over compliance does not allow management or employees, in the normal course of performing their assigned functions, to prevent, or detect and correct, noncompliance with a type of compliance requirement of a federal program on a timely basis. A material weakness in internal control over compliance is a deficiency, or a combination of deficiencies, in internal control over compliance, such that there is a reasonable possibility that material noncompliance with a type of compliance requirement of a federal program will not be prevented, or detected and corrected, on a timely basis. A significant deficiency in internal control over compliance is a deficiency, or a combination of deficiencies, in internal control over compliance with a type of compliance requirement of a federal program that is less severe than a material weakness in internal control over compliance, yet important enough to merit attention by those charged with governance.
Our consideration of internal control over compliance was for the limited purpose described in the first paragraph of this section and was not designed to identify all deficiencies in internal control over compliance that might be material weaknesses or significant deficiencies. We did not identify any deficiencies in internal control over compliance that we consider to be material weaknesses. However, material weaknesses may exist that have not been identified.
The purpose of this report on internal control over compliance is solely to describe the scope of our testing of internal control over compliance and the results of our testing based on the requirements of OMB Circular A-133. Accordingly, this report is not suitable for any other purpose.
Memphis, Tennessee December 15, 2014 ����

224
Schedule of Expenditures of Federal, State and Other AwardsSCHEDULE OF EXPENDITURES OF FEDERAL AND STATE AWARDS SHELBY COUNTYFor the year ended June 30, 2014 BOARD OF EDUCATION
FederalDomestic
Grantor/Pass Through Assistance GrantorGrantor/Program Title Number Number Expenditures
Federal Awards
U.S. Department of Labor Passed Through City of Memphis
WIN GRASSY 14.01 17.259 30999 109,749WIN GRASSY 12.01 17.259 27540 -WIN GRASSY 13.01 17.259 29996 9,765
Workforce Investment Act - Employment and Training Activities for Out of School Youth 13.01 17.259 29944 30,545
Workforce Investment Act - Employment and Training Activities for Out of School Youth 14.01 17.259 31001 166,816Workforce Investment Act - Employment and Training Activities for In School Youth 13.01 17.259 26782 -Workforce Investment Act - Employment and Training Activities for In School Youth 13.01 19,479Workforce Investment Act - Employment and Training Activities for In School Youth 12.01 17.259 27542Workforce Investment Act - Employment and Training Activities for In School Youth 14.01 17.259 31002 144,535Workforce Investment Act - Employment and Training Activities for In School Youth 11.01 17.259 27542
Total 17.259 480,889
National Science Foundation
Memphis Virtual STEM Academy 47.076 DRL-1311876 54,087Total 47.078 54,087
Federal Highway Administration
Garrett A. Morgan Technology and Transportation Education Program 20.215 DTFH61-12-G-00019 27,685Total 20.215 27,685
U.S. Department of Agriculture Passed Through State of Tennessee
National School Breakfast Program 10.553 N/A 17,814,462Total 10.553 17,814,462
National School Lunch Program 10.555 N/A 39,779,722National School Lunch Program-Non Cash Assistance 10.555 N/A 4,235,388
Total 10.555 44,015,110
National School Lunch Program-Non Cash Assistance 10.558 N/A 21,733Total 10.558 21,733
Fresh Fruit and Vegetable Program 10.582 N/A 1,486,609Total 10.582 1,486,609
Total U.S. Department of Agriculture 63,337,914
U.S. Department of Education Direct Funding
Foreign Language Assistance 11.01 84.293B T293B100184-11 3,055Total 84.293B 3,055
Gear-Up 2014 84.334 34952 220,437Total 84.334A 220,437
School Leadership Initiative 13.01 84.363A U363A100101-12 85,230School Leadership Initiative 14.01 84.363A U363A130164 147,921
Total 84.363A 233,151
See independent auditor's report and accompanying notes to schedule.
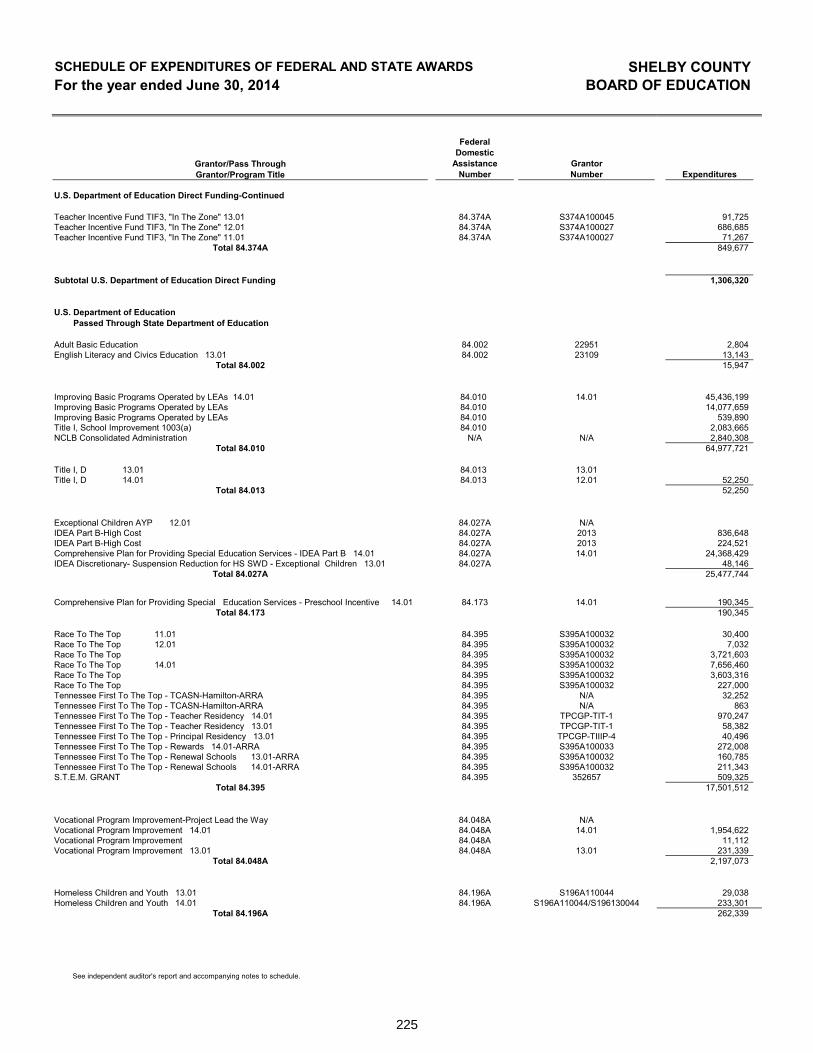
225
SCHEDULE OF EXPENDITURES OF FEDERAL AND STATE AWARDS SHELBY COUNTYFor the year ended June 30, 2014 BOARD OF EDUCATION
FederalDomestic
Grantor/Pass Through Assistance GrantorGrantor/Program Title Number Number Expenditures
U.S. Department of Education Direct Funding-Continued
Teacher Incentive Fund TIF3, "In The Zone" 13.01 84.374A S374A100045 91,725Teacher Incentive Fund TIF3, "In The Zone" 12.01 84.374A S374A100027 686,685Teacher Incentive Fund TIF3, "In The Zone" 11.01 84.374A S374A100027 71,267
Total 84.374A 849,677
Subtotal U.S. Department of Education Direct Funding 1,306,320
U.S. Department of Education Passed Through State Department of Education
Adult Basic Education 84.002 22951 2,804English Literacy and Civics Education 13.01 84.002 23109 13,143
Total 84.002 15,947
Improving Basic Programs Operated by LEAs 14.01 84.010 14.01 45,436,199Improving Basic Programs Operated by LEAs 84.010 14,077,659Improving Basic Programs Operated by LEAs 84.010 539,890Title I, School Improvement 1003(a) 84.010 2,083,665NCLB Consolidated Administration N/A N/A 2,840,308
Total 84.010 64,977,721
Title I, D 13.01 84.013 13.01Title I, D 14.01 84.013 12.01 52,250
Total 84.013 52,250
Exceptional Children AYP 12.01 84.027A N/AIDEA Part B-High Cost 84.027A 2013 836,648IDEA Part B-High Cost 84.027A 2013 224,521Comprehensive Plan for Providing Special Education Services - IDEA Part B 14.01 84.027A 14.01 24,368,429IDEA Discretionary- Suspension Reduction for HS SWD - Exceptional Children 13.01 84.027A 48,146
Total 84.027A 25,477,744
Comprehensive Plan for Providing Special Education Services - Preschool Incentive 14.01 84.173 14.01 190,345Total 84.173 190,345
Race To The Top 11.01 84.395 S395A100032 30,400Race To The Top 12.01 84.395 S395A100032 7,032Race To The Top 84.395 S395A100032 3,721,603Race To The Top 14.01 84.395 S395A100032 7,656,460Race To The Top 84.395 S395A100032 3,603,316Race To The Top 84.395 S395A100032 227,000Tennessee First To The Top - TCASN-Hamilton-ARRA 84.395 N/A 32,252Tennessee First To The Top - TCASN-Hamilton-ARRA 84.395 N/A 863Tennessee First To The Top - Teacher Residency 14.01 84.395 TPCGP-TIT-1 970,247Tennessee First To The Top - Teacher Residency 13.01 84.395 TPCGP-TIT-1 58,382Tennessee First To The Top - Principal Residency 13.01 84.395 TPCGP-TIIIP-4 40,496Tennessee First To The Top - Rewards 14.01-ARRA 84.395 S395A100033 272,008Tennessee First To The Top - Renewal Schools 13.01-ARRA 84.395 S395A100032 160,785Tennessee First To The Top - Renewal Schools 14.01-ARRA 84.395 S395A100032 211,343S.T.E.M. GRANT 84.395 352657 509,325
Total 84.395 17,501,512
Vocational Program Improvement-Project Lead the Way 84.048A N/AVocational Program Improvement 14.01 84.048A 14.01 1,954,622Vocational Program Improvement 84.048A 11,112Vocational Program Improvement 13.01 84.048A 13.01 231,339
Total 84.048A 2,197,073
Homeless Children and Youth 13.01 84.196A S196A110044 29,038Homeless Children and Youth 14.01 84.196A S196A110044/S196130044 233,301
Total 84.196A 262,339
See independent auditor's report and accompanying notes to schedule.

226
SCHEDULE OF EXPENDITURES OF FEDERAL AND STATE AWARDS SHELBY COUNTYFor the year ended June 30, 2014 BOARD OF EDUCATION
FederalDomestic
Grantor/Pass Through Assistance GrantorGrantor/Program Title Number Number Expenditures
U.S. Department of Education Passed Through-Continued
Charter Schools 84.282A N/A 200,000Total 84.282A 200,000
Twenty First Cent. Community Learning 2013 84.287C 192-10-4-021 8,645Twenty First Cent. Community Learning 12.01 84.287C 692,124Twenty First Cent. Community Learning 12.01 84.287C 150,094Twenty First Cent. Community Learning 12.01 84.287C 192-10-3-021 349,609
Total 84.287C 1,200,472
School Improvement 84.377 S77A110043 1,508,028School Improvement-ARRA 84.388A S388A090043A 713,260School Improvement-ARRA 84.388A S388A090043A 2,625,308School Improvement 2013-ARRA 84.388A/84.377A S388A090043A/S377A090043A 338,536School Improvement 2012-ARRA 84.388A/84.377A S388A090043A/S377A090043A 5,039,884School Improvement 2010-ARRA 84.388A N/A 290,045
Total 84.388A 10,515,061
Title III-English Language Acquisition 84.365A 813Title III-English Language Acquisition 14.01 84.365A 14.01 959,861Title III-English Language Acquisition 13.01 84.365A 13.01 66,928
Total 84.365A 1,027,602
Title II-Math and Science Partnership 84.366B N/A 10,562Total 84.368B 10,562
Title II-A Teacher and Principal Training & Recruiting 84.367A N/A 822,966Title II-A Teacher and Principal Training & Recruiting 13.01 84.367A S374A100045 871,206Title II-A Teacher and Principal Training & Recruiting 14.01 84.367A S374A100045 6,854,691
Total 84.367A 8,548,863
Subtotal U.S. Department of Education Passed Through 132,177,491
Total U.S. Department of Education 133,483,811
U.S. Department of Health and Human Services Passed Through State Department of Human Services
Teen Pregnancy and Parenting Success 93.500 CA-1213951 46,799HRSA School Clinic Equipment 93.501 C12CS21931 52,503
Total 93.500 and 93.501 99,302
U.S. Department of Health and Human Services Passed Through Center For Disease Control
Improving The Health, Education and Well-being of Young People 93.079 1U87PS004197-01 215,354Total 93.079 215,354
Total U.S. Department of Health and Human Services 314,656
Total Federal Awards 197,699,042
See independent auditor's report and accompanying notes to schedule.

227
SCHEDULE OF EXPENDITURES OF FEDERAL AND STATE AWARDS SHELBY COUNTYFor the year ended June 30, 2014 BOARD OF EDUCATION
FederalDomestic
Grantor/Pass Through Assistance GrantorGrantor/Program Title Number Number Expenditures
State Awards
State Department of Education
Family Resource Center N/AFamily Resource Center N/A 2014 78,227Safe Schools Act of 1998 N/A 2013 39,936Safe Schools Act of 1998 N/A 2013 319,136Safe Schools Act of 1998 N/A 2013 567,890Coordinated School Health - 2013 N/A 2013 516,361Early Childhood Education- Pilot/State N/A 10,803,042Lottery for Education: AfterSchool Programs 119-12-02-039 2013 404,962Lottery for Education: AfterSchool Programs 119-11-01-039 2014 1,140,970
13,870,524State Department of Health
Total State Awards 13,870,524
Total Federal and State Awards 211,569,566$
See independent auditor's report and accompanying notes to schedule.

228
This page left intentionally blank
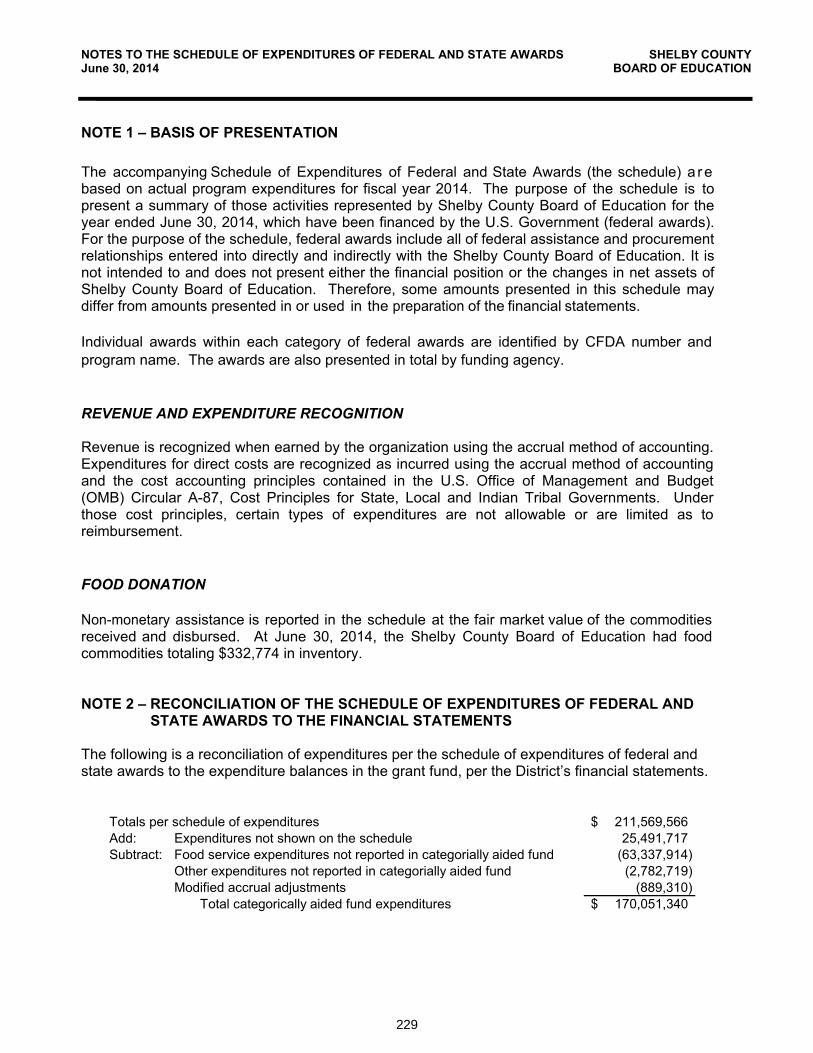
229
Notes to the Schedule of Expenditures of Federal AwardsNOTES TO THE SCHEDULE OF EXPENDITURES OF FEDERAL AND STATE AWARDS SHELBY COUNTY June 30, 2014 BOARD OF EDUCATION
NOTE 1 – BASIS OF PRESENTATION The accompanying Schedule of Expenditures of Federal and State Awards (the schedule) a re based on actual program expenditures for fiscal year 2014. The purpose of the schedule is topresent a summary of those activities represented by Shelby County Board of Education for the year ended June 30, 2014, which have been financed by the U.S. Government (federal awards). For the purpose of the schedule, federal awards include all of federal assistance and procurement relationships entered into directly and indirectly with the Shelby County Board of Education. It is not intended to and does not present either the financial position or the changes in net assets of Shelby County Board of Education. Therefore, some amounts presented in this schedule may differ from amounts presented in or used in the preparation of the financial statements.
Individual awards within each category of federal awards are identified by CFDA number and program name. The awards are also presented in total by funding agency.
REVENUE AND EXPENDITURE RECOGNITION
Revenue is recognized when earned by the organization using the accrual method of accounting. Expenditures for direct costs are recognized as incurred using the accrual method of accounting and the cost accounting principles contained in the U.S. Office of Management and Budget (OMB) Circular A-87, Cost Principles for State, Local and Indian Tribal Governments. Under those cost principles, certain types of expenditures are not allowable or are limited as to reimbursement.
FOOD DONATION
Non-monetary assistance is reported in the schedule at the fair market value of the commodities received and disbursed. At June 30, 2014, the Shelby County Board of Education had food commodities totaling $332,774 in inventory.
NOTE 2 – RECONCILIATION OF THE SCHEDULE OF EXPENDITURES OF FEDERAL AND STATE AWARDS TO THE FINANCIAL STATEMENTS
The following is a reconciliation of expenditures per the schedule of expenditures of federal and state awards to the expenditure balances in the grant fund, per the District’s financial statements.
Totals per schedule of expenditures 211,569,566$Add: Expenditures not shown on the schedule 25,491,717Subtract: Food service expenditures not reported in categorially aided fund (63,337,914)
Other expenditures not reported in categorially aided fund (2,782,719)Modified accrual adjustments (889,310) Total categorically aided fund expenditures 170,051,340$

230
Schedule of Findings and Questioned Costs
SCHEDULE OF FINDINGS AND QUESTIONED COSTS SHELBY COUNTY For the Year Ended June 30, 2014 BOARD OF EDUCATION
A. SUMMARY OF AUDIT RESULTS
1. The auditor's report expresses an unmodified opinion on the financial statements of the Shelby County Board of Education.
2. No significant deficiencies relating to the audit of the Board’s financial statements are reported.
3. No instances of noncompliance material to the financial statements of the Shelby County Board of Education were disclosed during the audit.
4. No significant deficiencies relating to the audit of the major federal award programs are reported.
5. The auditor's report on compliance for the major federal award programs for the Shelby County Board of Education expresses an unmodified opinion on all major federal programs.
6. The audit did not disclose any audit findings related to major programs that are required to be reported under OMB Circular A-133.
7. The programs tested as major programs included:
U.S. Department of Agriculture, School Breakfast Program, CFDA No. 10.553 U.S. Department of Agriculture, National School Lunch Program, CFDA No. 10.555 U.S. Department of Education, Title I Grants to Local Education Agencies, CFDA No. 84.010 U.S. Department of Education, Special Education Grants to States, CFDA No. 84.027 U.S. Department of Education, Special Education Preschool Grants, CFDA No. 84.173
8. The threshold for distinguishing Types A and B programs was $3,000,000.
9. The Shelby County Board of Education did qualify as a low-risk auditee.
B. FINDINGS - FINANCIAL STATEMENT AUDIT
NONE
C. FINDINGS AND QUESTIONED COSTS - MAJOR FEDERAL AWARD PROGRAM AUDIT
NONE

231
Summary of Prior Year Findings
SUMMARY SCHEDULE OF PRIOR YEAR AUDIT FINDINGS SHELBY COUNTY For the Year Ended June 30, 2014 BOARD OF EDUCATION
NONE �

232

233
This page left intentionally blank

234