Complete characterization of the synthesized SnO2 ...
11
Fazal Akbar Jan et al., J.Chem.Soc.Pak., Vol. 43, No. 01, 2021 14 Characterization of Synthesized SnO2 Nanoparticles and its Application for the Photo Catalytic Degradation of Eosin Y in Aqueous Solution 1 Fazal Akbar Jan*, 1 Muhammad Aamir, 2 Naimat Ullah and 1 Husaain Gulab 1 Department of Chemistry, Bacha Khan University Chrasadda, Khyber-Pakhtunkhwa,24420 Pakistan. 2 Department of Chemistry, Qauid-i- Azam University Islamabad, 45320 Pakistan. [email protected]* (Received on 12 th February 2020, accepted in revised form 24 th August 2020) Summary: The synthesized oxide (SnO2) nanoparticles by sol-gel method were characterized using UV-Visible spectroscopy (UV-Vis), Fourier Transform Infrared spectroscopy (FTIR), X-rays diffraction(XRD) and Scanning electron microscopy(SEM). Using X-rays diffraction analysis different parameter were calculated such as crystallite size, d-spacing, dislocation density, number of unit cell, cell volume, morphological index, micro strain and instrumental broadening. The average particle size was 28.396 nm. Scanning electron microscopy revealed that SnO2 nanopartcles are uniformly distributed. Optical properties such as band gap (energy gap = 3.6 eV) was calculated from UV-Visible spectroscopy. The characterized particles were used as photocatalyst for the degradation of Eosin dye in aqueous solution under UV light. The effect of different parameters i.e irradiation time, initial dye concentration, pH of the medium and catalyst weight on percent degradation was also studied. Mmaximum dye degradation was found at 220 minutes time interval that was 92 % using 10 ppm solution. At pH 5 the degradation of dye was found to be 94%. The catalyst dose of 0.06 g was found to be the optimum weight for the best photo catalytic degradation of Eosin Y. Key words: SnO2 nanoparticles, Eiosin dye, Photocatalytic, XRD, UV. Introduction Adversely affected environmental processes as a result of the contamination of the physical and biological component of the earth and atmosphere system are called environmental pollution. In developed as well as developing countries environmental pollution is a global problem and due to severe long-term consequences it has attracted the attention of human beings [1]. The effluents of certain industries such as food processing, textile, cosmetics, paper, leather, plastic, pharmaceutical, dye manufacturing and printing contain various kinds of synthetic dyes. During the dyeing process about 15% of the total world production of dyes is lost and dumped to industrial effluents [1]. The complex chemical structure of dyes makes them very stable to light oxidation and biodegradability [2, 3]. Eosin Y dye is one of the dye in the effluents which belongs to xanthene dye group has a pink color and causing more serious ecological risks and environmental problems[4]. This dye has been studied to cause severe health hazards in human beings, such as liver, brain and central nervous system disorders, dysfunction of kidney and reproductive system [5, 6]. A number of techniques such as ultrafiltration, adsorption, ion exchange, reverse osmosis, chlorination, biosorption, and ozonation are in use for treatment of industrial effluents. These processes have their own merits and demerits i.e not so much cost effective for example biosorption, adsorption, filtration and ion-exchange can result in transfer of pollutant from one phase to another and lead to more serious secondary pollutants. Keeping in view the demerits of the aforementioned processes scientific community has been in the search for process to be more effective and can lead to complete degradation of toxic pollutants to non-hazardous products [7]. In order to cope with the demands of the treatment process to be environmental friendly and to overcome these problems an alternate method that is photocatalytic degradation under visible light irradiation using metal oxides such as SnO2 nanoparticles has been proved effective[8]. Photocatalysts comprising of semiconductor-based materials has been developed in recent years as an alternative to organic pollutant degradation and decolourization methods [9, 10]. Belonging to an n- type semiconductor materials (SnO2) has many applications in transistors, transparent electrodes, gas sensors, catalysts and batteries [11, 12]. SnO2 has similarity in structure, band gap, and chemical stability to those of titanium dioxide (TiO2) and thus are used photocatalyst. It has no adverse health effects when injected or inhaled SnO2 because it is poorly absorbed by the human body [13]. Radiation treatment creates electron–hole pairs in semiconductor photocatalytic processes [14, 15]. SnO2 nanoparticles have a wide band gap (3.6 eV at 300 K) [16]. Electrical conduction can be attributed to point defects (native and foreign atoms) which act as donors or acceptors. Faster transport of * To whom all correspondence should be addressed.
Transcript of Complete characterization of the synthesized SnO2 ...
Fazal Akbar Jan et al., J.Chem.Soc.Pak., Vol. 43, No. 01, 2021 14
Characterization of Synthesized SnO2 Nanoparticles and its Application for the Photo
Catalytic Degradation of Eosin Y in Aqueous Solution
1Fazal Akbar Jan*, 1Muhammad Aamir, 2Naimat Ullah and 1Husaain Gulab 1Department of Chemistry, Bacha Khan University Chrasadda, Khyber-Pakhtunkhwa,24420 Pakistan.
2Department of Chemistry, Qauid-i- Azam University Islamabad, 45320 Pakistan. [email protected]*
(Received on 12th February 2020, accepted in revised form 24th August 2020)
Summary: The synthesized oxide (SnO2) nanoparticles by sol-gel method were characterized using
UV-Visible spectroscopy (UV-Vis), Fourier Transform Infrared spectroscopy (FTIR), X-rays
diffraction(XRD) and Scanning electron microscopy(SEM). Using X-rays diffraction analysis
different parameter were calculated such as crystallite size, d-spacing, dislocation density, number of
unit cell, cell volume, morphological index, micro strain and instrumental broadening. The average
particle size was 28.396 nm. Scanning electron microscopy revealed that SnO2 nanopartcles are
uniformly distributed. Optical properties such as band gap (energy gap = 3.6 eV) was calculated
from UV-Visible spectroscopy. The characterized particles were used as photocatalyst for the
degradation of Eosin dye in aqueous solution under UV light. The effect of different parameters i.e
irradiation time, initial dye concentration, pH of the medium and catalyst weight on percent
degradation was also studied. Mmaximum dye degradation was found at 220 minutes time interval
that was 92 % using 10 ppm solution. At pH 5 the degradation of dye was found to be 94%. The
catalyst dose of 0.06 g was found to be the optimum weight for the best photo catalytic degradation
of Eosin Y.
Key words: SnO2 nanoparticles, Eiosin dye, Photocatalytic, XRD, UV.
Introduction
Adversely affected environmental processes
as a result of the contamination of the physical and
biological component of the earth and atmosphere
system are called environmental pollution. In
developed as well as developing countries
environmental pollution is a global problem and due to severe long-term consequences it has attracted the
attention of human beings [1]. The effluents of
certain industries such as food processing, textile,
cosmetics, paper, leather, plastic, pharmaceutical, dye
manufacturing and printing contain various kinds of
synthetic dyes. During the dyeing process about 15%
of the total world production of dyes is lost and
dumped to industrial effluents [1]. The complex
chemical structure of dyes makes them very stable to
light oxidation and biodegradability [2, 3]. Eosin Y
dye is one of the dye in the effluents which belongs
to xanthene dye group has a pink color and causing more serious ecological risks and environmental
problems[4]. This dye has been studied to cause
severe health hazards in human beings, such as liver,
brain and central nervous system disorders,
dysfunction of kidney and reproductive system [5, 6].
A number of techniques such as ultrafiltration,
adsorption, ion exchange, reverse osmosis,
chlorination, biosorption, and ozonation are in use for
treatment of industrial effluents. These processes
have their own merits and demerits i.e not so much
cost effective for example biosorption, adsorption, filtration and ion-exchange can result in transfer of
pollutant from one phase to another and lead to more
serious secondary pollutants. Keeping in view the
demerits of the aforementioned processes scientific
community has been in the search for process to be
more effective and can lead to complete degradation
of toxic pollutants to non-hazardous products [7]. In order to cope with the demands of the treatment
process to be environmental friendly and to overcome
these problems an alternate method that is
photocatalytic degradation under visible light
irradiation using metal oxides such as SnO2
nanoparticles has been proved effective[8].
Photocatalysts comprising of semiconductor-based
materials has been developed in recent years as an
alternative to organic pollutant degradation and
decolourization methods [9, 10]. Belonging to an n-
type semiconductor materials (SnO2) has many
applications in transistors, transparent electrodes, gas sensors, catalysts and batteries [11, 12]. SnO2 has
similarity in structure, band gap, and chemical
stability to those of titanium dioxide (TiO2) and thus
are used photocatalyst. It has no adverse health
effects when injected or inhaled SnO2 because it is
poorly absorbed by the human body [13]. Radiation
treatment creates electron–hole pairs in
semiconductor photocatalytic processes [14, 15].
SnO2 nanoparticles have a wide band gap (3.6 eV at
300 K) [16]. Electrical conduction can be attributed
to point defects (native and foreign atoms) which act as donors or acceptors. Faster transport of
*To whom all correspondence should be addressed.
Fazal Akbar Jan et al., J.Chem.Soc.Pak., Vol. 43, No. 01, 2021 15
photoexcited electrons in SnO2 occur due to high
electron mobility (~100–200 cm2 V−1s−1 renders
peculiar properties to SnO2 and make the material
useful for many applications. Their methods of
preparation, electrical and optical properties have got attention of the researchers in recent years [17].
Keeping in view the hazards of the dyes in the
aqueous system and importance of SnO2
nanomaterials a study was designed to synthesize,
characterize and apply the same for the photocatalytic
degradation of Eosin Y dye in aqueous medium.
Experimental
Synthesis of SnO2 nanoparticles
Sol-gel method was used for the preparation of SnO2 nanoparticles. All the chemicals used were
analytical grade. In this typical experiment 13.38 g of
Tin (IV) chloride pentahydrate (SnCl4.5H2O) was
diluted in 100 mL of distilled water. To SnCl2
solution 19 mL ammonium hydroxide (NH4OH) was
add drop wise to precipitate tin as a hydroxide and
adjusting the pH of the solution to 8.2.The thick
white solution (gel) formed was stirred continuously
for 6 hours for the completion of the chemical
reaction and the temperature was adjusted around at
70-100 0C.The obtained crystalline powder was filtered and dried at 80 0C for 1 hour. The dried
sample was calcined for 3 hours at 600 0C to get
SnO2 nanoparticles.
Characterization of the nanoparticles
UV-Visible spectrophotometer, X-Ray
Diffractotmetery, Scanning Electron Microscopy and
FTIR spectroscopy was used for the characterization
of SnO2 nanoparticles.
Preparation of the dye solution
The stock solution (500ppm) of Eosin Y dye
was prepared by dissolving 0.125 gram of dry
powder of dye in distilled water and was vigorously
shaken. Different concentrations working solutions
were prepared from the stock solution using dilution
formula.
Photocatalytic degradation of the dye
For the evaluation of photocatalytic activity of SnO2 nanoparticles Eosin Y dye in aqueous solution
was used. For comparison the photocatalytic degradation
of the dye was carried out under UV-light and sun light.
The wavelength of maximum absorption of Eosin Y was
515nm and this was used as a monitor wavelength of
photodegradation.
An appropriate amount of photocatalyst i.e. A
SnO2 nanoparticle was separately added to working solutions. For 30 min in the dark mixed solution was
stirred to establish dsorption/desorption equilibrium
before the photodegradation reaction. Then the
dispersions were kept under light source. Experiments
were carried out in locally designed equipment in which
UV-lamp was placed 15 cm away from the surface of the
solution. The dye degradation was checked at various
intervals of times and the catalyst was removed
by centrifugation. The same process was repeated under
sun light irradiation. As the intensity of light is moderate
in March so the experiments were performed in this
month starting from 10am. The absorbance of centrifuged solution was measured via UV-Vissible
Spectrometer. The percentage photodegradation of Eosin
Y dye was calculated by using the following relation:
(2)
where C0 and Ct denotes the concentrations of Eosin Y
at time 0 mint and t (s), respectively, and t is the
irradiation time.
Results and Discussion
XRD characterization
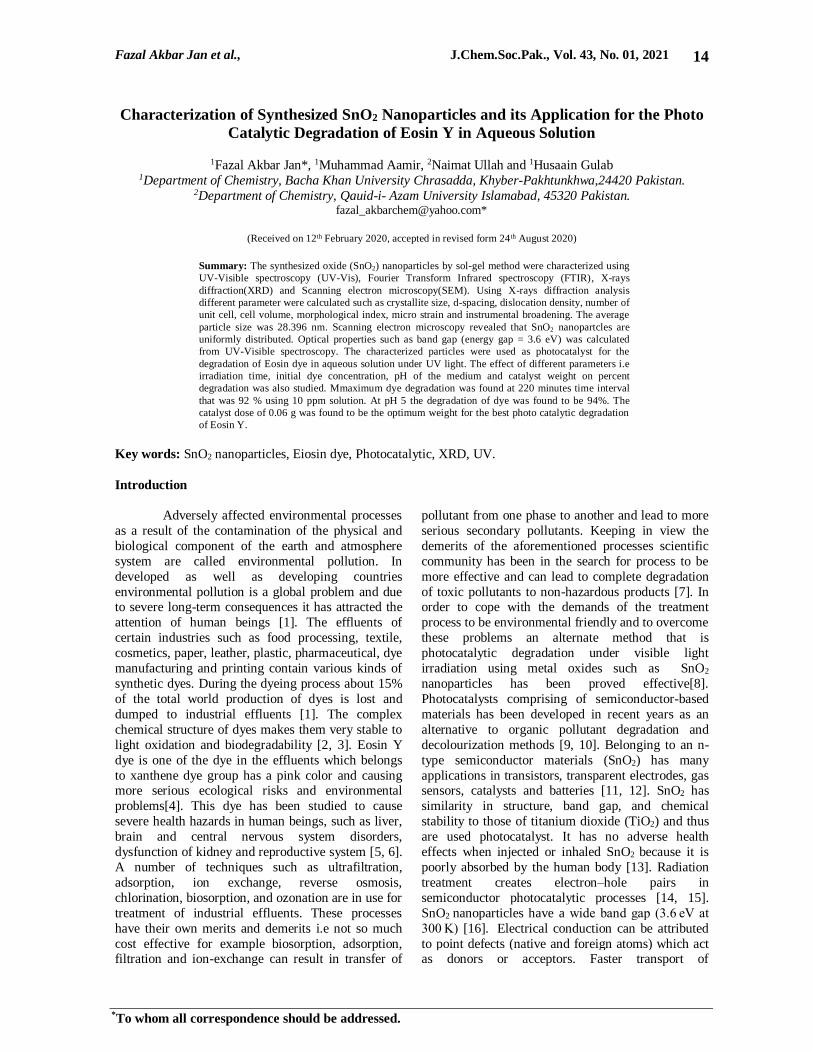
XRD pattern of SnO2 nanoparticles
synthesized through sol-gel method are shown Fig.1.
The pattern demonstrates to some extent broad and
well-defined peaks and shows the crystallinity of
synthesized SnO2 nanoparticles. The observed pattern
has prominent peaks at 2Ɵ value of 26.60°, 33.89°,
37.93°, 51.76°, 54.73°and 66.08° corresponding to (110), (101), (200), (211), (220) and (301) crystal
planes respectively, well coincide with JCPDS file
No. (00-021-1250) and confirms the SnO2
nanoparticles formation. The SnO2 shows tetragonal
structure. The peaks sharpness demonstrates that
SnO2 nanoparticles are highly crystalline [18]. The
experimental and standard diffraction angles of SnO2
nanoparticle is shown in Table-1
The experimental results are in coincidence
with the standard values.
Fazal Akbar Jan et al., J.Chem.Soc.Pak., Vol. 43, No. 01, 2021 16
Fig. 1: XRD pattern of SnO2 nanoparticles.
Table-1: Experimental and standard diffraction angle
of SnO2 nanoparticles. Experimental Standard- JCPDS (00-021-1250)
Diffraction Angle (2Ɵ in degree) Diffraction Angle (2 Ɵ in degree)
26.609 26.579
33.892 33.876
37.93 37.95
51.765 51.753
54.735 54.759
66.08 65.965
Particle size
The crystallite size of the SnO2
nanoparticles was calculated utilizing Debye Scherrer
formula as shown in equation 1
(1)
where D is the crystallite size, λis the wavelength,
β
is the full width at half maximum of the diffraction
peak, and Ɵ represent Bragg diffraction angle. Using
the given formula the average crystallite size was
calculated to be 28.396 nm [19].
d-spacing
Bragg’s law was used for calculating d-
spacing as shown in equation 2
2 d sin nλ (2)
2 d sin nλ (3)
where λ is the Wavelength and value is 1.5406 Å for
CuKα [20].The values d-spacing for 2Ɵ positions at
26.60°, 33.89°, 37.93°, 51.76°, 54.73°and 66.08° are
shown in Table-2.
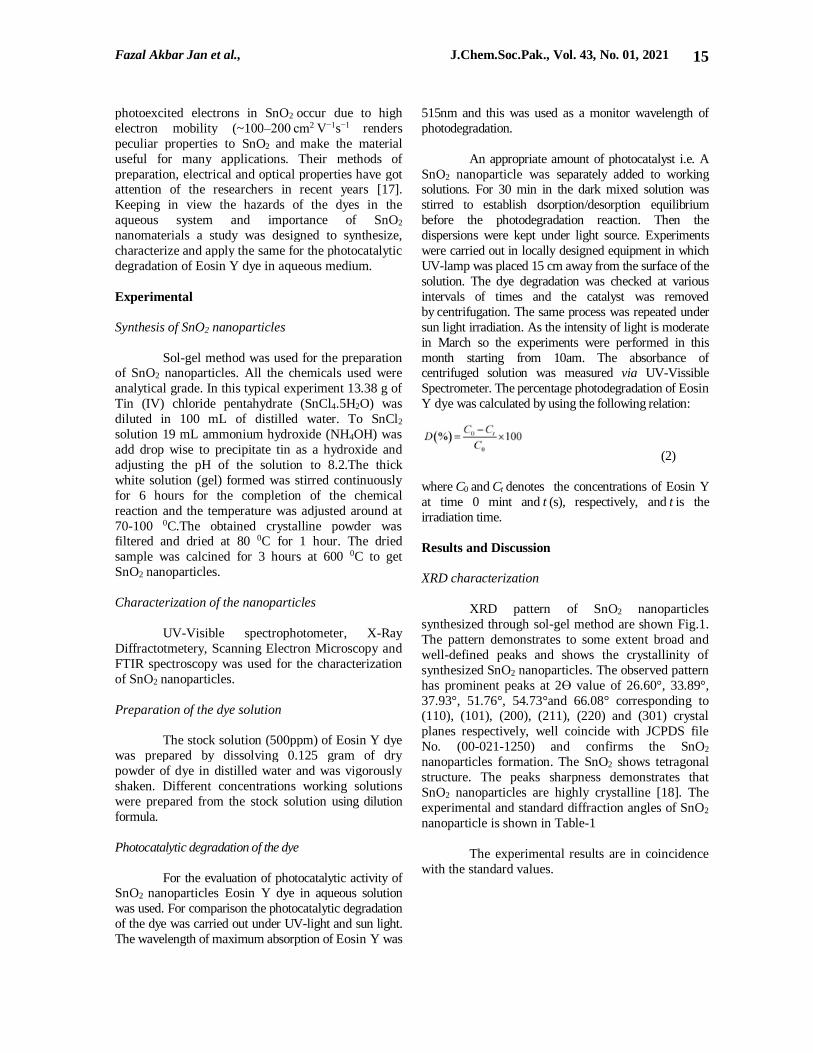
Dislocation Density
Dislocation density is characterized as the
dislocation of the crystal that occurs per unit volume.
Dislocation is the irregularity or crystallographic
imperfection within the crystal structure or a
deviation from a perfect crystal structure. Material
science well explains that numerous properties are
influenced due to the presence of dislocation within
the crystal. The movement of one dislocation hinders
the other dislocation present in crystal structure.
Also, bigger the dislocation larger will be the
hardness in sample. The formula for calculation of
dislocation density are shown in equation 4
1 δ (4)
D2
where δ is the Dislocation density and D is the
crystallite size of nanoparticle. The Values for
dislocation density are shown in Table-2.
Fig. 2: Particle size Vs dislocation density curve of
SnO2 nanoparticles
Fig. 2 shows plot of particle size versus the
dislocation density. The linear fitting of the graph
shows the indirect proportion of the dislocation
density with particle size as confirmed by the
equation ). This shows that by increment in
the particle size the dislocation in the crystal structure
is decreased.
Fazal Akbar Jan et al., J.Chem.Soc.Pak., Vol. 43, No. 01, 2021 17
Table-2: Diffraction angle, FWHM (β), Particle size (D), d-spacing, Dislocation density, Number of unit cell
and Morphology Index of SnO2 nanoparticles. Diffraction Angle
(2Ɵ in degree)
FWHM(β)
(Radians)
Particle Size (D)
(nm)
d-Spacing
(Å)
Dislocation Density
(m-2)×1014 Number of Unit Cell ×10-31
Morphological
Index (Unitless)
26.609 0.0043 41.464 3.351 5.816 5.18 0.714
33.892 0.00429 33.75 2.644 8.77 2.79 0.666
37.93 0.00858 17.067 2.369 34.33 0.3612 0.5
51.765 0.00429 35.87 1.765 7.77 3.35 0.666
54.735 0.00858 18.17 1.675 30.29 0.4358 0.5
66.08 0.00686 24.06 1.415 17.27 1.01 0.555
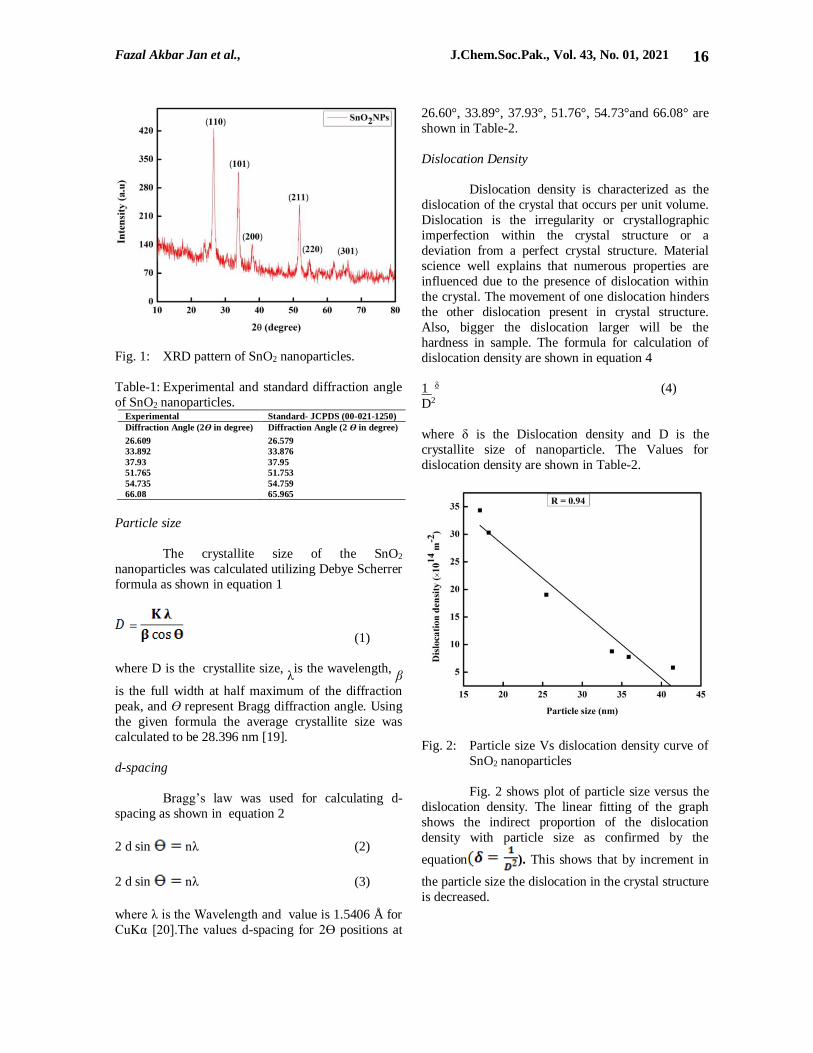
Unit cells
The number unit cells of the crystal system
are calculated using the formula as given in equation
5.
n = π ( ) ˣ 3 ˣ (5)
where D is the particle size and V represent cell
volume. The number of unit cell is shown in Table-2
Fig. 3: Number of unit cells Vs dislocation density
curve of SnO2 nanoparticles.
Fig.3 shows the plot of number of unit cells
versus the dislocation density. The all metrically
fitted graph shows the inverse relation of number of unit cells with the dislocation density as shown by the
equation ). Dislocation density is
a defect in which the layers of the crystals in the
crystal lattice are dislocated from their original position. With increase in the number of unit cells the
dislocation density of the lattice structure also
decreases as shown by graphical plot and the
equation.
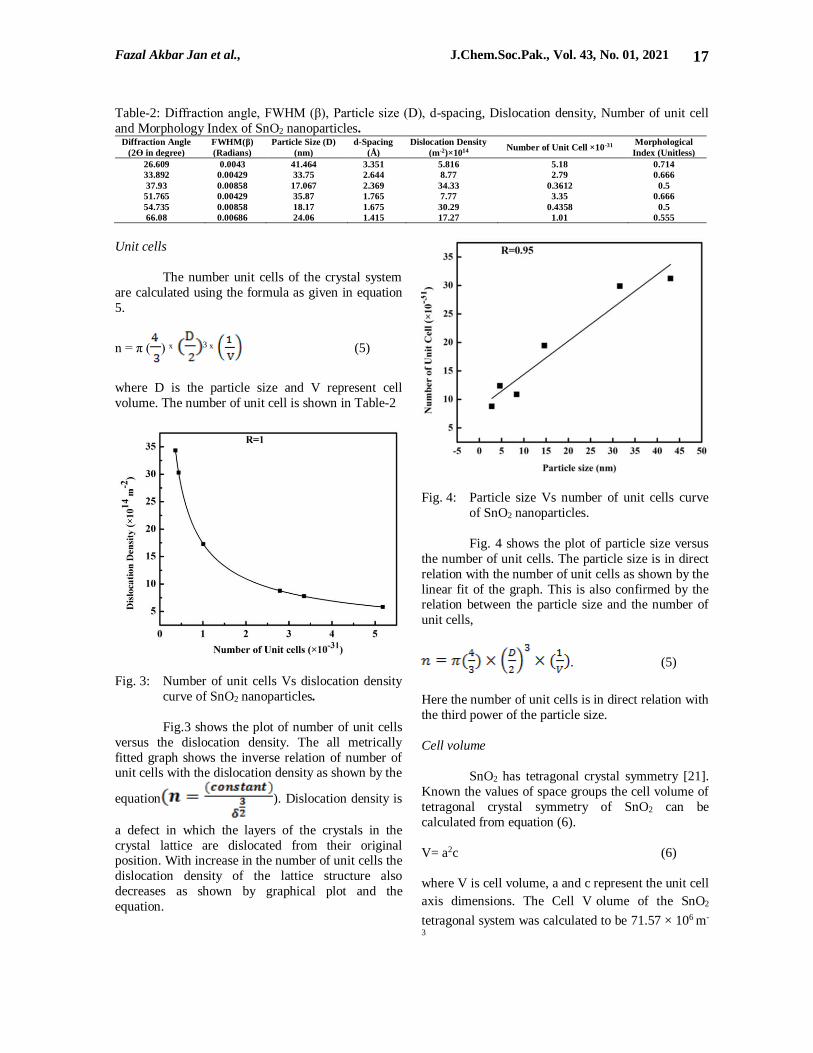
Fig. 4: Particle size Vs number of unit cells curve
of SnO2 nanoparticles.
Fig. 4 shows the plot of particle size versus
the number of unit cells. The particle size is in direct
relation with the number of unit cells as shown by the
linear fit of the graph. This is also confirmed by the relation between the particle size and the number of
unit cells,
. (5)
Here the number of unit cells is in direct relation with
the third power of the particle size.
Cell volume
SnO2 has tetragonal crystal symmetry [21].
Known the values of space groups the cell volume of
tetragonal crystal symmetry of SnO2 can be
calculated from equation (6).
V= a2c (6)
where V is cell volume, a and c represent the unit cell
axis dimensions. The Cell V olume of the SnO2
tetragonal system was calculated to be 71.57 × 10⁶ m-
3
Fazal Akbar Jan et al., J.Chem.Soc.Pak., Vol. 43, No. 01, 2021 18
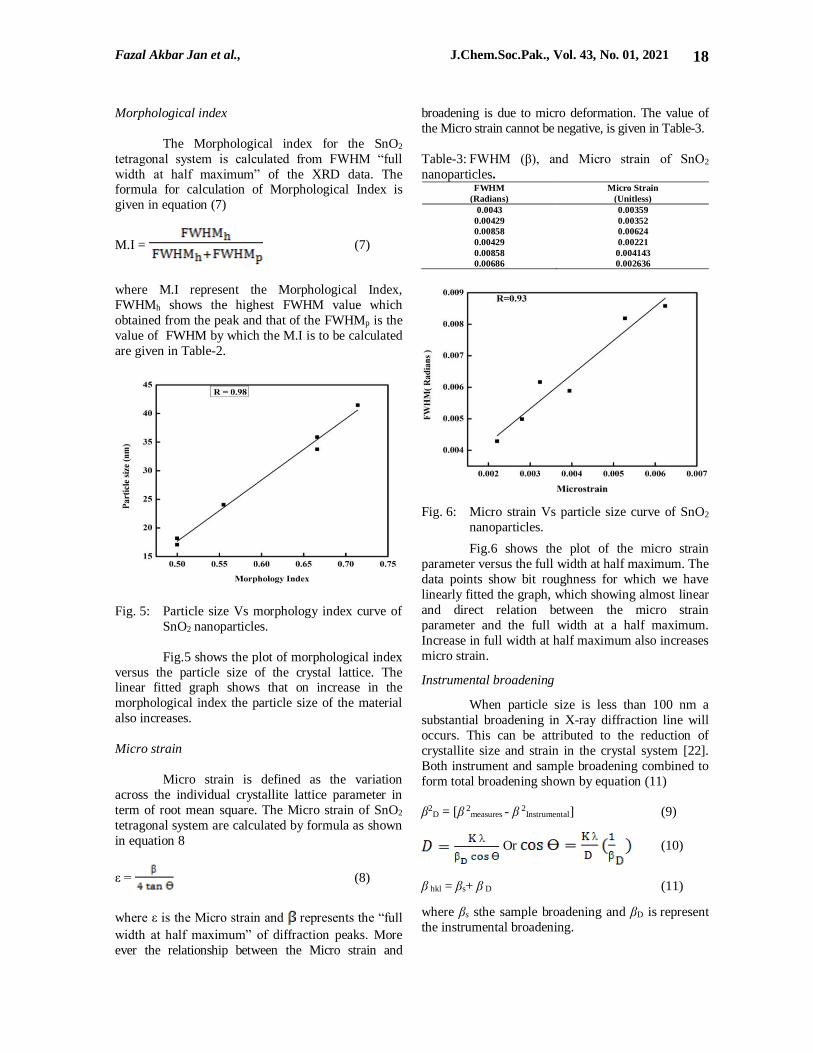
Morphological index
The Morphological index for the SnO2
tetragonal system is calculated from FWHM “full
width at half maximum” of the XRD data. The formula for calculation of Morphological Index is
given in equation (7)
M.I = (7)
where M.I represent the Morphological Index,
FWHMh shows the highest FWHM value which
obtained from the peak and that of the FWHMp is the
value of FWHM by which the M.I is to be calculated
are given in Table-2.
Fig. 5: Particle size Vs morphology index curve of
SnO2 nanoparticles.
Fig.5 shows the plot of morphological index
versus the particle size of the crystal lattice. The linear fitted graph shows that on increase in the
morphological index the particle size of the material
also increases.
Micro strain
Micro strain is defined as the variation
across the individual crystallite lattice parameter in
term of root mean square. The Micro strain of SnO2
tetragonal system are calculated by formula as shown
in equation 8
ε = (8)
where ε is the Micro strain and represents the “full
width at half maximum” of diffraction peaks. More
ever the relationship between the Micro strain and
broadening is due to micro deformation. The value of
the Micro strain cannot be negative, is given in Table-3.
Table-3: FWHM (β), and Micro strain of SnO2
nanoparticles. FWHM
(Radians)
Micro Strain
(Unitless)
0.0043 0.00359
0.00429 0.00352
0.00858 0.00624
0.00429 0.00221
0.00858 0.004143
0.00686 0.002636
Fig. 6: Micro strain Vs particle size curve of SnO2
nanoparticles.
Fig.6 shows the plot of the micro strain
parameter versus the full width at half maximum. The
data points show bit roughness for which we have
linearly fitted the graph, which showing almost linear
and direct relation between the micro strain
parameter and the full width at a half maximum.
Increase in full width at half maximum also increases
micro strain.
Instrumental broadening
When particle size is less than 100 nm a
substantial broadening in X-ray diffraction line will
occurs. This can be attributed to the reduction of
crystallite size and strain in the crystal system [22].
Both instrument and sample broadening combined to
form total broadening shown by equation (11)
β2
D = [β 2measures - β 2
Instrumental] (9)
Or (10)
β hkl = βs+ β D (11)
where βs sthe sample broadening and βD is represent
the instrumental broadening.
Fazal Akbar Jan et al., J.Chem.Soc.Pak., Vol. 43, No. 01, 2021 19
β hkl = ( ) +4 ε tan
(12)
𝛽hkl = [( ) +4 ε sin ] (13)
Equation (13) stands for UDM (uniform
deformation model) means the strain is uniform in all
crystallographic direction; ε is the micro strain of the
crystal system and instrumental broadening.
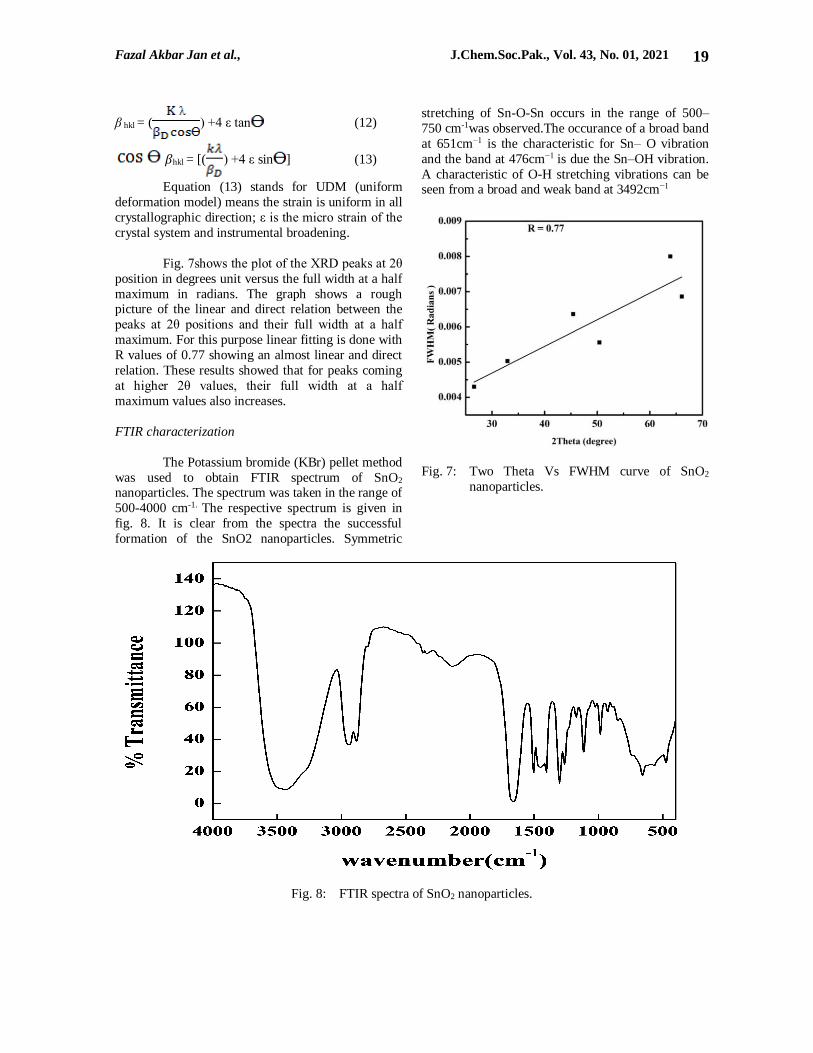
Fig. 7shows the plot of the XRD peaks at 2θ
position in degrees unit versus the full width at a half
maximum in radians. The graph shows a rough picture of the linear and direct relation between the
peaks at 2θ positions and their full width at a half
maximum. For this purpose linear fitting is done with
R values of 0.77 showing an almost linear and direct
relation. These results showed that for peaks coming
at higher 2θ values, their full width at a half
maximum values also increases.
FTIR characterization
The Potassium bromide (KBr) pellet method
was used to obtain FTIR spectrum of SnO2 nanoparticles. The spectrum was taken in the range of
500-4000 cm-1. The respective spectrum is given in
fig. 8. It is clear from the spectra the successful
formation of the SnO2 nanoparticles. Symmetric
stretching of Sn-O-Sn occurs in the range of 500–
750 cm-1was observed.The occurance of a broad band
at 651cm−1 is the characteristic for Sn– O vibration
and the band at 476cm−1 is due the Sn–OH vibration.
A characteristic of O-H stretching vibrations can be seen from a broad and weak band at 3492cm−1
Fig. 7: Two Theta Vs FWHM curve of SnO2
nanoparticles.
Fig. 8: FTIR spectra of SnO2 nanoparticles.
Fazal Akbar Jan et al., J.Chem.Soc.Pak., Vol. 43, No. 01, 2021 20
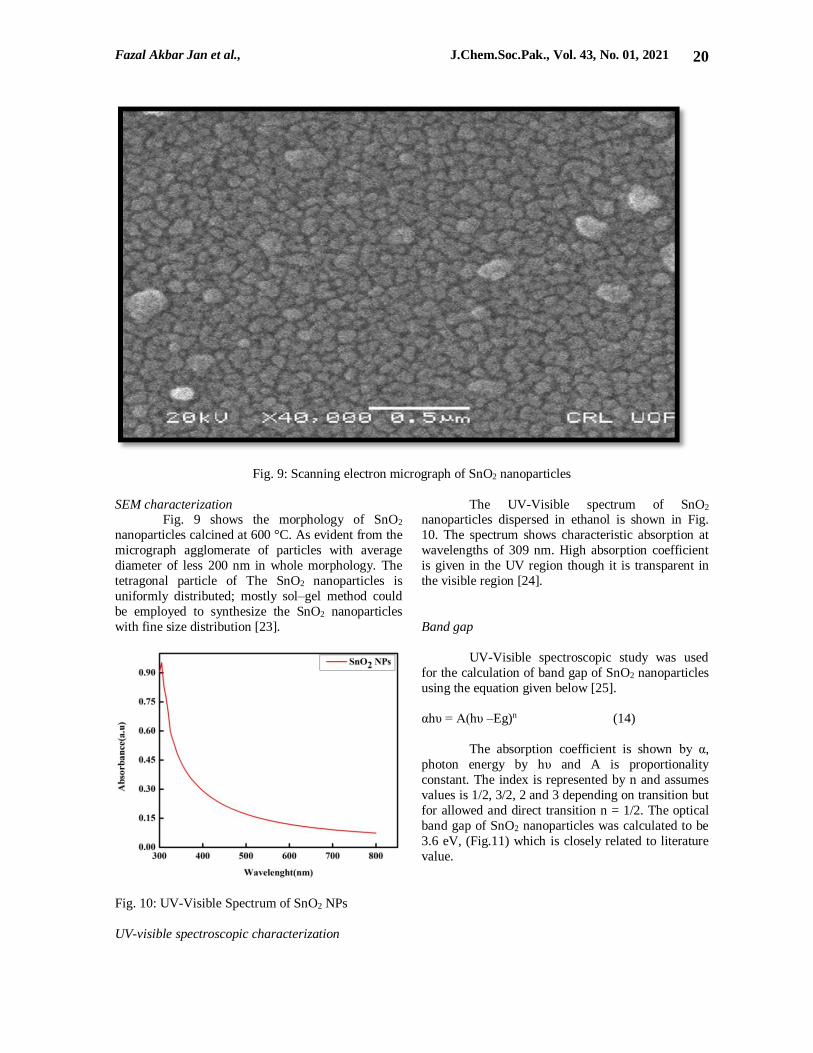
Fig. 9: Scanning electron micrograph of SnO2 nanoparticles
SEM characterization Fig. 9 shows the morphology of SnO2
nanoparticles calcined at 600 °C. As evident from the
micrograph agglomerate of particles with average
diameter of less 200 nm in whole morphology. The
tetragonal particle of The SnO2 nanoparticles is
uniformly distributed; mostly sol–gel method could
be employed to synthesize the SnO2 nanoparticles
with fine size distribution [23].
Fig. 10: UV-Visible Spectrum of SnO2 NPs
UV-visible spectroscopic characterization
The UV-Visible spectrum of SnO2 nanoparticles dispersed in ethanol is shown in Fig.
10. The spectrum shows characteristic absorption at
wavelengths of 309 nm. High absorption coefficient
is given in the UV region though it is transparent in
the visible region [24].
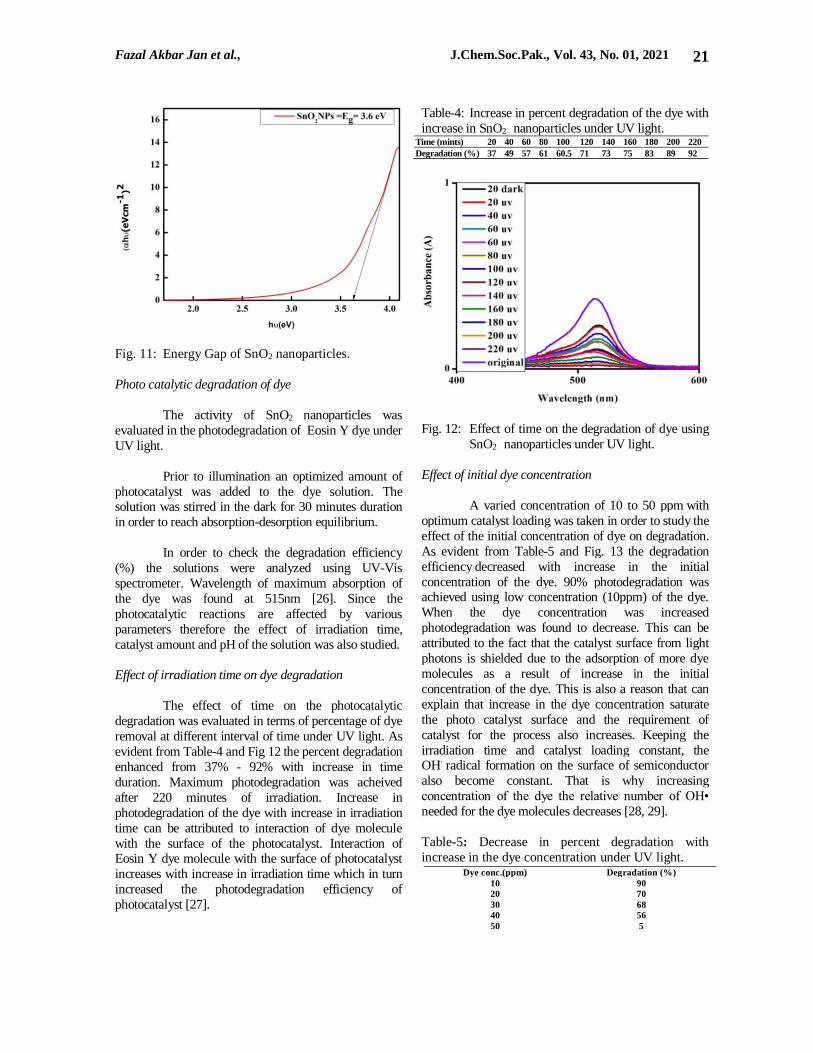
Band gap
UV-Visible spectroscopic study was used
for the calculation of band gap of SnO2 nanoparticles
using the equation given below [25].
αhυ = A(hυ –Eg)n (14)
The absorption coefficient is shown by α,
photon energy by hυ and A is proportionality
constant. The index is represented by n and assumes
values is 1/2, 3/2, 2 and 3 depending on transition but
for allowed and direct transition n = 1/2. The optical
band gap of SnO2 nanoparticles was calculated to be
3.6 eV, (Fig.11) which is closely related to literature
value.
Fazal Akbar Jan et al., J.Chem.Soc.Pak., Vol. 43, No. 01, 2021 21
Fig. 11: Energy Gap of SnO2 nanoparticles.
Photo catalytic degradation of dye
The activity of SnO2 nanoparticles was
evaluated in the photodegradation of Eosin Y dye under
UV light.
Prior to illumination an optimized amount of
photocatalyst was added to the dye solution. The solution was stirred in the dark for 30 minutes duration
in order to reach absorption-desorption equilibrium.
In order to check the degradation efficiency
(%) the solutions were analyzed using UV-Vis
spectrometer. Wavelength of maximum absorption of
the dye was found at 515nm [26]. Since the
photocatalytic reactions are affected by various
parameters therefore the effect of irradiation time,
catalyst amount and pH of the solution was also studied.
Effect of irradiation time on dye degradation
The effect of time on the photocatalytic
degradation was evaluated in terms of percentage of dye
removal at different interval of time under UV light. As
evident from Table-4 and Fig 12 the percent degradation
enhanced from 37% - 92% with increase in time
duration. Maximum photodegradation was acheived
after 220 minutes of irradiation. Increase in
photodegradation of the dye with increase in irradiation
time can be attributed to interaction of dye molecule
with the surface of the photocatalyst. Interaction of Eosin Y dye molecule with the surface of photocatalyst
increases with increase in irradiation time which in turn
increased the photodegradation efficiency of
photocatalyst [27].
Table-4: Increase in percent degradation of the dye with
increase in SnO2 nanoparticles under UV light. Time (mints) 20 40 60 80 100 120 140 160 180 200 220
Degradation (%) 37 49 57 61 60.5 71 73 75 83 89 92
Fig. 12: Effect of time on the degradation of dye using
SnO2 nanoparticles under UV light.
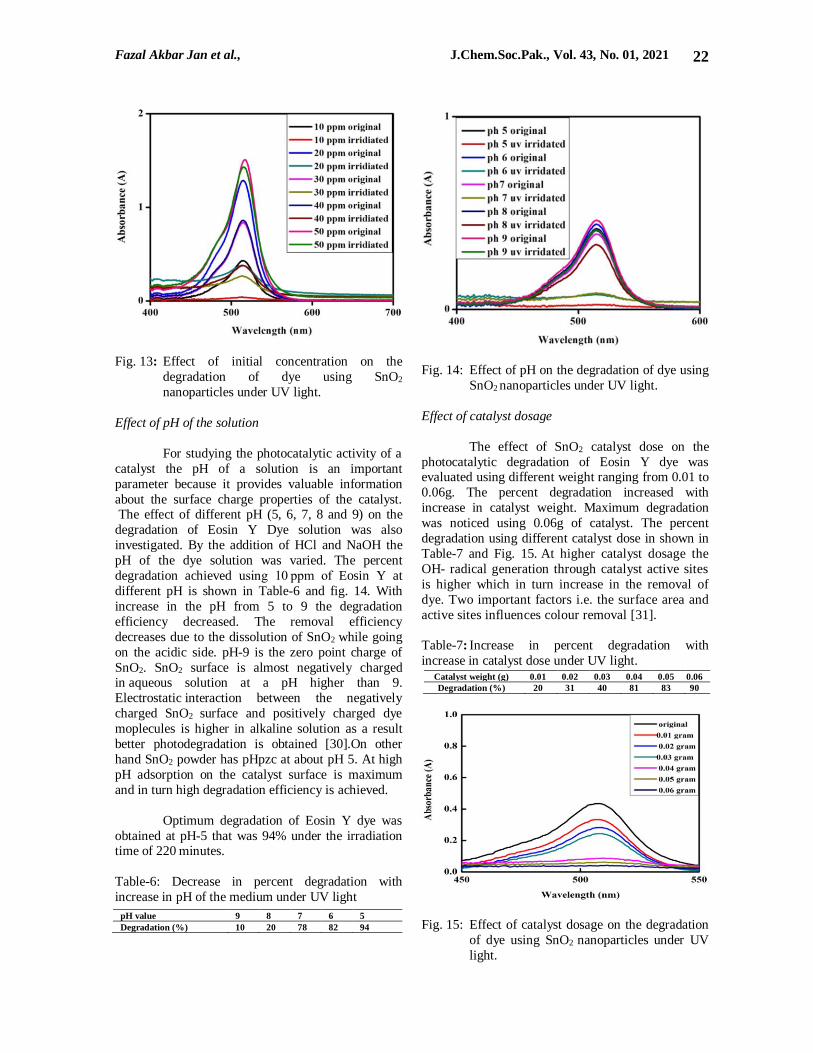
Effect of initial dye concentration
A varied concentration of 10 to 50 ppm with
optimum catalyst loading was taken in order to study the
effect of the initial concentration of dye on degradation.
As evident from Table-5 and Fig. 13 the degradation
efficiency decreased with increase in the initial
concentration of the dye. 90% photodegradation was achieved using low concentration (10ppm) of the dye.
When the dye concentration was increased
photodegradation was found to decrease. This can be
attributed to the fact that the catalyst surface from light
photons is shielded due to the adsorption of more dye
molecules as a result of increase in the initial
concentration of the dye. This is also a reason that can
explain that increase in the dye concentration saturate
the photo catalyst surface and the requirement of
catalyst for the process also increases. Keeping the
irradiation time and catalyst loading constant, the OH· radical formation on the surface of semiconductor
also become constant. That is why increasing
concentration of the dye the relative number of OH•
needed for the dye molecules decreases [28, 29].
Table-5: Decrease in percent degradation with
increase in the dye concentration under UV light.
Dye conc.(ppm) Degradation (%)
10 90
20 70
30 68
40 56
50 5
Fazal Akbar Jan et al., J.Chem.Soc.Pak., Vol. 43, No. 01, 2021 22
Fig. 13: Effect of initial concentration on the
degradation of dye using SnO2
nanoparticles under UV light.
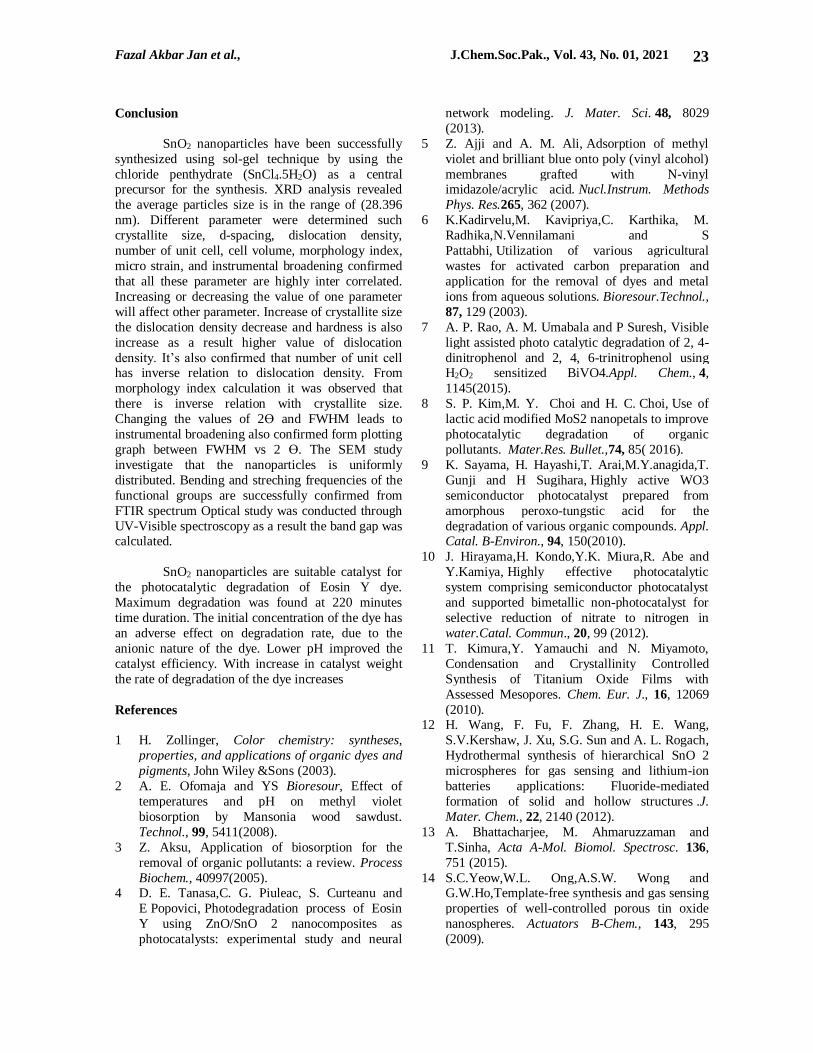
Effect of pH of the solution
For studying the photocatalytic activity of a
catalyst the pH of a solution is an important
parameter because it provides valuable information
about the surface charge properties of the catalyst. The effect of different pH (5, 6, 7, 8 and 9) on the
degradation of Eosin Y Dye solution was also
investigated. By the addition of HCl and NaOH the
pH of the dye solution was varied. The percent
degradation achieved using 10 ppm of Eosin Y at
different pH is shown in Table-6 and fig. 14. With
increase in the pH from 5 to 9 the degradation
efficiency decreased. The removal efficiency
decreases due to the dissolution of SnO2 while going
on the acidic side. pH-9 is the zero point charge of
SnO2. SnO2 surface is almost negatively charged in aqueous solution at a pH higher than 9.
Electrostatic interaction between the negatively
charged SnO2 surface and positively charged dye
moplecules is higher in alkaline solution as a result
better photodegradation is obtained [30].On other
hand SnO2 powder has pHpzc at about pH 5. At high
pH adsorption on the catalyst surface is maximum
and in turn high degradation efficiency is achieved.
Optimum degradation of Eosin Y dye was
obtained at pH-5 that was 94% under the irradiation time of 220 minutes.
Table-6: Decrease in percent degradation with
increase in pH of the medium under UV light
Fig. 14: Effect of pH on the degradation of dye using
SnO2 nanoparticles under UV light.
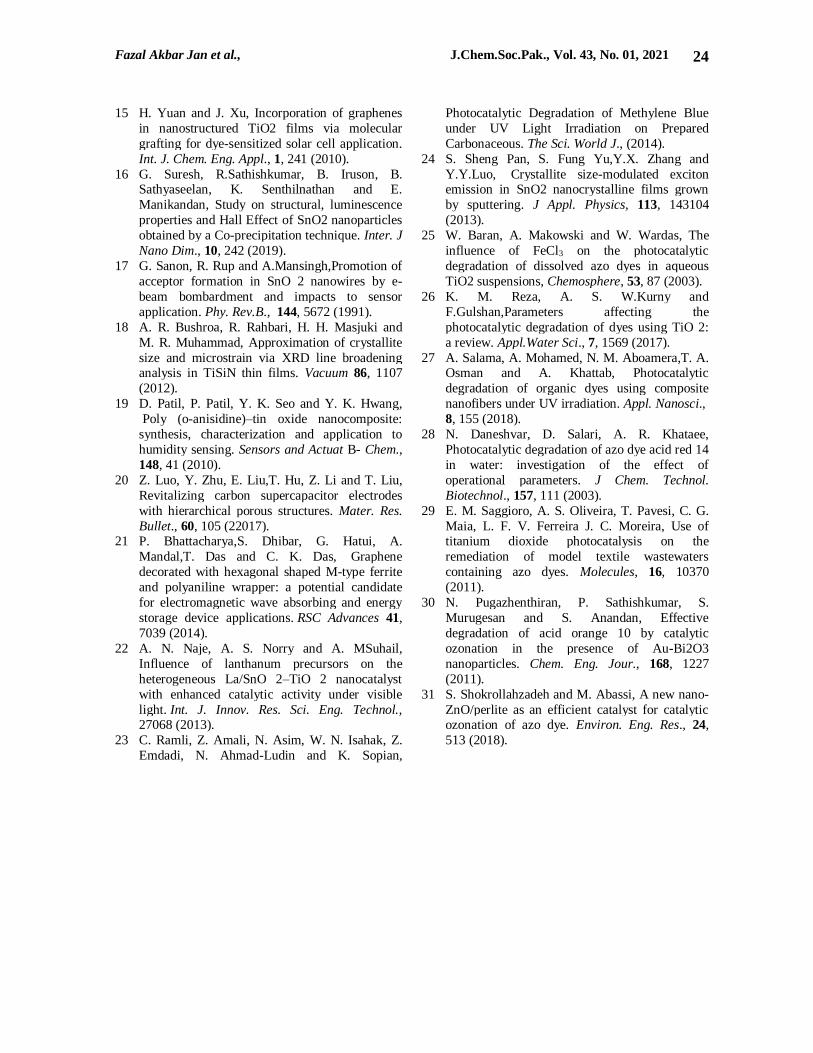
Effect of catalyst dosage
The effect of SnO2 catalyst dose on the
photocatalytic degradation of Eosin Y dye was evaluated using different weight ranging from 0.01 to
0.06g. The percent degradation increased with
increase in catalyst weight. Maximum degradation
was noticed using 0.06g of catalyst. The percent
degradation using different catalyst dose in shown in
Table-7 and Fig. 15. At higher catalyst dosage the
OH- radical generation through catalyst active sites
is higher which in turn increase in the removal of
dye. Two important factors i.e. the surface area and
active sites influences colour removal [31].
Table-7: Increase in percent degradation with
increase in catalyst dose under UV light.
Fig. 15: Effect of catalyst dosage on the degradation
of dye using SnO2 nanoparticles under UV
light.
pH value 9 8 7 6 5
Degradation (%) 10 20 78 82 94
Catalyst weight (g) 0.01 0.02 0.03 0.04 0.05 0.06
Degradation (%) 20 31 40 81 83 90
Fazal Akbar Jan et al., J.Chem.Soc.Pak., Vol. 43, No. 01, 2021 23
Conclusion
SnO2 nanoparticles have been successfully
synthesized using sol-gel technique by using the
chloride penthydrate (SnCl4.5H2O) as a central precursor for the synthesis. XRD analysis revealed
the average particles size is in the range of (28.396
nm). Different parameter were determined such
crystallite size, d-spacing, dislocation density,
number of unit cell, cell volume, morphology index,
micro strain, and instrumental broadening confirmed
that all these parameter are highly inter correlated.
Increasing or decreasing the value of one parameter
will affect other parameter. Increase of crystallite size
the dislocation density decrease and hardness is also
increase as a result higher value of dislocation
density. It’s also confirmed that number of unit cell has inverse relation to dislocation density. From
morphology index calculation it was observed that
there is inverse relation with crystallite size.
Changing the values of 2Ɵ and FWHM leads to
instrumental broadening also confirmed form plotting
graph between FWHM vs 2 Ɵ. The SEM study
investigate that the nanoparticles is uniformly
distributed. Bending and streching frequencies of the
functional groups are successfully confirmed from
FTIR spectrum Optical study was conducted through
UV-Visible spectroscopy as a result the band gap was calculated.
SnO2 nanoparticles are suitable catalyst for
the photocatalytic degradation of Eosin Y dye.
Maximum degradation was found at 220 minutes
time duration. The initial concentration of the dye has
an adverse effect on degradation rate, due to the
anionic nature of the dye. Lower pH improved the
catalyst efficiency. With increase in catalyst weight
the rate of degradation of the dye increases
References
1 H. Zollinger, Color chemistry: syntheses,
properties, and applications of organic dyes and
pigments, John Wiley &Sons (2003).
2 A. E. Ofomaja and YS Bioresour, Effect of
temperatures and pH on methyl violet
biosorption by Mansonia wood sawdust.
Technol., 99, 5411(2008).
3 Z. Aksu, Application of biosorption for the
removal of organic pollutants: a review. Process
Biochem., 40997(2005). 4 D. E. Tanasa,C. G. Piuleac, S. Curteanu and
E Popovici, Photodegradation process of Eosin
Y using ZnO/SnO 2 nanocomposites as
photocatalysts: experimental study and neural
network modeling. J. Mater. Sci. 48, 8029
(2013).
5 Z. Ajji and A. M. Ali, Adsorption of methyl
violet and brilliant blue onto poly (vinyl alcohol)
membranes grafted with N-vinyl imidazole/acrylic acid. Nucl.Instrum. Methods
Phys. Res.265, 362 (2007).
6 K.Kadirvelu,M. Kavipriya,C. Karthika, M.
Radhika,N.Vennilamani and S
Pattabhi, Utilization of various agricultural
wastes for activated carbon preparation and
application for the removal of dyes and metal
ions from aqueous solutions. Bioresour.Technol.,
87, 129 (2003).
7 A. P. Rao, A. M. Umabala and P Suresh, Visible
light assisted photo catalytic degradation of 2, 4-
dinitrophenol and 2, 4, 6-trinitrophenol using H2O2 sensitized BiVO4.Appl. Chem., 4,
1145(2015).
8 S. P. Kim,M. Y. Choi and H. C. Choi, Use of
lactic acid modified MoS2 nanopetals to improve
photocatalytic degradation of organic
pollutants. Mater.Res. Bullet.,74, 85( 2016).
9 K. Sayama, H. Hayashi,T. Arai,M.Y.anagida,T.
Gunji and H Sugihara, Highly active WO3
semiconductor photocatalyst prepared from
amorphous peroxo-tungstic acid for the
degradation of various organic compounds. Appl. Catal. B-Environ., 94, 150(2010).
10 J. Hirayama,H. Kondo,Y.K. Miura,R. Abe and
Y.Kamiya, Highly effective photocatalytic
system comprising semiconductor photocatalyst
and supported bimetallic non-photocatalyst for
selective reduction of nitrate to nitrogen in
water.Catal. Commun., 20, 99 (2012).
11 T. Kimura,Y. Yamauchi and N. Miyamoto,
Condensation and Crystallinity Controlled
Synthesis of Titanium Oxide Films with
Assessed Mesopores. Chem. Eur. J., 16, 12069
(2010). 12 H. Wang, F. Fu, F. Zhang, H. E. Wang,
S.V.Kershaw, J. Xu, S.G. Sun and A. L. Rogach,
Hydrothermal synthesis of hierarchical SnO 2
microspheres for gas sensing and lithium-ion
batteries applications: Fluoride-mediated
formation of solid and hollow structures .J.
Mater. Chem., 22, 2140 (2012).
13 A. Bhattacharjee, M. Ahmaruzzaman and
T.Sinha, Acta A-Mol. Biomol. Spectrosc. 136,
751 (2015).
14 S.C.Yeow,W.L. Ong,A.S.W. Wong and G.W.Ho,Template-free synthesis and gas sensing
properties of well-controlled porous tin oxide
nanospheres. Actuators B-Chem., 143, 295
(2009).
Fazal Akbar Jan et al., J.Chem.Soc.Pak., Vol. 43, No. 01, 2021 24
15 H. Yuan and J. Xu, Incorporation of graphenes
in nanostructured TiO2 films via molecular
grafting for dye-sensitized solar cell application.
Int. J. Chem. Eng. Appl., 1, 241 (2010).
16 G. Suresh, R.Sathishkumar, B. Iruson, B. Sathyaseelan, K. Senthilnathan and E.
Manikandan, Study on structural, luminescence
properties and Hall Effect of SnO2 nanoparticles
obtained by a Co-precipitation technique. Inter. J
Nano Dim., 10, 242 (2019).
17 G. Sanon, R. Rup and A.Mansingh,Promotion of
acceptor formation in SnO 2 nanowires by e-
beam bombardment and impacts to sensor
application. Phy. Rev.B., 144, 5672 (1991).
18 A. R. Bushroa, R. Rahbari, H. H. Masjuki and
M. R. Muhammad, Approximation of crystallite
size and microstrain via XRD line broadening analysis in TiSiN thin films. Vacuum 86, 1107
(2012).
19 D. Patil, P. Patil, Y. K. Seo and Y. K. Hwang,
Poly (o-anisidine)–tin oxide nanocomposite:
synthesis, characterization and application to
humidity sensing. Sensors and Actuat B- Chem.,
148, 41 (2010).
20 Z. Luo, Y. Zhu, E. Liu,T. Hu, Z. Li and T. Liu,
Revitalizing carbon supercapacitor electrodes
with hierarchical porous structures. Mater. Res.
Bullet., 60, 105 (22017). 21 P. Bhattacharya,S. Dhibar, G. Hatui, A.
Mandal,T. Das and C. K. Das, Graphene
decorated with hexagonal shaped M-type ferrite
and polyaniline wrapper: a potential candidate
for electromagnetic wave absorbing and energy
storage device applications. RSC Advances 41,
7039 (2014).
22 A. N. Naje, A. S. Norry and A. MSuhail,
Influence of lanthanum precursors on the
heterogeneous La/SnO 2–TiO 2 nanocatalyst
with enhanced catalytic activity under visible
light. Int. J. Innov. Res. Sci. Eng. Technol., 27068 (2013).
23 C. Ramli, Z. Amali, N. Asim, W. N. Isahak, Z.
Emdadi, N. Ahmad-Ludin and K. Sopian,
Photocatalytic Degradation of Methylene Blue
under UV Light Irradiation on Prepared
Carbonaceous. The Sci. World J., (2014).
24 S. Sheng Pan, S. Fung Yu,Y.X. Zhang and
Y.Y.Luo, Crystallite size-modulated exciton emission in SnO2 nanocrystalline films grown
by sputtering. J Appl. Physics, 113, 143104
(2013).
25 W. Baran, A. Makowski and W. Wardas, The
influence of FeCl3 on the photocatalytic
degradation of dissolved azo dyes in aqueous
TiO2 suspensions, Chemosphere, 53, 87 (2003).
26 K. M. Reza, A. S. W.Kurny and
F.Gulshan,Parameters affecting the
photocatalytic degradation of dyes using TiO 2:
a review. Appl.Water Sci., 7, 1569 (2017).
27 A. Salama, A. Mohamed, N. M. Aboamera,T. A. Osman and A. Khattab, Photocatalytic
degradation of organic dyes using composite
nanofibers under UV irradiation. Appl. Nanosci.,
8, 155 (2018).
28 N. Daneshvar, D. Salari, A. R. Khataee,
Photocatalytic degradation of azo dye acid red 14
in water: investigation of the effect of
operational parameters. J Chem. Technol.
Biotechnol., 157, 111 (2003).
29 E. M. Saggioro, A. S. Oliveira, T. Pavesi, C. G.
Maia, L. F. V. Ferreira J. C. Moreira, Use of titanium dioxide photocatalysis on the
remediation of model textile wastewaters
containing azo dyes. Molecules, 16, 10370
(2011).
30 N. Pugazhenthiran, P. Sathishkumar, S.
Murugesan and S. Anandan, Effective
degradation of acid orange 10 by catalytic
ozonation in the presence of Au-Bi2O3
nanoparticles. Chem. Eng. Jour., 168, 1227
(2011).
31 S. Shokrollahzadeh and M. Abassi, A new nano-
ZnO/perlite as an efficient catalyst for catalytic ozonation of azo dye. Environ. Eng. Res., 24,
513 (2018).