Discount for Lack of Marketability - Internal Revenue Service

Competitiveness and Marketability of Vegetable Oils,Oilmeals, and Plant Equipment for
Processing of Oilseeds and Oilsin the Baltic States
Sanjeev Agarwal and John Wong
MA TRIC Working Paper 96-MWP 1August 1996
Midwest Agribusiness Trade Research and Information CenterIowa State University
Ames, IA 50011
Sanjeev Agarwal and John Wong are associate professors of marketing, College of Business, Iowa State University
This report summarizes a MA TRICfunded research project examining competitiveness and marketability issues inthe oilseed industries of Lithuania, Latvia, and Estonia.
MATRIC is supported by the Cooperative State Research, Education, and Extension Service, U.S. Department ofAgriculture, under Agreement No. 95-34285-1303. Any opinions, findings, conclusions, or recommendationsexpressed in this publication are those of the authors and do not necessarily reflect the view of the U.S. Departmentof Agriculture.
`
The contents of this report may be cited with proper credit to the authors and to AM TRIC at Iowa State University.

CONTENTS
Introduction ............................................................................................................................................. I
Rapeseed.................................................................................................................................................. 3
Cultivation of Rapeseed .......................................................................................................................... 4
Production of Rapeseed oil ..................................................................................................................... 6
Demand for Rapeseed Oil ....................................................................................................................... 9
Prices ..................................................................................................................................................... 10
Demand for Oilmeals ............................................................................................................................ 11
Strategies ............................................................................................................................................... 12
Market for Oil Crushing and Refining Equipment ............................................................................... 16
APPENDIX A.
Economics of Oil Expelling (20 TPD) ....................................................................... 25
APPENDIX B.
Economics of of Oil Refining (10 TPD)..................................................................... 27
APPENDIX C.
Country Profiles .......................................................................................................... 29
Endnotes ................................................................................................................................................ 33

FIGURES
Figure 1. The Baltic States................................................................................................................... 17
TABLES
Table 1. World Oilseed Cultivation (million metric tons)................................................................... 17
Table 2. Total Oil Production for 1991/92 (`000 tons)........................................................................ 18
Table 3. Per Head Vegetable Oil Consumption, 1983/84-1991/92 ..................................................... 19
Table 4. Estimated Vegetable Oil Demand in the Baltics.................................................................... 19
Table 5. World Livestock Populations, 1990....................................................................................... 20
Table 6. World Oilmeal Consumption by Region 1983/84-1991/92 (`000 tons) ................................ 21
Table 7. World Oilmeal Consumption by Type and Region, 1991/92 (`000 tons).............................. 22
Table 8. Livestock Populations in the Baltics, 1990/92....................................................................... 23
Table 9. Average Protein Consumption in kg per Livestock Unit, 1990............................................. 23

ACKNOWLEDGMENTS
This project assesses the competitiveness and marketability of vegetable oils, oilmeals, and
evaluates plants and processing equipment used for oilseeds in Estonia, Latvia, and Lithuania. The
midwestern states are major processors of oilseeds and also major suppliers of equipment for processing
of oilseeds and oils (including handling and storage, oil extraction, oil refining, value added processing,
meal handling and storage, pelletizing, extruding, and protein extraction). With many of these
companies poised to benefit from a better understanding of the marketing and investment opportunities
in the Baltic States, it is important that a comprehensive technological and market study be conducted to
help companies develop an action plan.
Our study included a search of secondary publications, analysis of information supplied by oil
processing equipment suppliers, and conducting a field study that included interviews with government,
farm, and industry representatives as well as visits to producers and processing plants in the three Baltic
States in June and July 1994.
We want to extend our special thanks to Dr. George Uldis Liepa, Professor, Department of Nutrition
and Food Sciences, Texas Women's University, Denton, for accompanying Dr. Agarwal on a field trip to
the Baltics. Without his invaluable cooperation, enthusiasm, and local networking, this research would
have been difficult. We also want to thank Dr. Olafs Stengrevics, Director, BBL Ltd., Riga, a friend of
Dr. Liepa, for arranging meetings with government, farm, and industry representatives. He not only
arranged meetings for us, but visited with us whenever we needed his moral and intellectual support. His
cheerful and enthusiastic disposition helped us get through some challenging times.
We must mention that many other people helped clear hurdles in arranging meetings with relevant
officials and businesspersons. Especially notable are Dr. Natalija Kazlauskiene, Unit Head, International
Trade Development, Ministry of Agriculture, Republic of Lithuania, for arranging meetings for us in
Lithuania and Mr. Ruve Sank, Vice Chancellor, Ministry of Agriculture, Republic of Estonia, for
arranging meetings for us in Estonia. The project would not have been completed without the input of all
those whom we interviewed and who provided invaluable information to us. We are also thankful to
Honorable Mr. Olgerts Pavlovskis, State Minister for EU Affairs and Foreign Trade, Ministry of Foreign
Affairs, Republic of Latvia. He enthusiastically endorsed our belief that the Baltic states need several

)rivately owned, small-scale oilseed and oil processing plants. We are extremely encouraged by h
support and the support of many others whose ideas are imbedded in this report.
Finally, we would like to extend our special thanks to Dr. William H. Meyers, Director of MATRIC,
Iowa State University, for sponsoring this project and providing us with support. We also thank Kate
Pokorny and Lori Dooley for their assistance with this project.
-Sanjeev Agarwal and John Wong
COMPETITIVENESS AND MARKETABILITY OF VEGETABLE OILS,OILMEALS, AND PLANT EQUIPMENT FOR PROCESSING OF OILSEEDS
AND OILS IN THE BALTIC STATES
Introduction
The Baltic States of Estonia, Latvia, and Lithuania (see Figure 1), formerly part of the Soviet
Union, have a rich tradition in agriculture. Besides agriculture, these countries have also been at the
forefront of processing, manufacturing, and research and development activities within the former Soviet
Union. However, after the collapse of the Soviet Union and eventual severing of the political and
economic alliance with Russia, the three countries found themselves in a difficult situation. The
problems arose from their previous high degree of integration with, and dependence on, Russia.
Both agriculture and industrial sectors in the Baltics were planned and established by the former
Soviets as links in long manufacturing and supply chains spanning the Soviet land. The sourcing of
capital, raw materials, components, and machineries and eventual transportation, utilization, and
consumption of outputs was planned by the bureaucratic machinery based in Moscow. With the collapse
of the Soviet system and eventually the Russian economy, both farm and manufacturing operations in the
Baltic States lost their upstream sourcing as well as downstream supply/distribution links. This forced
many farm and industrial operators to go out of business. Only those operators that used local raw
materials and whose outputs were primarily consumed locally, such as dairies, confectioneries,
breweries, meat processors, and some canneries, survived. Consequently, the successful farm operators
were those who produced agricultural products that supported these manufacturing operations.
For Estonia, Latvia, and Lithuania, the problems created by the severance of the alliance with
Russia have been intensified due to the transition towards a market economy. Agricultural subsidies
have been scrapped and competition from the West permitted since these are essential preconditions for
transition to an efficient and competitive, market-oriented agricultural sector. Though price
liberalizations have increased prices sharply, including retail and farm procurement prices, procurement
prices have not risen enough to encourage farming operations.
Moreover, Western goods have flooded the markets. The immediate effect of these open door
policies has been that consumers have dumped the shoddy Russian style consumer products in favor of
quality Western products. The agricultural sector has been similarly set back because Western produce is
now available in the Baltics at lower prices than those for domestic produce. Partly because of heavy
2 / Sanjeev Agarwa! and John Wong
European Union subsidies and partly because of lower processing costs, better quality products from the
West are available in the Baltics at prices that are well below the prices of locally produced products.
Trade policy has attempted to protect the fragile state of the domestic agriculture sectors from
(often subsidized) imports and tried to promote production to meet domestic demand. In Latvia, for
example, import duties of 7.5 percent were introduced in 1992 on many products, including sugar,
vegetable oil, and grain products.' The problem, however, is that the size of the domestic market is so
small that it makes it difficult to justify establishing large-scale production/manufacturing operations.
Additionally, the small potential market that there is, is already serviced by Western products, even
though their import is subject in many cases to restrictions or tariffs.
The drop in domestic demand for locally made products, together with high input prices and a
slump in export demand, has created an extremely difficult market situation. Both agricultural and
industrial sectors are deeply in debt and illiquid. Large-scale financial collapse of state and collective
farms has given way to subsistence farming in the private sector. Likewise, the collapse of many state-
owned factories and cooperatives has given way to entrepreneurs who lease parts of factories and
conduct private business. While these kinds of activities show signs of budding private enterprise, the
i mmediate outlook does not appear to be encouraging. This can be largely attributed to the lack of
capital among farmers and entrepreneurs. Capital is available from private banks and can be borrowed.
However, astronomically high interest rates have made it difficult to establish business, especially those
that can legitimately compete with those in the West.
The farmers, as a consequence, are very pessimistic and reluctant to borrow funds to cultivate crops
and raise livestock that will eventually compete with products from the West. Both governments and
consumers recognize that agriculture can no longer be viewed as a sector from which it is possible to earn
hard currency export income or to even save hard currency through import substitution.
In spite of this difficult past, it is important for farmers, entrepreneurs, and governments to identify
and evaluate crops that can be profitable and can be cultivated and converted into value-added products
for consumers and industry. One crop that is highly valued is rapeseed. Demand for rapeseed is growing
worldwide; Western European countries are consuming more than they can produce. Therefore, the
danger of being flooded with cheap Western rapeseed is minimal.
Oil can be extracted from rapeseed and refined for human consumption in local processing plants.
The benefit of seed processing plants is that the three countries can capture the rapeseed crop and

Competitiveness and Marketability of Vegetable Oils... / 3
produce highly desirable vegetable oil for human and nonhuman consumption. The by-product is another
i mportant product, oilmeal-a high protein source-for animal feed.
Consumers are moving away from using animal fat and butter because of harmful health effects?
Vegetable oil is therefore a preferred product. Currently, completely refined vegetable oil is not
produced in any of the three countries. Refined oil is being imported for consumers as well as for
downstream processing of mayonnaise, margarine, soap, and similar products. Protein for animal feed is
i mportant to sustain the dairy and livestock industry. Currently, there is a serious shortage of protein
additives in each of the three countries, so they are being imported from the West. In some cases,
farmers are feeding raw seed to the cattle as protein supplements. This is highly inefficient use of the
seeds because, in addition to the protein, large quantities of high-value oil are being fed to the animals.
Moreover, a large amount of oil is not good for the animals.
Rapeseed
A number of farmers have expressed a willingness to grow rapeseed.' Only if the farmers are
assured that there is a market for their seeds locally, will they be encouraged to cultivate the crop. At
present, rapeseed cultivation is negligible. However, there is substantial potential for it to grow but
cultivation and processing must be coordinated correctly and cooperatively.
The Baltic States need to encourage private or cooperative establishment of small-scale rapeseed
(both seed and oil) processing plants at various growing centers throughout the three countries. This will
revive the cultivation of a cash crop that can enhance the well-being of the farmers and the consumers.
As the crop output increases, the processing plants can be expanded to process more rapeseed.
Rapeseed oil is low in erucic acid and glucosinolates, elements that present potential health risks to
humans and reduce the palatability and nutritional value as feed." Because of the implied health benefits
associated with the lowest saturated-fat content among all major vegetable oils, rapeseed has become a
major source of vegetable oil worldwide.
The demand for rapeseed, like any other vegetable oil source, is derived from its value as an input
in oil and oilmeal. Rapeseed contains roughly 40 percent oil, which typically accounts for 60 to 70
percent of the overall seed value. The oil is suitable for use in salads and cooking oils and baking and
frying fats. Farther along the marketing channel, rapeseed oil reaches consumers in processed foods such
as potato chips, salad dressings, mayonnaise, baked goods, and candies.

4 / Sanjeev Agarwal and John Wong
Another component of rapeseed demand is oilmeal. Demand for oilmeal is driven by the demand
for balanced feed concentrates, which depend upon the size and composition of the livestock herd. In
this market, the rapeseed meal competes with soybean, cottonseed, linseed, and sunflower-seed meals.
Rapeseed meal accounts for 55 to 57 percent of the seed weight in contrast to other oilseeds, such as
soybean and cottonseed, that contain in excess of 80 percent meal. Crude protein in rapeseed generally
ranges between 35 and 38 percent, significantly lower than soybean meal, which contains 44 to 49
percent crude protein. With a smaller market potential and lower feeding value, rapeseed meal is
typically discounted to soybean meal. In recent years, the relationship between soybean meal and
rapeseed meal has remained relatively constant. Though the price of rapeseed meal is an average of 35
percent below the price of soybean meal, it still costs about US$150 per ton.'
Cultivation of Rapeseed
The World
Worldwide production of all rapeseed has risen rapidly over the past two decades and now ranks
third in world oilseed cultivation (Table 1). Rapeseed is one of the few edible oil crops that can be
cultivated in northern latitudes. In most northerly growing locations such as Canada, rapeseed is grown
as a spring crop but in other areas, such as Western Europe, it is largely a winter-planted crop that is
higher yielding. Yields in Europe and Poland are much higher than in other parts of the world (2.73 tons
per hectare [tph] in Europe and 2.47 tph in Poland).
The Region
The former Soviet Union (USSR) produced only a fraction of the world's rapeseed output. In recent
years, Soviet output averaged about 55,000 tons of rapeseed per year. In contrast, the USSR's neighbor
to the South, China, produced 5.6 million tons in 1985, and Czechoslovakia, Poland, the German
Democratic Republic, and Yugoslavia all outproduced the USSR. This situation irritated Soviet
agricultural officials, who publicly chided Baltic and Belorussian farmers for producing a paltry 2,5006tons of rapeseed while their Polish neighbors produced 1.1 million tons

Competitiveness and Marketability of Vegetable Oils.../ 5
The Baltics
Estonia. Mr. Toomas Kevvai,' with the Ministry of Agriculture, indicated that there were 2,600
hectares of rapeseed cultivated in 1992. The yield was 0.8 tph, the lowest of all three republics.
Growing and harvesting technology in the Baltics is substandard and results in lower yields'
The government estimates that up to 30,000 hectares of rapeseed could be planted and the entire oil
requirement for the country can be supplied with this seed output. In addition, up to 50 percent of the oil
meal requirement can be grown domestically. Currently, however, only fragmented cultivation of
rapeseed is seen throughout Estonia.
Latvia. Free Latvia experimented with rapeseed by planting an estimated 3,000 hectares in 1993'
The total output was about 4,500 tons, which translates to a yield of 1.5 tph. The farmers are very
reluctant to increase rapeseed cultivation because there is no local demand for it. In the past, they have
had considerable losses because the product had to be sold to the West at discounted prices. Part of the
problem was that they did not have appropriate technology for drying and maintaining the quality of the
seeds.
Privately, Canadian Agra" has a joint venture farm on 1,500 hectares in southern Latvia. Canadian
Agra buys the seeds from the West and sells to farmers and consults on planting. The output from these
farms has been sold to Denmark at about US$200 per ton plus transportation. The firm is interested in
increasing the land under cultivation but finds itself constrained by lack of downstream processing
facilities in the country.
Lithuania. Free Lithuania did a little better and produced 8,000 metric tons of rapeseed in 1993.
Because of the lack of seed processing facilities, 4,000 tons of the seeds were exported to Denmark.
According to Mr. Rimas Varkulevichius' 2 , the Director of the Department of International Relations,
Ministry of Agriculture, Republic of Lithuania, 6,000 hectares were planted in winter 1994. Unfriendly
weather, however, destroyed 80 percent of the crop. In the summer of 1994, 10,000 hectares were
planted and he expected the yield to be about 20,000 tons (or about 2.0 tph). Lithuania's rapeseed yield
of about 2.0 tph is good compared with 2.47 in Poland, 2.73 in EC and 1.21 in Canada." According to
Mr. Varkulevichius, the plans are to eventually raise the seed output to 140,000 metric tons. The
government of Lithuania is providing some financial assistance and crop protection to farmers.
6 / Sanjeev Agarwal and John Wong
Production of Rapeseed Oil
The World
Rapeseed is a major source of vegetable oil worldwide. Rapeseed oil is the third most produced oil
in the world, just behind soybean and palm oil. Total oil production in 1991/92 was 63.117 million tons,
of which rapeseed oil was 9.505 million tons. The world production of major vegetable oils by country
is shown in Table 2.
The Region
The main sources of vegetable oil in Russia and the former Soviet republics are sunflower seed and
cottonseed. Rapeseed production has increased in Poland. The rapeseed output in Poland is about
1,200,000 tons, which means that rapeseed oil output is between 400,000 and 500,000 tons per year.
The Baltics
Estonia. According to Mr. Toomas Kevvai, a counselor with the Ministry of Agriculture, Estonia
has three cooperatives/unions that extract/expel oil from rapeseeds. Only one of them, Oruraps, Ltd., in
Hari county, is operative. The plant capacity is 2,500 tons of seeds per year but it may be only
processing about 1,000 tons per year at the present time. In 1992, the three producers formed a Rapeseed
Producers' Association (RPA) under the auspices of the Association of Estonian Food Industry (AEFI).
According to Mr. Roland Ilp, the Chancellor of AEFI and the Director of RPA, Estonia had one
margarine plant, the Tallinn Perfumery and Margarine Plant, that, at its peak, produced 6,000 tons of
margarine per year. This plant is, however, not functioning any more. In its place is a brand new plant,
supplied by a Swedish firm, Tetra Laval Food, formerly known as Alfa Laval. The plant has a capacity
to refine/hydrogenate 15,000 tons of rapeseed oil per year and convert it into 22,000 tons of margarine.
The plant was one of ten plants purchased by the former Soviet government in 1989. Interestingly,
only four of the ten plants have been installed." Others, including the one in Estonia, remain partially in
boxes, unopened. Tetra Laval is not certain whether all parts for the plant arrived in Tallinn and what
remains of it after five years." The Estonian government officials estimate that they have already spent
US$6 million on this plant. Additional investment of US$15 million will be needed to complete the
plant. '6 Various foreign firms, including Raizier from Finland, have considered the purchase of this
plant, although no one purchased it until the summer of 1994.
mvetitiveness and Marketabilitv o1 Vezetab,
The original Tallinn Perfumery and Margarine Plant has now been privatized. The current name of
the company is Formeer Ltd. According to its director, Mr. Arvo Hiller, the portion of the old plant that
is operative is a 5-tpd oil refinery. Margarine is no longer produced in this plant. Although a visit to this
plant was not possible, it appears that the plant produces only partially refined oil, meaning that it does
not bleach or deodorize the oil.
Human consumption of unrefined or partially refined oils is not unheard of, but these oils have
impurities that are either harmful or offensive. Since fully refined oil is available from the West, it is
unlikely that a majority of consumers are going to buy the locally produced unrefined or partially refined
oil. An informal survey of housewives, conducted during the site visit, revealed that locally produced so-
called "refined" oil (in some cases, it is simply filtered crude oil; in others, it may be neutralized) has
sediments, is colored, and has a bad smell. Consumers did not mention that the unrefined oils can also
contain high levels of fatty acids that can cause irritation to the throat. The refining process basically
removes all of these impurities to produce colorless, odorless, and acidless product. Most of the
consumers interviewed now purchased imported refined oil. The imported refined oil comes from many
firms located in both Western and Eastern European countries.
The good news for Estonia is that the original Tallinn Perfumery and Margarine Plant is now owned
and operated privately and Mr. Arvo Hiller, its director, wants the plant to complete refining capabilities
and to double its capacity. Mr. Hiller is also negotiating the purchase of the Tetra Laval plant.
The main concern for the new Tetra Laval plant owner is that the plant requires raw oil as its input
rather than the seed and hence cannot survive unless the raw oil is imported or seed crushing plants in the
country can supply the needed quantity. Given the information on seed cultivation at the present time, it
is highly unlikely that Estonia's local seed output will be large enough to support a plant of this size.
Latvia. The only mentionable plant in the entire Baltics to extract/expel oil is located in Liepaja,
Latvia, on the eastern shore of the Baltic Sea. It was built in the 1880s by a Danish firm." At present 30-
year old oilseed pressing and extracting equipment is in the 100-year-old structure. Plant capacity is
45,000 tons of rapeseed or soybean per year. Like most agricultural industry in Latvia, the Liepaja plant
is also state owned and controlled by LEER, a state shareholding company of the Ministry of
Agriculture." The plant is currently operating at one-fourth to one-third its full capacity.
The plant only has a partial refining facility, so the output is not fit for human consumption. A
private company has leased the facility from Liepaja, and is partially refining the Liepaja oil on the
grounds of the Liepaja plant but because the oil is not fully refined, the partially refined oil is sold to a

nieev Azarwal and John Wonq
fish canning factory. The company has contacted Tetra Laval to supply it with additional equipment to
make fully refined oil. Tetra Laval is hesitant at this point to supply equipment because the smallest
capacity plant supplied by them is 40 tpd, whereas the plant probably needs only a 10 tpd deodorizer."
Many foreign companies, including equipment suppliers such as Desmet of Belgium, have
i nspected the facilities at Liepaja and considered the feasibility of purchasing and renovating it."
However, no one has come forward to purchase it. Perhaps the main concern is that the plant is simply
too old and too inefficient to be of much value. Mrs. Irana Anshevica," Senior Manager, LATA
International Ltd., informed us that the American Soybean Association specialists who visited the plant
have recommended "scrapping" the plant. There were some efforts, however, made by LEER in
cooperation with the Canadian Agra to establish a 100 tpd oil refining plant. However, the financing
for such a plant ran into difficulty because the international funding agencies declined to support the
plan.
There are two mayonnaise production facilities, one called Lacplesis Agrofirma and the other called
Balttur (on the premises of Riga Taukvail Kombinat). Both companies are said to be producing about 10
tons of mayonnaise per day. Lacplesis packs their mayonnaise in 250 gram glass bottles, 4 whereas,
Balttur packs them in plastic pouches . 5 Balttur has 14 different flavors/types of mayonnaise that are sold
throughout Latvia.
Lithuania. According to Mr. Rimas Varkulevichius, Lithuania has one seed crushing plant at
Obeliei that can crush 100 tons of seed per day (or about 25,000 to 30,000 tons of seed per year).
According to Mr. Zelvys, formerly the General Director of Grain Processing enterprise, the Obeliei plant
is old and has no future .16 There is also a small oil refinery (or better, oil-cleaning) plant in Vilnius. Just
like the plants in Estonia and Latvia, this plant also produces partially refined oil. Such oil cannot be
expected to compete with the type coming from the West. According to Mr. Varkulevichius, this plant
was opened for privatization to foreign firms. Unilever, a Dutch conglomerate, was said to have shown
some interest but its consultants, KPMG, recommended against the purchase.
Mr. Zelvys, through his private firm, Grudtarna,2' is promoting the idea of constructing a plant to
process 144,000 tons of rapeseed (or 100,000 tons of soybean) per year at Kretinga or Klaipeda.
Subsequent evaluations seemed to favor Kretinga over Klaipeda or other possible sites because of the
availability of an excess steam generation plant and a rail siding. The reasons against Klaipeda include
lack of space in an already crowded port town. The oil output of this plant will be roughly 40,000 tons
and the oilmeal output will be in the range of 100,000 tons per year. Approximately US$400,000 was

Competitiveness and Marketability of Vegetable Oils... / 9
granted by the Canadian government to study the feasibility of this project. The project is estimated to
cost $35 to $40 million and seems to have the approval of the Lithuanian government? 9 The main
i nterest of the Canadian government is to support Canadian companies expected to supply equipment to
the oilseed plant. Canada is not interested in rapeseed exports for the plant from Canada."
The promoters, however, have had considerable difficulty in attracting private out-of-country
i nvestors and getting loans from funding agencies such as the World Bank and EBRD. The problem, in
our opinion, is that while demand for oil and oilmeal of the magnitude of this plant's proposed output
exists in Lithuania, there isn't enough rapeseed cultivated in the country to support this plant. The
present Lithuanian rapeseed output is only 15,000 to 20,000 tons. Assuming that the entire cultivation is
available for this plant, it still is only about one-tenth of the need of the proposed plant. If the plant is
operated at less than full capacity, high operating costs will make the project unprofitable. Even though
the proposed plant size is considered the smallest commercially viable size in the West, we do not think
that such projects are feasible in Lithuania or even the other two countries without substantial imports of
seeds/oils.
Demand for Rapeseed Oil
Vegetable oils are primarily used for human consumption, as an ingredient in food, as a vehicle for
cooking, or as margarine and salad oil. Nonedible uses include industrial applications, especially in
making soap, detergents, and cosmetics. Usually demand for oil is positively correlated with GDP
growth rate but other factors, including changes in taste and competition with other fats, also play an
important role. Table 3 shows the per head consumption of vegetable oil in various regions of the world.
The Region
There are regional differences in vegetable oil consumption. In Eastern Europe and Russia, the
market is dominated by locally produced sun flowerseed oil, which typically accounts for 50 percent of
consumption. Though Table 3 projected a per head consumption in the former USSR to be 13.7
kilograms in 1991/92, other sources doubt these figures. These figures are based on a straight growth of
2 percent per year, which is unlikely to have been realized during the early 1990s. There are no current
figures available for the region but previous estimates based on more cautious calculations suggest that it
may not be more than 14 kilogram/head."

10 / Sanjeev Agarwal and John Wong
The Baltics
The pattern of consumption in the Baltic States is changing due to the cutoff from the former USSR.
Since local production of oils as well as oilseeds is negligible, it is open for adaptation. Reliance on
sunflowerseed oil, which was widely available from Russia and Ukraine, is likely to decline at the
expense of other oils. All of the refined oil consumed in the three countries is currently imported.
Estonia. According to Mr. Toomas Kevvai, Councilor with the Ministry of Agriculture, Republic
of Estonia, per capita consumption of oil and margarine in Estonia was estimated at 9 kilograms in 1980.
While exact figures are not available, it is estimated that the consumption may have actually fallen in the
1 990s.
Latvia. According to Mr. Henrihs Nagla12 , Department Manager, Crop Processing, Ministry of
Agriculture, Republic of Latvia, the current consumption of oil and margarine is about 20,000 tons. He
estimates that the consumption should be in the range of 30,000 tons or about 12 kg/person.
Lithuania. The per capita consumption of vegetable oil and margarine in Lithuania was 8
kilograms/year in 1989. This was a 33 percent improvement over the consumption of 6 kilograms/year in
1980. Total imports of oil and margarine were 19,000 and 18,000 metric tons in 1989.' 3 According to
Mr. Rimas Varkulevichius, the country needs between 30,000 and 40,000 tons of oil and margarine.
Table 4 contains information on the estimated consumption of oils and margarine in the three
countries. The first column estimates the oil consumption on the basis of a per capita consumption of 8
kilograms/year, which seems to be roughly the case in all three countries at the present time. The second
column estimates the consumption on the basis of a per capita consumption of 14 kilograms/year, the
average for Eastern European countries. The officials in each of the three countries seem to be optimistic
that the oil and margarine consumption should increase to the level of the other Eastern European
countries. In estimating their current needs, they were all basing their projections on a per capita
consumption of between 12 and 14 kilograms. The third column of Table 4 estimates the consumption
on the basis of a per capita consumption of 22.5 kilograms/year, the average for Western European
countries. The estimates based on Western Europe may be a little optimistic, but they may provide an
indication of long-range potential.
Prices
The completely refined oil (from Western sources) is freely available to consumers in the markets
;°of Estonia, Latvia, and Lithuania at a retail price of about $1.20 to $1.30 in 1-liter plastic bottles.

Competitiveness and Marketability of Vegetable Oils... / 1 1
Based on the various information collected, we found that the wholesale price of crude rapeseed oil
is about $0.40 to $0.55 per liter. Neutralized oil (de-acidified) is priced at around $0.60 per liter and
bleached oil is priced at around $0.70 to $0.75 per liter. The completely refined oil (imported) can be
purchased at about $0.95 to $1.05 per liter."
Demand for Oilmeals
The World
Oilmeals are used primarily as protein supplements in animal feeds. Oilmeal demand is derived
from demand for meat and other livestock products, the demand for which in turn reflects such factors as
population growth, income, and taste. Measures of livestock population provide a convenient shortcut to
estimating the impact of income, population growth and changes in taste on oilmeal consumption.
Oilmeal consumption tends to be associated with the more intensive forms of livestock farming of, for
example, pigs, poultry, some forms of fish, and dairy cows. World livestock population is included in
Table 5. The oilmeal consumption by region is included in Table 6. The principal oilmeals used
throughout the world include soybean, sunflowerseed, cottonseed, groundnut, and rapeseed (Table 7).
The Baltics
Estonia. Estonia's livestock industry is the smallest of all three countries. Most of the requirement
for its livestock population was met with imported oilmeals. In particular, Estonia imported 20,000 tons
of soymeal from the United States in 1991 and 1992 16
Latvia. As part of the Soviet Union in 1989, Latvia produced 1,500,000 tons of livestock and
poultry feeds: 700,000 tons for swine, 300,000 tons for poultry, 300,000 tons for cattle, 150,000 tons for
fish and 50,000 tons for others. Protein meal usage was 170,000 tons (11.3% of all feeds). In 1992,
Latvia produced an estimated 900,000 tons of mixed feeds. Latvia used an estimated 40,000 tons of
soybean meal. The remaining oilmeal requirement was filled by the Liepaja oilseed crushing plant.
Lithuania. As part of the Soviet Union, Lithuania produced 2.5 million tons of mixed feeds in
Malyba's 20 grain and feed processing plants .38 It used 250,000 tons of soybean meal. In 1990, however,
the plant produced only 900,000 tons of feed: 400,000 tons for swine, 350,000 tons for poultry, 150,000
tons for cattle, and 100,000 tons for fish. Feed production did not exceed 1 million tons in 1993 and
160,000 tons of corn meal and 21,585 tons of soymeal was imported in 1993. The surplus from the
injeev AQarwa! and John WonR
previous year was 45,000 tons of soymeal. The requirement in 1994 was expected to be about 100,000
tons of oilmeal, based on protein meal usage of about 10 to 11 percent of total animal feed (including
grains). This ratio is well below the ratio used in Western countries.
Based on the animal feed consumed by the swine population, we can estimate that the total feed of
400,000 tons required about 40,000 tons of oilmeal. Given that there are 1.9 million head of swine in
Lithuania (Table 8), the protein consumption per pig head is calculated as 20.9 kilograms/head. This
consumption rate is considerably smaller than for any Western country (see Table 9). Even the
consumption rate in Eastern Europe is more than four times the consumption rate in Lithuania. The
consumption of protein for cattle is even lower: 7.1 kilograms/head. If we add all protein requirements
for cattle, swine, poultry, and fish, it is an understatement that there is a considerable shortage of oilmeal
in Lithuania.
The governments are aware of the relatively low protein usage rates in the Baltic States and have
identified improved protein feeding as a key to raising livestock productivity.
Strategies
There is no doubt that there is a significant demand for refined edible oil and oilmeal in the three
Baltic countries. According to Table 4, the current consumption of edible oil is estimated at 12,800 tons
for Estonia, 20,800 tons for Latvia, and 30,400 tons for Lithuania. Assuming that the consumption of
vegetable oil parallels Eastern Europe, Estonia, Latvia, and Lithuania should consume 22,400, 36,400,
and 53,200 tons of vegetable oil per year.
The potential for oilmeal is more difficult to estimate. Presently, consumption is approximately
50,000 tons in Estonia, 100,000 tons in Latvia, and 100,000 tons in Lithuania. However, it is clear that
present consumption levels are extremely low. Consequently, if livestock farming has to be sustained,
consumption levels have to rise significantly. An increase of approximately four times in the.
consumption of oilmeals may bring these three countries to the same level as Eastern Europe. Even then,
they will be one-half to one-third of that in the developed West.
Considering this situation, it is clear that these three countries need seed and oil processing plants to
not only supply oil but oilmeal as well. In addition, it will also invigorate farming activity that is
currently well below reasonable levels.
There is some evidence, especially in Lithuania, that there is a government-backed attempt to
establish one large plant, not large by Western standards, but large enough to meet the national

Competitiveness and Marketability of - Vegetable Oils... 113
requirements. Another example is the Tetra Laval margarine plant that is yet to be commissioned in
Estonia and was expected to meet the needs of not only Estonia but Latvia and Lithuania as well.
However, it is our belief that there is a need to rethink the industrialization policy and move away from
Soviet-style large-scale operation and technology. The scale and the technology should fit and be
appropriate for the situation. In addition, we believe that the initial goals of the industrialization policy
should be modest. Primary emphasis at this point should be on import substitution, empowerment of the
farmers, and encouragement of small-scale private enterprise for which the raw material is locally
available.
The scale of operations should be commensurate with the level of local demand and capability of
the oilseed production sector. It should be recognized that oilseed production is rather low and cannot
meet the demand from larger processing plants. Rather than establish large plants in anticipation of
l arger crops, the philosophy should be to expand processing capacity as the agricultural output increases.
We therefore propose that the three countries encourage establishment of small-scale plants.
Although oil crushing plants come in all sizes in different parts of the world, a suitable and economically
viable size may be a plant to process 20 tons of seeds per day. This plant will yield approximately 6 tons
of rapeseed oil per day. Consequently, a 6 tpd oil refining plant is needed to complement the seed
crushing plant. Such plant capacities are generally unthinkably small in the West. For example, in the
United States, plant suppliers will consider a 75 tpd oil refining plant to be a small plant.' 9 Plant
capacities of oil refineries in Western countries range from 300 to 3,000 tpd. Investments in such large
sized plants will run into multimillion dollars and out of reach of investors in the three Baltic States.
Such large plants are also unrealistic because of the rapeseed output and market sizes of the three
countries.
Note that there is always room for expansion, provided the investors do not lose confidence in the
feasibility of such plants. The larger plants, which do not run on full capacity, will not be commercially
profitable or feasible at first.
Small crushing plants can be installed in a space of 1000 m 2 at an estimated cost of US$300,000. A
small 6 to 10 tpd oil refinery may be installed in a space of 4000 m2 at an estimated cost of
US$800,000.°° This kind of investment is within the reach of private investors or farm cooperatives in
the Baltics. Many former farm cooperatives in the Baltics showed interest in establishing such plants.
The major attraction of these small plants is that they give ownership to farmers who can see the benefits

14 / Sanjeev Agarwal and John Wong
of cultivating rapeseed. For them, the plant will provide a way to convert their crop into a value-added
product.
Both oil and oilmeal should find ready market in the local economies or within the region. And as
the farmers start visualizing the potential benefits of cultivating rapeseed, more production will be
forthcoming. As more seed production is realized, more crushing plants and refining plants can be
established.
The Seed Crushing Plant
The simplest method of extracting vegetable oil from the oilseeds is to press the oilseeds through
mechanical screw presses known as expellers. Most of the oil can be recovered in two or three
sequential crushings. The residual oil content in the oilmeal is 7 to 9 percent. If a higher degree of oil
recovery is desired, a more sophisticated solvent extraction system must be installed. With additional
extraction using solvents, the residual oil can be as low as 0.5 percent.
Solvent extraction plants are, however, better suited for handling at least 125 to 150 tons of
rapeseed per day. For smaller capacities, it is not economically feasible to install a solvent extraction
plant. Particularly for small-scale operators, oil expelling is a better alternative. Moreover, the oilmeal
with 8 percent oil content is suitable for use as cattlefeed and may be marketed locally. The extracted oil
may be sold as crude oil or can be refined in small-scale refineries.
The expellers work efficiently if the moisture content in the oilseed is no more than 10 percent.
The seeds obtained directly from the farms may have higher moisture content, usually in the range of 12
to 15 percent. It is, therefore, necessary to dry the seed either before storage or during processing. By
using seed drying equipment before storing, processors can prevent the seeds from deteriorating. It is
desirable to purchase drying and other preparatory equipment with the expellers.
The oilmeal, which is a high protein source, can be mixed with other feed materials to make animal
feed. Appropriate equipment may be needed to prepare the feed in desirable composition and texture.
Oilseed crushing plants can be set up in even smaller capacities. In developing countries, for
example, small plants can be set up to handle as little as 1.5 tons of seed per day. Such a plant takes a
space of 300 m Z and can be set up for as little as US$30,000. It is not uncommon to have plants that are
between 1.5 tpd and 20 tpd. Of course, developed countries have plants with significantly higher
capacities.
Competitiveness and Marketability of Vegetable Oils... / I.J
Appendix A illustrates the economics of owning and operating a seed crushing plant. The plant, if
operated 24 hours a day for 250 days per year, has the potential of yielding a profit of US$ 191,250. The
plant would more than pay for itself in less than two years, a decidedly profitable investment proposal.
Seed crushing plants without oil refineries will be less valuable as is evident from the experiences
of the Liepaja plant in Latvia. While the crushing plants-and the refining plants do to have to be installed
by the same investors or at the same location, the coordinated installation and operation of both is
i mportant for sustaining this industry in a country.
The Oil Refining Plant
Oils contain free fatty acids, gummy matter, coloring pigments, and smelly residue. In some of the
developing countries poor people may use unrefined raw oil for cooking needs but others prefer oils that
have no color, taste, or smell. Therefore, these naturally occuring, undesirable impurities need to be
removed from the oil during the refining process.
For small-scale oil refineries, batch-type processing is recommended because it is easy, economical,
and requires minimal investment in plant cost. In this process, the raw oil is first subjected to a hot water
treatment to remove gummy materials and then subjected to an alkali (caustic soda) treatment to
neutralize the free-fatty acids. The alkali reacts with fatty acids and forms soap. The soap is allowed to
settle to the bottom and is removed from the bottom of the vessel. A hot water wash flushes the
remainder of the soap. The soapy water is also removed from the bottom of the vessel. Three or four
washes are necessary to free the oil of soap.
Since water is used to washi the oil, some water mixes with the oil and must be removed. The oil is
transferred to another vessel where it is heated to 90°C and subjected to depressurized conditions. This
process removes the moisture from the oil. Next, bleaching materials such as activated carbon and/or
Fuller's Earth are added to the oil. After about an hour, the oil is filtered to remove the bleaching
materials. The resulting oil is free of coloring pigments so it is clear.
Bleached and filtered oil is then transferred to another vessel where it is heated to 200 °C under
highly depressurized conditions. Steam is injected into the oil to lift the odoriferous (smelly) matter and
l eave the oil free of any taste or odor. The oil is then cooled and filtered to give it a shiny appearance.
Finally the completely refined oil is packed in appropriate containers for consumers. This oil is a
wholesome cooking oil which can be used for deep frying, as salad oil, or for making mayonnaise.
16 / Sanjeev Agarwal and John Wong
In order to make margarine, the refined oil needs to be hydrogenated: the liquid oil is converted to
solid at room temperature. However, the process of hydrogenation is not economical for plant capacities
of less than 25 tons of oil per day. The investment in a hydrogenation plant is about three times that of
an oil refining plant.
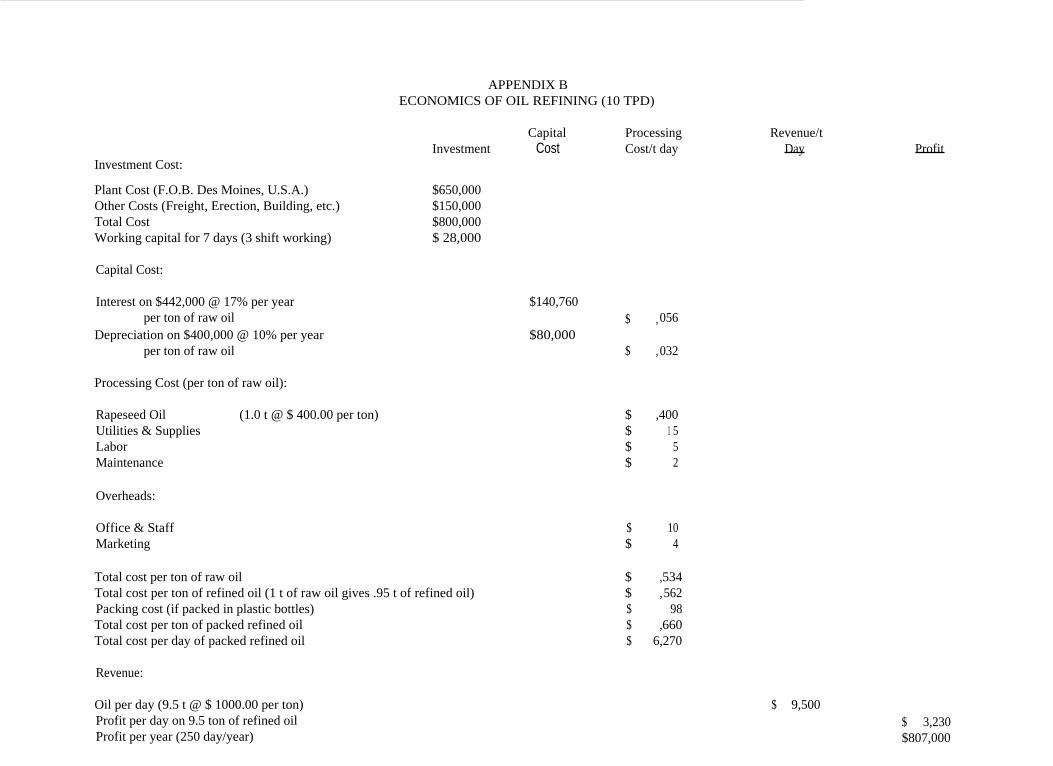
Appendix B illustrates the economics of owning and operating an oil refining plant. If operated 24
hours a day for 250 days per year, it has the potential of yielding a profit of US$807,500. The plant
would pay for itself in roughly one year, a decidedly profitable investment proposal.
Please note that the economic feasibilities reported in this study are based on estimated costs. All
costs are subject to change and thus they should be verified and adapted if necessary. The prices of raw
materials and finished products may also change, and could alter profitability calculations. We should
exercise caution in interpreting these calculations and recalculate at the time of embarking upon a
specific project.
Market for Oil Crushing and Refining Equipment
Given the current state of oil crushing and refining industries in the three Baltic states, the market
for equipment for large-scale operations is virtually nonexistent. The major barriers include lack of
oilseeds, lack of export markets, small domestic markets, and lack of capital, especially low-cost capital.
Moreover, the free market trends preclude government support and protection.
On the other hand, the equipment for small-scale operations appears to have a great deal of
potential. The nature of the market and the economics of operating in the Baltic States favors U.S.
manufacturers/supplier s of small-scale oil production equipment. Note, however, that what we refer to as
small scale may actually be micro-scale for most U.S. firms.
As the economies of the three countries develop, their oil consumption will increase, oilseed
production will increase, and capital will be available. At that point the countries will be ready for larger
plants.
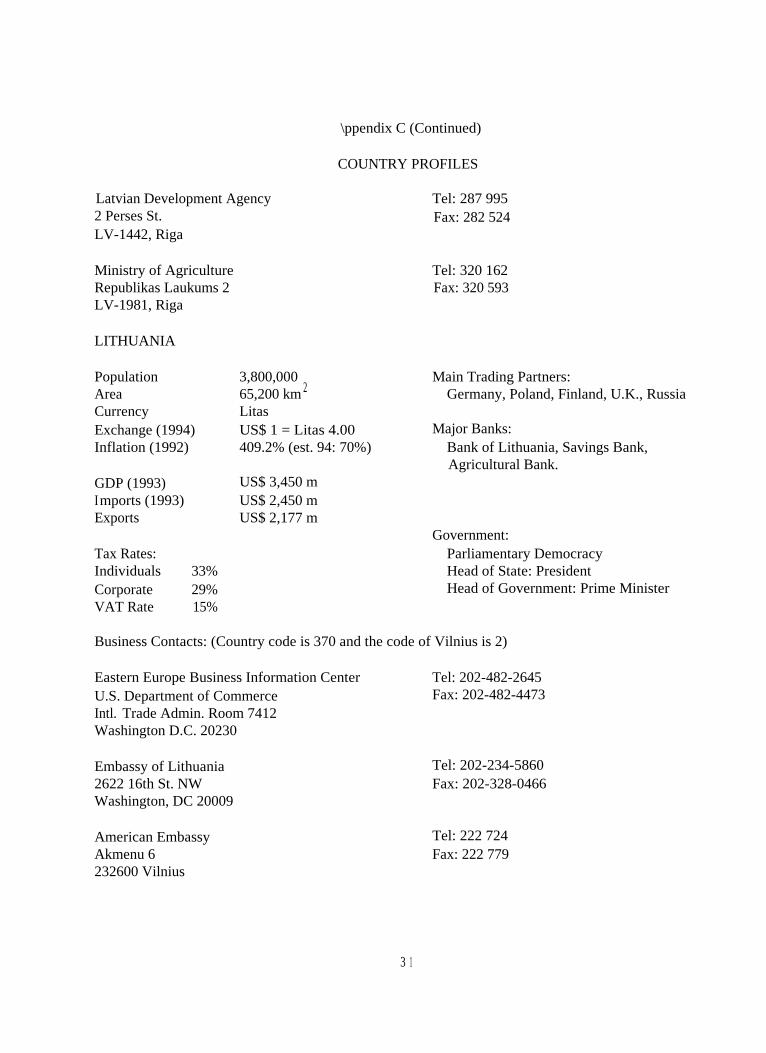
For brief profiles of Lithuania, Latvia, and Estonia, please refer to Appendix C, which contains a
list of useful contacts for those interested in pursuing the options and opportunities we have discussed.

Figure l. The Baltic States
Competitiveness and Marketability of Vegetable Oils... /17
Table 1World Oilseed Cultivation (million metric tons)
Source: Bill Howard, Oils & Oilseeds to 1996, The Economist Intelligence Unit.
1987/88 1988/89 1989/90 1990/91 1991/92
Soybean 103.81 95.64 107.27 103.62 107.01Cottonseed 32.07 33.19 30.89 33.48 35.07Rapeseed 23.46 22.73 21.85 25.78 27.09Peanut 20.98 23.28 22.06 22.12 22.52Sunflowerseed 20.92 20.36 21.87 22.02 21.60

Source: Bill Howard, Oils & Oilseeds to 1996, The Economist Intelligence Unit.
Table 2 1-Total Oil Production for 1991/92 ('000 tons) a
USA
Soybean
6,382
Palm-
-
Rape-
79
Sun-flower
334
Ground-nut
1 00
Cotton
545
Coconut
-
Palm kernel
. ..
Total
7,439
a
41
A
Malaysia 74 6,246 - - ... ... 31 923 7,273 A
A
EC 2,311 - 2,877 1,638 11 97 49 1 5 6,9980
China 519 1 4 2,197 260 1,270 917 - . .. 5,177
India 364 9 1,708 348 1,731 418 234 . .. 4,813010
Brazil 2,718 59 - 13 1 6 1 78 - 8 2,992
Former USSR 1 60 - 80 1,789 1 817 - . .. 2,848
Indonesia 69 2,901 - - 1 8 ... 741 217 3,946
Argentina 1,217 - - 1,190 35 72 - . .. 2,513
Eastern Europe 166 - 529 759 7 ... 3 ... 1,464
Japan 680 - 839 - ... 7 27 2 1,555
Philippines 5 60 - - ... ... 1,087 6 1,158
Canada 1 97 - 647 30 ... ... - . .. 874
Nigeria - 623 - - ... ... - 96 719
Others 1,669 1,838 550 843 791 1,170 656 279 7,795
Total 1 6,531 11,750 9,505 7,203 3,980 4,220 2,827 1,547 57,563

Competitiveness and Marketability of Vegetable Oils.
Table 3Per Head Vegetable Oil Consumption, 1983/84-1991/92
Source: Bill Howard, Oils & Oilseeds to 1996, The Economist Intelligence Unit.
Table 4
Estimated Vegetable Oil Demand in the Baltics
Region
1 983/84Consumption per
Head (kg/head).
1991/92Consumption perHead (kg/head)
AnnualAverage
Growth (%)
Volume Growth
1 983/84-1 991/92
(kg/head)
North America 22.9 28.2 2.6 5.3
Western Europe 15.1 22.5 5.1 7.4
Japan 12.9 15.7 2.5 2.8
East. Europe & USSR 11.7 13.7 2.0 2.0
S.& C. America 10.4 12.1 1.9 1.7
Middle East 7.4 1 0.1 4.0 2.7
Far East & Oceania 6.3 9.6 5.4 3.3
Africa 5.2 7.2 4.1 2.0
China 4.5 6.3 4.4 1.8
India 5.7 6.1 0.9 0.4
World 8.3 10.6 3.1 2.3
Population Current Rate@ 8 kg/year
Eastern Europe Rate@ 14 kg/year
EC [email protected] kg/year
Estonia 1.6 million 12,800 mt 22,400 mt 36,000 mt
Latvia 2.6 million 20,800 mt 36,400 mt 58,500 mt
Lithuania 3.8 million 30,400 mt 53,200 mt 85,500 mt

20 / Sanjeev Agarwal and John Wong
Table 5
World Livestock Populations, 1990
Source: Bill Howard, Oils & Oilseeds to 1996, The Economist Intelligence Unit.
Cattle
(`000)
Sheep & Goat
(`000)
Pigs
('000) Poultry (m)
North America 111,375 13,363 66,134 1,747
South & Central America 316,720 156,399 77,388 1,339
Western Europe 88,114 116,931 111,826 907
Eastern Europe 37,455 49,468 74,126 487
CIS 119,600 217,600 78,100 1,207
China 77,141 180,538 348,954 2,315
Japan 4,682 67 11,866 330
India 195,500 160,486 1 0,300 270
Africa 185,794 370,178 13,097 873
Middle East 66,516 234,666 447 700
Far East & Oceania 78,574 273,871 53,964 1,058

Competitiveness and Marketability of Vegetable Oils... 121
Table 6World Oilmeal Consumption by Region
1983/84-1991/92 ('000 tons)
Source: Bill Howard, Oils & Oilseeds to 1996, The Economist Intelligence Unit.
1 983/84 1 991/92 Annual AverageGrowth (%)
Western Europe 30,291 41,703 4.6
North America 19,785 26,530 3.2
Eastern Europe & USSR 11,641 12,626 3.0
China 1 0,449 10,783 -2.4
Far East & Asia 4,229 8,389 10.9
India 4,632 7,748 6.2
South & Central America 4,689 6,914 3.6
Japan 4,679 5,793 3.6
Africa 1,855 3,135 5.9
Middle East 2,770 4,524 4.2
Total 95,020 128,145 3.3

Source: Bill Howard, Oils & Oilseeds to 1996, The Economist Intelligence Unit.
NorthAmerica
World Oilmeal
SouthCentral
America
Consumption
WesternEurope
by Type and
EasternEurope
& USSR
Region,
China
1 991/92 (`000
Japan
tons)
India Africa MiddleEast
FarEast
A
Soybean 23,067 4,858 21,062 6,898 794 3,450 275 1,427 1,625 5,588 0
Sunflower 410 391 3,827 2,904 568 - 381 473 483 2290
Rapeseed 776 174 4,735 749 3,436 1,307 2,261 9 314 805 w~
Palm kernel - 84 1,561 26 - 2 - 133 - 134
Copra - 77 898 2 ... 13 116 1 37 5. 495
Cottonseed 1,619 982 1,164 1,894 3,959 22 2,451 659 2,059 471
Groundnut 116 67 412 77 1,984 1 2,264 251 - 492
Corngluten 542 280 8,044 75 43 997 - 86 37 1 75
Total 26,530 6,914 41,703 1 2,626 10,783 5,793 7,748 3,175 4,524 8,389

Competitiveness and Marketability of Vegetable Oils... 123
Table 8Livestock Populations in the Baltics, 1990/92
Source: Organization for Economic Cooperation and Development (OECD)
Cattle('000).
Pigs('000)
Poultry(m)
Estonia1990 806 1 080 69231991 758 960 65361 992 708 798 5229
Latvia1990 1 472 1555 112461991 1382 1 410 103211992 1 431 1181 8250
Lithuania1 990 2422 2730 1 74861 991 2321 2436 168151992 2100 1912 1 0000
Table 9Average Protein Consumption in kg per Livestock Unit, 1990
North America 164.9
South & Central America 16.2
Western Europe 276.3
Eastern Europe 86.4
CIS 50.1
China 38.4
Japan 481.5
India 24.1
Africa 11.0
Middle East 62.3
Far East & Oceania 50.0
Source: Bill Howard, Oils & Oilseeds to 1996, The Economist Intelligence Unit.

Investment Cost:
APPENDIX A
ECONOMICS OF OIL EXPELLING (20 TPD):
Revenue:
Capital Processing
Revenue/
I nvestment Cost Cost/day
Day
Profit
Oil
(6.0 tons @ $ 400.00 per ton)
$
2,400
Oilmeal (13.4 tons @ $ 150.00 per ton)
$
2,010
Total per day
$
4,410
Profit per day
$
,765
Profit per year
$191,250
Plant Cost (F.O.B. Des Moines, U.S.A.)Other Costs (Freight, Erection, Building, etc.)Total CostWorking capital for 7 days (3 shift working)
$250,000$ 50,000$300,000$ 20,000
Capital Cost:Interest on 320,000 @ 17% per year $54,000
per day (250 day/year) $ ,218
Depreciation on 320,000 @ 10% per year $ 32,000
per day (250 day/year) $ ,128
Processing Cost:
Rapeseed (20 tons @ $145.00 per ton) $ 2,900
Power (3000 kWFl @ $ 0.05 per kWl I) $ ,150
Labor (15 workers @ $ 5.00 per head) $ ,075
Mainten. (3 workers @ $ 8.00 per head) $ ,024
Spares $ ,050
Overheads:
Office & Staff $ ,060
Marketing $ , 040
Total Expenses per Day $ 3,645
Investment Cost:
Plant Cost (F.O.B. Des Moines, U.S.A.)
$650,000Other Costs (Freight, Erection, Building, etc.)
$150,000Total Cost
$800,000Working capital for 7 days (3 shift working)
$ 28,000
Capital Cost:
Interest on $442,000 @ 17% per year
$140,760per ton of raw oil
$
,056Depreciation on $400,000 @ 10% per year
$80,000per ton of raw oil
$
,032
Processing Cost (per ton of raw oil):
Rapeseed Oil
(1.0 t @ $ 400.00 per ton)
$
,400Utilities & Supplies
$
1 5Labor
$ 5Maintenance
$ 2
Overheads:
Office & Staff
$
10Marketing
$ 4
Total cost per ton of raw oil
$
,534Total cost per ton of refined oil (1 t of raw oil gives .95 t of refined oil)
$
,562Packing cost (if packed in plastic bottles)
$
98Total cost per ton of packed refined oil
$
,660Total cost per day of packed refined oil
$
6,270
Revenue:
Oil per day (9.5 t @ $ 1000.00 per ton)Profit per day on 9.5 ton of refined oilProfit per year (250 day/year)
APPENDIX BECONOMICS OF OIL REFINING (10 TPD)
Capital Processing
Revenue/tInvestment
Cost
Cost/t day
Day
Profit
$ 9,500$ 3,230$807,000

American EmbassyKentmanni 20EE-0001 Tallinn
Estonia Chamber of Commerce and IndustryToom-Kooli 17EE-0100 Tallinn
Estonian Privatization Agency6 Ravala BoulevardEE-0100 Tallinn
A,PPENDIX C
COUNTRY PROFILES
Business Contacts: (Country Code is 372 and the code of Tallinn is 2)
Tel: 358 303 182 (via Helsinki)Fax: 358 306 817 (via Helsinki)
Tel: 444 929Fax: 443 656
Tel: 454 439Fax: 454 450
ESTONIA
Population 1,600,000 Main Trading Partners:Area 45,215 km' Finland, Russia, Sweden, GermanyCurrency KroonExchange (1994) US$ 1 = Kroons 14.40 Major Banks:Inflation (1992) 1069.3% (est.94: 50%) Bank of Estonia (Central Bank), Savings Bank,
Agricultural Bank, Bank for Industry &GDP (1992) US$ 864 m Commerce, Social Bank, Tartu CommercialImports US$ 446 m Bank, Bank of Tallinn, Union Baltic Bank.Exports US$ 457 m
Eastern Europe Business Infonmation Center Tel: 202-482-2645U.S. Department of Commerce Fax: 202-482-4473Intl. Trade Admin. Room 7412Washington D.C. 20230
Embassy of Estonia Tel: 202-789-03201030 15th Street, Suite 1000 Fax: 202-789-0471Washington, D.C.
Tax Rates Government:Individuals 16-33% Parliamentary DemocracyCorporate 15-30% Head of State: PresidentVAT Rate 18% Head of Government: Prime Minister

Business Contacts: (Country code is 371 and the
Eastern Europe Business Information CenterU.S. Department of CommerceIntl. Trade Admin. Room 7412Washington D.C. 20230
Embassy of Latvia4325 17th Street N.W.Washington, D.C. 20011
American EmbassyRaina Boulevard 7LV-6050, Riga
Latvian Chamber of Commerce & Industry21 Brivibas BulvarisLV-6189, Riga
Appendix C (Continued)
COUNTRY PROFILES
code of Riga is 2)
3 0
Tel: 202-482-2645Fax: 202-482-4473
Tel: 202-726-8213Fax: 202-726-6785
Tel: 358 311 348 (via Helsinki)Fax: 358 314 665 (via Helsinki)
Tel: 332 205
Ministry of Agriculture Tel: 441 166Lai 39/41 Fax: 440 601EE-0100 Tallinn
LATVIA
Population 2,600,000 Main Trading Partners:Area 64,589 km' Russia, Germany, Sweden, U.K.Currency LatExchange (1994) US$1 = Lats 0.57Inflation (1993) 109% (est. 94: 40%) Major Banks:GDP (1993) US$ 1,139 m Bank of Latvia, Savings Bank of Latvia,Imports (1993) US$ 954 m Riga Commercial Bank, Baltija Bank, UnionExports (1993) US$ 1008 m Baltic Bank in Riga, Olimpija Bank, Latvian
Industrial Bank, Latvian Investment Bank
Tax Rates: Government:Individuals 15-35% Parliamentary DemocracyCorporate 15-35% Head of State: PresidentVAT Rate 10% plus 2% at retail Head of Government: Prime Minister
Latvian Development Agency2 Perses St.LV-1442, Riga
Ministry of AgricultureRepublikas Laukums 2LV-1981, Riga
LITHUANIA
Population 3,800,000Area
65,200 km 2
Currency LitasExchange (1994)
US$ 1 = Litas 4.00Inflation (1992)
409.2% (est. 94: 70%)
GDP (1993)
US$ 3,450 mImports (1993)
US$ 2,450 mExports
US$ 2,177 m
Tax Rates:Individuals 33%Corporate 29%VAT Rate
15%
\ppendix C (Continued)
COUNTRY PROFILES
Business Contacts: (Country code is 370 and the code of Vilnius is 2)
3 1
Tel: 287 995Fax: 282 524
Tel: 320 162Fax: 320 593
Main Trading Partners:Germany, Poland, Finland, U.K., Russia
Major Banks:Bank of Lithuania, Savings Bank,Agricultural Bank.
Government:Parliamentary DemocracyHead of State: PresidentHead of Government: Prime Minister
Eastern Europe Business Information Center Tel: 202-482-2645U.S. Department of Commerce Fax: 202-482-4473Intl. Trade Admin. Room 7412Washington D.C. 20230
Embassy of Lithuania Tel: 202-234-58602622 16th St. NW Fax: 202-328-0466Washington, DC 20009
American Embassy Tel: 222 724Akmenu 6 Fax: 222 779232600 Vilnius

Appendix C (Continued)
COUNTRY PROFILES
Lithuania Chamber of Trade and Industry
Tel: 661 550Algirdo 31
Fax: 661 550
2600 Vilnius
Ministry of Agriculture
Tel: 629 994Gedimino pr. 19
Fax: 224 4402025 Vilnius

ENDNOTES
1.
Agricultural Policies, Markets and Trade Monitoring and Outlook 1993, OECD.
2.
Personal interview with Mr. Renaldo Mandmets, European Community Project Group, Ministry ofAgriculture, Republic of Estonia.
3.
Personal interviews with Mr. Janis Urbanovich, Director, Latgale Satio, Darzu Street 7a, Rezenke,Latvia 4601; Mr. Berzinsh Ilmars Georgievich, Director, Bauska Agro-Industrial Complex, Bauska,Latvia; Mr. Skroders, Head Agronomist, Agrofirm "Bulduri" SIA, Bulduri, Latvia; Mr. ValdisDulmanis, Lacplesis Agrofirma, Lielvarde, Lativa; Mr. Henrihs Nagla, Department of Cropprocessing, Ministry of Agriculture, Latvia; Mr. Renaldo Mandmets, Rural DevelopmentInternational and Ministry of Agriculture, Estonia; and Mr. Rimas Varkulevichius, Director of theDepartment of International Relations, Ministry of Agriculture, Lithuania.
4.
Weiss, T.J. Food Oils and Their Uses, Avi Publishing Co., Inc., Westport, CT. 1970.
5.
Ian McCormick and Roger Hoskin Canola: Prospects for an Emerging Market, Oil Crops Situationand Outlook Report, Commodity Economics Division, Economic Research Service, USDA,October 1991, OCS-31.
6.
Thomas W. Bickerton, USSR Oilseed Production, Processing, and Trade, Commodity EconomicsDivision, Economic Research Service, USDA, September 1987.
7.
Personal Interview with Mr. Toomas Kevvai, Counsellor, Ministry of Agriculture, Estonia.
8.
George Liepa, Oilseeds in Latvia -- What Lies Ahead? Inform, vol 4, no. 4 (April 1993).
9.
George Liepa, Oilseeds in Latvia -- What Lies Ahead, Inform, vol.4, no. 4 (April 1993).
10.
Personal interview with Mr. Skroder, Head Agronomist, Agrofirm "Bulduri" SIA, Bulduri, Latvia.
11.
Personal interview with Zigmars Brunavs, Canadian Agra, Riga, Latvia.
12.
Personal interview with Rimas Varkulevichius, Director of the Department of InternationalRelations, Ministry of Agriculture, Lithuania.
13.
Kazlauskiene, Natalia, William H. Meyers, and Kyle J. Stephens (1991), The LithuanianAgricultural and Food Industry: The Setting for Economic Reforms, Ames, IA: Center forAgricultural and Rural Development. Report 91-BR 3.
14.
Personal interview with Mr. Hans G. Lindberg, General Manager, Alfa Laval InternationalEngineering AB, Riga, Latvia.

1 5.
Personal interview with Mr. Hans G. Lindberg, General Manager, Alfa Laval InternationalEngineering AB, Riga, Latvia.
1 6.
Personal interview with Toomas Kevvai, Counsellor, Ministry of Agriculture, Estonia.
1 7.
George Liepa, ibid.
1 8.
Steven B. Nemeth, Trip Report, no. 127, ASA, Nov. 1993.
1 9.
Personal interview with Mr. Nits Tervell, Sales Area Manager, Tetra Laval Food, Stockholm,Sweden.
20.
Personal interview with Ms. Inguna Gulbe, Director of the Department of Foreign Relations,Ministry of Agriculture, Latvia.
21.
Personal interview with Mrs. Irana Anshevica, Senior Manager, LATA International Ltd., Riga,Latvia.
22.
Personal interview with Mr. Maris Ermanis, Senior Manager, LATA International Ltd., Riga,Latvia
23.
Personal interview with Mr. Zigmars Brunavas, Canadian Agra, Riga, Latvia.
24.
Personal interview with Mr. Valdis Dulmanis, Lacplesis Agrofirma, Lielvarde, Latvia.
25.
Personal interview with Mr. Jevgenijs Hinevics, Director, Balttur SIA, Riga, Latvia
26.
Personal interview with Dr. Aloyzas Zelvys, Chairman and General Director, Grudtarna Joint StockCo., Vilnius, Lithuania.
27.
Personal interview with Dr. Aloyzas Zelvys, Chairman and General Director, Grudtarna Joint StockCo., Vilnius, Lithuania.
28.
Trip Report No. 127, November 1993, Dr. Steven B. Nemeth, Director, American SoybeanAssociation, Vienna.
29.
Personal interview with Ms. Laima Jureviciene, Specialist on Vegetable Oil Industry, Food IndustryDepartment, Ministry of Agriculture, Lithuania.
30.
Trip Report No. 124, September 1993, Dr. Steven B. Nemeth, Director, American SoybeanAssociation, Vienna.
31.
Bickerton, Thomas W., "USSR Oilseed Production, Processing, and Trade," CommodityEconomics Division, Economic Research Service, U.S. Department of Agriculture.
34

32.
Personal interview with Mr. Henrihs Nagla, Department Manager, Crop Processing, Ministry ofAgriculture, Latvia.
33.
Shaffer, Creg V. (1993), An Analysis of Consumption and Expenditures for Lithuanian HouseholdsUsing Budget Survey Data, Ames, IA: Center for Agricultural and Rural Development. Report 93-BR 8.
34.
Personal study of the markets in Estonia, Latvia, and Lithuania.
35.
Personal interview with Mr. Arvo Hiller, Director, Formeer Ltd., Tallinn, Estonia.
36.
Trip Report No. 124, September 1993, Dr. Steven B. Nemeth, Director, American SoybeanAssociation, Vienna.
37.
Trip Report No. 106, August 1992, Dr. Steven B. Nemeth, Director, American SoybeanAssociation, Vienna.
38.
Trip Report No. 115, March 1993, Dr. Steven B. Nemeth, Director, American Soybean Association,Vienna.
39.
Telephone interview with Mr. Barry V. Smith, Managing Vice President and General Manager,Wurster & Sanger, Division of Crown Iron Works, Minneapolis, MN.
40.
Based on estimates provided by various equipment suppliers. Note that these prices arerepresentative and must be verified with the suppliers. The prices mentioned here are those thatwere the most competitive prices supplied by American companies.