Chapter E The National Coal Coal Marketability: Current ... · Chapter E. Coal Marketability:...
65
Chapter E Coal Marketability: Current and Future Conditions By Emil D. Attanasi and Philip A. Freeman U.S. Geological Survey Professional Paper 1625–F U.S. Department of the Interior U.S. Geological Survey Chapter E of The National Coal Resource Assessment Overview Edited by Brenda S. Pierce and Kristin O. Dennen This report, although in the USGS Professional Paper series, is available only on CD–ROM Click here to return to Volume Table of Contents The National Coal Resource Assessment Overview
Transcript of Chapter E The National Coal Coal Marketability: Current ... · Chapter E. Coal Marketability:...
Chapter E
Coal Marketability: Current and Future Conditions
By Emil D. Attanasi and Philip A. Freeman
U.S. Geological Survey Professional Paper 1625–F
U.S. Department of the Interior U.S. Geological Survey
Chapter E ofThe National Coal Resource Assessment OverviewEdited by Brenda S. Pierce and Kristin O. Dennen
This report, although in the USGS Professional Paper series, is available only on CD–ROM
Click here to return to Volume Table of Contents
The National Coal Resource Assessment Overview
U.S. Department of the InteriorKEN SALAZAR, Secretary
U.S. Geological SurveySuzette M. Kimball, Acting Director
U.S. Geological Survey, Reston, Virginia: 2009
For more information on the USGS—the Federal source for science about the Earth, its natural and living resources, natural hazards, and the environment, visit http://www.usgs.gov or call 1-888-ASK-USGS
For an overview of USGS information products, including maps, imagery, and publications, visit http://www.usgs.gov/pubprod
To order this and other USGS information products, visit http://store.usgs.gov
Any use of trade, product, or firm names is for descriptive purposes only and does not imply endorsement by the U.S. Government.
Although this report is in the public domain, permission must be secured from the individual copyright owners to reproduce any copyrighted materials contained within this report.
Suggested citation: Attanasi, E.D., and Freeman, P. A., 2009, Coal marketability—Current and future conditions, in Pierce, B.S., and Dennen, K.O., eds., The National Coal Resource Assessment Overview: U.S. Geological Survey Professional Paper 1625–F, Chapter E, 59 p.
Contents
Abstract ...........................................................................................................................................................1Introduction.....................................................................................................................................................2Acknowledgments .........................................................................................................................................4Coal Demand for Electrical-Power Generation ........................................................................................4
Historical and Current Fuel Choice in Electrical-Power Generation ...........................................4Coal Demand and Powerplant Deregulation ....................................................................................7Coal Demand and Emissions Regulation: Clean Air Act Amendments ........................................9
Phase I Regulations and Responses ......................................................................................10Phase II Regulations and Response .......................................................................................11Beyond the 1990 Clean Air Act Amendments .......................................................................15
Carbon Dioxide Emission Abatement and Coal-Fired Power Generation .................................16Coal Mining Industry ...................................................................................................................................17
Industry Structure ...............................................................................................................................17Industry Conduct .................................................................................................................................20Industry Performance ........................................................................................................................20Coal Markets by Coal-Producing Region ........................................................................................23Rail Transportation ..............................................................................................................................29Coal Quality and Marketability .........................................................................................................29
Valuation of Sulfur in Coal ........................................................................................................29Coal Quality by Producing Region ...........................................................................................31
Future Coal Markets ..........................................................................................................................31Emerging Supply Regions ..................................................................................................................38
Summary and Implications .........................................................................................................................38References Cited..........................................................................................................................................42Glossary .........................................................................................................................................................44Appendix A—Electrical Utility Deregulation: Nature and Motivation ................................................46Appendix B—Quality of Produced Coal by Beds and Coal Fields .......................................................48
Figures
1. Location map of regions assessed in U.S. Geological Survey’s National Coal Assessment (2009) ........................................................................................................................3
2.–5. Graphs showing: 2. Forces determining the size and nature of the central-powerplant market for coal .......................................................................................................................3 3. Shares of energy sources (placed on a Btu basis) delivered to powerplants
from 1973 through 2006 .........................................................................................................5 4. Coal (expressed in terms of calorific value) supplied to powerplants in
each census region. ..............................................................................................................6 5. Historical fuel cost in current dollars for coal-fired and gas-fired electrical
powerplants ............................................................................................................................8

6. Pie chart showing electric utility compliance options under Phase I of the 1990 Clean Air Act Amendments by generating capacity ....................................................10 7–8. Graphs showing: 7. Percentage of U.S. Coal-fired electrical-generating capacity classified by year of first service as of 2006 ...........................................................................................12 8. Status of flue-gas desulfurization units in the 20 States with largest coal-fired electrical generation capacity for years (A) 2006 and (B) 1996 ................12 9–16. Charts showing:
9. Historical emissions per megawatt-hour from of coal-fired electricity generation for the years of 1990, 1995, 2000, and 2005. A, shows historical SO2 emissions; B, NOx emissions ..................................................13
10. Labor productivity at surface and underground mines by coal-supply region for 1985, 1990, 1998, and 2006 ..............................................................................22
11. Volumes of coal produced in the Northern Appalachian Basin and received by powerplants, by State location of powerplant for 2006 and 1998 ......................................................................................................................24
12. Volumes of coal produced in the Central Appalachian Basin and received by powerplants, by State location of powerplant for 2006 and 1998 ......................................................................................................................25
13. Volumes of coal produced in the Illinois Basin and received by powerplants, by State location of powerplant for 2006 and 1998 ............................................................26
14. Volumes of coal produced in the Powder River Basin and received by powerplants, by State location of powerplant for 2006 and 1998 ..............................27
15. Volumes of coal produced in the Colorado Plateau and received by powerplants, by State location of powerplant for 2006 and 1998 ..............................28
16. Western rail rates for new multiyear contracts in constant 2006 dollars for shipments to competitively served destinations .......................................30
17. Location map of selected coal fields within the Northern Rocky Mountains and Great Plains Region ............................................................................................................32
18–20. Charts showing: 18. Cumulative distribution of produced coal by sulfur content, in
pounds per million Btu’s (MMBtu), of coal delivered to powerplants in 2006 in A, Northern Appalachia; B, Central Appalachia; C, Illinois Basin; D, Gulf Coast Lignite region; E, Powder River Basin; F, Williston Basin; G, Colorado Plateau region. .............................................................................................33
19. Average monthly coal transactions prices in dollars per million Btu (constant 2006 dollars) from January 1991 through December 2006 from mines in various regions producing coal destined for powerplants: A, FOB prices; B, Delivered prices ..................................................................................39
20. Average transactions prices of SO2 allowances plotted with average natural gas prices in dollars per million Btu’s ...............................................................41
Tables
1. Census regions .............................................................................................................................5 2. Investment and operating costs for new coal, gas, and nuclear plants .............................7 3. Reduction in percent emissions per megawatt-hour and reduction in actual
emissions from 1990 though 2005 from coal-fired powerplants .........................................14 4 . Trends in production (in millions of short tons), number of mines, and
concentration among mines by producing region ................................................................18 5. Concentration ratios (shares) of annual National coal production accounted
for by the 4, 8, and 15 leading coal-mining firms ...................................................................19 6. Distribution of quality of produced coal received at powerplants for 2006
by producing region1 ..................................................................................................................37 7. Percent of shipments to plants by status of emission control equipment. (FGD,
Flue gas desulfurization) ............................................................................................................38 8. Estimated in-situ coal resources in billions of short tons for Western Areas
with expected low sulfur coal ..................................................................................................40

Intentionally left blank.
Abstract
Electrical-power generation accounts for almost 90 percent of U.S. coal consumption. Forces shaping the electri-cal-power generation industry will effectively determine the future size and scope of the U.S. coal industry. The regula-tory structure of the U.S. electrical-power generation industry is a mix wherein some plants are parts of regulated utilities and other plants are owned by independent power generators or holding companies that also own regulated distribution systems. The chaos in the California electricity market during the early part of the first decade of the 21st century and recent escalation of gas fuel prices appear to have effectively stopped the movement toward deregulation. The growth in demand for electricity exceeds the overall growth in energy demand in the United States and worldwide. One of the challenges of the industry that uses fossil fuels to generate electrical power is to reliably meet electricity demand while abating airborne emissions of sulfur dioxide, nitrogen oxide, particulates, and carbon dioxide. In the United States, coal supplies just over one-half the energy required for U.S. electrical-power genera-tion and 80 percent of the electricity generated by fossil fuels. The Energy Information Administration projects coal to be the primary fossil fuel used for electrical-power production in the United States and for most of the developing world at least until 2030, the duration of the forecast period.
The analysis of demand for coal considers the competi-tive position of alternative base-load fuels in the context of a mixed power-generation sector where about one-half of the power is generated by business entities that are no longer regu-lated as utilities. Coal-fired power-generation plants were most affected by the airborne emission-abatement requirements of the 1990 Clean Air Act Amendments. From 1990 to 2005, nationwide coal-fired powerplant emissions of sulfur dioxide and nitrogen oxides declined by 33 and 56 percent, respec-tively. For the emissions reductions obtained, the cap and trading system for emission allowances resulted in estimated savings of $1.6 billion per year to consumers and society compared to costs that would have been incurred if a single abatement option were mandated.
Compliance patterns are reviewed as of the end of 2007. In particular, as a result of lower costs, increased reliability, and the ability to substitute allowances rather than install redundant systems, many older coal-fired plants have been
Coal Marketability: Current and Future Conditions
By Emil D. Attanasi and Philip A. Freeman
retrofitted with flue-gas desulfurization (FGD) systems. Most of the high-sulfur coal produced in the Northern Appalachian Basin and Illinois Basin is now shipped to plants with FGD systems. This pattern suggests a relatively smooth transition to stricter emissions requirements under the Clean Air Interstate Rule, which target coal-fired power-generation plants and are set to take effect in 2009, 2010, and 2018. Projections by the U.S. Environmental Protection Agency (USEPA) indicate most of coal-fired power-generating units will have FGD systems by 2020.
Although coal-fired power-generation plants emit more than twice the carbon dioxide as gas-fired powerplants, con-version to gas is not viewed as a viable alternative to coal-fired plants for the United States because of the volatility and escalation of gas prices and its perceived resource scarcity. The discussion on U.S. carbon abatement in coal-fired plants concentrates on the incremental costs associated with new plants and the uncertainties surrounding sequestration tech-nology applied on a massive scale. Estimates indicate cost of generation will increase a minimum of 70 percent over costs of generation without carbon capture and sequestration.
The cost of coal supply depends on the cost of the factors of production—that is, coal, labor, equipment, capital funds, and scale of operations, technology, and coal transport cost. A competitive coal mining industry responds efficiently and in a timely manner to changes in market conditions, such as those resulting from changes in regulatory status and tighter envi-ronmental regulations. Though for the coal industry, the trend of increasing concentration (fewer mines or firms producing a given percentage of industry output) may be the result of the pursuit of scale economies that lead to lower cost, fewer independent producers tends to lead to opportunities to exploit market power. With few competitors the exploitation of market power can occur, particularly in regions where opera-tors can deter entry of new competitors through economics of scale or “reserve position.” Since 1990, coal supply prices in constant dollars varied within a limited range and through 2007 have not followed the rapidly escalating prices of oil and natural gas. However, for producing areas outside the Western United States, growth in productivity has slowed or stalled. Production in these regions has also declined, so it is not clear if modernization of existing mines and new mine investment have faltered or whether the remaining coal can only be mined at higher costs. Only four railroads account for 90 percent of

2 The National Coal Resource Assessment Overview
the coal transportation, so competitive conditions should be monitored.
Finally, long lead times are required to develop an abatement program for carbon emissions from coal-fired poweplants. Technology for monitoring sequestration should be developed, improvements in carbon dioxide capture from flue gases devised, and the transportation infrastructure to move carbon dioxide to sequestration sites constructed. Most projections relating to coal production are demand driven because volumes of the in-situ resource are so large, it is assumed that the resource can be produced as needed. This assumption, of course, is not true; supply costs increase and difficulties typically appear well before the energy resource approaches physical exhaustion. It is prudent to improve the economic characterization of the Nation’s coal resource base as it commits itself to a costly carbon abatement program.
Introduction
The U.S. Geological Survey’s (USGS) current national coal-resource assessment describes the location and general characteristics of selected coal zones and coal beds. Estimates are made of average depth of overburden, bed or zone thick-ness, and volumes of in-situ coal resources. Specifically, the assessment reported on the volumes of resources in selected beds in the Northern and Central Appalachian Basins and the Illinois Basin. Selected zones of the Gulf Coast lignite region, the Northern Rocky Mountains and Great Plains region, and the Colorado Plateau region were also analyzed (see fig. 1).
Such compilations represent an initial step in resource evaluation. Neither they, nor the calculated estimates of in-situ coal resources, provide sufficient information to determine extraction and beneficiation costs. In fact, the reported in-situ volumes of coal may have little relation to coal that is cur-rently economically producible. To be useful for economic planning, coal resource assessments should convey sufficient information to project future mining costs as the best deposits are depleted. Coal-industry production forecasting models commonly erroneously assume that existing coal resources can be commercially produced as needed.
For national and local economic planning purposes, estimates of volumes of coal are of little value unless the coal is marketable in the foreseeable future. Perhaps the only pub-lished in-situ coal resource volumes that convey any economic meaning are the recoverable reserves at operating mines reported to the Energy Information Administration (EIA) in the Coal Industry Annual. As of 2006, operating mines reported recoverable reserves of 18.9 billion short tons (bst) (17.2 billion metric tons, bmt) total, with 5.9 bst (5.3 bmt) at underground mines and 13.0 bst (11.8 bmt) at surface mines.1
The 2006 production reported to EIA was about 1.2 bst (1.1 bmt) (Energy Information Administration, 2007a).
Refinements of the initial geologic assessments should focus on specific geographic areas or beds likely to be mined because of lower mining cost and superior coal quality over the next 2 decades. This report discusses future coal mar-ket conditions to assist in identification of these resources. Specifically, the next section considers demand for coal by the electrical-power-generation industry. It discusses the state of electrical utility deregulation. It also considers the effects of the newest set of coal-fired powerplant emissions regula-tions on demand for coal, the coal mining industry, and coal marketing.
The analysis of coal supply conditions begins with evalu-ation of the competitive conditions in the coal mining industry. Competitive conditions are evaluated on the basis of the indus-try’s economic structure, conduct, and performance. These conditions are important because a competitive industry is generally more responsive to market changes than a noncom-petitive industry. A competitive industry generally can expand production more quickly and at lower costs and customer prices than a noncompetitive industry. Changing environmen-tal regulations and economic deregulation of power genera-tion represent such changes in market conditions for the coal mining industry.
Data show that, since 1998, advances in productivity have slowed, and for some areas mining productivity has declined. Sale prices of coal, in real terms, have remained remarkably stable when compared to other fossil fuels. Environmental regulations, declining rail transport cost, and aggressive pricing to increase market share have been, in part, responsible for the shift of production to areas in the Western United States that have low-cost, low-sulfur resources.
In 2006, coal supplied 23 percent of the primary energy used in the United States, and it supplied 50 percent of the total energy used in electricity generation. Coal accounted for more than 80 percent of the fossil fuel energy used in electricity generation. About 88 percent of the coal produced in the United States was supplied for electrical-power generation. The remaining 12 percent was exported, used as metallurgical coal, or supplied to industrial and residential customers (Energy Information Administration, 2007b).
Figure 2 is the paradigm used here that shows the forces that determine the market for coal by U.S. central electricity-generation plants. The central oval symbolizes the market for coal by central powerplants. The position and slope of the power industry’s coal demand function is determined by the boxes above, below, and to the right of the oval. The right horizontal box represents factors that determine the position of the demand function for electricity. The box below the oval includes market factors that modify the demand for coal by
1The EIA estimate of the demonstrated reserve base is 508 billion tons of coal (Energy Information Administration, 2000). Similar to the resource estimates calculated in this and previous U.S. Geological Survey’s coal assessments, there is virtually no economic content in these numbers. The demonstrated reserve base represents measured plus indicated coal resources in beds of 28 inches (71 cm) for bituminous coals, 60 (152 cm) inches for subbituminous coals, and 60 inches (152 cm) for surface minable lignite. The coal resources must be no deeper than 1,000 feet (305 m) unless currently being mined.

Coal Marketability: Current and Future Conditions 3
Unassessed areas
EXPLANATION
Priority regions
Gulf Coast
Illinois Basin
AppalachianBasin
Northern RockyMountains and
Great Plains
ColoradoPlateau
Northern
CentralWesternInterior
GulfCoast
Figure 1. Locations of regions assessed in U.S. Geological Survey’s National Coal Assessment (2009).
Forces Affecting Size of the Central-Powerplant Coal Market
Regulatory Controls/Threats
1. Airborne pollutants a. 1990 Clean Air Act Amendment SO2 , NOx , PM2.5 , HAPS b. CO capture and sequestration2. Solid-waste products3. Cooling-water use
Coal Mining Industry Suppliers/Services/Costs
1. Labor: union, nonunion2. Capital equipment3. Financial capital cost4. Reserve position, Federal coal leasing5. Transportation to customer6. Technological innovation
CENTRAL-POWERPLANT COAL MARKET
•Competitive and regulated powerplants
•Coal producers/suppliers: structure,conduct, performance
Central Powerplant Demand
1. Urbanization2. Distribution/generation efficiency3. Secular population growth4. Living standard
Substitutes: Coal/Central Powerplant
1. Alternative fuels; gas, nuclear and renewables2. Distributed energy (fuel cells)
2
Figure 2. Forces determining the size and nature of the central-powerplant market for coal.

4 The National Coal Resource Assessment Overview
central powerplants, such as prices and reliability of competi-tive substitute fuels for power generation and factors that determine competitive position of central powerplant electric-ity supply. The box above the oval represents external regula-tions imposed on the central power stations to assure that the full cost of electricity generation is reflected in electricity price by regulating levels of permissible air-borne emissions, water-borne emissions, and solid wastes. The box to the extreme left represents factors that affect the cost of coal supply, such as productivity, transport cost, taxes, cost of capital, and regula-tory costs needed to assure that coal prices reflect the full cost of coal production.
Figure 2 summarizes salient forces that control the size of the central powerplant coal market. The mining industry’s function is simplified to that of supplying coal Btu’s to central power-generating plants. Changes in coal production and delivery costs can expand or contract the market, environmen-tal controls shrink the market, factors increasing central- powerplant electricity demand expand the market, and substi-tutes for coal and central-powerplant-generated electricity can either expand or contract the market. This figure provides an idealized map of economic factors to assist in understanding topics to be discussed.
Acknowledgments
The authors gratefully acknowledge comments by Brenda Pierce, Robert Milici, Hal Gluskoter, James Coleman, Ione Taylor, Stan Schweinfurth, and Ron Stanton that substantially improved this report. We thank Eric Morrissey for developing the graphics.
Coal Demand for Electrical-Power Generation
Since 1970, the substitution of coal for natural gas and liquid fuels in electricity generation and the decline of the United States’ steel and other coal-consuming industries have worked together to make central electricity-generating plants the primary customers of the domestic coal industry. Half of 1970 U.S. coal production was supplied to electrical utilities; 12 percent was exported; 17 percent was consumed by industrial, commercial, and residential users; and 16 percent was used in metallurgical coke plants. By contrast, 88 percent of 2006 U.S. coal production was supplied to the electrical power industry; 4 percent was supplied as exports; 6 percent was supplied to industrial, commercial, and residential users; and 2 percent went to metallurgical coke plants (Freme, 2007). The dominance of the electrical-power industry as the principal customer of the domestic coal industry suggests that forces that shape the electrical-power generation industry will also effectively determine size and scope of the future coal industry. Safety concerns based on the Three-Mile Island
nuclear powerplant accident and nuclear plant cost overruns deterred applications for permits for new nuclear powerplant construction from the early 1980s until the end of 2008. The last nuclear power station completed in the United States was the Tennessee Valley Authority’s Watts Bar I station, which came on line in 1996. Construction for that powerplant station had started in 1973.
Historical and Current Fuel Choice in Electrical-Power Generation
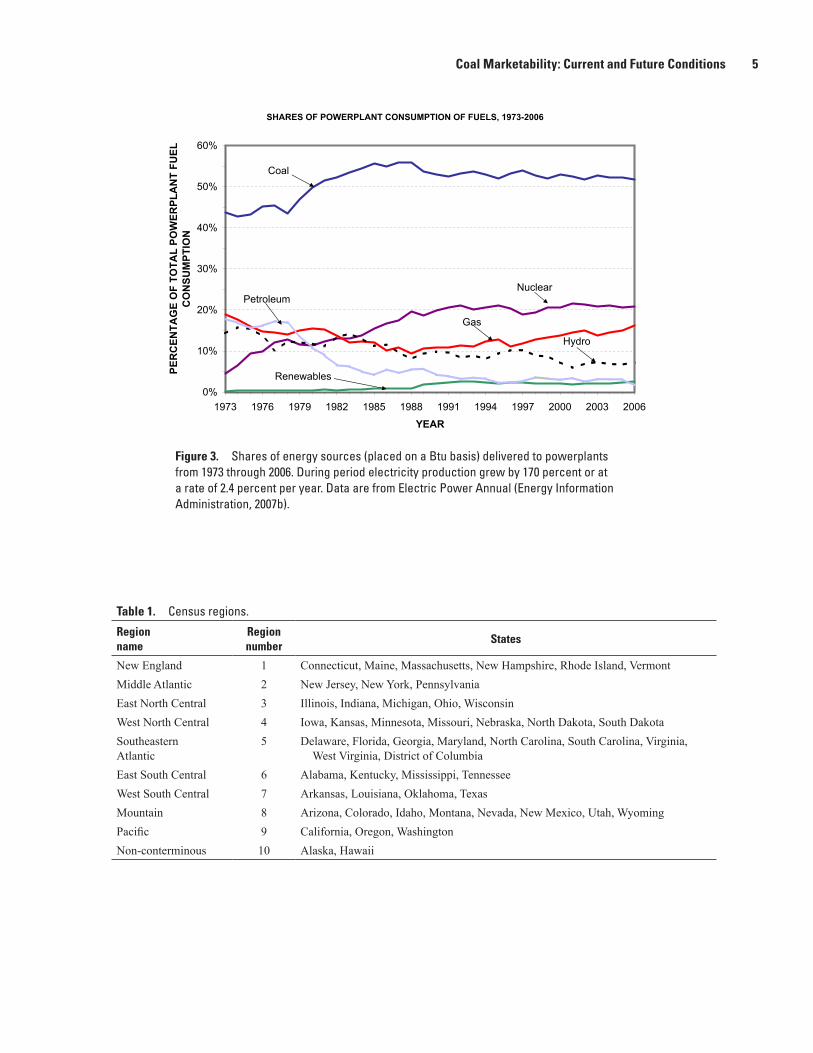
Figure 3 shows, on an energy equivalent basis (Btu), the relative shares of all energy used by electric utilities from 1973 to 2006. The share of coal in 1973 was 44 percent, and by 2006 it was 52 percent; nuclear power went from 5 to 21 percent during the same period. Coal’s share of fossil fuels used for power generation went from 54 to 74 percent as it displaced oil and gas. During the oil and gas shortages of the 1970s, Federal power-industry regulators discouraged use of oil and gas for electricity generation except for peak-load periods. Provisions of the 1990 Clean Air Act Amendments (implemented in 1995) encouraged use of gas in power gen-eration. Oil’s share of fossil fuel energy supplied to utilities declined from 22 to 2 percent, while the gas energy share went from 24 percent down to 13 percent (1988) but by 2006 had recovered and accounted for 23 percent of the fossil fuel used for electrical-power generation.
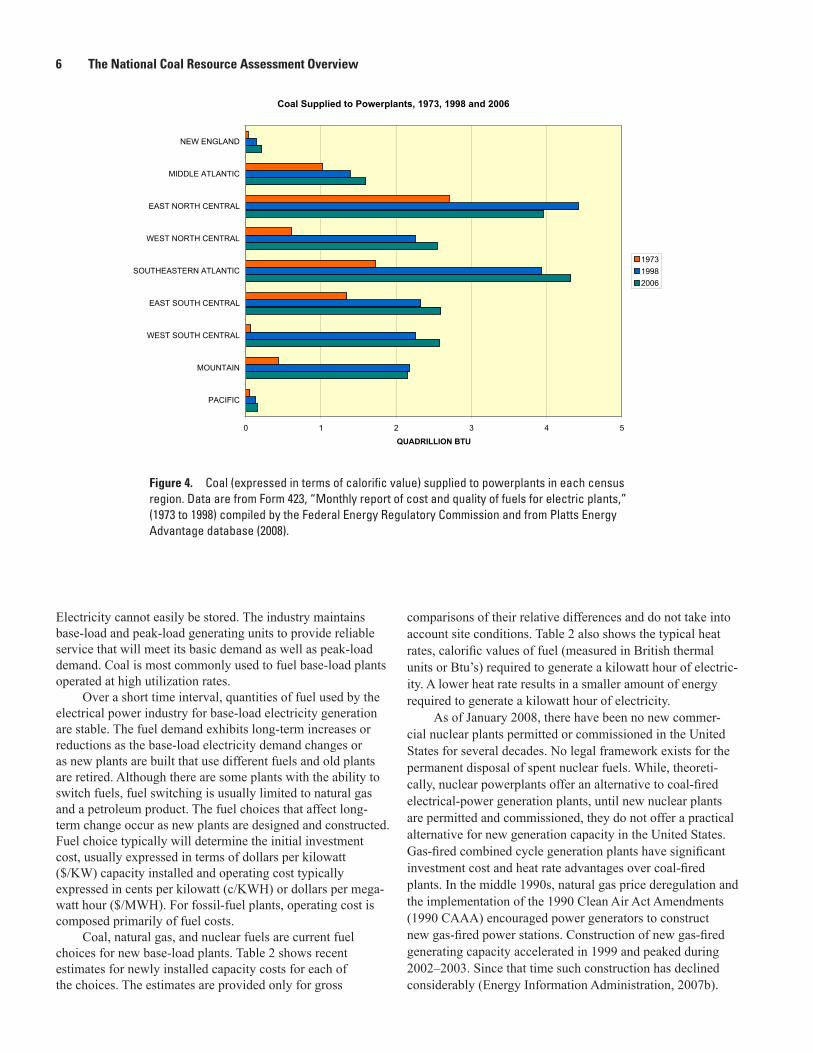
Statistics on electricity generation are compiled accord-ing to the census regions shown in table 1. Figure 4 shows the regional distribution of coal supplied to electrical-power generation plants in 1973, 1998, and 2006. From 1973 through 1998, all regions had increased coal use. After 1998 growth in coal use continued except in the East North Central region and the Mountain regions. Coal accounts for more than one-half of the fuel mix for electrical-power generation in the East North Central, West North Central, Southeastern Atlantic, East South Central, and Mountain regions. Natural gas is the primary fossil fuel used to generate electricity in the Pacific region because of environmental restrictions. In the Middle Atlan-tic States, coal competes with nuclear power. Outside of the Pacific and West South Central regions, most natural-gas- generating capacity is used to meet peak-load electricity demand.2
Nearly all of the electricity generated in the United States for residential and commercial customers is produced by central power-generation stations, operating either as part of regulated utilities or operating as associated nonregulated enti-ties or merchant power generators. Some industrial operations and government installations will generate electricity for their own use. There are substantial variations or swings in elec-tricity demand, seasonally and even within a 24-hour period.
2 Peak-load capacity is generating equipment normally reserved for opera-tion during hours of highest daily, weekly, or seasonal loads. Electricity load is the electricity delivered or required at any specific node or set of nodes on the system.
Coal Marketability: Current and Future Conditions 5
SHARES OF POWERPLANT CONSUMPTION OF FUELS, 1973-2006
0%
10%
20%
30%
40%
50%
60%
1973 1976 1979 1982 1985 1988 1991 1994 1997 2000 2003 2006
YEAR
PER
CEN
TAG
E O
F TO
TAL
POW
ERPL
AN
T FU
EL
CO
NSU
MPT
ION
Coal
Nuclear
Gas
Hydro
Petroleum
Renewables
Figure 3. Shares of energy sources (placed on a Btu basis) delivered to powerplants from 1973 through 2006. During period electricity production grew by 170 percent or at a rate of 2.4 percent per year. Data are from Electric Power Annual (Energy Information Administration, 2007b).
Table 1. Census regions.
Region name
Regionnumber
States
New England 1 Connecticut, Maine, Massachusetts, New Hampshire, Rhode Island, VermontMiddle Atlantic 2 New Jersey, New York, PennsylvaniaEast North Central 3 Illinois, Indiana, Michigan, Ohio, WisconsinWest North Central 4 Iowa, Kansas, Minnesota, Missouri, Nebraska, North Dakota, South DakotaSoutheastern Atlantic
5 Delaware, Florida, Georgia, Maryland, North Carolina, South Carolina, Virginia, West Virginia, District of Columbia
East South Central 6 Alabama, Kentucky, Mississippi, Tennessee West South Central 7 Arkansas, Louisiana, Oklahoma, TexasMountain 8 Arizona, Colorado, Idaho, Montana, Nevada, New Mexico, Utah, WyomingPacific 9 California, Oregon, WashingtonNon-conterminous 10 Alaska, Hawaii
6 The National Coal Resource Assessment Overview
Coal Supplied to Powerplants, 1973, 1998 and 2006
0 1 2 3 4 5
PACIFIC
MOUNTAIN
WEST SOUTH CENTRAL
EAST SOUTH CENTRAL
SOUTHEASTERN ATLANTIC
WEST NORTH CENTRAL
EAST NORTH CENTRAL
MIDDLE ATLANTIC
NEW ENGLAND
QUADRILLION BTU
197319982006
Figure 4. Coal (expressed in terms of calorific value) supplied to powerplants in each census region. Data are from Form 423, “Monthly report of cost and quality of fuels for electric plants,” (1973 to 1998) compiled by the Federal Energy Regulatory Commission and from Platts Energy Advantage database (2008).
Electricity cannot easily be stored. The industry maintains base-load and peak-load generating units to provide reliable service that will meet its basic demand as well as peak-load demand. Coal is most commonly used to fuel base-load plants operated at high utilization rates.
Over a short time interval, quantities of fuel used by the electrical power industry for base-load electricity generation are stable. The fuel demand exhibits long-term increases or reductions as the base-load electricity demand changes or as new plants are built that use different fuels and old plants are retired. Although there are some plants with the ability to switch fuels, fuel switching is usually limited to natural gas and a petroleum product. The fuel choices that affect long-term change occur as new plants are designed and constructed. Fuel choice typically will determine the initial investment cost, usually expressed in terms of dollars per kilowatt ($/KW) capacity installed and operating cost typically expressed in cents per kilowatt (c/KWH) or dollars per mega-watt hour ($/MWH). For fossil-fuel plants, operating cost is composed primarily of fuel costs.
Coal, natural gas, and nuclear fuels are current fuel choices for new base-load plants. Table 2 shows recent estimates for newly installed capacity costs for each of the choices. The estimates are provided only for gross
comparisons of their relative differences and do not take into account site conditions. Table 2 also shows the typical heat rates, calorific values of fuel (measured in British thermal units or Btu’s) required to generate a kilowatt hour of electric-ity. A lower heat rate results in a smaller amount of energy required to generate a kilowatt hour of electricity.
As of January 2008, there have been no new commer-cial nuclear plants permitted or commissioned in the United States for several decades. No legal framework exists for the permanent disposal of spent nuclear fuels. While, theoreti-cally, nuclear powerplants offer an alternative to coal-fired electrical-power generation plants, until new nuclear plants are permitted and commissioned, they do not offer a practical alternative for new generation capacity in the United States. Gas-fired combined cycle generation plants have significant investment cost and heat rate advantages over coal-fired plants. In the middle 1990s, natural gas price deregulation and the implementation of the 1990 Clean Air Act Amendments (1990 CAAA) encouraged power generators to construct new gas-fired power stations. Construction of new gas-fired generating capacity accelerated in 1999 and peaked during 2002–2003. Since that time such construction has declined considerably (Energy Information Administration, 2007b).
Coal Marketability: Current and Future Conditions 7
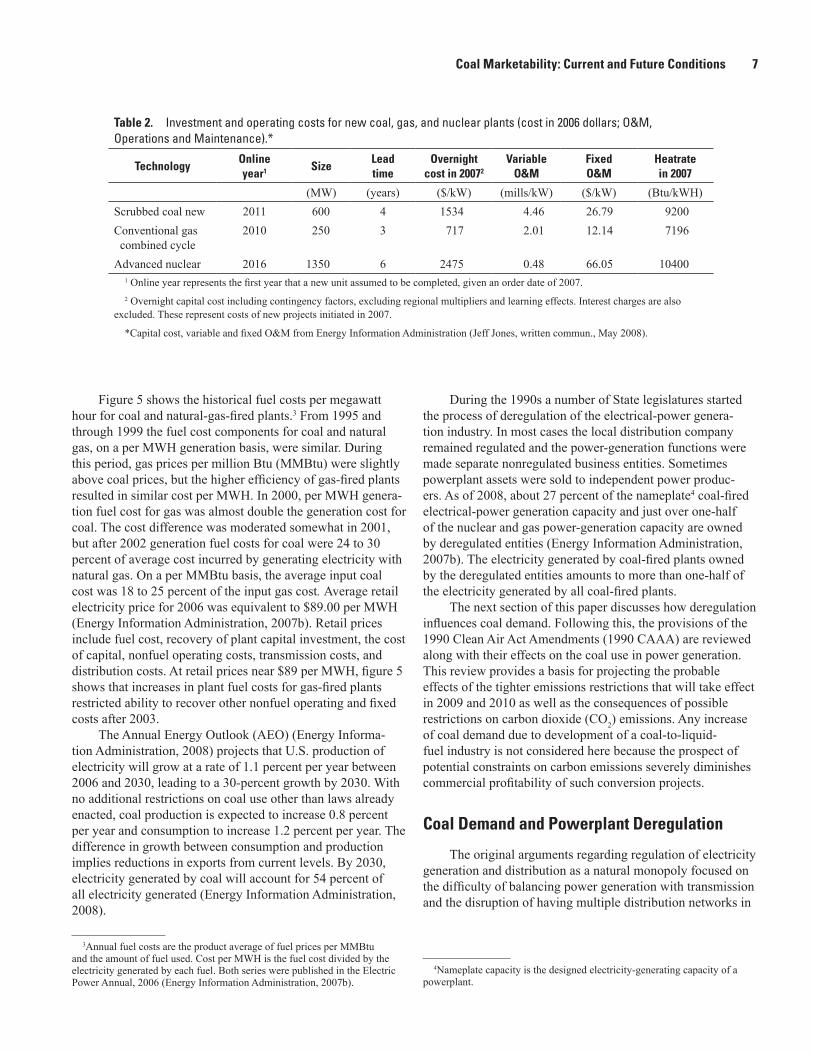
Table 2. Investment and operating costs for new coal, gas, and nuclear plants (cost in 2006 dollars; O&M, Operations and Maintenance).*
TechnologyOnlineyear1 Size
Leadtime
Overnightcost in 20072
VariableO&M
FixedO&M
Heatratein 2007
(MW) (years) ($/kW) (mills/kW) ($/kW) (Btu/kWH)Scrubbed coal new 2011 600 4 1534 4.46 26.79 9200Conventional gas combined cycle
2010 250 3 717 2.01 12.14 7196
Advanced nuclear 2016 1350 6 2475 0.48 66.05 104001 Online year represents the first year that a new unit assumed to be completed, given an order date of 2007.2 Overnight capital cost including contingency factors, excluding regional multipliers and learning effects. Interest charges are also
excluded. These represent costs of new projects initiated in 2007.
*Capital cost, variable and fixed O&M from Energy Information Administration (Jeff Jones, written commun., May 2008).
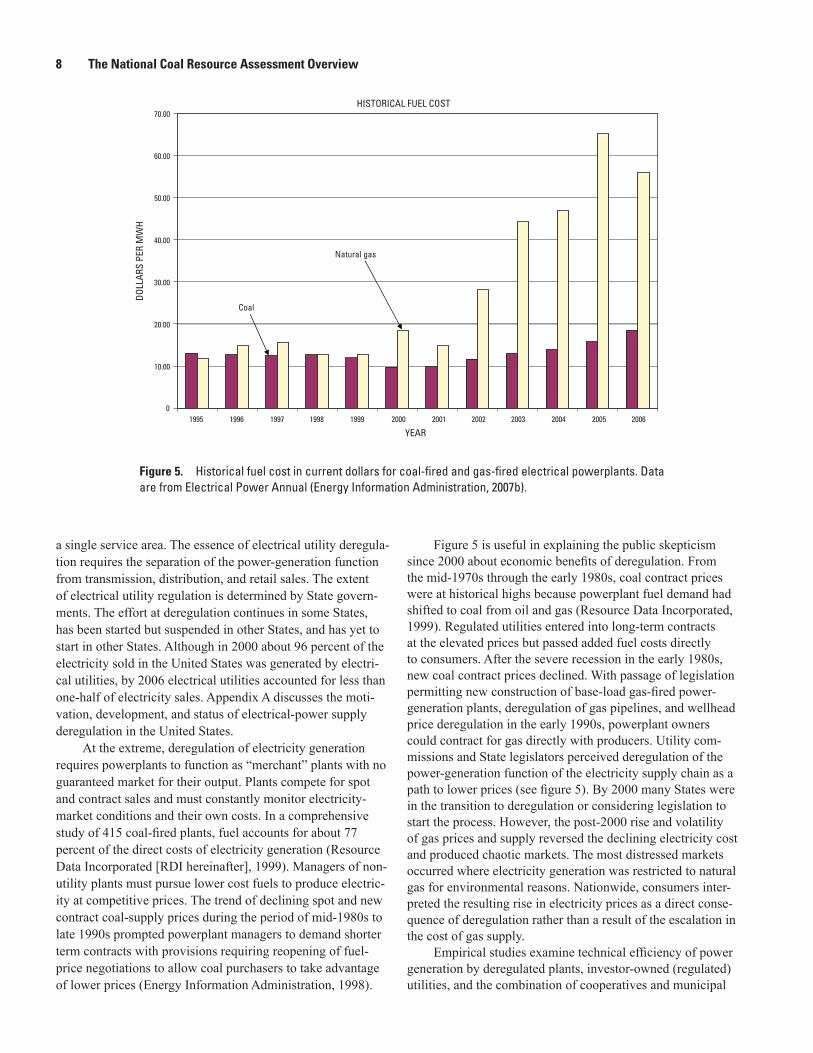
Figure 5 shows the historical fuel costs per megawatt hour for coal and natural-gas-fired plants.3 From 1995 and through 1999 the fuel cost components for coal and natural gas, on a per MWH generation basis, were similar. During this period, gas prices per million Btu (MMBtu) were slightly above coal prices, but the higher efficiency of gas-fired plants resulted in similar cost per MWH. In 2000, per MWH genera-tion fuel cost for gas was almost double the generation cost for coal. The cost difference was moderated somewhat in 2001, but after 2002 generation fuel costs for coal were 24 to 30 percent of average cost incurred by generating electricity with natural gas. On a per MMBtu basis, the average input coal cost was 18 to 25 percent of the input gas cost. Average retail electricity price for 2006 was equivalent to $89.00 per MWH (Energy Information Administration, 2007b). Retail prices include fuel cost, recovery of plant capital investment, the cost of capital, nonfuel operating costs, transmission costs, and distribution costs. At retail prices near $89 per MWH, figure 5 shows that increases in plant fuel costs for gas-fired plants restricted ability to recover other nonfuel operating and fixed costs after 2003.
The Annual Energy Outlook (AEO) (Energy Informa-tion Administration, 2008) projects that U.S. production of electricity will grow at a rate of 1.1 percent per year between 2006 and 2030, leading to a 30-percent growth by 2030. With no additional restrictions on coal use other than laws already enacted, coal production is expected to increase 0.8 percent per year and consumption to increase 1.2 percent per year. The difference in growth between consumption and production implies reductions in exports from current levels. By 2030, electricity generated by coal will account for 54 percent of all electricity generated (Energy Information Administration, 2008).
During the 1990s a number of State legislatures started the process of deregulation of the electrical-power genera-tion industry. In most cases the local distribution company remained regulated and the power-generation functions were made separate nonregulated business entities. Sometimes powerplant assets were sold to independent power produc-ers. As of 2008, about 27 percent of the nameplate4 coal-fired electrical-power generation capacity and just over one-half of the nuclear and gas power-generation capacity are owned by deregulated entities (Energy Information Administration, 2007b). The electricity generated by coal-fired plants owned by the deregulated entities amounts to more than one-half of the electricity generated by all coal-fired plants.
The next section of this paper discusses how deregulation influences coal demand. Following this, the provisions of the 1990 Clean Air Act Amendments (1990 CAAA) are reviewed along with their effects on the coal use in power generation. This review provides a basis for projecting the probable effects of the tighter emissions restrictions that will take effect in 2009 and 2010 as well as the consequences of possible restrictions on carbon dioxide (CO2) emissions. Any increase of coal demand due to development of a coal-to-liquid-fuel industry is not considered here because the prospect of potential constraints on carbon emissions severely diminishes commercial profitability of such conversion projects.
Coal Demand and Powerplant Deregulation
The original arguments regarding regulation of electricity generation and distribution as a natural monopoly focused on the difficulty of balancing power generation with transmission and the disruption of having multiple distribution networks in
3Annual fuel costs are the product average of fuel prices per MMBtu and the amount of fuel used. Cost per MWH is the fuel cost divided by the electricity generated by each fuel. Both series were published in the Electric Power Annual, 2006 (Energy Information Administration, 2007b).
4Nameplate capacity is the designed electricity-generating capacity of a powerplant.
8 The National Coal Resource Assessment Overview
a single service area. The essence of electrical utility deregula-tion requires the separation of the power-generation function from transmission, distribution, and retail sales. The extent of electrical utility regulation is determined by State govern-ments. The effort at deregulation continues in some States, has been started but suspended in other States, and has yet to start in other States. Although in 2000 about 96 percent of the electricity sold in the United States was generated by electri-cal utilities, by 2006 electrical utilities accounted for less than one-half of electricity sales. Appendix A discusses the moti-vation, development, and status of electrical-power supply deregulation in the United States.
At the extreme, deregulation of electricity generation requires powerplants to function as “merchant” plants with no guaranteed market for their output. Plants compete for spot and contract sales and must constantly monitor electricity-market conditions and their own costs. In a comprehensive study of 415 coal-fired plants, fuel accounts for about 77 percent of the direct costs of electricity generation (Resource Data Incorporated [RDI hereinafter], 1999). Managers of non-utility plants must pursue lower cost fuels to produce electric-ity at competitive prices. The trend of declining spot and new contract coal-supply prices during the period of mid-1980s to late 1990s prompted powerplant managers to demand shorter term contracts with provisions requiring reopening of fuel-price negotiations to allow coal purchasers to take advantage of lower prices (Energy Information Administration, 1998).
Figure 5 is useful in explaining the public skepticism since 2000 about economic benefits of deregulation. From the mid-1970s through the early 1980s, coal contract prices were at historical highs because powerplant fuel demand had shifted to coal from oil and gas (Resource Data Incorporated, 1999). Regulated utilities entered into long-term contracts at the elevated prices but passed added fuel costs directly to consumers. After the severe recession in the early 1980s, new coal contract prices declined. With passage of legislation permitting new construction of base-load gas-fired power- generation plants, deregulation of gas pipelines, and wellhead price deregulation in the early 1990s, powerplant owners could contract for gas directly with producers. Utility com-missions and State legislators perceived deregulation of the power-generation function of the electricity supply chain as a path to lower prices (see figure 5). By 2000 many States were in the transition to deregulation or considering legislation to start the process. However, the post-2000 rise and volatility of gas prices and supply reversed the declining electricity cost and produced chaotic markets. The most distressed markets occurred where electricity generation was restricted to natural gas for environmental reasons. Nationwide, consumers inter-preted the resulting rise in electricity prices as a direct conse-quence of deregulation rather than a result of the escalation in the cost of gas supply.
Empirical studies examine technical efficiency of power generation by deregulated plants, investor-owned (regulated) utilities, and the combination of cooperatives and municipal
HISTORICAL FUEL COST
0
10.00
20.00
30.00
40.00
50.00
60.00
70.00
1995 1996 1997 1998 1999 2000 2001 2002 2003 2004 2005 2006
DOLL
ARS
PER
MW
H
Coal
Natural gas
YEAR
Figure 5. Historical fuel cost in current dollars for coal-fired and gas-fired electrical powerplants. Data are from Electrical Power Annual (Energy Information Administration, 2007b).

Coal Marketability: Current and Future Conditions 9
plants. Fabrizio and others (2007) find deregulated plants (based on constant output) reduced labor and nonfuel expense 3–5 percent relative to investor-owned utilities. The cost dif-ferences between deregulated plants and the cooperative and municipal power generators were 6 to 12 percent. Successful deregulation may push investor-owned utilities to be more aggressive about reducing costs.
The competitive price pressure that merchant powerplants face is, in turn, shared by coal suppliers who must constantly be searching out ways to reduce costs. Labor costs constitute about one-half of coal mining costs (Energy Information Administration, 1998). The increasingly larger capacity of mining equipment, particularly in surface-mine operations, has been an important source of productivity increases. Pro-ductivity in underground mines has increased over the long term because of higher speeds of more powerful shearers in longwall mining equipment. The share of underground min-ing accounted for by longwall mines has increased gradually. Increasing productivity allowed coal prices to decline even when industry production increased.
The drive to exploit economies of scale has increased mine size as measured by annual capacity. However, part of the coal mining industry’s move to larger and fewer mines and firms came through consolidations, mergers and acquisitions, and rationalizations of industry capacity. This process has resulted in a decline in the number of operating mines from 3,412 in 1990 to 1,424 in 2006 (Energy Information Admin-istration, 2007a). The larger operations and firms are able to take advantage of physical, administrative, and financial economies of scale to reduce production and delivery costs on a per-ton basis. Larger mining firms are more likely to survive prolonged coal-price volatility by instituting risk-management strategies that may involve futures and options markets, strate-gic alliances, energy swaps, and tolling. Tolling is the practice in which the powerplant simply charges a toll for turning fuel it is supplied into electricity (Energy Information Administra-tion, 1998).
Coal-mining firms of the future may have to be of a critical size and have sufficient financial reserves to open new mines. In the past, mines were financed on an individual-project basis. Specifically, financial institutions lent funds to the operator who first obtained commitments to purchase the mine’s output in the form of long-term contracts with some contract price floor. Deregulation of the power industry may make long-term purchase agreements unlikely. Mining firms may be required to raise more capital for new mines internally (Energy Information Administration, 1998). In summary, deregulation tends to impose pressure on the coal-mining industry to control costs and to consolidate in order to reap benefits of scale economies.
Coal Demand and Emissions Regulation: Clean Air Act Amendments
In the absence of environmental controls, coal-fired electrical-generation plants emitted air-borne particulates—such as fly ash—and gaseous emissions—such as sulfur diox-ide, nitrogen oxides, and carbon dioxide. Federal regulation of coal-fired boilers to control emissions was authorized by the Clean Air Act Extension of 1970. This law created the U.S. Environmental Protection Agency (USEPA), adopted National Ambient Air Quality Standards (NAAQS), defined air-quality regions, and charged the new USEPA administrator with set-ting new source performance standards for emission of sulfur dioxide, nitrogen oxides, and particulates from new coal-fired boilers.
Emissions of sulfur dioxide and oxides of nitrogen from fossil-fuel combustion have been identified as a primary source of acid rain (U.S. Environmental Protection Agency, 2007). These oxides react with water and oxygen to form acidic compounds. Some of these acid compounds fall back to Earth in rain, but others return as gases and dry particles. Acid deposition may cause forest degradation and elevated acid levels in lakes and streams, resulting in a loss of fish and other aquatic biota. Sulfate has been associated with lung disorders. Nitrogen oxides form ozone in the atmosphere and also pose a health risk to individuals with lung disorders (U.S. Environ-mental Protection Agency, 2007).
The Clean Air Act Amendments of 1977 required States to develop formal State Implementation Plans (SIP) for bringing areas in violation of the NAAQS into compliance and authorized penalties for States that have not developed or enforced approved SIPs. In an effort to discourage use of low-sulfur Western U.S. coal (Arbuckle and others, 1985), new source performance standards for coal-fired boilers were revised to require control technologies in all new plants to reduce emissions by certain percentages of what would be emitted in the absence of controls. In effect, controls would have to be installed even if Western low-sulfur coal were used. The USEPA did, however, establish different percentage reductions depending on the sulfur content of the fuel burned. This law also specified that Best Available Control Technology (BACT) be applied to new coal-fired plants sited in designated areas where no environmental degradation is allowed.
The 1990 Clean Air Act Amendments depart from the command and control approach of specifying an emission standard and compliance technology for each source of pollu-tion. The industrywide emissions cap and trading market for emissions allowances let individual firms choose a least-cost combination of compliance options. For most industrial pro-cesses, the per-ton-of-SO2 emission-reduction costs increase as a higher fraction of total emissions must be captured. But certain plants probably have low compliance costs and rela-tively flat marginal costs for additional percentage of emis-sions reductions. These plants can reduce emissions below the standard cheaply and thereby earn emission allowances. The

10 The National Coal Resource Assessment Overview
allowances earned by overcompliance either can be sold or banked for future use.
Alternatively, plants having high compliance costs and marginal costs that rise steeply with the increasing capture of emissions have the option to purchase the emission allow-ances and will do so when the annualized incremental costs of emission reductions are higher than the cost of emission allowances. Overall, the industry will meet the emissions stan-dard. By utilizing tradable permits, marginal costs of emission reduction can be equalized across each plant in the industry, leading to a least-cost mix of emission-control strategies.
Phase I Regulations and Responses
The amendments to the Clean Air Act passed in 1990 (referred to herineafter as 1990 CAAA) specify that reduc-tions in sulfur emissions at coal-fired plants occur in two phases. Phase I occurred from 1995 through 1999 and Phase II began in 2000. Phase I designated 263 boiler units (attached to 261 generators, representing 89 gigawatts [GW] of capac-ity) for emission reductions. Emissions for these units were to be reduced to 2.5 lb of sulfur dioxide (SO2) per million Btu (MMBtu) (4.5 grams per million calories or 4.5 g/MMcal) of fuel burned.
Plants affected by Phase I were allocated emissions allowances at the rate of 2.5 lb SO2 per MMBtu combusted (4.5 g/MMcal). The number of allowances issued was tied to the fuel burned during the 1985 through 1987 base period. If a plant instituted actions that reduced emissions below this 2.5 lb SO2 per MMBtu (4.5 g/MMcal) the plant could bank or sell the unused emission allowances. Each emission allowance permits the plant to emit one short ton of sulfur dioxide.
The utilities affected by Phase-I regulations added 182 boilers (attached to 174 generators, representing 42 GW of capacity) that served as substitution or compensating units so that the emissions standards could be met on the basis of a group of boilers. Lower emissions in a substitution unit could be applied to offset required emission reductions in the paired original unit. Each pair, the original Phase-I boiler and the compensating or substitution unit, was required to be under common ownership. Options for compliance included coal fuel switching or blending, installation of flue-gas desulfuriza-tion (FGD) systems, retiring units, using previously imple-mented controls, boiler repowering,5 and purchasing additional emission allowances.
Figure 6 shows the Phase-I compliance options chosen by utilities as of 1997. About one-half the original units (with 53 percent of nameplate capacity affected by Phase I) switched to lower sulfur coal, 32 percent of the units (with 27 percent of the capacity) purchased additional emissions allowances, 10 percent (with 16 percent of the capacity) installed scrub-bers, 3 percent (with 2 percent of the capacity) were retired, and the remaining units switched to oil or gas. Continuous
emissions-monitoring systems were required in all plants affected by Phase I. As of January 1, 2000, plants regulated by Phase I had banked about 11.6 million allowances.
Under Phase I, on a per-ton basis of sulfur dioxide emis-sions, annualized abatement costs in 1995 dollars averaged as follows: for a new retrofit scrubber $322/st ($355/t), for switching to low-sulfur bituminous coal $167/st ($184/t), and for switching to low-sulfur subbituminous coal $113 st ($125/t). The switching costs include modifications to the boiler and other parts of the plant along with any price pre-mium paid for low-sulfur coal (Energy Information Adminis-tration, 1997). In the period from 1995 to 1997, the market for emissions allowances varied between $69 and $138 per st ($76 to $152 per tonne). Overall, the 1995 sulfur-dioxide emissions from all Phase-I units (initial, substitute, and complementary units) were cut to one-half of the 1985 emission levels. The positive results in terms of emissions reduction of the Phase-I program exceeded the objectives of the legislation. Also, the predominant compliance patterns appear to indicate the strate-gies that the industry will use under Phase II. Even without the imminent pressure of deregulation, utilities opted for switch-ing to low-sulfur coal rather than incur the risks of installing retrofit FGD systems.
As of 1999, less than 30 percent of the coal-fired electrical-generation capacity was equipped with FGD systems (Resource Data Incorporated, 1999). The scrubber cost estimates quoted are based on the capital costs of retrofitting plants with scrubbers compared to other compliance options. Operating costs are higher with FGD systems because of additional materials-flow and waste-handling requirements. On a yearly basis, the tonnage of solid and liquid scrubber
(2.00%)
(27.00%)
(16.00%)
(2.00%)
(53.00%)
Air Act Amendment—Generating Capacity
LOWERSULFUR COAL
SWITCH TOOIL/GAS
EMISSIONSALLOWANCES
RETIRED
SCRUBBER
Compliance Options Under Phase I of 1990 Clean
Figure 6. Electric utility compliance options under Phase I of the 1990 Clean Air Act Amendments by generating capacity. (Source: Energy Information Administration, 1997).
5Boiler repowering changes fuel type radically and also changes the technology configuration of the powerplants.

Coal Marketability: Current and Future Conditions 11
waste materials for a wet limestone slurry system could easily approach 90 percent of the plant’s input coal tonnage. Newer coal-fired plants are commonly located in rural areas and are able to allot hundreds of acres for dewatering and settling ponds of FGD waste materials. Older plants located near metropolitan areas may not have such land available. In 1997, 96 percent of the boiler slag, 30 percent of the bottom ash, and 32 percent of the fly ash were recovered and resold from powerplants. Much less of the FGD wastes are recovered (Wright, 1999).
If a coal-fired plant switches to a lower calorific fuel, the plant’s maximum generating capacity will be de-rated (reduced). Investments in boiler modifications can mitigate much of this penalty. However, additional investment in materials-handling equipment is required to manage the higher fuel feed rates that are necessary. For example, suppose the plant’s heat rate remains constant after conversion of the boiler. If a coal of 12,500 Btu/lb (6,950 cal/g) is replaced with a coal of 8,900 Btu/lb (4,950 cal/g), the lower calorific coal tonnage would have to increase by at least 40 percent to maintain the same generating capacity.
Phase II Regulations and Response
Phase-II requirements affect virtually all fossil fuel elec-tricity producers and cap sulfur dioxide emissions nationally at 8.95 mst (8.12 Mt) per year (U.S. Environmental Protection Agency, 2007). In 2000, the cap implied that plant’s emissions could be no more than 1.2 lb SO2/MMBtu (2.2 g/MMcal) (or 0.6 lb sulfur/MMBtu) (1.1 g sulfur/MMcal) (U.S. Envi-ronmental Protection Agency, 2000). During Phase II, each plant is allotted SO2 emissions allowances based on their fuel use during the 1985 through 1987 base period. Allowances are issued at the rate of 1.2 lb SO2/MMBtu (2.2 g/MMcal) combusted during the base period. Transition rules regarding the base endowment for allowances affect certain plants and plants constructed between 1987 and 1995. Plants constructed after 1996 are not allotted emissions permits but must pur-chase them. Although Phase-II allocation rates are consistent with the absolute cap on sulfur dioxide emissions of 8.95 mst (8.12 Mt) per year, actual emissions probably will exceed the goal until the banked allowances are depleted.
In response to the 1990 CAAA, several State legislatures in high-sulfur-coal-producing States passed laws requiring coal-burning utilities operating within the State to install flue-gas scrubbers for the purpose of encouraging use of locally produced coal. These laws were challenged by Western U.S. coal producers and were voided and found to be unconstitu-tional by Federal courts.
In 2000, at the outset of Phase II, industry forecasts were for a conversion from coal-fired power generation to gas-fired power generation (Resource Data Incorporated, 1999) and from high-sulfur to low-sulfur coal (Hill and Associates, 1999). As figure 5 shows, historical per MWH fuel costs for coal and gas from 1995 through 1999 were reasonably close. From 1995 though 1999, the share of electricity generated by
gas increased from 13 to 16 percent while the share attribut-able to coal barely changed (see figure 3).
Since 1996, the amount of coal-fired generating capacity using FGD systems to capture SO2 has increased by 85 per cent, from 86 GW to 159 GW, but total coal-fired generating capacity increased less than 5 percent. There is evidence that FGD system manufacturers initiated technological improve-ments that reduced costs and increased system reliability at the outset of Phase I (Ellerman and others, 2000). Data published by EIA (Energy Information Administration, 2007b) show that between 1995 and 2005, the installed cost of FGD systems declined by 11 percent and operating costs declined by 16 percent (based on constant 2006 dollars).
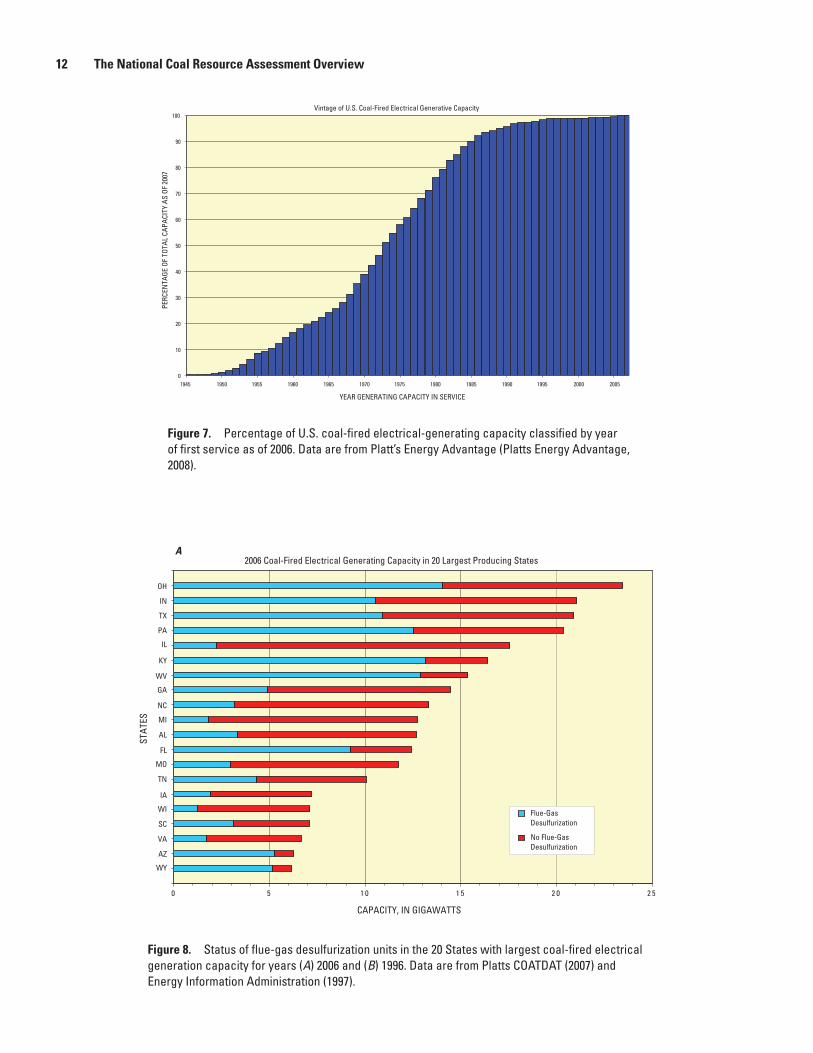
Figure 7 shows vintages of U.S. coal-fired generation capacity expressed in terms of percentage of total coal-fired capacity. About 70 percent of the coal-fired capacity in use in 2006 was installed before 1980. Though many of these plants have modernized their boilers and generators, some had obvious physical limitations in the plant configurations that preclude, for example, a doubling of the plant’s materials- handling capacity that might be required for retrofit FGD systems.
According to figure 4, the two census regions consum-ing the largest quantities of coal are the East North Central region (Illinois, Indiana, Michigan, Ohio, and Wisconsin) and the Southeastern Atlantic region (Delaware, Florida, Georgia, Maryland, Virginia, West Virginia, North and South Carolina). The States of Ohio, West Virginia, Pennsylvania, Kentucky, Georgia, Florida, and Indiana accounted for 60 percent of the new FGD capacity that was added between 1996 and 2006. The Eastern States of Ohio, West Virginia, Pennsylvania, and Indiana all produce high-sulfur coal, and prior to 2000 these States had few plants equipped with scrubbers and had among the highest SO2 emissions.
Figures 8A and 8B rank the coal-fired generation capac-ity for 2006 and 1996, respectively, for States with at least 6 GW of capacity in 2006, respectively. Figure 8 also shows, for each State, the proportion of coal-fired capacity with FGD systems. For 2006, the top seven States (Ohio, Indiana, Texas, Pennsylvania, Illinois, Kentucky and West Virginia) are also major coal-producing States. By 2007, with the exception of Illinois, at least half of each of these States’ coal-fired gener-ating capacity was equipped with FGD systems. Both Texas and Illinois purchased more than 55 millions tons (50 million t) of low-sulfur Powder River Basin coal in 2006. Coal-fired plants in Michigan, Missouri, and Wisconsin were also large purchasers of low-sulfur Powder River Basin coal. Eastern States such as Georgia, Ohio, North Carolina, and South Carolina are dominant purchasers of low-sulfur coal produced in the Central Appalachian Basin. The data show the coal-fired electrical-power generation industry had a balanced approach to compliance under Phase II.
The outcomes of the emissions-abatement actions are shown by figures 9A and 9B. Since 1990, the overall U.S. rate of SO2 and nitrogen oxide (NOx) emissions per MWH generated by coal-fired plants have declined by 47 percent
12 The National Coal Resource Assessment Overview
Vintage of U.S. Coal-Fired Electrical Generative Capacity
0
10
20
30
40
50
60
70
80
90
100
1945 1950 1955 1960 1965 1970 1975 1980 1985 1990 1995 2000 2005
YEAR GENERATING CAPACITY IN SERVICE
PERC
ENTA
GE O
F TO
TAL
CAPA
CITY
AS
OF 2
007
Figure 7. Percentage of U.S. coal-fired electrical-generating capacity classified by year of first service as of 2006. Data are from Platt’s Energy Advantage (Platts Energy Advantage, 2008).
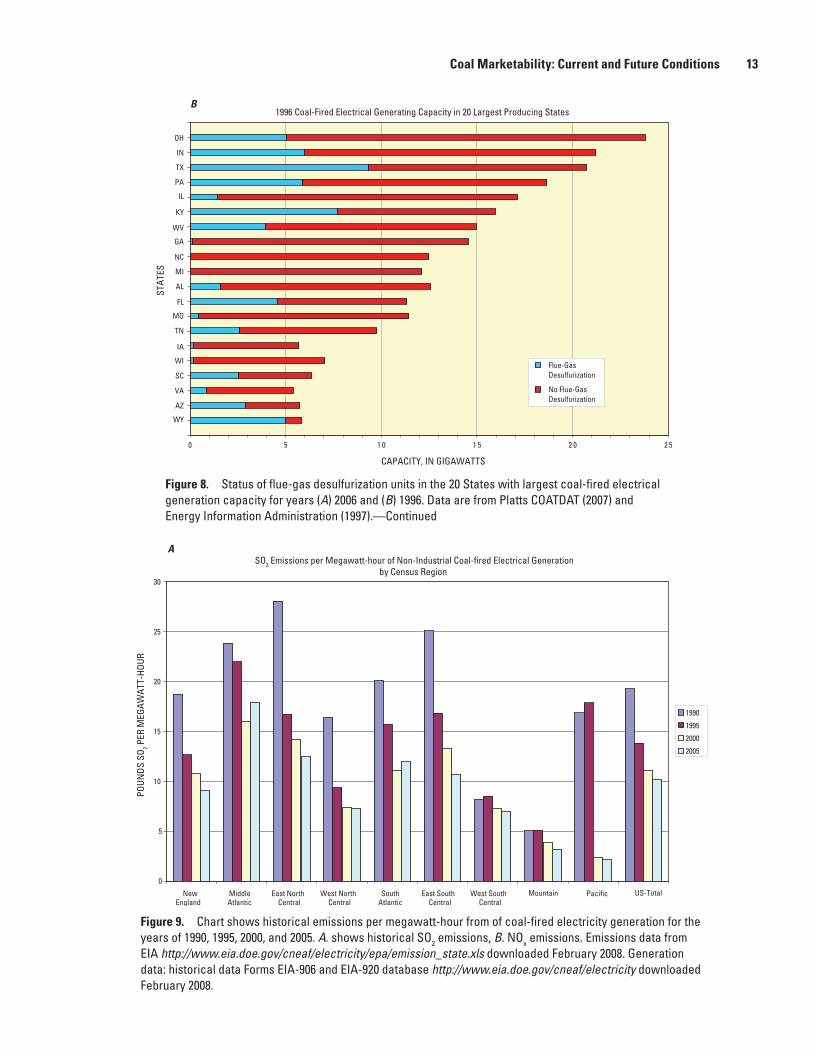
Figure 8. Status of flue-gas desulfurization units in the 20 States with largest coal-fired electrical generation capacity for years (A) 2006 and (B) 1996. Data are from Platts COATDAT (2007) and Energy Information Administration (1997).
2006 Coal-Fired Electrical Generating Capacity in 20 Largest Producing States
5202510150
OH
IN
TX
PA
IL
KY
WV
GA
NC
MI
AL
FL
MO
TN
IA
WI
SC
VA
AZ
WY
STAT
ES
CAPACITY, IN GIGAWATTS
Flue-GasDesulfurization
No Flue-GasDesulfurization
A
Coal Marketability: Current and Future Conditions 13
Figure 8. Status of flue-gas desulfurization units in the 20 States with largest coal-fired electrical generation capacity for years (A) 2006 and (B) 1996. Data are from Platts COATDAT (2007) and Energy Information Administration (1997).—Continued
1996 Coal-Fired Electrical Generating Capacity in 20 Largest Producing States
5202510150
OH
IN
TX
PA
IL
KY
WV
GA
NC
MI
AL
FL
MO
TN
IA
WI
SC
VA
AZ
WY
STAT
ES
CAPACITY, IN GIGAWATTS
Flue-GasDesulfurization
No Flue-GasDesulfurization
B
SO2 Emissions per Megawatt-hour of Non-Industrial Coal-fired Electrical Generationby Census Region
0
5
10
15
20
25
30
NewEngland
MiddleAtlantic
East NorthCentral
West NorthCentral
SouthAtlantic
East SouthCentral
West SouthCentral
POUN
DS S
O 2 PER
MEG
AWAT
T-HO
UR
1990
1995
2000
2005
Mountain US-TotalPacific
A
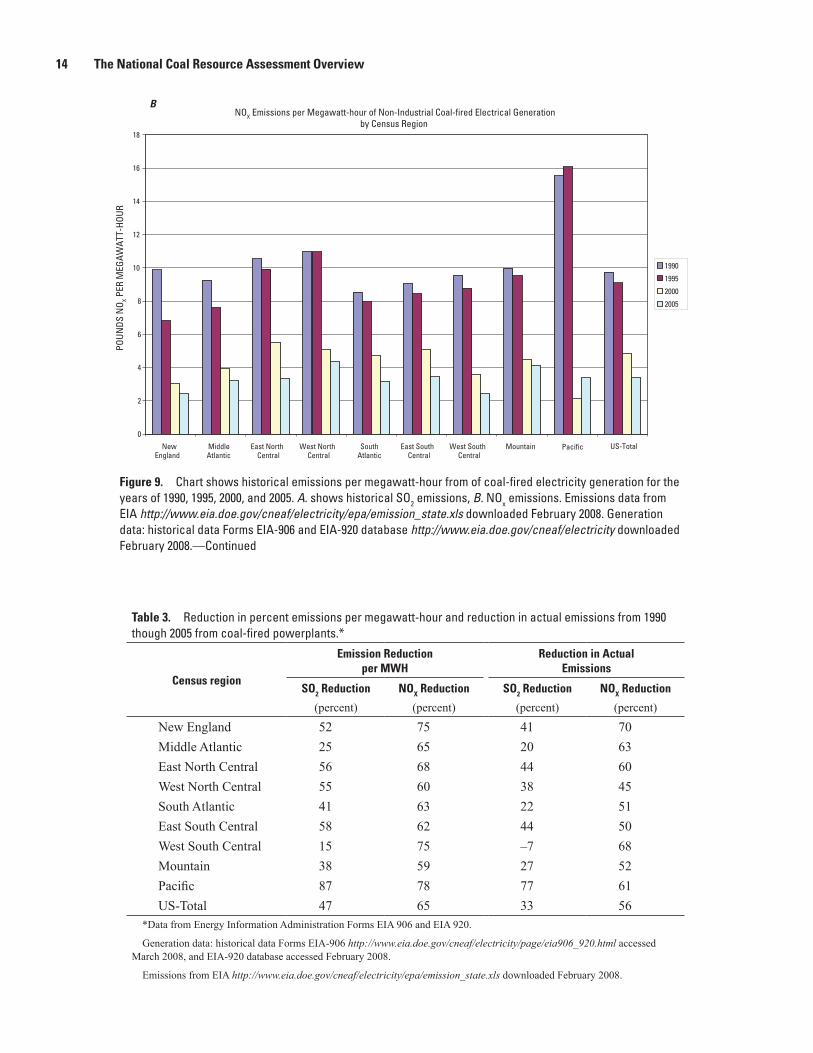
Figure 9. Chart shows historical emissions per megawatt-hour from of coal-fired electricity generation for the years of 1990, 1995, 2000, and 2005. A. shows historical SO2 emissions, B. NOx emissions. Emissions data from EIA http://www.eia.doe.gov/cneaf/electricity/epa/emission_state.xls downloaded February 2008. Generation data: historical data Forms EIA-906 and EIA-920 database http://www.eia.doe.gov/cneaf/electricity downloaded February 2008.
14 The National Coal Resource Assessment Overview
BNOX Emissions per Megawatt-hour of Non-Industrial Coal-fired Electrical Generation
by Census Region
0
2
4
6
8
10
12
14
16
18
NewEngland
MiddleAtlantic
East NorthCentral
West NorthCentral
SouthAtlantic
East SouthCentral
West SouthCentral
Mountain
POUN
DS N
O X PER
MEG
AWAT
T-HO
UR
1990
1995
2000
2005
US-TotalPacific
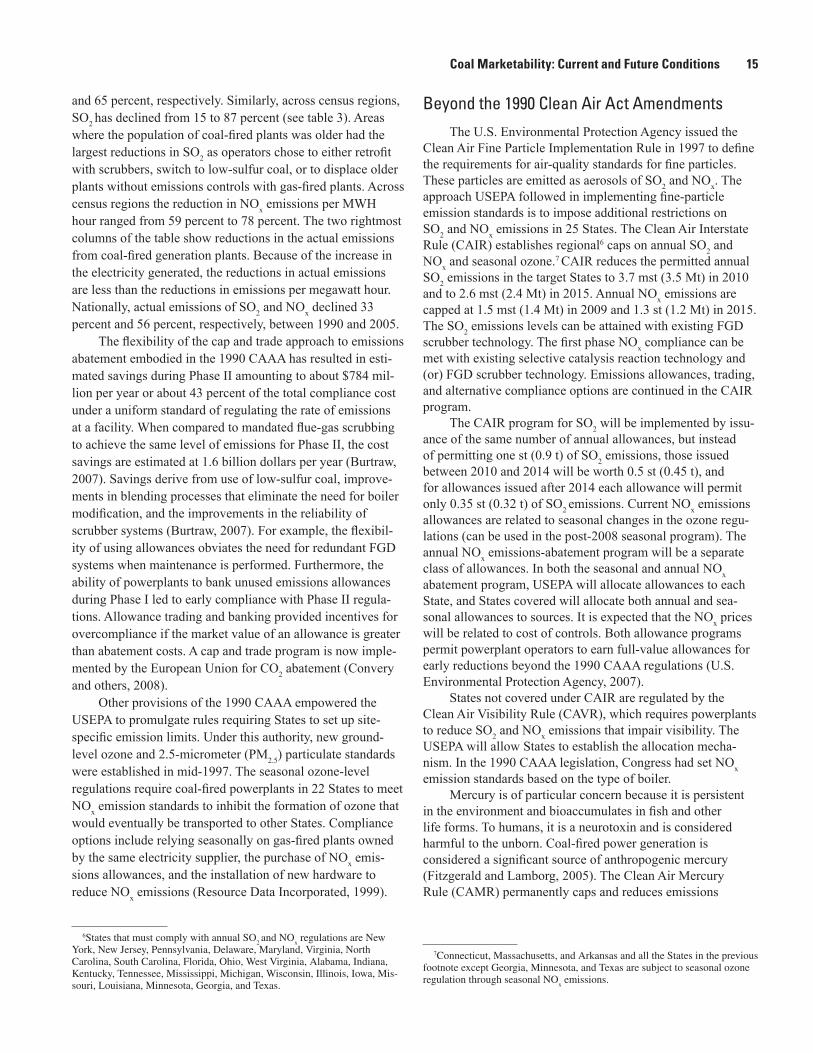
Figure 9. Chart shows historical emissions per megawatt-hour from of coal-fired electricity generation for the years of 1990, 1995, 2000, and 2005. A. shows historical SO2 emissions, B. NOx emissions. Emissions data from EIA http://www.eia.doe.gov/cneaf/electricity/epa/emission_state.xls downloaded February 2008. Generation data: historical data Forms EIA-906 and EIA-920 database http://www.eia.doe.gov/cneaf/electricity downloaded February 2008.—Continued
Table 3. Reduction in percent emissions per megawatt-hour and reduction in actual emissions from 1990 though 2005 from coal-fired powerplants.*
Census region
Emission Reductionper MWH
Reduction in Actual Emissions
SO2 Reduction NOX Reduction SO2 Reduction NOX Reduction
(percent) (percent) (percent) (percent)
New England 52 75 41 70Middle Atlantic 25 65 20 63East North Central 56 68 44 60West North Central 55 60 38 45South Atlantic 41 63 22 51East South Central 58 62 44 50West South Central 15 75 –7 68Mountain 38 59 27 52Pacific 87 78 77 61US-Total 47 65 33 56
*Data from Energy Information Administration Forms EIA 906 and EIA 920.
Generation data: historical data Forms EIA-906 http://www.eia.doe.gov/cneaf/electricity/page/eia906_920.html accessedMarch 2008, and EIA-920 database accessed February 2008.
Emissions from EIA http://www.eia.doe.gov/cneaf/electricity/epa/emission_state.xls downloaded February 2008.
Coal Marketability: Current and Future Conditions 15
and 65 percent, respectively. Similarly, across census regions, SO2 has declined from 15 to 87 percent (see table 3). Areas where the population of coal-fired plants was older had the largest reductions in SO2 as operators chose to either retrofit with scrubbers, switch to low-sulfur coal, or to displace older plants without emissions controls with gas-fired plants. Across census regions the reduction in NOx emissions per MWH hour ranged from 59 percent to 78 percent. The two rightmost columns of the table show reductions in the actual emissions from coal-fired generation plants. Because of the increase in the electricity generated, the reductions in actual emissions are less than the reductions in emissions per megawatt hour. Nationally, actual emissions of SO2 and NOx declined 33 percent and 56 percent, respectively, between 1990 and 2005.
The flexibility of the cap and trade approach to emissions abatement embodied in the 1990 CAAA has resulted in esti-mated savings during Phase II amounting to about $784 mil-lion per year or about 43 percent of the total compliance cost under a uniform standard of regulating the rate of emissions at a facility. When compared to mandated flue-gas scrubbing to achieve the same level of emissions for Phase II, the cost savings are estimated at 1.6 billion dollars per year (Burtraw, 2007). Savings derive from use of low-sulfur coal, improve-ments in blending processes that eliminate the need for boiler modification, and the improvements in the reliability of scrubber systems (Burtraw, 2007). For example, the flexibil-ity of using allowances obviates the need for redundant FGD systems when maintenance is performed. Furthermore, the ability of powerplants to bank unused emissions allowances during Phase I led to early compliance with Phase II regula-tions. Allowance trading and banking provided incentives for overcompliance if the market value of an allowance is greater than abatement costs. A cap and trade program is now imple-mented by the European Union for CO2 abatement (Convery and others, 2008).
Other provisions of the 1990 CAAA empowered the USEPA to promulgate rules requiring States to set up site- specific emission limits. Under this authority, new ground-level ozone and 2.5-micrometer (PM2.5) particulate standards were established in mid-1997. The seasonal ozone-level regulations require coal-fired powerplants in 22 States to meet NOx emission standards to inhibit the formation of ozone that would eventually be transported to other States. Compliance options include relying seasonally on gas-fired plants owned by the same electricity supplier, the purchase of NOx emis-sions allowances, and the installation of new hardware to reduce NOx emissions (Resource Data Incorporated, 1999).
Beyond the 1990 Clean Air Act Amendments
The U.S. Environmental Protection Agency issued the Clean Air Fine Particle Implementation Rule in 1997 to define the requirements for air-quality standards for fine particles. These particles are emitted as aerosols of SO2 and NOx. The approach USEPA followed in implementing fine-particle emission standards is to impose additional restrictions on SO2 and NOx emissions in 25 States. The Clean Air Interstate Rule (CAIR) establishes regional6 caps on annual SO2 and NOx and seasonal ozone.7 CAIR reduces the permitted annual SO2 emissions in the target States to 3.7 mst (3.5 Mt) in 2010 and to 2.6 mst (2.4 Mt) in 2015. Annual NOx emissions are capped at 1.5 mst (1.4 Mt) in 2009 and 1.3 st (1.2 Mt) in 2015. The SO2 emissions levels can be attained with existing FGD scrubber technology. The first phase NOx compliance can be met with existing selective catalysis reaction technology and (or) FGD scrubber technology. Emissions allowances, trading, and alternative compliance options are continued in the CAIR program.
The CAIR program for SO2 will be implemented by issu-ance of the same number of annual allowances, but instead of permitting one st (0.9 t) of SO2 emissions, those issued between 2010 and 2014 will be worth 0.5 st (0.45 t), and for allowances issued after 2014 each allowance will permit only 0.35 st (0.32 t) of SO2 emissions. Current NOx emissions allowances are related to seasonal changes in the ozone regu-lations (can be used in the post-2008 seasonal program). The annual NOx emissions-abatement program will be a separate class of allowances. In both the seasonal and annual NOx abatement program, USEPA will allocate allowances to each State, and States covered will allocate both annual and sea-sonal allowances to sources. It is expected that the NOx prices will be related to cost of controls. Both allowance programs permit powerplant operators to earn full-value allowances for early reductions beyond the 1990 CAAA regulations (U.S. Environmental Protection Agency, 2007).
States not covered under CAIR are regulated by the Clean Air Visibility Rule (CAVR), which requires powerplants to reduce SO2 and NOx emissions that impair visibility. The USEPA will allow States to establish the allocation mecha-nism. In the 1990 CAAA legislation, Congress had set NOx emission standards based on the type of boiler.
Mercury is of particular concern because it is persistent in the environment and bioaccumulates in fish and other life forms. To humans, it is a neurotoxin and is considered harmful to the unborn. Coal-fired power generation is considered a significant source of anthropogenic mercury (Fitzgerald and Lamborg, 2005). The Clean Air Mercury Rule (CAMR) permanently caps and reduces emissions
6States that must comply with annual SO2 and NO
x regulations are New
York, New Jersey, Pennsylvania, Delaware, Maryland, Virginia, North Carolina, South Carolina, Florida, Ohio, West Virginia, Alabama, Indiana, Kentucky, Tennessee, Mississippi, Michigan, Wisconsin, Illinois, Iowa, Mis-souri, Louisiana, Minnesota, Georgia, and Texas.
7Connecticut, Massachusetts, and Arkansas and all the States in the previous footnote except Georgia, Minnesota, and Texas are subject to seasonal ozone regulation through seasonal NO
x emissions.

16 The National Coal Resource Assessment Overview
from coal-fired powerplants. Phase I (2010) reduces annual (national) emissions to 35 st (32 t), and Phase II (2018) reduces those emissions to 15 st (14 t), representing a 70-percent reduction from the base year of 1999. Mercury reduction will be accomplished by existing technologies as a consequence of SO2 and NOx in 28 Eastern States and the District of Columbia. under Phase I (Kolker and others, 2006). It is anticipated that specific technologies will have to be developed to accomplish the reduction required by 2018 (U.S. Environmental Protection Agency, 2007). In February 2008, a Federal Court suspended enforcement of the Clean Air Mercury Rule because of a proposed emission allowance market cap and trade plan. Several States have instituted mercury emission standards.
Carbon Dioxide Emission Abatement and Coal-Fired Power Generation
Concern about greenhouse gas emissions has led to sev-eral legislative proposals limiting carbon dioxide emissions. The European Union already has a cap and trade program for CO2 in effect (Convery and others, 2008). Coal-fired power-generation plants are primary targets for regulation. Although all fossil-fuel power-generation plants emit CO2, coal-fired plants emit more than twice as much per MWH as gas-fired plants. With well over half of U.S. electricity generated by coal-fired plants, transition to another fuel cannot occur quickly even if an acceptable fuel could be found. U.S. con-ventional gas production reached a peak in 1973, and while unconventional natural gas resources appear to be large, pro-duction rates are lower than conventional gas-production rates given the same volume of in-place resource. It is much more costly8 with unconventional resources to attain and sustain the gas-production rates required to significantly increase gas-fired power generation. Nuclear powerplant safety, security concerns, and delays in the resolution of the disposition of spent nuclear fuels have resulted in no new nuclear power-plants being approved for construction in the United States from the end of the 1970s through 2008. Even though several plants had been approved before the 1980s they have not yet been constructed.
Most of the following discussion on the implications of carbon-emission constraints on coal-fired powerplants is taken from the Massachusetts Institute of Technology (MIT) Center for Energy and Environment publication “Future of Coal: Options for a Carbon-Constrained World.” The MIT study published in 2007 (Massachusetts Institute of Technol-ogy, 2007) was based on costs that do not fully incorporate the escalation in capital cost that have occurred from 2000 to 2006, so the discussion that follows is based on the relative
increases in costs that must be incurred from a base plant that meets all 2008 emissions-abatement requirements.
One option for abatement of carbon emissions from coal-fired plants is CO2 capture, concentration, and sequestration (CCS). The procedure refers to the removal of carbon dioxide from the combustion-product flue gas at fossil-fuel electricity-generating plants, compression of the carbon dioxide to a liquid form, transportation to the sequestration site, and injec-tion into the sequestration site. As currently envisioned, the capture of CO2 from the plant’s flue-gas stream would apply the technology currently used in natural gas plants (amine process) for CO2 removal from the gas stream. The CO2 gas is then compressed and shipped by pipeline to an injection site where it may be sequestered.
Suppose the goal is to capture 90 percent of the CO2 gen-erated by combustion in the absence of capture. The capture and compression stage are energy intensive. For new state-of-the-art plants, that is, pulverized coal combustion utilizing ultra-supercritical, supercritical, or subcritical technologies, capture and compression will reduce plant efficiency from 22 to 27 percent (Massachusetts Institute of Technology, 2007). Because of plant floor-space requirements for the additional processes and because of the severe de-rating that existing plants would have (40-percent reduction in efficiency) when adding the capture and compression processes, the MIT study did not consider retrofitting existing plants with CCS pro-cesses as a viable option. For new state-of-the-art pulverized coal combustion utilizing ultra-supercritical, supercritical, or subcritical technologies, plant construction cost would increase by 54 to 74 percent by adding carbon capture and compression. The total generation cost would increase from 57 to 69 percent.
An alternative to pulverized coal combustion and CCS is first to synthesize natural gas from coal and generate electric-ity in a combined cycle plant, that is, Integrated Gas Com-bined Cycle. Whereas the CO2 capture is an integral part of the coal-to-gas conversion part, the MIT study cites poor plant startup experience and no cost advantage that would offset the risks of poor startup.
The MIT study considers CCS from a global perspective. A 500-MW coal-fired powerplant generates three million tons of CO2 per year. The United States has more than 300 GW of coal-fired generating capacity. Just 250 GW is equivalent to 500 coal-fired plants of 500 MW each. The largest successful carbon dioxide sequestration project in the world is the North Sea Sleipner field that injects 1 million tons of CO2 into an offshore saline aquifer. The CSS challenge is to scale up the process to sequester more than 1.3 billion tons per year, the equivalent of 90 percent of the carbon dioxide emitted annu-ally from 500 coal-fired plants of 500 MW each. Because coal is much more abundant and more uniformly distributed around the world than any other fossil fuel, coal is the fuel choice for
8Volumes of natural gas hydrates are thought to be immense, but technology must be developed for commercial recovery.
Coal Marketability: Current and Future Conditions 17
most of the developing world, and in particular, China and India, which are rapidly industrializing. The MIT study con-tends that the only way to stabilize CO2 in the atmosphere is to have developing countries also implement CCS programs. There is much research and development that must still be completed to devise protocols for choosing and monitoring sequestration sites. It is the view of the MIT study that the monitoring of such sites must be perpetual. The MIT study argues that the United States and other industrialized countries must develop the technology and knowledge base and transfer that technology to the developing world as a way to stabilize CO2 content in the atmosphere. For the purpose of this report, it appears that without an unforeseen advance in a ubiquitous, unconventional hydrocarbon source such as gas hydrates, coal will remain a primary base-load fuel for electricity generation in the United States and much of the developing world.
Coal Mining Industry
The coal mining industry is a natural-resource industry where production is tied geographically to a specific location or deposit with distinct properties. In competitive markets, short-run prices are set by the marginal cost associated with the marginal (highest cost) unit of production exchanged in the market. Unique properties of some deposits allow opera-tors to undercut costs of other producers, resulting in accrual of excess profits; that is, economic rents. For the market to be competitive, the low-cost producers must set their out-put in response to market prices rather than control price by manipulating output. With entry of new mines and expansion of productive capacity, the long-run competitive price of coal will tend toward the average unit costs of the new mines that supply the market (Charles River Associates, 1977).
Economic efficiency is fostered in competitive markets; however, no single measure of competition exists. The essence of the competitive market is that the individual firm responds to, rather than sets, market prices. Economists typically exam-ine an industry’s structure, conduct of firms, and performance to describe and evaluate competitive conditions.
The elements of an industry’s structure are the number and size distribution of firms or production units, level of firm and plant concentration, and barriers to entry or exit. Barriers to entry result from absolute cost advantages of incumbents, legal barriers such as patents, geographical barriers from lack of infrastructure, economies of scale, and, for natural resources, “reserve positions.” In particular, entry of new firms can be deterred by the magnitude and quality of leased or owned reserves of incumbents. The greater the barriers to entry, the less likely the industry will be competitive because incumbents can raise prices without fear of entry of new competitors. Conduct of firms includes national and regional pricing policy and the nature of nonprice forms of competi-tion. Attributes of industry economic performance include eco-nomic efficiency as indicated by profit margins (measured by price/cost ratios), productivity trends, technological innovation
and speed of adoption, improvements in product quality, and price stability.
Industry Structure
Table 4 shows national and regional trends in concentra-tion of mine-level production. Concentration ratios are simply the amount of market or productive capacity accounted for by a specific number of mines or firms. Between 1980 and 2006, domestic coal production increased by 42 percent, but the number of mines declined by more than 60 percent. Table 4 shows that U.S. production is increasingly concentrated in relatively few mines. By 2006, about 1 percent of the total number of mines (14 mines) accounted for 40 percent of the Nation’s productive capacity. Increasing mine concentra-tion may be a result of the drive to lower costs by exploiting economies of scale wherever possible. In 1980, the largest mine produced 16.1 mst (14.5 Mt), and in 2006 the highest producing single mine produced 92.7 mst (84.1 Mt) (Energy Information Administration, 2007a).
It can be difficult to determine from local mine-operator names the identity of mine ownership. Regional firm con-centration levels could not be calculated. Mine-concentration levels presented in table 4 understate operator/owner regional concentration because the largest firms commonly own more than one of the largest mines. For example, in 2006, only four firms produced 88 percent of the coal produced in the Powder River Basin, an area accounting about 40 percent of U.S. coal production.
Table 5 shows trends in mining-firm concentration of pro-duction at the national level. Data for 1980 to 1990 were from surveys prepared and published by the Keystone Coal Manual (1977, 1981, 1986, 1992). Data for 1993, 1998, and 2006 were compiled and published by EIA (1994, 2000, 2007a) from industrywide surveys. Coal prices rose with increasing oil and gas prices during the late 1970s and early 1980s. High prices attracted new entrants into coal mining from miner-als and other energy sectors. With the collapse of oil and gas prices in the mid-1980s and the decline of coal prices, profit expectations declined, and many of the new entrants left the industry by selling their properties to traditional coal-mining firms. Firm-concentration ratios reflect this pattern. By 2006, only four firms produced slightly less than one-half of U.S. coal production, and only 15 firms accounted for about three-fourths of the production.
Coal markets and mining are spatially separated, and transportation costs represent a significant part of delivered costs. Individual supply regions have natural (geographically proximate) markets, so market-supply efficiencies may also be assessed by examining the market structure from a regional perspective. Since 1980, in all regions except for the Gulf Coast lignite region, the number of operating mines declined and the concentration of production in fewer mines generally increased (see table 4). In five of the seven regions, the largest four mines in each region produced at least one-third of the

18 The National Coal Resource Assessment Overview
Table 4 . Trends in production (in millions of short tons), number of mines, and concentration among mines by producing region.*Region 1980 1985 1990 1997 2006NationalProduction 815.5 872.0 10,16.4 1,089.9 1,162.0Number of mines 3,967 3,354 3412 1,828 1,424Mine Concentration showing percentage of year’s production from thelargest 4 mines 6 7 8 11 22largest 8 mines 10 12 13 19 32largest 20 mines 18 22 23 31 45Northern Appalachian BasinProduction 181.0 160.7 166.7 160.1 130.4Number of mines 1,127 880 849 557 385Mine Concentration showing percentage of year’s production from thelargest 4 mines 5 7 10 17 30largest 8 mines 9 14 18 29 49largest 20 mines 18 27 35 56 69Central Appalachian BasinProduction 211.8 223.8 284.1 279.6 239.1Number of mines 2,074 1,894 1,628 916 787Mine Concentration showing percentage of year’s production from thelargest 4 mines 5 5 4 7 7largest 8 mines 7 7 8 13 12largest 20 mines 12 13 15 23 24Southern Appalachian Basin**Production 35.7 34.6 32.8 27.8 21.6Number of mines 293 176 151 97 80Mine Concentration showing percentage of year’s production from thelargest 4 mines 11 22 32 42 41largest 8 mines 21 34 49 65 55largest 20 mines 39 58 72 85 77Illinois BasinProduction 133.7 128.6 133.7 111.6 95.1Number of mines 259 215 186 114 76Mine Concentration showing percentage of year’s production from thelargest 4 mines 10 12 10 15 21largest 8 mines 18 19 18 27 37largest 20 mines 36 38 38 51 65Gulf Coast ligniteProduction 30.1 45.6 58.9 56.9 53.5Number of mines 8 14 17 14 15Mine concentration showing percentage of year’s production from thelargest 4 mines 90 72 58 53 46largest 8 mines 100 96 84 86 75

Coal Marketability: Current and Future Conditions 19
Table 4 . Trends in production (in millions of short tons), number of mines, and concentration among mines by producing region.*—ContinuedNorthern Rocky Mountains and Great PlainsProduction 137.8 196.3 246.4 349.1 519.0Number of mines 53 53 54 37 31Region 1980 1985 1990 1997 2006Mine Concentration showing percentage of year’s production from the largest 4 mines 33 31 31 36 50largest 8 mines 53 53 52 58 73largest 20 mines 85 85 88 92 97Colorado PlateauProduction 59.0 59.2 74.5 91.6 96.5Number of mines 75 54 40 33 30Mine Concentration showing percentage of year’s production from thelargest 4 mines 41 41 35 36 34largest 8 mines 61 58 56 58 60largest 20 mines 83 82 89 92 96
*Data are from EIA Form 7A various years, from the Energy Information Administration.
Conversion factor: 1 million short ton = 0.907 million metric tons. Years 1990, 1997, 2006 available at http://www.eia.doe.gov/cneaf/coal/page/database.html 2006 Coal Production Data File (Database, coalpublic06.xls) downloaded February 26, 2008.
**The Southern Appalachian Basin consists of mines in Alabama, Georgia, and Tennessee.
Table 5. Concentration ratios (shares) of annual National coal production accounted for by the 4, 8, and 15 leading coal-mining firms.
SHARES EXPRESSED AS PERCENTAGE OF ANNUAL PRODUCTION
1975* 1980* 1985* 1990* 1993** 1998** 2006**
largest 4 firms 26 21 20 22 24 40 47largest 8 firms 36 31 31 33 37 53 61largest 15 firms 47 41 43 47 51 65 73
*Data are from the Keystone Coal Industry Manual, McGraw Hill, published in years 1977, 1981, 1986, 1992.
**Data are from Energy Information Administration, Coal Industry Annual, published in years 1994, 2000, and 2007.
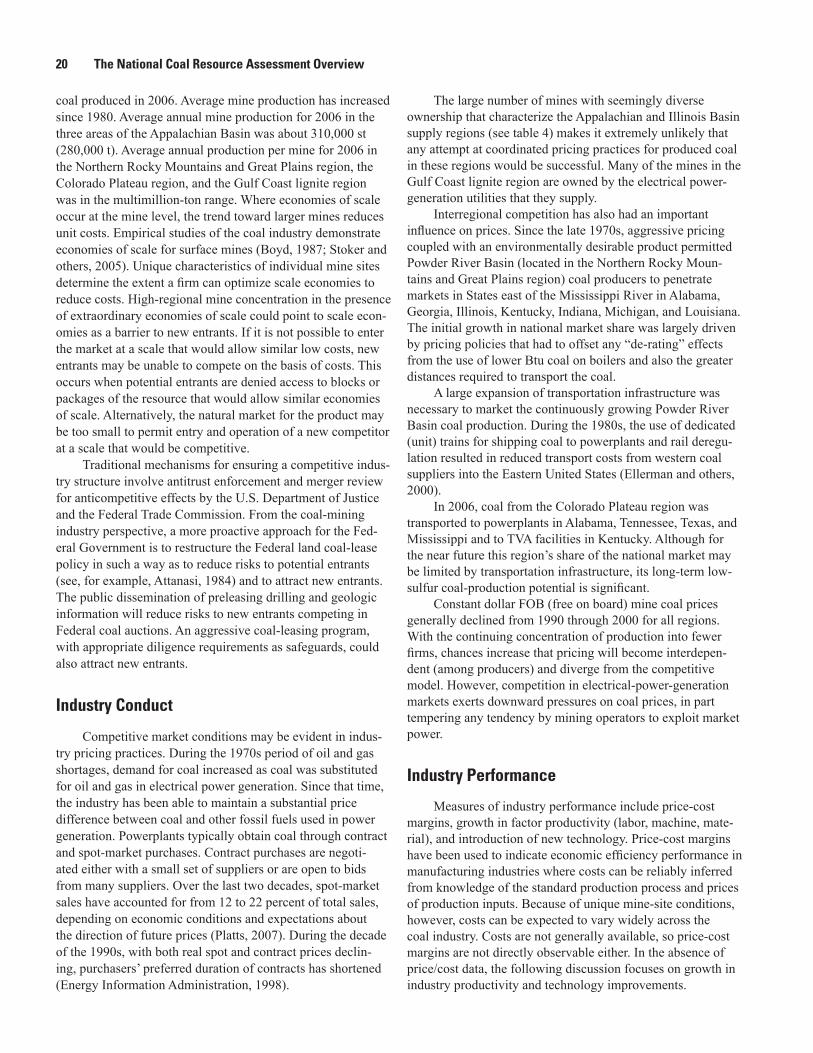
20 The National Coal Resource Assessment Overview
coal produced in 2006. Average mine production has increased since 1980. Average annual mine production for 2006 in the three areas of the Appalachian Basin was about 310,000 st (280,000 t). Average annual production per mine for 2006 in the Northern Rocky Mountains and Great Plains region, the Colorado Plateau region, and the Gulf Coast lignite region was in the multimillion-ton range. Where economies of scale occur at the mine level, the trend toward larger mines reduces unit costs. Empirical studies of the coal industry demonstrate economies of scale for surface mines (Boyd, 1987; Stoker and others, 2005). Unique characteristics of individual mine sites determine the extent a firm can optimize scale economies to reduce costs. High-regional mine concentration in the presence of extraordinary economies of scale could point to scale econ-omies as a barrier to new entrants. If it is not possible to enter the market at a scale that would allow similar low costs, new entrants may be unable to compete on the basis of costs. This occurs when potential entrants are denied access to blocks or packages of the resource that would allow similar economies of scale. Alternatively, the natural market for the product may be too small to permit entry and operation of a new competitor at a scale that would be competitive.
Traditional mechanisms for ensuring a competitive indus-try structure involve antitrust enforcement and merger review for anticompetitive effects by the U.S. Department of Justice and the Federal Trade Commission. From the coal-mining industry perspective, a more proactive approach for the Fed-eral Government is to restructure the Federal land coal-lease policy in such a way as to reduce risks to potential entrants (see, for example, Attanasi, 1984) and to attract new entrants. The public dissemination of preleasing drilling and geologic information will reduce risks to new entrants competing in Federal coal auctions. An aggressive coal-leasing program, with appropriate diligence requirements as safeguards, could also attract new entrants.
Industry Conduct
Competitive market conditions may be evident in indus-try pricing practices. During the 1970s period of oil and gas shortages, demand for coal increased as coal was substituted for oil and gas in electrical power generation. Since that time, the industry has been able to maintain a substantial price difference between coal and other fossil fuels used in power generation. Powerplants typically obtain coal through contract and spot-market purchases. Contract purchases are negoti-ated either with a small set of suppliers or are open to bids from many suppliers. Over the last two decades, spot-market sales have accounted for from 12 to 22 percent of total sales, depending on economic conditions and expectations about the direction of future prices (Platts, 2007). During the decade of the 1990s, with both real spot and contract prices declin-ing, purchasers’ preferred duration of contracts has shortened (Energy Information Administration, 1998).
The large number of mines with seemingly diverse ownership that characterize the Appalachian and Illinois Basin supply regions (see table 4) makes it extremely unlikely that any attempt at coordinated pricing practices for produced coal in these regions would be successful. Many of the mines in the Gulf Coast lignite region are owned by the electrical power-generation utilities that they supply.
Interregional competition has also had an important influence on prices. Since the late 1970s, aggressive pricing coupled with an environmentally desirable product permitted Powder River Basin (located in the Northern Rocky Moun-tains and Great Plains region) coal producers to penetrate markets in States east of the Mississippi River in Alabama, Georgia, Illinois, Kentucky, Indiana, Michigan, and Louisiana. The initial growth in national market share was largely driven by pricing policies that had to offset any “de-rating” effects from the use of lower Btu coal on boilers and also the greater distances required to transport the coal.
A large expansion of transportation infrastructure was necessary to market the continuously growing Powder River Basin coal production. During the 1980s, the use of dedicated (unit) trains for shipping coal to powerplants and rail deregu-lation resulted in reduced transport costs from western coal suppliers into the Eastern United States (Ellerman and others, 2000).
In 2006, coal from the Colorado Plateau region was transported to powerplants in Alabama, Tennessee, Texas, and Mississippi and to TVA facilities in Kentucky. Although for the near future this region’s share of the national market may be limited by transportation infrastructure, its long-term low-sulfur coal-production potential is significant.
Constant dollar FOB (free on board) mine coal prices generally declined from 1990 through 2000 for all regions. With the continuing concentration of production into fewer firms, chances increase that pricing will become interdepen-dent (among producers) and diverge from the competitive model. However, competition in electrical-power-generation markets exerts downward pressures on coal prices, in part tempering any tendency by mining operators to exploit market power.
Industry Performance
Measures of industry performance include price-cost margins, growth in factor productivity (labor, machine, mate-rial), and introduction of new technology. Price-cost margins have been used to indicate economic efficiency performance in manufacturing industries where costs can be reliably inferred from knowledge of the standard production process and prices of production inputs. Because of unique mine-site conditions, however, costs can be expected to vary widely across the coal industry. Costs are not generally available, so price-cost margins are not directly observable either. In the absence of price/cost data, the following discussion focuses on growth in industry productivity and technology improvements.
Coal Marketability: Current and Future Conditions 21
Bonskowski and others (2007) catalogue a list of innova-tions adopted by the coal-mining industry between 1983 and 2003 that enhanced productivity. For surface mines, productiv-ity is enhanced by the continuous scale-up (increase in size) of haul trucks, loaders, and excavators and by computer control of scheduling and dispatching haul trucks based on geoposi-tioning feedback and loader cycles. For underground mines, changes that resulted in use of conveyor belts to transport coal out of the mine required advances in materials, elec-tric motors, and conveyor technology. Underground mining productivity was also enhanced by improvements in steel used in longwall cutters, by improvements in automation and roof bolting equipment, and by the initial introduction of robotic mining.
Labor productivity can be computed from data collected by the U.S. Mine Safety and Health Administration (MSHA). Since 1980, average labor productivity in the coal mining industry has increased from 1.98 st (1.80 t) per miner-hour to 6.26 st (5.68 t) per miner-hour (Energy Information Admin-istration, 2007). This striking increase was due, in part, to the shift of mine production from the Eastern to the Western United States and to surface mining, which usually has higher labor productivity than underground mining. Western mine sites are generally more conducive to exploiting scale econo-mies than eastern mine sites. In 2006, more than 90 percent of the western coal was surface mined, but less than 40 percent of the eastern coal was produced by surface mines.
Economists commonly refer to land, labor, capital equipment, fuels, and materials as the factors of produc-tion. Increases in labor productivity do not inexorably signal increases in productivity for all other factors (that is, total factor productivity.) Increases in labor productivity arising from the substitution of capital for labor or because of new labor-saving technologies may not change total factor produc-tivity. There is strong evidence, however, that increases in coal industry labor productivity through 1998 reflected growth in total factor productivity (Darmstadter, 1997).
State productivity data for 1985, 1990, 1998 and 2006 from the Energy Information Administration’s Annual Coal Reports (1994, 2000, and 2007a) were reworked to estimate labor productivity for coal-supply regions. During the early 1970s, coal-mining labor productivity had declined because of implementation of health and safety regulations and surface-mine reclamation requirements embodied in the Coal Health and Safety Act of 1969 and the Surface Mining Act of 1977, respectively (Darmstadter, 1997). By 1984, overall coal-mining labor productivity had recovered to pre-regulation levels. Figure 10 compares estimates of labor productivity for each supply region for both surface and underground mining. Estimates for the Northern Rocky Mountains and the Great Plains region and the Colorado Plateau region are combined and designated “western.”
Figure 10 shows increasing labor productivity from 1985 through 1998. Inasmuch as labor productivity across regions reflects total factor productivity and unit costs, these differentials mirror the competitive mining cost positions of
each region. The resulting decline in unit costs allowed the decline in mine-mouth prices. With the exception of mines in the Western U.S. regions, labor productivity either declined between 1998 and 2006 or the growth in productivity was stagnant. Production declined substantially in each region with declining labor productivity. It is not clear whether the decline in labor productivity is a result of lack of investment to open new mines with state-of-the-art technology or whether it signals increasing costs due to smaller coal mining units and thinner beds.
During the period from 1985 though 1998, improvements in underground mine productivity increase were largely attrib-utable to a shift to longwall mining from traditional room-and-pillar mining operations. Room-and-pillar operations use either continuous miners or conventional mining techniques.9 Production from longwall mines accounted for nearly one-half of U.S. underground coal production in 2006, up from 20 percent of underground production in 1983.
On average, longwall mines with the highest labor productivity are in the Western United States. Data for 2006 (Energy Information Administration, 2007a) show Appala-chian longwall mines are, on average, at least 50 percent more productive than underground mines using continuous mining in a room-and-pillar setting. In the Western United States, longwall mines were at least 160 percent more productive than other underground methods. Longwall mines accounted for nearly 48 percent of Appalachian underground production, and in the Western United States they accounted for nearly 90 per-cent (Energy Information Administration, 2007a). Longwall mines also have higher recovery rates of the coal-in-place than room-and-pillar mines. Future productivity improvements in longwall mining will be incremental, resulting from increas-ing automation, improved mine design, and greater machine capacity and speed (Weisdack and Wolf, 1995).
To summarize, growth in labor productivity occurred in all regions from 1985 through 1998 in underground and sur-face mines. Pricing behavior, at least over the last 15 years, is consistent with competitive markets. For the period from 1998 through 2006, some areas showed a decline in labor productiv-ity for surface and underground mines. At the national level, however, coal production increased from 1998 through 2006 while coal production in the Appalachian Basin, the Illinois Basin, and the Gulf Coast lignite region declined. Sources of productivity growth include exploitation of scale econo-mies, incremental technological advances embedded in new
9In room-and-pillar underground mining, the pillars (indigenous coal left intact) at regular intervals support the roof of the mine, and the “room” is the area where the coal is extracted. In conventional mining, explosives or compressed air are used to loosen coal from the face that is then broken by machine and transported out of the mine. In continuous mining, a machine extracts coal from the face without blasting. For longwall mining a cutting machine moves back and forth across a very large coal face referred to as a coal panel 300 to 820 feet (91 to 250 meters) wide and up to 3 miles (4.8 kilometers) long, extracting coal from the face that is removed by conveyor. The mining machine is protected under movable roof supports that advance as the bed is cut. The roof of mined-out areas collapses as mining progresses (see Energy Information Administration, 1994, for a detailed description).

22 The National Coal Resource Assessment Overview
WESTERN REGIONS
SOUTHERN APPALACHIAN BASIN
ILLINOIS BASIN
CENTRAL APPALACHIAN BASIN
NORTHERN APPALACHIAN BASIN
GULF COAST LIGNITE REGION
SURFACE MINE, Regional Labor Productivity
SHORT TONS PER MINER HOUR
1985
1990
1998
2006
0 5 10 15 20 25 30
0 5 10
GULF COAST LIGNITEREGION
NORTHERN APPALACHIAN BASIN
CENTRAL APPALACHIAN BASIN
ILLINOIS BASIN
SOUTHERN APPALACHIAN BASIN
WESTERN REGIONS
SHORT TONS PER MINER HOUR
UNDERGROUND MINES, Regional Labor Productivity
1985
1990
1998
2006
Figure 10. Labor productivity at surface and underground mines by coal-supply region for 1985, 1990, 1998, and 2006. Western region includes the Northern Rocky Mountains and Great Plains and the Colorado Plateau regions—see figure 1. Calculations made from data by Energy Information Administration (1994, 2000, 2007a).
Coal Marketability: Current and Future Conditions 23
capital, and innovative production techniques. In view of the large regional differences in productivity, it is also likely that the regional redistribution of production will continue if coal transportation rates remain stable.
Coal Markets by Coal-Producing Region
Coal transportation costs can account for a significant fraction of the delivered price to powerplants. If coals were homogeneous, extraction costs constant and uniform across mines, then a producing region’s geographic market area would be spatially defined by transportation rates and dis-tances between competing producing regions. However, coal is differentiated by its quality. Extraction and unit transporta-tion costs vary widely among producing areas. The actual geographic market area of each coal-producing region is delineated empirically by inter- and intraregional shipments from coal-producing areas to States where consumer power-plants are located. Figures 11 through 14 show, for each major coal-producing region, the coal volumes and States in which powerplants collectively received at least 5 mst (4.5 Mt) of coal in 2006 and 1998. Graphs are based on data collected by the Federal Energy Regulatory Commission (FERC) and augmented by Platts COALDAT database (Platts, 2007). The transactions data are submitted by powerplant operators and may not include shipments to industrial users, exporters, or resellers.
The powerplant transaction data show that most Northern Appalachian Basin coal produced in 1998 was received at powerplants in Pennsylvania, Ohio, and West Virginia (States located within the producing region). By 2006, Ohio and West Virginia had reduced shipments by 30 mst (27 Mt). Shipments to Indiana, New York, and Maryland were also reduced by at least 1 mst (0.9 Mt) per year. Coal produced in the Northern Appalachian region is typically high sulfur.
Coal produced in the Central Appalachian Basin typi-cally has much lower sulfur content than the coal produced by mines in the Northern Appalachian Basin. Ohio, Georgia, and North Carolina were the leading States receiving coal from the Central Appalachian Basin in 1998 and 2006 (fig. 12). By 2006, however, shipments to these States had declined by about 18 mst (16 Mt) from 1998 levels. Partly offsetting these reductions were increases in shipments to Virginia, Florida, South Carolina, Delaware, and Indiana. Analysis of coal quality data for the 2006 shipments (see section “Coal Quality by Producing Region”) indicates that, with optimal blending, about 45 percent of the coal produced in this region would satisfy Phase II of the 1990 CAAA requirements. In recent years, much of the low-sulfur coal has come from underground mining where progressively thinner beds have been mined and from mountaintop/valley-fill surface mining. Litigation contesting the mountaintop/valley-fill operations in the Central Appalachian Basin contends the practice damages water supply, wetlands, and natural drainage systems. Litiga-
tion has slowed down and in some cases stopped issuance of permits for new operations.
The coal produced in the Illinois Basin is typically high in sulfur content. In 1998 most of the coal was used within the region (Illinois, Indiana, and Kentucky) and also in Florida (fig. 13). By 2006, shipments to Florida were reduced by two-thirds and shipments to Illinois were reduced by one-half. Off-setting the reductions were increases for Kentucky, Louisiana, and Tennessee. With implementation of Phase II requirements, Illinois powerplants shifted to Powder River Basin coal, and Florida plants shifted to lower sulfur coals from the Central Appalachian Basin and to imports. The increased shipments to Kentucky, Louisiana, and Tennessee were to newer units with FGD systems and plants retrofitted with FGD systems.
Market areas for the Gulf Coast lignite region and Wil-liston Basin lignite coal are local in nature and are not shown. Because of the low calorific value of lignite, it is not economic to transport it long distances. For these coal-producing regions the expansion of market area occurs with construction of pow-erplants and the opening of new mines nearby.
The market area for Powder River Basin coal is national in scope (fig. 14). From 1998 to 2006 Alabama, Georgia, Iowa, Illinois, Kansas, Kentucky, Michigan, Missouri, Oklahoma, Texas, and Wisconsin together increased coal shipments from the Power River Basin by 129 mst (117 Mt). The expansion of output was driven by the substitution of low-sulfur coal for high-sulfur coal in response to the 1990 CAAA legislation. This is evident by changes in coal purchase patterns of pow-erplants in Illinois, Missouri, and Wisconsin that shifted pur-chases from the Illinois Basin and Northern Appalachian Basin to the Powder River Basin. Powerplants in Iowa, Kansas, and Oklahoma appear to have shifted most of their coal purchases to the Power River Basin from locally mined high-sulfur coals of the Western Interior coal fields (see fig. 2).
Figure 15 shows changes in the market area for the mines in the Colorado Plateau regions. Much of the coal produced in this region remains in the region, and production increases have followed the growth of electricity demand. Some of the low-sulfur bituminous coal produced in this region is shipped outside the region. In 2006 about 18 percent of the coal was shipped to powerplants east of the Mississippi River, while in 1998 only 6 percent was shipped to plants in the East.
The compliance provisions of the 1990 CAAA provided the option for powerplants to substitute low-sulfur coal for high-sulfur coal. As a result, the geographical market areas expanded for the low-sulfur coal produced in the Powder River Basin and in certain areas of the Colorado Plateau. The aggressive pricing policy of the Powder River Basin produc-ers seems to have offset potential costs of “de-rating” and (or) required boiler modifications to their customers. The future patterns of coal shipment depends on mining costs, transporta-tion, and the rate at which electrical-power-generation plants install FGD systems. Even if FGD systems are required for compliance with CAIR, the aggressive pricing of western coal producers and the apparent deterioration of mining productiv-
24 The National Coal Resource Assessment Overview
NAPP 2006 and 1998
MI
SC
KY
IN
NY
MD
WV
OH
PA
LOCA
TION
OF
POW
ERPL
ANT
MILLIONS SHORT TONS RECEIVED
2006
1998
0 5 10 15 20 25 30 35 40 45 50
Figure 11. Volumes of coal produced in the Northern Appalachian Basin and received by powerplants, by State location of powerplant for 2006 and 1998. Data are from Form 423, “Monthly report of cost and quality of fuels for electric plants,” compiled by the Federal Energy Regulatory Commission and augmented by Platts COALDAT database (Platts COALDAT, 2008). For each State shown, annual volume of coal received is at least 1 million short tons.
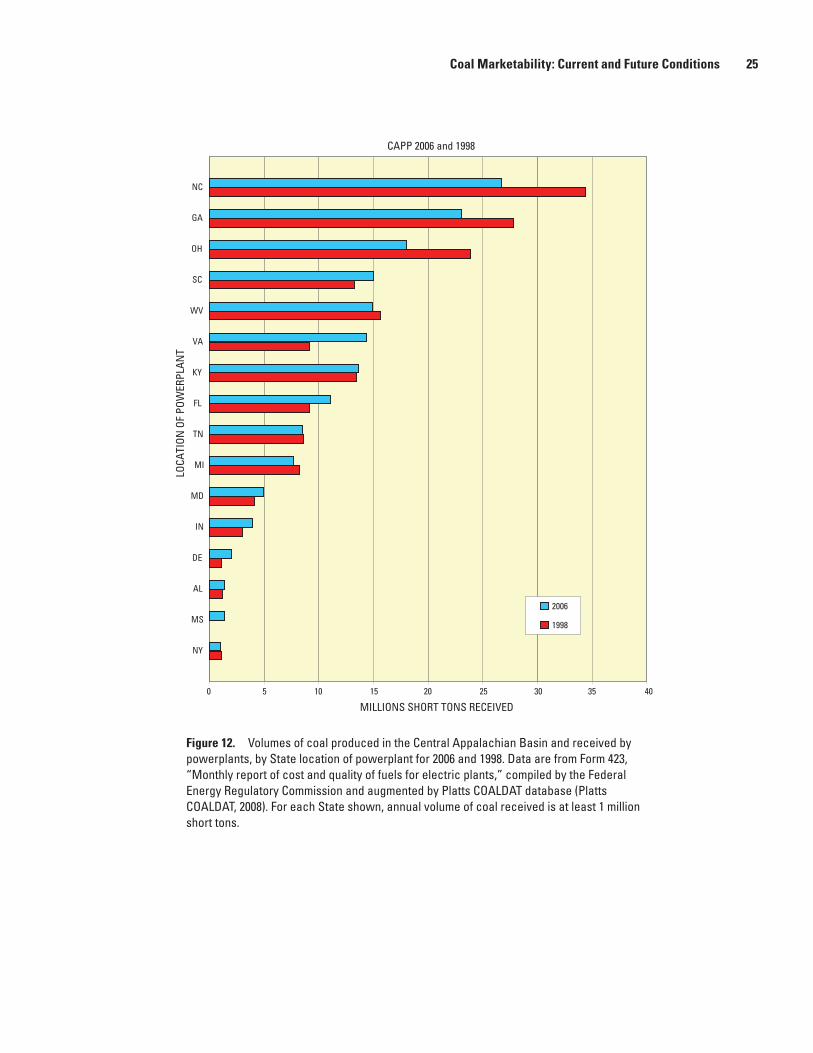
Coal Marketability: Current and Future Conditions 25
CAPP 2006 and 1998
NY
MS
AL
DE
IN
MD
MI
TN
FL
KY
VA
WV
SC
OH
GA
NCLO
CATI
ON O
F PO
WER
PLAN
T
MILLIONS SHORT TONS RECEIVED
2006
1998
0 5 10 15 20 25 30 35 40
Figure 12. Volumes of coal produced in the Central Appalachian Basin and received by powerplants, by State location of powerplant for 2006 and 1998. Data are from Form 423, “Monthly report of cost and quality of fuels for electric plants,” compiled by the Federal Energy Regulatory Commission and augmented by Platts COALDAT database (Platts COALDAT, 2008). For each State shown, annual volume of coal received is at least 1 million short tons.

26 The National Coal Resource Assessment Overview
IB 2006 and 1998
OH
AL
LA
FL
TN
IL
KY
IN
LOCA
TION
OF
POW
ERPL
ANT
MILLIONS SHORT TONS RECEIVED
2006
1998
0 5 10 15 20 25 30 35 40
Figure 13. Volumes of coal produced in the Illinois Basin and received by powerplants, by State location of powerplant for 2006 and 1998. Data are from Form 423, “Monthly report of cost and quality of fuels for electric plants,” compiled by the Federal Energy Regulatory Commission and augmented by Platts COALDAT database (Platts COALDAT, 2008). For each State shown, annual volume of coal received is at least 1 million short tons.
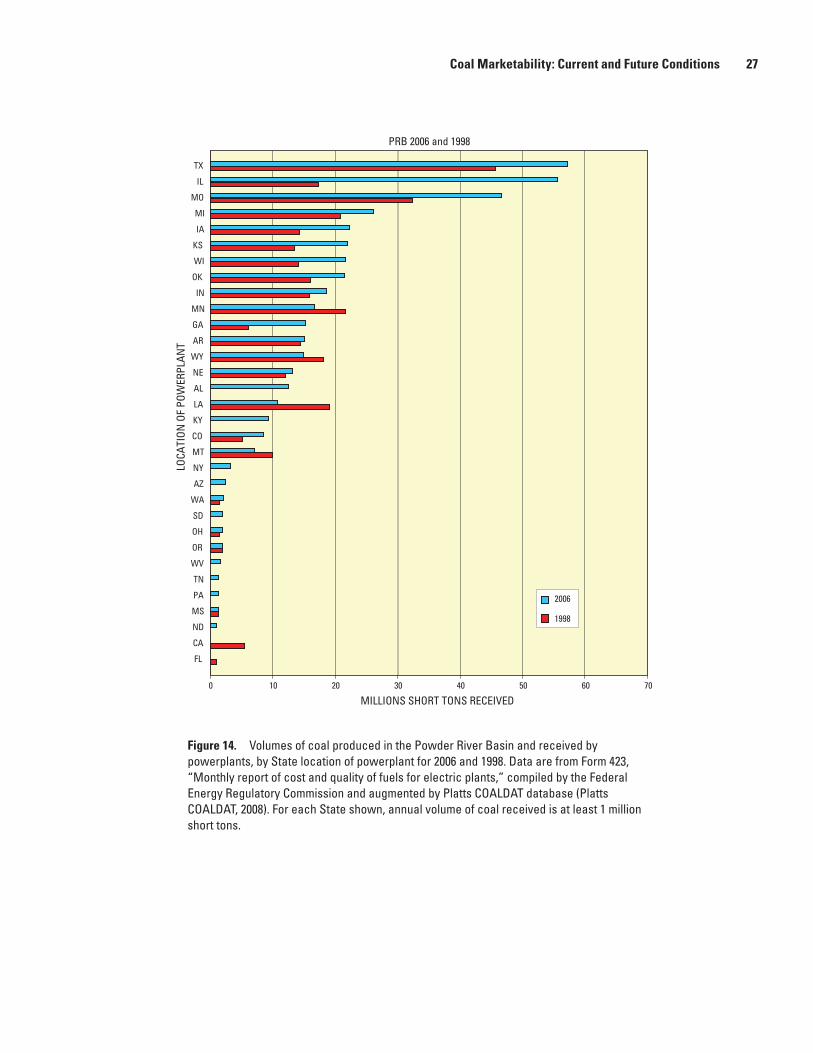
Coal Marketability: Current and Future Conditions 27
PRB 2006 and 1998
FL
CA
ND
MS
PA
TN
WV
OR
OH
SD
WA
AZ
NY
MT
CO
KY
LA
AL
NE
WY
AR
GA
MN
IN
OK
WI
KS
IA
MI
MO
IL
TX
LOCA
TION
OF
POW
ERPL
ANT
MILLIONS SHORT TONS RECEIVED
2006
1998
0 10 20 30 40 50 60 70
Figure 14. Volumes of coal produced in the Powder River Basin and received by powerplants, by State location of powerplant for 2006 and 1998. Data are from Form 423, “Monthly report of cost and quality of fuels for electric plants,” compiled by the Federal Energy Regulatory Commission and augmented by Platts COALDAT database (Platts COALDAT, 2008). For each State shown, annual volume of coal received is at least 1 million short tons.
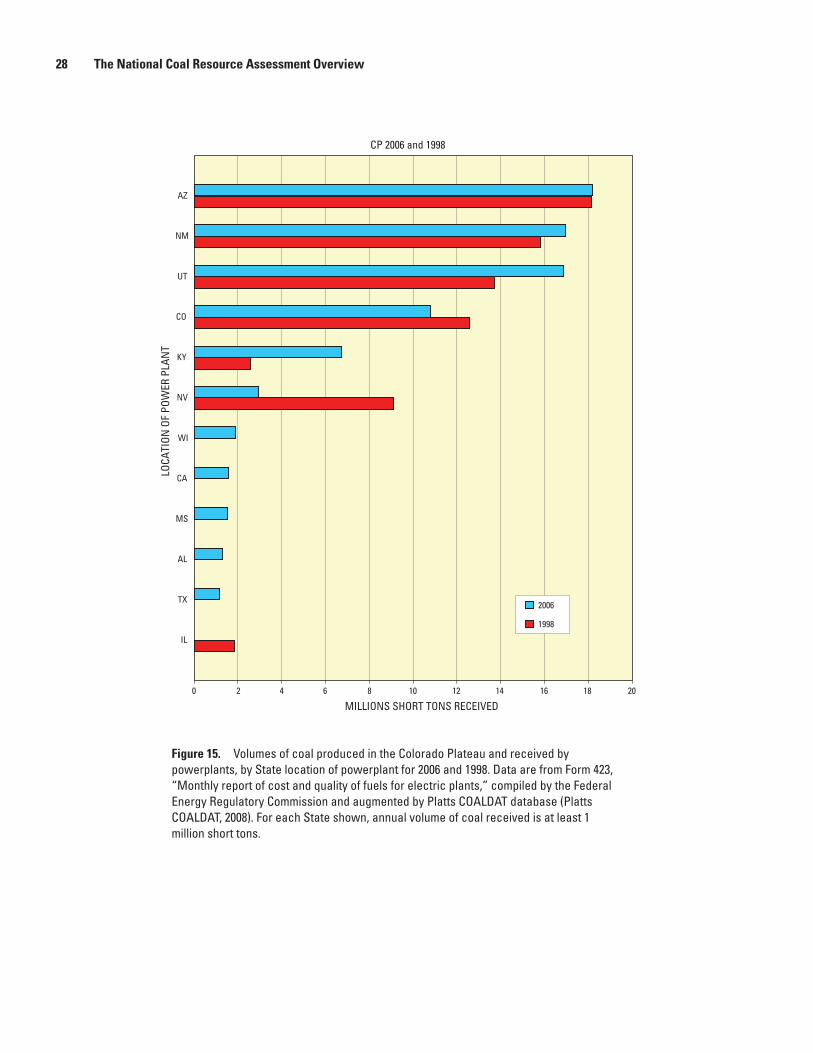
28 The National Coal Resource Assessment Overview
CP 2006 and 1998
IL
TX
AL
MS
CA
WI
NV
KY
CO
UT
NM
AZ
LOCA
TION
OF
POW
ER P
LAN
T
MILLIONS SHORT TONS RECEIVED
2006
1998
0 2 4 6 8 10 12 14 16 18 20
Figure 15. Volumes of coal produced in the Colorado Plateau and received by powerplants, by State location of powerplant for 2006 and 1998. Data are from Form 423, “Monthly report of cost and quality of fuels for electric plants,” compiled by the Federal Energy Regulatory Commission and augmented by Platts COALDAT database (Platts COALDAT, 2008). For each State shown, annual volume of coal received is at least 1 million short tons.

Coal Marketability: Current and Future Conditions 29
ity in mines in the Illinois Basin and the Appalachian Basin solidify market positions outside their producing region.
Rail Transportation
Transportation costs represent an important part of the total delivered price of coal to the powerplant. Coal transport costs depend on the per-mile rate and on the distance from the mine to the powerplant. In 2002, the last year statistics were published, two-thirds of coal was delivered by rail, about 12 percent was waterborne, 13 percent was transported by truck, and the remainder by slurry pipeline, tram, and con-veyers (Energy Information Administration, 2004). For coal originating in the Appalachian Basin in 2001, coal transport costs averaged 14 to 20 percent of delivered coal prices to destinations in the Northeast and Midwest. From western coal-producing areas, coal transport costs averaged about 61 to 71 percent of delivered prices to destinations in the Mid-west and South (Energy Information Administration, 2004). In 2006 three-fourths of the coal produced was shipped by rail at some stage. This coal represented 44 percent of the all tonnage transported by rail and accounted for almost 21 percent of the railroad industry’s gross revenues (Association of American Railroads, 2008).
Four railroads control 90 percent of the rail transporta-tion for coal. The Burlington Northern/Santa Fe and the Union Pacific operate in the Western United States, and CSX and Norfolk Southern operate in the Eastern United States. The dominance of these railroads is the result of a series of consol-idations and mergers as railroads were gradually deregulated, starting with the Staggers Act and continuing to the demise of the Interstate Commerce Commission (ICC) in 1986. Prior to railroad deregulation, the ICC had set rail rates. The Surface Transportation Board has replaced the ICC. Rather than tak-ing a proactive stance in assuring “fair” rail rates, the Surface Transportation Board operates on the basis of complaints by shippers and has apparently made no attempt to mitigate the wave of rail mergers that has resulted in the current industry structure (Fiscor, 1999).
From 1983 to 2001, average per-ton-mile railroad freight rates for coal, in real (constant 2000) dollars, declined by 65 percent (Energy Information Administration, 2004). Cost-sav-ing measures adopted by railroads include unit trains, lighter rail cars, and reduced crews. However, for the local shipper, only a few options assure fair rates. Shippers and coal pur-chasers can develop rail spurs to a competing rail line. Power generators commonly purchase their own rail cars to carry coal. To bypass rails, electricity suppliers may also ship coal to generating plants having favorable “tolling” rates to gener-ate electricity that the contracting supplier can then resell. Competitive pressures on the deregulated coal-fired power-plant electricity producers are expected to perhaps partly offset efforts by railroads to increase rail rates (Fiscor, 1999).
Figure 16 shows that Western U.S. rail rates for new multiyear contracts in constant 2006 dollars for shipments to
competitively served destinations (Heller, 2008). From 1983 through 2004, rates declined by more than three-fourths. The rise in rates from 2004 through 2006 (assuming a 1,000-mile haul and an 8,800 Btu/lb of coal [5,891cal/g]) amounts to an additional $0.43 per MMBtu ($1.88 per billion calories) added to delivered cost (in constant 2006 dollars). The Powder River Basin coals are somewhat unique because of their low sulfur content and their large resource. Competition among railroads and other coal transport modes forestalls the capture by trans-portation providers of the economic rents associated with the unique characteristics of the coal product.
Coal Quality and Marketability
Valuation of Sulfur in Coal
As primary customers of the domestic coal industry, electrical power producers will decide the quality of coal that is produced. Nonutility electricity producers compete for customers, search for the lowest cost fuels, and devise environmental compliance strategies that minimize costs. With implementation of the Phase II of the 1990 CAAA, coal-fired power generators can earn and bank SO2 emissions allowances by reducing emissions below their allotments, that is, below the critical threshold of 0.6 lb sulfur (1.2 lb SO2) per MMBtu (1.1 g sulfur [2.2 g SO2] per MMcal) of fuel burned. The allowances may be sold or purchased at market prices plus a small transactions cost.
The market prices of emission allowances provide a basis for the calculation of extra cost associated with burn-ing noncompliance coal that would avoid the steep penalties assessed by the U.S. Environmental Protection Agency. Fol-lowing Alderman (1999), the cost for burning the coal without scrubbing, when put in terms of the value of the required extra emissions allowances, is:
Cost per ton = [pc/st SO2] × [1 st SO2/2000 lb SO2] × [(xs–1.2) lb SO2/106 Btu] × (h Btu/lb coal) ×[2000 lb coal/1st coal] (1)where
pc is the price of an emission allowance in dollars per short ton SO2 ,
xs is the sulfur dioxide emitted by the coal in pounds per MMBtu, and
h is the coal’s calorific value in Btu’s per pound of coal.
For example, suppose the market price for an allowance to emit 1 short ton of SO2 is $500 ($554/t). Suppose the coal is 1.5 percent sulfur by weight and has a calorific content of 10,000 Btu/ lb (5,558 cal/g). It will generate 3 pounds of SO2 per MMBtu (5.4 g SO2/MMcal); then the penalty can be calcu-lated as ($500/st SO2)×((1 st SO2)/ (2000 lb SO2)] × [(3.0–1.2) lb SO2)/(106 Btu)] × [(20×106 Btu)/st coal which is equal to $9.00/st coal.
Assuming an allowance price of $500, in a competitive market, the price of this coal would be penalized by $9.00 per
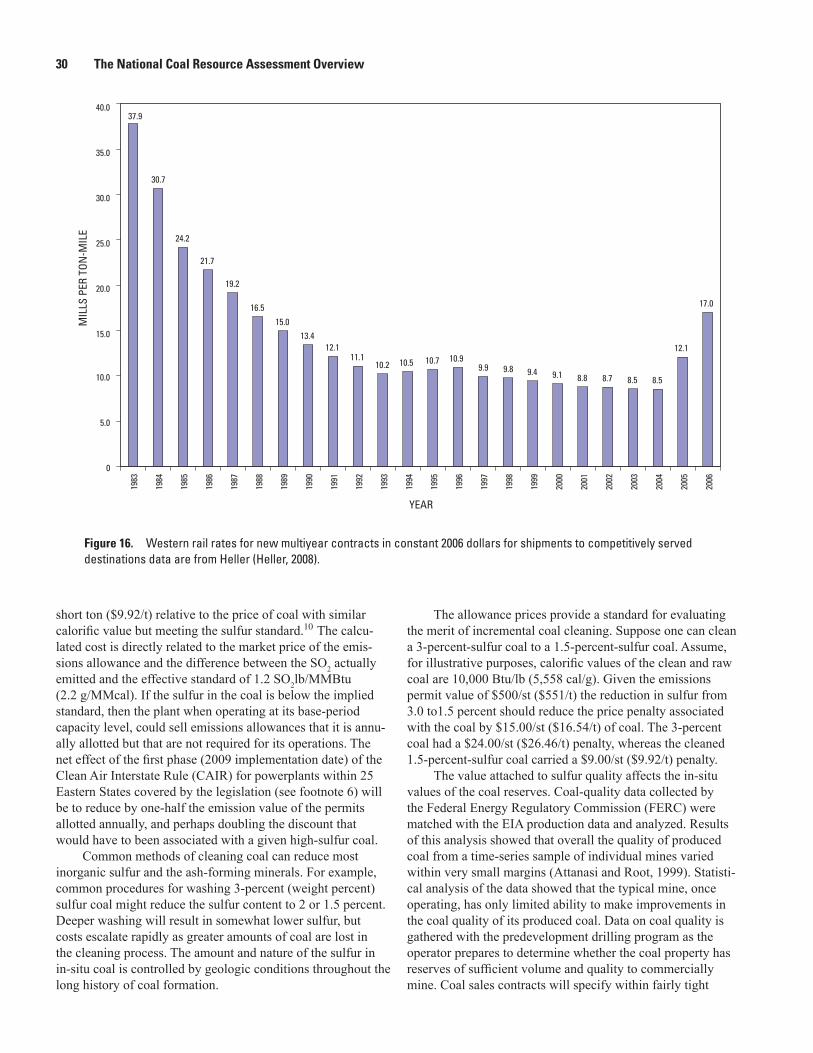
30 The National Coal Resource Assessment Overview
0
5.0
10.0
15.0
20.0
25.0
30.0
35.0
40.0
1983
1984
1985
1986
1987
1988
1989
1990
1991
1992
1993
1994
1995
1996
1997
1998
1999
2000
2001
2002
2003
2004
2005
2006
YEAR
MIL
LS P
ER T
ON-M
ILE
30.7
24.2
21.7
19.2
16.5
15.013.4
12.111.1
10.2 10.5 10.7 10.99.9 9.8 9.4 9.1 8.8 8.7 8.5 8.5
12.1
17.0
37.9
Figure 16. Western rail rates for new multiyear contracts in constant 2006 dollars for shipments to competitively served destinations data are from Heller (Heller, 2008).
short ton ($9.92/t) relative to the price of coal with similar calorific value but meeting the sulfur standard.10 The calcu-lated cost is directly related to the market price of the emis-sions allowance and the difference between the SO2 actually emitted and the effective standard of 1.2 SO2lb/MMBtu (2.2 g/MMcal). If the sulfur in the coal is below the implied standard, then the plant when operating at its base-period capacity level, could sell emissions allowances that it is annu-ally allotted but that are not required for its operations. The net effect of the first phase (2009 implementation date) of the Clean Air Interstate Rule (CAIR) for powerplants within 25 Eastern States covered by the legislation (see footnote 6) will be to reduce by one-half the emission value of the permits allotted annually, and perhaps doubling the discount that would have to been associated with a given high-sulfur coal.
Common methods of cleaning coal can reduce most inorganic sulfur and the ash-forming minerals. For example, common procedures for washing 3-percent (weight percent) sulfur coal might reduce the sulfur content to 2 or 1.5 percent. Deeper washing will result in somewhat lower sulfur, but costs escalate rapidly as greater amounts of coal are lost in the cleaning process. The amount and nature of the sulfur in in-situ coal is controlled by geologic conditions throughout the long history of coal formation.
The allowance prices provide a standard for evaluating the merit of incremental coal cleaning. Suppose one can clean a 3-percent-sulfur coal to a 1.5-percent-sulfur coal. Assume, for illustrative purposes, calorific values of the clean and raw coal are 10,000 Btu/lb (5,558 cal/g). Given the emissions permit value of $500/st ($551/t) the reduction in sulfur from 3.0 to1.5 percent should reduce the price penalty associated with the coal by $15.00/st ($16.54/t) of coal. The 3-percent coal had a $24.00/st ($26.46/t) penalty, whereas the cleaned 1.5-percent-sulfur coal carried a $9.00/st ($9.92/t) penalty.
The value attached to sulfur quality affects the in-situ values of the coal reserves. Coal-quality data collected by the Federal Energy Regulatory Commission (FERC) were matched with the EIA production data and analyzed. Results of this analysis showed that overall the quality of produced coal from a time-series sample of individual mines varied within very small margins (Attanasi and Root, 1999). Statisti-cal analysis of the data showed that the typical mine, once operating, has only limited ability to make improvements in the coal quality of its produced coal. Data on coal quality is gathered with the predevelopment drilling program as the operator prepares to determine whether the coal property has reserves of sufficient volume and quality to commercially mine. Coal sales contracts will specify within fairly tight

Coal Marketability: Current and Future Conditions 31
tolerances the quality—that is, sulfur content, calorific value, and ash content—of the coal to be supplied. The allowance market provides a means to associate an economic value with sulfur content.
Coal Quality by Producing Region
At the level of the coal field, publicly available (in-situ) coal-quality data are not sufficient to reliably characterize coal-resource quality outside of mining areas. Consequently, coal-quality data have not generally been related to coal volumes over large areas by a statistically valid procedure. In areas having coal production, data on the quality of produced coal give a rough idea of the expected quality of remaining coal resources.
Powerplants monitor quality of coal received to deter-mine whether delivered coal meets contract specifications. The Federal Energy Regulatory Commission collects data on the quality of produced coal (FERC Form 423) from shipments received at all utility powerplants having at least 25 megawatts of generating capacity. Those data, along with additional data on the quality of coal received at nonutility powerplants, are collected and made available on a subscription basis by Platts in the COALDAT database. The data include tonnage, calorific value (Btu/lb), weight percent sulfur and ash, and price. They also include the county of origin of the shipment and com-monly the coal mine name and (or) operator name. The quality of various produced coals is described by showing sulfur grade (in pounds per MMBtu) relative to cumulative tonnage produced.
The U.S. Geological Survey’s five coal-resource assess-ment regions in the current national coal-resource assessment program are the Northern and Central Appalachian Basins, the Illinois Basin, the Gulf Coast lignite region, the Northern Rocky Mountains and Great Plains region, and the Colorado Plateau region (see fig. 1). For purposes of this discussion, the focus of the Northern Rocky Mountains and Great Plains region is on its two major producing areas, the Powder River Basin and the Williston Basin (see fig. 17).
Sulfur-grade tonnage characteristics in each region and the two principal coal basins in the Northern Rocky Mountains and Great Plains are shown in the following figures: 18A, Northern Appalachian Basin; 18B, Central Appalachian Basin; 18C, Illinois Basin; 18D, Gulf Coast lignite region; 18E, Williston Basin; 18F, Powder River Basin; and 18G, Colorado Plateau region. Table 6 also shows properties of the sulfur, calorific content, and ash of the produced coal for these regions. Additional graphs of sulfur grade cumulative tonnage functions for beds and coal fields are presented in Appendix B.
EIA no longer provides bed data, so bed sulfur-grade tonnage graphs in Appendix B use data as of 1997.
Figures 18A and 18C show that only small amounts of the coal shipped to powerplants from the Northern Appalachian Basin and the Illinois Basin met the standard of 0.6 lb/MMBtu (1.1 g/MMcal). Most of the coal shipped to powerplants from the Northern Appalachian and the Illinois Basins is already washed, so universal washing will not change the curves noticeably, particularly at the lower sulfur ends. Like the Northern Appalachian Basin and the Illinois Basin, there is virtually no coal currently being utilized from the lignite areas of Texas and Louisiana (Gulf Coast lignite region) (fig. 18D) and North Dakota (Williston Basin) (fig. 18F) that meet the Phase-II standard. Because of the low calorific value of lignite, powerplants are located close to the mine, and most already have scrubbers that will allow compliance with Phase-II standards. Twenty-four percent of the coal shipped to powerplants in 2006 from the Central Appalachian Basin (fig. 18B) and 90 percent of the coal from the Powder River Basin (fig. 18E) met the Phase-II requirement.
Blending very low sulfur coal with higher sulfur coal of the same rank can maximize the total amount of coal that complies with the implied Phase-II standard. Based on the 2006 data, if coal produced within the Central Appalachian Basin were blended optimally to maximize the total tonnage that meets the Phase-II standard, 45 percent would have been compliant. Similarly, with blending, all coal produced in the Powder River Basin in 2006 could meet the Phase-II stan-dard. Figure 18G shows that 66 percent of the coal shipped to powerplants in 2006 from the Colorado Plateau region met the standard. With blending, all of that area’s coal could have met the standard. At the national level for 2006, 56 percent of the coal delivered to electrical utilities met the Phase-II sulfur standard, whereas only 32 percent coal produced in 1985 met this criterion.
For the Central Appalachian Basin, the sustainability of production of low-sulfur coals at competitive price levels is quite uncertain (Platt, 1992; Price, 1992). The principal beds/zones of low-sulfur coals in the Central Appalachian Basin are the Hazard-Coalburg, Fireclay, Pond Creek, and Pocahon-tas (Energy Information Administration, 2007a). All but the Hazard-Coalburg were studied in the U.S. Geological Survey’s Central Appalachian coal assessment (U.S. Geological Survey Northern and Central Appalachian Basin Assessment Team, 2001). Sulfur-grade-produced coal tonnage distributions of selected beds of the Northern Appalachian and Central Appa-lachian Basins are presented in Appendix B.
Future Coal Markets
Additional SO2 and NOx emissions abatement rules will be implemented in 2009, and mercury regulations are sched-uled to shortly follow. It is useful to review the response of the electrical-power-generation industry as Phase II of the
10Ideally, the price received by the mine for the high-sulfur coal will be discounted or penalized relative to the price of the low-sulfur coal that meets the standard. In the absence of a fuel gas desulfurization system, a powerplant will be required to purchase emissions allowances to be able to burn the high-sulfur coal legally.
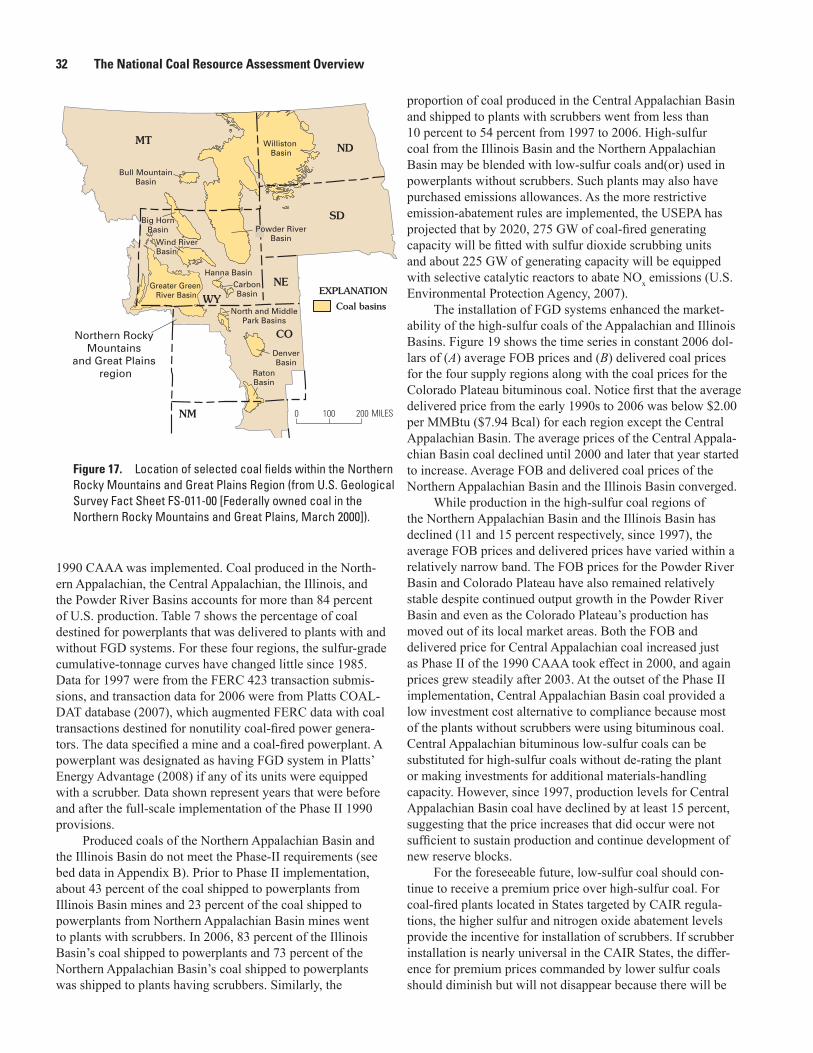
32 The National Coal Resource Assessment Overview
1990 CAAA was implemented. Coal produced in the North-ern Appalachian, the Central Appalachian, the Illinois, and the Powder River Basins accounts for more than 84 percent of U.S. production. Table 7 shows the percentage of coal destined for powerplants that was delivered to plants with and without FGD systems. For these four regions, the sulfur-grade cumulative-tonnage curves have changed little since 1985. Data for 1997 were from the FERC 423 transaction submis-sions, and transaction data for 2006 were from Platts COAL-DAT database (2007), which augmented FERC data with coal transactions destined for nonutility coal-fired power genera-tors. The data specified a mine and a coal-fired powerplant. A powerplant was designated as having FGD system in Platts’ Energy Advantage (2008) if any of its units were equipped with a scrubber. Data shown represent years that were before and after the full-scale implementation of the Phase II 1990 provisions.
Produced coals of the Northern Appalachian Basin and the Illinois Basin do not meet the Phase-II requirements (see bed data in Appendix B). Prior to Phase II implementation, about 43 percent of the coal shipped to powerplants from Illinois Basin mines and 23 percent of the coal shipped to powerplants from Northern Appalachian Basin mines went to plants with scrubbers. In 2006, 83 percent of the Illinois Basin’s coal shipped to powerplants and 73 percent of the Northern Appalachian Basin’s coal shipped to powerplants was shipped to plants having scrubbers. Similarly, the
proportion of coal produced in the Central Appalachian Basin and shipped to plants with scrubbers went from less than 10 percent to 54 percent from 1997 to 2006. High-sulfur coal from the Illinois Basin and the Northern Appalachian Basin may be blended with low-sulfur coals and(or) used in powerplants without scrubbers. Such plants may also have purchased emissions allowances. As the more restrictive emission-abatement rules are implemented, the USEPA has projected that by 2020, 275 GW of coal-fired generating capacity will be fitted with sulfur dioxide scrubbing units and about 225 GW of generating capacity will be equipped with selective catalytic reactors to abate NOx emissions (U.S. Environmental Protection Agency, 2007).
The installation of FGD systems enhanced the market-ability of the high-sulfur coals of the Appalachian and Illinois Basins. Figure 19 shows the time series in constant 2006 dol-lars of (A) average FOB prices and (B) delivered coal prices for the four supply regions along with the coal prices for the Colorado Plateau bituminous coal. Notice first that the average delivered price from the early 1990s to 2006 was below $2.00 per MMBtu ($7.94 Bcal) for each region except the Central Appalachian Basin. The average prices of the Central Appala-chian Basin coal declined until 2000 and later that year started to increase. Average FOB and delivered coal prices of the Northern Appalachian Basin and the Illinois Basin converged.
While production in the high-sulfur coal regions of the Northern Appalachian Basin and the Illinois Basin has declined (11 and 15 percent respectively, since 1997), the average FOB prices and delivered prices have varied within a relatively narrow band. The FOB prices for the Powder River Basin and Colorado Plateau have also remained relatively stable despite continued output growth in the Powder River Basin and even as the Colorado Plateau’s production has moved out of its local market areas. Both the FOB and delivered price for Central Appalachian coal increased just as Phase II of the 1990 CAAA took effect in 2000, and again prices grew steadily after 2003. At the outset of the Phase II implementation, Central Appalachian Basin coal provided a low investment cost alternative to compliance because most of the plants without scrubbers were using bituminous coal. Central Appalachian bituminous low-sulfur coals can be substituted for high-sulfur coals without de-rating the plant or making investments for additional materials-handling capacity. However, since 1997, production levels for Central Appalachian Basin coal have declined by at least 15 percent, suggesting that the price increases that did occur were not sufficient to sustain production and continue development of new reserve blocks.
For the foreseeable future, low-sulfur coal should con-tinue to receive a premium price over high-sulfur coal. For coal-fired plants located in States targeted by CAIR regula-tions, the higher sulfur and nitrogen oxide abatement levels provide the incentive for installation of scrubbers. If scrubber installation is nearly universal in the CAIR States, the differ-ence for premium prices commanded by lower sulfur coals should diminish but will not disappear because there will be
NE
ND
SD
CO
WY
NM
MT
RatonBasin
DenverBasin
North and MiddlePark Basins
CarbonBasin
Hanna Basin
Wind RiverBasin
Big HornBasin
Williston Basin
Bull MountainBasin
Coal basins
0 100 200 MILES
Greater Green River Basin
Northern Rocky Mountains
and Great Plains region
EXPLANATION
Powder RiverBasin
Figure 17. Location of selected coal fields within the Northern Rocky Mountains and Great Plains Region (from U.S. Geological Survey Fact Sheet FS-011-00 [Federally owned coal in the Northern Rocky Mountains and Great Plains, March 2000]).
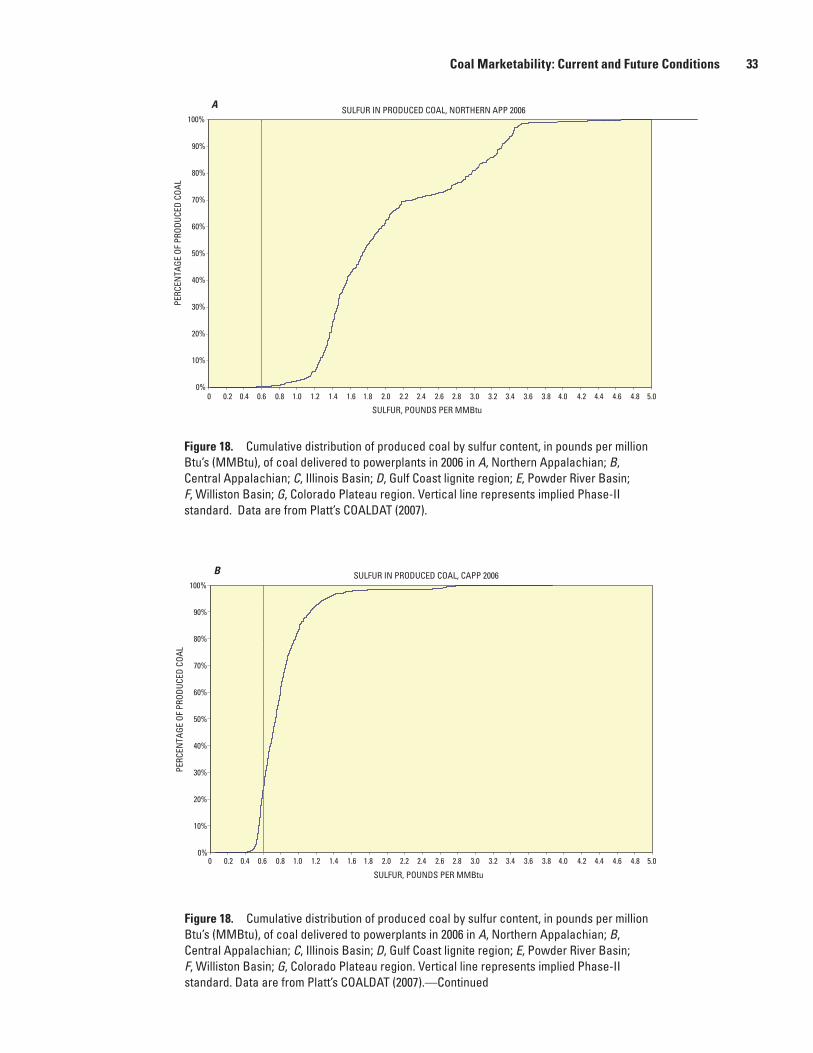
Coal Marketability: Current and Future Conditions 33
SULFUR IN PRODUCED COAL, NORTHERN APP 2006
0%
10%
20%
30%
40%
50%
60%
70%
80%
90%
100%
SULFUR, POUNDS PER MMBtu
PERC
ENTA
GE O
F PR
ODUC
ED C
OAL
0 0.2 0.4 0.6 0.8 1.0 1.2 1.4 1.6 1.8 2.0 2.2 2.4 2.6 2.8 3.0 3.2 3.4 3.6 3.8 4.0 4.2 4.4 4.6 4.8 5.0
A
Figure 18. Cumulative distribution of produced coal by sulfur content, in pounds per million Btu’s (MMBtu), of coal delivered to powerplants in 2006 in A, Northern Appalachian; B, Central Appalachian; C, Illinois Basin; D, Gulf Coast lignite region; E, Powder River Basin; F, Williston Basin; G, Colorado Plateau region. Vertical line represents implied Phase-II standard. Data are from Platt’s COALDAT (2007).
SULFUR IN PRODUCED COAL, CAPP 2006
0%
10%
20%
30%
40%
50%
60%
70%
80%
90%
100%
SULFUR, POUNDS PER MMBtu
PERC
ENTA
GE O
F PR
ODUC
ED C
OAL
0 0.2 0.4 0.6 0.8 1.0 1.2 1.4 1.6 1.8 2.0 2.2 2.4 2.6 2.8 3.0 3.2 3.4 3.6 3.8 4.0 4.2 4.4 4.6 4.8 5.0
B
Figure 18. Cumulative distribution of produced coal by sulfur content, in pounds per million Btu’s (MMBtu), of coal delivered to powerplants in 2006 in A, Northern Appalachian; B, Central Appalachian; C, Illinois Basin; D, Gulf Coast lignite region; E, Powder River Basin; F, Williston Basin; G, Colorado Plateau region. Vertical line represents implied Phase-II standard. Data are from Platt’s COALDAT (2007).—Continued

34 The National Coal Resource Assessment Overview
SULFUR IN PRODUCED COAL, ILLINOIS BASIN 2006
0%
10%
20%
30%
40%
50%
60%
70%
80%
90%
100%
SULFUR, POUNDS PER MMBtu
PERC
ENTA
GE O
F PR
ODUC
ED C
OAL
0 0.2 0.4 0.6 0.8 1.0 1.2 1.4 1.6 1.8 2.0 2.2 2.4 2.6 2.8 3.0 3.2 3.4 3.6 3.8 4.0 4.2 4.4 4.6 4.8 5.0
C
SULFUR IN PRODUCED COAL, GULF COAST LIGNITE 2006
0%
10%
20%
30%
40%
50%
60%
70%
80%
90%
100%
SULFUR, POUNDS PER MMBtu
PERC
ENTA
GE O
F PR
ODUC
ED C
OAL
0 0.2 0.4 0.6 0.8 1.0 1.2 1.4 1.6 1.8 2.0 2.2 2.4 2.6 2.8 3.0 3.2 3.4 3.6 3.8 4.0 4.2 4.4 4.6 4.8 5.0
D
Figure 18. Cumulative distribution of produced coal by sulfur content, in pounds per million Btu’s (MMBtu), of coal delivered to powerplants in 2006 in A, Northern Appalachian; B, Central Appalachian; C, Illinois Basin; D, Gulf Coast lignite region; E, Powder River Basin; F, Williston Basin; G, Colorado Plateau region. Vertical line represents implied Phase-II standard. Data are from Platt’s COALDAT (2007).—Continued
Figure 18. Cumulative distribution of produced coal by sulfur content, in pounds per million Btu’s (MMBtu), of coal delivered to powerplants in 2006 in A, Northern Appalachian; B, Central Appalachian; C, Illinois Basin; D, Gulf Coast lignite region; E, Powder River Basin; F, Williston Basin; G, Colorado Plateau region. Vertical line represents implied Phase-II standard. Data are from Platt’s COALDAT (2007).—Continued

Coal Marketability: Current and Future Conditions 35
SULFUR IN PRODUCED COAL, POWDER RIVER BASIN 2006
0%
10%
20%
30%
40%
50%
60%
70%
80%
90%
100%
SULFUR, POUNDS PER MMBtu
PERC
ENTA
GE O
F PR
ODUC
ED C
OAL
0 0.2 0.4 0.6 0.8 1.0 1.2 1.4 1.6 1.8 2.0 2.2 2.4 2.6 2.8 3.0 3.2 3.4 3.6 3.8 4.0 4.2 4.4 4.6 4.8 5.0
E
Figure 18. Cumulative distribution of produced coal by sulfur content, in pounds per million Btu’s (MMBtu), of coal delivered to powerplants in 2006 in A, Northern Appalachian; B, Central Appalachian; C, Illinois Basin; D, Gulf Coast lignite region; E, Powder River Basin; F, Williston Basin; G, Colorado Plateau region. Vertical line represents implied Phase-II standard. Data are from Platt’s COALDAT (2007).—Continued
SULFUR IN PRODUCED COAL, WILLISTON BASIN LIGNITE 2006
0%
10%
20%
30%
40%
50%
60%
70%
80%
90%
100%
SULFUR, POUNDS PER MMBtu
PERC
ENTA
GE O
F PR
ODUC
ED C
OAL
0 0.2 0.4 0.6 0.8 1.0 1.2 1.4 1.6 1.8 2.0 2.2 2.4 2.6 2.8 3.0 3.2 3.4 3.6 3.8 4.0 4.2 4.4 4.6 4.8 5.0
F
Figure 18. Cumulative distribution of produced coal by sulfur content, in pounds per million Btu’s (MMBtu), of coal delivered to powerplants in 2006 in A, Northern Appalachian; B, Central Appalachian; C, Illinois Basin; D, Gulf Coast lignite region; E, Powder River Basin; F, Williston Basin; G, Colorado Plateau region. Vertical line represents implied Phase-II standard. Data are from Platt’s COALDAT (2007).—Continued

36 The National Coal Resource Assessment Overview
SULFUR IN PRODUCED COAL, COLORADO PLATEAU 2006
0%
10%
20%
30%
40%
50%
60%
70%
80%
90%
100%
SULFUR, POUNDS PER MMBtu
PERC
ENTA
GE O
F PR
ODUC
ED C
OAL
0 0.2 0.4 0.6 0.8 1.0 1.2 1.4 1.6 1.8 2.0 2.2 2.4 2.6 2.8 3.0 3.2 3.4 3.6 3.8 4.0 4.2 4.4 4.6 4.8 5.0
G
Figure 18. Cumulative distribution of produced coal by sulfur content, in pounds per million Btu’s (MMBtu), of coal delivered to powerplants in 2006 in A, Northern Appalachian; B, Central Appalachian; C, Illinois Basin; D, Gulf Coast lignite region; E, Powder River Basin; F, Williston Basin; G, Colorado Plateau region. Vertical line represents implied Phase-II standard. Data are from Platt’s COALDAT (2007).—Continued

Coal Marketability: Current and Future Conditions 37
Table 6. Distribution of quality of produced coal received at powerplants for 2006 by producing region.1
Producing regionPercentile2 of cumulative produced tonnage for 2006
1 5 25 50 75 95 99
A. Northern Appalachian BasinSulfur (lb/MMBtu) 0.83 1.16 1.41 1.74 2.75 3.44 3.73Btu (Btu/lb) 10,250 11,300 12,070 12,560 12,971 13,160 13,303Ash (WT%) 6.66 7.00 8.00 8.86 11.70 19.10 22.70B. Central Appalachian BasinSulfur (lb/MMBtu) 0.48 0.54 0.61 0.74 0.90 1.32 2.64Btu (Btu/lb) 10,994 11,620 12,058 12,345 12,593 12,985 13,285Ash (WT%) 6.60 7.80 9.95 11.58 12.69 14.60 18.32C. Illinois BasinSulfur (lb/MMBtu) 0.46 0.73 1.49 2.51 2.80 3.42 3.80Btu (Btu/lb) 10,050 10,445 10,955 11,320 11,800 12,282 12,498Ash (WT%) 5.90 6.50 8.14 8.80 9.80 12.70 16.00D. Gulf Coast LigniteSulfur (lb/MMBtu) 0.78 0.81 1.13 1.44 1.77 4.49 4.60Btu (Btu/lb) 5,070 5,115 6,041 6,672 6,785 7,162 7,262Ash (WT%) 9.70 11.50 12.80 15.50 20.00 27.80 28.50E. Williston BasinSulfur (lb/MMBtu) 0.78 0.79 1.00 1.06 1.22 1.52 1.62Btu (Btu/lb) 6,189 6,219 6,272 6,578 6,675 6,981 7,156Ash (WT%) 7.10 8.00 8.90 9.60 11.80 12.60 12.90F. Powder River BasinSulfur (lb/MMBtu) 0.22 0.23 0.27 0.35 0.42 0.58 0.91Btu (Btu/lb) 8,023 8,285 8,473 8,720 8,830 8,958 9,491Ash (WT%) 4.10 4.30 4.60 5.10 5.40 6.82 10.10G. Colorado PlateauSulfur (lb/MMBtu) 0.27 0.31 0.41 0.50 0.75 1.03 1.10Btu (Btu/lb) 8,747 8,883 9,715 10,882 11,540 12,259 12,557Ash (WT%) 5.50 6.50 9.30 11.20 18.00 22.40 23.30
1Data from Platts COALDAT database (2007) Monthly Coal Transactions (2007).2For example, at the 25th percentile the interpretation is that at 75% of the volume of the coal produced in
2006 was at least the magnitude of the numerical value shown under sulfur in pounds per MMBTU, Btu content in Btu/lb or ash weight percent.
Conversion factors are lb/MMBtu = 1.799 g/MMCal, Btu/lb = 0.5558 Cal/g.

38 The National Coal Resource Assessment Overview
Table 7. Percentage of shipments to plants by status of emission control equipment. (FGD, Flue gas desulfurization) *
Destination 1997 Destination 2006**
Region of mine FGD No FGD FGD No FGD
(percent) (percent) (percent) (percent)
Northern Appalachian Basin 22 78 73 27Central Appalachian Basin 9 91 54 46Illinois Basin 43 58 83 17Powder River basin 21 80 34 66
*Shipment data for 1997: Form 423, “Monthly report of cost and quality of fuels for electric plants,” compiled by the Federal Energy Regulatory Commission and status of plants FGD systems as of end of 1996 Environmental Protection Agency data base Census of FGD systems data base accessed January 1998.
**Shipment data for 2006 from CoalDat database Monthly Coal Transactions (2007) and FGD sys-tems status Platts Energy Advantage database Annual Plant Statistics (2008).
Conversion factor is 1 million short tons = 0.907 million metric tons.
demand for low-sulfur coal by plants in States not covered by CAIR’s annual sulfur and nitrogen oxide provisions. Prior to the 1990 CAAA, western coals competed on the basis of price.
Emerging Supply Regions
For at least the next decade the marketability of coal will continue to depend acutely on the full costs of extrac-tion, cleaning, transportation, and desulfurization of combus-tion products to meet standards. Because all technologies for desulfurization are costly, low-sulfur coal can be expected to command a premium, and high-sulfur coals a penalty, in the marketplace. For the near-term, additional low-sulfur coal supplies are expected to come from the Powder River Basin of the Northern Rockies and Great Plains region. The cal-culated in-situ coal resources in the Powder River Basin are 570 bst (517 Mt) (all depths and beds at least 2.5 ft [0.76 m] thick). Table 8 shows similar estimates for other western coal fields. Based on results of limited exploration and production data, most of the resources from these western coal fields are expected to meet the Phase-II sulfur dioxide requirements (see Appendix B). Other areas in that region with low-sulfur coals and some past coal mining include the Hanna Basin and the Greater Green River Basin (Flores and Nichols, 1999). Coal fields of the Colorado Plateau region that contain low-sulfur bituminous coal resources with a minimum in situ of 1 bst (0.907 bt) are located in the Northern Piceance Basin (the Yampa coal field, specifically), the Southern Piceance Basin, the Northern Wasatch Plateau, and the Southern Wasatch Pla-teau. All of these areas have had some coal production. Most of the coal of the Kaiparowits Plateau is designated as part of the Grand Staircase–Escalante National Monument where it is generally difficult to obtain permits for surface facilities.
The geologic in-situ coal resource volumes reported by geologists indicate a target for future study. The resource should be conceptually partitioned into broad mining areas. An economic overlay is then applied to estimate the incremen-tal cost function (see Attanasi and Green, 1981). In the U.S. Geological Survey’s assessment of coal zones, however, the thickness measurements of individual beds of the zone were added together to obtain zone thickness without accounting for interburden. As a general rule, the drill-hole data must be rein-terpreted so measurements of coal thickness of specific beds are correlated across the coal field. Where multiple beds occur, then interburden intervals should also be correlated across the area. With such a geologic model of the field’s coal beds, one can begin to allocate the remaining coal into minable blocks (taking into account technical and legal restrictions) to estimate costs of mining, beneficiation, and transportation to the closest rail loadout, and finally to compute a cost function for the region.
Summary and Implications
Given that coal demand is driven by electrical-power generation, this study examined the competitive position of coal compared to alternative base-load fuels in the context of a power-generation sector where about one-half of U.S. electricity is generated by business entities that are no longer regulated as utilities. With the exception of the Central Appa-lachian Basin, FOB and delivered coal prices to powerplants varied within a very limited range during the last 20 years. The price of natural gas for the period from 1995 to 1999 was stable, and the annual average varied around $2.00 per MMBtu. Beginning in 2000, gas prices became more volatile
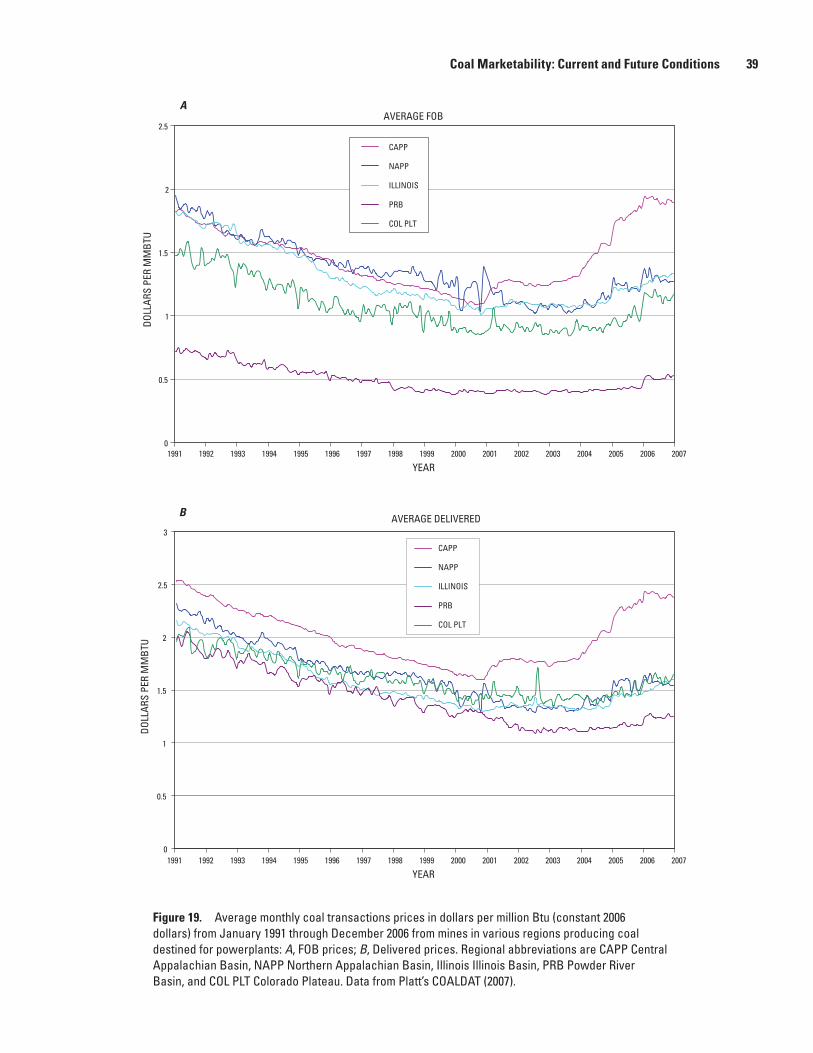
Coal Marketability: Current and Future Conditions 39
Figure 19. Average monthly coal transactions prices in dollars per million Btu (constant 2006 dollars) from January 1991 through December 2006 from mines in various regions producing coal destined for powerplants: A, FOB prices; B, Delivered prices. Regional abbreviations are CAPP Central Appalachian Basin, NAPP Northern Appalachian Basin, Illinois Illinois Basin, PRB Powder River Basin, and COL PLT Colorado Plateau. Data from Platt’s COALDAT (2007).
AVERAGE FOB
0
0.5
1
1.5
2
2.5
YEAR
DOLL
ARS
PER
MM
BTU
CAPP
NAPP
ILLINOIS
PRB
COL PLT
1991 1992 1993 1994 1995 1996 1997 1998 1999 2000 2001 2002 2003 2004 2005 2006 2007
A
AVERAGE DELIVERED
0
0.5
1
1.5
2
2.5
3
DOLL
ARS
PER
MM
BTU
CAPP
NAPP
ILLINOIS
PRB
COL PLT
YEAR1991 1992 1993 1994 1995 1996 1997 1998 1999 2000 2001 2002 2003 2004 2005 2006 2007
B

40 The National Coal Resource Assessment Overview
Table 8. Estimated in-situ coal resources in billions of short tons for Western areas with expected low-sulfur coal.
Basin Billions short
tons
Northern Rocky Mountains and Great PlainsArticle I. Powder River Basin 570.0Article II. Hanna Basin 6.0Article III. Greater Green River Basin (Black Butte/Jim Bridger) 2.7Colorado PlateauNorthern Piceance (Yampa) 75.9Southern Piceance 120.00Kaiparowits Plateau 61.0Northern Wasatch Plateau 1.1Southern Wasatch Plateau 6.8
*Sources: Estimates for Northern Rocky Mountains and Great Plains are from Flores and Nichols (1999) and estimates for the Colorado Plateau are from Kirschbaum (2000).
Conversion factor is one billion short tons = 0.907 billion metric tons.
and progressively increased. For natural-gas-fired generat-ing facilities, the average constant dollar cost for generating electricity from 2000 to 2006 was triple the average cost from the beginning of 1995 through 1999. Average fuel costs per kilowatt hour generated for coal-fired plants for the period from 2000 through 2006 were less than 35 percent of the per kilowatt hour fuel cost incurred by gas-fired plants during the same period (fig. 5). The competitive position of coal-fired power-generation plants was most affected by the air-borne emission-abatement requirements of the 1990 Clean Air Act Amendments. From 1990 to 2005, nationwide coal-fired powerplant emissions of sulfur dioxide and nitrogen oxides declined by 33 and 56 percent, respectively. For the emission reductions obtained, the cap and trading system for emission allowances instituted by the 1990 Clean Air Act resulted in an estimated savings of $1.6 billion per year to the consumer and society compared to the cost that would have been incurred if a single abatement option was mandated.
The cap and trading allowance feature and flexible com-pliance options of the 1990 CAAA appears to have established a link between natural gas prices and the market prices for SO2 allowances. Figure 20 shows the nominal series of average monthly natural gas prices with the monthly average trading price of the SO2 allowances as reported by Cantor-Fitzgerald (Cantor CO2e, 2008). During the period from January 2000 through the end of 2007 (latest data) there is a statistically significant positive correlation between monthly natural gas prices and the average transaction price of SO2 allowances 2 months later. The correlation between the two from January 2000 through the end of 2007 (with SO2 allowances prices lagged 2 months) was 0.81, which is statistically significant at the 1-percent level. The combination of powerplant deregula-tion and anticipation of Phase II of the 1990 CAAA led to a large construction program for gas plants for base-load power generation prior to 2000. However, the explosion in gas prices
and shortfalls in gas in the face of weather events appear to have induced nonutility power generators, who are at risk of losing sales and market share, to retrench to coal. Even regu-lated utilities are often not permitted immediate price adjust-ment to compensate for rising fuel prices. The SO2 allowances permitted coal-fired plants not having FGD systems to operate when alternative gas-fired generation was too costly.
As of the end of 2007, most of the high-sulfur coal produced in the Northern Appalachian Basin and Illinois Basin was shipped to plants with FGD systems. This pattern would suggest a relatively smooth transition to stricter emis-sions requirements under the Clean Air Interstate Rule, which targets coal-fired power-generation plants that are set to take effect in 2009, 2010, and 2018. The U.S. Environmental Pro-tection Agency projects that most coal-fired generating units will have FGD systems by 2020.
Although coal-fired power-generation plants emit more than twice the carbon dioxide as gas-fired powerplants, con-version to gas is not viewed as a viable alternative to coal-fired plants for the United States. The discussion on U.S. carbon abatement in coal-fired plants concentrated on the incremental costs associated with new plants and the uncertainties sur-rounding sequestration technology applied at the scale that will be required. Estimates indicate that the cost of generation will increase a minimum of 70 percent over costs of genera-tion without carbon capture and sequestration. Volatile gas markets, safety concerns about nuclear power, and the issue of disposal of spent fuel suggest that even with sequestration costs added, coal will still be competitive with other base-load fuels. However, the development of an effective abatement program for carbon emissions from coal-fired powerplants will require sufficient lead times for development of technology and protocols to select and monitor sequestration sites, along with improvements in carbon dioxide capture from flue gases,

Coal Marketability: Current and Future Conditions 41
SO2-GAS Chart f20
SO2 A
LLOW
ANCE
GAS
PRI
CE
$0
$200
$400
$600
$800
$1,000
$1,200
$1,400
$1,600
$1,800
SO2 Allowances, nominal dollars
Gas, nominal dollars
$0
$2
$4
$6
$8
$10
$12
JAN-95 JAN-96 JAN-97 JAN-98 JAN-99 JAN-00 JAN-01 JAN-02 JAN-03 JAN-04 JAN-05 JAN-06 JAN-07
Figure 20. Average transactions prices of SO2 allowances plotted with average natural gas prices in dollars per million Btu. The natural gas prices are well head price per thousand cubic feet from January 1995 through December 2007 from EIA Web site accessed March 2008, http://tonto.eia.doe.gov/dnav/ng/ng_pri_sum_dcu_nus_m.htm and the SO2 allowance prices are from Cantor Fitzgerald (CantorCO2e, accessed February 12, 2008). Available online at http://www.emissionstrading.com/myCantorCO2e/?page=myCantorCO2e-BulletinsHistoric.
and for development of transportation infrastructure to move carbon dioxide to sequestration sites.
The cost of coal supply depends on the cost of the factors of production; that is, in-situ coal, labor, equipment includ-ing cost of capital, scale of operations, technology, and coal transport cost. A competitive coal-mining industry responds efficiently and in a timely manner to changes in market conditions, such as those resulting from changes in regulatory status and tighter environmental regulations. The increasing level of production concentrated in fewer mines and min-ing firms may be the result of the pursuit of scale economies that lead to lower cost. However, the opportunities to exploit market power are greater when there are fewer independent producers. With few competitors the exploitation of market power can occur particularly in regions where operators can deter entry of new competitors through economics of scale or “reserve position.” Coal-supply transaction prices through 2007 had not followed the rapidly escalating prices of oil and natural gas. Producing areas outside of the Western United States have experienced a reversal in productivity growth. Production in these regions also declined. It is not clear if
modernization investment and new mine investment have faltered or whether the remaining coal can only be mined at higher costs. Competitive conditions in the coal transporta-tion segment of the industry require some ongoing scrutiny because only four railroads account for 90 percent of the coal railroad transportation.
Most projections relating to coal production are demand driven because volumes of the in-situ resource are so large, it is assumed that the resource can be produced as needed. This, of course is not true because supply costs increase and difficulties typically appear well before the energy resource approaches physical exhaustion. The occurrence of vast quan-tities of an energy resource in nature is not sufficient to assure that it can be commercially extracted at rates that can meet the demands of modern industrial economies. It would seem prudent to improve our understanding of the economic dimen-sions of the U.S. coal resource base as the Nation is projected to rely on it as the primary fuel for electricity generation and as the Nation commits itself to a research program to develop technologies to abate carbon emissions in coal-fired electricity generation.

42 The National Coal Resource Assessment Overview
References Cited
Alderman, J.K.,1999, Y2K, SO2, and coal washing—Danger and opportunity: Coal Age, May, p. 38–39.
Arbuckle, J.G., Brown, M.A., Bryson, N.S., Frick, G.W., Hall, M., Jr., Miller, J.G., Miller, M.L., Sullivan, T.F.P., Vanderver, T.A., Jr., and Wegman, L.N., 1985, Environmen-tal law handbook (8th ed.): Rockville, Maryland, Govern-ment Institutes, 586 p.
Association of American Railroads, 2008, Class I railroad sta-tistics and North American freight statistics, 7 p., accessed March 2008 at http://www.aar.org/PubCommon/Documents/AboutTheIndustry/Statistics.pdf
Attanasi, E.D., 1984, Government investment in mineral resource information on leasable public lands—The case of strippable coal: Resources and Energy, v. 6, no. 1, p. 41–59.
Attanasi, E.D., and Green, E.K., 1981, Economics and coal resource appraisal—Strippable coal in the Illinois Basin: Southern Economic Journal, v. 47, no. 3, p. 742–752.
Attanasi, E.D., and Root, D.H., 1999, Coal-fired power gen-eration, new air quality regulations, and future U.S. coal production: Environmental Geosciences, v. 6, no. 3, p. 139–145.
Averch, Harvey, and Johnson, L.L., 1962, Behavior of the firm under regulatory constraint: American Economic Review, December, p. 1052–1069.
Bonskowski, R.F., Feme, F., and Watson, W.D., 2007, Coal production in the U.S., in Capehart, B.L., Encyclopedia of energy engineering and technology: Boca Raton, Fla., CRC Press, 1600 p.
Boyd, G.A., 1987, Factor intensity and site geology as determinants of returns to scale in coal mining: Review of Economics and Statistics, v. 69, p. 18–23.
Burtraw, Dallas, 2007, Written testimony of Dallas Burtraw, Climate change—Lessons learned from existing cap and trade programs, March 29, 2007: Prepared for the U.S. House of Representatives Committee on Energy and Com-merce, Subcommittee on Energy and Air Quality, 17 p., accessed February 2008, http://www.rff.org/rff/Documents/RFF-CTst_07-Burtraw.pdf
Cantor CO2e, 2008, Historical monthly bulletins: New York, Cantor Fitzgerald, available online at http://www.emissionstrading.com/myCantorCO2e/? page=myCantorCO2e-BulletinsHistoric (accessed February 12, 2008).
Charles River Associates, 1977, Coal price formation: Electric Power Research Institute Report EA–497, 193 p.
Convery, Frank, Ellerman, D., and DePerthuis, C., 2008, The European carbon market in action—Lessons from the first trained period: Interim Report, March 2008, MIT Cen-ter for Energy and Environmental Policy Research, 40 p. accessed May 2008 at http://web.mit.edu/ceepr/www/publi-cations/workingpapers.html
Darmstadter, Joel, 1997, Productivity changes in the U.S. coal mining: Resources for the Future [discussion paper], July, 55 p. Available online at: http://www.rff.org/documents/RFF–DP–97–40.pdf (accessed June 1, 2009).
Ellerman, A. Denny, Joskow, Paul, L., Shmalenesee, Richard, Montero, Juan-Pablo, and Bailey, Elizabeth, 2000, Markets for clean air—The US acid rain program: New York, Cambridge University Press, 363 p.
Energy Information Administration, 1994, Coal industry annual, 1993: Energy Information Administration, DOE/EIA-0584(94), 267 p.
Energy Information Administration, 1996a, The changing structure of the electric power industry—An update: Energy Information Administration, DOE/EIA-0562(96), 182 p.
Energy Information Administration, 1996b, Electric power annual [v. I], 1995: Energy Information Administration, DOE/EIA-0348(97), 59 p.
Energy Information Administration, 1997, The effects of Title IV of the Clean Air Act Amendments of 1990 on electric utilities—An update: Energy Information Administration, DOE/EIA-0582(97), 118 p.
Energy Information Administration, 1998, Challenges of elec-tric power industry restructuring of fuel suppliers: Energy Information Administration, DOE/EIA-0623, 138 p.
Energy Information Administration, 2000, Coal industry annual, 1998: Energy Information Administration, DOE/EIA-0584(98), 308 p.
Energy Information Administration, 2004, Coal transporta-tion—Rates and trends in the United States, 1979–2001 (with supplementary data to 2002): Energy Information Administration, accessed April 2008, http://www.eia.doe.gov/cneaf/coal/page/trans/ratesntrends.html
Energy Information Administration, 2007a, Annual coal report, 2006: Energy Information Administration, DOE/EIA-0584(2006), 67 p.
Energy Information Administration, 2007b, Electric power annual, 2006: Energy Information Administration, DOE/EIA-0348(2006), 95 p.
Energy Information Administration, 2008, Annual Energy Outlook, 2008: Energy Information Administration, DOE/EIA-0383(2008), accessed May 2008. http://www.eia.doe.gov/oaif/aeo/index.html/

Coal Marketability: Current and Future Conditions 43
Fabrizio, K.R., Rose, N.L. and Wolfram, C.D., 2007, Do markets reduce costs? Assessing the impact of regulatory restructuring on U.S. electric generating efficiency: American Economic Review, v. 97, no. 4, 1250–1277.
Fiscor, Steven, 1999, Rail transportation issues: Coal Age, May, p. 23–27.
Fitzgerald, W.F., and Lamborg, C.H., 2005, Geochemistry of mercury in the environment, in Lollar, B.S., ed., Environ-mental geochemistry: Oxford, United Kingdom, Elsevier, v. 9, p. 107–148.
Flores, R.M., and Nichols, D.J., 1999, Executive summary—Tertiary coal resources in the Northern Rocky Mountains and Great Plains region—Clean and compliant fossil fuel beyond 2000, in Fort Union Assessment Team, 1999 resource assessment of selected Tertiary coal beds and zones in the Northern Rocky Mountains and Great Plains region: U.S. Geological Survey Professional Paper 1625–A, 2 CD–ROMs.
Freme, Fred, 2007, US coal supply and demand—2006 Review: Energy Information Administration, accessed Feb-ruary 2008, http://www.eia.doe.gov/cneaf/coal/page/special/feature06.pdf
Heller, Jamie, 2008, New baseload coal generation—Warts and all, presented at Energy Information Administration 2008 Energy Conference—30 Years of energy information and analysis: Washington, D.C., April 8, 2008, accessed at http://www.eia.doe.gov/conf_pdfs/Tuesday/Heller.pdf
Hill and Associates, 1999, Coal demand and price projections: Gas Research Institute, v. 1, 90 p.
Joskow, P.L., 1997, Restructuring, competition, and regulatory reform in the U.S. electricity sector: Economic Perspectives, v. 11, p. 119–138.
Keystone Coal Manual Industry Manual, 1977: New York, McGraw Hill.
Keystone Coal Manual Industry Manual, 1981: New York, McGraw Hill.
Keystone Coal Manual Industry Manual, 1986: New York, McGraw Hill.
Keystone Coal Manual Industry Manual, 1992: New York, McGraw Hill.
Kirschbaum, M.A., 2000, Executive summary—Geologic assessment of coal in the Colorado Plateau— Arizona, Colorado, New Mexico, and Utah, in Kirschbaum, M.A., Roberts, L.N.R., and Biewick, L.R.H., eds., Geologic assessment of coal in the Colorado Plateau—Arizona, Colorado, New Mexico, and Utah: U.S. Geological Survey Professional Paper 1625–B, 2 CD–ROMs.
Kolker, Allan, Senoir, C.L., and Quick, J.C., 2006, Mercury in coal and the impact of coal quality on mercury emissions from combustion: Applied Geochemistry, 21, p. 1821–1836.
Massachusetts Institute of Technology Study Group, 2007, Future of coal—Options for a carbon-constrained world: Massachusetts Institute of Technology, 175 p, accessed February 2008, http://web.mit.edu/coal/
Platt, Jeremy, 1992, Eastern low-sulfur coal supply—A national concern, in Platt, J., Price, J., Miller, M., and Suboleski, S., eds., One point two—New perspectives on Central Appalachian low-sulfur coal supplies: Fairfax, Va., Coal Decisions Forum, Tech Books, p. 1–28.
Platts, 2007, COALDAT database: Boulder, Colo. Platts, ver-sion September 2007.
Platts, 2008, Platt’s Energy Advantage database: Houston, McGraw Hill Inc. [on-line subscription database]
Price, J.P., 1992, Central Appalachian low-sulfur coal avail-ability—Uncertainties and implications, in Platt J., Price J., Miller, M., and Suboleski, S., eds., One point two—New perspectives on Central Appalachian low-sulfur coal sup-plies: Fairfax, Va., Coal Decisions Forum, Tech Books, p. 29–38.
Resource Data Incorporated, 1999, Coal-fired generation in competitive markets: Boulder, Colo., Resource Data Inc., [2 volumes], 1 CD–ROM.
Scherer, F.M., 1971, Industrial market structure and economic performance: Chicago, Rand McNally, 576 p.
Stoker, T.M., Berndt, E.R., Ellerman, A.D., and Schennach, S.M., 2005, Panel data analysis of U.S. coal productivity: Journal of Econometrics, 127, p. 121–164.
U.S. Environmental Protection Agency, 2007, Acid rain and related programs—2006 Progress Report: U.S. Environ-mental Protection Agency, (November), 60 p., accessed at February 2008. http://www.epa.gov/airmarkets/progress/arp06.html
U.S. Geological Survey Northern and Central Appalachian Basin Coal Regions Assessment, 2001, 2000 Resource Assessment of Selected Coal Beds and Zones in the Northern and Central Appalachian Basin Coal Regions, by Northern and Central Appalachian Basin Coal Regions Assessment Team: U.S. Geological Survey Professional Paper 1625–C. [CD–ROM]. http://pubs.usgs.gov/prof/p1625c/
Weisdack, G.V., and Wolf, W.P., 1995, The future of longwall mining through 2005: Coal Age, February, p. 45–47.
Wright, Patrick, 1999 Environmental air initiatives will affect CCPS and utility costs: Coal Age, April, p. 57–58.
44 The National Coal Resource Assessment Overview
Glossary
Central Powerplants Electrical-power-generating plants whose product is transmitted through a network or grid and ultimately dis-tributed to geographically diverse customers.
Concentration The percentage of an industry’s production, sales, productive capacity, or assets controlled by the 4, 8, or 20 largest ranked enti-ties (firms or producing units).
Demand Function or Demand Schedule For a particular commodity, the demand function is expressed as an analytical formula or as a locus of points where each point shows the maximum quantity of the commodity that will be pur-chased per unit time at a particular price. The position of the function is determined by prices of substitute goods and the purchasers’ income.
Deregulation The term as applied to electrical utilities implies that the price of the electricity sold to the local distribution company is not set by a regulatory authority. Beside the power generation, wholesale sales and retail sales functions may be deregulated while the fees for the distribution of electricity to customers remain regulated.
Economic Efficiency Economic efficiency occurs when the cost of producing an output level is as low as possible. A related concept is technical efficiency, which implies that it is not possible to increase the quantity produced from a fixed set of inputs or factor of produc-tion. Economic efficiency implies technical efficiency, but technical efficiency does not necessarily imply economic efficiency.
Economic Efficiency Reductions in the aver-age unit production cost are a result of increases in the design production level of a plant, mine, or firm.
FOB The term is used when shipping goods to indicate who pays for loading and transporta-tion costs or the points at which goods transfer from shipper to buyer. In coal transactions the seller pays transport to point of shipment plus loading costs and buyer pays for freight, insurance, unloading, and transportation to final destination. FOB stands for free on board.
Flue Gas Desulfurization Systems Chemi-cal process systems applied to remove sulfur dioxide from the exhaust flue gases in power-plants that burn coal or oil to produce steam for turbines that drive electricity generators. Industry Conduct The pricing and competi-tive behavior of firms in an industry. It includes pricing behavior (such as price leadership, price discrimination, and collusion), product behavior (product differentiation, advertising, service innovation), and market differentiation strate-gies.
Industry Performance Term used to describe attainment of several economic goals or norms that indicate whether an industry has attained economic efficiency. Economic goals include (1) production technologies or processes that do not waste scarce resources and industry products that should be responsive qualitatively and quantitatively to consumer demand, (2) producers should be pursuing technologies to reduce cost and increase technical efficiency, and (3) distribution of economic benefits of pro-duction among land, labor, and capital should be equitable.
Industry Structure The number and size distri-bution, in either sales or productive capacity, of firms in the industry. Types of industry structure include the perfect competition, monopoly, monopolistic competition, and oligopoly.
Merchant Powerplants Merchant power-generation plants produce electricity and sell directly to wholesale or retail customers or to transmission and distribution companies.
Price-Cost Margin An index computed as the difference between price and marginal cost divided by the price. This number is taken to be an indicator of market power, where an index of 0 indicates no market power and a higher price-cost margin indicates greater market power.
Public Utility An organization or firm that maintains infrastructure for delivery of power (gas electric, or heat), water and sewer, trans-portation or communications (telephone or telecommunication). To avoid disruptions due
Coal Marketability: Current and Future Conditions 45
to construction and maintenance of redundant infrastructure, the utility is given exclusive rights (monopoly rights) to serve an area. In return, a regulatory body is empowered to set rates for the services provided by the utility. In this report, public utilities are:
Investor Owned Utility A regulated entity operating as an investor-owned or common stock company.
Municipal Utility A regulated entity owned and operated by a city or municipality.
Cooperative Utility A regulated utility owned by its customers.
Rationalization Term typically applied to reduction of an industry’s excess capacity through the closing of plants and (or) depar-ture of firms from the industry.
Spot Price Refers to the quoted price of a commodity based on immediate payment and delivery. Subcritical Conditions Refers to the temper-ature and pressure conditions reached by the steam generated as water circulates though the broiler tubes near the boiler perimeter. Sub-critical steam is 16.5 MPA (about 2,400 psi) and 540°C (1,000°F). Generating efficiencies are 33 to 37 percent (Massachusetts Institute of Technology, 2007),
Supercritical and ultra-supercritical condi-tions Refer to the temperature and pressure conditions reached by the steam generated as water circulates though the boiler tubes near the boiler perimeter. Supercritial steam is 24.3 MPA (about 3,530 psi) and 565°C (1,050°F). Generation efficiency in new supercritical plants is 37–40 percent efficiency. Ultra-supercritical steam is higher temperature and pressure than supercritical criteria given above. Currently, plants operating under ultra-supercritical conditions are at 32 MPa (about 4,640 psi) temperature 600–610°C (1,112–1,130°F). Generating efficiency is greater than 40 to 44 percent. Targets for future ultra-supercritical conditions are 36.5 to
38.5 MPa (about 5,300–5,600 psi) temperatures of 700°–720°C (1,290°–1,330°F) with generat-ing efficiencies of 44 to 46 percent range but will require improvements in materials (Massa-chusetts Institute of Technology, 2007).
Supply Function or Supply Schedule For a particular commodity, the supply function is expressed as an analytical formula or as a locus of points where each point shows the maximum quantity of the commodity that will be supplied per unit time at a particular price. The position of the function is determined by prices of inputs (land, capital, labor, and materials used in production), prices of substitute inputs, technology, and industry structure and conduct.

46 The National Coal Resource Assessment Overview
From a social-accounting standpoint, the suboptimal combination of inputs inflates production costs and regulated retail prices, reducing the quantity of electricity demanded and ultimately produced by the industry. Industry prices would be higher and output lower than would be economically efficient. In the economic literature, this is known as the Averch-John-son effect (Averch and Johnson, 1962). It has been suggested that the bias toward very capital intensive projects explains the adoption by many utilities of the highly capital intensive nuclear option for power generation in the 1970s (Scherer, 1971).
The regulatory scheme applied to electrical-power utili-ties during the 1970s and early 1980s shifted excess costs, their associated risks, and escalating fuel prices to electricity consumers rather than the utility. When capital equipment is placed in service, it is added to the utility’s rate base. The prices the utility is allowed to charge include recovery of its capital through depreciation and all operating costs plus a fair rate of return on invested capital. During the oil and gas shortages of the 1970s, utilities commonly sought guaranteed fuel supplies by signing contracts at above-market prices and passing the extraordinary fuel costs directly on to customers as fuel adjustment charges. Faced with skyrocketing energy costs, consumers rebelled and some local regulatory commis-sions resisted or modified requested rate hikes.
Seeds of deregulation of the electrical-power industry began in the late 1970s. The decoupling of the generation and transmission functions was accelerated by the expansion of the wholesale electricity trade that resulted from widely differing fuel prices. Specifically, utilities were selling their custom-ers electricity generated by another utility or an independent power generator.
The Public Utility Regulatory Policy Act of 1978 (PURPA) (Energy Information Administration, 1998) required utilities to purchase electricity from cogenerators and produc-ers of electricity from renewable sources. This stimulated long-term contracts between vertically integrated utilities and independent power generators. The law guaranteed a market for “qualifying facilities,” with prices set according to the
Appendix A—Electrical Utility Deregulation: Nature and Motivation
Retail electricity customers traditionally have been supplied by electrical utilities that are either investor owned, publicly owned, or cooperatives vested by the Government with exclusive rights to sell electricity in a geographic area. Investor-owned utilities account for about three-fourths of the electricity sales and revenue (Energy Information Administra-tion, 1996b). In return for monopoly rights, the utility is obli-gated to plan and reliably supply electricity to retail customers. The utility commonly assumes supply functions of generation, transmission, distribution, and retailing. Generation involves the production of electricity. The transmission function deliv-ers the generated high-voltage current to a demand node or network for distribution to the final customer. The distribution function converts high-voltage direct current to lower volt-age alternating current and also supplies electricity to the final customers. Retailing or marketing entails providing pricing options, handling billing, and measuring consumer use.
Electricity demand varies continuously, and electricity cannot be stored. The generation and transmission functions must be continuously balanced to keep the transmission and distribution systems stable in terms of frequency and voltage. The technically complex task of coordination of generation and transmission to maintain stable systems at the demand nodes is the reason most public utilities have historically fulfilled both functions jointly (Joskow, 1997). While the joint ownership of generation, transmission, and distribution facili-tates coordination, technically these functions do not require a vertically integrated utility monopoly.
Electricity pricing to retail customers has historically been regulated so that the utility received a fair return on the value of its capital investment (rate base) and recovery of its operating and maintenance costs. Regulatory commissions commonly fail to ensure operating efficiency because of the difficulty of monitoring costs. Economists have theorized (Averch and Johnson, 1962) that when the fair rate of return exceeds the cost of capital to the utility, the profit-maximizing utility would choose highly capital intensive investment proj-ects rather than choose the cost-minimizing combination of inputs of labor, capital, and materials.

Coal Marketability: Current and Future Conditions 47
utility’s avoided costs, that is, equal to the purchasing utility’s incremental costs of expanded production (Joskow, 1997).
The Energy Policy Act of 1992 opened interstate transmission lines to independent power generators (called exempt wholesalers) who did not meet PURPA’s cogenera-tion or renewable resource requirement. Provisions of this act required that utilities give the independent power generators access to transmission systems nationwide for wholesale sales, but it did not require that utilities purchase their electricity (Energy Information Administration, 1996a). State regulators have also required utilities seeking approval of construction for additional capacity to solicit bids from independent power producers to supply the additional capacity. More than half of the additions to U.S. power-generation capacity in recent years have been by independent power producers (Joskow, 1997).
The Federal Energy Regulatory Commission (FERC) issued Orders 888 and 889 in 1996, which promoted open access to the transmission lines and addressed the issue of stranded capital costs (Energy Information Administration, 1998). Stranded costs are costs that have already been incurred by the integrated utility but which cannot be recovered if the consumers are allowed to choose other electricity suppliers. Order 888 stated that recovery of stranded costs from depart-ing retail and wholesale customers should be permitted.
Many State legislatures and regulatory commissions plan to open competition at the retail sales level (Energy Information Administration, 1996a), and some are requiring the divestiture of parts of integrated utilities along functional lines. For the powerplant owners, wholesale and retail compe-tition for electricity has magnified the uncertainty relating to future consumer demand and plant-capacity utilization. This uncertainty has resulted in delays and cancellations of gener-ating-plant investments. Electricity producers should carefully consider the cost effectiveness of investments in new capacity or improved efficiency in old plants as well as compliance strategies to meet environmental regulations.

48 The National Coal Resource Assessment Overview
Appendix B—Quality of Produced Coal by Beds and Coal Fields
This Appendix presents the sulfur grade–produced coal
a reasonable characterization. Data describing the quality of produced coal delivered to electrical powerplants are compiled by the Federal Energy Regulatory Commission (FERC) with Form 423 “Monthly report of cost and quality of fuels for electric plants” for the period 1983 through 1998. These data represent shipments received at all utility power plants having at least 50 megawatts of generating capacity. They include coal
ash. Data also include county of origin of the shipment and, commonly, the coal-mine name and (or) operator name.
The sulfur content of produced coal is described by show-ing sulfur grade (in pounds per MMBtu) versus cumulative percentage tonnage relationships. The position of the curve is determined by the central tendency or location of the distribu-tion of values of sulfur per MMBtu in the coal shipped. The shape of the curve determines how much of the distribution of these values spreads from the central value. If, for example, the location or median of the distribution is close to the Phase-II standard of 0.6 lb/MMBtu (1.1 g/MMcal), the shape of the distribution would indicate whether optimal blending of coals
implied Phase-II standard. The procedure for assembling Form 423 data by bed
required additional information to identify mines that pro-duced exclusively from a single bed. The Energy Information Administration (EIA) collects production data by bed from individual mines (EIA Form 7A). With these data, mines were
The Resource Data Incorporated (RDI) COALDAT database (RDI, 1999) enhances the FERC-Form-423-data by organizing transactions by mine. The Mine Safety and Health Administra-tion (MSHA) of the U.S. Department of Labor has assigned codes to mines that have produced coal for several years. The MSHA codes were then used as the basis for tying FERC data on coal quality to individual coal beds.
Data on the quality of coal delivered to powerplants for
the FERC data. In some cases, a county included two separate
for other areas, the paucity of shipments required several years of data.
Figures B-1 through B-3 show the sulfur grade–produced tonnage distributions for the three assessed beds in Northern
Appalachian Basin: the Pittsburgh, the Upper Freeport, and the Lower Kittanning. Table B-1 provides the fractile values of the empirical distribution (that is, data-determined distribution)
yield in weight percent. According to 1997 production data, at 81.2 mst (73.6 mt) per year, the Pittsburgh had the second largest production of any coal bed in the United States. For 1997, among the beds monitored by EIA (1998a), the Upper Freeport’s production was ranked as 14th (14.7 mst, 13.3 mt), and the production from the Lower Kittanning was ranked as 7th at 23.3 mst (21.1 mt). The Pittsburgh is primarily mined underground, whereas surface mining accounted for 71 percent of 1997 production in the Lower Kittanning. Underground mining accounted for 71 percent of the Upper Freeport. In 1997, these three beds represented about 74 percent of the production from the Northern Appalachian Basin.
0
10
20
30
40
50
60
70
80
90
100 PE
RCEN
TAG
E O
F PR
OD
UCE
D C
OA
L
0 0.2 0.4 0.6 0.8 1.0 1.2 1.4 1.6 1.8 2.0 2.2 2.4 2.6 2.8 3.0 3.2 3.4 3.6 3.8 4.0 4.2 4.4 4.6 4.8 5.0
SULFUR, POUNDS PER MMBtu
Sulfur in Produced Coal, Pittsburgh Coal Bed, 1989-1997
Figure B-1. Cumulative distribution of produced coal by sulfur content, in pounds per million Btu’s (MMBtu), of coal delivered to power- plants in 1989–1997 for the Pittsburgh coal bed in the Northern Appa-lachian Basin. Vertical line is implied Phase-II standard.
0
10
20
30
40
50
60
70
80
90
100
PERC
ENTA
GE
OF
PRO
DU
CED
CO
AL
0 0.2 0.4 0.6 0.8 1.0 1.2 1.4 1.6 1.8 2.0 2.2 2.4 2.6 2.8 3.0 3.2 3.4 3.6 3.8 4.0 4.2 4.4 4.6 4.8 5.0
SULFUR, POUNDS PER MMBtu
Sulfur in Produced Coal, Upper Freeport Coal Bed, 1989-1997
Figure B-2. Cumulative distribution of produced coal by sulfur content, in pounds per million Btu’s (MMBtu), of coal delivered to power- plants in 1989–1997 for the Upper Freeport coal bed in the Northern Appalachian Basin. Vertical line is implied Phase-II standard.
Coal Marketability 35

Coal Marketability: Current and Future Conditions 49
Most coal produced in the Northern Appalachian Basin is cleaned before shipment to the powerplant so that the coal quality shown by the curves is more representative of the coal received at powerplants than the in-situ values of the coal. During the 1989 through 1997 period, 25 percent of the Lower Kittanning coal shipped to powerplants met the Phase-II standard. These values may not be characteristic of the remaining coal. Data show that, even though ash yield of the produced coal from the Lower Kittanning and Upper
Freeport is generally greater than the ash found in the Pitts-burgh bed, their sulfur contents are somewhat less.
Figures B-4 through B-7 show the sulfur grade–produced tonnage distributions for the Fireclay/Chilton, Pond Creek/Eagle, Pocahontas No. 3, and the Hazard-Coalburg beds or zones of the Central Appalachian Basin. Table B-1 shows
and ash. Figures B-4 through B-7 show, for the period 1989 through 1997, 22 percent of the Fireclay/Chilton, 25 percent of the Pond Creek/Eagle, 91 percent of the Pocahontas, and 60 percent of the Hazard-Coalburg coals shipped to powerplants met the Phase-II standard. If optimally blended, 44 percent of the Fireclay/Chilton, 44 percent of the Pond Creek/Eagle, all of the Pocahontas, and 82 percent of the Hazard-Coalburg would have met the Phase-II standard.
In 1997, these beds accounted for about 34 percent of coal shipped from the Central Appalachian Basin to powerplants. The Pond Creek/Eagle, the Fireclay/Chilton, and the Pocahon-tas No. 3 are almost entirely mined by underground methods, whereas surface mining accounted for almost 60 percent of the production of the Hazard-Coalburg in 1997. According to EIA, in 1997 the Hazard-Coalburg was the third most productive bed/zone in the United States. The sulfur content and ash yield of the Pocahontas is much lower than other beds.
Figures B-8 to B-10 show the sulfur grade–produced tonnage distributions for the Herrin (also known as No. 6),
Illinois Basin. Table B-1 shows the fractiles of the empirical
0
10
20
30
40
50
60
70
80
90
100
PERC
ENTA
GE
OF
PRO
DU
CED
CO
AL
0 0.2 0.4 0.6 0.8 1.0 1.2 1.4 1.6 1.8 2.0 2.2 2.4 2.6 2.8 3.0 3.2 3.4 3.6 3.8 4.0 4.2 4.4 4.6 4.8 5.0
SULFUR, POUNDS PER MMBtu
Figure B-3. Cumulative distribution of produced coal by sulfur con-tent, in pounds per million Btu’s (MMBtu), of coal delivered to power- plants in 1989–1997 for the Lower Kittanning coal bed in the Northern Appalachian Basin. Vertical line is implied Phase-II standard.
0
10
20
30
40
50
60
70
80
90
100
PERC
ENT
OF
PRO
DU
CED
CO
AL
0 0.2 0.4 0.6 0.8 1.0 1.2 1.4 1.6 1.8 2.0 2.2 2.4 2.6 2.8 3.0
SULFUR, POUNDS PER MMBtu
Sulfur in Produced Coal, Fireclay/Chilton Coal Bed, 1989-1997
Figure B-4. Cumulative distribution of produced coal by sulfur con-tent, in pounds per million Btu’s (MMBtu), of coal delivered to power- plants in 1989–1997 for the Fireclay/Chilton coal bed in the Central Appalachian Basin. Vertical line is implied Phase-II standard.
0
10
20
30
40
50
60
70
80
90
100
PERC
ENT
OF
PRO
DU
CED
CO
AL
0 0.2 0.4 0.6 0.8 1.0 1.2 1.4 1.6 1.8 2.0 2.2 2.4 2.6 2.8 3.0
SULFUR, POUNDS PER MMBtu
Sulfur in Produced Coal, Pond Creek/Eagle Coal Bed, 1989-1997
Figure B-5. Cumulative distribution of produced coal by sulfur con-tent, in pounds per million Btu’s (MMBtu), of coal delivered to power- plants in 1989–1997 for the Pond Creek/Eagle coal bed in the Central Appalachian Basin. Vertical line is implied Phase-II standard.
Sulfur in Produced Coal, Fireclay/Chilton Coal Bed, 1989–1997
SULFUR, POUNDS PER MMBtu
PERC
ENTA
GE
OF
PRO
DU
CED
CO
AL
Sulfur in Produced Coal, Pond Creek/Eagle Coal Bed, 1989–1997
PERC
ENTA
GE
OF
PRO
DU
CED
CO
AL
SULFUR, POUNDS PER MMBtu
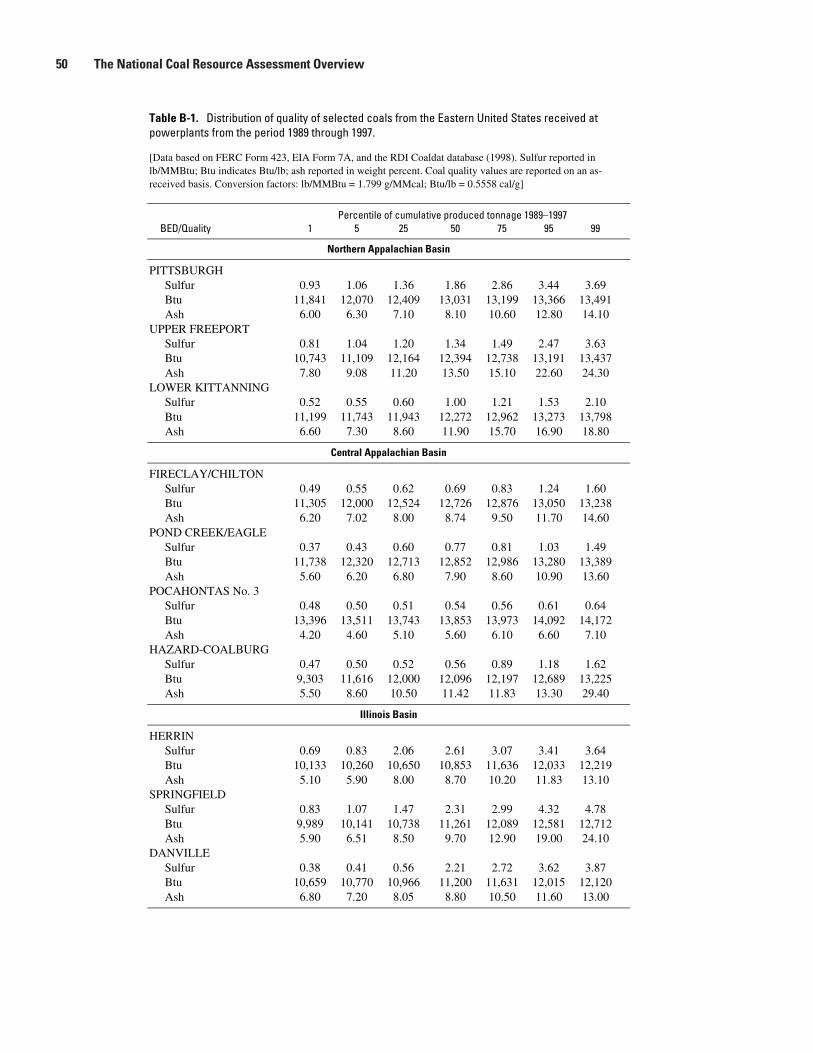
50 The National Coal Resource Assessment Overview
Table B-1. Distribution of quality of selected coals from the Eastern United States received at powerplants from the period 1989 through 1997.
[Data based on FERC Form 423, EIA Form 7A, and the RDI Coaldat database (1998). Sulfur reported in lb/MMBtu; Btu indicates Btu/lb; ash reported in weight percent. Coal quality values are reported on an as-received basis. Conversion factors: lb/MMBtu = 1.799 g/MMcal; Btu/lb = 0.5558 cal/g]
evitalumuc fo elitnecreP produced tonnage 1989–1997 BED/Quality 1 5 25 50 75 95 99
Northern Appalachian Basin
PITTSBURGH Sulfur 0.93 1.06 1.36 1.86 2.86 3.44 3.69 Btu 11,841 12,070 12,409 13,031 13,199 13,366 13,491 Ash 6.00 6.30 7.10 8.10 10.60 12.80 14.10 UPPER FREEPORT Sulfur 0.81 1.04 1.20 1.34 1.49 2.47 3.63 Btu 10,743 11,109 12,164 12,394 12,738 13,191 13,437 Ash 7.80 9.08 11.20 13.50 15.10 22.60 24.30 LOWER KITTANNING Sulfur 0.52 0.55 0.60 1.00 1.21 1.53 2.10 Btu 11,199 11,743 11,943 12,272 12,962 13,273 13,798 Ash 6.60 7.30 8.60 11.90 15.70 16.90 18.80
Central Appalachian Basin
FIRECLAY/CHILTON Sulfur 0.49 0.55 0.62 0.69 0.83 1.24 1.60 Btu 11,305 12,000 12,524 12,726 12,876 13,050 13,238 Ash 6.20 7.02 8.00 8.74 9.50 11.70 14.60 POND CREEK/EAGLE Sulfur 0.37 0.43 0.60 0.77 0.81 1.03 1.49 Btu 11,738 12,320 12,713 12,852 12,986 13,280 13,389 Ash 5.60 6.20 6.80 7.90 8.60 10.90 13.60 POCAHONTAS No. 3 Sulfur 0.48 0.50 0.51 0.54 0.56 0.61 0.64 Btu 13,396 13,511 13,743 13,853 13,973 14,092 14,172 Ash 4.20 4.60 5.10 5.60 6.10 6.60 7.10 HAZARD-COALBURG Sulfur 0.47 0.50 0.52 0.56 0.89 1.18 1.62 Btu 9,303 11,616 12,000 12,096 12,197 12,689 13,225 Ash 5.50 8.60 10.50 11.42 11.83 13.30 29.40
Illinois Basin
HERRIN Sulfur 0.69 0.83 2.06 2.61 3.07 3.41 3.64 Btu 10,133 10,260 10,650 10,853 11,636 12,033 12,219 Ash 5.10 5.90 8.00 8.70 10.20 11.83 13.10 SPRINGFIELD Sulfur 0.83 1.07 1.47 2.31 2.99 4.32 4.78 Btu 9,989 10,141 10,738 11,261 12,089 12,581 12,712 Ash 5.90 6.51 8.50 9.70 12.90 19.00 24.10 DANVILLE Sulfur 0.38 0.41 0.56 2.21 2.72 3.62 3.87 Btu 10,659 10,770 10,966 11,200 11,631 12,015 12,120 Ash 6.80 7.20 8.05 8.80 10.50 11.60 13.00

Coal Marketability: Current and Future Conditions 51
Figure B-6. Cumulative distribution of produced coal by sulfur con-tent, in pounds per million Btu’s (MMBtu), of coal delivered to power- plants in 1989–1997 for the Pocahontas No. 3 coal bed in the Central Appalachian Basin. Vertical line is implied Phase-II standard.
Figure B-7. Cumulative distribution of produced coal by sulfur con-tent, in pounds per million Btu’s (MMBtu), of coal delivered to power- plants in 1989–1997 for the Hazard-Coalburg coal bed in the Central Appalachian Basin. Vertical line is implied Phase-II standard.
Figure B-8. Cumulative distribution of produced coal by sulfur content, in pounds per million Btu’s (MMBtu), of coal delivered to powerplants in 1989–1997 for the Herrin coal bed in the Illinois Basin. Vertical line is implied Phase-II standard.
0
10
20
30
40
50
60
70
80
90
100
PERC
ENTA
GE
OF
PRO
DU
CED
CO
AL
0 0.2 0.4 0.6 0.8 1.0 1.2 1.4 1.6 1.8 2.0 2.2 2.4 2.6 2.8 3.0
SULFUR, POUNDS PER MMBtu
Sulfur in Produced Coal, Pocahontas No. 3Coal Bed, 1989–1997
0
10
20
30
40
50
60
70
80
90
100
PERC
ENTA
GE
OF
PRO
DU
CED
CO
AL
0 0.2 0.4 0.6 0.8 1.0 1.2 1.4 1.6 1.8 2.0 2.2 2.4 2.6 2.8 3.0
SULFUR, POUNDS PER MMBtu
Sulfur in Produced Coal, Hazard-Coalburg Coal Zone, 1989–1997
0
10
20
30
40
50
60
70
80
90
100
PERC
ENTA
GE
OF
PRO
DUC
ED C
OAL
0 0.2 0.4 0.6 0.8 1.0 1.2 1.4 1.6 1.8 2.0 2.2 2.4 2.6 2.8 3.0 3.2 3.4 3.6 3.8 4.0 4.2 4.4 4.6 4.8 5.0 5.2 5.4 5.6
SULFUR, POUNDS PER MMBtu
Sulfur in Produced Coal, Herrin Coal Bed, 1989–1997

52 The National Coal Resource Assessment Overview
Figure B-9. Cumulative distribution of produced coal by sulfur content, in pounds per million
coal bed in the Illinois Basin. Vertical line is implied Phase-II standard. million Btu’s (MMBtu), of coal delivered to powerplants in 1989–1997 for the Springfield
Figure B-10. Cumulative distribution of produced coal by sulfur content, in pounds per million Btu’s (MMBtu), of coal delivered to powerplants in 1989–1997 for the Danville coal bed in the Illinois Basin. Vertical line is implied Phase-II standard.
0
10
20
30
40
50
60
70
80
90
100
PERC
ENTA
GE
OF
PRO
DU
CED
COA
L
0 0.2 0.4 0.6 0.8 1.0 1.2 1.4 1.6 1.8 2.0 2.2 2.4 2.6 2.8 3.0 3.2 3.4 3.6 3.8 4.0 4.2 4.4 4.6 4.8 5.0 5.2 5.4 5.6
SULFUR, POUNDS PER MMBtu
Sulfur in Produced Coal, Springfield Coal Bed, 1989–1997
0
10
20
30
40
50
60
70
80
90
100
PERC
ENTA
GE
OF
PRO
DU
CED
COA
L
0 0.2 0.4 0.6 0.8 1.0 1.2 1.4 1.6 1.8 2.0 2.2 2.4 2.6 2.8 3.0 3.2 3.4 3.6 3.8 4.0 4.2 4.4 4.6 4.8 5.0 5.2 5.4 5.6
SULFUR, POUNDS PER MMBtu
Sulfur in Produced Coal, Danville Coal Bed, 1989–1997
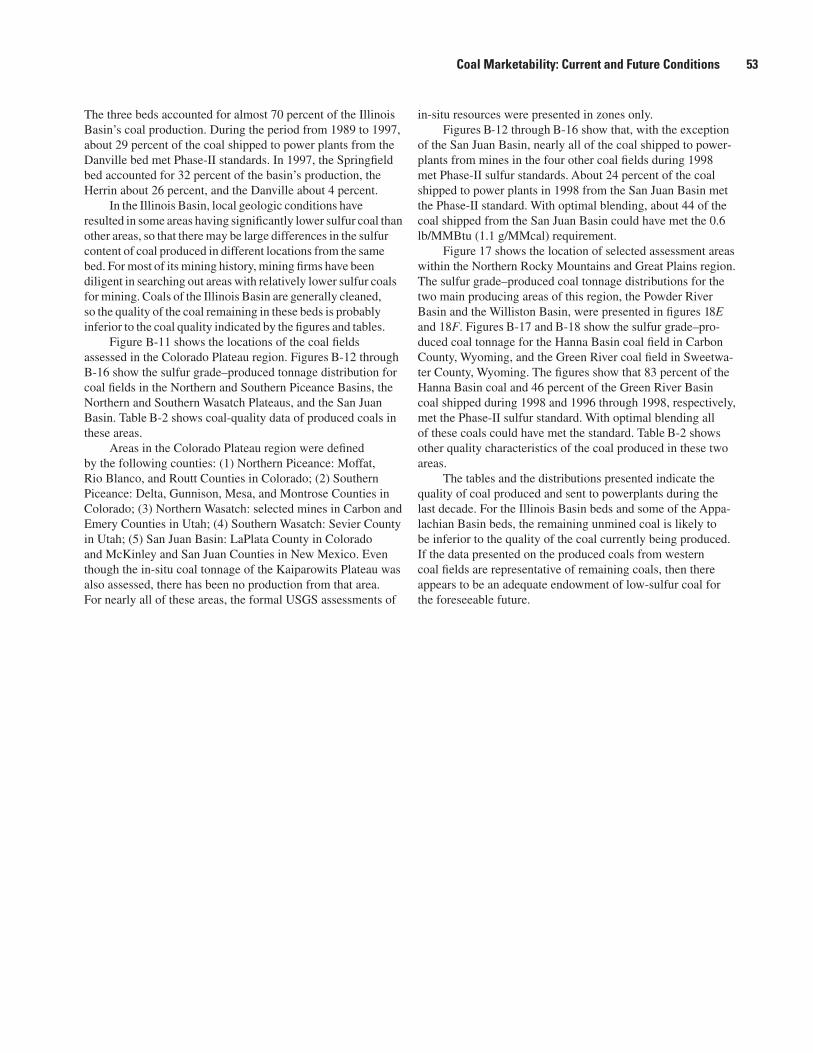
Coal Marketability: Current and Future Conditions 53
The three beds accounted for almost 70 percent of the Illinois Basin’s coal production. During the period from 1989 to 1997, about 29 percent of the coal shipped to power plants from the
bed accounted for 32 percent of the basin’s production, the Herrin about 26 percent, and the Danville about 4 percent.
In the Illinois Basin, local geologic conditions have
other areas, so that there may be large differences in the sulfur content of coal produced in different locations from the same
diligent in searching out areas with relatively lower sulfur coals for mining. Coals of the Illinois Basin are generally cleaned, so the quality of the coal remaining in these beds is probably
assessed in the Colorado Plateau region. Figures B-12 through B-16 show the sulfur grade–produced tonnage distribution for
Northern and Southern Wasatch Plateaus, and the San Juan Basin. Table B-2 shows coal-quality data of produced coals in these areas.
by the following counties: (1) Northern Piceance: Moffat, Rio Blanco, and Routt Counties in Colorado; (2) Southern Piceance: Delta, Gunnison, Mesa, and Montrose Counties in Colorado; (3) Northern Wasatch: selected mines in Carbon and Emery Counties in Utah; (4) Southern Wasatch: Sevier County in Utah; (5) San Juan Basin: LaPlata County in Colorado and McKinley and San Juan Counties in New Mexico. Even though the in-situ coal tonnage of the Kaiparowits Plateau was also assessed, there has been no production from that area. For nearly all of these areas, the formal USGS assessments of
in-situ resources were presented in zones only.Figures B-12 through B-16 show that, with the exception
of the San Juan Basin, nearly all of the coal shipped to power-
met Phase-II sulfur standards. About 24 percent of the coal shipped to power plants in 1998 from the San Juan Basin met the Phase-II standard. With optimal blending, about 44 of the coal shipped from the San Juan Basin could have met the 0.6 lb/MMBtu (1.1 g/MMcal) requirement.
Figure 17 shows the location of selected assessment areas within the Northern Rocky Mountains and Great Plains region. The sulfur grade–produced coal tonnage distributions for the two main producing areas of this region, the Powder River
and 18F. Figures B-17 and B-18 show the sulfur grade–pro-
Hanna Basin coal and 46 percent of the Green River Basin coal shipped during 1998 and 1996 through 1998, respectively, met the Phase-II sulfur standard. With optimal blending all of these coals could have met the standard. Table B-2 shows other quality characteristics of the coal produced in these two areas.
The tables and the distributions presented indicate the quality of coal produced and sent to powerplants during the last decade. For the Illinois Basin beds and some of the Appa-lachian Basin beds, the remaining unmined coal is likely to be inferior to the quality of the coal currently being produced. If the data presented on the produced coals from western
appears to be an adequate endowment of low-sulfur coal for the foreseeable future.
B
8E

54 The National Coal Resource Assessment Overview
Figure B-11.
Coal-bearing strataStudy area
Assessment units1. Kaiparowits Plateau2. Henry Mts Basin3. S. Wasatch Plateau4. N. Wasatch Plateau5. Deserado6. Danforth Hills7. Yampa8. S . Piceance Basin9. Somerset
10. San Juan Basin11. Bisti12. Black Mesa Basin
1
2
3
4
5
6
7
8
9
10
12 11
113
113
34 34
4040
106
106
0 100 MILES
Colorado Plateau study area
AZUT
NMCO
Gallup
Durango
Cedar City
Moab
Price
Albu-querque
Socorro
Grand Junction
40
25
40
15
70
F
.
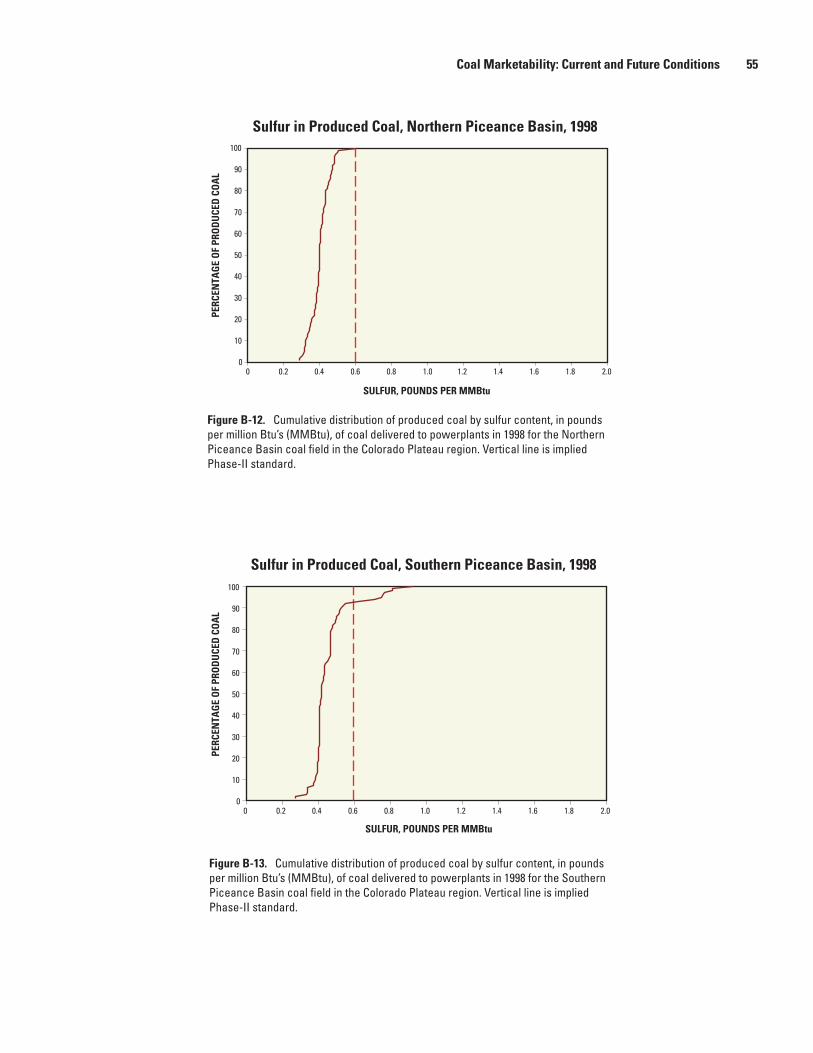
Coal Marketability: Current and Future Conditions 55
Figure B-12. Cumulative distribution of produced coal by sulfur content, in pounds per million Btu’s (MMBtu), of coal delivered to powerplants in 1998 for the Northern
Phase-II standard.
Figure B-13. Cumulative distribution of produced coal by sulfur content, in pounds per million Btu’s (MMBtu), of coal delivered to powerplants in 1998 for the Southern
Phase-II standard.
0
10
20
30
40
50
60
70
80
90
100
PERC
ENTA
GE
OF
PRO
DU
CED
COA
L
0 0.2 0.4 0.6 0.8 1.0 1.2 1.4 1.6 1.8 2.0
SULFUR, POUNDS PER MMBtu
Sulfur in Produced Coal, Northern Piceance Basin, 1998
0
10
20
30
40
50
60
70
80
90
100
PERC
ENTA
GE
OF
PRO
DU
CED
COAL
0 0.2 0.4 0.6 0.8 1.0 1.2 1.4 1.6 1.8 2.0
SULFUR, POUNDS PER MMBtu
Sulfur in Produced Coal, Southern Piceance Basin, 1998
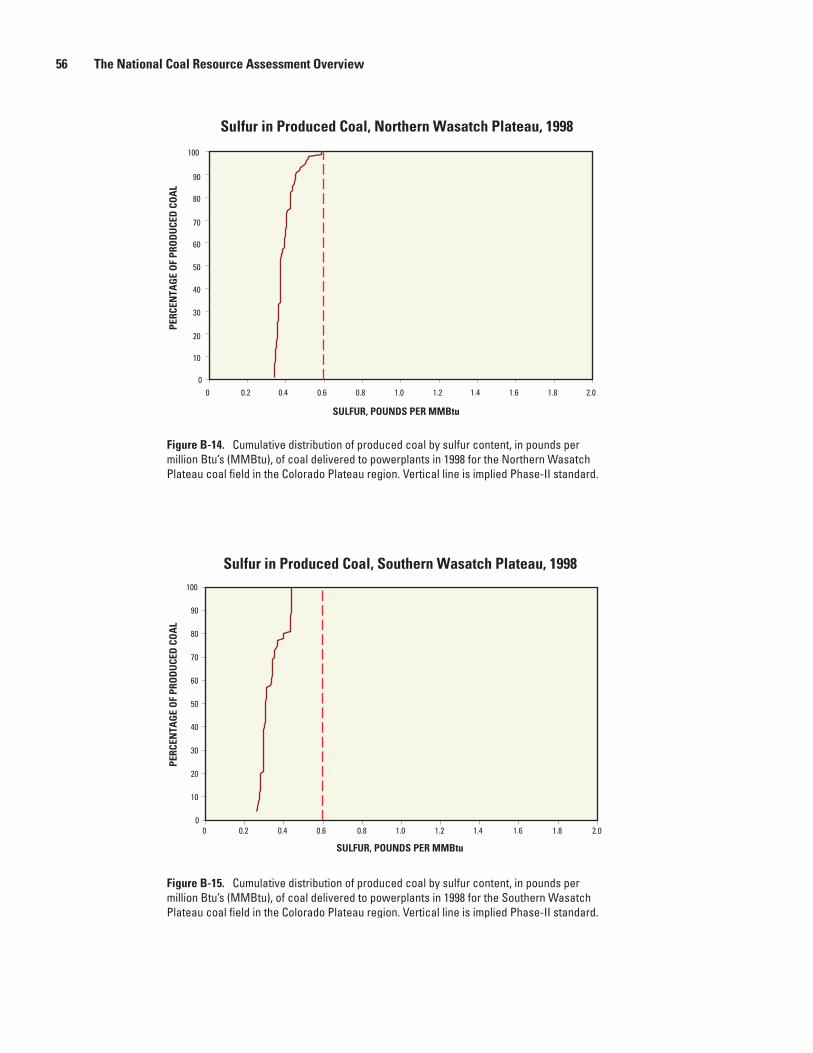
56 The National Coal Resource Assessment Overview
Figure B-14. Cumulative distribution of produced coal by sulfur content, in pounds per million Btu’s (MMBtu), of coal delivered to powerplants in 1998 for the Northern Wasatch
Figure B-15. Cumulative distribution of produced coal by sulfur content, in pounds per million Btu’s (MMBtu), of coal delivered to powerplants in 1998 for the Southern Wasatch
0
10
20
30
40
50
60
70
80
90
100
PERC
ENTA
GE
OF
PRO
DU
CED
COA
L
0 0.2 0.4 0.6 0.8 1.0 1.2 1.4 1.6 1.8 2.0
SULFUR, POUNDS PER MMBtu
Sulfur in Produced Coal, Northern Wasatch Plateau, 1998
0
10
20
30
40
50
60
70
80
90
100
PERC
ENTA
GE
OF
PRO
DU
CED
COAL
0 0.2 0.4 0.6 0.8 1.0 1.2 1.4 1.6 1.8 2.0
SULFUR, POUNDS PER MMBtu
Sulfur in Produced Coal, Southern Wasatch Plateau, 1998

Coal Marketability: Current and Future Conditions 57
Table B-2. Distribution of quality of selected coals from the Western United States received at powerplants in 1998.
[Data based on Federal Energy Regulatory Commission Form 423 data. Sulfur reported in lb/MMBtu; Btu indicates Btu/lb; ash reported in weight percent. Conversion factors: lb/MMBtu = 1.799 g/MMcal; Btu/lb = 0.5558 cal/g. --, no data]
8991 egannot decudorp evitalumuc fo elitnecreP BED/Quality 1 5 25 50 75 95 99
Colorado Plateau
NORTHERN PICEANCE (includes Yampa coal field) Sulfur 0.29 0.32 0.38 0.40 0.43 0.49 0.51
488,11 094,11 382,11 665,01 352,01 648,9 -- utB Ash 5.09 5.50 6.48 8.73 9.60 11.00 12.00 SOUTHERN PICEANCE Sulfur 0.27 0.34 0.40 0.42 0.47 0.75 0.81 Btu 10,595 10,793 11,682 11,814 11,933 12,398 12,499 Ash 4.28 8.10 8.70 9.21 9.75 18.30 19.80 NORTHERN WASATCH PLATEAU Sulfur 0.34 0.34 0.36 0.37 0.42 0.50 0.58 Btu 10,356 10,409 10,960 11,395 11,728 12,164 12,278 Ash 6.80 7.30 9.90 11.50 12.80 14.90 17.10 SOUTHERN WASATCH PLATEAU Sulfur -- 0.26 0.30 0.31 0.37 0.44 0.44
925,11 605,11 814,11 593,11 833,11 232,11 -- utB Ash -- 7.50 8.00 8.30 8.60 10.40 10.40 SAN JUAN BASIN Sulfur 0.42 0.43 0.74 0.85 0.91 0.96 0.97
290,01 709,9 294,9 172,9 469,8 017,8 -- utB Ash 12.30 13.50 16.43 20.70 22.60 25.30 25.60
Northern Rocky Mountains and Great Plains
HANNA BASIN Sulfur -- 0.37 0.56 0.58 0.59 0.61 0.62
713,11 148,01 308,01 487,01 347,01 877,8 -- utB Ash -- 5.29 5.50 5.90 6.20 6.30 6.50 GREEN RIVER BASIN (includes Black Butte and Jim Bridger coal fields) Sulfur 0.38 0.40 0.49 0.61 0.65 0.71 0.86 Btu 9,238 9,375 9,461 9,562 9,851 10,738 11,039 Ash 5.00 7.10 8.20 9.10 10.10 10.90 12.70
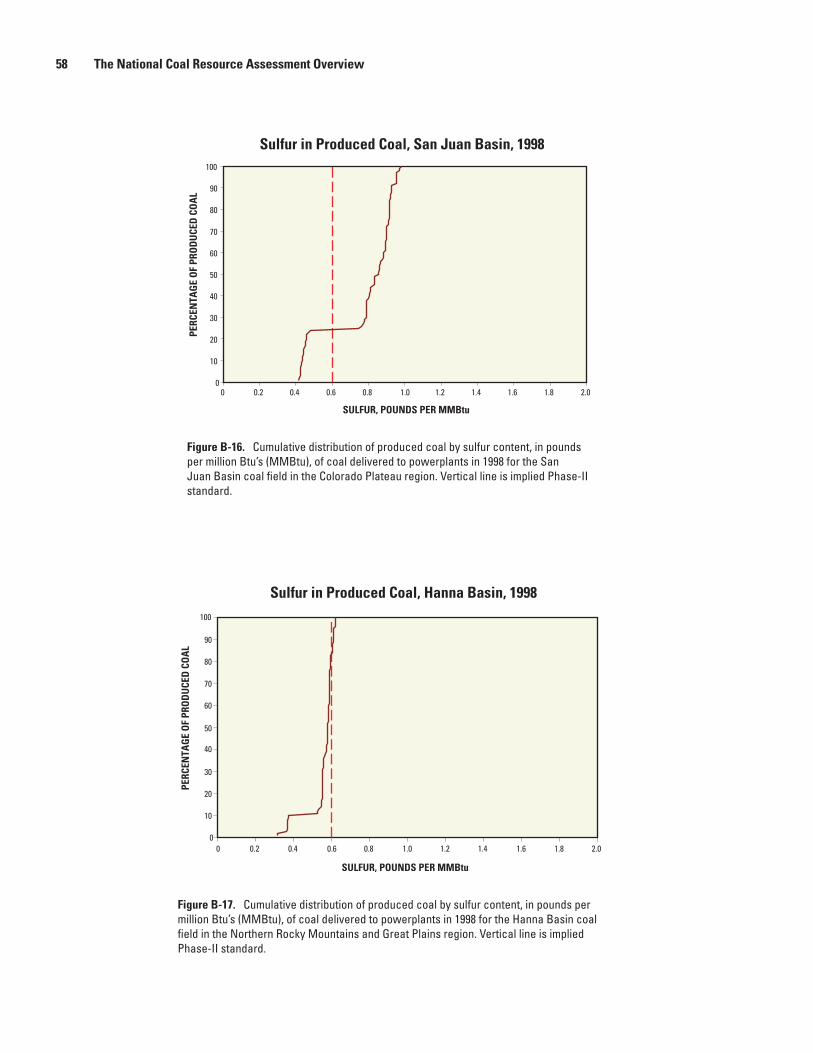
58 The National Coal Resource Assessment Overview
Figure B-16. Cumulative distribution of produced coal by sulfur content, in pounds per million Btu’s (MMBtu), of coal delivered to powerplants in 1998 for the San
standard.
Figure B-17. Cumulative distribution of produced coal by sulfur content, in pounds per million Btu’s (MMBtu), of coal delivered to powerplants in 1998 for the Hanna Basin coal
Phase-II standard.
0
10
20
30
40
50
60
70
80
90
100
PERC
ENTA
GE
OF
PRO
DU
CED
COA
L
0 0.2 0.4 0.6 0.8 1.0 1.2 1.4 1.6 1.8 2.0
SULFUR, POUNDS PER MMBtu
Sulfur in Produced Coal, San Juan Basin, 1998
0
10
20
30
40
50
60
70
80
90
100
PERC
ENTA
GE
OF
PRO
DU
CED
COAL
0 0.2 0.4 0.6 0.8 1.0 1.2 1.4 1.6 1.8 2.0
SULFUR, POUNDS PER MMBtu
Sulfur in Produced Coal, Hanna Basin, 1998
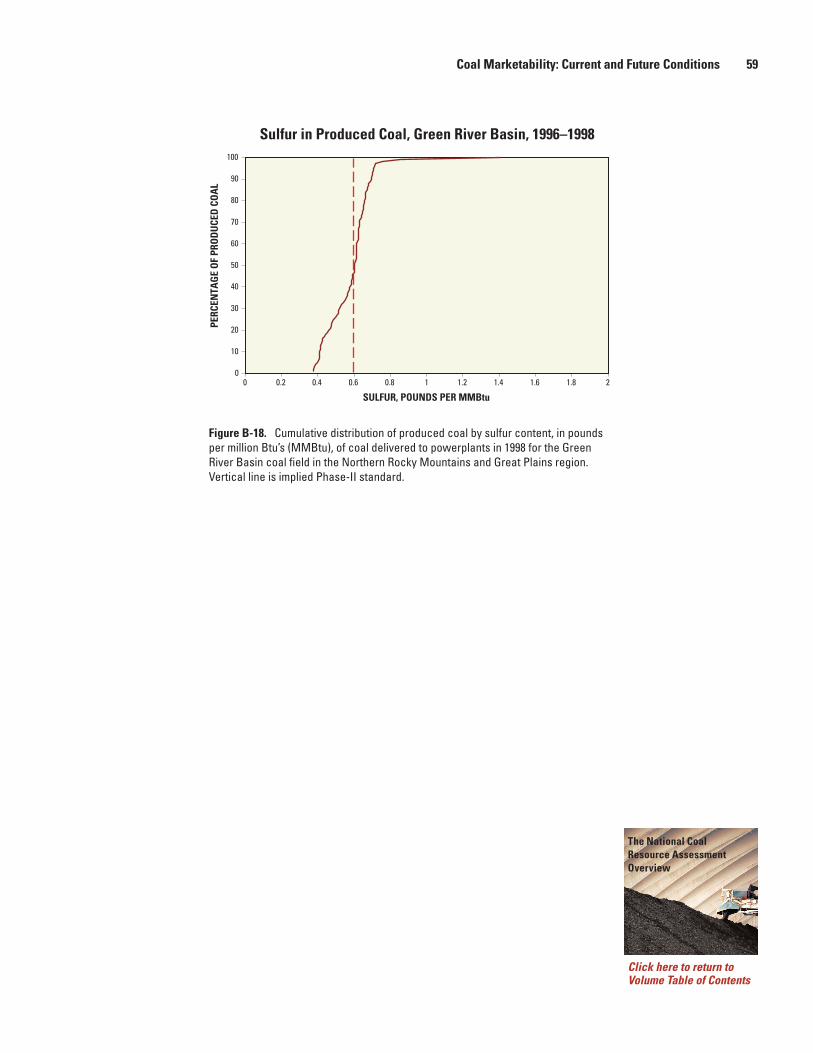
Coal Marketability: Current and Future Conditions 59
Figure B-18. Cumulative distribution of produced coal by sulfur content, in pounds per million Btu’s (MMBtu), of coal delivered to powerplants in 1998 for the Green
Vertical line is implied Phase-II standard.
0
10
20
30
40
50
60
70
80
90
100
PERC
ENTA
GE
OF
PRO
DU
CED
COAL
0 0.2 0.4 0.6 0.8 1 1.2 1.4 1.6 1.8 2
SULFUR, POUNDS PER MMBtu
Sulfur in Produced Coal, Green River Basin, 1996–1998
Click here to return to Volume Table of Contents
The National Coal Resource Assessment Overview