Comparison of Five Color Models in Skin Pixel …super/ratfg1999.pdfComparison of Five Color Models...
6
Comparison of Five Color Models in Skin Pixel Classification Benjamin D. Zarit, Boaz J. Super, Francis K. H. Quek Electrical Engineering and Computer Science University of Illinois at Chicago [email protected], [email protected], [email protected] Abstract Detection of skin in video is an important component of systems for detecting, recognizing, and tracking faces and hands. Different skin detection methods have used different color spaces. This paper presents a comparative evaluation of pixel classification performance of two skin detection methods in five color spaces. The skin detection methods used in this paper are color-histogram based approaches that are intended to work with a wide variety of individuals, lighting conditions, and skin tones. One is the widely-used lookup table method, the other makes use of Bayesian decision theory. Two types of enhancements, based on spatial and texture analyses, are also evaluated. 1. Introduction Skin detection in video images is an important first step in a wide variety of recognition and tracking systems. It can be used to begin the process of face recognition or facial expression extraction, and can provide an initial estimate or follow-up verification for face and hand tracking algorithms. Being able to do these types of detection based merely on skin color would eliminate the need for cumbersome tracking devices or artificially placed color keys. Imagine a video conference in which the speakers can move freely, while cameras automatically track their positions, always keeping them centered in the frame [16]. One of the primary problems in skin detection is color constancy. Ambient light, bright lights, and shadows change the apparent color of an image. Different cameras affect the color values as well. Movement of an object can cause blurring of colors. Finally, skin tones vary dramatically within and across individuals. A primary objective of the current work is to study the effect of color space choice on skin detection performance. Two color histogram based methods are evaluated on five color spaces; one is the widely-used lookup table method, the other makes use of Bayesian decision theory. The effect of using different color histogram resolutions and of enhancements based on region growing and texture analysis are also evaluated. The skin detection methods use off-line training rather than incremental run-time training, and are tested on images representing a wide variety of people, environments, cameras, and lighting conditions. 2. Background A number of existing systems employ a skin detection algorithm. Face detectors and face trackers make up the majority of these (see [2 - 4, 7, 13, 15 - 17]). In real-time trackers, a skin detector does not do the actual tracking, but instead, does the initial location of the face and acts as a reality check. Face recognition and facial expression analysis systems often use skin detection as an initial step. Hand trackers (such as [1, 9, 11]), while not as common as face trackers, also can make use of skin detectors to aid in tracking. A majority of the skin detection algorithms use color histograms for segmentation, either directly or for ML estimation ([1, 2, 5, 7 - 12, 14, 16, 17]); others perform pixel classification based on predefined ranges in color space ([6, 13]). Differences among existing skin detection systems occur primarily in the following areas: color space used, incremental run-time training versus off-line training, and the techniques used for sorting and identifying colors corresponding to skin. The skin detection methods used in this paper are based on [11] and [10]. Individual color spaces used in prior skin detection methods include HSV ([9, 12, 13]), a variant of Hue and Saturation ([6]), Normalized RGB ([1, 7, 16, 17]), simple RGB ([10, 11]), YUV ([4]), and transformations from CIE XYZ, including Farnsworth ([3, 15]) and CIE L*a*b* ([2]). Five of these color spaces are compared in the current paper. Further discussion of color spaces and skin detection can be found in [18].
Transcript of Comparison of Five Color Models in Skin Pixel …super/ratfg1999.pdfComparison of Five Color Models...

Comparison of Five Color Models in Skin Pixel Classification
Benjamin D. Zarit, Boaz J. Super, Francis K. H. QuekElectrical Engineering and Computer Science
University of Illinois at [email protected], [email protected], [email protected]
AbstractDetection of skin in video is an important component ofsystems for detecting, recognizing, and tracking faces andhands. Different skin detection methods have useddifferent color spaces. This paper presents a comparativeevaluation of pixel classification performance of two skindetection methods in five color spaces. The skin detectionmethods used in this paper are color-histogram basedapproaches that are intended to work with a wide variety ofindividuals, lighting conditions, and skin tones. One isthe widely-used lookup table method, the other makes useof Bayesian decision theory. Two types of enhancements,based on spatial and texture analyses, are also evaluated.
1. Introduction
Skin detection in video images is an important firststep in a wide variety of recognition and tracking systems.It can be used to begin the process of face recognition orfacial expression extraction, and can provide an initialestimate or follow-up verification for face and handtracking algorithms. Being able to do these types ofdetection based merely on skin color would eliminate theneed for cumbersome tracking devices or artificially placedcolor keys. Imagine a video conference in which thespeakers can move freely, while cameras automaticallytrack their positions, always keeping them centered in theframe [16].
One of the primary problems in skin detection is colorconstancy. Ambient light, bright lights, and shadowschange the apparent color of an image. Different camerasaffect the color values as well. Movement of an objectcan cause blurring of colors. Finally, skin tones varydramatically within and across individuals.
A primary objective of the current work is to study theeffect of color space choice on skin detection performance. Two color histogram based methods are evaluated on fivecolor spaces; one is the widely-used lookup table method,the other makes use of Bayesian decision theory. The
effect of using different color histogram resolutions and ofenhancements based on region growing and textureanalysis are also evaluated. The skin detection methodsuse off-line training rather than incremental run-timetraining, and are tested on images representing a widevariety of people, environments, cameras, and lightingconditions.
2. Background
A number of existing systems employ a skin detectionalgorithm. Face detectors and face trackers make up themajority of these (see [2 - 4, 7, 13, 15 - 17]). In real-timetrackers, a skin detector does not do the actual tracking,but instead, does the initial location of the face and acts asa reality check. Face recognition and facial expressionanalysis systems often use skin detection as an initialstep. Hand trackers (such as [1, 9, 11]), while not ascommon as face trackers, also can make use of skindetectors to aid in tracking.
A majority of the skin detection algorithms use colorhistograms for segmentation, either directly or for MLestimation ([1, 2, 5, 7 - 12, 14, 16, 17]); others performpixel classification based on predefined ranges in colorspace ([6, 13]). Differences among existing skin detectionsystems occur primarily in the following areas: colorspace used, incremental run-time training versus off-linetraining, and the techniques used for sorting andidentifying colors corresponding to skin. The skindetection methods used in this paper are based on [11] and[10].
Individual color spaces used in prior skin detectionmethods include HSV ([9, 12, 13]), a variant of Hue andSaturation ([6]), Normalized RGB ([1, 7, 16, 17]), simpleRGB ([10, 11]), YUV ([4]), and transformations from CIEXYZ, including Farnsworth ([3, 15]) and CIE L*a*b*([2]). Five of these color spaces are compared in thecurrent paper. Further discussion of color spaces and skindetection can be found in [18].

CIELAB Fleck HS HSV
Normalized RGB YCrCb
Figure 1: Results for lookup table method across five color spaces for 64x64 resolution.
3. Images Used and Performance Metrics
Both algorithms presented here were trained using 48images. The testing was done on 64 other images. Theimages were downloaded from a variety of sources,including frames from movies and television, professionalpublicity photos and amateur photographs. The imageswere selected so as to include a wide range of skin tones,environments, cameras, and lighting conditions. Some ofthe images depicted multiple individuals and the quality ofthe images varied. The choice of the images is describedin greater detail in [18]. To obtain ground truth fortraining and evaluation of pixel classification performance,the skin regions in all 112 images were marked by hand.
Four different metrics are used to evaluate the resultsof the skin detection algorithms. C (percent correct) isthe proportion of all image pixels (both skin and non-skin) identified correctly. SE (skin error) is the numberof skin pixels identified as non-skin, divided by thenumber of image pixels. NSE (non-skin error) is thenumber of non-skin pixels identified as skin, divided bythe number of image pixels. S (% of skin correct) is theproportion of all skin pixels identified correctly.
4. Algorithm 1: Lookup Table Method
The first algorithm presented here uses a color
histogram-based approach for segmenting the skin pixelsfrom the remainder of the image. This approach relies onthe assumption that skin colors form a cluster in somecolor measurement space ([10, 11]). A two-dimensionalhistogram is used to represent the skin tones. By usingthe two parameters of a color system which do notcorrespond to intensity or illumination, the histogramshould be more stable with respect to differences inillumination and local variations caused by shadows [12].
The two-dimensional histogram used here is referred toas the lookup table (LT). Each cell in the LT representsthe number of pixels with a particular range of color valuepairs. A set of training images is used to construct theLT as follows: Each image, having been previouslysegmented by hand, undergoes a color spacetransformation. Then, for each pixel marked as skin, theappropriate cell in the LT is incremented. After all theimages have been processed, the values in the LT aredivided by the largest value present. The normalizedvalues ([0,1]) in the LT cells reflect the likelihood thatthe corresponding colors will correspond to skin.
To perform skin detection, an image is firsttransformed into the color space. For each pixel in theimage, the color values index the normalized value in theLT. If this value is greater than a threshold, the pixel isidentified as skin. Otherwise, the pixel is considered to benon-skin.

4.1 Lookup Table Results
Initially, ten different LTs were constructed, at twodifferent resolutions (64 x 64 and 128 x 128) and in fivedifferent color spaces (CIEL*a*b*, HSV, an AlternateHue-Saturation system, referred to here as Fleck HS ([6]),Normalized RGB and YCrCb ). Each of the ten LTs wasconstructed from the 48 images in the training set andtested with the 64 images from the test set. For eachimage, the algorithm was run with thresholds from 0 to 1.Figure 1 shows the results for a resolution of 64 x 64.
For all ten LTs, the value of the threshold determineda tradeoff between NSE and SE . In all cases C (%correct) started below 50% and then increased to around80% where it leveled off. The S (% of skin correct)tended to be close to 100% at very low thresholds, andthen fell to near zero at high thresholds.
Figures 2 and 3 show these results grouped by S ,rather than by color space. In each plot, C, SNE and S Eare shown for all five color spaces.
At a 60% S (Figure 2), HSV and Fleck HS have thebest results, with C around 80%, NSE just over 10% andSE just below 10%. The results from the other colorspaces are comparable, but with a higher NSE and alower C.
At an 80% S (Figure 3) the differences between thecolor spaces become more apparent. Here, Fleck HS hasthe best results, followed closely by HSV, while YCrCb
and CIELAB have the worst, with C below 70% andNSE above 30%. In every case, SE is negligible, as it
is near or below 5%.It is interesting that the two Hue-Saturation based
color spaces perform better than the two systems designedto accurately reproduce color information (CIELAB andYCrCb).
4.2 Adding Double Thresholding
While the LT method works reasonably well, it has atendency to omit pixels (a high SE at low thresholds).To overcome this problem, a simple double-thresholdingregion-growing method was added to the algorithm. Asimilar technique was used in [6].
Values above a threshold are always considered to beskin, while values below a lower threshold are alwaysconsidered to be non-skin. All pixels with values abovethe first threshold are identified as skin. Next, for eachpixel, the 5x5 neighborhood around the pixel is examined.If a majority of the pixels in this neighborhood are skin,it is also identified as skin (if not already). Otherwise, thecurrent pixel is identified as non-skin. This has the effectof removing small groups of spatially outlying skinpixels, as well as filling in small areas that were missed.
After applying this simple smoothing technique, theregion growing begins. Pixels adjacent to pixels thathave been previously identified as skin are examined. Ifthe LT indicates a value between the two thresholds, thepixel is identified as skin. This process repeats until thetotal number of new pixels added from a single passthrough the image is less than 1% of the total number of
Figure 2: Result at an 60% Skin Correct Figure 3: Result at an 80% Skin Correct

Figure 4: Lookup table method with doublethresholding of half of original threshold.
Figure 5: Lookup table method with doublethresholding of quarter of original threshold.
pixels in the image.
4.3 Results of Adding Double Thresholding
Instead of testing every combination of thresholds, thesecond threshold selected was either half or a quarter of thefirst. Again, testing was done with all five color spaces.Looking at the results for an 80% S for both half (Figure4) and a quarter (Figure 5) of the original threshold, onceagain HSV and Fleck HS have the best results, whileCIELAB and YCrCb have the worst results. While theresults with double thresholding are improved for the lattertwo color spaces, overall, using double thresholding withthe LT does not result in major improvements.
5. Algorithm 2: Bayesian Method
The second method presented here uses Bayes' Theoremto choose the most likely hypothesis, given the value of afeature. Here, the mutually exclusive classes are skin (s)and non-skin ( ¬s). The feature is the two-dimensional
color value x of a pixel. In contrast with the lookuptable method, the Bayesian method uses two colorhistograms, one for skin and one for non-skin pixels.
When constructing the probabilities for Bayesiandecision making, there are two possible assumptions. Inthe first case, the probability that a pixel is skin isassumed to be the same as the probability that a pixel isnon-skin (P(s) = P( ¬s) ). This corresponds to maximumlikelihood (ML) estimation. For any pixel, if the ratiofound from (1) is greater than one, then the pixel can beclassified as skin. Otherwise, the pixel can be classifiedas non-skin:
P s x
P s x
P x s
P x s
( | )( | )
( | )( | )¬
=¬
(1)
In the second case, the values of probabilities P(s) andP( ¬s) are estimated from the training data. Thiscorresponds to maximum a posteriori (MAP) estimation.If the ratio in (2) is greater than 1, then the pixel can beclassified as skin. Otherwise, the pixel can be classifiedas non-skin:
P s x
P s x
P x s P s
P x s P s
( | )( | )
( | ) ( )( | ) ( )¬
=¬ ¬
(2)
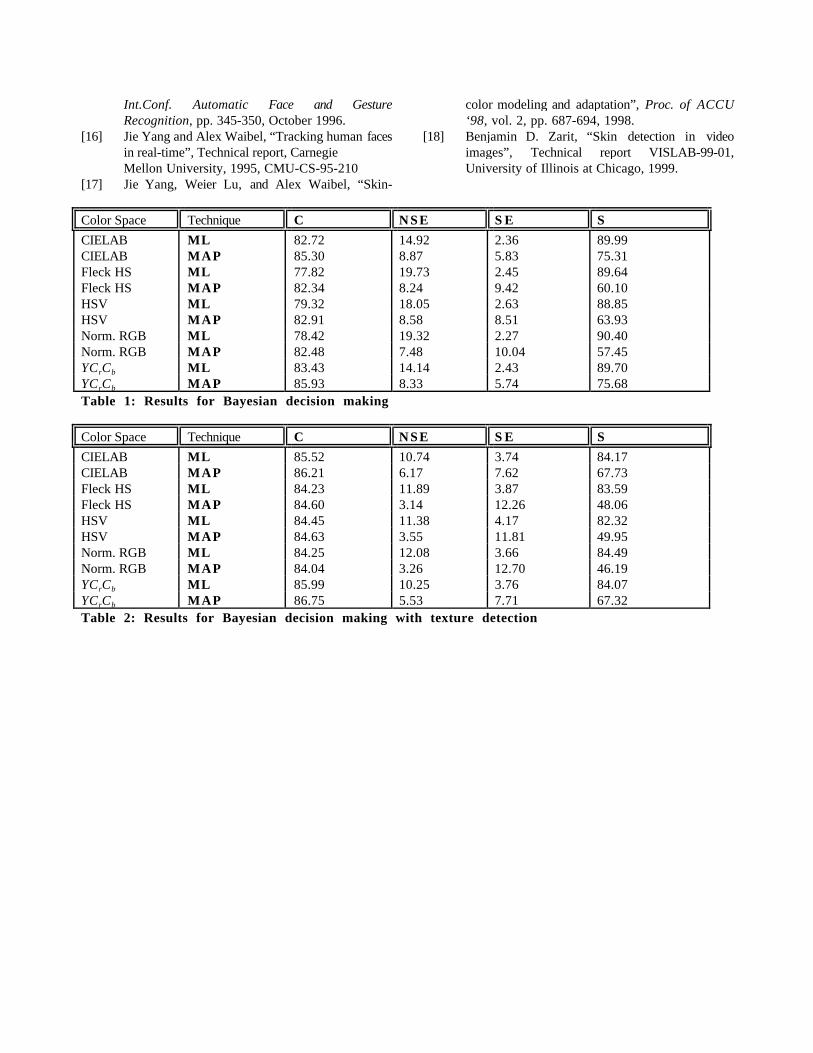
5.1 Results of Bayesian Method
This method was tested with all five color spaces andwith the MAP and ML techniques. The results areshown in Table 1. The results for each of the color spacesare very close for ML. While the results for the differentcolor spaces are very similar, the results for MAP andML are quite different. MAP has a slightly higher C ,and a higher SE. ML has a high S (around 90% in allfive cases), with a very low SE , but a high NSE (from15-20%).
5.2 Bayesian Method with Texture Detection
To reduce NSE , a simple texture detection methodwas used, as skin tends to be smooth and to have littletexture. The texture detection method used here measuresthe variance in a neighborhood. By eliminating areas witha high variance, neighborhoods that are definitely not skinshould be eliminated. However, this may have the

undesired effect of reducing the number of correct results,because pixels along the boundary between skin and non-skin regions will also have a high degree of variance.Texture detection was also used in [6].
The algorithm begins by applying the ML or MAPmethods and then applies smoothing as described for theLT method. The variance is measured in 3x3neighborhoods of pixels already identified as skin. Areaswith a high texture are reclassified as non-skin.
5.3 Results for Bayesian Method with TextureDetection
In this case, the results were as expected. N S Edecreased, while SE increased and S decreased. C alsoincreased, which implies that overall, this was a goodtechnique. However, when using MAP, the decrease in Swas very extreme, making the results significantly worsethan for other techniques. Overall, the results from MLare superior to the results from MAP.
6. Conclusions
The LT method performed best when used with FleckHS or HSV, but CIELAB and YCrCb yielded poorerresults. The results proved to be similar to other skindetection systems ([18]). Double thresholding did notprovide a significant improvement over a single thresholdfor the two color spaces that performed the best.Additionally, the results for a resolution of 128x128 werevery close to the results for a resolution of 64x64.
For the Bayesian method, the biggest difference wasbetween ML and MAP . ML performed significantlybetter than MAP across all five color spaces. Usingdifferent color spaces provided very little variation in theresults. The ML method also worked well when simpletexture detection was added, lowering the NSE , thoughalso reducing C and S . The ML method produced betterresults than the LT method; in addition, it comparesfavorably to other skin detection systems ([18]), iscomputationally efficient, and is easy to implement.
References
[1] Subutai Ahmad, “A usable real-time 3d handtracker”, Conference Record of the AsilomarConference on Signals, Systems and Computers,pp. 1257-1261, 1994.
[2] J. Cai, A. Goshtasby, and C. Yu, “Detectinghuman faces in color images”, Int. Workshop onMulti-Media Database Management Systems, pp.124-131, August 1998.
[3] Qian Chen, Haiyuan Wu, and Masahiko Yachida,
“Face detection by fuzzy pattern matching”, IEEE5th Int.Conf. Computer Vision, pp. 591-596,1995.
[4] M. Collobert, R. Feraud, G. Le Tourneur, D.Bernier, J. E. Vaiallet, Y. Mahieux, and D.Collobert, “Listen: A system for locating andtracking individual speakers”, Int. Conf.Automatic Face and Gesture Recognition, pp.283-288, October 1996.
[5] T. Darrell, G. Gordon, M. Harville, J. Woodfill,"Integrated Person Tracking Using Stereo, Color,and Pattern Detection," Proc. Conf. on ComputerVision and Pattern Recognition, Santa Barbara,California, June 1998.
[6] Margaret M. Fleck, David A. Forsyth, and ChrisBregler, “Finding naked people”, European Conf.Computer Vision, vol. 2, pp. 592-602, 1996.
[7] Martin Hunke and Alex Waibel, “Face locatingand tracking for human-computer interaction”,IEEE Computer, pp. 1277-1281, November1994.
[8] K. Imagawa, S. Lu, S. Igi, "Color-Based HandsTracking System for Sign LanguageRecognition," Proc. 3rd Int. Conf. on Face andGesture Recognition, Nara, Japan, April 1998.
[9] Rich Kjeldsen and John Kender, “Finding skincolor images”, Int.Conf. Automatic Face andGesture Recognition, pp. 312-317, October 1996.
[10] Thomas A. Mysliwiec, “Fingermouse: AFreehand computer pointing interface”, Technicalreport VISLab-94-01, University of Illinois atChicago, 1994.
[11] Francis K. H. Quek, Thomas Mysliwiec, andMeide Zhao, “Fingermouse: A freehand pointinginterface”, Proc. Int. Workshop on AutomaticFace- and Gesture-Recognition, Zurich,Switzerland, pp. 372-377, June 1995.
[12] David Saxe and Richard Foulds, “Toward robustskin identification in video images”, 2nd Int. Faceand Gesture Recognition Conf., September 1996.
[13] Karin Sobottka and Ioannis Pitas, “Segmentationand tracking of faces in color images”, Second Int.Conf. Automatic Face and Gesture Recognition,pp. 236-241, October 1996.
[14] J-C. Terrillon, M. David, and S. Akamatsu,"Automatic Detection of Human Faces in NaturalScene Images by Use of a Skin Color Model andof Invariant Moments," Proc. 3rd Int. Conf. onFace and Gesture Recognition, Nara, Japan, April1998.
[15] Haiyuan Wu, Taro Yokoyama, DadetPramadihanto, and Masahiko Yachida, “Face andfacial feature extraction from color images”,
Int.Conf. Automatic Face and GestureRecognition, pp. 345-350, October 1996.
[16] Jie Yang and Alex Waibel, “Tracking human facesin real-time”, Technical report, CarnegieMellon University, 1995, CMU-CS-95-210
[17] Jie Yang, Weier Lu, and Alex Waibel, “Skin-
color modeling and adaptation”, Proc. of ACCU‘98, vol. 2, pp. 687-694, 1998.
[18] Benjamin D. Zarit, “Skin detection in videoimages”, Technical report VISLAB-99-01,University of Illinois at Chicago, 1999.
Color Space Technique C N S E S E S
CIELAB ML 82.72 14.92 2.36 89.99CIELAB MAP 85.30 8.87 5.83 75.31Fleck HS ML 77.82 19.73 2.45 89.64Fleck HS MAP 82.34 8.24 9.42 60.10HSV ML 79.32 18.05 2.63 88.85HSV MAP 82.91 8.58 8.51 63.93Norm. RGB ML 78.42 19.32 2.27 90.40Norm. RGB MAP 82.48 7.48 10.04 57.45YCrCb ML 83.43 14.14 2.43 89.70YCrCb MAP 85.93 8.33 5.74 75.68Table 1: Results for Bayesian decision making
Color Space Technique C N S E S E S
CIELAB ML 85.52 10.74 3.74 84.17CIELAB MAP 86.21 6.17 7.62 67.73Fleck HS ML 84.23 11.89 3.87 83.59Fleck HS MAP 84.60 3.14 12.26 48.06HSV ML 84.45 11.38 4.17 82.32HSV MAP 84.63 3.55 11.81 49.95Norm. RGB ML 84.25 12.08 3.66 84.49Norm. RGB MAP 84.04 3.26 12.70 46.19YCrCb ML 85.99 10.25 3.76 84.07YCrCb MAP 86.75 5.53 7.71 67.32Table 2: Results for Bayesian decision making with texture detection