Commuting in Londonttw-flows.pdf · London commuters were more likely to be younger: Forty-four per...
40
GLA Intelligence 1 CIS 2014-11 Commuting in London July 2014 The 2011 Census recorded the place of work and method of travel to work of all respondents aged 16 or over. The Special Workplace Statistics dataset provides information on travel to work flows and the characteristics of workers based on where they live (origin) and where they work (destination). This summary document provides an overview of commuting in London and is based on the first origin- destination outputs from the 2011 Census which were released on 25 th July, 2014. Key Findings Net commuting inflow from the rest of England and Wales to London was 519,000 in 2011 up seven per cent since 2001. Both inflows and outflows were higher than in 2001: inflows rose nine per cent to 790,000 while outflows rose 15 per cent to 271,000. Within London, more than two million persons worked in a different local authority to their residence. Nearly 400,000 workers commuted into Westminster from the rest of London, while 115,000 commuted out of Wandsworth to the rest of London. The largest single cross-border flow was 29,100 from Wandsworth to Westminster. Twenty-four local authorities outside London had 10,000 or more London commuters. Dartford replaced Slough as the top destination for commuters from London. 356,500 people commuted to jobs in the City of London. 40 per cent from inner London, 29 per cent from outer London, 31 per cent from outside London 558,900 people commuted to jobs in Westminster. 46 per cent from inner London, 32 per cent from outer London, 23 per cent from outside London 103,500 people commuted to jobs in Canary Wharf. 44 per cent from inner London, 30 per cent from outer London, 26 per cent from outside London Those workers who lived outside London and commuted to City, Westminster or Canary Wharf were most likely to live in either Surrey (14 per cent), Essex (17 per cent) or Hertfordshire (14 per cent)
Transcript of Commuting in Londonttw-flows.pdf · London commuters were more likely to be younger: Forty-four per...

GLA Intelligence 1
CIS 2014-11
Commuting in London July 2014
The 2011 Census recorded the place of work and method of travel to work of all respondents aged 16 or over. The Special Workplace Statistics dataset provides information on travel to work flows and the characteristics of workers based on where they live (origin) and where they work (destination). This summary document provides an overview of commuting in London and is based on the first origin-destination outputs from the 2011 Census which were released on 25th July, 2014.
Key Findings Net commuting inflow from the rest of England and Wales to London was 519,000 in 2011 up seven per
cent since 2001. Both inflows and outflows were higher than in 2001: inflows rose nine per cent to 790,000 while outflows rose 15 per cent to 271,000.
Within London, more than two million persons worked in a different local authority to their residence. Nearly 400,000 workers commuted into Westminster from the rest of London, while 115,000 commuted out of Wandsworth to the rest of London. The largest single cross-border flow was 29,100 from Wandsworth to Westminster.
Twenty-four local authorities outside London had 10,000 or more London commuters. Dartford replaced Slough as the top destination for commuters from London.
356,500 people commuted to jobs in the City of London. 40 per cent from inner London, 29 per cent from outer London, 31 per cent from outside London
558,900 people commuted to jobs in Westminster. 46 per cent from inner London, 32 per cent from outer London, 23 per cent from outside London
103,500 people commuted to jobs in Canary Wharf. 44 per cent from inner London, 30 per cent from
outer London, 26 per cent from outside London Those workers who lived outside London and commuted to City, Westminster or Canary Wharf were
most likely to live in either Surrey (14 per cent), Essex (17 per cent) or Hertfordshire (14 per cent)

Commuting in London
GLA Intelligence 2
Commuting in London
In 2011, there were 4.50 million persons in work in London an increase of 690,000, some 18 per cent compared to 2001. Some 790,000 workers commuted into London from the rest of England and Wales while 271,000 London residents worked outside the capital.
Table 1: Commuting flows in and out of London 1991 to 2011, thousands
1991 2001 2011 Per cent increase 2001 to
2011
Workers commuting into London from outside 673 722 790 9%
Workers commuting out of London to rest of England and Wales 150 236 271 15%
Net commuting into London 523 486 519 7%
Source Census tables: 1991 L06, 2001 TT010, 2011 WU01EW
Both inflows and outflows were higher than in 2001. Net inflow rose seven per cent to 519,000, a similar level to 20 years earlier.
Figure 1: Net flow for districts in London

Commuting in London
GLA Intelligence 3
Commuting within London by London local authority Commuter flows within London were much larger than flows across the London boundary with over two million Londoners working in a different London local authority to their residence.
Figure 2 shows that nearly 400,000 workers (397,000) commuted into Westminster from the rest of London, more than three times as many as commuted from outside London. The City of London received 243,000 commuters from the rest of London while Camden, Tower Hamlets, Southwark and Islington each received over 100,000. The largest commuter inflow to an outer London borough was 49,000 into Ealing.
Figure 3 shows that the boroughs with the largest commuter outflows to other London boroughs were the contiguous inner London boroughs of Wandsworth with 115,000, Lambeth with 109,000 and Southwark with 90,000. The outer London borough of Ealing came next with an outflow of 85,000 to the rest of London.
The largest individual commuter flows between London local authorities were into Westminster and City from the neighbouring boroughs of Wandsworth, Lambeth Tower Hamlets and Southwark. The largest flows to outer London boroughs were 12,000 from Hounslow to Hillingdon, 11,700 from Ealing to Hillingdon,10,800 from Bexley to Greenwich and 10,400 from Ealing to Hounslow.

Commuting in London
GLA Intelligence 4
Figure 2: Commuting inflows within London by London Local Authority
Source: 2011Census table WU01EW
0 100 200 300 400
Bexley
Havering
Sutton
Harrow
Barking and Dagenham
Kingston upon Thames
Redbridge
Waltham Forest
Enfield
Croydon
Richmond upon Thames
Bromley
Lewisham
Merton
Greenwich
Haringey
Barnet
Newham
Brent
Hillingdon
Hounslow
Hackney
Ealing
Wandsworth
Lambeth
Hammersmith and…
Kensington and Chelsea
Southwark
Islington
Tower Hamlets
Camden
City of London
Westminster
Thousands

Commuting in London
GLA Intelligence 5
Figure 3: Commuting outflows within London by London Local Authority
Source: 2011Census table WU01EW
0 30 60 90 120 150 180
City of London
Kingston upon Thames
Barking and Dagenham
Sutton
Hillingdon
Havering
Kensington and Chelsea
Westminster
Richmond upon Thames
Bexley
Harrow
Hounslow
Camden
Merton
Hammersmith and…
Enfield
Greenwich
Waltham Forest
Tower Hamlets
Islington
Redbridge
Bromley
Newham
Hackney
Croydon
Haringey
Brent
Barnet
Lewisham
Ealing
Southwark
Lambeth
Wandsworth
Thousands

Commuting in London
GLA Intelligence 6
Commuting into London by London local authority
The vast majority of commuters both into and out of London came from the neighbouring South East and East regions. Half of all in-commuters, 404,000, came from the South East and nearly four in ten, 308,000, came from the East region, the remainder of the English regions and Wales together accounted for 78,000 or a tenth of London’s commuters.
Figure 4: Commuting inflows from outside London by London Local Authority
Westminster had the largest inflow 127,000, followed by City with 112,000. Camden, Hillingdon and Tower Hamlets received around 50,000 commuters each from outside London. As would be expected, authorities
0 20 40 60 80 100 120 140
Lewisham
Haringey
Waltham Forest
Merton
Greenwich
Redbridge
Barking and Dagenham
Harrow
Wandsworth
Brent
Newham
Hackney
Sutton
Richmond upon Thames
Kensington and Chelsea
Croydon
Bromley
Ealing
Bexley
Hammersmith and Fulham
Kingston upon Thames
Havering
Lambeth
Barnet
Enfield
Hounslow
Islington
Southwark
Tower Hamlets
Hillingdon
Camden
City of London
Westminster
Thousands
East South East Rest of EW

Commuting in London
GLA Intelligence 7
to the east of London tended to attract more commuters from the East region and those to the west relatively more from the South East. Hillingdon had more commuters from the South East region (37,200) than any London local authority except Westminster and City (68,100 and 48,400 respectively). City had the most commuters from the East region (55,700) followed by Westminster (42,200), Tower Hamlets (25,800) and Camden (23,300).
Figure 5: Regions in England & Wales to London
Top local authorities commuting into London
Table 2 gives the 24 local authorities that had 10,000 or more commuters into London in 2011. Epping Forest had most commuters in 2011 at 25,900, although this was slightly down on the 2001 figure of 26,200. The authorities that showed the biggest increase in commuters were Thurrock (up 2,600 to 22,100) and Dartford (up 2,500 to 19,100).
The top source of commuters outside South East and East regions was Wiltshire unitary authority with 3,700 working in London.

Commuting in London
GLA Intelligence 8
Table 2: Local authorities with over 10,000 commuters into London in 2011
Rank Local authority 2011 2001 change 2001 rank
1 Epping Forest 25,900 26,200 -300 1
2 Elmbridge 23,800 22,300 1,500 2
3 Thurrock 22,100 19,500 2,600 3
4 Dartford 19,100 16,700 2,500 9
5 Sevenoaks 18,400 17,400 1,000 7
6 Spelthorne 18,000 18,200 -200 5
7 Hertsmere 18,000 17,100 900 8
8 Basildon 17,800 18,300 -500 4
9 Reigate and Banstead 17,500 16,000 1,500 10
10 Medway 17,300 17,600 -300 6
11 St Albans 16,600 14,600 2,000 12
12 Epsom and Ewell 15,800 14,300 1,500 13
13 Broxbourne 14,400 14,800 -400 11
14 Chelmsford 14,100 13,900 100 14
15 Slough 13,200 10,900 2,300 19
16 Three Rivers 13,100 12,100 1,000 16
17 East Hertfordshire 12,800 11,500 1,300 18
18 Brentwood 12,800 11,700 1,100 17
19 Tandridge 12,500 12,400 100 15
20 Southend-on-Sea 12,400 10,500 1,900 21
21 Watford 11,700 9,300 2,400 23
22 Windsor and Maidenhead 11,100 10,700 400 20
23 Gravesham 10,300 9,800 500 22
24 Dacorum 10,200 9,200 1,000 24 Source: 2011Census table WU01EW

Commuting in London
GLA Intelligence 9
Figure 6: Districts to London
Top areas for commuting out of London
Over half of all commuters out of London, some 151,500, worked in the South East region. A third, 92,400, worked in the East region while a tenth, 27,200, worked in the rest of England and Wales.
Table 3 gives the 19 local authorities that received 5,000 or more commuters from London in 2011, including four that each had flows from London of over 10,000. Dartford received most commuters, 11,700, up 2,100 since 2001. Slough, second with 11,100 was the top destination in 2001. The authorities that showed the biggest increase in commuters were Thurrock (up 2,800 to 8,200) and Epping Forest (up 2,700 to 9,800).

Commuting in London
GLA Intelligence 10
Table 3: Local authorities that received 5,000 or commuters from London in 2011
Rank Local authority 2011 2001 change 2001 rank
1 Dartford 11,700 9,600 2,100 3
2 Slough 11,100 9,700 1,400 1
3 Reigate and Banstead 10,700 8,600 2,100 6
4 Hertsmere 10,300 9,600 700 2
5 Epping Forest 9,800 7,100 2,700 9
6 Elmbridge 9,400 8,600 900 7
7 Spelthorne 9,200 8,700 500 5
8 Thurrock 8,200 5,400 2,800 12
9 Epsom and Ewell 8,000 7,200 800 8
10 Watford 7,900 6,900 1,000 10
11 Runnymede 7,400 6,100 1,300 11
12 Welwyn Hatfield 6,100 3,800 2,400 23
13 Mole Valley 6,100 4,500 1,600 16
14 Crawley 6,000 5,400 600 13
15 Sevenoaks 5,800 5,200 600 14
16 Three Rivers 5,200 4,300 900 19
17 Brentwood 5,200 4,400 700 17
18 Broxbourne 5,100 3,800 1,300 22
19 Basildon 5,100 4,000 1,000 21 Source: 2011Census table WU01EW

Commuting in London
GLA Intelligence 11
Figure 7: London to Districts

Commuting in London
GLA Intelligence 12
Commuting flows by age of commuters
Nearly two-fifths (37 per cent) of commuters from outside the London local authority in which they worked were aged 35 to 49 and a third (33 per cent) were aged 25 to 34, a tenth (10 per cent) were aged 16-24 and only two per cent were aged 65 and over. These proportions were broadly in-line with the workforce age profile for London.
Figure 8: Commuters to London workplaces by age and origin of commute
Source: 2011Census table WU02EW
Figure 8 shows that commuters from outside London were more likely to be aged 35 and over, while within London commuters were more likely to be younger: Forty-four per cent of commuters from outside London were aged 35 to 49 and 23 per cent were aged 25 to 34. For commuters from another local authority within London, 37 per cent were aged 25 to 34 and 34 per cent aged 35 to 49.
0%
15%
30%
45%
16‐24 25‐34 35‐49 50‐64 65+
London Rest of England and Wales

Commuting in London
GLA Intelligence 13
Commuting flows by method of travel to work
The table below gives the mode of transport for all commutes to work a non-home workplace within London. Overall, driving to work was the most popular mode of transport with over one million commuters choosing this method (1.06 million).
Public transport accounted for over two million journeys: Underground (793,000), Trains (780,000) and Buses (494,000). All other modes of transport accounted for 593,000 journeys.
Table 4: Commuter flows into London by mode of transport to work, thousands
Within local authority
Cross borough within London
Originating Outside London
Total
All Commuters 826 2,100 790 3,716
Underground 48 701 43 792
Train 28 395 357 780
Bus 170 301 23 494
Taxi 3 6 1 10
Motorcycle 5 31 9 45
Driving a car 290 448 318 1,056
Passenger in a car 22 26 16 64
Bicycle 35 106 7 148
On foot 224 80 14 318
Other 3 5 2 10Source: 2011Census table WU03EW

Commuting in London
GLA Intelligence 14
For commutes within London local authorities (shown in Figure 9), road transport predominates with 35 per cent of commuters driving and 21 per cent travelling by bus. Over a quarter of journeys to work within the same local authority were on foot.
Figure 9: Commutes within London local authorities by mode of transport (per cent)
Source: 2011Census table WU03EW
Amongst the boroughs, the proportion of commuters who lived in the same local authority who drove to work varied from over half in some outer boroughs (57 per cent in Bexley, 54 per cent in Bromley and 52 per cent in Enfield) to less than one in ten in central boroughs (6 per cent in Westminster, 7 per cent in Camden and 8 per cent in Islington). Bus use was highest in Lambeth (31 per cent) and Southwark (30 per cent). In Hammersmith and Fulham, half of in-borough commuters walked to work, as did two fifths of commuters in Westminster. In the City 87 per cent of resident workers walked to work, reflecting the City of London’s very small size.
0 5 10 15 20 25 30 35 40
Taxi and other
on foot
bicycle
Passenger in car
Driving car
Motorcycle
Bus
Train
Underground

Commuting in London
GLA Intelligence 15
For commutes within London that crossed borough boundaries, the London Underground was the most popular mode of transport accounting for a third of all journeys to work. Driving a car still accounted for a fifth (21 per cent) of journeys, trains for 19 per cent and buses for 14 per cent.
Figure 10: Commutes across local authorities within London by mode of transport (per cent)
Source: 2011Census table WU03EW
The highest proportions of travel by Underground were in Tower Hamlets where 50 per cent of workers resident in London commuted by Underground), Westminster (47 per cent) and Camden (45 per cent). The highest rates for driving to work were for Barking and Dagenham (62 per cent), Bexley (58 per cent) and Hillingdon (55 per cent).
0 5 10 15 20 25 30 35
Taxi and other
on foot
bicycle
Passenger in car
Driving car
Motorcycle
Bus
Train
Underground

Commuting in London
GLA Intelligence 16
The majority of commuters travelling from outside London used either Trains (45 per cent) or drove a car (40 per cent).
Figure 11: Commutes to London from outside London by mode of transport (per cent)
Source: 2011Census table WU03EW
Over four fifths of workers in the City who commuted from outside London did so by Train (81 per cent), as did seven out of ten workers in Camden (71 per cent), Westminster (70 per cent) and Southwark (68 per cent). Commuting by car was more common in outer London, accounting for four fifths of journeys in Hillingdon (85 per cent), Barking and Dagenham, Bexley and Havering (all 82 per cent).
0 10 20 30 40 50
Taxi and other
on foot
bicycle
Passenger in car
Driving car
Motorcycle
Bus
Train
Underground

Commuting in London
GLA Intelligence 17
Canary Wharf
In 2011 103,900 people worked in Canary Wharf (for the purposes of this summary Canary Wharf is defined as Tower Hamlets MSOA 33). Out of that total 103,500, or 99.6 per cent, lived in England & Wales while the other 400 commuted from elsewhere in the UK. This report is concerned only with the 103,500 workers who were resident in England & Wales at the time of the census. Of those, three quarters (74 per cent or 76,300) were resident in London while the remaining 27,200 commuted into Canary Wharf from outside London.
Figure 12: Residence of Canary Wharf workers, London, 2011
Source: 2011 Census table WU01EW
Within London Londoners working in Canary Wharf were more likely to live in inner London than outer London. Six in ten (45,300) lived in inner London, and four in ten (31,000) in outer. As expected then, the top five with the largest populations of Canary Wharf workers were found in inner London. A large proportion of Londoners
0 2,000 4,000 6,000 8,000 10,000 12,000
Tower Hamlets
Southwark
Wandsworth
Greenwich
Westminster
Newham
Lewisham
Redbridge
Kensington and Chelsea
Bromley
Lambeth
Camden
Havering
Islington
Bexley
Croydon
Hammersmith and Fulham
Barnet
Hackney
Merton
Richmond upon Thames
Waltham Forest
Brent
Harrow
Barking and Dagenham
Haringey
Enfield
Ealing
Kingston upon Thames
Hounslow
Sutton
Hillingdon
City of London

Commuting in London
GLA Intelligence 18
working in Canary Wharf travelled either from within Tower Hamlets or from neighbouring boroughs. Over 10,000 lived in Tower Hamlets (13 per cent of all Canary Wharf workers). The boroughs of Southwark, Wandsworth, Greenwich, Westminster and Newham all had between 3,700 and 4,500 residents working in Canary Wharf (five to six per cent of the London total for each).
Outside London
The quarter of Canary Wharf workers (27,300) who were resident outside of London were overwhelming found in either the South East region (46 per cent of the total) or the East of England region (47 per cent of the total). Together these two areas accounted for 93 per cent of all outside London workers in Canary Wharf.
All other regions in England & Wales held a share of two per cent or less of the total working in Canary Wharf but living outside London population.
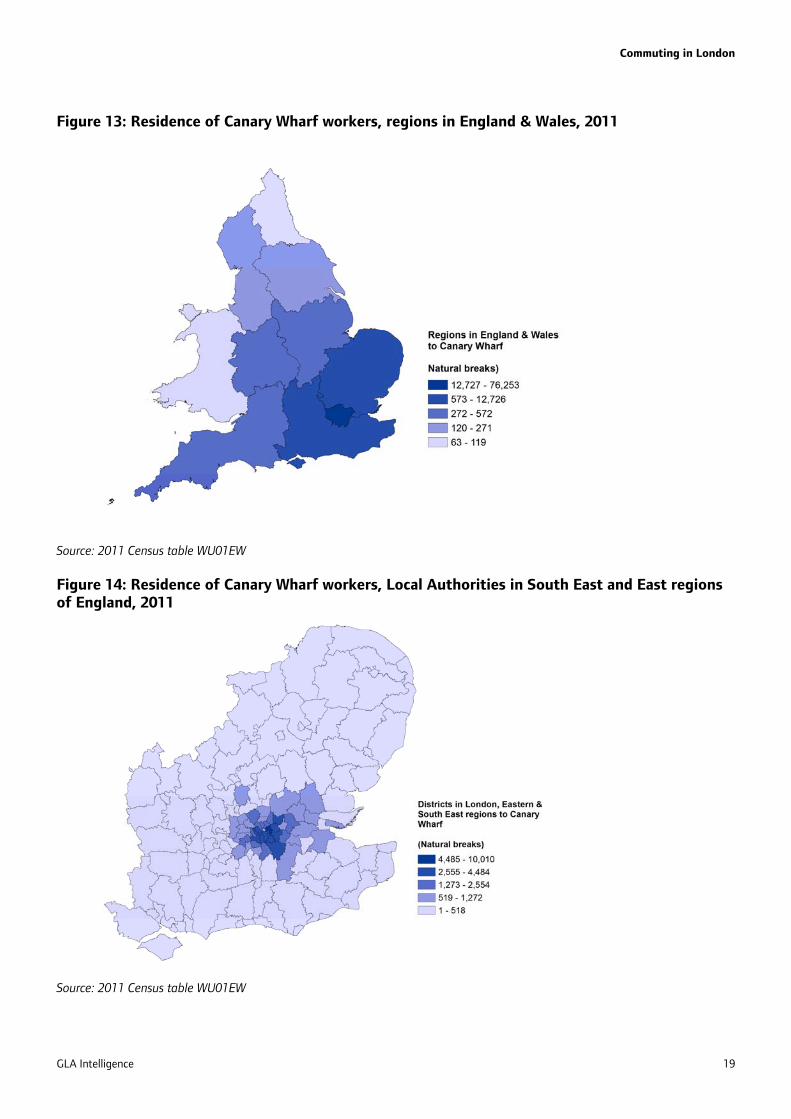
A total of 25,200 people commuted from the South East and East of England to work in Canary Wharf in 2011. Of all counties in these regions, Essex held the highest number of Canary Wharf workers; one quarter of all workers from these regions were resident in Essex (24 per cent). Kent and Surrey were joint second, each holding a 14 per cent share, closely followed by Hertfordshire at 11 per cent. All other South East and East of England counties (of which there are 26) held shares of four per cent or less.
Table 5 shows the number of Canary Wharf workers that live in each county or unitary authority in the South East and East of England, ranked from the highest to the lowest number of people. The unitary authorities that have been included here do not fit into any specific county, but are situated in the South East or East regions. A column has also been included at the bottom of the table to show the number of people coming from all other regions.
Commuting in London
GLA Intelligence 19
Figure 13: Residence of Canary Wharf workers, regions in England & Wales, 2011
Source: 2011 Census table WU01EW Figure 14: Residence of Canary Wharf workers, Local Authorities in South East and East regions of England, 2011
Source: 2011 Census table WU01EW

Commuting in London
GLA Intelligence 20
Table 5: The number and percentage of people living outside London working in Canary Wharf by county and unitary authority, 2011
County Region Number Percentage
Essex East of England 6,500 24%
Kent South East 3,800 14%
Surrey South East 3,700 14%
Hertfordshire East of England 3,000 11%
Thurrock East of England 1,000 4%
Southend-on-Sea East of England 940 3%
Hampshire South East 940 3%
West Sussex South East 800 3%
Buckinghamshire South East 680 2%
Medway South East 650 2%
East Sussex South East 430 2%
Cambridgeshire East of England 340 1%
Central Bedfordshire East of England 270 1%
Suffolk East of England 260 1%
Brighton and Hove South East 230 1%
Milton Keynes South East 220 1%
Oxfordshire South East 210 1%
Windsor and Maidenhead South East 210 1%
Luton East of England 160 1%
Wokingham South East 140 1%
Reading South East 130 0%
Slough South East 120 0%
Bedford East of England 110 0%
Norfolk East of England 90 0%
Bracknell Forest South East 80 0%
Peterborough East of England 70 0%
West Berkshire South East 60 0%
Southampton South East 50 0%
Portsmouth South East 20 0%
Isle of Wight South East 10 0%
Other Regions Any other region 2,100 8%
Total - 27,300 100% Source: 2011 Census table WU01EW The four counties with the highest amount of residents working in Canary Wharf (Essex, Kent, Surrey and Hertfordshire) contain together 45 local authorities. Epping Forest (1,200), Basildon (1,100) and Chelmsford (960) had the highest number of people; all of which are located in Essex. Other local authorities with high numbers were Sevenoaks (Kent, 880), Elbridge (Surrey, 840) and Brentwood (Essex, 790).

Commuting in London
GLA Intelligence 21
Figure 15: Canary Wharf workers by local authority residence, South East and East regions, 2011
Source: 2011 Census table WU01EW
‐ 200 400 600 800 1,000 1,200 1,400
Epping Forest
Basildon
Chelmsford
Sevenoaks
Elmbridge
Brentwood
St Albans
Dartford
Tunbridge Wells
East Hertfordshire
Reigate and Banstead
Rochford
Woking
Tonbridge and Malling
Castle Point
Braintree
Colchester
Gravesham
Hertsmere
Tandridge
Guildford
Maidstone
Waverley
Epsom and Ewell
Uttlesford
Broxbourne
North Hertfordshire
Three Rivers
Dacorum
Welwyn Hatfield
Mole Valley
Swale
Ashford
Harlow
Watford
Maldon
Spelthorne
Runnymede
Surrey Heath
Tendring
Stevenage
Canterbury
Shepway
Thanet
Dover

Commuting in London
GLA Intelligence 22
The City of London
There were 356,500 people living in England & Wales working in the City of London in 2011. The majority of those, seven in ten people (244,300 or 69 per cent) were residents of London. Those living in the East of England accounted for 16 per cent (55,700) of the total and their South East counterparts slightly less, at 14 per cent (48,400). No other region accounted for more than one per cent of the total.
Within London London residents working in City of London were more likely to live in inner London (58 per cent or 141,100) than outer London (42 per cent or 103,200). Figure 16: Residence of City of London workers, London, 2011
‐ 2,000 4,000 6,000 8,000 10,000 12,000 14,000 16,000 18,000
Wandsworth
Tower Hamlets
Southwark
Westminster
Lambeth
Islington
Kensington and Chelsea
Bromley
Camden
Hammersmith and Fulham
Redbridge
Barnet
Hackney
Lewisham
Havering
Greenwich
Newham
Merton
Croydon
Haringey
Bexley
Waltham Forest
Richmond upon Thames
Ealing
Enfield
Brent
Harrow
Kingston upon Thames
Hounslow
Barking and Dagenham
Sutton
Hillingdon
City of London

Commuting in London
GLA Intelligence 23
Source: 2011 Census table WU01EW Wandsworth was the London borough with the highest number of City workers, at 17,000 (seven per cent of the total). The number of people living in Tower Hamlets working in City was also very high, at 15,000; 5,000 residents more than the number working in Canary Wharf.
Most boroughs holding high shares in the total number of Londoners working in City were in inner London. These included Southwark (13,300), Westminster (12,700), Lambeth (12,700) and Islington (11,700), each holding around a one in twenty share.
City of London was the borough with the lowest number of people working in the City of London, with just 1,500 City residents working there (one per cent of all City workers). However, because the resident population of the City of London is so small (just 6,800 aged 16 and over) the 1,500 who both lived and worked in the City accounted for 22 per cent of the resident population.
Outside London There were 104,100 residents of the South East and East of England regions working in the City of London in 2011. Of all non-London residents working in City, 43 per cent (48,400) lived in the South East and 50 per cent (55,700) in the East of England, with a combined share of 93 per cent. Essex in the South East region was the county with by far the highest proportion of residents working in the City of London, holding a share of one quarter of all of those commuting from outside London (26,700 workers). Hertfordshire (14,800), Surrey (14,200) and Kent (13,400) were the counties with the next highest number of City workers, each holding 13 to 14 per cent of the total. All other counties in these regions held shares of less than five per cent.

Commuting in London
GLA Intelligence 24
Figure 17: Residence of City workers, regions in England & Wales, 2011
Source: 2011 Census table WU01EW Figure 18: Residence of City workers, Local Authorities in South East and East regions of England, 2011
Source: 2011 Census table WU01EW

Commuting in London
GLA Intelligence 25
Table 6: The number and percentage of people living outside London working in City of London by county and unitary authority, 2011 County Region Number Percentage
Essex East of England 26,700 24%
Hertfordshire East of England 14,800 13%
Surrey South East 14,200 13%
Kent South East 13,400 12%
Southend-on-Sea East of England 3,900 3%
West Sussex South East 3,700 3%
Thurrock East of England 3,400 3%
Hampshire South East 3,300 3%
Buckinghamshire South East 3,000 3%
Medway South East 2,400 2%
East Sussex South East 2,000 2%
Suffolk East of England 1,800 2%
Cambridgeshire East of England 1,600 1%
Central Bedfordshire East of England 1,400 1%
Oxfordshire South East 1,200 1%
Brighton and Hove South East 1,100 1%
Windsor and Maidenhead South East 870 1%
Milton Keynes South East 710 1%
Luton East of England 680 1%
Wokingham South East 620 1%
Bedford East of England 570 1%
Reading South East 550 0%
Norfolk East of England 530 0%
West Berkshire South East 420 0%
Slough South East 420 0%
Bracknell Forest South East 280 0%
Peterborough East of England 280 0%
Southampton South East 130 0%
Portsmouth South East 110 0%
Isle of Wight South East 80 0%
All other regions All other regions 8,100 7%
Total - 112,200 100% Source: 2011 Census table WU01EW

Commuting in London
GLA Intelligence 26
Figure 19: City workers by local authority residence, South East and East regions, 2011
Source: 2011 Census table WU01EW
‐ 500 1,000 1,500 2,000 2,500 3,000 3,500 4,000 4,500 5,000
Basildon
Chelmsford
Epping Forest
St Albans
Elmbridge
Brentwood
Sevenoaks
East Hertfordshire
Rochford
Tunbridge Wells
Braintree
Castle Point
Reigate and Banstead
Colchester
Tonbridge and Malling
Dartford
Broxbourne
Tandridge
Hertsmere
Guildford
Woking
Waverley
Uttlesford
Epsom and Ewell
North Hertfordshire
Gravesham
Maidstone
Dacorum
Welwyn Hatfield
Three Rivers
Watford
Mole Valley
Maldon
Swale
Ashford
Harlow
Tendring
Spelthorne
Surrey Heath
Runnymede
Canterbury
Stevenage
Shepway
Thanet
Dover

Commuting in London
GLA Intelligence 27
Figure 19 shows all local authorities in the four counties with the highest numbers of residents working in Westminster (as above) and the numbers of residents living in each that travelled to the City of London for work in 2011.Three of the four local authorities with the highest number of workers in the City of London were in Essex. These were Basildon (4,600), Chelmsford (4,100) and Epping Forest (3,700). Other local authorities in high proportions were St Albans in Hertfordshire with 3,500 residents working in Westminster, and Elmbridge in Surrey, with 3,100. All other local authorities had up to 3,000 residents working in City in 2011.

Commuting in London
GLA Intelligence 28
Westminster
There were 558,900 residents of England and Wales working in Westminster in 2011. Almost eight in ten (77 per cent or 431,600) were residents of London. Those living in the South East region accounted for 12 per cent of the total (68,100), and in the East of England eight per cent (42,200). All other regions held no more than one per cent of the total share of Westminster workers.
Within London There were 431,600 residents of London working in Westminster, and six in ten (59 per cent) of them lived in inner London, while the other four in ten (41 per cent) in outer; similar to the proportions working in Canary Wharf and City.
People working in Westminster living within London were most likely to be resident in Westminster itself, at eight per cent of the total (34,800). All boroughs with high amounts of residents commuting to Westminster for work were either bordering or very near to bordering Westminster. Boroughs holding almost equally high numbers of Westminster workers as were Wandsworth with 29,100 and Lambeth, with 29,000 (both seven per cent). Also in high proportions were Southwark (20,800) and Camden (19,900), both with a share of five per cent of the total Westminster workers resident in London. All other boroughs held less than five per cent shares.
Outside London There were 127,300 Westminster workers living outside of London, making up 23 per cent of the total workers in the borough. In Canary Wharf and City of London similar proportions come from the East and South East of England. However, Westminster workers were much more likely to commute from the South East than the East of England. Over half of those working in Westminster living outside London (53 per cent or 68,100) commuted from the South East region while a third (33 per cent or 42,200) came from the East region. Four per cent (5,100) travelled from the South West to work in Westminster, and three per cent (3,900) from the East Midlands. All other regions held shares few than three percent of the total Westminster workers living outside London.
Table 7 shows the numbers and percentages of people travelling to Westminster from each country and unitary authority in the South East and East of England. All other regions have been combined to form one total ‘all other regions’.

Commuting in London
GLA Intelligence 29
Figure 20: Residence of Westminster workers, London, 2011
Source: 2011 Census table WU01EW
0 5,000 10,000 15,000 20,000 25,000 30,000 35,000 40,000
Westminster
Wandsworth
Lambeth
Southwark
Camden
Brent
Hammersmith and Fulham
Kensington and Chelsea
Barnet
Islington
Haringey
Lewisham
Tower Hamlets
Ealing
Hackney
Bromley
Newham
Croydon
Waltham Forest
Merton
Greenwich
Richmond upon Thames
Redbridge
Enfield
Harrow
Hounslow
Bexley
Kingston upon Thames
Hillingdon
Sutton
Havering
Barking and Dagenham
City of London

Commuting in London
GLA Intelligence 30
Figure 21: Residence of City workers, regions in England & Wales, 2011
Source: 2011 Census table WU01EW Figure 22: Residence of City workers, Local Authorities in South East and East regions of England, 2011
Source: 2011 Census table WU01EW

Commuting in London
GLA Intelligence 31
Table 7: Westminster workers by county and unitary authority, 2011
County Region Number Percentage
Surrey South East 19,300 15%
Hertfordshire East of England 18,300 14%
Kent South East 13,700 11%
Essex East of England 12,400 10%
Buckinghamshire South East 6,500 5%
Hampshire South East 5,200 4%
West Sussex South East 4,500 4%
Oxfordshire South East 2,800 2%
Medway South East 2,700 2%
East Sussex South East 2,400 2%
Cambridgeshire East of England 2,400 2%
Brighton and Hove South East 2,300 2%
Windsor and Maidenhead South East 2,000 2%
Central Bedfordshire East of England 1,900 2%
Thurrock East of England 1,800 1%
Southend-on-Sea East of England 1,500 1%
Milton Keynes South East 1,400 1%
Reading South East 1,100 1%
Luton East of England 1,100 1%
Slough South East 1,000 1%
Wokingham South East 1,100 1%
Suffolk East of England 1,000 1%
West Berkshire South East 840 1%
Bedford East of England 740 1%
Norfolk East of England 600 0%
Bracknell Forest South East 580 0%
Peterborough East of England 390 0%
Portsmouth South East 290 0%
Southampton South East 280 0%
Isle of Wight South East 130 0%
All other regions All other regions 17,100 13%
Grand Total - 127,300 100%
Source: 2011 Census table WU01EW
Of all counties outside of London, Surrey had the highest number of people working in Westminster at 19,300 or 15 per cent of all non-London residents. Hertfordshire closely followed Surrey, holding a 14 per cent share with 18,300 of its residents working in Westminster. Just over one in ten Westminster workers living outside London lived in Kent (11 per cent or 13,700), and one in ten were residents of Essex (10 per cent or 112,400).
The county with the next highest number of residents working in Westminster was Buckinghamshire, which held proportions half the size of Essex at five per cent (6,500). All counties other than the four in the highest proportions held a combined share of 13 per cent of the total non-London resident Westminster workers.

Commuting in London
GLA Intelligence 32
There were 63,700 people working in Westminster that were resident in Surrey, Hertfordshire, Kent or Essex in 2011. Figure 23 shows the numbers and proportions all local authorities in these counties held in the total workers in Westminster.
The local authority with the highest number of residents commuting to Westminster was Elmbridge in Surrey, at 3,900 people. St Albans (Hertfordshire) and Epping Forest (Essex) also had high numbers commuting to Westminster, at 3,170 and 2,900 respectively, as did Sevenoaks (2,500, Kent) and Reigate and Banstead (combined, 2,400, Surrey).

Commuting in London
GLA Intelligence 33
Figure 23: City workers by local authority residence, South East and East regions, 2011
Source: 2011 Census table WU01EW
‐ 500 1,000 1,500 2,000 2,500 3,000 3,500 4,000 4,500
Elmbridge
St Albans
Epping Forest
Sevenoaks
Reigate and Banstead
Hertsmere
Dartford
Dacorum
Three Rivers
East Hertfordshire
Epsom and Ewell
Woking
Tunbridge Wells
Guildford
Basildon
Tonbridge and Malling
Watford
Tandridge
North Hertfordshire
Waverley
Chelmsford
Welwyn Hatfield
Mole Valley
Gravesham
Broxbourne
Brentwood
Maidstone
Spelthorne
Runnymede
Swale
Colchester
Braintree
Rochford
Ashford
Surrey Heath
Uttlesford
Castle Point
Stevenage
Harlow
Canterbury
Tendring
Maldon
Shepway
Thanet
Dover

Commuting in London
GLA Intelligence 34
Age cohorts
The following analysis breaks down commuting data by age, and aims to identify any patterns, trends or relationships between age, place of residence (inner London, outer London or outside London) and place of employment (Canary Wharf, City of London and Westminster). As with the other data, only residents of England & Wales aged 16 and over are included.
Canary Wharf Of all residents of England & Wales working in Canary Wharf in 2011, almost half (48 per cent) were aged 25-34. Three in ten (30 per cent) were aged 34-49, while the age groups 16-24 and 50-64 each held around a one in ten share (11 per cent and 10 per cent respectively). Figure 24 shows this age breakdown for people resident in inner London, outer London and outside London in 2011.
Figure 24: Canary Wharf workers by age, residence in inner London, outer London and outside London, 2011
Source: 2011 Census table WU01EW
Over half of people working Canary Wharf and living in inner London (53 per cent) were aged 25 to 34, and just under a third (31 per cent) were aged 35 to 49. One in ten were in the lowest age group (16-24), and one in twenty were aged 50 to 64.
As with the average and those living in inner London, the majority of the residents of outer London were aged between 25 and 49 years. However, compared with inner London, the population was older. Over four in ten (42 per cent or 13,200) outer London residents working in Canary Wharf were aged 35 to 49; 11 percentage points higher than the share this age group held in the inner London group.
0%
10%
20%
30%
40%
50%
60%
Aged 16‐24 Aged 25‐34 Aged 35‐49 Aged 50‐64 Aged 65+
Outside London Inner London Outer London

Commuting in London
GLA Intelligence 35
Outer London also had double the share of residents in the higher age band 50 to 64 than inner London, at one in ten (11 per cent) compared with one in twenty for inner London. Given that outer London had a higher share of older people working in Canary Wharf, there was a lower proportion of outer London residents aged 24-34 working in this area than their inner London resident counterparts, at 39 per cent compared with 53 per cent respectively.
The age of Canary Wharf workers living outside of London was much older than those resident in inner or outer London. Over half of all those commuting to Canary Wharf from outside London were aged 35-49 (53 per cent), and those aged 50 to 64 held a share three times the size the same age group held living in inner London, at 16 per cent. Just three in ten (30 per cent) of Canary Wharf workers living outside London were aged 16 to 34, a share 16 percentage points smaller than their outer London counterparts (46 per cent), and under half the size of the share held by inner London residents (63 per cent).
The City of London The City of London had the highest share of workers in the older age groups of the three areas. Almost half of its population of workers were aged 35 to 49 (47 per cent), and one in five (20 per cent) were aged 50 to 64. Just 24 per cent were aged 25 to 34; half the proportion Canary Wharf held. Figure 25 shows this age breakdown for people resident in inner London, outer London and outside London in 2011.
Figure 25: City of London workers by age, residence in inner London, outer London and outside London, 2011
Source: 2011 Census table WU01EW
0%
10%
20%
30%
40%
50%
60%
Aged 16‐24 Aged 25‐34 Aged 35‐49 Aged 50‐64 Aged 65+
Outside London Inner London Outer London

Commuting in London
GLA Intelligence 36
Those living in inner London commuting to City were much more likely than average to be of a younger age. On average, one in four City workers were aged 25 to 34, however, over half of those commuting from inner London were of this age, at 52 per cent (73,000). The share of those living in inner London working in City aged 50 to 64 was under half the average, at just eight per cent.
Out of those living in outer London and working in City of London, four in ten (40 per cent) were aged 35 to 49; a ten percentage point higher share than their inner London held. There was also much higher proportions of this group aged 50 to 64 than their inner London equivalents, at 14 per cent. Due to the higher shares the older age groups held, the share of outer London residents aged 16 to 34 working in City was much lower.
Like those living in outer and unlike those in inner London, City workers resident outside of London were most likely to be aged 35 to 49, with a share of half (49 per cent or 54,500). This group of City workers were generally older than those from London, with one in five (19 per cent or 21,500) aged 50 to 64. Three in ten City workers living outside of London were aged 16 to 34; the smallest share by far of the three areas (inner London 61 per cent, outer London 44 per cent).
Westminster Out of the three areas, Westminster had the most even spread across age cohorts. There were almost even proportions of Westminster workers aged 25 to 34 and 35 to 49, at 35 per cent and 38 per cent respectively. 48,100 (15 per cent) were aged 50 to 64, and one in ten aged 16 to 24. Figure 26 shows this age breakdown for people resident in inner London, outer London and outside London in 2011.
Figure 26: City of London workers by age, residence in inner London, outer London and outside London, 2011
0%
5%
10%
15%
20%
25%
30%
35%
40%
45%
50%
Aged 16‐24 Aged 25‐34 Aged 35‐49 Aged 50‐64 Aged 65+Outside London Inner London

Commuting in London
GLA Intelligence 37
Source: 2011 Census table WU01EW
As with the other work areas, those working in Westminster and living in inner London were most likely to be 25-34, holding a share of 45 per cent. Three in ten (30 per cent) were aged 35 to 49, and there were almost equal proportions of Westminster workers commuting from inner London aged 16 to 24 as there were aged 50 to 64 (12 per cent and 11 per cent respectively).
Those living in outer London working and in Westminster were more likely to be older than their inner London counterparts. The proportion of Westminster workers from outer London aged 25 to 34 was almost as high as that for those aged 35 to 49, at 34 per cent and 37 per cent respectively. The proportion aged 50 to 64 was much higher than those of the same age held from inner London, at 17 per cent.
As with the other work areas, those living outside of London working in Westminster were more likely to be older than their London-resident counterparts. One quarter (24 per cent) of all Westminster workers living outside London were aged 50 and over. This proportion was just one fifth for those living in outer London (19 per cent) and ten percentage points less than those commuting from outside London for inner London residents (13 per cent).The age group holding the largest share was those aged 35 to 44, with 44 per cent (55,500) of Westminster workers living outside London of this age group in 2011. One quarter (24 per cent) were aged 25 to 34; 21 percentage points lower than the share their inner London equivalents held.

Commuting in London
GLA Intelligence 38
Method of travel
The census only records one method of travel for each person. Therefore individuals who use more than one of method of travel must state the method which covers the largest distance. Where this section refers to ‘Underground’ as a method of travel this includes metro, light rail or tram.
Canary Wharf Figure 27: Canary Wharf workers’ method of travel to work
Source: 2011 Census table WU03EW
While train (66 per cent) was the most common form of transport for those commuting to Canary wharf from outside London, the second most popular method of travel was by car (16 per cent). This contrasts with City and Westminster workers who commuted from outside London where seven per cent and 13 per cent respectively travelled by car. A further ten per cent travelled by Underground, metro, light rail or tram. Almost half of those who travelled in to Canary Wharf from outer London went by Underground (49 per cent). Just over a third travelled by train (35 per cent). Again the proportion who drove to work was higher for Canary Wharf than for City or Westminster (nine per cent, four per cent and seven per cent). Those who lived in inner London tended to either take the Underground (63 per cent) or walk (11 per cent). Almost as many people drove from inner London (five per cent) as took a train (seven per cent) or bus (six per cent).
0% 20% 40% 60% 80%
Underground, metro, light rail or tram
Train
Bus, minibus or coach
Taxi
Motorcycle, scooter or moped
Driving a car or van
Passenger in a car or van
Bicycle
On foot
Other method of travel to work
Outer London Inner London Outside London

Commuting in London
GLA Intelligence 39
City of London
Figure 28: City workers’ method of travel to work
Source: 2011 Census table WU03EW
Those workers who travelled from outside London overwhelming travelled by train (81 per cent). A further seven per cent identified their main method of travel as Underground and the same proportion who drove to work. Over one thousand people who lived outside London and worked in the City recorded their main method of travel as ‘by foot’.
Workers who lived in outer London mostly travelled by train (52 per cent). Another 37 per cent travelled by Underground meaning that in total 89 per cent of residents of outer London used one of these two methods. Driving a car was less popular than for the out-of-Londoners (four per cent compared to seven) while bus, taxi and foot all had the same proportions in the two areas.
Those living in inner London had very different travel to work habits. The largest group here was those travelling by Underground (48 per cent) while 15 per cent travelled by train and 13 per cent by bus. A significant ten per cent walked to work while eight per cent cycled (four times the percentage who cycled from outer London).
0% 20% 40% 60% 80% 100%
Underground, metro, light rail or tram
Train
Bus, minibus or coach
Taxi
Motorcycle, scooter or moped
Driving a car or van
Passenger in a car or van
Bicycle
On foot
Other method of travel to work
Outer London Inner London Outside London

Commuting in London
GLA Intelligence 40
Westminster Figure 29: Westminster workers’ method of travel to work
Source: 2011 Census table WU03EW
People who worked in Westminster but lived outside London primarily travelled to work by train (70 per cent), as may be expected. A high number (13 per cent) also travelled by car. Those whose main method of travel was Underground accounted for nine per cent of the total. A surprising two per cent (2,300) people said their main method of travel was by foot.
Those workers who came to Westminster from outer London travelled by Underground (46 per cent) or train (34 per cent). The same proportion either drove or took the bus, at seven per cent for each. Less people walked to work from outer London (one per cent, 1,500 people) than from outside London.
A similar proportion of those who lived in inner London travelled by tube to Westminster as those who lived in outer London (44 per cent and 46 per cent). Almost a fifth (19 per cent) took the bus while 11 per cent took the train and ten per cent walked. A total of nine per cent or 21,700 people cycled to their jobs in Westminster while half as many (four per cent) drove.
0% 20% 40% 60% 80%
Underground, metro, light rail or tram
Train
Bus, minibus or coach
Taxi
Motorcycle, scooter or moped
Driving a car or van
Passenger in a car or van
Bicycle
On foot
Other method of travel to work
Outer London Inner London Outside London
For more information please contact Richard Cameron or Emma White, GLA Intelligence Greater London Authority, City Hall, The Queen’s Walk, More London, London SE1 2AA Tel: 0207 983 4473 e-mail: [email protected] Copyright © Greater London Authority, 2014