Working Paper No. 590 Determining Gender Equity in Fiscal ...

Commitment to Equity for Children (CEQ4C): Fiscal Policy, Multidimensional Poverty,
and Equity in Uganda
Jose Cuesta, Jon Jellema, Yekaterina Chzhen and Lucia Ferrone
UNICEF Office of Research | Innocenti Working Paper
WP-2018-03 | April 2018
Commitment to Equity for Children, CEQ4C: Fiscal Policy, Multidimensional Poverty, and Equity in Uganda
Jose Cuesta,1 Jon Jellema,2 Yekaterina Chzhen1 and Lucia Ferrone1
(1) UNICEF Office of Research, Florence
(2) Commitment to Equity Institute, University of Tulane, New Orleans
April 2018 This Innocenti Working Paper has been published without undergoing layout, copy-editing or proofreading. It is being released to rapidly share results of our work with the wider research and practitioner communities, and to encourage discussion of methods and findings. Abstract: Fiscal incidence analysis is the most widely used methodology to assess the distributional effects of fiscal policies. However, for 40 years, it has lacked a child lens. A child focus on the redistributive capacity of fiscal policy is increasingly important due to the disproportionate incidence of poverty among children globally. This paper provides a child-dedicated focus on fiscal incidence analysis by tracking child-relevant benefits, turning children the unit of analysis, and using multidimensional child poverty metrics. The analysis—Commitment to Equity for Children, or CEQ4C—integrates three analytical frameworks, namely, public finance, fiscal incidence analysis, and multidimensional child poverty analysis. The paper develops a proof of concept for Uganda that includes measurement, diagnostics, and a policy simulation package replicable across diverse contexts. The proof of concept confirms that CEQ4C provides a higher-resolution fiscal incidence analysis for children than the traditional fiscal incidence analysis. Key words: Fiscal incidence analysis, child poverty, equity, fiscal reforms, Uganda JEL Codes: H23, I32 The authors thank Jose Antonio Alonso, Zlata Bruckauf, Jingqing Chai, Gabriela Inchauste, Estuardo Moran, Tia Palermo, Alberto Posso, Maria Ana Lugo, Nora Lustig, Stephen Smith, Emilia Toczydlowska, Stephen Younger, and participants in workshops held in Florence, Madrid, New York and Washington DC for useful comments and suggestions to earlier versions of this work. Remaining errors are the sole responsibility of the authors.
Commitment to Equity for Children, CEQ4C:
Fiscal Policy, Multidimensional Poverty, and Equity in Uganda
1. Introduction
The body of evidence on interventions that successfully address deprivations and inequalities in child well-being is growing. Investments in early childhood development, the rising quality of education, universal health care, cash transfers, and childcare protection against violence are some of many interventions shown to reduce poverty, inequality and inequity (Berlinksi and Schady 2015; Davis et al. 2016; World Bank 2016a). It follows that the composition and scale of these interventions in government programs determine their success in addressing child deprivations. Also, financing those expenditures has distributional consequences. Whether governments rely on often-progressive income taxes or often-regressive value added taxes (VATs) or introduce property or inheritance taxes rather than user fees has distinctive distributional effects (World Bank 2016b).1 The analysis of the impacts of public spending and revenue collection on poverty and inequality is not new. It dates to the 1970s (Chenery et al. 1974, Wulf 1975, Meerman 1979, and Selowsky 1979). But fiscal incidence analyses in the last 40 years lack a specific focus on children’s well-being other than considering the incidence of education spending or child grants.2 This omission is important for three reasons. First, the traditional focus on income, consumption, or wealth often misses the true status of children’s well-being (Gordon et al. 2003, Alkire and Santos 2013). As reported below, the incidence of monetary poverty among children in Uganda, 22 percent, starkly contrasts with the incidence of multidimensional child poverty, 83 percent. Second, spending that can be easily associated with children, for instance, education, is often mixed with spending that is not specific to children, for instance, universal health care programs. This does not allow a precise, high-resolution assessment of the incidence of spending on children. Third, a child focus on the redistributive capacity of fiscal policy is increasingly important in the face of renewed attention to inequality worldwide and the new Sustainable Development Goals (SDGs) era of child-specific universal mandates. This paper provides a child-specific lens on the equity analysis of public finance by broadening one of the most thorough applications of the traditional fiscal incidence analysis, the Commitment to Equity (CEQ) Assessment (Lustig et al. 2012, Lustig 2018). The resulting framework, Commitment to Equity for Children (CEQ4C), contributes to the fiscal incidence literature in three distinctive ways. First, it identifies child-relevant benefits from others not impacting children; ensures children are the unit of analysis; and uses multidimensional child poverty metrics. Second, it integrates three separate analytical frameworks: public finance, child poverty measurement, and fiscal incidence analysis. Third, it builds a protocol that includes measurement, diagnostics, and a policy simulation package that can be replicated across diverse contexts and the child’s life cycle. Section 2 introduces CEQ assessments and their child-focused extension, CEQ4C. Section 3 applies CEQ4C to a country, Uganda, reporting the main findings of what constitutes a proof of concept of the
1 This is more the case during periods of crisis. For instance, fiscal measures in Greece to confront the recent financial crisis included progressive features such as eliminating the 13th and 14th extra monthly salaries for high-income earners as well as regressive features like VAT increases disproportionally affecting the poorest households (Avram, Levy, and Sutherland 2014). 2 Key analytical developments emerge also from the work by Derviş, de Melo, and Robinson (1982), van de Walle and Nead (1995), Shah (2003), Bourguignon, Ferreira, and Leite (2003), Bourguignon and Pereira da Silva (2003), Löfgren (2004), Martinez-Vazquez (2008), Moreno-Dodson and Wodon (2008), Cuesta and Ponce (2007), Bastagli, Coady, and Gupta (2012), Lustig et al. (2012), IMF (2014), Cuesta (2014), Avram, Levy, and Sutherland (2014), to cite some of the most influential studies.

expanded fiscal incidence analysis. Section 4 concludes and identifies next steps for this enhanced analytical framework.
2. Fiscal incidence analysis with a child lens Fiscal incidence analysis estimates how much and through which channels public expenditure is received, as well as how large is the burden from public revenue collections, by a group or groups in society. Incidence analyses also capture how progressively or regressively public benefits and fiscal burdens are distributed, that is, how the share of benefits and burdens decreases or increases with welfare levels. Furthermore, fiscal incidence analysis addresses the capacity of taxes and expenditures to affect the current distribution of incomes and, ultimately, poverty and inequality. Methodologically, this analysis follows three basic steps (van de Walle 1996): first, it approximates the value to consumers of a public service or the liability with which a taxpayer is burdened—usually equated with the cost of providing the service and the net payment incurred by the taxpayer; second, it ranks the beneficiaries and tax bearers according to some agreed measure of welfare distributed across the entire population, typically income; and third, it assigns the provision or use of the public service across the welfare distribution to compute the shares of the services that are allocated to various segments of the population and the statutory burden of taxes. Typically, the unit of analysis is the representative household by quintile or decile of income (on a per capita basis).3 There are caveats, of course: fiscal incidence says little about the mechanism generating a distribution of incomes, benefits, or burdens. For example, fiscal incidence reports rarely provide information about how a certain program or policy influences the behavior of beneficiaries (relative to nonbeneficiaries). Incidence analysis rests on strong operational assumptions: benefits received by individuals are usually assumed to be equivalent to the public costs of public provision; individuals value identically both transfers received and taxes taken; and, frequently (though not always), there is a total pass-through of the taxes remitted by producers to the prices paid by consumer. These assumptions may create several biases. It is likely, for example, that the poor attend lower-quality schools and health care facilities and therefore receive lower effective benefits from schooling or health care services. The Commitment to Equity (CEQ) Assessment, developed by Lustig et al. (2012), Inchauste and Lustig (2017), and Lustig (2018), is one of the most comprehensive applications of fiscal incidence analysis.4 The core building block of CEQ is the definition and construction of actual and counterfactual income concepts that include market (or prefiscal) income that includes only returns from non-public market or non-market activities to various measures of postfiscal income that include taxes and transfers originating in the public sector. For example, after constructing a value for the market income of a household, disposable income is obtained by subtracting direct personal
3 CEQ assessments have been or are being conducted in nearly 100 countries globally, covering 80 percent of the world’s poor, thus far. A main advantage of incidence analysis is the simple and powerful policy message it produces nationally and internationally. A recent assessment on Tanzania concludes that social expenditures have done relatively little to redistribute income and reduce poverty, while taxes have narrowed inequality (with direct taxes well targeted to high incomes), but have not affected poverty in aggregate (Younger, Myamba, and Mdadila 2016). 4 Several techniques have been developed to operationalize the fiscal incidence analysis, with different degrees of complexity and different limitations, data demands, and analytical objectives. The techniques include tax-benefit microsimulation models, such as Euromod (Atkinson et al. 2002, Lelkes 2007) or LATAX, a multicountry tax microsimulation model housed at the Institute of Fiscal Studies (Abramovsky and Phillips 2015); dedicated general equilibrium models, such as Maquettes for Millennium Development Goal (MDG) simulations (MAMs); and efficiency analysis of budgets along geographical lines, such as BOOST (Löfgren 2009, Wilkinson 2009, Kheyfets et al. 2011).
income taxes and adding cash transfers. Consumable income adds indirect subsidies and subtracts indirect taxes to disposable incomes, while final income adds in-kind transfers and subtracts copayments and user fees to consumable incomes. A CEQ Assessment generates marginal contributions to determine the effect of taxes and spending on poverty and inequality. The marginal contribution of a tax (or transfer) is calculated by taking the difference between the poverty (or inequality) indicator without the tax (or transfer) and with it. For instance, the marginal contribution of direct taxes to inequality at Final Income is the difference between the Gini of Final Income with all taxes and transfers included and the Gini of Final Income without direct taxes included. However, even the most comprehensive CEQ assessments lack a child lens. Providing a true child lens requires much more than disaggregating results for child-appropriate age groups or studying the incidence of public spending on education. It requires establishing child-specific links to fiscal incidence analysis. The proposed approach, Commitment to Equity for Children, CEQ4C, does this by expanding the standard CEQ in three directions: at a macrolevel, describing public spending particularly relevant to children’s well-being; at a mesolevel, performing policy simulations involving child-relevant spending and revenues; and at a microlevel, introducing a measure of multidimensional child poverty (MDCP). Specifically, the CEQ4C application adds to the CEQ three components: An explicit focus on child-relevant budgets. A “child relevant” budget line item includes public spending or tax revenues that are specific to age groups between zero and eighteen years of age (for example). CEQ4C defines a child-relevant budget as a budget possessing components that explicitly and directly target children’s well-being through investments in children’s development. This implies spending that is earmarked to benefit children through eligibility mechanisms or an allocation formula (such as preschool, primary, and secondary education, early childhood development, or child grants). Spending accruing to children as one of multiple beneficiaries (for example, training programs for youth that may include adolescents and young adults); and spending not linked directly to children, but providing them with benefits as part of a collective benefit for the household or community to which children belong are also included as child-relevant. Examples of the last would be subsidies for basic food staples or a lifeline electricity or heating energy tariff. Pragmatically, country by country, the specific context and circumstances of each program need to be taken into consideration in classifying each budgetary item. This practical solution reflects the lack of consensus around the definition of child-relevant budget (United Nations Children’s Fund, UNICEF 2016). Cummins (2016) reports that 16 country exercises define child-relevant budgets inconsistently across spending related to child protection; sports, recreation, and culture; and public safety and security, adding to the more usual education, health care, nutrition, social transfers, and housing. A recent analysis in Uganda (Republic of Uganda and UNICEF 2016), included only three items of social spending as child relevant––all education, health and water and sanitation spending. In Spain, an analysis reviewed some 14,000 budgetary lines and about 100 tax expenses to determine which was child-relevant (Garcimartin et al, forthcoming). A built-in MDCP metrics in the fiscal incidence analysis. Alongside a monetary or income metrics, CEQ4C assessments create indices of, and explicitly examine, multidimensional child poverty. While several MDCP measurements are currently used (see de Neubourg et al. 2012, Hjelm et al. 2016 and Karpati and de Neubourg 2017 for conceptual and empirical comparisons), the choice of a preferred measurement is based on the needs of the exercise and the availability of relevant data in each context. Regardless of the measure chosen, individuals are categorized as poor or nonpoor based on an MDCP metric, which complements the monetary poverty metric used by

any standard fiscal incidence analysis. The incidence of public spending—child-relevant and other—and tax burdens can also be defined across individuals based on the estimated MDCP status. In doing so, the fiscal incidence takes children as the unit of analysis. Furthermore, CEQ4C reflects age-relevant considerations in analyzing various spending categories, such as biological factors (for example, age groups associated with different cognitive development stages, or the 1,000 first days of life), institutional factors (such as age 6 often being the official age for starting primary school), or policy reasons (a new intervention intentionally targeted on teenagers while another on younger children). Child relevant policy simulations. While policy analyses need to consider the specific context they assess, CEQ4C builds a series of comparable policy simulations relevant to child-specific well-being policy questions common to diverse contexts, type of countries, and child’s life cycle. These simulations revolve around the following generic scenarios, policy settings, or reforms: a. The fiscal cost of filling investment gaps in a country. This policy simulation estimates the additional cost of providing essential services to those children currently not benefiting from public spending (per national legislation, policy aims, or international standards). Specific examples of policy objectives in this simulation include providing universal access to primary education or vaccination or reducing urban and rural gaps. b. MDCP as targeting mechanism. This type of analysis uses MDCP status or the intensity of MDCP to target or, more generally, allocate public spending (or tax revenue considerations) across individuals based on MDCP status or severity. c. Distributive effects of pro-child spending shifts. Under this type of simulation, public spending composition or aggregate levels are shifted from observed to alternative uses, relying on equity considerations as motivation for the changes. A typical example would shift resources from a regressive energy subsidy providing meager benefits to the poorest groups to pro-poor and pro-child public spending on primary education. The simulation identifies those population groups that win or lose from the policy change. d. Fiscal reform impacts on children. As governments design fiscal reforms to increase revenues or improve the equity of their fiscal systems, simulations can estimate the specific impacts of the reforms on children based on MDCP status. An example of this simulation includes is a shift of resources from subsidies to a child grant that is accompanied by selective increases in VAT rates. These simulations also single out how each intervention of a fiscal package reform impacts different age groups, including children. A CEQ4C assessment performs three distinct functions, namely, measurement, diagnostics, and policy analysis. Both quantifying the part of the budget that serves a child-relevant objective and estimating the incidence of multidimensional child poverty have a measurement objective. The focus on children of the expanded fiscal incidence analysis provides a more granular diagnostic of the distributive capacity of fiscal policy. The set of policy simulations thus built into the CEQ4C framework allows any analyst to quantify the potential effects of alternative policy interventions across age groups. These (or other) simulation exercises require a thorough discussion of the assumptions made in terms of, for instance, the behavior of beneficiaries and nonbeneficiaries or the incremental costs of supplying the service to certain groups that are difficult to reach.
3. CEQ4C in practice: Uganda case study
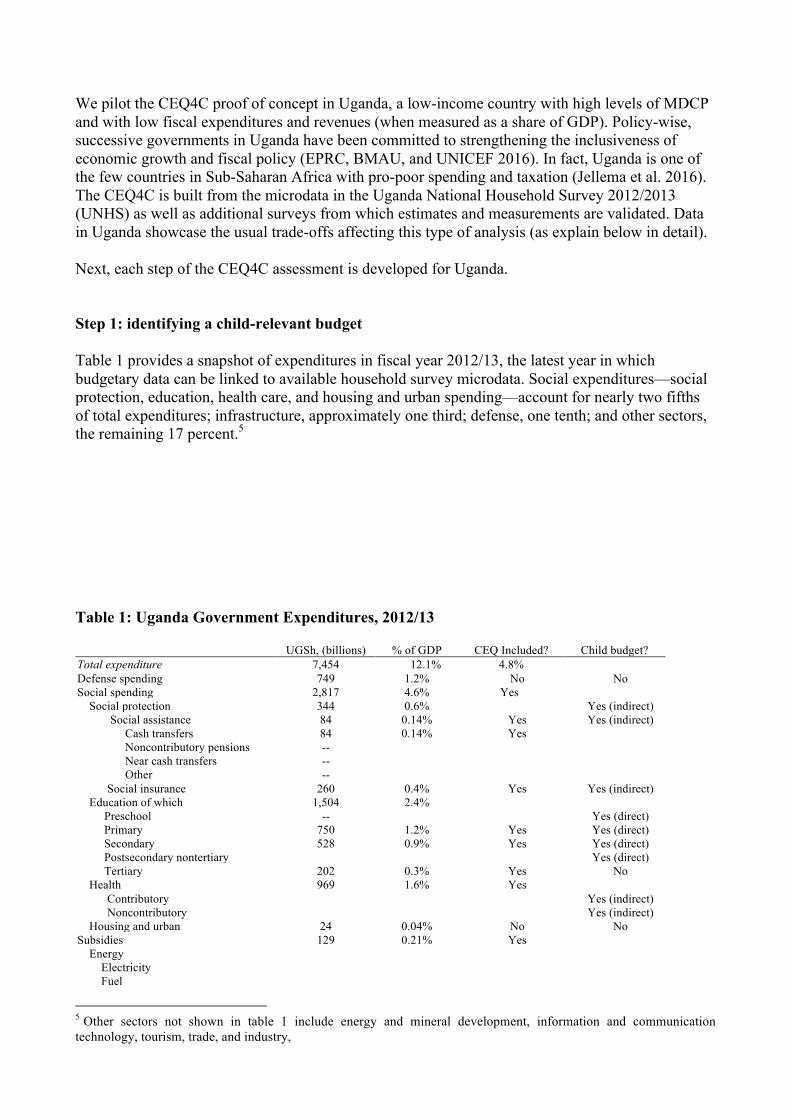
We pilot the CEQ4C proof of concept in Uganda, a low-income country with high levels of MDCP and with low fiscal expenditures and revenues (when measured as a share of GDP). Policy-wise, successive governments in Uganda have been committed to strengthening the inclusiveness of economic growth and fiscal policy (EPRC, BMAU, and UNICEF 2016). In fact, Uganda is one of the few countries in Sub-Saharan Africa with pro-poor spending and taxation (Jellema et al. 2016). The CEQ4C is built from the microdata in the Uganda National Household Survey 2012/2013 (UNHS) as well as additional surveys from which estimates and measurements are validated. Data in Uganda showcase the usual trade-offs affecting this type of analysis (as explain below in detail). Next, each step of the CEQ4C assessment is developed for Uganda. Step 1: identifying a child-relevant budget Table 1 provides a snapshot of expenditures in fiscal year 2012/13, the latest year in which budgetary data can be linked to available household survey microdata. Social expenditures––social protection, education, health care, and housing and urban spending––account for nearly two fifths of total expenditures; infrastructure, approximately one third; defense, one tenth; and other sectors, the remaining 17 percent.5 Table 1: Uganda Government Expenditures, 2012/13 UGSh, (billions) % of GDP CEQ Included? Child budget? Total expenditure 7,454 12.1% 4.8% Defense spending 749 1.2% No No Social spending 2,817 4.6% Yes Social protection 344 0.6% Yes (indirect) Social assistance 84 0.14% Yes Yes (indirect) Cash transfers 84 0.14% Yes Noncontributory pensions -- Near cash transfers -- Other -- Social insurance 260 0.4% Yes Yes (indirect) Education of which 1,504 2.4% Preschool -- Yes (direct) Primary 750 1.2% Yes Yes (direct) Secondary 528 0.9% Yes Yes (direct) Postsecondary nontertiary Yes (direct) Tertiary 202 0.3% Yes No Health 969 1.6% Yes Contributory Yes (indirect) Noncontributory Yes (indirect) Housing and urban 24 0.04% No No Subsidies 129 0.21% Yes Energy Electricity Fuel
5 Other sectors not shown in table 1 include energy and mineral development, information and communication technology, tourism, trade, and industry,

Food Inputs for agriculture 18 Yes No Water 91 Yes No Rural electrification 9 Yes No Infrastructure 2,595 4.21% No No Source: Authors’ calculations based on data in MoFPED 2013. In Uganda, child-relevant include all spending on education that benefits children ages 0 to 17, that is, primary- and secondary-school expenses. Public preschool spending is negligible, while tertiary education benefits an older age group. All public health spending is considered part of the child-relevant budget. It combines benefits aimed directly at children and benefits that reach children indirectly though they are aimed at benefiting other people. Social insurance and social assistance are considered––indirectly––relevant to children (see Jellema et al 2017 for a detailed description). Social insurance, even if not targeted directly on children, helps cover risks that affect all members of the households of beneficiaries. Social assistance in Uganda is not directly linked to children either but household size is used as a criterion to define the magnitude of some transfers, and, in other cases, transfers are expected to benefit the consumption of the entire household, including children. The only in-kind social spending that is not covered by this CEQ4C assessment is housing-urban expenditure, of which there is little in Uganda and virtually none undertaken outside the capital, Kampala. Neither defense and infrastructure spending nor subsidies are considered child-relevant budget items.6 As a result, the child-relevant budget in Uganda amounts to 4.2 percent of GDP, at the low end of the 4.5 percent to 8.5 percent of GDP range reported in Cummins (2016) for other countries at a similar developmental stage, such as El Salvador and Honduras. Table 2 provides a snapshot of public revenue sources in Uganda in fiscal year 2012/13. Uganda’s revenues come largely from indirect taxes such as a VAT, excise taxes (including on petroleum products), and trade taxes. This structure is similar to the structure in neighboring countries at a comparable level of development, such as Ethiopia and Tanzania (Jellema et al. 2016). Direct taxes––the pay-as-you-earn personal income tax and various corporate income taxes, including on capital gains, and a withholding tax––contribute to public revenues by half as much as the contribution from indirect taxes. Consumption taxes include the VAT, levied at a statutory 18 percent, excise duties, which include fuels, and customs duties. Although the VAT rate is uniform, there are various exemptions and zero-rated products. These are targeted on goods that have been identified as consumption goods among the poor. Examples of exempt goods are unprocessed foodstuffs, agricultural products (except for wheat grain), and the supply of various agricultural inputs. Overall, Uganda's tax to GDP ratio, at 11.6 percent of GDP in fiscal year 2012/13, is one of the lowest in sub-Saharan Africa. The tax compliance gap is large, and collections rest on a small base. Table 2: Uganda Government Revenues, 2012/13
UGSh, (billions)
% of GDP CEQ Included?
CEQ4C included?
Total revenue and grants 9,213 14.9 8.2% Revenue 8,277 13.4
Tax revenue 7,150 11.6 Direct taxes 2,407 3.9
Personal income tax 1,197 1.9 Yes Yes Corporate income tax 598 1.0 No No Corporate withholding tax 389 0.06 No No Taxes on property -- --
6 Heavy direct subsidies of water and electricity consumption had been phased out in urban areas by the time the UNHS was run, while, in rural areas, relatively small subsidies cover only some infrastructure investments and maintenance costs. The extent to which the government would have increased consumer tariffs to cover such investments and costs is not clear.

Contributions to social insurance -- -- Indirect taxes 4,712 7.6
VAT 2,353 3.8 Yes Yes Sales tax -- -- Excise taxes 1,466 2.4 Yes Yes Customs duties 753 1.2 No Taxes on exports 0 0.0 No
Nontax revenue 191 0.3 No Grants 936 1.5 Yes Yes
Source: Authors’ calculations based on data in MoFPED 2013. The Uganda CEQ4C assessment covers most indirect taxes and the personal income tax, including the pay-as-you-earn component. There is not sufficient information to allocate corporate income tax burdens to UNHS households, nor is sufficient administrative information available to allocate social insurance contributions. Step 2: from budget spending to individual benefits Figure 1 links the public spending defined as child relevant and the revenue items included in the CEQ4C analysis with the individual and household income earning generation process. The CEQ4C assessment in Uganda includes personal income, payroll taxes, and the VAT. Spending covers direct cash transfers, direct near-cash transfers, and benefits from public spending on education and health care. Spending on defense and housing, corporate taxes, and subsidies are not considered child relevant (see above). Corporate taxes and contributions to social security are not in the current analysis because the household survey does not allow them to be identified. Also, although not considered child relevant, subsidies are included in the assessment as part of policy simulations, that is, a budget component to be redistributed to children according to their multidimensional poverty status. Figure 1: From Budget to Household and Individual Income in Uganda

Source: Authors’ adaptation, based on Lustig 2018. Step 3: measuring multidimensional child poverty The proposed MDCP estimate for this proof of concept is a generic measure that identifies critical dimensions of child well-being based on children’s rights; reflects current SDGs-based priorities; picks representative indicators for those dimensions (a decision driven by data availability); and identifies whether children are deprived along those dimensions when they do not reach predetermined minimum thresholds for selected indicators. Most dimensions are relevant for each child, regardless of age, with the exception of education, which applies only to children ages 6 or older. The dimensions and indicators considered in Uganda are reported in table 3.
PRE-FISCAL INCOME =
Market income PLUS Contributory Pensions =Wages and salaries, income from capital, remittances, private pensions, imputed rent and own production,
contributory old-age pensions ( contributions to social insurance old-age pensions not reported)
TRANSFERS TAXES
Public Work Program (PWP), Household Income Support Program (HISP), the Senior Citizen's Grant (SCG),the
Vulnerable Family Sipport Grant (VFSG)
Disposable income
Personal income taxes
−+
Consumable income
Primary and secondary education, clinic and hospital care services
Final income
Agricultural, electricity and water subsidies (but not as part of child
budget)
Out of pocket expenses to education
VAT, excise taxes
+
+
−
−

Table 3: Measuring Multidimensional Child Poverty in Uganda Child well-being dimension
Child well-being indicator
Definition of indicator Reference age group
Health care Insecticide-treated mosquito net
Did not sleep under an insecticide-treated mosquito net the night before the survey
0–17
Nutrition Lack of dietary diversity
Deprived if child lives in a household in which food consumption comprises less than 4 food groups, of which one omitted group is meat/fish/pulses, or egg/milk
0–17
Education School enrolment Not in school 6–12; 13–17 Grade/age More than two grades behind 13–17
Housing Overcrowding Four or more people per room in the household 0–17 Water Unimproved water The main source of drinking water is unprotected well
or spring, river, tanker truck, or bottled water or an unspecified source
0–17
Sanitation Unimproved sanitation facility
The main toilet facility is a latrine without a slab, no facility (bush), or unspecified
0–17
Source: Authors’ analysis based on UBS 2014. The MDCP index as defined in Uganda is not more accurate than alternative applications such as multiple overlapping deprivation analysis (MODA) or the multidimensional poverty index (MPI).7 Rather it demonstrates shows that it is possible to generate a simple MDCP that can be used for fiscal incidence purposes without costly engagement of difficult choices regarding conceptual foundations, indicators, weights, or thresholds. It also demonstrates that an MDCP measure can be obtained from a standard household income-expenditure survey even when the survey not designed to provide a precise picture of child well-being. As for fiscal incidence analysis itself, caveats are also required here. The indicator capturing deprivations in the health dimension—access, ownership, coverage, or use of insecticide-treated mosquito nets—is selected over more frequently used indicators capturing assisted delivery or vaccinations. This is because the UNHS does not contain standard information on vaccinations, maternal health care, or postnatal care. Likewise, the proposed nutrition indicator is not children’s anthropometrics––not available in UNHS––or caloric intake or other nutritional variables. Dietary diversity, a nutritional input, is used instead. In the present application, the dietary diversity indicator refers to all children, providing information on school-aged children and adolescents, which is usually missing in the Multiple Indicator Cluster Surveys or the Demographic and Health Surveys. The objective was to take as many reasonable proxies as possible from the primary micro-data in order to provide a straightforward connection between children and the households in which they live. The nationally estimated MDCP in Uganda is 83 percent. MDCP is defined as the share of children reporting two or more deprivations (table 4). MDCP is higher in rural areas than in urban areas (87.5 percent versus 63.8 percent, respectively). This is true of all age groups considered, 0–6, 7–12, and 13–17. Furthermore, while six deprivations are rarely observed among Ugandan children (only between 0 percent and 1 percent of the respective sample of children), four and five deprivations can affect as many as 48 percent of children; this is the case among rural children aged 13–17. Across dimensions (not shown in table 4), sanitation is the most frequently observed 7 Karpati and de Neubourg (2017) ) offer a detailed discussion of the strengths and weaknesses of several specific measures of MDCP, including MODA, MPI, Mexico’s multidimensional poverty measure, or the European Union’s material deprivation index. They conclude that none is systematically superior to others.
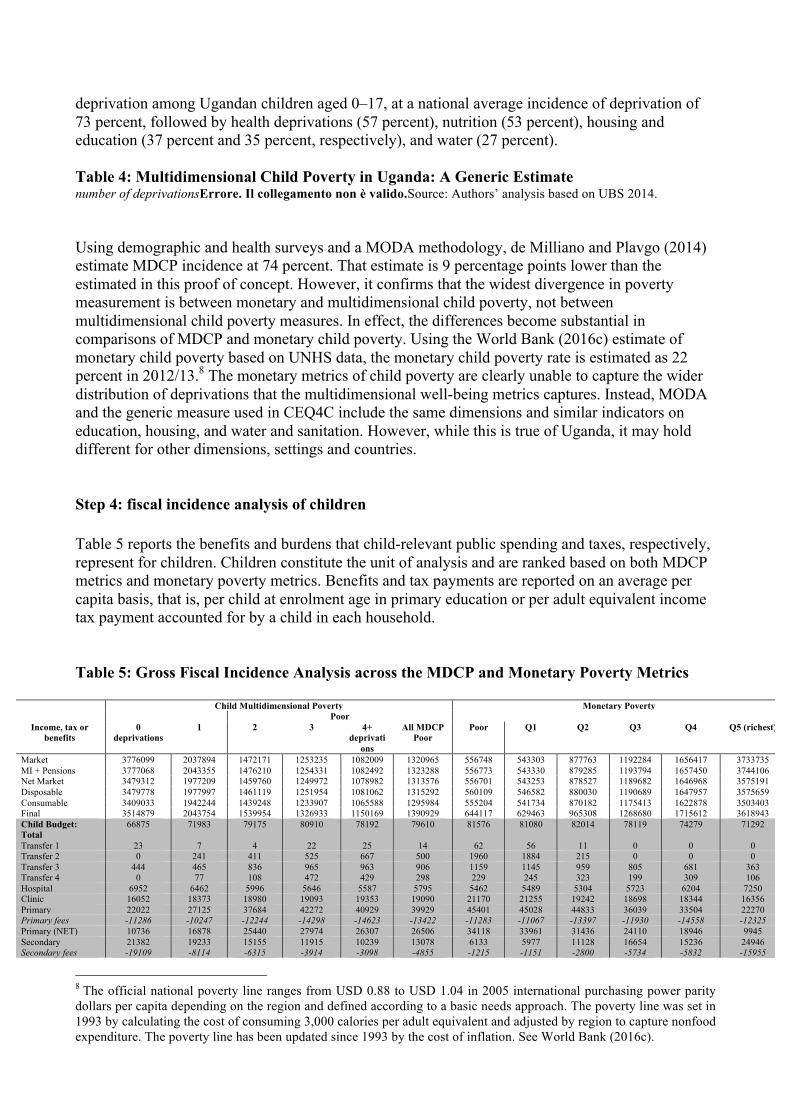
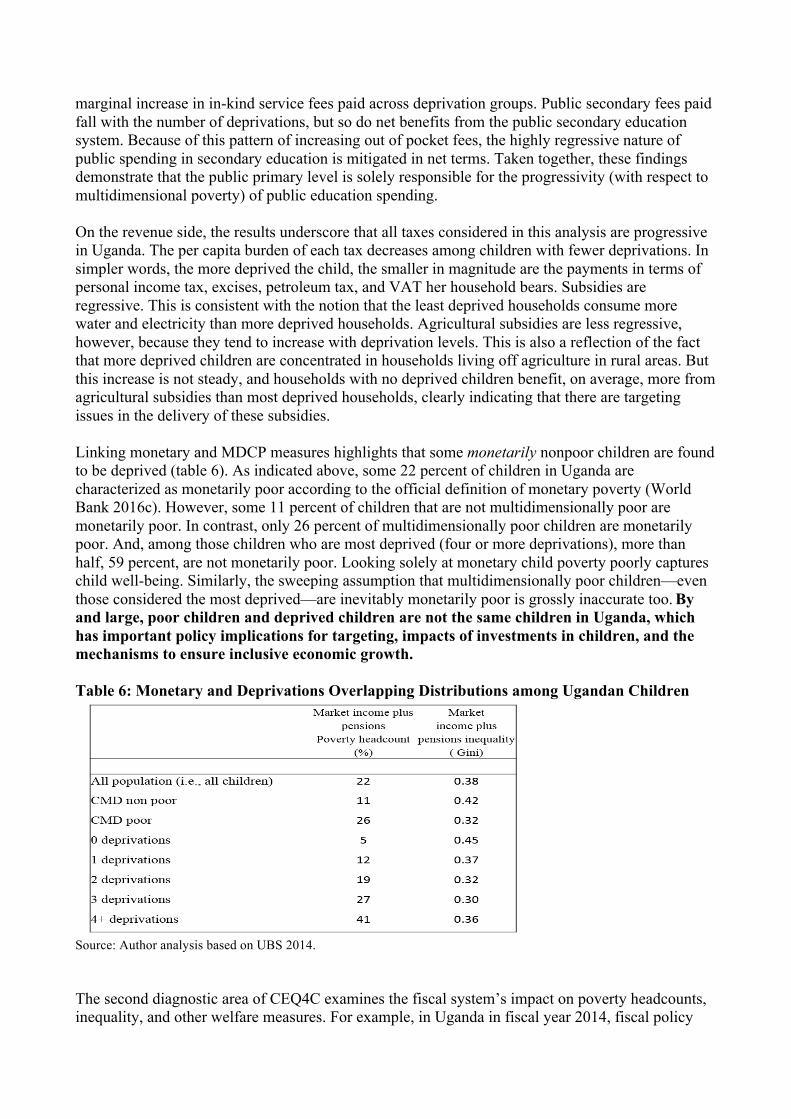
deprivation among Ugandan children aged 0–17, at a national average incidence of deprivation of 73 percent, followed by health deprivations (57 percent), nutrition (53 percent), housing and education (37 percent and 35 percent, respectively), and water (27 percent). Table 4: Multidimensional Child Poverty in Uganda: A Generic Estimate number of deprivationsErrore. Il collegamento non è valido.Source: Authors’ analysis based on UBS 2014. Using demographic and health surveys and a MODA methodology, de Milliano and Plavgo (2014) estimate MDCP incidence at 74 percent. That estimate is 9 percentage points lower than the estimated in this proof of concept. However, it confirms that the widest divergence in poverty measurement is between monetary and multidimensional child poverty, not between multidimensional child poverty measures. In effect, the differences become substantial in comparisons of MDCP and monetary child poverty. Using the World Bank (2016c) estimate of monetary child poverty based on UNHS data, the monetary child poverty rate is estimated as 22 percent in 2012/13.8 The monetary metrics of child poverty are clearly unable to capture the wider distribution of deprivations that the multidimensional well-being metrics captures. Instead, MODA and the generic measure used in CEQ4C include the same dimensions and similar indicators on education, housing, and water and sanitation. However, while this is true of Uganda, it may hold different for other dimensions, settings and countries. Step 4: fiscal incidence analysis of children Table 5 reports the benefits and burdens that child-relevant public spending and taxes, respectively, represent for children. Children constitute the unit of analysis and are ranked based on both MDCP metrics and monetary poverty metrics. Benefits and tax payments are reported on an average per capita basis, that is, per child at enrolment age in primary education or per adult equivalent income tax payment accounted for by a child in each household. Table 5: Gross Fiscal Incidence Analysis across the MDCP and Monetary Poverty Metrics
Child Multidimensional Poverty Monetary Poverty Poor
Income, tax or benefits
0 deprivations
1 2 3 4+ deprivati
ons
All MDCP Poor
Poor Q1 Q2 Q3 Q4 Q5 (richest)
Market 3776099 2037894 1472171 1253235 1082009 1320965 556748 543303 877763 1192284 1656417 3733735 MI + Pensions 3777068 2043355 1476210 1254331 1082492 1323288 556773 543330 879285 1193794 1657450 3744106 Net Market 3479312 1977209 1459760 1249972 1078982 1313576 556701 543253 878527 1189682 1646968 3575191 Disposable 3479778 1977997 1461119 1251954 1081062 1315292 560109 546582 880030 1190689 1647957 3575659 Consumable 3409033 1942244 1439248 1233907 1065588 1295984 555204 541734 870182 1175413 1622878 3503403 Final 3514879 2043754 1539954 1326933 1150169 1390929 644117 629463 965308 1268680 1715612 3618943 Child Budget: Total
66875 71983 79175 80910 78192 79610 81576 81080 82014 78119 74279 71292
Transfer 1 23 7 4 22 25 14 62 56 11 0 0 0 Transfer 2 0 241 411 525 667 500 1960 1884 215 0 0 0 Transfer 3 444 465 836 965 963 906 1159 1145 959 805 681 363 Transfer 4 0 77 108 472 429 298 229 245 323 199 309 106 Hospital 6952 6462 5996 5646 5587 5795 5462 5489 5304 5723 6204 7250 Clinic 16052 18373 18980 19093 19353 19090 21170 21255 19242 18698 18344 16356 Primary 22022 27125 37684 42272 40929 39929 45401 45028 44833 36039 33504 22270 Primary fees -11286 -10247 -12244 -14298 -14623 -13422 -11283 -11067 -13397 -11930 -14558 -12325 Primary (NET) 10736 16878 25440 27974 26307 26506 34118 33961 31436 24110 18946 9945 Secondary 21382 19233 15155 11915 10239 13078 6133 5977 11128 16654 15236 24946 Secondary fees -19109 -8114 -6315 -3914 -3098 -4855 -1215 -1151 -2800 -5734 -5832 -15955
8 The official national poverty line ranges from USD 0.88 to USD 1.04 in 2005 international purchasing power parity dollars per capita depending on the region and defined according to a basic needs approach. The poverty line was set in 1993 by calculating the cost of consuming 3,000 calories per adult equivalent and adjusted by region to capture nonfood expenditure. The poverty line has been updated since 1993 by the cost of inflation. See World Bank (2016c).

Secondary (NET) 2273 11120 8841 8001 7141 8223 4918 4825 8329 10920 9404 8992 Tertiary 19209 8563 6549 4659 1723 4970 553 0 2237 5020 5877 19249 Tertiary fees -10149 -5549 -4111 -2563 -674 -2915 -139 0 -485 -1435 -3534 -13775 VAT -36405 -20463 -13183 -10738 -9100 -11546 -4074 -4020 -6215 -9261 -15229 -38866 Excise -35865 -19615 -12124 -9903 -7884 -10537 -3789 -3774 -6656 -9599 -13653 -35158 Petroleum -4867 -1340 -659 -264 -223 -437 -9 -10 -16 -124 -311 -3847 PIT 297757 66146 16450 4359 3510 9713 72 77 757 4112 10481 168914 Water Subsidy 5114 4462 3107 2002 1006 2319 2401 2388 2279 2561 2945 4377 Elec. Subsidy 700 533 212 142 147 175 62 62 107 177 339 699 Agri. Subsidy 580 670 775 714 581 717 505 504 653 971 831 538
Source: Authors’ analysis based on UBS 2014. Transfer 1 refers to the Public Work Program; Transfer 2 to the Household Income Support Program; Transfer 3 to the Senior Citizen’s Grant; and Transfer 4 to the Vulnerable Family Support Grant. Child-relevant benefits (grey area in table 5) within the MDCP metrics constitute on average about UGSh 70,000 to UGSh 80,000 per child.9 These benefits are progressive: they increase with the number of child deprivations of the average child. However, this progressivity is not marked nor steady: children with three deprivations obtain the largest average benefits from the child budget, more than those with four or more deprivations. Among children with three deprivations, the benefits represent 7 percent of per capita household market income. The monetary metrics corroborates these findings. The magnitude of cash transfers is rather small, representing a meagre 2 percent or 3 percent of total child transfers across deprivation categories (and income quintiles). Some of the transfers are clearly more progressive than others, but, in practice, this may not mean much as the average amount of benefit is rather scant: less than 0.2 percent of per capita household market incomes. Health service benefits are much larger in magnitude. Benefits to children in the form of clinic services are slightly progressive: they increase along with the number of deprivations, although the average increase as children report each additional deprivation is certainly limited. Yet, these benefits appear to have a larger distributive effect than transfers from hospital services. These are about three times smaller than clinic transfers per child and are clearly regressive, that is, they decrease with the number of deprivations reported by children. This reflects the fact that deprived children typically use these services less frequently relative to children who are less deprived. Primary and secondary education benefits implicit in the provision of public education also differ. Primary education benefits are the largest in magnitude across all child-relevant benefits considered and are progressive: they increase with the number of deprivations reported by the child. On average, a child with four or more deprivations enjoys about 85 percent more transfers through public education than a child without deprivations. This is significant because primary education transfers represent more than half of all the benefits that a highly-deprived child receives in Uganda. Among children with no deprivations, primary education benefits represent only a third of total transfers received. In contrast, benefits supplied through the public provision of secondary education are regressive because they decrease with the number of deprivations children report. For the most deprived children, secondary education transfers represent only a quarter of the benefit transferred from primary education. Yet, the regressivity of public secondary education is less marked than that observed in tertiary education. Public primary school fees that are paid out of pocket (for registration and tuition, books and supplies, and uniforms) rise among more deprived children relative to less deprived children, thus describing a regressive pattern. Thus, primary education benefits, net of household contributions are progressive (which is confirmed if children are categorized by level of income). This is the result of marginal increases (across deprivation groups) in in-kind service benefits being greater than the
9 These are category means, that is, they include beneficiaries and nonbeneficiaries.
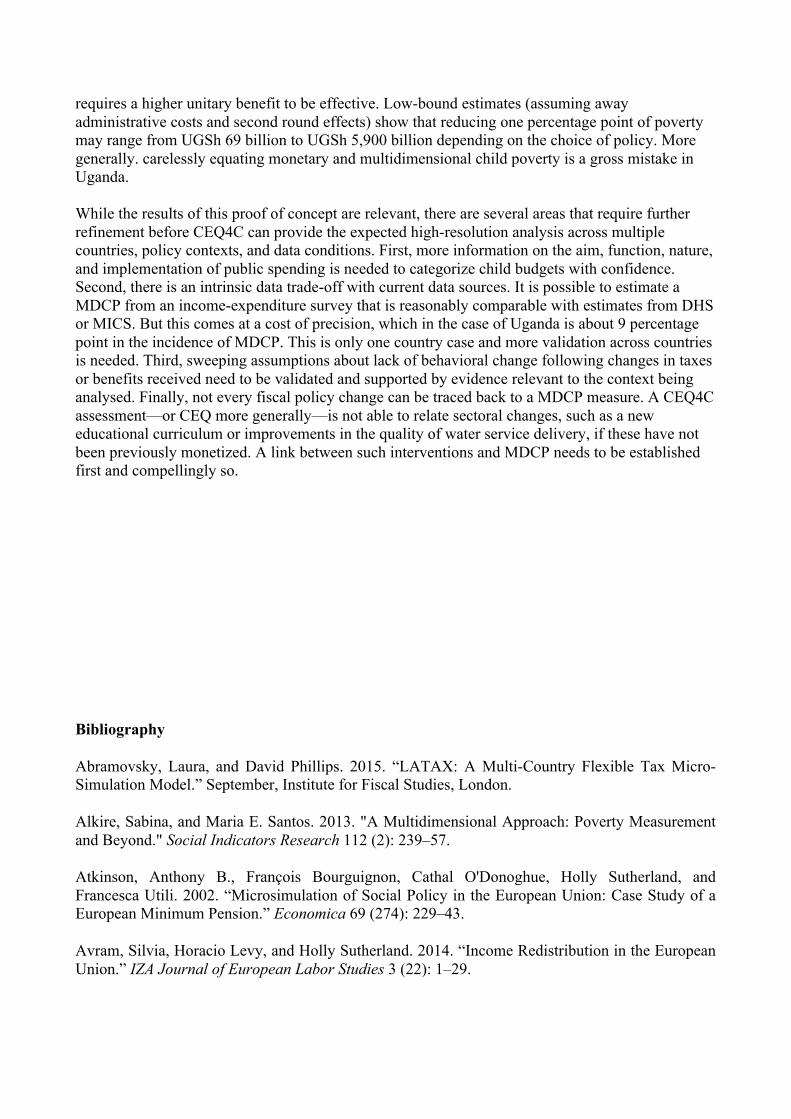
marginal increase in in-kind service fees paid across deprivation groups. Public secondary fees paid fall with the number of deprivations, but so do net benefits from the public secondary education system. Because of this pattern of increasing out of pocket fees, the highly regressive nature of public spending in secondary education is mitigated in net terms. Taken together, these findings demonstrate that the public primary level is solely responsible for the progressivity (with respect to multidimensional poverty) of public education spending. On the revenue side, the results underscore that all taxes considered in this analysis are progressive in Uganda. The per capita burden of each tax decreases among children with fewer deprivations. In simpler words, the more deprived the child, the smaller in magnitude are the payments in terms of personal income tax, excises, petroleum tax, and VAT her household bears. Subsidies are regressive. This is consistent with the notion that the least deprived households consume more water and electricity than more deprived households. Agricultural subsidies are less regressive, however, because they tend to increase with deprivation levels. This is also a reflection of the fact that more deprived children are concentrated in households living off agriculture in rural areas. But this increase is not steady, and households with no deprived children benefit, on average, more from agricultural subsidies than most deprived households, clearly indicating that there are targeting issues in the delivery of these subsidies. Linking monetary and MDCP measures highlights that some monetarily nonpoor children are found to be deprived (table 6). As indicated above, some 22 percent of children in Uganda are characterized as monetarily poor according to the official definition of monetary poverty (World Bank 2016c). However, some 11 percent of children that are not multidimensionally poor are monetarily poor. In contrast, only 26 percent of multidimensionally poor children are monetarily poor. And, among those children who are most deprived (four or more deprivations), more than half, 59 percent, are not monetarily poor. Looking solely at monetary child poverty poorly captures child well-being. Similarly, the sweeping assumption that multidimensionally poor children—even those considered the most deprived—are inevitably monetarily poor is grossly inaccurate too. By and large, poor children and deprived children are not the same children in Uganda, which has important policy implications for targeting, impacts of investments in children, and the mechanisms to ensure inclusive economic growth. Table 6: Monetary and Deprivations Overlapping Distributions among Ugandan Children
Source: Author analysis based on UBS 2014. The second diagnostic area of CEQ4C examines the fiscal system’s impact on poverty headcounts, inequality, and other welfare measures. For example, in Uganda in fiscal year 2014, fiscal policy

(social spending, subsidies, and taxes) reduced the poverty headcount among all children by approximately 5 percentage points from market (or pre-fiscal) incomes to final (or post-fiscal) income (figure 2, first panel). The largest contribution to child poverty reduction in Uganda is due to in-kind benefits from public services in health and education. The effect of cash transfers on monetary poverty reduction is negligible, about 0.14 percentage points, from 21.91 percent down to 21.76 percent, as should be expected from the low average benefits per individual. Only if in-kind transfers are considered does the reduction in poverty become substantive, more than 5 percentage points (figure 2, first panel). Poverty reduction is more significant among children aged 7–12 and 13–17 than among the youngest children (a 7-percentage point reduction among the two older groups relative to a 2-percentage point reduction among the youngest group; figure 2, third panel), that is, among children of school age relative to the youngest children. Because the benefits associated with education exceed other benefits, it is precisely these groups of children of school age who enjoy the largest average reduction in poverty. Figure 4: The Income Poverty and Inequality Effects of Child Budgets
0%
5%
10%
15%
20%
25%PovertyHeadcount-Allchildren
0,200
0,250
0,300
0,350
0,400
0,450 Ginicoef6icient-inequality-Allchildren
MarketIncome+Pensions MI+P+directtransfersMI+P+Childbudget MI+P+ChildnetbudgetMI+P+Childnetbudget-taxes+subsidies

Source: Authors’ analysis based on UBS 2014. The initial inequality of market and pension income (Gini of 0.375) narrows by 0.013 points (to 0.361) because of the inclusion of the child budget (figure 2, second panel). Children of school age benefit the most in terms of inequality reduction, with the same equalizing effect from spending in favor of children of primary and secondary school age (a reduction of 0.020 points in Gini each relative to a reduction of only 0.006 points among the youngest age group; figure 2, fourth panel). The reason is that, while not the largest in magnitude (compared with secondary education), primary-school transfers are much more progressively distributed. Adding the out of pocket contributions to education increases poverty—by about 0.6 percentage points—and leaves inequality virtually unchanged. Adding taxes and consumption subsidies also increases poverty, by an additional 0.15 percentage points, while reducing inequality by a small margin (0.013 points). The increase in the poverty headcount associated with net subsidies in the first age group is more significant than the increase associated with the older age groups. This result derives once more from the ineligibility of children in the first age group to access the public education service delivery system, which provides the most significant benefit to the older age groups. Step 5: policy simulations
0%
5%
10%
15%
20%
25%PovertyHeadcountRatio
0,300
0,320
0,340
0,360
0,380
0,400
0,420
0-6yearolds 7-12yr.olds 13-18yr.olds
Ginicoef6icient-Inequality
MarketIncome+Pensions MI+P+directtransfersMI+P+Childbudget MI+P+ChildnetbudgetMI+P+Childnetbudget-taxes+subsidies

This section reports five fiscal policy simulations relevant in Uganda (table 8). Simulation 1 estimates the fiscal impact of closing the educational deprivation gap in Uganda, or enrolling (at public educational institutions) all school-aged children currently out of school.10 Simulation 2 estimates the effect on (monetary) poverty and inequality of shifting the current composition of the budget towards a more child-relevant composition: it eliminates all spending on subsidies categorized as not child relevant and shown to be regressive and those foregone subsidy expenditures are used to fund a new cash transfer program targeted (perfectly) to multidimensionally poor children.11 Simulation 3 describes a fiscal reform which eliminates all VAT exemptions (in the fiscal-year-2014 VAT schedule) and placing those previously-exempt goods and as standard-rated under a preferential VAT rate. Meanwhile, currently standard-rated goods see their VAT rate increase under Simulation 3.12 In addition, public spending is shifted as discussed in simulation 2. Simulations 4 and 5 respectively repeat simulations 2 and 3 but target transfers based on monetary poverty, not MDCP.13 None of these simulations include behavioral changes or additional administrative costs such as, for example, establishing a MDCP-based targeting system. Simulation 1 does include the expected private contributions necessary for accessing the public education service delivery system and therefore includes the net benefit from extending public education access to those currently excluded. Only in Simulation 1 is possible to compute the impact on both monetary and multidimensional poverty because education deprivation is a dimension of MDCP. For the other simulations, the focus is on the effect of fiscal policy changes on monetary poverty. The expected poverty and distributional changes, and the expected fiscal cost, resulting from these simulated policy alternatives are diverse in magnitude and direction. The effect of closing the educational gap, Simulation 1, by extending access to the public education service delivery system—with no additional administrative costs—reduces MDCP by approximately 2.5 percentage points, that is, the share of children experiencing two or more deprivations declines by that magnitude after ensuring universal education in Uganda. The overall effect of closing the education gap is a drop of 1.3 percentage points in the monetary poverty headcount ratio. 14 The poverty reduction is only moderate among the primary school age group, 7–12; this group of poor individuals has a relatively high level of enrolment prior to the simulation (at 80 percent). The reduction in monetary poverty among the group 13–17 is substantive, some 14 percentage points.15 This is the result of a very large in-kind transfer associated with the provision of secondary education, almost two thirds of the equivalent poverty line per person per year. Even though only a fourth of the 13–17 age group who benefit in Simulation 1 are monetarily poor (811,000 of 3.3 million), those same individuals represent 88
10 In other words, the fiscal impact of closing this gap is the estimated cost of providing public education services to those school-aged children who report that they are not currently enrolled. 11 Simulation 2 combines the second and third generic scenarios discussed in section 2. It is theoretically fiscally neutral because there are no additional fiscal costs associated with this policy change; transaction costs are ignored. 12 The preferential rate is approximately 2 percent while the higher standard VAT rate is 14 percent. These new VAT rates ensure that the reform is revenue neutral. 13 Because the size of the monetarily poor children pool is approximately 25 percent of the size of the MDCP pool (22 percent versus 83 percent of all children), the per child benefit in simulations 4 and 5 is approximately four times greater than the per child benefit in simulations 2 and 3.14 There might be, however, some trade-off between the implicit transfer received after schooling and reduced labor supply from children or adolescents now enrolled in school. That trade-off, significant to the extent of child/adolescence labor, is not accounted here. 15 No changes should be observed for the age group 0–6 as they are too young to attend primary school.

percent of the age 13–17 poor population, and they all receive a large-magnitude transfer. Thus, the simulated policy in this scenario is not well targeted to the poor population and so significant benefits are received by the nonpoor population. Despite that, the intervention still covers the age 13–17 poor population with significant benefits. Table 8: Child-Relevant Fiscal Policy Simulations in Uganda
Simulation Initial poverty (Po) and inequality (Go)
by age group
Number of children affected by the
reform
Average benefit Impact on poverty and inequality (Δ change
in P and G), percentage points
Fiscal costs Assumptions
Sim 1: Children deprived of education (that is, not enrolled in school) become enrolled and benefit from the implicit transfer from public provision in education
Po = 21.91% Po [0–6] = 18.18% Po [7–12] = 17.48% Po [13–17] = 15.01% Go = 0.370 Go [0–6] = 0.370 Go [7–12] = 0.344 Go [13–17] = 0.374 MDCP = 83%
0.95 million and 3.0 million children aged 7–12 and 13–17, respectively
Unitary cost for student at age group 7–12: UGSh 110,428 Unitary cost for student at age group 13–17: UGSh 703,398
ΔP = −1.33 ΔP [0–6] = 0 ΔP [7–12] = −0.82 ΔP [13–17] = −14 ΔG: −0.013 ΔG [0–6] = 0 ΔG [7–12] = −0.003 ΔG [13–17] = −0.074 Δ MDCP = −2.5
UGSh 449 billion or 6 percent of total public spending
No behavioral changes. No additional administrative costs of reaching out to currently unenrolled students. No need to build additional infrastructure to accommodate new students.
Sim 2: Public spending on subsidies is removed and transferred to children found to be multidimensionally poor through a child grant that is equal for all beneficiaries
14.29 million multidimensionally poor children
Uniform cash transfer of UGSh 8,500 to each beneficiary
ΔP = −0.30 ΔP [0–6] = −0.23 ΔP [7−12] = −0.29 ΔP [13–17] = −0.46 ΔG: −0.001 ΔG [0–6]: −0.001 ΔG [7–12]: −0.001 ΔG [13–17]: 0
0 fiscal cost: the UGSh 118 billion saved from ending subsidies are fully redistributed to multidimensionally poor children
No behavioral changes and no administrative costs of providing the cash transfer
Sim 3: Same as simulation 2 with an additional VAT reform, that eliminates all exemptions and introduces a new two-tier schedule of 2 and 14 percent VAT rates.
14.29 million multidimensionally poor children (from the spending reform) and 18.27 million affected by the VAT reform
Uniform cash transfer of UGSh 9,027 to each beneficiary
ΔP = −0.02 ΔP [0–6] = 0 ΔP [7–12] = +0.06 ΔP [13–17] = −0.18 ΔG: −0.001 ΔG [0–6]: −0.001 ΔG [7–12]: −0.001 ΔG [13–17]: −0.001
Revenue neutral scenario. The UGSh 118 million saved from ending subsidies are fully redistributed to multidimensionally poor children. The VAT reform is designed to be fiscally neutral
No behavioral changes and no administrative costs of providing the cash transfer or closing VAT exemptions.
Sim 4: Public spending on subsidies is removed and transferred to children found to be monetarily poor through a child grant that is equal for all beneficiaries
4.02 million poor children
Uniform cash transfer of UGSh 32,107 to each beneficiary
ΔP = –1.71 ΔP [0–6] = −1.75 ΔP [7–12] = −1.68 ΔP [13–17] = –1.73 ΔG: –0.004 ΔG [0–6]: –0.003 ΔG [7–12]: –0.004 ΔG [13–17]: –0.003
0 fiscal cost: the UGSh 118 billion saved from ending subsidies are fully redistributed to poor children
No behavioral changes and no administrative costs of providing the cash transfer.
Sim 5: Same as simulation 4 with an additional VAT reform eliminating all exemptions and introducing a two-tier schedule of 2 and 14 percent VAT rates.
4.02 million poor children (from the spending reform) and 18.27 million affected by the VAT reform
Uniform cash transfer of UGSh 32,107 to each beneficiary
ΔP = –1.51 ΔP [0–6] = −1.54 ΔP [7–12] = −1.40 ΔP [13–17] = −1.65 ΔG: −0.004 ΔG [0–6]: −0.005 ΔG [7–12]: −0.004 ΔG [13–17]: = −0.004
Revenue neutral scenario. The UGSh 118 million saved from ending subsidies are fully redistributed to multidimensionally poor children. The VAT reform is designed to be fiscally neutral.
No behavioral changes and no administrative costs of providing the cash transfer or closing VAT exemptions.
Source: Authors’ estimates In terms of inequality reduction, the total effect is a modest narrowing of 1.3 Gini points; the effects on inequality among children aged 7–12 are approximately one half the size of the inequality impact on children aged 13–17. This is, again, the result of the fact that children who benefit from this policy are not necessarily monetarily poor. So, for those aged 13–17 who benefit from the policy, one fourth are originally poor, while the other three fourths are not. In conclusion, while MDCP is reduced substantially, monetary child poverty is not reduced much, and the distribution of incomes does not change substantially.

Even though it is designed to be progressive, Simulation 2 brings scant poverty- or inequality-reduction or benefits: the poverty headcount falls by approximately 0.3 percentage points while the Gini coefficient falls by approximately 0.01 points. This is because of the mismatch between multidimensionally poor children and monetarily children and the meagre fiscal shift from subsidies, only UGSh 118 billion (almost four times more resources are required to close the educational gap). If the VAT reform is added to this spending shift (Simulation 3), the additional effect of raising the VAT rate (by 2 percent) on previously exempted goods (which represent a clear majority of the consumption of poor households, is an increase in poverty from Simulation 2 (but a slight decrease in poverty from the baseline) and virtually no change in inequality. These paltry results are obtained from a VAT reform that is designed to be revenue neutral. Simulations 4 and 5 show a more sizeable impact in monetary poverty reduction between 1.5 and 2 percentage points, resulting from the targeting of benefits to monetarily poor children and from a much larger unitary benefit to each child. These simulations also confirm that the impact on inequality is dismal. The VAT reform (added in Simulation 5) has a similar impact on poverty (relative to Simulation 4) as it had in Simulation 3 (relative to Simulation 2), about a 0.3 percentage point increase, which partly reflects the fact that neither changes in consumption behavior nor substantial increases in VAT rates are introduced. Finally, while the resources that are redistributed in Simulations 2 to 5 (UGSh 118 billion) are more limited than in Simulation 1 (closing the education gap, UGSh 448 billion), the capacity to reduce poverty in each scenario varies considerably (see table 9). The cost of reducing one percentage point of monetary child poverty requires UGSh 69 to 79 billion in simulations where the targeting of resources is articulated around monetary child poverty. This cost increases substantially to around UGSh 400 billion when MDCP is used as targeting mechanism; when the VAT reform is included (as in Simulations 3 and 5), the cost per percentage point of poverty reduction skyrockets (to as much as billion in Simulation 3) as far fewer people are helped out of poverty via VAT reform.16 Table 9: Cost-Benefit of Simulated Policies
Simulation Cost of reducing 1 pp of child poverty (UGSh billion)
Requires additional funding?
Expected administrative costs How to maximize poverty impact?
1 (end educational gap)
337 Yes Moderate to high costs required to accommodate almost 4 million new students
Ensure economies of scale when expanding the provision of education to almost four million new students
2 (spending shift 393 No Low cost of eliminating Increase unitary benefits to
16 In other words, even though the VAT reform is fiscally neutral and designed to reduce the impact of increased VAT rates on welfare in poor households, it considerably limits the capacity of progressive policies to reduce poverty.

and MDCP targeting)
subsidies, moderate cost of targeting beneficiaries based on MDCP
the extent possible
3 (spending shift, MDCP targeting and VAT reform)
5,900 No Low cost of eliminating subsidies and replacing old VAT rates, moderate cost of targeting beneficiaries based on MDCP
Explore alternative revenue raising strategies that do not increase poverty such as increasing PIT rates or extend base to nonpoor currently exempted households.
4 (spending shift and monetary poverty targeting)
69 No Low cost of eliminating subsidies, moderate to high cost of targeting monetary poverty (almost four times lower incidence than MDCP)
Success of this policy comes from targeting a smaller group of beneficiaries (poor children). The more resources shifted from regressive spending to these schemes, the better.
5 (spending shift, monetary poverty targeting and VAT reform)
78 No Low cost of eliminating subsidies and replacing old VAT rates, moderate to high cost of targeting monetary poverty
Same as simulation 4.
Source: Authors based on results reported in table 8.
4. Conclusions Incidence analysis is a powerful analytical tool to understand poverty and distributional effects of fiscal policies. Neither CEQ nor other incidence techniques focus on children or use nonmonetary poverty metrics. CEQ4C remedies these gaps by singling out public spending that is child relevant and building in a multidimensional child poverty metrics and policy simulation scenarios in the analysis. The Ugandan child budget estimated in this exercise represents 4.2 percent of GDP, at the lower end of comparable countries. Child-relevant spending transfers about 6 percent of per capita household market income to multidimensionally poor children (less than 2 percent to non-deprived children). Despite modest, child relevant budgets reduce poverty and inequality in Uganda. The modest impact is the result of its small magnitude but also of its composition. Primary education spending is clearly a progressive investment (it increases with the number of child deprivations); secondary education is clearly regressive (it decreases with the number of deprivations affecting a child), while health services are either progressive (clinic visits) or regressive (hospital services). Policy simulations show that the fiscal cost of ending educational enrolment deprivation in Uganda is relatively modest, in part because additional administrative costs of reaching out children left behind is not considered. Alternative policy scenarios, progressive in nature, that eliminate child-unrelated and regressive subsidies and redistribute fiscal savings in favor of multidimensionally poor children, reduce poverty almost imperceptibly. This is so for two main reasons: fiscal resources mobilized are small and targeting MDCP will not bring sizeable improvements in monetary child poverty. Many multidimensional poor children are not monetarily poor. A larger reduction in poverty of about 2 percentage points is found when shifts in spending and VAT reform are targeted to monetarily poor children instead of multidimensionally poor children. Simulations highlight that different strategies will only be efficient if they can increase their total funding, improve unitary benefits and improve targeting. Those interventions that will target MDCP
requires a higher unitary benefit to be effective. Low-bound estimates (assuming away administrative costs and second round effects) show that reducing one percentage point of poverty may range from UGSh 69 billion to UGSh 5,900 billion depending on the choice of policy. More generally. carelessly equating monetary and multidimensional child poverty is a gross mistake in Uganda. While the results of this proof of concept are relevant, there are several areas that require further refinement before CEQ4C can provide the expected high-resolution analysis across multiple countries, policy contexts, and data conditions. First, more information on the aim, function, nature, and implementation of public spending is needed to categorize child budgets with confidence. Second, there is an intrinsic data trade-off with current data sources. It is possible to estimate a MDCP from an income-expenditure survey that is reasonably comparable with estimates from DHS or MICS. But this comes at a cost of precision, which in the case of Uganda is about 9 percentage point in the incidence of MDCP. This is only one country case and more validation across countries is needed. Third, sweeping assumptions about lack of behavioral change following changes in taxes or benefits received need to be validated and supported by evidence relevant to the context being analysed. Finally, not every fiscal policy change can be traced back to a MDCP measure. A CEQ4C assessment––or CEQ more generally––is not able to relate sectoral changes, such as a new educational curriculum or improvements in the quality of water service delivery, if these have not been previously monetized. A link between such interventions and MDCP needs to be established first and compellingly so.
Bibliography
Abramovsky, Laura, and David Phillips. 2015. “LATAX: A Multi-Country Flexible Tax Micro-Simulation Model.” September, Institute for Fiscal Studies, London.
Alkire, Sabina, and Maria E. Santos. 2013. "A Multidimensional Approach: Poverty Measurement and Beyond." Social Indicators Research 112 (2): 239–57.
Atkinson, Anthony B., François Bourguignon, Cathal O'Donoghue, Holly Sutherland, and Francesca Utili. 2002. “Microsimulation of Social Policy in the European Union: Case Study of a European Minimum Pension.” Economica 69 (274): 229–43.
Avram, Silvia, Horacio Levy, and Holly Sutherland. 2014. “Income Redistribution in the European Union.” IZA Journal of European Labor Studies 3 (22): 1–29.
Bastagli, Francesca, David Coady, and Sanjeev Gupta, 2012, “Income Inequality and Fiscal Policy.” IMF Staff Discussion Note SDN/12/08, Fiscal Affairs Department, International Monetary Fund, Washington, DC.
Berlinski, Samuel, and Norbert Schady, eds. 2015. The Early Years: Child Well-Being and the Role of Public Policy. Development in the Americas Series. Washington, DC: Inter-American Development Bank; New York: Palgrave Macmillan.
Bourguignon, François, Francisco H. G. Ferreira, and Phillippe George Leite. 2003. “Conditional Cash Transfers, Schooling, and Child Labor: Micro-Simulating Brazil’s Bolsa Escola Program.” World Bank Economic Review 17 (2): 229–54.
Bourgignon, François, and Luiz Awazu Pereira da Silva, eds. 2003. The Impact of Economic Policies on Poverty and Income Distribution: Evaluation Techniques and Tools. Washington, DC: World Bank; New York: Oxford University Press.
Chenery, Hollis Burnley, Montek S. Ahluwalia, C. L. G. Bell, John H. Daly, and Richard Jolly. 1974. Redistribution with Growth: Policies to Improve Income Distribution in Developing Countries in the Context of Economic Growth. Washington, DC: World Bank; London: Oxford University Press.
Cuesta, Jose. 2014. “Social Spending, Distribution, and Equality of Opportunities: The Opportunity Incidence Analysis.” World Development 62: 106–24.
Cuesta, Jose and Juan Ponce. 2007. “Ex Ante Simulations of Direct and Indirect Effects of Welfare Reforms.” Review of Income and Wealth 53 (4): 645–72.
Cummins, Matthew. 2016. “Child-Focused Public Expenditure Measurement: A Compendium of Country Initiatives.” PF4C Working Paper 2, Program Division, United Nations Children’s Fund, New York.
Davis, Benjamin, Sudhanshu Handa, Nicola Hypher, Natalia Winder, Paul C. Winters, and Jennifer Yablonski, eds. 2016. From Evidence to Action: The Story of Cash Transfers and Impact Evaluation in Sub-Saharan Africa. Oxford, U.K.: Oxford University Press.
de Milliano, Marlous, and Ilze Plavgo. 2014. “CC-MODA, Cross-Country Multiple Overlapping Deprivation Analysis: Analysing Child Poverty and Deprivation in Sub-Saharan Africa.” Innocenti Working Paper WP 2014–19 (November), Office of Research, United Nations Children’s Fund, Florence.
de Neubourg, Chris, Jingqing Chai, Marlous de Milliano, Ilze Plavgo, and Ziru Wei. 2012. “Cross-Country MODA Study: Multiple Overlapping Deprivation Analysis (MODA), Technical Note.” Innocenti Working Paper WP 2012–05 (November), Office of Research, United Nations Children’s Fund, Florence.
Derviş, Kemal, Jaime de Melo, and Sherman Robinson. 1982. General Equilibrium Models for Development Policy. New York: Cambridge University Press.
EPRC (Economic Policy Research Centre), BMAU (Uganda, Budget Monitoring and Accountability Unit, Ministry of Finance, Planning, and Economic Development), and UNICEF (United Nations Children’s Fund). 2016. National Social Service Delivery Equity Atlas FY

2013/14–2014/15: Public Finance for Children. Kampala, Uganda: Ministry of Finance, Planning, and Economic Development.
Garcimartin, Carlos, Rafael Frutos, Jose Antonio Rodrigo and Manuel Rodriguez. Forthcoming. Medicion del Gasto Presupuestario en la Infancia. Propuesta Metodologica y Primeros Resultados. Universidad Juan Carlos I, Departamento de Economia.
Gordon, David, Shailen Nandy, Christina Pantazis, Simon Pemberton, and Peter Townsend. 2003. Child Poverty in the Developing World. Bristol, U.K.: Policy Press.
Hjelm, Lisa, Lucia Ferrone, Sudhanshu Handa, and Yekaterina Chzhen. 2016. “Comparing Approaches to the Measurement of Multidimensional Child Poverty.” Innocenti Working Paper WP-2016–29 (December), Office of Research, United Nations Children’s Fund, Florence.
IMF (International Monetary Fund). 2014. “Fiscal Policy and Income Inequality.” IMF Policy Paper (January 23), IMF, Washington, DC.
Inchauste, Gabriela, and Nora C. Lustig, eds. 2017. The Distributional Impact of Fiscal Policy: Evidence from Developing Countries. Washington, DC: World Bank.
Jellema, Jon, Nora C. Lustig, Astrid Haas, and Sebastian Wolf. 2016. “The Impact of Taxes, Transfers, and Subsidies on Inequality and Poverty in Uganda.” CEQ Working Paper 53 (November), CEQ Institute, Tulane University, New Orleans.
Karpati, Julia, and Chris de Neubourg. 2017. “Individuals or Households as Units of Measurement and Other Differences in Multidimensional Poverty Studies: A Policy-Oriented Assessment.” Draft paper presented during the panel “Age and Gender Specific Poverty,” at the International Statistical Institute’s 61st World Statistics Congress, Marrakech, 16–21 July.
Kheyfets, Igor, Massimo Mastruzzi, Dino Merotto, and Lars Sondergaard. 2011. “A New Data Tool to BOOST Public Spending Efficiency.” Europe and Central Asia Knowledge Brief 43, World Bank, Washington, DC.
Lelkes, Orsolya. 2007. “Tax-Benefit Microsimulation Models In Eastern Europe.” International Journal of Microsimulation 1 (1): 54–56.
Löfgren, Hans. 2004. “MAMS: An Economy-Wide Model for Analysis of MDG Country Strategies.” Working paper, World Bank, Washington, DC.
———. 2009. “Program Note: Development Strategy Analysis with MAMS.” July 29, World Bank, Washington, DC.
Lustig, Nora C., ed. 2018. Commitment to Equity Handbook. Estimating the Impact of Fiscal Policy on Inequality and Poverty. New Orleans: CEQ Institute, Tulane University; Washington, DC: Brookings Institution Press.
Lustig, Nora C., George Gray Molina, Sean Higgins, Miguel Jaramillo, Wilson Jiménez, Veronica Paz, Claudiney Pereira, Carola Pessino, John Scott, and Ernesto Yañez. 2012. “The Impact of Taxes and Social Spending on Inequality and Poverty in Argentina, Bolivia, Brazil, Mexico and Peru: A Synthesis of Results.” CEQ Working Paper 3, Commitment to Equity, Inter-American Dialogue,

Washington, DC; Center for Inter-American Policy and Research and Department of Economics, Tulane University, New Orleans.
Martinez-Vazquez, Jorge. 2008. “The Impact of Budgets on the Poor: Tax and Expenditure Benefit Incidence Analysis.” In Public Finance for Poverty Reduction: Concepts and Case Studies from Africa and Latin America, edited by Blanca Moreno-Dodson and Quentin Wodon, 113–62. Directions in Development: Poverty Series. Washington, DC: World Bank.
Meerman, Jacob. 1979. Public expenditure in Malaysia: Who Benefits and Why. New York: Oxford University Press.
MoFPED (Uganda, Ministry of Finance, Planning, and Economic Development). 2013. Annual Budget Performance Report FY 2012/13. September. Kampala, Uganda: MoFPED.
———. 2014. “Poverty Status Report 2014: Structural Change and Poverty Reduction in Uganda.” November, Kampala, Uganda: MoFPED
———. 2016. “National Budget Framework Paper FY 2016/17.” December, Kampala, Uganda: MoFPED.
Moreno-Dodson, Blanca, and Quentin Wodon, eds. 2008. Public Finance for Poverty Reduction. Concepts and Case Studies from Africa and Latin America. Directions in Development: Poverty Series. Washington, DC: World Bank.
Republic of Uganda and UNICEF. 2016. Rethinking Public Finance for Children. Monitoring for Results. Kampala, Republic of UNICEF.
Selowsky, Marcelo. 1979. Who Benefits from Government Expenditure? A Case Study of Colombia. New York: Oxford University Press.
Shah, Anwar, ed. 2003. Public Expenditure Analysis. Public Sector Governance and Accountability Series. Washington, DC: World Bank.
UBS (Uganda Bureau of Statistics). 2014. Uganda National Household Survey 2012/13. Kampala, Uganda: UBS.
UNICEF (United Nations Children’s Fund). 2016. “UNICEF’s Engagement in Influencing Domestic Public Finance for Children (PF4C): A Strategic Framework, 2016–2030. UNICEF, New York.
van de Walle, Dominique. 1996. “Assessing the Welfare Impacts of Public Spending.” Policy Research Working Paper 1670, World Bank, Washington, DC.
van de Walle, Dominique, and Kimberly Nead, eds. 1995. Public Spending and the Poor: Theory and Evidence. Baltimore: Johns Hopkin University Press.
Wilkinson, Kate. 2009. “Adapting Euromod for Use in a Developing Country: The Case of South Africa and Samod.” Euromod Working Paper EMS5/09 (May), Institute for Social and Economic Research, University of Essex, Colchester, U.K.

World Bank. 2016a. Poverty and Shared Prosperity 2016: Taking On Inequality. Washington, DC: World Bank.
———. 2016b. “Chile: Distributional Effects of 2014 Tax Reform.” Latin America and Caribbean Region, World Bank, Washington, DC.
———. 2016c. The Uganda Poverty Assessment Report 2016: Farms, Cities, and Good Fortune, Assessing Poverty Reduction in Uganda from 2006 to 2013. Report ACS18391 (September). Washington, DC: World Bank.
Wulf, Luc H. De. 1975. “Fiscal Incidence Studies in Developing Countries: Survey and Critique.” IMF Staff Paper 22 (1): 61–131.
Younger, Stephen D., Flora Myamba, and Kenneth Mdadila. 2016. “Fiscal Incidence in Tanzania.” CEQ Working Paper 36 (January), CEQ Institute, Tulane University, New Orleans.