COMBINING HISTORIC AND CONTEMPORARY FIA DATA TO ASSESS LONG-TERM TRENDS: THE LONGLEAF PINE FOOTPRINT...
23
COMBINING HISTORIC AND CONTEMPORARY FIA DATA TO ASSESS LONG-TERM TRENDS: THE LONGLEAF PINE FOOTPRINT IN THE SOUTH William Burkman Christopher M. Oswalt Analysis completed with contributions from: Christopher W. Woodall Horace W. Brooks
-
Upload
camron-mitchell -
Category
Documents
-
view
218 -
download
1
Transcript of COMBINING HISTORIC AND CONTEMPORARY FIA DATA TO ASSESS LONG-TERM TRENDS: THE LONGLEAF PINE FOOTPRINT...

COMBINING HISTORIC AND CONTEMPORARY FIA DATA TO ASSESS LONG-TERM TRENDS: THE LONGLEAF PINE FOOTPRINT IN THE SOUTH
William BurkmanChristopher M. Oswalt
Analysis completed with contributions from:Christopher W. WoodallHorace W. Brooks

LON
GLE
AF P
INE IN
TH
E S
OU
TH
ER
N U
NIT
ED
STA
TES
Outline
• Brief background
• Methods of Investigation
• Results• Latitudinal/Longitudinal shifts• Central range thinning
• Highlights from FIA assessment
•Comments on outlook
Photo – Stephen F. Austin
LON
GLE
AF P
INE IN
TH
E S
OU
TH
ER
N U
NIT
ED
STA
TES
Background
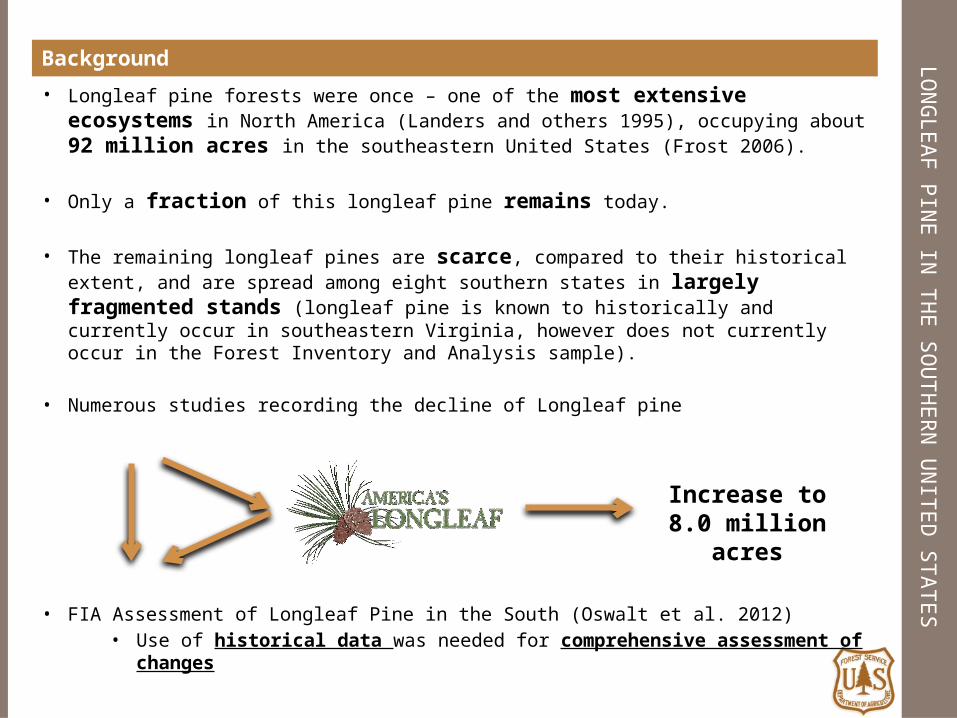
• Longleaf pine forests were once – one of the most extensive ecosystems in North America (Landers and others 1995), occupying about 92 million acres in the southeastern United States (Frost 2006).
• Only a fraction of this longleaf pine remains today.
• The remaining longleaf pines are scarce, compared to their historical extent, and are spread among eight southern states in largely fragmented stands (longleaf pine is known to historically and currently occur in southeastern Virginia, however does not currently occur in the Forest Inventory and Analysis sample).
• Numerous studies recording the decline of Longleaf pine
• FIA Assessment of Longleaf Pine in the South (Oswalt et al. 2012)• Use of historical data was needed for comprehensive assessment of changes
Increase to 8.0 million acres

LON
GLE
AF P
INE IN
TH
E S
OU
TH
ER
N U
NIT
ED
STA
TES
Change in longleaf dominated stands – 1970’s to 2010
1970’s 2010
15 percent 7 percent
Oswalt et al. In Press
Longleaf pine = 3,300,717
LLP – Oak = 984,637

LON
GLE
AF P
INE IN
TH
E S
OU
TH
ER
N U
NIT
ED
STA
TES

LON
GLE
AF P
INE IN
TH
E S
OU
TH
ER
N U
NIT
ED
STA
TES

LON
GLE
AF P
INE IN
TH
E S
OU
TH
ER
N U
NIT
ED
STA
TES
Methods
• 1970’s vs. 2010
• Periodic, asynchronous inventories vs. Annual, continuous inventories
• Total Plots
State Forested plots LLP plots Forested plots LLP plotsAlabama 3,710 614 4,120 316 Florida 4,419 1,261 2,998 468 Georgia 5,926 987 4,516 280 Louisiana 2,481 262 2,469 123 Mississippi 2,780 326 3,547 188 North Carolina 4,732 341 3,524 128 South Carolina 3,986 634 2,433 206 Texas 1,961 109 2,192 29 Virginia 4,028 - 2,976 -
All 34,023 4,534 28,775 1,738
1970 2010
State 1970's 2010Alabama 1972 2011Florida 1970 2010Georgia 1972 2011Louisiana 1974 2010Mississippi 1977 2010North Carolina 1974 2011South Carolina 1978 2011Texas 1975 2010Virginia 1977 2010

LON
GLE
AF P
INE IN
TH
E S
OU
TH
ER
N U
NIT
ED
STA
TES
Methods – Forest type definitions
• Longleaf pine - 141• Longleaf pine occurs as a pure type comprises a majority of trees in the
overstory • Associates – Slash, loblolly and shortleaf pine, southern red oak, blackjack
oak, water oak, persimmon, and sweetgum• Sites – those areas that can and do burn on a periodic basis – usually occurs
on middle and upper slopes with low severity brush or hardwood competition
• Longleaf pine – Oak - 403• Associates – Longleaf pine and scrub oaks – primarily turkey oak, bluejack
oak, blackjack oak, and dwarf post oak• Sites – Common on sandhills where soils are dry, infertile, and coarse-
textured

LON
GLE
AF P
INE IN
TH
E S
OU
TH
ER
N U
NIT
ED
STA
TES
Graphical descriptions of forest types
Longleaf pine forest type
Longleaf pine – Oak forest type

LON
GLE
AF P
INE IN
TH
E S
OU
TH
ER
N U
NIT
ED
STA
TES
•
• Combine Outer Range analysis techniques from Woodall et al. (2009) with longitudinal band analysis techniques from Kai et al. (2012).
• Woodall et al. (2008 and 2009) describes the inherent difficulty in comparing historical and contemporary FIA Inventories.
• Here we overcome those difficulties by:• Greater electronic availability of historical data• Not examining seedlings• Greater similarity in periodic inventories within a single region• No attempt made at linking causality to long-term phenomenon (changing climate) that
would require a large span of time between inventories

LON
GLE
AF P
INE IN
TH
E S
OU
TH
ER
N U
NIT
ED
STA
TES
Methods
Defining the “Outer Range” (sensu Woodall et al. 2009 - also see Zhu et al. 2012)
90th & 10th percentiles calculated based on 1970’s presence
Eastern, Western, Southern, & Northern Outer Ranges (EOR, WOR, NOR, & SOR, respectively).
Primary focus was on “Outer Ranges” – The “heart” of the LLP range was investigated further for changes in area et al.

LON
GLE
AF P
INE IN
TH
E S
OU
TH
ER
N U
NIT
ED
STA
TES
Methods
• Comparison between decades of:• Mean latitude by 1 degree longitude classes• Mean longitude by 1 degree latitude classes
• Welch’s two-sample t-test
• Comparison across decades of:• Mean area• Mean biomass
• Welch’s two-sample t-test• Transformations• Presentation of back-transformed metrics
•

LON
GLE
AF P
INE IN
TH
E S
OU
TH
ER
N U
NIT
ED
STA
TES
Mean Latitude – Longitude for 1970 & 2010
Mean longitude
-90 -88 -86 -84 -82 -80 -78 -76L
atitu
de
class
26
28
30
32
34
36
38
19702010
Longitude class
-100 -95 -90 -85 -80 -75
Me
an
latitu
de
30
31
32
33
34
35
36
19702010

LON
GLE
AF P
INE IN
TH
E S
OU
TH
ER
N U
NIT
ED
STA
TES
Changes in Latitude
Longitude class
-88 -86 -84 -82 -80 -78 -76 -74
Mean latitude
34.0
34.2
34.4
34.6
34.8
35.0
35.2
35.4
35.6 19702010
Longitude class
-96 -94 -92 -90 -88 -86 -84 -82 -80M
ean latitude
28.2
28.4
28.6
28.8
29.0
29.2
29.4
29.6
29.8
30.0
30.2
19702010
Northern Outer Range Southern Outer Range

LON
GLE
AF P
INE IN
TH
E S
OU
TH
ER
N U
NIT
ED
STA
TES
Changes in Longitude
Mean longitude
-80.0 -79.5 -79.0 -78.5 -78.0 -77.5 -77.0 -76.5L
atitu
de
class
32
33
34
35
36
37
38
19702010
Mean longitude
-93.5 -93.0 -92.5 -92.0 -91.5 -91.0 -90.5
La
titud
e cla
ss
29.5
30.0
30.5
31.0
31.5
32.0
32.5
33.0
33.5
19702010
Western Outer Range Eastern Outer Range

LON
GLE
AF P
INE IN
TH
E S
OU
TH
ER
N U
NIT
ED
STA
TES

LON
GLE
AF P
INE IN
TH
E S
OU
TH
ER
N U
NIT
ED
STA
TES

LON
GLE
AF P
INE IN
TH
E S
OU
TH
ER
N U
NIT
ED
STA
TES
Potential “Thinning”
LON
GLE
AF P
INE IN
TH
E S
OU
TH
ER
N U
NIT
ED
STA
TES
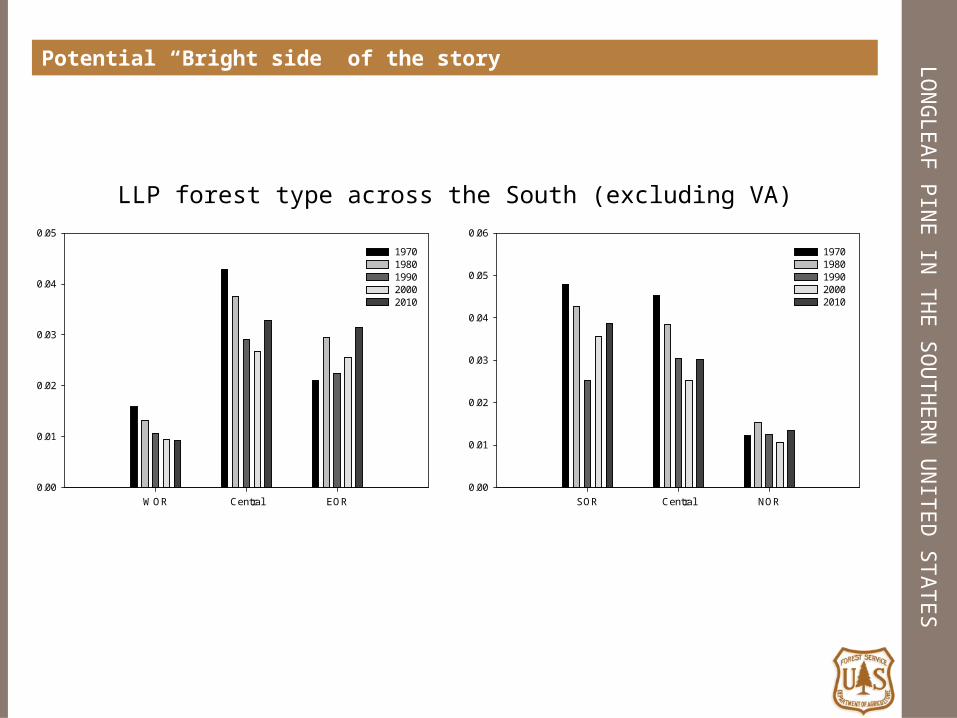
Potential “Bright side” of the story
WOR Central EOR
Relative frequency
0.00
0.01
0.02
0.03
0.04
0.05
19701980199020002010
SOR Central NORR
elative frequency
0.00
0.01
0.02
0.03
0.04
0.05
0.06
19701980199020002010
WOR Central EOR
Relative frequen
cy
0.00
0.01
0.02
0.03
0.04
0.05
19701980199020002010
SOR Central NOR
Relative frequen
cy
0.00
0.01
0.02
0.03
0.04
0.05
0.06
19701980199020002010
LLP forest type across the South (excluding VA)

LON
GLE
AF P
INE IN
TH
E S
OU
TH
ER
N U
NIT
ED
STA
TES
From the FIA Assessment – Change in Diameter Distribution

LON
GLE
AF P
INE IN
TH
E S
OU
TH
ER
N U
NIT
ED
STA
TES
Challenges to Using Historical Data
• Electronic Availability • Regional differences in temporal richness of available data
• SRS – 1970’s• NRS – 1980’s • RMRS – 1980’s• PNWRS – 1990’s
• Temporal Consistency of Variables• Great example – collection of seedling data• Many others
• Temporal Consistency of Inventory Design• Multiple designs• Changes, Changes, Changes
• None of these challenges are insurmountable.• However, all of these challenges impact the strength of inferences that can be
made and the confidence in those inferences.
State 1970’s 1980’s 1990’sAL 1972 1982 1990AR 1978 1988 1995FL 1970 1980, 1987 1995GA 1972 1982, 1989 LA 1974 1984 1991MS 1977 1987 1994NC 1974 1984 1990OK (East) 1976 1986 1993SC 1978 1986 1993TN 1980, 1989 TX (East) 1975 1986 1992VA 1977 1985 1992
SC 1968 also available electronicallyVA 1984 renamed 1985

LON
GLE
AF P
INE IN
TH
E S
OU
TH
ER
N U
NIT
ED
STA
TES
CONCLUSION
Combination of Woodall’s “Outer Range” and Zhu’s “Longitudinal Bands”
Longleaf pine “footprint” has contracted since 1970
Most significant contraction in Northeast of range
“Rebounding” from low may be occurring
FIA data and analyses good at helping identify large-scale conservation issues – not so good (in many cases) at identifying cause and effect

William Burkman Christopher M. Oswalt
[email protected] [email protected] 865-862-2068Knoxville, TN Knoxville, TN