CMO Industry Update - PharmSource · 2016-04-29 · CMO Industry Update Interphex 2016 April 27,...
18
CMO Industry Update Interphex 2016 April 27, 2016 Jim Miller PharmSource www.pharmsource.com 1
Transcript of CMO Industry Update - PharmSource · 2016-04-29 · CMO Industry Update Interphex 2016 April 27,...

CMO Industry Update
Interphex 2016 April 27, 2016
Jim Miller
PharmSource
www.pharmsource.com 1

Agenda
• Market conditions overview
• Industry M&A activity and its
implications
www.pharmsource.com 2

Results reflect pipeline
and small molecule strength
8.7%
4.1%
0.7%
11.0%
0.0%
2.0%
4.0%
6.0%
8.0%
10.0%
12.0%
DEV CLIN DP DS
Bio/Pharma Services Revenue Growth
2014-2015 Company Segment Growth
Cambrex DS 24%
Dottikon DS 7%
Lonza DS 10%
AMRI DS 7%
Avid DS 20%
Sharp PKG 37%
Patheon DP 5%
Baxter DP -10%
Catalent DEV 7%
Metrics DEV 9%
SGS DEV 7%
Charles River DEV 8%
www.pharmsource.com 3
Dev = development services
CLIN = clinical research
DP = dose manufacturing
DS = API manufacturing
Source: Public company reports
Individual Company Performance
2015 vs. 2014

NDA approvals are way up
10 12 10 11 22
33 17 17 18 16
10 3 8 20
17
15
19 13 22 23
37
30 23
36 31
24
27 27
38 49
39
28 37
21 27 22
25 33
23
28
0
20
40
60
80
100
120
140
2006 2007 2008 2009 2010 2011 2012 2013 2014 2015
Mid Size
Global
Smallcommercial
Generic
www.pharmsource.com 4
Global bio/pharma has returned as major driver
Source: PharmSource CMO Scorecard

Market environment
Propensity to outsource unchanged
0%
10%
20%
30%
40%
50%
60%
70%
80%
90%
Generic SmallCommercial
Global Mid Size All
2015 2010-2014
www.pharmsource.com 5
Source: PharmSource CMO Scorecard

Market environment
Clinical activity indicators are positive
0
100
200
300
400
500
600
700
800
900
IND Filings at FDA 2009-2015
NDA/BLA Biosimilars
0
20
40
60
80
100
120
140
160
2013 2014 2015
NDA Submissions to FDA
NMEs Non-NMEs
www.pharmsource.com 6
0
200
400
600
800
1,000
1,200
1,400
1,600
1,800
20
08
20
09
20
10
20
11
20
12
20
13
20
14
20
15
20
16
Q1 New Registrations in clinicaltrials.gov
Phase 1 Phase 2
Phase 3
Source: FDA Source: FDA Source: clinicaltrials.gov

Market environment
Financing and R&D spend have been strong
$-
$5
$10
$15
$20
$25
$30
$35
$40
$45
2008 2009-12 2013/14 2015
$ B
illi
on
Funding to Early Stage Companies
Other Private equity
IPO Secondary offering
Venture capital Upfront license fees
www.pharmsource.com 7
Source: PharmSource Lead Sheet
$-
$20
$40
$60
$80
$100
2010 2011 2012 2013 2014 2015
US
$ B
illi
on
s
R&D Spending by Top 25 Bio/Pharma Companies
Top 25 companies spending
20% of revenue on R&D
Source: public financial reports
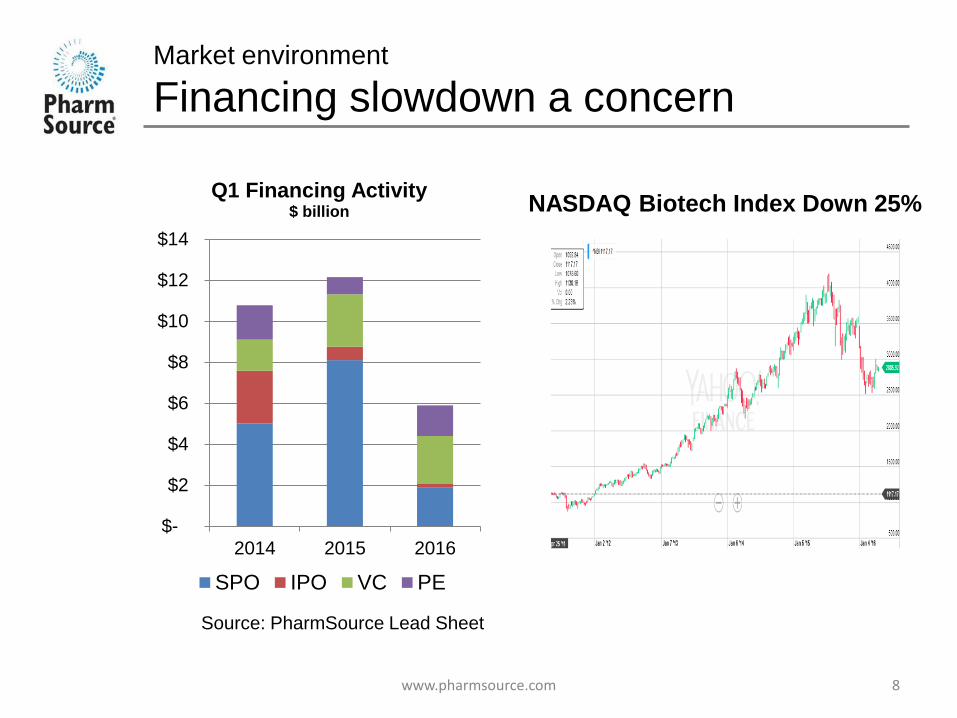
Market environment
Financing slowdown a concern
$-
$2
$4
$6
$8
$10
$12
$14
2014 2015 2016
Q1 Financing Activity $ billion
SPO IPO VC PE
www.pharmsource.com 8
Source: PharmSource Lead Sheet
NASDAQ Biotech Index Down 25%

Market conditions takeaways
• Financing picture bears watching
– Bio/pharma funding always cyclical
– Lower valuations means fewer deals and less $ per deal
– “What if we can’t replace what we spend?”
• CMO dependence on small bio/pharma at risk
when global bio/pharma dominates funding,
pipeline and approvals
www.pharmsource.com 9

M&A re-shaping CDMO industry
Target
API Dose Other
Bu
yer
AP
I
AMRI/Gadea
AMRI/Cedarburg
Siegfried/BASF CM
Novacap/Chemie Uetikon
Siegfried/Hameln
Piramal/Coldstream Labs
AMRI/Aptuit Glasgow
AMRI/Oso
AMRI/Whitehouse Labs
Johnson-
Matthey/Pharmorphix
AMRI/SSCI
Do
se Patheon/Irix
Patheon/Gallus
Catalent/Micron Tech
Capsugel/Xcelience
Synerlab/Alcala Farma
Patheon/Agere
Recipharm/Kemwell
Oth
er PCI/Penn Pharma BioDuro/Formex
Charles River/WIL-QS
Evans Analytical/ABC Labs
www.pharmsource.com 10
Lots more to come
• PE holding periods maturing
• IPO market is difficult
• Strategic buyers scramble for assets
Source: PharmSource STRATEGIC ADVANTAGE database

M&A
Deal values have been rich
Year Buyer Target Service
Value
US$ M
Revenue
Multiple
EBITDA
Multiple
2012
Patheon
Banner Dose $ 269 1.1 x 10 x
2014 Gallus Bio API $ 257 2.6 x
2015 Irix SM API $ 161 1.6 x
2012
Siegfried
Alliance Medical Dose $ 58 2.9 x
2014 Hameln Dose $ 62 0.7 x
2015 BASF assets SM API $ 300 1.0 x
2014
AMRI
Oso Bio Dose $ 110 1.9 x 11 x
2014 Cedarburg SM API $ 41 2.2 x 7.5 x
2015 Gadea SM API $ 174 2.1 x 9 x
2015 Shenxhen
Hepalink
Cytovance Bio API $ 206 5.0 x
2015 Piramal Coldstream Labs Dose $ 31 2.2 x
2014 Consort Aesica Dose $ 374 1.3 x 11.5 x
2016 Recipharm
Kemwell Biopharma Dose $ 205 2.2 x 15.0 x
2016 Nitin Lifesciences (74%) Dose $ 102 2.9 x 11.7 x
www.pharmsource.com 11
Source: PharmSource STRATEGIC ADVANTAGE database
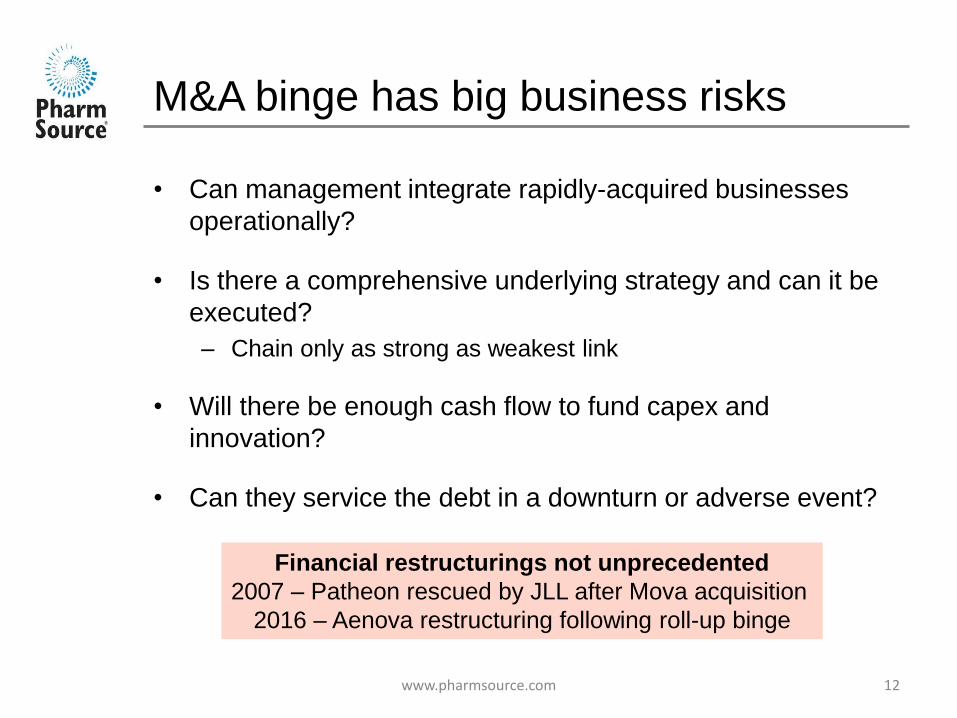
M&A binge has big business risks
• Can management integrate rapidly-acquired businesses
operationally?
• Is there a comprehensive underlying strategy and can it be
executed?
– Chain only as strong as weakest link
• Will there be enough cash flow to fund capex and
innovation?
• Can they service the debt in a downturn or adverse event?
www.pharmsource.com 12
Financial restructurings not unprecedented
2007 – Patheon rescued by JLL after Mova acquisition
2016 – Aenova restructuring following roll-up binge

Ultimate endpoint: full service CMO
13 www.pharmsource.com
• Complete suite of
offerings • Component
• Scale
• Technology
• Principal examples
• Patheon
• Catalent
• Siegfried
• AMRI
• Corden Pharma
• Fareva

What is the full service model really about?
• Response to slow organic growth • Dose CMOs generally growing in single digits
• Achieving breadth and scale • Capture more client spend with broader service offering
• Cost savings in sales, marketing, G&A
• Private equity opportunity to employ capital • PE firms like roll-up model
• Response to customer desire to work with fewer suppliers • Pricing leverage, lower vendor management costs
www.pharmsource.com 14
Challenge:
Can CMOs create real value in full service model?

Two successful routes to full service CMO model
Acquired asset Redundant facility CMO business
Route • Acquire unneeded facility from
bio/pharma company
• Acquire functioning CMO
Advantages • Low capital cost
• Contracts for legacy products
• Immediate EBITDA
• Established client base and
reputation
• Appropriate cost structure
• Established service culture
• US opportunities
• Larger top line increments
Disadvantages • High cost base
• Legacy products in decline
• Underutilized capacity
• Must create service culture
• Technology may be old
• Mostly limited to Europe
• High initial investment
• High purchase multiple
• Integration costs and risks
Examples • Fareva
• Corden Pharma
• Patheon
• AMRI
• Siegfried
www.pharmsource.com 15

Growing number of very large CMOs
Size Company Route
Bio
API
SM
API Dose Develop
$1+
billion
Lonza Organic
Patheon CMO acquisition
Catalent CMO acquisition
$500+
million
Aenova CMO acquisition
Fareva Facility acquisition
Siegfried CMO acquisition
Evonik Organic
Vetter Organic
B-I Organic
Famar Facility acquisition
Recipharm CMO acquisition
www.pharmsource.com 16
Source: PharmSource analysis

Final thoughts
• CDMO scale increasingly important but will
it be enough?
– Strategy, integration, operational skills key
• Buyers should do careful due diligence for
operational and financial risks
• CMOs may have to learn how to sell again
www.pharmsource.com 17

18 www.pharmsource.com