Climate Change Southern Africa - · •Climate change can be described as shift in long-term mean...
18
Climate Variability and Observed Change in Southern Africa A C Kruger Climate Service South African Weather Service Templ ref: PPT-ISO-colour.001 Doc Ref no: CLS-RES-PRES-201302-1
Transcript of Climate Change Southern Africa - · •Climate change can be described as shift in long-term mean...
Climate Variability and Observed Change in Southern Africa
A C KrugerClimate Service
South African Weather Service
Templ ref: PPT-ISO-colour.001 Doc Ref no: CLS-RES-PRES-201302-1

Templ ref: PPT-ISO-colour.001 Doc Ref no:CLS-RES-PRES-201302-1
Introduction
•Climate change can be described as shift in long-term mean or change in occurrence of extreme events.
•Frequencies of extremes can change over long-term; due to shift in mean and/or increase in variability.
•Society experiences climate change primarily through increased intensity / frequency of extreme weather events.
•In general: Expectation of more frequent and intense warm events, and less frequent cold events.
•Regional differences in magnitudes of climate change evident → need for historical trend studies to cover as much of the globe as possible.

Identification of historical climate trendsChallenges:
• Data quality,
• Available parameters – rainfall and temperature most widely measured.Other parameters increasing in importance: e.g. wind for wind energy potential and proper design of infrastructure – limited long-term measurements available.
•Metadata (e.g. move of stations, instrument types, changes in exposure, roughness etc.)
•Lengths of records,
•Spatial density,• Optimal assessment of trends => max period with sufficient density of continuous measurements;
Templ ref: PPT-ISO-colour.001 Doc Ref no:CLS-RES-PRES-201302-1

Observed trends
•The determination of historical climate change important for:1. Identification of regions which has become stressed,2. Verification of climate models.
•Focus on mean trends & trends in extremes.
•Internationally recognised indices - developed by WMO ETCCDI.
WMO extreme temperature indices applicable to South Africa
Templ ref: PPT-ISO-colour.001 Doc Ref no:CLS-RES-PRES-201302-1

Global Analyses
•HadEx and HadEX2 datasets – collation of data & analyses with WMO indices•HadEX2 - Donat et al. 2013.
•Largest gaps in sparsely populated regions, e.g. Africa, Amazon basin
Data sources for HadEX2 – Donat et al. 2013
Templ ref: PPT-ISO-colour.001 Doc Ref no:CLS-RES-PRES-201302-1

Temperature extremes•Global and regional trends:
• Max temps: Annual number of days increased; cool days decreased• Min temps: Cool nights decreased, warm nights increased.• Southern Africa – stronger trends for 1951-2010 vs. 1901-2010.
Templ ref: PPT-ISO-colour.001 Doc Ref no:CLS-RES-PRES-201302-1

• South Africa: 1961 – 2010 (28 stations) (Kruger & Sekele, 2012):• Spatially variable results, but general increase of warm days and nights (Tx90P
and Tn90P) and decreases cold days and nights (Tx10P and Tn10P);
• N and S Cape => greatest increases: Warm days (TX90P): 2 – 4 days / decade:
Templ ref: PPT-ISO-colour.001 Doc Ref no:CLS-RES-PRES-201302-1

• South Africa - mean trend +- 0.174°C / decade (1961 – 2010)• Similar to increasing global trend +- 0.177°C / dec ade
Templ ref: PPT-ISO-colour.001 Doc Ref no:CLS-RES-PRES-201302-1

• Analyses of longer time series => confirm likelihood that warming accelerated since the mid-1960’s;
Increase in number of warm days at Cape Agulhas: 1911 – 2009.
Templ ref: PPT-ISO-colour.001 Doc Ref no:CLS-RES-PRES-201302-1

Annual extremes•Annual maximum and minimum temperature
• Weaker global signal• Fewer regions with significant trends• Extreme temperatures not always attributable to anthropogenic climate change• E.g. southern Africa – no regional significant trends.
Templ ref: PPT-ISO-colour.001 Doc Ref no:CLS-RES-PRES-201302-1
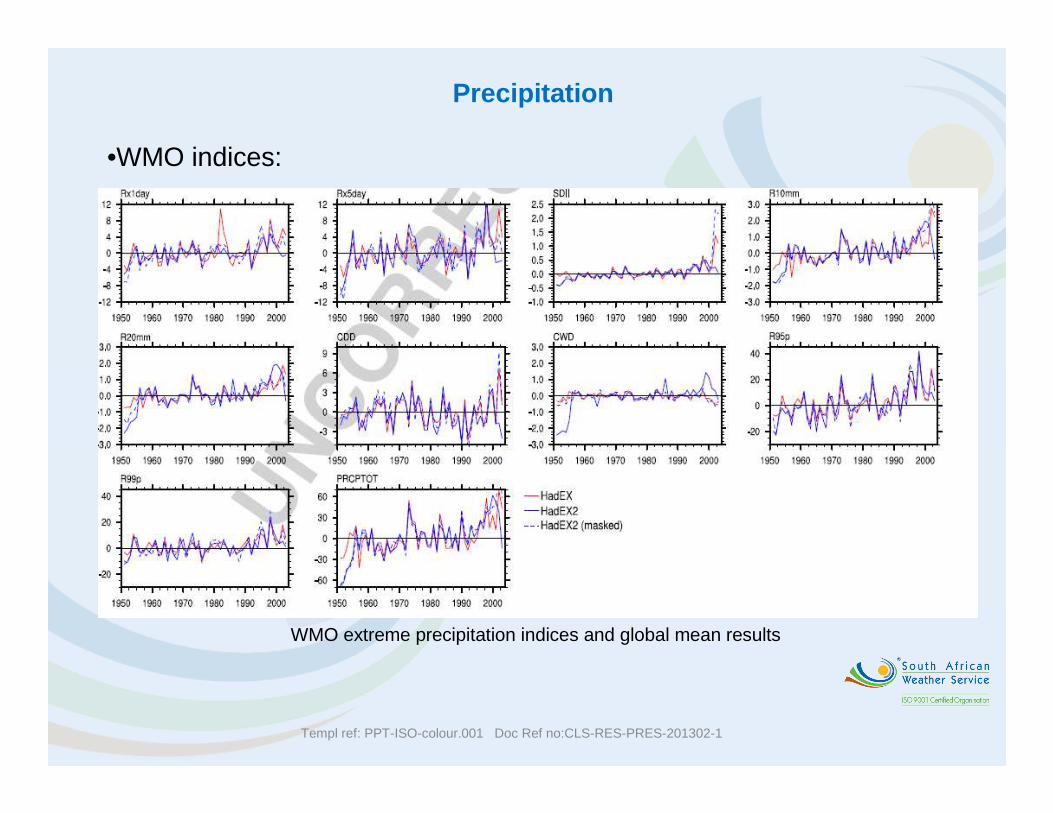
Precipitation
•WMO indices:
WMO extreme precipitation indices and global mean results
Templ ref: PPT-ISO-colour.001 Doc Ref no:CLS-RES-PRES-201302-1

• Tendency toward wetter conditions;• Intensity, frequency, and duration of extreme precipitation is
increasing on average;• Results spatially highly variable – regional results of extreme
indices limited to South Africa.
Templ ref: PPT-ISO-colour.001 Doc Ref no:CLS-RES-PRES-201302-1

• 1910 – 2004 study: Region covering S Free State and most of Eastern Cape province: Significantly positive trends in amount of annual precipitation from extreme daily events.
Templ ref: PPT-ISO-colour.001 Doc Ref no:CLS-RES-PRES-201302-1
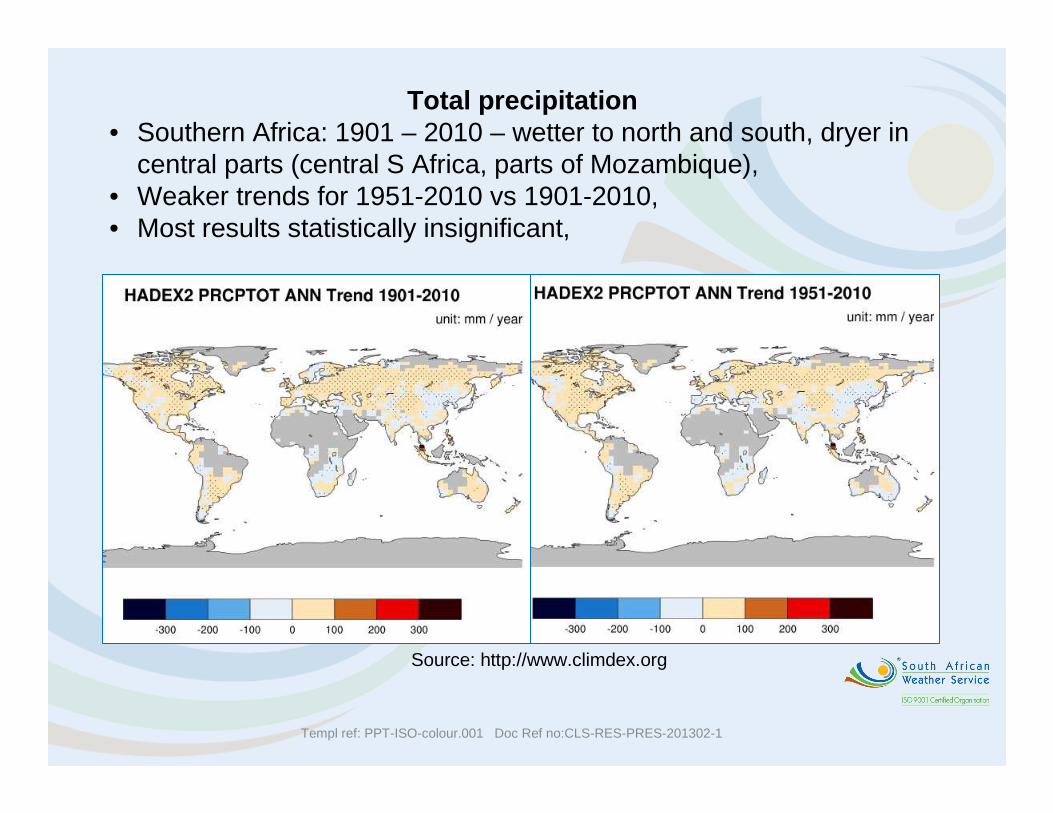
Total precipitation• Southern Africa: 1901 – 2010 – wetter to north and south, dryer in
central parts (central S Africa, parts of Mozambique),• Weaker trends for 1951-2010 vs 1901-2010,• Most results statistically insignificant,
Source: http://www.climdex.org
Templ ref: PPT-ISO-colour.001 Doc Ref no:CLS-RES-PRES-201302-1

• South Africa: no countrywide consistency in trends for 1911 - 2004,• Most results statistically insignificant,• Update of results – more stations and more stringent QC procedures.
Templ ref: PPT-ISO-colour.001 Doc Ref no:CLS-RES-PRES-201302-1

Wind
•Mean wind – general tendency for lower mean wind speed – Changes in surface roughness or changes in mean circulation?
•Extreme wind – most studies indicate little or no trend.
Global distribution of observed u trends (McVicar et al., 2012).
Templ ref: PPT-ISO-colour.001 Doc Ref no:CLS-RES-PRES-201302-1

Conclusions
General warming over the region and accelerating trends evident from long-term climate stations
Mixed results from rainfall trends – regional results sparse
Suggestions
•Identification of regional long-term key stations, especially those still operational;•Metadata from regional stations•Proper data quality control•Regional contribution to global analyses•On-going data rescue•Sector-specific indices (e.g. health)•Strategic expansion of observation network
Templ ref: PPT-ISO-colour.001 Doc Ref no:CLS-RES-PRES-201302-1
THANK YOU
Templ ref: PPT-ISO-colour.001 Doc Ref no:CLS-RES-PRES-201302-1