SCAG Climate Change and the Future of Southern Californiasustain.scag.ca.gov/Sustainability Portal...
92
SOUTHERN CALIFORNIA ASSOCIATION OF GOVERNMENTS CLIMATE CHANGE and the FUTURE of SOUTHERN CALIFORNIA JULY 2009
Transcript of SCAG Climate Change and the Future of Southern Californiasustain.scag.ca.gov/Sustainability Portal...

SOUTHERN CALIFORNIA ASSOCIATION OF GOVERNMENTS
CLIMATE CHANGE and the FUTURE of S O U THE R N C A L IF O R NI A
JULY 2009


JULY 2009
SOUTHERN CALIFORNIA ASSOCIATION OF GOVERNMENTS
CLIMATE CHANGE and the FUTURE of S O U THE R N C A L IF O R NI A

The preparation of this report has been financed in part through grants from the Federal Highway Administration and Federal Transit Administration, U.S. Department of Transportation, under the Metropolitan Planning Program, Section 104(f) of Title 23, U.S. Code. The contents of this report do not necessarily reflect the official views or policy of the U.S. Department of Transportation. Additional assistance was provided by the California Department of Transportation.
MISSION STATEMENT
Under the guidance of the Regional Council and in collaboration with our partners, our mission is to facilitate a forum to develop and foster the realization of regional plans that improve the quality of life for Southern Californians.
iv
REGIONAL COUNCIL
OFFICERS
President: Jon Edney, El Centro First Vice President: Larry McCallon, Highland Second Vice President: Pam O’Connor, Santa Monica Immediate Past President: Richard Dixon, Lake Forest
MEMBERS
Imperial County:
Los Angeles County:
Orange County:
Riverside County
San Bernardino County:
Ventura County:
Tribal Government Representative:
Orange County Transportation Authority:
Riverside County Transportation Commission:
San Bernardino Associated Governments:
Ventura County Transportation Commission:
7/2/09
COMMITTEE CHAIRS
Community, Economic and Human Development: Energy & Environment Committee: Transportation Committee: Executive/Administration Committee: Jon Edney, El Centro
COMMUNITY, ECONOMIC AND HUMAN DEVELOPMENT
COMMITTEE
v


Preface ...............................................................................................................2
Introduction and Summary ................................................................................4
Climate Change – What Should Southern California Prepare for? ................10
Dan Cayan
Peak Oil and Climate Change: Scenarios and Implications ...........................22
n
n
How Planning Can Combat Climate Change in Southern California ..............36
n
Green Buildings – A Tool for Stemming Climate Change? .............................40
s
Education for a Green Region ..........................................................................48
Mona Field
Governance and Financing Policy in Southern California: Transformative
Changes to Achieve Climate Change Goals ....................................................54
Dan Mazmanian, Mark Pisano, Richard Little, Alison Linder
Climate Disruption: Searching for Sustainability in Southern California ......62
Monty Hempel
Guest Essay Authors by Title ...........................................................................68
Overview of AB 32 and SB 375 ........................................................................72
Greenhouse Gas Reduction Best Practice Guide and Resources ...................76
Acronyms .........................................................................................................80
Acknowledgements .........................................................................................81

Climate Change and the Future of Southern California
PrefacePreface
Climate Change and the Future of Southern California is an essays publication which introduces readers to the scenarios, impacts and potential responses with respect to climate change. It is written mainly from the perspective of Southern California. A primary objective is to disseminate information and perspectives about climate change, particularly with respect to its impacts under various scenarios, and to illustrate how Southern California could respond to address this global challenge.
It should be noted that this publication may not capture the full spectrum of opinions and perspectives on the science of climate change or its underlying causes. Discussions of this subject can be found from numerous sources. The primary intent of this set of essays is to focus on potential impacts and response options for the Southern California region. Our hope is to continue raising the awareness and understanding of climate change issues and facilitate constructive policy dialogues and actions.
The Southern California Association of Governments (SCAG) is the largest regional planning organization in the nation. The SCAG region, also referred to as Southern California in this report, includes six counties (Imperial, Los Angeles, Orange, Riverside, San Bernardino and Ventura) and 189 cities. Currently, with almost 19 million residents, it is also one of the top global gateway regions and would rank 15th among all national economies in the world.
For the past ten years, SCAG published the State of the Region Report and Report Card each year to track and assess the progress of the region. Each State of the Region Report also included essays prepared by experts in the respective fields. These essays explored the underlying factors and dynamics of selected regional issues, and discussed policy implications. Beginning in 2009, SCAG will publish the essays separately on an annual
basis to continue highlighting important regional issues and their policy implications. In addition, SCAG will publish the State of the Region Report and Report Card every two years instead of annually so that cumulative changes would be more likely to be detected.
The purpose of the new annual essays publication program is to provide a forum for deliberation on one significant regional issue. The audiences include elected officials, key local government/agency staff, planning partners/stakeholders for the region, as well as the general public. One of the objectives is to inform and assist policy formulation and implementation through an integrated regional planning approach. For the first essays publication, the Benchmarks Task Force selected climate change as its focus given its regional and global significance.
In focusing on one overarching regional issue in the annual essays publication, we also hope to gain additional knowledge about our region, including its strengths, weakness, and potential threats and opportunities it might face. With more understanding, we can better prepare for the future of our region.
Preparation of Climate Change and the Future of Southern California was guided by SCAG’s Benchmarks Task Force, consisting of local elected officials and regional issue experts in Southern California. The complete 2009 climate change essays report, along with past State of the Region Reports, has been posted on the SCAG website at www.scag.ca.gov/publications.

Preface
33
SCAG Region

Climate Change and the Future of Southern California
Background
Climate change has become a critical issue affecting the future of Southern California and the entire global community. Assessments from the international and national scientific communities, notably the Intergovernmental Panel on Climate Change (IPCC) and the National Academy of Sciences, have
found that the Earth has been warming at an accelerated pace. In addition to warming temperatures, recent changes in a large number of other measures have been linked to climate change.
Since the beginning of the 20th century, average global temperatures have already risen 1.4̊ F, with much of the warming occurring within the last 30 years (Figure 1).1 The year 2005 was Earth’s warmest year followed by 2007, and the fourteen warmest years on record have all occurred since 1990. Looking forward, temperatures will likely rise at least another 2̊ F, and possibly more than 11̊ F by the end of the 21st century.2
Since the beginning of the Industrial Revolution, increasing greenhouse gas (GHG) emissions due to human activities, particularly the use of fossil fuels, have led to a marked increase in atmospheric GHG concentrations that absorb the heat. These GHGs, predominantly (77 percent) carbon dioxide (CO2), also include methane (CH4), nitrous oxide (N2O), hydrofluorocarbons (HFCs), perfluorocarbons (PFCs) and sulfur hexafluoride (SF6). GHGs are not quickly purged from the atmosphere – CO2 has a residence time of more than 100 years. So the effects of high GHG emissions on the Earth’s climate will be felt for several decades into the future. Between 1750 and 2006, annual global CO2 emissions from fossil fuel burning increased from 3 million metric tons to 8.4 billion metric tons (Figure 2). In particular, annual global CO2 emissions from fossil fuel burning since 1950 have increased more than 5 times, from 1.6 billion metric tons to 8.4 billion metric tons.
Introduction and Summary
Average Global Temperature, 1880 - 2007
59.0
annual average
5-year average
58.5
58.0
57.5
57.0
56.5
56.0
55.5
55.019001880 20001940 1960 19801920
Source: NASA Goddard Institute for Space Studies (GISS)
Degr
ees
Fahr
enhe
it
Figure 1

Introduction and Summary
55
Figure 2
Annual Global Carbon Dioxide Emmissions from Fossil Fuel Burning, 1751-2006
Source: G. Marland, T. A. Boden, and R. J. Andres, “Global, Regional, and National CO2 Emissions,” Trends: A Compendium of Data on Global Change (Oak Ridge, TN: Carbon Dioxide Information Analysis Center, 2007); 2005 and 2006 emissions calculated by Earth Policy Institute from energy consumption in BP, Statistical Review of World Energy (London: 2007)
Mill
ion
Met
ric T
ons
of C
O 2
9,000
8,000
7,000
6,000
5,000
4,000
3,000
2,000
1,00001751 1801 1851 1901 1951 2001
In 2007, the atmospheric concentration of CO2 was 384 parts per million (ppm), up from 277 ppm at the start of the Industrial Revolution in 1750 (Figure 3). During the same period, the atmospheric concentration of both methane and nitrous oxide, two other greenhouse gases, also increased significantly due to human activities.3 Between 2000 and 2007, atmospheric CO2 concentration grew by an average of 2 ppm per year, the fastest seven-year increase since continuous monitoring began in 1959.
Figure 3
Atmospheric Concentration of Carbon Dioxide, 1000 - 2007
Source: Data from Mauna Loa at www.esrl.noaa.gov/gmd/ccgg/trends, updated January 2008, with long term historical data compiled by Worldwatch Institute from Scripps Institution of Oceanography, Oakridge National Lab, and Intergovermental Panel on Climate Change (IPCC).
Parts
per
Mill
ion
by V
olum
e
390
370
350
330
310
290
270
2501000 1200 1400 1600 1800 2000
Global warming poses a serious threat to the economic well-being, public health and natural environment in Southern California and beyond. The potential adverse impacts of global warming include, among others, a reduction in the quantity and quality of water supply, a rise in sea levels, damage to marine and other ecosystems, and an increase in the incidences of infectious diseases. According to climate scientists, California and the rest of the developed world will have to cut GHG emissions by 80 percent from today’s levels to stabilize the amount of GHG emissions in the atmosphere and prevent the most severe effects of global climate change.4

Climate Change and the Future of Southern California
Introduction and Summary6
California Context
In 1990, California generated 427 million metric tons of CO2 equivalents (MMTCO2E) of GHG emissions that increased to reach 469 MMTCO2E based on the average between 2002 and 2004. It is projected to further increase to 596 MMTCO2E in 2020 without changes in mitigation efforts. GHG emissions generally track closely with trends in energy use, adjusting for changes in fuel mix and the relative carbon intensity of the various fuels. In 2004, the transportation sector accounted for 38 percent of the total GHG emissions, followed by electricity (23 percent), industry (20 percent), commercial and residential (9 percent), agricultural (6 percent), and others.
California is the most populous state in the nation. Despite its achievement in energy efficiency and less carbon-intensive energy use relative to other states, California is second only to Texas in the nation in terms of total GHG emissions, and is the 15th largest source of climate change emissions in the world, exceeding most nations. The SCAG region, with close to half of the state’s population and economic activities, is an important contributor to the global climate change problem and should also be an important contributor to its solution.
In 2006, state legislation Assembly Bill No. 32 (AB 32), the California Global Warming Solutions Act, passed into law requiring that statewide GHG emissions be reduced to 1990 levels by 2020 (Figure 4). This would represent reducing about 30 percent from business-as-usual emission levels projected for 2020. On December 11, 2008, the California Air Resources Board (ARB) adopted a comprehensive Scoping Plan outlining the state’s strategy to achieve the 2020 GHG emission reduction target. Senate Bill No. 375 (SB 375), effective January 2009, also intends to implement a small portion of AB 32 to reduce the GHG emissions from
the use of autos and light trucks through land use and related policies. Furthermore, as a long-term goal, Governor’s Executive Order (S-3-05) requires that by 2050 reducing the GHG emissions to 80 percent below the 1990 level.5
Figure 4
California Greenhouse Gas Emission Trends and Target (Million Metric Tons CO2 Equivalents)
Source: California Air Resources Board, Climate Change Scoping Plan, December 2008
700
600
500
400
300
200
100
01990 20202002-2004 Average
2020 Target
Actual and Projected Emissions
Considerations in Selecting Essay Topics
The scope of the climate change issue is very broad and encompasses planning (e.g. land use, transportation, energy, water, ecosystem and human health), financing, technology, policy, legislation, etc. In addition to state and federal leadership and international cooperation, to effectively address

Introduction and Summary
77
the climate change challenges requires truly integrated regional planning linked with local implementation.
For this essays publication, the focus is on the scenarios and impacts of climate change in Southern California and potential responses in the region to contribute to the climate change solutions. Because there are many uncertainties involved in so many different aspects of the climate change problem, identifying with confidence a single outcome or pathway is not possible. Thus, it is important to consider a set of possible scenarios. Pertinent scenarios involve not only the range of possible climate changes and their impacts, but also combined impacts with other looming stresses, such as the limit that will be imposed by peak oil that will develop along with an increasingly changing climate. Topics of response strategies covered include integrating land use/transportation planning, green buildings, education and workforce development for a green economy, governance and financing policies, and integration with larger sustainability goals. Most of the response strategies are applicable for local government in the region.
It should be noted that response strategies discussed are illustrative in nature and are not intended to be comprehensive. In addition, they focus on mitigating the potential climate change impacts and not on adaptation strategies. Given certain climate change impacts will be unavoidable, adaptation strategies will also be needed.
Summary of the Essays
The seven issue essays included in this publication address different dimensions of the climate change challenges, solutions and opportunities.
In “What Should Southern California Prepare for?,” Dr. Dan Cayan outlines
the range of climate changes in the region and their potential impacts. He noted that temperature in Southern California by 2100 will likely rise by 4̊ F, and greater warming, as much as 10̊ F or more is possible, if greenhouse gas emissions continue at a high rate. Amongst the pervasive effects of climate warming are that the number of days with high ozone conditions will markedly increase. Warmer temperature might require the implementation of additional emission controls in order to offset this climate change. Also, heat waves will likely intensify and last longer.
Southern California’s annual receipt of precipitation is some of the most variable in the world, so we only occasionally see a “normal” year. This volatility, combined with warmer temperatures and a strong possibility of a shift to overall drier conditions, makes us especially vulnerable to climate change. Additionally, Southern California’s water supply challenges will be affected by changes that occur beyond the region in the Sierra Nevada and Colorado River Watersheds. By 2050, sea levels along Southern California’s coast, relative to its 2000 level, could rise as much as one foot, and by 2100 they could rise 1.5 feet to 4 feet above the 2000 level.
Mr. Bryn Davidson’s essay “Peak Oil and Climate Change: Scenarios and Implications” focuses on the nexus of climate change, peak oil and planning. Though climate change and peak oil have uncertainties, both were founded on a largely undeniable central message: the future may be very different from the past. Mr. Davidson explores how these two powerful forces might combine to change the way we build our cities and regions. He explains what we know about peak oil (including the growing gap between discovery and consumption). While in the long term, runaway climate change could have many times the impact of peak oil, in the near term (say 1 to 20 years), peak oil’s direct impact on the economy and on the price and availability of energy could be many times the direct local impact of either climate change or climate policy.

Climate Change and the Future of Southern California
Introduction and Summary8
Given the uncertainty of both climate change and peak oil, Mr. Davidson defined plausible future scenarios encompassing the combined impacts of peak oil and climate change. In the “Techno-Markets” scenario, the market, after several years of turbulent transition, responds to energy shocks, carbon cap and carbon pricing with new high tech technologies that scale up quickly. In the “Lean and Local” scenario, combined energy, economy, and climate shocks derail both the economy and local concern for climate change. Technological adaptation (to fuel shortages and a more chaotic climate) is limited by the stagnant global economy. Government rationing is common. Local and low tech community-based solutions predominate. These two scenarios are contrasted with the “Past Trend” scenario which embodies many of the assumptions still used by many people today.
The scenario-based planning approach not only identifies the combined impacts of peak oil and climate change but also the policy strategies that would be most robust across scenarios. Those robust strategies must reduce both emissions and oil dependence through resilient investments. By prioritizing these strategies, we can create the backbone of a prosperous post-carbon economy and region.
The first two essays summarized above focus on the impacts and scenarios of climate change and set the stage for the other five essays to address response strategies. In “How Planning Can Combat Climate Change in Southern California,” Mr. William Fulton reminds us that we could build on certain trends of the existing development patterns to address climate change. Specifically, we have to take advantage of the emerging pockets of urban concentration in the region, and to reshape certain parts of the region to be less dependent on automobiles.
He gives examples of relatively self-contained villages and dense communities.
The trick is to reinforce these villages and centers so that they have jobs, housing and retail in close proximity to one another – to the extent possible – knit these locations together with high speed public transit in the form of rail lines or bus rapid transit. Mr. Fulton then illustrates some of the tools to accomplish this goal including market opportunities, policy ideas and funding sources. Just as successfully reducing our carbon footprint requires a concentration of activities, successfully bringing these communities into existence requires a dense and focused concentration of policy, funding and marketing efforts.
Mr. Walker Wells addresses the effectiveness of green building programs which have become the cornerstone of climate action plans for local government. In “Green Buildings – A Tool for Stemming Climate Change?,” he observes that green buildings integrate innovations in energy efficiency, water conservation, waste management, land use planning and public health. They are a long-term strategy to address climate change and the benefits increase exponentially as time goes by. While new green buildings have attracted the most attention, renovation and operation of existing buildings are also important. In the end, green buildings need to be combined with thoughtful land use planning and provision of resource-efficient transportation options to realize the full potential of the built environment to stem climate change.
Ms. Mona Field illustrates the effort of the Los Angeles Community College District (LACCD) in “Education for a Green Region: Community Colleges Tackle Climate Change and Economic Development through Green Curriculum and Sustainable Building.” With the emerging green technology industries, it is important that we train a new generation of workers for a green economy. The District’s green curriculum covers workforce development programs such as architecture, solar installation, alternative fuels, water supply, waste water, and sustainable construction.

Introduction and Summary
99
In addition, LACCD is undergoing one of the largest public sector sustainable building efforts in the nation, with all new buildings being constructed to meet Leadership in Energy and Environmental Design (LEED™) standards. Also, through a Zero Landfill policy, approximately 98 percent of the District’s construction surplus items are kept from reaching local landfills by selling, donating or recycling. Also virtually all of the newly purchased carpeting and furniture procured by LACCD comes from manufacturers who use recycled materials in their products.
Dr. Dan Mazmanian and his colleagues propose a decision-making framework for investment – a triple bottom line – for the region. In “Governance and Financing Policy in Southern California: Transformative Changes to Achieve Climate Change Goals,” he proposes that investment should be evaluated based on their performance with respect to the environment, economy and equity. Dr. Mazmanian found that Southern California’s unprecedented climate change and energy supply challenges are potentially dire, yet they also provide an opportunity for Southern California to emerge as a national model for how to meet them. Transformation of existing governance and financing structures will be an essential part of meeting the region’s challenges, with lasting benefits in the provision of major infrastructure and public service projects for decades to come. In moving the region forward, it will be essential that a “Triple Bottom Line” (TBL) approach be adopted that combines economic growth, environmental and health safeguards, and an improved quality of life for all the people of the region as the ultimate gauge of the region’s prosperity.
In “Climate Disruptions: Searching for Sustainability in Southern California,” Dr. Monty Hempel acknowledges that it is too late to stop the climate “train”, but slowing it down is paramount. Southern California will experience the impacts not only from within the region but also through its global
connections. He reminds us that never before has the urgency of a global problem aligned so closely with local transformation. He points out that regional institutional capacities and shared community visions are central to the implementation of “glocal” climate solutions. Actions at the regional and local levels to curb greenhouse gas emissions will have significant co-benefits in contributing to the sustainability of our regional community and beyond for our children and grandchildren.
Finally, to further support implementation activities to address climate change impacts, SCAG staff also prepared two informational pieces to compliment the issue essays. The first piece provides an overview of two climate change legislations in California, AB 32 and SB 375 due to its particular relevance to local government. The other piece provides additional resources on best practices to address climate change.
Endnotes
1. The National Academies. 2008. Understanding and Responding to Climate Change - Highlights of National Academies Reports.
2. Intergovernmental Panel on Climate Change (IPCC). 2007. Climate Change 2007: The Physical Science Basis. Contribution of Working Group I to the Fourth Assessment Report of the Intergovernmental Panel on Climate Change. p. 13, Cambridge University Press.
3. Ibid, p. 3.
4. California Air Resources Board. 2008. Climate Change Scoping Plan.
5. See Section on “Overview of AB 32 and SB 375” in this publication for additional background information.
Climate Change and the Future of Southern California
Dan Cayan
Climate Change – What Should Southern California Prepare for?
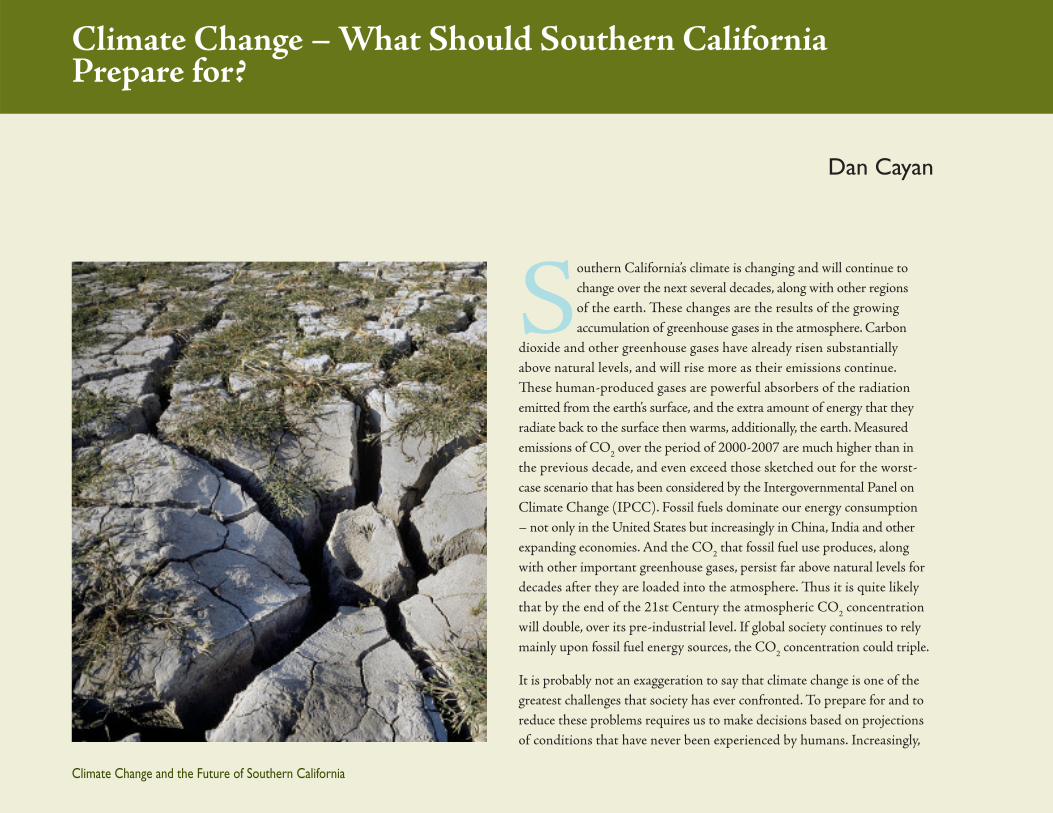
Southern California’s climate is changing and will continue to change over the next several decades, along with other regions of the earth. These changes are the results of the growing accumulation of greenhouse gases in the atmosphere. Carbon
dioxide and other greenhouse gases have already risen substantially above natural levels, and will rise more as their emissions continue. These human-produced gases are powerful absorbers of the radiation emitted from the earth’s surface, and the extra amount of energy that they radiate back to the surface then warms, additionally, the earth. Measured emissions of CO2 over the period of 2000-2007 are much higher than in the previous decade, and even exceed those sketched out for the worst-case scenario that has been considered by the Intergovernmental Panel on Climate Change (IPCC). Fossil fuels dominate our energy consumption – not only in the United States but increasingly in China, India and other expanding economies. And the CO2 that fossil fuel use produces, along with other important greenhouse gases, persist far above natural levels for decades after they are loaded into the atmosphere. Thus it is quite likely that by the end of the 21st Century the atmospheric CO2 concentration will double, over its pre-industrial level. If global society continues to rely mainly upon fossil fuel energy sources, the CO2 concentration could triple.
It is probably not an exaggeration to say that climate change is one of the greatest challenges that society has ever confronted. To prepare for and to reduce these problems requires us to make decisions based on projections of conditions that have never been experienced by humans. Increasingly,

Essay Dan Cayan
1111
in addition to issues surrounding shorter term climate impacts such as occur during large El Niño events, we in the climate community are scrambling to provide scenarios that will shed light on risks of climate changes. We know, with great certainty, that the consequences will grow the longer greenhouse gases are allowed to accumulate at full throttle. Greenhouse gases are emitted globally so that reductions across an international network are needed. However, to achieve meaningful reductions will require actions, beginning right now, from individual parties, and the impacts expected are severe enough that the State of California has stepped forward. In an unprecedented process set forth by the California legislature and Governor Schwarzenegger’s administration, the State has instituted measures to reduce emissions as well as to monitor and plan for changes in climate and sea levels.
Two pieces of evidence point toward substantial future climate change. First, early signs of a warming earth are appearing at an increasing rate. If the only warming we had observed was confined to a limited region such as western North America, the warming might simply be a temporary natural climate fluctuation and we could expect, within a few years, a transition back to a cooler regime. But, in fact, there is a global signature – surface air temperature here in California has risen about 1̊ F over the last 100 years (Figure 1) similar to the warming of average temperature from a global array of thermometer records. In recent decades, warming has become more acute, and along with it has come a set of other changes, including more rain/less snow and earlier snowmelts in western mountains and advances in spring plant blooms. Although the warming is still modest, the levels of seasonal and annual temperatures are beginning to extend above the highest temperatures observed historically. Furthermore, the pace of change is exceptionally fast, when compared to long records that have been constructed from proxy records of climate such as from tree rings, sediments and coral
records, and this warming is taking place over a broad global domain. In fact, the warming, along with other changes, has a “fingerprint” that is in line with the pattern of changes that are predicted by model and theoretical reasoning when greenhouse gas concentrations are increased. Thus, it is quite certain that we (humans) have caused this warming.
Figure 1
South Coast Annual Average Temperature
1900
58
60
62 58
64 60
56
54
1920 1940 1960 1980 2000
˚F ˚F
Light blue curve shows historical annual surface temperature (left scale), averaged across several stations recording temperature in the “South Coast” region, from Western Regional Climate Center Climate Tracker http://www.wrcc.dri.edu/monitor/cal-mon/california-climate-monitor.html . Dark blue curve is 11 year smoothed (running mean, showing over 1ºF increase). For comparison, the orange curve (right scale) shows warming of global land and ocean surface temperature from Smith and Reynolds. http://www.ncdc.noaa.gov/oa/climate/research/anomalies/anomalies.html.

Climate Change and the Future of Southern California
Peak Oil and Climate Change: Scenarios and Implications12
Second, looking forward, the fact that humans have caused the warming in recent years means that continued, collective human impacts will lead to even greater changes. Various scenarios for increased greenhouse gas concentrations have been explored using computer-run numerical models that have been devised to simulate the dynamics of the climate system. These models provide a way to study the changes in climate that may occur over the next several decades. A comprehensive global scale evaluation from several global climate models (GCMs) was presented in the recent 2007 IPCC Fourth Assessment. The information from these climate models is resolved at a pretty coarse scale, but it can be combined with the structural information that we have from observed historical temperature and other data over California. We use this information to “downscale” the climate model changes to project changes onto the Southern California landscape and thus infer how climate change may evolve over our region, which is in many ways unique from the rest of the United States.
How much and how fast will Southern California’s climate warm? The models suggest that by 2050, the amount of warming is likely to exceed the 1°F we have already experienced, perhaps by yet another 1-2ºF, and by 2100 it will likely reach 4°F above current levels. Greater warming, possibly as much as 10°F, could occur if greenhouse gas emissions continue at a high rate (Figure 2). The six GCMs, run under two very different emissions scenarios are ones used in the 2008 California Climate Change Scenarios assessment. Because we are not able to predict how regulations, technology and economic activity will develop in future decades, several differing scenarios describing the trajectory of future greenhouse gas emissions are typically explored in these evaluations, and it is not possible to assign odds to different emissions scenarios. Consequently, the climate projections should be viewed as a set of possible outcomes, none of which would qualify as a specific prediction.
Figure 2
Annual Temperature Projected Change, Los Angeles
10
8
6˚F
4
2
0
2020 2040 2060 2080 21002000
A2 B1
What we can be very certain of, however, is that the rate of warming will increase substantially over the rates we have seen in recent decades. Climate model projections based on lower end emission trajectories indicate that, by 2100, temperature increases will likely exceed 3°F.
Projected change in annual mean temperature, Los Angeles region, from six Global Climate Models (GCMs), for A2 (green) and B1 (brown) greenhouse gas (GHG) emission scenarios. Light green curves and brown curves are individual A2 and B1 simulations, respectively. The six GCMs and the two emissions scenarios are ones used in the 2008 California Climate Change Scenarios assessment. The A2 and B1 scenarios represent two plausible, but very different trajectories of the world economy, society, and energy system, and imply divergent paths of future anthropogenic GHG emissions, with projected emissions in A2 being substantially higher than for B1. Temperature changes are relative to 1961-1990 annual average temperature for the grid point nearest Los Angeles from each of the GCMs, respectively.

Essay Dan Cayan
1313
In contrast, by 2100, the upper-warming end of the climate models and greenhouse gas emission scenarios actually produce warming that is greater than 7°F. This degree of change may seem trivial in comparison to daily and seasonal temperature fluctuations, but it is enormous when we consider that they represent the shifts in multi-year averages. Importantly, even if greenhouse gas emissions were to be cut back today to pre-industrial levels, there is still about 1°F more warming in store from changes we have already set in motion. The earth will continue to warm because it is still adjusting to the increased levels of greenhouse gases that we have already loaded into the atmosphere. And, the use of the 2100 endpoint in the model simulations is arbitrary – in a number of scenarios, the warming and associated climate change would continue long after that.
One aspect of climate change that we are wrestling to understand is how the amount of warming may differ from season to season and how it will play out over the California landscape. Several of the recent climate simulations suggest that summer temperatures will increase more than those in winter (Figure 3). And, the warming projected in the models varies as we cross California. It is troublesome that several of the models project summer warming to strengthen in the interior just beyond the immediate Southern California coastal zone (Figure 4). This intensification could have severe impacts upon our public health and our supply of water and energy. And, a summer-amplified warming could be a harsh challenge to Southern California wildlife and ecosystems, which in the present day are said to be amongst the most diverse of all regions on earth.
Figure 3
Los Angeles Temperature Change From 1961 - 1990
8
˚F6
4
2
02005 - 2034 2035-2064 2070 - 2099
A2 B1
January - February - March
8
˚F6
4
2
02005 - 2034 2035-2064 2070 - 2099
July - August - September
Projected surface air temperature changes in winter ( January through March, upper) and summer ( July through September, lower) show greater increases in summer. These are averages of data from six GCMs for higher (A2, brown ) and lower (B1, green) GHG emissions scenarios. Temperature changes are relative to 1961-1990 average temperature for the grid point nearest Los Angeles from each of the GCMs, respectively.

Climate Change and the Future of Southern California
Peak Oil and Climate Change: Scenarios and Implications14
And, it is not only our average temperatures that will warm – the models indicate that extreme temperatures will also rise. The Southern California climate will continue to contain weather and short period climate fluctuations superimposed upon longer term trends. Historically, most of our heat waves have occurred in July and August, but as climate warming takes hold, these events will likely begin to appear earlier in the season and could continue through the Fall period, while summer events become more frequent and more intense. Model simulations suggest that California cities will see a great increase in hot days, as represented for Los Angeles by one GCM simulation, the A2 simulation of the Geophysical Fluid Dynamics Laboratory (GFDL) of the National Oceanic and Atmospheric Administration (NOAA) in (Figure 5). By the end of the century, if greenhouse gas emissions continue along the higher trajectory, heat wave days could increase by fourfold or more. And, within a given heat wave, there is an increasing tendency for multiple hot days in succession – heat waves last longer. Especially important may be the lack of nighttime cooling that has characterized recent heat waves in California, and the projection that the occurrence of events having durations of 5 days or longer will become much more prevalent by the last decades of the 21st Century, putting huge strains on our health and utility infrastructure.
Figure 4
Maximum Temperature During July
36˚
34˚
240˚
40 50 60 70 80 90 100
242˚ 244˚
1961 - 1990
36˚
34˚
240˚
40 50 60 70 80 90 100
242˚ 244˚
2035 - 2064
Figure 4. July maximum temperature throughout Southern California from the A2 simulation of GFDL global climate model (lower panel) is projected to warm considerably, especially over inland regions.
Upper and lower panels compare historical (1961-1990) version of GFDL simulation with mid-21st Century (2035-2064) simulation.
In these maps, the GFDL model temperatures have been “downscaled” from the coarse 150km GCM scale to a 1km spatial matrix covering the California landscape.

Essay Dan Cayan
1515
Figure 5
Los Angeles Number of Extremely Hot Days
84
63n
year
42
21
02000 2020 2040 2060 2080 2100
May - September
Southern California has one of the most urbanized and most productive economies in the United States. But along with this comes the misfortune of having very high air pollution loadings. The pollution problem in Los Angeles is set up by the temperature inversions from subsiding air masses around the North Pacific high pressure center, and is complicated by the mountains to the north and east of the Los Angeles basin that further trap pollutants. Additionally, Southern California’s air pollution is aggravated by ozone buildup, especially when warm sunny days with stagnant atmospheric conditions produce greater chances for photochemical reactions affecting trapped emissions. Ozone and particulate matter are often considered the most critical in adversely affecting human health, and have been implicated as being particularly harmful to children’s health. Climate model projections
of future temperature rise combined with the historical ozone trends indicate that the number of days with high ozone conditions will markedly increase. Warmer future temperatures might require the implementation of additional emissions controls in order to offset this climate-driven increase.
Compounding California’s climate problems is our coastal setting. Climate warming, in causing thermal expansion within the global oceans and in melting glaciers and large ice stockpiles in Greenland and Antarctica, will likely accelerate sea level rise, probably multiplying the rates that we have observed over the last century. This would not only increase the risk of erosion of coastal structures and shrink our beaches, but also will increase the chances of salt water intruding into our fresh water systems. Southern California is familiar with rising sea level, which has been occurring before and during the period of our modern development. Sea level measured at tide gauges along the California coast rose by a total of about 7 inches over the last century – similar to rises estimated for the global ocean. But as temperatures near the surface of the earth warm, sea levels will rise even more. By 2050, relative to its 2000 level, sea level seems likely to rise by another foot. Estimates of future sea level rise have not converged to a well defined rate, and some recent mainstream estimates are significantly larger than has been publicized by the IPCC in their Fourth Climate Assessment, released in 2007. Estimates of sea level rise by the end of the century have upper ranges of more than 4 feet (Figure 6). A major vulnerability in California’s water systems is the Sacramento/San Joaquin Delta, through which much of the State’s freshwater passes on its way to meet water demands that span the entire state south of Sacramento. As sea level rises, it will also elevate shorter term extremes of tides, storm surge and waves, so there will be an increased rate of extreme high sea level events. Add a foot or more to sea levels in the long run, and when
Projected number of heat wave days in Los Angeles from the GFDL GCM simulation, under the A2 GHG emissions scenario. In this case, a heat wave is any day exceeding 81°F, the 95th percentile of daytime temperature in Los Angeles during May through September from 1961-1990.

Climate Change and the Future of Southern California
Peak Oil and Climate Change: Scenarios and Implications16
large storm-generated waves happen to coincide with high tides, as during major storms in the 1982-83 El Niño winter, we have the recipe for severe flooding and rapid coastal erosion. And, as decades proceed, heightened sea level events will persist for more hours, which would impose a greater threat of coastal erosion and other damage, especially to the fragile levees in the Delta.
Figure 6
Projected Sea Level Rise for Southern California Coastline
36
30
24in
year
18
12
6
02020 2040 2060 2080 21002000
A2 B1
Figure 7
Water Year (October - September) Precipitation
40
in30
20
10
01900 1920 1940 1960 1980 2000
South Coast
40
in30
20
10
01900 1920 1940 1960 1980 2000
South Interior
Sea level for Southern California coast under projected global warming, from A2 (brown) and B1 (blue) GHG emissions scenarios simulated by six different GCMs. Sea level changes have been estimated using the method of Rahmstorf (2007). Light lines are the six A2 and the six B1 simulations and bold lines are mean of the A2 and B1 simulations.
Precipitation for South Coast (upper) and South Interior (lower) regions of Southern California has experienced wide variation from year to year (light bars). 11 year running mean values (heavy lines) illustrate the substantial multi-year variability that has characterized Southern California’s historical precipitation. Historical annual (October-September) precipitation. From California Climate Tracker, Western Regional Climate Center
Essay Dan Cayan
1717
Figure 8
Los Angeles Precipitation Change from 1961 - 1990
0
-4
-8%
-12
-16
2005 - 2034 2070 - 20992035 - 2064
A2 B1
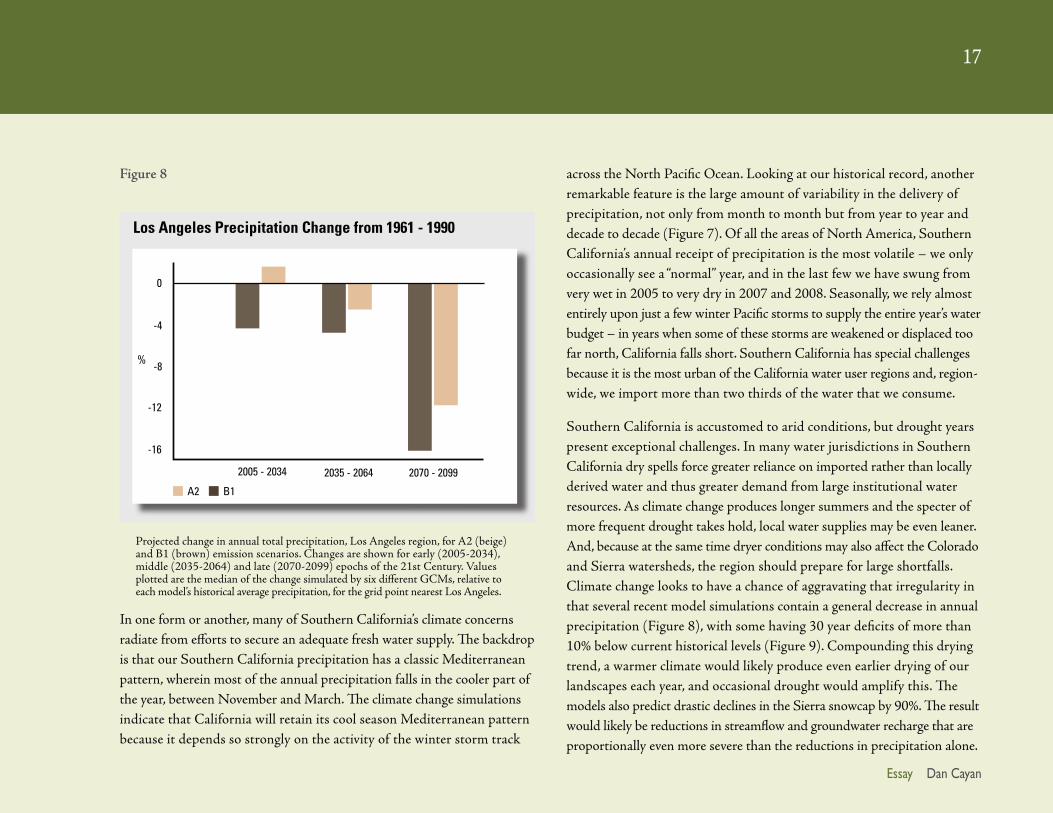
In one form or another, many of Southern California’s climate concerns radiate from efforts to secure an adequate fresh water supply. The backdrop is that our Southern California precipitation has a classic Mediterranean pattern, wherein most of the annual precipitation falls in the cooler part of the year, between November and March. The climate change simulations indicate that California will retain its cool season Mediterranean pattern because it depends so strongly on the activity of the winter storm track
across the North Pacific Ocean. Looking at our historical record, another remarkable feature is the large amount of variability in the delivery of precipitation, not only from month to month but from year to year and decade to decade (Figure 7). Of all the areas of North America, Southern California’s annual receipt of precipitation is the most volatile – we only occasionally see a “normal” year, and in the last few we have swung from very wet in 2005 to very dry in 2007 and 2008. Seasonally, we rely almost entirely upon just a few winter Pacific storms to supply the entire year’s water budget – in years when some of these storms are weakened or displaced too far north, California falls short. Southern California has special challenges because it is the most urban of the California water user regions and, region-wide, we import more than two thirds of the water that we consume.
Southern California is accustomed to arid conditions, but drought years present exceptional challenges. In many water jurisdictions in Southern California dry spells force greater reliance on imported rather than locally derived water and thus greater demand from large institutional water resources. As climate change produces longer summers and the specter of more frequent drought takes hold, local water supplies may be even leaner. And, because at the same time dryer conditions may also affect the Colorado and Sierra watersheds, the region should prepare for large shortfalls. Climate change looks to have a chance of aggravating that irregularity in that several recent model simulations contain a general decrease in annual precipitation (Figure 8), with some having 30 year deficits of more than 10% below current historical levels (Figure 9). Compounding this drying trend, a warmer climate would likely produce even earlier drying of our landscapes each year, and occasional drought would amplify this. The models also predict drastic declines in the Sierra snowcap by 90%. The result would likely be reductions in streamflow and groundwater recharge that are proportionally even more severe than the reductions in precipitation alone.
Projected change in annual total precipitation, Los Angeles region, for A2 (beige) and B1 (brown) emission scenarios. Changes are shown for early (2005-2034), middle (2035-2064) and late (2070-2099) epochs of the 21st Century. Values plotted are the median of the change simulated by six different GCMs, relative to each model’s historical average precipitation, for the grid point nearest Los Angeles.

Climate Change and the Future of Southern California
Peak Oil and Climate Change: Scenarios and Implications18
Figure 9
Projected Precipitation
40
in30
20
10
02000 2020 2040 2060 2080 2100
Los Angeles
40
in30
20
10
02000 2020 2040 2060 2080 2100
Riverside
The November, 2008 fires in Southern California burned over 40,000 acres and destroyed over 1000 dwellings. This recent flare up, along with the conflagrations of 2003 and 2007, is a reminder that Southern California has some of the riskiest wildfire conditions in the United States. As climate changes, it appears that summer dryness will begin earlier, last longer and become more intense. These changes may exacerbate fire occurrences, which have historically peaked in late summer and early fall. In years with wet winters, annual vegetation growth is plentiful. But accentuated dryness during summer would produce a hazardous fuel load that worsens the wildfire problem in some of Southern California wildlands. With expanding development into the urban/wildland interface, threats to human safety and property are even greater. The spread of invasive species that are more fire-prone, coupled with more frequent and prolonged periods of drought, all increase the risk of fires, and reduce the capacity of native species to recover. Wildfires are also bad news for the region in terms of air quality, human health, soil erosion and stress on watersheds. Direct costs of fighting the 2008 wildfires have been reported at several hundred millions of dollars, and at the time this is written the property damage toll is still being assessed. With climate change we could see more years like this in our future.
Population growth combined with higher temperatures would lead to higher electrical demand. Coastal Southern California being nearly fully developed, new growth is largely slated to inhabit interior valley locations
One example of projected future annual total precipitation in Southern California, taken from the GFDL GCM for the A2 greenhouse gas emission scenario. Typical of such simulations, there is considerable precipitation variability from year to year (light bars) and decade to decade (heavy lines, 11 year running mean). As with several (but not all) recent projections, the GFDL simulation contains a trend approaching 25% less precipitation by 2100 than historical levels. Los Angeles (upper) and Riverside (lower) series are derived from a statistical downscaling of the GFDL simulation

Essay Dan Cayan
1919
such as the Inland Empire and the Imperial Valley. California’s peak electrical demands in summer are 150% greater than those in winter, to meet air conditioning, water processing and pumping, and other power needs. Even without climate change, this interior development will heighten demand for electricity as needs for summer cooling increase.
needs. Even without climate change, this interior development will heighten demand for electricity as needs for summer cooling increase.
Climate warming would further stress the demand for electricity and could increase the likelihood of power outages during the hottest periods. And, complicating this issue, without new sources of “clean” electricity, higher demand would increase greenhouse emissions.
Climate changes are not confined to California – they are taking on a global footprint. In many ways, these extra-regional changes will probably also
affect Southern California. Increased heat waves would intensify the need for electric power throughout California and probably beyond. Nearly 20% of our electrical energy is imported, much of it from hydroelectric generators in the Columbia River basin. The blackouts during California’s early Summer 2000 electricity crisis were exacerbated by the lack of hydro-electric power available from the Pacific Northwest. This shortfall was due to dry conditions over the Northwest that had built up over the previous few winters. Recently, a decade of drought in the Colorado River basin and the recent two years of dryness in the Sierra Nevada underscore the frailty of our water supply in Southern California. Recent decisions have tightened the amount of Colorado River water available to California. Water supplies on the Colorado have become nearly fully utilized – it appears that we will have to increase efficiency to muster supplies for new users.
In the foreseeable future, Southern California expects continued growth in population, demand for energy and water, many more vehicles and miles traveled, and shifts in land use and ecosystems. Even in the best of circumstances, climate change will compound many of the problems associated with these developments. The early signs of climate change have already been recorded and considerably more change is on the way. How much more will be determined, to a large extent, by our collective global decisions and policies with respect to fossil fuel use and environmental protection. Climate warming, sea level rise, ecosystem collapses and other shifts are likely not reversible, at least on human generational time scales. So, we cannot afford to wait--taking steps now to limit greenhouse gas emissions to a lower rather than higher pathway could avoid the high end of climate warming. Keeping warming to lower levels will help to reduce “dangerous” consequences and “climate surprises” – reactions that we do not understand well now but that are more likely as the global and regional

Climate Change and the Future of Southern California
Peak Oil and Climate Change: Scenarios and Implications20
climate migrates away from its natural equilibrium. California policy and technological developments are well-noticed by the world community, so that even though climate solutions here are only a small fraction of those needed over a global scale, the way we deal with them can be a model that would be applied elsewhere.
Acknowledgments
Mary Tyree produced illustrations. Mike Dettinger, Alexander Gershunov, Jim Stewart, Ping Chang and Jennifer Johns provided helpful comments. Support for writing and illustrating this essay came from the California Energy Commission through the California Climate Change Center and by the NOAA RISA program through the California Applications Program.
About the Author
Dan Cayan, Ph.D., is a Researcher at the Scripps Institution of Oceanography, University of California, San Diego, and also with the U.S. Geological Survey, Water Resources Discipline. He directs the California Climate Change Center and the California Applications Program, multi-institution research programs to provide climate information to the State and region. Dr. Cayan was a lead researcher in the 2005-2006 California Climate Change Scenarios Assessment Project and continues to play that role in the ongoing 2008-2009 California Climate Change Assessment. He was one of the Guest Editors and a science contributor of the Special Issue on “California at a Crossroads: Climate Change Science Informing Policy”, Climatic Change Journal, March 2008.
Additional Resources
Announcement of California’s 2008 Climate Change Impacts Assessmenthttp://www.climatechange.ca.gov/research/2008_assessment/index.html
Our Changing Climate, Assessing the Risks in California http://meteora.ucsd.edu/cap/pdffiles/CA_climate_Scenarios.pdf
Preparing for Climate Change: A Guidebook for Local, Regional, and State Governmentshttp://cses.washington.edu/db/pdf/snoveretalgb574.pdf
IPCC, 2007: Summary for Policymakers. In: Climate Change 2007: The Physical Science Basis. Contribution of Working Group I to the Fourth Assessment Report.http://www.ipcc.ch/pdf/assessment-report/ar4/wg1/ar4-wg1-spm.pdf

Essay Dan Cayan
2121
California Department of Water Resources, California Water Plan 2006:http://www.waterplan.water.ca.gov/
California Assembly Bill 32 (AB 32): Global Warming Solutions Acthttp://www.ef.org/documents/AB-32-fact-sheet.pdf
EXECUTIVE ORDER S-13-08 by the Governor of the State of California (Sea Level Rise)http://gov.ca.gov/executive-order/11036/
San Diego’s Changing Climate, a Regional Wake Up Callhttp://www.sdfoundation.org/news/pdf/Focus2050_whitepaper_final.pdf
The Encyclopedia of Earth: Biological Diversity in the California Floristic Provincehttp://www.eoearth.org/article/Biological_diversity_in_the_California_Floristic_Province

Climate Change and the Future of Southern California
Peak Oil and Climate Change: Scenarios and Implications
Bryn Davidson
Peak oil and climate change are unprecedented global challenges that will bring about fundamental changes to both our cities and regions, and the global economy. In combination, these two forces will drive a decades-long transition away from the cheap,
but carbon intensive, fossil fuels that have become the backbone of our modern society.
In response to these two forces, we need to focus on strategies which reduce both emissions and oil dependence. These high-priority actions will include improving the energy productivity of our local economies, improving the food and shelter security of our most vulnerable populations, and making large investments in cleaner and more secure sources of energy.
Before we can start this, however, we need a new way to plan.
We need to break away from the current practice of extrapolating past trends, while at the same time accounting for the potentially massive impacts, and equally large uncertainty, surrounding both peak oil and climate change.
One potentially powerful way to move forward is through scenario-based planning.
Scenarios allow us to bundle together sets of assumptions about the impacts of peak oil and climate change and can help bridge differences of
Municipal and regional planning in the context of the global energy transition

Essay Bryn Davidson
2323
scientific or political opinion. Scenarios can help us prepare for energy, economic, and climate shocks while helping define a positive path towards a post-carbon future.
Through scenario-based planning we can test the potential value of our long term investments – in infrastructure, land use plans, or policy – in different futures defined by energy and emissions constraints. By placing these plausible futures side-by-side, and asking the key question, “which investments and actions best retain their value across all potential futures?” we can create more resilient cities, while avoiding investments in ‘stranded assets’.
What follows is an outline of scenarios incorporating both peak oil and climate change into a broader vision of the ‘global energy transition’, and an example of using scenarios to plan for truck traffic and road capacity in Southern California and beyond.
Energy Transition = Peak Oil + Climate Change
In 2005-06 with the one-two punch of Hurricane Katrina and Al Gore’s An Inconvenient Truth having heightened public focus on climate change, there was an attentive global audience listening when the Intergovernmental Panel on Climate Change (IPCC) released their 2007 assessment that climate change was, in fact, real and human activity was responsible for it.
Independent of any ensuing controversy over the technical aspects of climate change, the years since 2005 have seen a broad change in the level of global interest in climate policy, and it now seems that climate concerns have earned an indelible place in our planning strategies.
Enter peak oil.
Like climate change, there have been groups of professionals talking about ‘peak oil’ – the peaking and permanent decline of global oil production1 – for decades, but with turbulent gas prices, and global oil supplies entering an apparent plateau, the abstract idea has suddenly become very real.
Peak Oil vs. Climate Change
What has emerged, then, is a situation where the market’s responses to rising energy prices (and by extension, peak oil) have been both good and bad in terms of climate change.
On one hand, the recent dramatic rise in gas prices led to a dramatic shift in the sale of fuel efficient cars and even reversed the nearly 30 year growth trend in highway travel. Likewise, the rising tide of energy prices has spurred a dramatic surge of investment in alternative fuels and renewable energy.
On the other hand, if you are concerned about climate change or environmental protection, many potential responses to peak oil can be seen as serious threats.
Rising energy prices are bound to brush away political opposition to drilling offshore and in protected areas.2 Non-conventional fuels from tar sands, shale, and coal will attract billions in investment while significantly increasing the carbon intensity of our fuel supply.3 In many places food will become fuel, and rainforests will continue to be ploughed under for fuel crops.

Climate Change and the Future of Southern California
Peak Oil and Climate Change: Scenarios and Implications24
Because of these threats, many climate activists see peak oil as a distraction at best, and at worst, an industry agenda aimed at removing all barriers to extraction.
To ignore or marginalize peak oil, however, is to ignore the potentially massive impact that rising energy prices and shortages could have on our economy, on our food and housing supply, and on global stability. As witnessed by the powerful impact of rising gas prices, the economic force
of peak oil has the potential to dwarf the near term local impacts of climate change and self-imposed climate legislation.
When looking at climate policy from a peak oil context, many climate mitigation strategies such as forestry-based offsets, atmospheric carbon capture, and emissions trading are of relatively little value because they do nothing to reduce the oil dependence of our local economies and cities.
If, collectively, we focus all of our climate mitigation dollars on tree planting offsets (or are hoping that depleting natural gas supplies will replace coal or oil) then we are leaving our economies, cities, food systems, and homes vulnerable to the impacts of peak oil and peak natural gas.
Peak Oil + Climate Change: Finding Common Ground
In the end, climate change may be a much larger multi-generational threat, but in the near term the immediate and tangible impact of peak oil will likely demand a much sharper focus on transportation and oil-dependence than a climate-only approach would suggest.
In terms of priorities, we will need to focus on the oil dependence of the regional economy and workforce, and the oil dependence of core community services such as medical, police, and fire services as well as food and shelter security for the most vulnerable populations.
For this reason, we must prioritize those actions which find common ground between peak oil and climate change; strategies which reduce both emissions and oil dependence.
This is not to say that emissions trading will not be a necessary tool or that we will not need some unconventional oil or natural gas, but rather that we
Essay Bryn Davidson
2525
need to find common ground and aggressively prioritize those strategies which address both peak oil and climate change.
Taken in the context of the global energy transition, aggressive action on climate change is no longer an economic burden, but rather the core of a strategy that will make both the nation’s and region’s economy more competitive in a future defined by peak oil and carbon constraints.
Peak Oil: What We Know
While climate change has garnered much attention in both public and government forums, peak oil has, thus far, been largely relegated to online communities and niche professional discussion by organizations like the Association for the Study of Peak Oil and Gas (ASPO).
This dearth of public discussion has occurred even while the topic was being actively studied by mainstream institutions like the U.S. Department of Energy,4 the U.S. Government Accountability Office5 and several branches of the U.S. military.6
What follows then, is a brief recap of some of the key salient points in the peak oil dialogue – an attempt to separate ‘what we know’ from ‘what we believe’ and to create a foundation from which scenarios integrating peak oil and climate change can be built.
Peak Oil: Aging Giant Fields
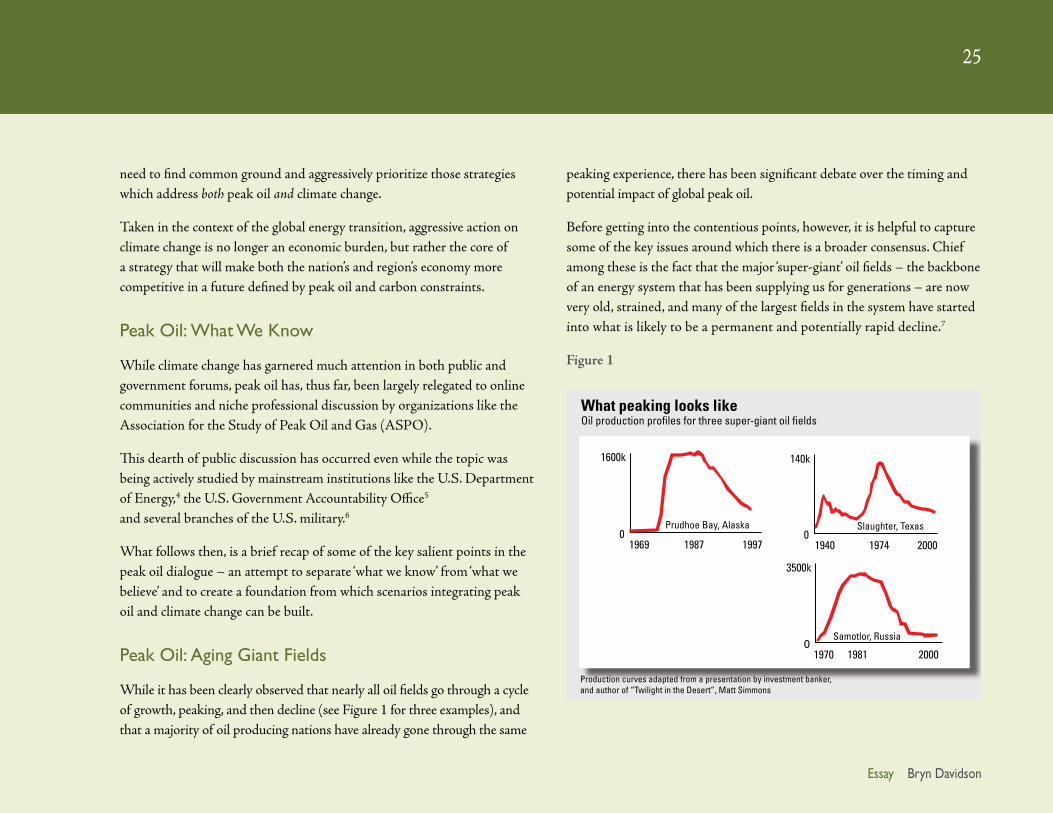
While it has been clearly observed that nearly all oil fields go through a cycle of growth, peaking, and then decline (see Figure 1 for three examples), and that a majority of oil producing nations have already gone through the same
peaking experience, there has been significant debate over the timing and potential impact of global peak oil.
Before getting into the contentious points, however, it is helpful to capture some of the key issues around which there is a broader consensus. Chief among these is the fact that the major ‘super-giant’ oil fields – the backbone of an energy system that has been supplying us for generations – are now very old, strained, and many of the largest fields in the system have started into what is likely to be a permanent and potentially rapid decline.7
Figure 1
What peaking looks likeOil production profiles for three super-giant oil fields
1981
3500k
020001970
1974
140k
0200019401987
1600k
019971969
Prudhoe Bay, Alaska Slaughter, Texas
Samotlor, Russia
Production curves adapted from a presentation by investment banker, and author of “Twilight in the Desert”, Matt Simmons

Climate Change and the Future of Southern California
Peak Oil and Climate Change: Scenarios and Implications26
Figure 2
19300
20
40
60
Gb
/ a
1950 1970 1990 Today 2030 2050
~1960: Global ‘Peak Discovery’
~1980: We start using more oil than we find
Today: Using much more oil than we’re finding
Global Oil Discovery & Production “The Growing Gap”
The growing gap between discovery and production}
Source: Association for the Study of Peak Oil and Gas (ASPO)
Global Oil Discovery Global Oil Production
Peak Oil: Peak Discovery
At the same time, while our consumption of oil has been growing, we have been discovering fewer and fewer giant oil fields.
Globally ‘peak discovery’ (the heyday of global oil drilling) occurred in the 1960s with the discovery of Saudi Arabia’s super giant fields. Since this point of peak discovery, the rate at which we have been finding new oil has been declining steadily.
Today, after nearly fifty years of declining discoveries, we would need to
find several new fields the size of Saudi Arabia’s to even have a chance of reversing this trend. While it is likely that there will be a number of new discoveries forthcoming (in the arctic, in ultra deep water, or somewhere else) it is highly unlikely that any amount of investment or drilling will result in sufficiently enormous finds to reverse the fifty year trend.8
Non-Conventional Oil
While no new conventional super-giant oil fields have been discovered in recent decades, there has been great discussion about ‘Saudi sized’ oil reserves in North America in the form of non-conventional oils, specifically in Canada’s tar sands9 and oil shales in the U.S.
The difference between ‘conventional’ and ‘non-conventional’ oil is important, however, because non-conventional oil is much harder to get out of the ground and often requires the consumption of large amounts of either water, natural gas, or electricity to extract crude from either sand or stones.10
Because of these potential limits to the production of non-conventional oil, it is important to distinguish between the size of ‘reserves’ – which are often quoted in articles and editorials as being ‘Saudi sized’ – and the actual potential flows of oil which are significantly smaller than the giant reserve numbers might suggest.
Peak Oil: What We Know is Uncertain
The potential scope of a peak oil driven energy shock has been widely debated and opinions run the gamut from ‘nothing to worry about’ to ‘we are facing the collapse of the globalized economy’.

Essay Bryn Davidson
2727
Figure 3
Reported OPEC Oil Reserves: Paper Barrels? World oil data is often of poor quality or susceptible to political manipulation
Source: US EIA. 2006 International Energy Outlook
1980
0
800
600
400
200
1000
billi
on b
arre
ls
1985 1990 1995 2000 2005
In the mid 80s a new OPEC rule tied each nation’s production quota to the size of their reported reserves.
Soon thereafter OPEC reserve estimates from each member country were nearly doubled.
Depending on what assumptions you make, and whose data you trust, you could potentially arrive at either conclusion, though, as is usually the case, the truth probably lies somewhere in the middle.
Much of the uncertainty surrounding peak oil stems from the fact that much of the data available is either of poor quality or has been deliberately manipulated. OPEC oil reserves, for instance, were almost instantly doubled in the 80s after a new rule was implemented that tied each country’s quota to the size of their published reserves (see Figure 3).
Given the suspect nature of this reserves jump,11 many early peak proponents believe that actual OPEC reserves might be substantially smaller than the numbers quoted by many mainstream energy groups and energy reporters.
In the realm of future projections, and dates for global peak oil, the opinions vary widely as well. On one hand there are early peak proponents – such as those from ASPO12 – who are predicting a near term peak followed by a rapid decline. On the other hand there are those who believe peaking will happen later as part of a long sustained plateau.
An evolving consensus among the former group (a position reinforced by peer reviewed academic studies,13 near term ‘mega-projects’ forecasts,14 15 recent world events, and cautionary statements from the International Energy Agency16) is for a peak or plateau running from 2005 to around 2012, and followed by a later peak in global natural gas production.
Figure 4 shows the results of a peer-reviewed analysis of the world’s super giant oil fields.17 From this study, the predicted date for peak oil ranges between ~ 2008 and ~ 2018, with rapid declines occurring post peak.
While there are still some economic and industry groups who dispute this type of near term projection, we are still in a position of needing to incorporate the potentially profound impacts of peak oil driven energy scarcity, and climate change driven policy, into the models used to plan our cities and regions.
To do this, in the most responsible way possible, we need to move beyond the linear planning approach that has guided past development, and instead talk about different scenarios for the future.

Climate Change and the Future of Southern California
Peak Oil and Climate Change: Scenarios and Implications28
Figure 4
1945
6
8
4
10
2
0
Mill
ion
Bbl
/ D
ay
1965 19851925 2005 2025 2045
Peering Ahead: Global Peak Oil ScenariosA Peer-Reviewed Analysis by Fredrik Robelius, University of Uppsala
PAST FUTURE
Historic Global Oil ProductionA Range of Estimates for Future Oil Production (Robelius)
Scenarios: Exploring Plausible Futures
Those cities which are affected by simultaneous energy and climate crises could plausibly experience a ‘major shock transition’ defined by several decades of severe economic turbulence, widespread migration and immigration, government rationing programs, and food and housing shocks which put vulnerable populations at risk.
By contrast, if oil depletion and climate impacts are less severe, then a proactive region might undergo a largely market-driven, and relatively ‘high tech’ transition away from carbon intensive fuels.
These two scenarios, named ‘Lean and Local’ and ‘Techno-Markets’ respectively are contrasted with the ‘Past Trends’ scenario which embodies many of the assumptions still used by most planning agencies today.
Figure 5 shows a diagram which maps out these three scenarios as defined by the combined impacts of peak oil and climate change. Potential climate shocks range from minor (e.g. warmer weather) to major (e.g. massive sea level rise). Potential peak oil shocks range from minor (e.g. rising prices) to major (e.g. the collapse of globalized trade).
Figure 5
Peak Oil + Climate Change: Combined Impacts & ScenariosDefining three plausible scenarios encompassing the individual and combined impacts of peak oil and climate change
MajorPeak OilShock
ModeratePeak OilShock
Peak Oil Impacts
Clim
ate
Chan
ge Im
pact
s
MinorPeak Oil Shock
MinorClimateShock
ModerateClimateShock Scenario 2:
‘Techno-Markets’
Scenario 1:
‘Past Trends’
Scenario 3:
‘Lean & Local’
MajorClimateShock
2008 Dynamic Cities Project

Essay Bryn Davidson
2929
The key distinction between ‘Techno-Markets’ and ‘Lean and Local’ is the breakdown of the globalized economy (from peak oil, climate change, or other factors) which limits the uptake of new green technologies, and shifts the emphasis from global markets to government and local community action.
For a narrative outline of the ‘Techno-Markets’ and ‘Lean and Local’ scenarios (see Figure 6).
Scenarios: Gaming the Future
With these three narrative scenarios in place it becomes possible to create relatively transparent numerical models – using bundles of assumptions from each scenario – to ‘game’ future potential impacts on planning metrics like transportation demand.
In the past, planning agencies have predicted future demand for highways and other major infrastructure investments by extrapolating past growth trends into the future. While this “predict and provide” approach may have made sense in the past, it does a very poor job of accounting for a future defined by the unfolding impacts of both peak oil and climate change.
An alternative approach, then, is to do a supply-based projection which – in the case of transportation demand forecasts – looks at the future availability of fuels in a future defined by fuel scarcity and carbon constraints.
This type of modeling starts with an oil depletion scenario18 (tailored to a specific location like the U.S. or Canada) and then layers in bundles of assumptions about how quickly we can scale up various mitigation strategies.
In the case of the ‘Techno-Markets’ scenario the wedges for technological mitigation and adaptation strategies are relatively large (assuming that global trade and credit markets continue to support the uptake of new technologies).
By contrast, the ‘Lean and Local’ scenario assumes that technological mitigation and adaptation strategies are impeded by economic difficulties and that community based solutions, government infrastructure spending, and government rationing programs play a larger role.
Modeling Future Transportation Demand
With a regionally specific depletion model19 in hand we can begin to layer in the various mitigation strategies that will be implemented to address either peak oil or climate change.
The ‘wedges’ for these strategies (including alternative fuels, vehicle efficiency and electrification, among others) illustrate the speed with which each strategy or technology can be brought to market and scaled up.
The wedges are based on an amalgamation of various studies and forecasts, but are weighted by scenario. The wedge for vehicle efficiency, for instance, is much larger in the ‘Techno Markets’ scenario than in the ‘Lean and Local’, but both are based on an analysis of how quickly the fleet of vehicles can be turned over as newer, more efficient vehicles gradually replace older ones.

Climate Change and the Future of Southern California
Peak Oil and Climate Change: Scenarios and Implications30
Figure 6
2 Scenarios for the Energy Transition (2000-2050)
The market, after several years of turbulent transition, responds to energy shocks, carbon caps, and carbon pricing with new green technologies and jobs that scale up quickly.
Combined energy, economic, and climate shocks derail both the economy and local concern for climate change.Technological adaptation is limited by the stagnant global economy.Government rationing is common. Local and low tech community-based solutions predominate.
Energy prices rise and fall, and rise again (like a roller coaster) leading to turbulent stock markets and inflation.
Older industries are forced to shift to new 'green' models in response to higher prices and a growing market demand for energy efficient products and services.
"Oil dependent" suburban real estate stagnates, while walkable communities with transit options see growing demand and appreciation.
Highway and airport expansion projects are halted in favor of infrastructure repair projects and other capital projects that increase the ‘energy productivity’ of the regional economy.
Green building standards are mandated for all new construction.
Cities with oil dependent economies lose business and population to regions with more resilient economies and reliable water supplies.
Governments enact energy, food and housing rationing systems (which stay in place more than a decade).
Populations fluctuate wildly as migrants and immigrants seek refuge from places made un-inhabitable by the changing climate, changing economy, and chronic energy shortages.
Some communities and suburban housing tracts are abandoned while others re-form around new, primarily local, economies.
Farming communities absorb migrant workers, while urban centres pack more people into their existing housing stock.
Key Points
Narrative
A turbulent market driven transition
“Techno-Markets”1
A transition driven by a combination of major shocks
“Lean and Local”2
Massive government and private sector programs assist with efficiency upgrades to older homes and buildings.
Assistance programs help low income families and seniors to transition smoothly.
Global markets quickly scale up new energy and environmental technologies.
Cap and trade systems regulate large emitters of CO2. Carbon taxes are widely enacted, but in the short term have a relatively small impact when compared to the price impact from peak oil.
Communities that invested heavily in transit, density, and efficient buildings transition smoothly to an emerging post-carbon economy.
For a decade, many North American cities see the re-emergence of shantytowns and other informal settlements.
Low-tech and improvised solutions predominate over high tech ones.
For several decades, local economic concerns trump global climate concerns, even with the disappearance of arctic sea ice and rising sea levels.
After decades of turbulent transition, new land use patterns, transport systems, and low carbon energy systems re-emerge which support much lower energy and carbon use per capita.
As a result, the global economy eventually stabilizes and returns to the task of adapting to the ever-changing climate.
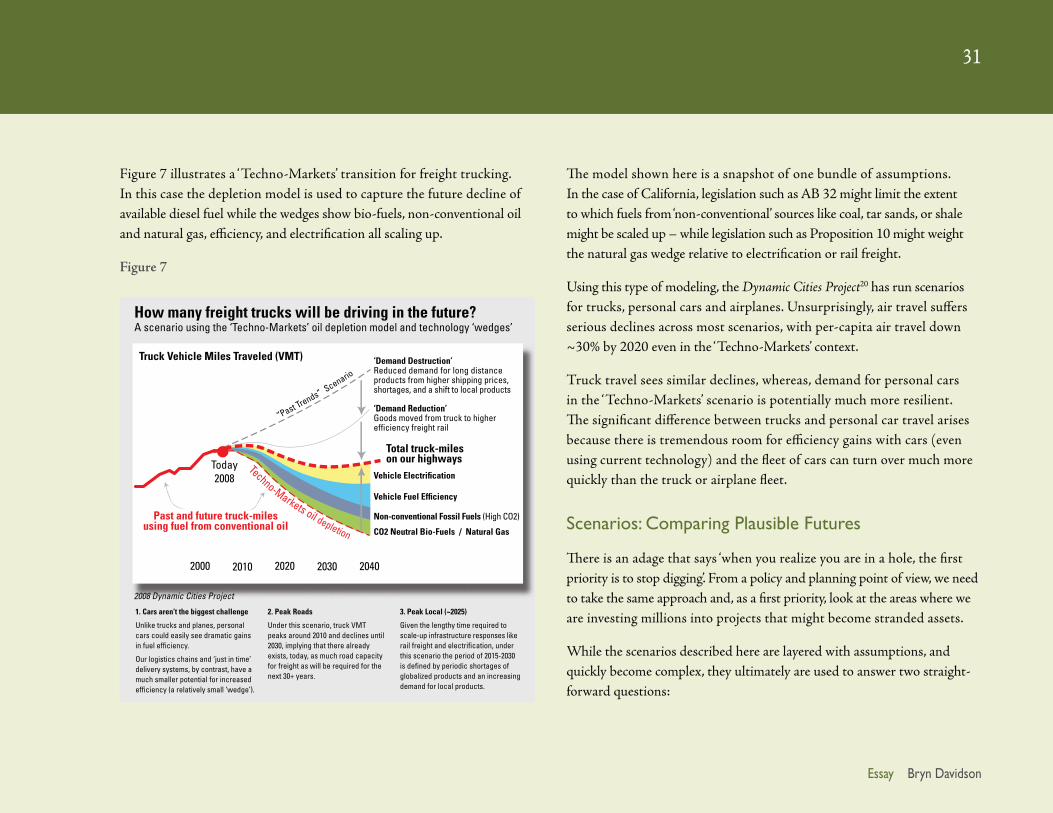
Essay Bryn Davidson
3131
Figure 7 illustrates a ‘Techno-Markets’ transition for freight trucking. In this case the depletion model is used to capture the future decline of available diesel fuel while the wedges show bio-fuels, non-conventional oil and natural gas, efficiency, and electrification all scaling up.
Figure 7
Truck Vehicle Miles Traveled (VMT)
How many freight trucks will be driving in the future? A scenario using the ‘Techno-Markets’ oil depletion model and technology ‘wedges’
2. Peak Roads
Under this scenario, truck VMT peaks around 2010 and declines until 2030, implying that there already exists, today, as much road capacity for freight as will be required for the next 30+ years.
1. Cars aren’t the biggest challenge
Unlike trucks and planes, personal cars could easily see dramatic gains in fuel efficiency.
Our logistics chains and ‘just in time’ delivery systems, by contrast, have a much smaller potential for increased efficiency (a relatively small ‘wedge’).
“Past Trends” Scenario
Today2008
Techno-Markets oil depletion CO2 Neutral Bio-Fuels / Natural Gas
Non-conventional Fossil Fuels (High CO2)
Vehicle Fuel Efficiency
Vehicle Electrification
‘Demand Destruction’ Reduced demand for long distance products from higher shipping prices, shortages, and a shift to local products
‘Demand Reduction’ Goods moved from truck to higher efficiency freight rail
Total truck-miles on our highways
20102000 2020 2030 2040
3. Peak Local (~2025)
Given the lengthy time required to scale-up infrastructure responses like rail freight and electrification, under this scenario the period of 2015-2030 is defined by periodic shortages of globalized products and an increasing demand for local products.
Past and future truck-miles using fuel from conventional oil
2008 Dynamic Cities Project
The model shown here is a snapshot of one bundle of assumptions. In the case of California, legislation such as AB 32 might limit the extent to which fuels from ‘non-conventional’ sources like coal, tar sands, or shale might be scaled up – while legislation such as Proposition 10 might weight the natural gas wedge relative to electrification or rail freight.
Using this type of modeling, the Dynamic Cities Project20 has run scenarios for trucks, personal cars and airplanes. Unsurprisingly, air travel suffers serious declines across most scenarios, with per-capita air travel down ~30% by 2020 even in the ‘Techno-Markets’ context.
Truck travel sees similar declines, whereas, demand for personal cars in the ‘Techno-Markets’ scenario is potentially much more resilient. The significant difference between trucks and personal car travel arises because there is tremendous room for efficiency gains with cars (even using current technology) and the fleet of cars can turn over much more quickly than the truck or airplane fleet.
Scenarios: Comparing Plausible Futures
There is an adage that says ‘when you realize you are in a hole, the first priority is to stop digging’. From a policy and planning point of view, we need to take the same approach and, as a first priority, look at the areas where we are investing millions into projects that might become stranded assets.
While the scenarios described here are layered with assumptions, and quickly become complex, they ultimately are used to answer two straight-forward questions:

Climate Change and the Future of Southern California
Peak Oil and Climate Change: Scenarios and Implications32
1. “Is our investment [ in new highway capacity ] the best way to invest millions of dollars, or could that investment become a stranded asset?”
2. “Is there a better investment which would retain its value in every scenario? (While reducing both emissions and the oil dependence of the regional economy)”
In the case of truck vehicle-miles-traveled (VMT) we can look at three scenarios for the future road space required for trucks in 2020:
� Under a ‘Past Trends’ scenario truck travel is predicted to rise by as much as 50% (a number suggested by extrapolating the growth from 1980-2005).
� By contrast, a ‘Techno-Markets’ scenario, which accounts for peak oil and climate impacts coupled with a strong market and technology response, predicts a 10% decline in truck VMT by 2020.
� A ‘Lean and Local’ scenario – resulting from combined energy, economic, and climate shocks – results in an even steeper 30% decline by 2020.
Scenarios: Are We Nearing ‘Peak Roads’?
In the two scenarios which account for peak oil and climate impacts, truck VMT peaks in the near future, and then declines for several decades (as high cost diesel fuel, carbon caps, and a more local economy reverses the globalization trend of the past 30 years21).
In these scenarios, which contrast sharply with the ‘Past Trends’ predictions,
we have as much road capacity today as we will ever need, or be able to use (i.e. ‘peak roads’). This implies that there is a good chance that new highway (or airport) expansion projects risk becoming ‘stranded assets'.22
By contrast, investments that increase the energy productivity of the workforce and economy could simultaneously address climate change and the economic strength of the region.
Energy Transition and the Post-Carbon Economy
Peak oil and climate change are driving an unprecedented global energy transition which will demand an unprecedented response from our cities and regions, and from the global economy.
Through the lens of peak oil, climate legislation can be seen not as an economic burden, but rather as a critical catalyst for making the Southern California economy more competitive, and the region’s cities more healthy and prosperous. To do this, however, climate policy must have a stronger focus on strategies that reduce both emissions and oil dependence.
Likewise, oil depletion models need to become integral components of the region’s infrastructure and economic development planning. Today’s long term investments will serve us through the turbulent decades of the energy transition, and will serve our children in a post-oil future.
It is critical, then, that we begin to use scenarios as a tool for breaking away from ‘extrapolated’ planning, and as a way to bridge the uncertainty that defines both peak oil and climate change. We can use scenarios as a means to avoid sinking millions of dollars into potentially stranded assets, and to channel our efforts towards more resilient alternatives.

Essay Bryn Davidson
3333
In most cases, these alternatives are fairly clear; an emphasis on passenger and freight rail, electrification of transport, transit and carpooling, local manufacturing and job creation, livable density in mixed use communities, preservation of high quality agricultural land, and new cleaner energy supplies.
These investments, which find the common ground between peak oil and climate change, will form the backbone of a new, post-carbon, economy that will create local jobs, protect the region’s most vulnerable populations, and help us transition to a future we can be proud of.
About the Author Bryn Davidson is a LEED accredited designer and sustainability consultant holding degrees in mechanical engineering (U.C. Berkeley) and architecture (U. British Columbia). He is the cofounder and executive director of the Dynamic Cities Project (DCP) and is a principal of Rao/Davidson Design and Planning (Rao/D Cityworks). Mr. Davidson has given numerous presentations on the global energy transition to public and professional groups, and recently presented a talk on scenario planning at the 2008 ASPO-USA world oil conference. In parallel with his research and outreach work through the DCP, Mr. Davidson designs low-energy green buildings, and works on projects that aim to have a “net positive” impact on their community’s emissions and oil dependence.
Additional Information About the Dynamic Cities' Depletion ModelsThe Dynamic Cities Project (www.dynamiccities.org) The Dynamic Cities Project was founded in 2005 as a non-profit think tank working to integrate the nexus of peak oil and climate change – “the global energy transition” – into the practice of urban and regional
planning. Since then, the DCP’s presentations and research have received enthusiastic reviews both locally and globally.
Dynamic Cities’ Depletion ModelsThe Dynamic Cities Project has created two models (Figure 8) which aim to capture a high and low case for the amount of oil available to consumers and businesses in the U.S. and Canada.
These models are derived in part from the peer reviewed global depletion study done by Fredrik Robelius at the University of Uppsala, but – like the narrative scenarios – they aim to incorporate the wide range of political, economic, and geological factors which will make the local experience of peak oil different from that of exporting countries (whose internal oil consumption is subsidized and will peak later) and poor countries (who cannot afford oil at today’s prices).
Model #1 assumes that Saudi Arabia and other exporters have oil supplies on the higher end of the range of estimates, but that they (in particular the Saudis) limit their production so as to slow global depletion and preserve oil resources for their future generations.
Model #2 assumes that US imports of oil are flat to 2010, and then decline slowly to 2015 (as richer US consumers are able to out-purchase their competitors in poorer countries). Post 2015, with imports from Mexico and other countries in serious decline, the depletion rate accelerates to 4% a year.
Depletion model #1 is used as an input into the ‘Past Trends’ scenario as a test to see if any of today’s current assumptions about future growth in transportation demand could still be true. Depletion model #2, by contrast, is used for both the ‘Techno-Markets’ and ‘Lean & Local’ scenarios.

Climate Change and the Future of Southern California
Peak Oil and Climate Change: Scenarios and Implications34
Figure 8
How much fuel will we have access to in the future?Future availability of fuels from conventional oil 1, 2, 3
Depletion Model 1: ‘Past Trends’ Scenario
Depletion Model 2: ‘Techno-Markets’ and ‘Lean and Local‘ Scenarios
2. ‘Available’ OilThese scenarios aim to account for geologic, political, and economic factors including declining ‘net-exports’ from producing countries, and price driven ‘demand destruction’ in poorer countries.
1. Regionally SpecificThese scenarios are for U.S. and Canadian consumers.
Model v.2 Jan 2008 Dynamic Cities Project www.dynamiccities.org
Today2008
Today2008
Rapid Depletion
Slower Depletion
2015 - 2050 (-1%) Annual Decline2008 - 2015 +1% Annually
2008 - 2010 +0% Annually2010 - 2015 (-2%) Annual Decline
2015 - 2050 (-4%) Annual Decline
3. Fuel from ‘Conventional Oil’These models represent fuels from ‘conventional’ oil only.
Bio-fuels, tar sands, and other non-conventional sources are modeled separately, as they have varying impacts on potential CO2 emissions.
Global Depletion
Model
2008 Dynamic Cities Project
Endnotes
1. For a graphical overview of peak oil, see the Dynamic Cities Project’s presentation “Peak Oil: Navigating the Debate”
http://dynamiccities.squarespace.com/peak-oil-navigating-the-debate/
2. ”Last month...the Democratic-controlled Congress allowed the moratorium to lapse amid pressure from the White House, Republican lawmakers...who had come under attack for not doing more to bolster domestic energy supplies with gas prices topping $4 a gallon over the summer.” Cynthia Dizikes, Los Angeles Times, November 13, 2008
3. ”Canadian oil sands representatives have become regular visitors to [Sacramento]...The Alberta oilmen are there for damage control. Canadian producers are investing billions of dollars on new oil sands projects aimed at supplying oil primarily to the U.S. market, but which generate more greenhouse gases than other sources.” Claudia Cattaneo, Financial Post, October 31, 2008
4. “Peaking of World Oil Production: Impacts, Mitigation, and Risk Management” Robert L. Hirsch, Roger Bezdek, Robert Wendling, Consultant study prepared for the U.S. Department of Energy, February 2005
5. “Crude Oil: Uncertainty about Future Oil Supply Makes It Important to Develop a Strategy for Addressing a Peak and Decline in Oil Production” GAO-07-283, February 28, 2007
6. “Pentagon and Peak Oil: A Military Literature Review” Sohbet Karbuz, Energy Bulletin, Jul 13 2006
http://www.energybulletin.net/node/18056
7. Mexico’s super-giant Cantarell field, which peaked around 2005, has been declining rapidly, closely following the worst-case decline projections – even while Mexico’s domestic oil consumption has increased. These opposing trends have led some forecasters at a recent conference on oil depletion to predict that by 2012 or 2013 Mexico may no longer be able to export oil.
Essay Bryn Davidson
3535
8. For more on oil discovery challenges see “The End of Cheap Oil” Tim Appenzeller, National Geographic, June 2004
9. “The oil sands of northern Alberta are undergoing rapid growth. Nearly $100-billion will be spent in the coming decades to produce this resource which contains almost 175 billion barrels of oil— a reserve second only to Saudi Arabia’s in size. “ Bruce March, National Post, November 12, 2008
10. It is much harder to scale-up production (the rate of extraction) of non-conventional oil when compared to conventional oil. In addition, because each barrel of non-conventional oil requires significantly more input energy to create it, there is a lower overall energy profit to society – a lower ‘energy return on energy invested’ or EROI. EROI limits, and production constraints make it difficult for any non-conventional oil or biofuel to be considered a ‘scalable’ substitute for conventional oil.
11. For further independent analysis of Saudi and OPEC oil data see “Twilight in the Desert: The Coming Saudi Oil Shock and the World Economy” by Matthew Simmons
12. Association for the Study of Peak Oil and Gas (ASPO) Depletion Model, November 2008:
http://www.aspo-ireland.org/contentFiles/newsletterPDFs/newsletter95_200811.pdf
13. Peer Reviewed Depletion Studies (ASPO – International website):
http://www.peakoil.net/publications/peer-reviewed-articles
14. Mega-Projects Forecasts: “Prices holding steady, despite massive planned capacity additions “ Chris Skrebowski, Petroleum Review, April 2006
15. Oil Mega-Projects Wiki:
http://en.wikipedia.org/wiki/Oil_megaprojects
16. “IEA warns of new oil supply crunch” Carola Hoyos, Ed Crooks and Javier Blas, Financial Times, November 12, 2008
17. “Giant Oil Fields – The Highway to Oil: Giant Oil Fields and their Importance for Future Oil Production“ Fredrik Robelius, University of Uppsala, March 2007
18. See more information (after About the Author) on the depletion models used in the transport demand scenarios
19. See more information (after About the Author) on the Dynamic Cities Project and the depletion models used for transportation demand
scenarios (www.dynamiccities.org)
20. Ibid.
21. “While railroads generally were happy with their third quarter earnings for this year, trucking companies suffered the brunt of the nation’s economic woes and high fuel prices.” “Trucking Earnings Fall Below Railroads....” U.S. Rail News, November 13, 2008
22. “Several years and $61.4 million later, [Hagerstown, Md.] opened its... new 7,000 foot runway...two months after the airport lost scheduled air service altogether. Despite its costly investment...the airport has had no luck attracting a new carrier, as the industry struggles under soaring fuel prices.” Micheline Maynard, New York Times, May 21, 2008

Climate Change and the Future of Southern California
William Fulton
How Planning Can Combat Climate Change in Southern California
Conventional wisdom would suggest that Southern California is ill-prepared for the twin challenges of peak oil and climate change. After all, we are the most sprawling, car-oriented place on
earth, right? We are so addicted to our automobiles that we simply cannot live without our fix of driving, and this will doom our efforts to attack the question of climate change and respond to the problem of peak oil. Right?
Not exactly. It is true that Southern California, like most metropolitan areas in the Western United States, is mostly auto oriented. We have built vast stretches of single-family homes across the landscape, and in large parts of the region it is almost impossible to get around without a car. But as a society, Southern California is surprisingly efficient. On a per-capita basis, both our vehicle miles traveled and the associated transportation energy consumption are low compared to the rest of the country.1 That is because, by and large, although we have to drive to get from one place to another, those places are not very far apart, particularly in the Los Angeles and Orange counties portion of the region.
Clearly, in the era of peak oil and climate change, we have to do better. But this does not mean that we have to force the creation of a dense urban society that nobody wants. Rather, what it means is that we have to take maximum advantage of the emerging pockets of urban concentration that we see throughout the region. We need to focus as much of our public policy as possible on reinforcing those concentrated areas so that they function as efficiently as any urban location on earth.

Essay William Fulton
3737
Despite our international reputation as a capital of sprawl, most of Southern California actually is not sprawling today. That is because we have few places left to sprawl to. Most of Los Angeles and Orange counties are built-out, with very little raw land left. Ventura County has made a policy choice to retain farmland and, in so doing, is driving new development into existing cities. Riverside and San Bernardino counties are still building out on raw land, but increasingly they are facing constraints, both from environmental protection and the realities of traffic congestion.
The result of these current development patterns, to be sure, is ever-more traffic congestion in a lot of places. The sheer amount of traffic on the region’s freeways is overwhelming, even though most drivers are not going
a long distance; and traffic on surface streets is considerable, especially in affluent communities where more people have cars and more jobs are concentrated. But hidden within this problem is opportunity – the opportunity to reshape certain parts of the region to be less dependent on automobiles and therefore respond to the challenges of both peak oil and climate change.
Despite its reputation as a sprawling and low-density region, Southern California has always had more than its share of self-contained villages and dense communities. The original Red Car system linked together a far-flung network of villages from Santa Monica to San Bernardino, all of which contained jobs and houses and retail in close proximity to one another. The central part of Los Angeles has always been a dense concentration of urban activity; before the opening of the Red Line, the Wilshire Corridor was the busiest bus-only corridor in the nation. And Southern California has always had high-density centers of single activities, including apartment complexes throughout the San Fernando Valley and Orange County; office centers such as Warner Center in Woodland Hills and Century City in West Los Angeles; and shopping centers such as South Coast Plaza in Orange County.
Today, the trick is to reinforce these villages and centers so that they have more jobs and housing and shopping in close proximity to one another; and – to the extent possible – knit these locations together with high-speed public transit in the form of rail lines and “bus rapid transit” like the Orange Line across the San Fernando Valley. Only by doing this will our region move beyond the current situation – auto-efficient but still auto-dependent – to a situation where we actually begin to reduce overall driving, reduce the use of gasoline, and reduce greenhouse-gas emissions.
Climate Change and the Future of Southern California
Peak Oil and Climate Change: Scenarios and Implications38
Southern California already has the tools in place to accomplish these goals. Over the past decade, a wide variety of policy efforts – including SCAG’s Compass/Blueprint program – have identified villages and centers best suited to accommodate more development, along with market opportunities, policy ideas, and funding sources that can be brought together to both create and strengthen locations that are less dependent on the car. In Los Angeles County, new development along the Red Line and the Gold Line especially have shown the way. North Hollywood, for example, has blossomed into a walkable urban community with a thriving arts scene. Meanwhile, transit-oriented development has sprung up along the Gold Line all the way from downtown Los Angeles to Pasadena.
In outlying counties, similar concentrations of development have occurred along Metrolink lines and in centralized locations that are parking-rich, thus permitting localities to adopt a “Park Once” strategy. Concentrated development is planned near the Fullerton Metrolink station in Orange County, for example; and even Simi Valley in Ventura County has built high-density housing adjacent to Metrolink. In places like Victoria Gardens in Rancho Cucamonga and Valencia Town Center in Santa Clarita, we are seeing construction of urban housing adjacent to jobs and shopping in areas formerly viewed as exclusively suburban. Residents may still drive to work, but they do not have to drive much of anyplace else – especially for shopping and entertainment, which is just a short stroll away.
Southern California is blessed with dozens of these emerging mixed-use villages containing a dense concentration of activities. Some date back to the 19th Century, when the rail lines were first laid out. Others are prewar downtowns. Still others, like Victoria Gardens and Valencia Town Center, have essentially been created out of nothing in recent years. In a few cases,
such as The Americana At Brand in Glendale, the new town center concept has been plugged into an old downtown area.
Just as successfully reducing our carbon footprint requires a concentration of activities in close proximity to one another, successfully bringing these communities into existence requires a dense and focused concentration of policy, funding, and marketing efforts.
There is no question, for example, that our region has an increasingly large market for more urban living. This market stretches across virtually all demographic and income groups. Young professionals and empty-nesters alike want to live a hassle-free life where they have minimal reliance on the car – but maximum access to entertainment and recreation. Working-class families increasingly prefer to live in small-lot single-family houses near their families, neighborhoods, and churches – rather than moving 40, 60, 80 miles away for a new house. And increasingly, as well, private real estate capital is gravitating toward these markets, targeting specific zip codes or income groups.
Just as important, however, is the fact that public funding sources are reinforcing these new, more concentrated communities as well. In 2006, for example, California voters adopted Proposition 1C – a housing bond that allocated more than $1 billion for infill and transit-oriented development projects. Many major mixed-use projects in infill locations and adjacent to transit stops are now being funded partly by this money.
Increasingly as well, public policy is shifting in this direction too. The recent adoption of SB 375 is perhaps the best example. This state law – designed to draw transportation and land use closer together in order to reduce greenhouse gas emissions – creates powerful new incentives for

Essay William Fulton
3939
regional planning agencies like SCAG to give preference to development projects located in these concentrated locations, especially those near transit stops. Under SB 375, SCAG will build on the Compass/Blueprint program to create a “Sustainable Communities Strategy” – and projects that conform to that strategy will qualify for streamlined review under the California Environmental Quality Act.
There is still a lot of resistance throughout the region to the idea of concentrated development in villages and centers. Many longtime residents fear that their quality of life – traditionally suburban in nature – will be compromised by these changes. In addition, inner-city activists focused on environmental justice issues fear that their communities will be disproportionately affected as well.
These are legitimate concerns. But even for these longtime residents, scattershot development is likely to compromise their quality of life as well. Overall traffic congestion will be worse. Rather than being concentrated in existing villages and centers, new high-rise development could spring up randomly in their communities. And, of course, longtime residents as well will have to drive more in slower traffic, consume more oil, and emit more greenhouse gases.
It is hard to know whether we have hit peak oil yet, but it is coming soon. And the climate change crisis is already here. These two crises – on top of important other trends, such as transit construction, a lack of land, and the increasing cost of a suburban lifestyle – are likely to push Southern California strongly in a new direction in the decades ahead.
Endnote
1. In 2005, the vehicle miles traveled (VMT) per capita in the SCAG region were approximately 8,770 compared to 10,083 for the national average. This is mainly due to the much lower VMT per capita from Los Angeles and Orange counties at 7,672. VMT per capita in Riverside and San Bernardino counties, however, exceeded the national average in 2005. Please refer to Frank Southworth, Anton Sonnenberg, and Marilyn Brown, “The Transportation Energy and Carbon Footprints of the 100 Largest U.S. Metropolitan Areas” Working Paper 37 (Georgia Institute of Technology School of Public Policy, 2008).
About the Author
William Fulton is Deputy Mayor of Ventura and a Principal in the planning consulting firm of Design, Community & Environment. He is the author of several books including Guide to California Planning and The Reluctant Metropolis. Mr. Fulton is also Publisher of California Planning & Development report and a Senior Scholar at the School of Policy, Planning & Development at the University of Southern California. He has spoken on growth and planning trends to groups throughout the United States.

Climate Change and the Future of Southern California
Peak Oil and Climate Change: Scenarios and Implications
Walker Wells, AICP, LEED AP
Green Buildings – A Tool for Stemming Climate Change?
Over the past decade, Southern California cities have adopted green building programs at a steady pace. Today, the region is a national hotbed of green building, with mandatory programs in
seven Los Angeles County cities complemented by incentive-based programs in cities like Riverside and Costa Mesa.1 As climate change rapidly moves to the center of environmental discourse, it is essential to explore how these programs factor into the climate change equation.
Functioning as an umbrella, a green building program integrates and encourages innovation in waste management, stormwater, water conservation, energy efficiency, land use, and public health. Pioneers like Santa Monica laid the foundation for folding green building into local government operations by focusing first on City building projects. This trend continued through the first part of the new millennium, with Southland cities large and small adopting green requirements for public construction.
Over the past several years the trend has shifted to focus on requesting or requiring private sector development to build green.2 Global Green worked with a number of cities - Los Angeles, Long Beach, Pasadena, Irvine, and West Hollywood – that have taken this path. Structurally, a model private sector program combines planning and building code modifications; instituting a comprehensive green building standard; and, establishing incentives such as priority processing, increased building area, or parking reductions. This basic framework is then adjusted to address the environmental, social, political, and development issues unique to each city.
Figure 1

Essay Walker Wells
4141
Figure 2
Example Local Green Building Rating Systems
City Thresholds Mandatory Thresholds Voluntary/Incentive Thresholds Effective Date
Irvine New HomesNew Commercial ProjectsNew Apartments
City "Green Home" ChecklistCity "Green Apartment Home" ChecklistCity "Green Building" Checklist
October 2005
Long Beach Municipal Buildings (≥7,500 sf )Residential/Mixed Use (≥50 units)Commercial/Industrial (≥50,000 sf )
LEED CertifiedIntent of LEED CertifiedIntent of LEED Certified
June 2003
November 2007
Los Angeles Municipal Buildings (≥7,500 sf )Non-Res./Mixed (≥50,000 sf )Res. (High-Rise, ≥50,000 sf, ≥ 50 units)Res. Renovations (≥50,000 sf/≥50 units)
LEED CertifiedIntent of LEED CertifiedIntent of LEED Certified
LEED SilverLEED SilverLEED Silver
January 2002
April 2008
Pasadena Municipal BuildingsNew (≥5,000 sf )Renovations (≥15,000 sf )
Non-Res. New ConstructionNew Construction (≥25,000 sf )New Construction (≥50,000 sf )
ResidentialTenant Improvements (≥25,000 sf )Multifamily (≥ 4 stories)Mixed-Use (≥ 4 stories)
Intent of LEED SilverIntent of LEED Silver
Intent of LEED CertifiedIntent of LEED Silver
Intent of LEED CertifiedIntent of LEED CertifiedIntent of LEED Certified
LEED Certified (affordable units)LEED Certified (affordable units)LEED Certified (affordable units)
October 2005(Updated May 2008)
West
HollywoodMunicipal Buildings (≥10,000 sf )Private Development (all projects)Private Development (≥ 3 units)
LEED CertifiedWEHO Basic Green StandardsWEHO Basic Green StandardsWEHO Green Point System (min. 60 pts.)
WEHO Green Point System (min. 90 pts.)WEHO Green Point System (min. 90 pts.)
April 2006
October 2007

Climate Change and the Future of Southern California
Peak Oil and Climate Change: Scenarios and Implications42
In 2006, Global Green developed a six-step methodology for establishing a green building program.3 The process begins with an analysis of existing codes, policies and programs, then reviews projections for the future type and quantity of development. Next is a series of meeting with designers, builders, environmental advocates, and other interested parties, often in the form of a “green ribbon” committee to discuss what issues are of greatest priority locally, what building types and sizes should be addressed, and how to most effectively implement the program. At this point, the program framework can be fleshed out and presented for adoption.
This approach guided our contributions to the programs listed above and is being used by many more cities as a tool and resource. But clarity in approach and structure does not necessarily reflect unity in intent. What is clear is that cities adopt green programs for a variety of reasons, and the reasons are changing as perspectives on environmental issues evolve.
Santa Monica’s program emerged from the City’s commitment, starting in 1994, to promote sustainability locally. Looking at ways to reduce the ecological footprint, staff quickly identified the built environment as both a strategic entry point and a means to generate quantifiable benefits that could be folded into the long-term tracking of citywide performance through sustainability indicators. In other places, green building programs have served as the catalyst for stronger commitments to sustainability. Pasadena adopted the UN Environmental Accords partly as an outgrowth of its green building program and Long Beach recently established a Sustainable City Commission concurrent with preparing the green building ordinance. For other cities, programs stemmed from a long-term commitment to overall environmental stewardship, often driven by several committed senior staff members, planning commissioners, or city council members.
Analyze Building TrendsPast Trends
Planned City Projects and Major Private Projects
Projected Growth
Establish BaselineGeneral Plan Policies
OrdinancesEnvironmental Programs
Establish FrameworkIdentify Priority Sectors
Determine PhasingSet Incentives
Determine Administration
Conduct OutreachForm City Staff Team
Form Citizen CommitteeConvene Groups
Identify Issues and Priorities
Review Existing GuidelinesFit with Local Climate
Fit with City ProceduresFit with Local Building Practice
Address Local Priorities
ImplementationPolicy Adoption
Resources and MaterialsWorkshops and TrainingAdditional Staff Needs
Figure 3

Essay Walker Wells
4343
Recently though, the focus has shifted to green building programs as the cornerstone of climate action plans. Why the sudden change?
First, climate change has quickly moved up the list of critical issues in the minds of the public and policymakers. The June 2006 Parade Magazine cover story, “Why You Can’t Ignore the Changing Climate,” combined with the early 2007 release of the 4th Assessment Report from the International Panel on Climate Change4 effectively ended the discussion, both public and scientific, of whether climate change was “real.” As evidence of climate change grew, the urgency of the issue grew too. The issue at hand became determining what to do, quickly, to stabilize atmospheric carbon and maintain the climate close to what we have become accustomed to over the past 10,000 years.
For staff members and elected officials looking for local climate change mitigation strategies, turning to green building is a natural move. Nationally, buildings account for 39% of energy use, 68% of total electricity consumption, and 38% of carbon dioxide annually.5 In California these numbers are slightly lower, the result of both the stringency and consistent implementation of the State energy code (Title 24, Part 6) over the past thirty years. Nonetheless, buildings remain one of the largest consumers of energy and contributors to climate change in the State.6
The second reason is the California Global Warming Solutions Act or AB 32. With the 2006 adoption of this landmark state policy, addressing climate change switched overnight from a voluntary undertaking of few progressive cities, to compliance with state law. The State Attorney General’s Office quickly conveyed just how serious and fundamental a change was in the wind by challenging several jurisdictions’ general plans on the grounds that they were deficient in addressing climate change.

Climate Change and the Future of Southern California
Peak Oil and Climate Change: Scenarios and Implications44
In hammering out the settlement agreements, climate action plans are emerging as preferred strategy, with green building a core component in at least one instance.7
So, how effective are green buildings as a tool for stemming climate change?
Examining the projected benefits of the City of Los Angeles Green Building Program offers some insight into the actual value of a green building program in the effort to address climate change. The program, approved unanimously by the City Council and signed into law by Mayor Villaraigosa on Earth Day 2008, requires all building projects of 50,000 square feet or 50 residential units or greater to meet the intent of the US Green Building Council’s LEED rating system at the Certified level. As a part of our assistance to the city in establishing the program, Global Green analyzed the energy, water, and construction waste savings and prepared an estimate of the avoided carbon emissions that would result from the approximately 150 projects estimated to be subject to the program annually.
The results show that the Los Angeles Program would yield approximately 5,500 tonnes of avoided emissions each year.8 The Los Angeles Department of Water and Power’s most recent submittal to the California Climate Registry provides a useful reference point. As the city’s electricity and water provider, DWP reported 4,129,368 total tonnes of carbon dioxide emissions represent a large portion of the overall carbon footprint for Los Angeles.9 In year one, the green building program would result in just a .13% reduction in overall emissions. Given the time and effort that went into creating the program this seems underwhelming.
Figure 4
But the picture changes, dramatically, as more buildings come on line. By year fifteen, the annual emissions reductions increase to 14%. This is because buildings that come on line in year one continue to generate energy and water savings in future years. As time goes by, the benefits of the green building program increase exponentially. Translated into quantities that are perhaps easier to grasp than “tonnes of avoided emissions”, by the end of its fifteenth year the benefits of the Los Angeles program are equivalent to planting 14 million trees or removing 100,000 cars off the road permanently.

Essay Walker Wells
4545
Figure 5
This analysis highlights that green building is a strategy for the long term. By focusing on new construction or major remodels, the number of green buildings and, by extension, the volume of benefits produced by the program over time become significant. Given short political and economic cycles and a general societal expectation for quick fixes and fast results, this long-term strategy may require greater patience than is typically expected or available. Climate change is a long-term problem and it will require long-term thinking and commitment to produce meaningful emission reductions. Given that the carbon footprint of a typical commercial or high-rise residential project will last for the at least 50 year life span of the building, our ability to capture efficiencies on a consistent basis becomes
even more imperative.10 To capture more benefits, sooner, the Los Angeles program could be augmented with requirements and incentives for energy and water retrofits of existing buildings. Still, new construction offers the greatest potential, with a recent study estimating a threefold benefit as compared to retrofits.11
Clearly, green building is only a part of the larger climate solution, not a panacea. Only by combining green building with thoughtful land use planning and provision of resource-efficient transportation options, can the built environment realize its full potential in helping to stem climate change. At deeper level, green buildings are components of a holistic, green urbanism strategy that links individual structures, efficient and appropriately scaled infrastructure, and healthy natural systems; to transform our cities over time to work with, instead of against, nature.
Which perhaps brings us back to sustainability - a mindset as much as a series of strategies and technologies. Green buildings, as microcosms of sustainability, show what can be achieved through focused effort, a spirit of collaboration and integration, and a commitment to work at a high level. If green buildings can change how we perceive the relationship between the built and natural environments and thus redefine we what we consider to be “business-as-usual,” that may be the greatest value of all.
About the Author
Walker Wells, AICP, LEED AP, is the Green Urbanism Program Director at the Global Green USA, a national non-profit organization headquartered in Santa Monica. He works with affordable housing developers, municipalities, and school districts across the country to further green building and sustainable development practices by providing

Climate Change and the Future of Southern California
Peak Oil and Climate Change: Scenarios and Implications46
technical assistance, conducting workshops, and developing public policy. Mr. Wells is an editor and a co-author of the 2007 book Blueprint for Greening Affordable Housing and the 2006 publication Creating Successful Green Building Programs.
Additional Resources
Global Green USAhttp://www.globalgreen.org/greenurbanism
City of West Hollywood Green Building Program: http://www.weho.org/index.cfm/fuseaction/DetailGroup/navid/53/cid/4493/
City of Los Angeles Green Building Program: http://www.environmentla.org/greenbuilding/newgreenbuilding.htm
California Climate Action Registryhttp://www.climateregistry.org
US Green Building Council/LEED Rating System http://www.usgbc.org
Endnotes
1. Office of the California Attorney General, “Local Government Green Ordinances in California” Last Updated: 10/15/08
2. Environmental Law Institute, “Municipal Green Building Programs: Strategies for Transforming Building Practices in the Private Sector” April 2008.
3. Global Green USA, “Creating Successful Green Building Programs” 2006
4. Intergovernmental Panel on Climate Change, “Fourth Assessment Report, Working Group 1 Report: The Physical Science Basis” 2007.
5. U.S. Environmental Protection Agency, “Green Buildings: Why Build Green?” 2005.
6. The Climate Change Draft Scoping Plan prepared by the California Air Resources Board ( June 2008) states that commercial and residential buildings account for 9% of the State’s greenhouse gas emissions. In addition, buildings are the predominate user of electricity, which the Draft Scoping Plan identifies as accounting for a 23% of statewide GHG emissions.

Essay Walker Wells
4747
7. State of California Office of the Attorney General, Memorandum of Agreement with City of Stockton, September 2008.
8. Global Green USA analysis, September 2008.
9. California Climate Action Registry, Los Angeles Department of Water and Power Annual Emission Report for 2005, February 2008.
10. California Environmental Associates, “Design to Win: Philanthropists Role in the Fight Against Global Warming” August 2007.
11. Ibid.

Climate Change and the Future of Southern California
Peak Oil and Climate Change: Scenarios and Implications
Mona Field
Education for a Green Region
Depleting natural resources, escalating energy consumption and record high fuel prices are spiraling out of control. The planet's existence and our survival depend on countering this reality,
balancing necessity and conservation with solutions that lead us toward a carbon-neutral world.
In the fight against global warming, other nations are ahead of the United States. For instance, Israel is a global pioneer, perhaps best known for its creation of the drip irrigation system that it popularized and exported to global markets. Also ahead of the United States is Europe, which implemented an European Union Sustainable Development Strategy focusing on clean energy solutions, sustainable transport, consumption, and production conservation, among other areas.
While California has been known as a center of innovation, we are behind much of the world when it comes to sustainability. Community colleges are playing a major role in taking the initiative forward, and the Los Angeles Community College District (LACCD) is helping to lead the effort through education, training and a $2.2 billion construction program to create new and renovated sustainable buildings.
The California Situation
California is renowned as a green issues trend-setter. It was the first to implement a statewide green building code, as well as the first to pass
Community Colleges Tackle Climate Change and Economic Development through Green Curriculum and Sustainable Building

Essay Mona Field
4949
a plan to reduce carbon emissions (Assembly Bill 32 - Pavley/Nunez). From the governor’s office to the local level, leadership continues to raise awareness of green issues, both legislatively and by executive order.
With massive population increases on the way,1 California faces the challenge of accommodating new growth while reducing its environmental impact. Since buildings are major energy users2 and huge contributors to global warming,3 building green is the only option for meeting demand and reducing carbon emissions.
Leading the way is LACCD, which serves approximately 36 cities in Los Angeles County and covers more than 882 square miles. The District’s nine colleges educate and train the region’s diverse workforce. In 2002, after voters approved bond funding to renovate and build new campus facilities, the LACCD Board of Trustees (BOT) adopted a sustainability policy, which required “green” buildings. The District was a frontrunner and won international recognition for promoting green building several years ahead of many other public and private entities. As a result, LACCD is undergoing one of the largest public sector sustainable building efforts in the nation, with all new buildings being constructed to meet Leadership in Energy and Environmental Design (LEED™) standards.
The District’s innovative programs and services are a catalyst for change and success for more than three million students, and the sustainable construction effort is evident throughout the Los Angeles basin. There are integrated solar farms at East Los Angeles, Southwest, Mission and Pierce Colleges; a natural-light filled Maintenance and Operations building at L.A. Valley College; a water-saving botanic garden that serves as a “living classroom” at Pierce College; and many others examples of new green buildings.

Climate Change and the Future of Southern California
Peak Oil and Climate Change: Scenarios and Implications50
The District is a leader in other ways as well. In April 2005, LACCD became one of the first community college districts to join the California Climate Action Registry. In September 2007, the District contracted for independent verification of its annual greenhouse gas emissions with a goal of reducing the district’s contribution to global climate change.
Moving toward clean energy and a ‘green’ economy in Southern California
As we move into the new global economy, green innovation will have a greater impact on Southern California than ever before. Venture capital funds are being allocated to green technology companies across the state,4 and these investments could account for 52,000 to 114,000 high-quality jobs and $11 to $25 billion in yearly revenue to California by 2010.
The emerging solar industry is one promising area that shows tremendous potential for growth. A forecast from the American Solar Energy Society reported that renewable energy and energy-efficient industries were responsible for the creation of nearly 8.5 million jobs in 2006. By 2030, the number of direct and indirect jobs related to these sectors is expected to reach 40 million. For Southern California, solar-related firms currently employ between 5,900 and 6,900 workers with 73 percent of surveyed employers planning to hire more employees over the next year.5
By partnering with renewable energy leaders, such as Chevron Energy Solutions, MMA Renewable Ventures and Southern California Edison, the District's goal of energy independence is becoming reality. At East Los Angeles College (ELAC), a 1.2 megawatt solar project now provides nearly 45 percent of the College’s energy needs, saving ELAC and the District an estimated $270,000 annually. ELAC’s installation was made possible
through the sophisticated use of a Power Purchase Agreement and federal tax incentives.
Such alliances are typical of the steps that can be taken to achieve green goals. LACCD is also one of 11 Clinton Climate Change Initiative (CCI) partners to launch a pilot program that will help dramatically reduce greenhouse gas emissions by upgrading campus buildings without using capital budgets or increasing monthly operating expenses.
Reuse, Recycle, Reduce: An eco-lifestyle and green economy just make cents
Reducing the amount of waste headed to local landfills is one of the top priorities for LACCD. The District reuses wood, concrete and asphalt at construction sites and donates used and surplus office furniture items to local nonprofits. Through a Zero Landfill policy, approximately 98 percent of LACCD's surplus items are kept from reaching local landfills by selling, donating or recycling.
Showing people how their individual contributions can help reduce our carbon footprint is part of the larger strategy for greening the District. Recycling is widely considered one of the easiest ways to help the environment, and the District has retained a consultant to ensure that all nine colleges have vibrant recycling programs, including educating all students, employees and visitors about the reasons to recycle and the correct use of campus bins. Additionally, in order to close the recycling loop, virtually all of the newly purchased carpeting and furniture procured by LACCD comes from manufacturers who use recycled materials in their products.

Essay Mona Field
5151
With the region’s water supplies becoming more scarce, the District is also following a variety of water reduction strategies, including the use of drought-resistant plants and waterless urinals, which are expected to collectively save nearly 50 million gallons of water each year.
Health is also an important factor to consider. According to Larry H. Eisenberg, LACCD’s Director of Facilities Planning and Sustainability, colleges designed with proper ventilation and non-toxic construction materials have been shown to improve student and employee health and produce better student performance. Attention to site planning and adequate day lighting has been shown to heighten student performance by as much as 25 percent.6 Eisenberg also suggests that lower operating costs are another measurable benefit of "going green."
Training for a ‘green’ labor force - A Green Curriculum for the Future
Nationally, community colleges are responsible for training and educating 11 percent of the workforce. In order to promote a sustainability curriculum, LACCD launched a Green College Initiative & Curriculum program. The curriculum covers workforce development programs such as architecture, solar installation, alternative fuels, water supply, waste water, and sustainable construction. In addition, in courses from the academic fields of biology, geography, geology, sociology and many other disciplines, faculty are revising course content so that every student has a chance to learn about sustainability during their studies at our colleges.
At the district’s most centrally located campus, just south of downtown Los Angeles, Los Angeles Trade-Technical College has a range of green-related courses and programs that range from alternative fuels and emissions
Climate Change and the Future of Southern California
Peak Oil and Climate Change: Scenarios and Implications52
reduction in the Diesel Technology Program to a Water Supply Technology two-year degree with an emphasis in water purification. Currently the college has 52 green-integrated courses and four green-related degree and certificate programs in career-technical, science, health, and liberal arts programs.
At Los Angeles Valley College, in the heart of the San Fernando Valley, Environmental Studies courses provide interdisciplinary views and expose students to all the issues relating to planetary sustainability.
Staying on the path toward energy independence
The District’s Sustainability Policy is the key to its future energy independence. To facilitate this goal, the District is implementing a ground-breaking Renewable Energy program involving solar, wind and geothermal sources, and energy storage techniques such as hydrogen-generation and local storage. On average, each of the nine colleges uses approximately one megawatt of electricity per year. By continually increasing the amount of self-generating power (through the use of PV panels and/or other renewable energy sources), the District is moving toward producing enough electricity to meet each college's needs. “Getting off the grid” will make LACCD truly a national model.
Conclusion
Although many challenges remain, sustainable building and green education offer great promise to offset global warming and give a new generation of workers the skills needed to improve their quality of life. While the notion of climate neutrality can seem elusive, energy independence is the only real solution to slowing, and ultimately reversing, climate change. For LACCD, how effectively we train and educate our communities in the new green economy will likely shape our future. The work we have started offers great promise for the next generation.
About the Author
Mona Field is currently Vice President of the Board of Trustees for the Los Angeles Community College District. She is the author of numerous articles on education, labor and the environment, as well as two college textbooks, “California Government and Politics Today” and “The People and Promise of California”. She is Professor of Political Science at Glendale Community College, and has served as a member of the Board of Governors of the Faculty Association of the California Community Colleges.

Essay Mona Field
5353
Additional Resources
Los Angeles Community College District Builds Greenhttp://www.laccdbuildsgreen.org
Los Angeles Community College Districthttp://www.laccd.edu
Endnotes
1. Southern California Association of Governments (SCAG), The Compass Vision report (2004)
2. Environmental Protection Agency, Building Codes Fact Sheet http://www.epa.gov/cleanrgy/documents/ buildingcodesfactsheet.pdf
3. The National Institute of Building Sciences’ (NIBS) Whole Building Design Guide
4. Natural Resources Defense Council, L.A. Economic Conditions/LACCD Bond Impact Report (2004)
5. 2008 Solar Energy & Workforce Study: The Economic and Workforce Development, California Community Colleges
6. Planet Green Game, Top 10 Green Tips, Global Green USA/Starbucks Coffee

Climate Change and the Future of Southern California
Peak Oil and Climate Change: Scenarios and Implications
Dan Mazmanian, Mark Pisano, Richard Little, Alison Linder
Governance and Financing Policy in Southern California: Transformative Changes to Achieve Climate Change Goals
The unprecedented climate change and energy supply challenges identified in the essays by Dan Cayan and Bryn Davidson provide an important opportunity for Southern California to
emerge as a national model for how to meet them. Transformation of existing governance and financing structures will be an essential part of meeting the region’s challenges, with lasting benefits in the provision of major infrastructure and public service projects for decades to come. In moving the region forward, it will be essential that a “Triple Bottom Line” (TBL) approach be adopted that combines economic growth, environmental and health safeguards, and an improved quality of life for all the people of the region into the ultimate gauge of the region’s prosperity. That the public and region’s leaders already aspire to the TBL has become evident through public opinion polls and the testimonials of leaders from the public and private sectors. Accomplishing TBL in practice is the challenge. Thinking as a region, working cooperatively, taking risks, and being creative in the face of countless uncertainties are necessary ingredients in the transformation required to undertake new strategies and new investments.
It will also require understanding that our region, like other regions is a complex interdependent system of systems. In terms of public policies, a policy system is the set of goals and parameters intended to guide and govern behavior within a single policy domain. In considering substantive areas such as transportation, energy, environment, and economic

Essay Dan Mazmanian, Mark Pisano, Richard Little, Alison Linder
5555
development, each can be thought of as its own system. As a guiding mental picture or metaphor for our thinking, an entire mega-region needs to be understood as a system as well, in our case, the Southern California mega-region. Each substantive area becomes interwoven within the broader regional context. Viewing Southern California as a system also begs the question of what are the critical points of intervention in the system for bringing about transformative change. Transformative changes, important to note, are unlikely to succeed if imposed from afar – from the state and federal levels. Region-wide changes in the American context have succeeded only when they have been inspired and motivated by the collective self-interest and determination of those involved residents, although they may well be motivated by the larger or external economic, political or environmental forces.
Finally, most of the policy and institutional changes and proposals for the Southern California region in this essay are new in this context. However, they follow the thinking and reinventing in the public and private sectors, policy experiments, and innovative financing approaches that have been suggested over the past decades and introduced in various places across the nation. What is new is our weaving them together into a new and more comprehensive transformational strategy at the system level, at the level of Southern California, as one of the more important mega-regions not only in the United States, but among the 20 most important regions on the face of the globe.
Those government agencies that need to be part of the transformation, but today are more characterized by having too narrow or parochial focus, protective of turf, or unwilling or unable to think and act regionally, will need to “reinvent” themselves to be part of the transformation. They will need to become part of the solution or will be shunted aside. While
funding to achieve most major public projects and policy goals has historically come from state and federal sources, albeit in the Southland with increasing help from local sales taxes, a requisite of the transformation is that the region will need to take greater responsibility for innovative methods of financing its activities from within. Although the paucity of state and federal funding will be unpopular, the principle of self-funded and therefore regionally managed and “owned” projects and programs in all senses of the word, offers an opportunity. As an important component of the new approaches to financing, the region will need to utilize the kinds of public and private joint investment strategies and linking of services with payments being tested and refined elsewhere in the US and especially in Europe, Asia, and the developing world, in order to realize the TBL.
The transformation will require adopting approaches from those communities that are charting new ways of improving their decision making and policymaking delivery. Particularly important in this regard will be to change our input-driven thinking and practices where the public conveys to political leaders the public goods and services needed, these become public policy goals which government agencies implement, but in the end, the outcome of the process often fails to match what was expected. To avoid this result, we need to approach the policy process in reverse, starting with the goals for a prosperous Southern California, and then addressing how best to achieve them through effective and transparent implementation strategies; strategies drawn from best emerging practices out of both the public and private sectors. Reversing our thinking and approach to the policy process in this manner, known as backward mapping, is needed especially if Southern California is to cultivate the scale of entrepreneurship and the substantial investment capital in new technology that will need to be central in achieving the TBL.

Climate Change and the Future of Southern California
Peak Oil and Climate Change: Scenarios and Implications56
Undertaking this transformation at the regional level in Southern California and helping to set the path for the state will position Southern California as the model for a “mega-region”-based strategy and will place Southern California in a leadership position in the global competition among mega-regions of the 21st century.
Pundits and seasoned practitioners will likely feel that simultaneously pursuing all three dimensions of the TBL and the underlying transformation in governing institutions and financing practices this will require is at best impractical, if not an impossibility. It will be a challenge, for sure. Though our response is that it is harder yet to imagine how the goals of economic development, air quality improvements, greenhouse gas reduction, and a more equitable society can be achieved without the political, economic, and technological changes embodied in a comprehensive, region-wide transformation. Furthermore, our optimism is bolstered in recognizing the region’s meteoric rise over the span of a mere century (the 20th) and all this required in terms of innovation and invention that has made Southern California the world class mega-region that it is today. Emerging from a semi-arid desert town to a post-WWII industrial leader, from the air pollution capital of the nation to a world class model in air quality improvement, from a water strapped outpost to the delivering of water and power over great distances, and creating what has become the nation’s leading deepwater port and transshipping hub, the region has conquered larger obstacles. Transformation can happen.
Goods Movement as a System
The logistics industry in Southern California is not only an enormously powerful economic driver, but also a major contributor to greenhouse gas emissions, particulates, and other pollutants. As such, it illustrates our point about system level thinking and the crucial importance of interconnectedness and interdependence among systems. Conceptually, the logistics or goods movement industry meets the definitional requirements of a Large Technical System or LTS, which are the complex and capital intensive organizations that have been developed to meet the needs of modern industrial societies. In essence, an LTS is an intricate construction of technology, people, and governance structures that are sometimes

Essay Dan Mazmanian, Mark Pisano, Richard Little, Alison Linder
5757
created, but just as often evolve to provide necessary services. From that standpoint, the goods movement LTS can serve as a good illustration to tease out the broader implications of the TBL approach to climate change and energy policy. This is especially important today given the need to reconcile economic growth at the Ports of Los Angeles and Long Beach with environmental goals and maintaining health standards, jobs and overall quality of life throughout the region. The goods movement system also provides a valuable test-bed for meeting the challenges of AB 32. Currently, the industry relies on internal combustion engines (gasoline, natural gas, or diesel) to move goods from points “a” to “b”. New approaches and advanced technologies will need to be applied to meet AB 32 goals. This will require cooperation amongst all entities of the goods movement LTS.
Although we speak of a goods movement “system”, in reality the components necessary to actually move goods involve multiple actors that span political and organizational boundaries and utilize multiple infrastructure modes owned and operated by both the public and private sectors. Decision-making is fragmented along narrow lines of self-interested actors and organizations. Even when collaborative decisions emerge, they are rarely based on what might be considered as optimal – in terms of cost, benefits, functionality – for the entire system. Knowing this, it is worth emphasizing that the absence of coordinated governance and decision-making will, in all likelihood, present the greatest challenge to the goods movement industry as it attempts to address the linked issues of global warming and air pollution in a holistic and efficient manner.
Reducing greenhouse gas and pollutant emissions will require improved performance from a myriad of mostly mobile sources. Goods arrive and depart the Ports of Los Angeles and Long Beach by ships which are almost
exclusively diesel-powered. Landside drayage is provided by truck and rail, again almost exclusively diesel-powered. No single federal or state statute controls pollutant emissions from these multiple sources which makes it difficult to implement an effective and equitable control strategy. Meanwhile, the state’s AB 32 legislation is the only regulatory guidance in place for controlling greenhouse gases; the federal role is only now evolving.
Thus, while everyone can agree that addressing mobility and infrastructure needs will play a major role in improving air quality, the regulatory environment and responses to it are fragmented. Trucks moving to and from the ports are a major direct source of pollutant emissions and contribute to the massive highway congestion that surrounds them. Reducing congestion will require substantial investments in the transportation network for which no funds have been identified. Electrifying the rail system or moving to an alternative combustion-free technology will similarly require new investment, but the railroads have shown little interest in generating the necessary funds from increased tariffs. As a result, container fees paid by shippers have emerged as the funding source of least resistance although considerable opposition has developed as manifest by the Governor’s veto of SB 974 (“Clean Ports”) in 2008 which proposed a cargo fee to address these issues.
There is a growing consensus among business, government, and environmental and health stakeholders that if the goods movement industry and those who depend on it are to thrive, the twin problems of emissions and infrastructure need be addressed concurrently if not in tandem. Under the present fragmented governance structures, this is unlikely. Ships, railroads, and trucks need to be addressed within a systems-level comprehensive framework in order to make the rail and highway improvements and deliver the new technologies that will be

Climate Change and the Future of Southern California
Peak Oil and Climate Change: Scenarios and Implications58
necessary to alleviate congestion and reduce emissions. The fact that no single framework yet exists is evidenced by the challenge by the environmental community to the recent State Implementation Plan that CARB, AQMD and SCAG developed as not going far enough in this direction. Similarly, the regulatory actions of environmental agencies under the Clean Air Act are not designed nor are they capable of addressing the long-term transformational capital investments needed. Once again, the linked problems can only be solved in a coordinated manner, but without a unified governance structure, such coordination will not occur even though all the actors will suffer if it does not. If each agency could agree on the TBL goals and embrace them into their decision making processes, that would be a good first step. Additionally if the regulations and incentives were arranged differently and the investments from public and private were obtained differently we could succeed. The challenge for goods movement will not be what to do, but how to get it done.
Transformative Interventions
The example of the goods movement industry is not unique and underscores the point that a TBL decision-making framework needs to be used in evaluating future system-level governing processes and investment decisions in the region. Ultimately, we must create a situation where the region benefits by devising strategies where the gains to individuals and organized interests also maximize the common good. In short, we need to maximize “collective self interest”. To that end, we offer the following observations and recommendations.
Maintaining Consistency among Objectives: The Triple Bottom Line
� SCAG has already laid out TBL priorities for the region that include meeting the region’s emission reduction goals, creating conditions for continued economic growth, distributing prosperity equitably, and allowing the region to maintain a high quality of life. Goals, which are the guideposts for actions undertaken by all the entities in the region, were first articulated in the 1996 Regional Comprehensive Plan and carried forward to the present in the state climate change and economic development policies, and the region’s growth, green ports and air quality proposals. The critical component is that goals achieved in one subsystem must support or at least not impede the goals of the others. For example, the COMPASS 2% Strategy adopted by SCAG relates how land in the region can be used to meet the goals of affordable housing, reduction of vehicle miles traveled and congestion, reduction in energy consumption and CO2 emissions, and provides for growth in the region. Interestingly, if the region and individual jurisdictions achieve these TBL goals under the recently enacted SB 375 (Transportation planning: travel demand models: sustainable communities strategies: environmental review), particularly vehicle miles traveled (VMT) reductions, there will be CEQA streamlining for them. This is an example of state policy supporting the regions’ self-defined objectives in support of the Triple Bottom Line ideal.
� Funding, both public and private, is not always based on a decision-making process that links it directly to achievement of TBL goals, however. SCAG did pioneer such a process in its 1998 Regional Transportation Plan. Yet absent the reinforcement of collective self-interest by larger or external forces, narrow self interest has continued to win out. What is needed is the adoption of a “performance

Essay Dan Mazmanian, Mark Pisano, Richard Little, Alison Linder
5959
objectives” approach and the development of a method of evaluating the use of all funds (whether public or private, capital or maintenance and operations), in terms of how well they contribute to the TBL. Use of this method will need to be adopted by all entities and all levels of government in the region. Caltran's and MTA’s willingness to use this kind of decision-making approach are good examples.
Getting the Incentives Right
� Regulatory policies should incentivize strategies to meet the TBL goals, including requirements contained in AB 32. Investing in the resulting “green economy” will create new jobs, stimulate and diversify economic growth, and help advance technologies to meet climate change challenges. If a cap-and-trade framework is utilized, then the trades need to demonstrate that the region is moving toward its emissions reduction target, and more importantly if the trade is outside the region that the goal of greater equity within the region are nonetheless met. Alternatively a distributed pricing structure could be used to incentivize the desired investment or behavior. For example, in the goods movement area, a price could be imposed on the discharger equal to the cost of damage from the emissions. The discharger could innovate, change technology, or pay to have another party innovate and build new systems. Ships, for example, could change fuels, change their equipment or pay another party – public or private – to collectively accomplish this objective. The same is true for trucks and trains.
A Catalytic Role for Public Organizations
� Public organizations need to become leaders in the transformation towards reducing CO2 emissions and can do so through adopting new procurement policies. Because the needed and ultimately “best” technologies are yet unknown, outcome-based procurement should be required. Rather than specifying a particular technology, public organizations would specify the desired CO2 reduction outcome and purchase the best solution through an open and competitive process. Being the first to purchase new technologies helps to create a market, keep prices lower and add credibility. This would require changes in the existing federal, state and local procurement laws to allow for such flexibility, innovation, and inevitably some risk. AB 1467, authored by Assemblyman Nunez, authorizes flexible procurement procedures and is an example of an outcome-based procurement for public and privately funded initiatives, but it is limited to four projects of a limited nature.
Acknowledging and Shouldering Risk
� Shared technology testing programs should be utilized that create a win-win for the state and industry. This has been used with cargo handling equipment in goods movement where vendors, the ports and terminal operators participate for mutual benefit. The vendor offers the technology to be paid for by the users and assumes the risk if something goes wrong. The terminal operator gets free technology at no cost or risk. The port gets to measure the benefit of the technology in a real life setting.

Climate Change and the Future of Southern California
Peak Oil and Climate Change: Scenarios and Implications60
Transparency and Accountability in Decision Making
� Reporting of progress against the TBL and providing clear accountability is essential. The goals and the performance standards used in the decision-making process must be quantified if they are to be used to make funding decisions. Nexus must be quantified for regulatory decisions. Strategies must factually achieve these goals and objectives. Then, on a regular basis, public agencies must measure and report on the progress made in achieving them. The State of the Region report, the Further Progress report of the agencies, and the Annual reports of all entities are the instruments to jointly report on the collective self-interest progress toward the TBL.
Conclusion
Southern California has the opportunity to implement the TBL approach to decision-making and create a strategy for the reduction of climate changing greenhouse gas emissions that the entire nation can follow. The benefits of this TBL transformation will be the improved quality of life that SCAG has aspired to for all economic and social groups in the region for more than a decade including new jobs, affordable housing, and clean water and air. An undertaking of this magnitude is unprecedented but not unachievable. The enactment of of SB 375 along with the companion legislation of SB 732 puts in place the policy framework of a non-hierarchical management structure where the region is held accountable to long term sustainability and survivability. Moreover, by not addressing the TBL goals the actions needed to sustain growth are also frustrated, e.g. the goods movement dilemma. Without growth and sustainability positive changes in equity will not be made.
Performance-based decisions that link all money – public and private – to outcomes is the method for assuring those directly involved, the public and private sector financers and the public at large, that programs and services will be delivered as promised. “Collective self-interest” in pursuit of regional goals must be the motivating force and basis of incentives and rewards, for without being held to this standard, individual, corporate, and agency self-interests will inevitably prevail. Procurement should not be minutely specified, but determined by outcomes. Innovation and experimentation is encouraged and incentivized by policy.
Lastly, clear accountability and reporting of progress creates transparency and creditability. In this way, the Southern California TBL regional strategy will be positioned to help shape future federal climate change policy as regionally-based and transformational, rather than being seen and designed as simply the addition of more environmental regulations. Of utmost importance, we believe that once the new framework is embraced, the public will be far more willing to pay, to invest, in the region’s well being and a prosperous future.
About the Authors
Daniel A. Mazmanian, Ph.D., is the Bedrosian Chair in Governance at the School of Policy, Planning, and Development at the University of Southern California, and Director of the USC Center on Governance and the Public Enterprise. Dr. Mazmanian is the author of seven books, numerous articles, and the recipient of National Science Foundation and other research grants. His areas of interest are public policy analysis and implementation, with special emphasis on environmental policy and sustainability, and California governance and policymaking.

Essay Dan Mazmanian, Mark Pisano, Richard Little, Alison Linder
6161
Mark Pisano is a Senior Fellow in the School of Policy, Planning and Development at the University of Southern California, a faculty member in the Bedrosian Center on Governance and the Public Enterprise and Chair of the Advisory Board of the Keston Institute on Public Finance and Infrastrucure Policy. He is Co-Chairman of America 2050. Previously he served as the Executive Director of the Southern California Association of Governments for 31 years. He is a member of the National Academy of Public Administration and was the recipient of the National Public Service Award.
Richard Little is Director of the Keston Institute for Public Finance and Infrastructure Policy at the University of Southern California. He has conducted numerous studies dealing with project management and the life-cycle management and financing of infrastructure and has had written extensively on infrastructure finance. He has almost forty years experience in planning, management, and policy development relating to infrastructure and public finance. He has been certified by the American Institute of Certified Planners and in 2008 was elected to the National Academy of Construction.
Alison Linder is a PhD Candidate at the USC School of Policy, Planning and Development working towards a PhD in Urban Planning, with a focus on transportation and environmental policy. Alison has worked at the Port of Long Beach on sustainability programming and has done research for RAND Corporation as well as several USC research centers on AB 32, infrastructure planning, environmental challenges at the San Pedro Bay ports and parks and open spaces. For her dissertation, she is studying voluntary air quality programs at the San Pedro Bay ports to learn more about alternative approaches to achieving environmental improvements.
Additional Resources
IBM Center for the Business of Governmenthttp://www.businessofgovernment.org/
National Academy of Public Administrationhttp://www.napawash.org/
America 2050http://www.america2050.org/
The Canadian Council for Public-Private Partnershipshttp://www.pppcouncil.ca/
National Civic Leaguehttp://ncl.org/

Climate Change and the Future of Southern California
Peak Oil and Climate Change: Scenarios and Implications
Monty Hempel
Climate Disruption: Searching for Sustainability in Southern California
Although the general public has grown weary of bad news about the economy and world affairs, the most enduring form of bad news (as well as opportunity) may be the rate of climate change
taking place in the atmosphere and oceans.
The science of climate change is rapidly evolving into a science of climate disruption. While forecasts of the magnitude of climate forcing impacts have not changed dramatically, the observed rate of change has surpassed earlier predictions of most climate scientists with disturbing speed. In Southern California, much of this acceleration in climate impacts is invisible. Most of it is taking place in faraway places, such as the Arctic and Antarctic regions, in the polynyas of Greenland and the breakaway zones of the Larsen ice shelf, or in the drying of the Amazon rainforest, the shifting of the East Asia monsoon, the slowing of the North Atlantic current, and a host of other changes emerging from the Sahara to the Tibetan Plateau. Unless one looks closely at trends in wildfire intensity or long-term drought cycles, it is hard to find evidence of mounting climate disruption in the SCAG region.
Unfortunately, Southern California, like the rest of the world, is biogeochemically committed to unseen future changes because of the lag times in climate dynamics and the long atmospheric residence times of many greenhouse gases (e.g., CO2 released today remains in the atmosphere for an average of more than 100 years). It is too late to stop the climate “train,” but slowing it down may be sufficient, if we are lucky.

Essay Monty Hempel
6363
Even if the world could somehow stop emitting greenhouse gases today, it is inevitable that climate impacts of past emissions will be felt for many centuries. Some adaptation to changes in climate will be required for the foreseeable future. Whether the adaptation will be merely inconvenient or impose wrenching adjustments in our way of life cannot be forecast with any confidence. What seems certain is that the carbon blanket covering the earth is getting thicker and very likely to produce changes and feedback loops that could threaten the economies and ecosystems of very large regions of the world. Researchers at the University of California, Berkeley (Roland-Holst and Kahrl 2008, p. 3), have estimated that statewide damage costs of climate disruption in California will range from $7.3 billion to $46.6 billion per year, in 2006 dollars. Real estate assets valued at $2.5 trillion are at risk from sea level rise, extreme weather, and increased wildfire dangers [p.7]. Even if Southern California were somehow spared any major direct impacts of climate disruption, the collateral damage from impacts affecting other regions could be very severe. In a tightly-coupled global economic system, the notion of climate winners and losers is likely to give way to a sobering truth: the so-called “winners” will simply lose more slowly.
In stark contrast to this grim picture of changes in the climate system are a series of promising measures for transforming our energy, transportation, and land use plans and practices.
Such a transformation is driven not only by climate fears, but by vast technological and behavioral opportunities for securing a sustainable future for our children and the generations that follow. The simultaneous meltdowns on Wall Street and Greenland are fostering a search for bold new solutions.
Both types of meltdowns may encourage the acceleration of green energy technology, though continuing financial meltdowns could slow or divert investments in climate protection measures, thus hastening glacial meltdowns. With sufficient economic stimulus, however, the response to the climate challenge may aide in long-term economic recovery. Moreover, it may help us recover our sense of community. Never before has the urgency of a global problem aligned so closely with the local solutions of community-based transformation. And never before has the need for “glocal” (global + local) integration of planning, design, economic revitalization, and visionary leadership emerged with such urgency.
Central to the implementation of “glocal” climate solutions are the regional institutional capacities and shared community visions needed to overcome the inertial barriers to social and political change. While interlocking slow-motion crises in the climate system need to be addressed internationally, they must be framed at levels of action that are small enough to engage individual communities and large enough to capture the regional synergies and economies of scale made possible by a “community of communities.” Herein lies the promise of regional metropolitan planning and governance for addressing the challenge of climate disruption. Organizations like SCAG are strategically well positioned, given adequate resources, to play a vital role in assessment, planning, and integrated management of both regional greenhouse gas reduction initiatives and local adaptation strategies needed for coping with climate disruption.
Regional climate solutions are likely to require a delicate balance between greater self-sufficiency in energy supply – using alternative fuels and technology – and greater emphasis on demand-side management in transportation, land use, and urban design.

Climate Change and the Future of Southern California
Peak Oil and Climate Change: Scenarios and Implications64
Curbing greenhouse gas emissions by reducing sprawl, inefficient vehicle travel, and energy-intensive buildings, are all major goals under California’s growing set of initiatives to combat climate disruption. The latest of these measures, SB 375, directs the California Air Resources Board to establish regional targets for greenhouse gas emissions that can be used in planning and urban growth management. Signed by the governor in September, 2008, the new law builds on the Global Warming Solutions Act of 2006 (AB 32) by strengthening land use strategies for reducing emissions of greenhouse gases.
Achieving these goals and strategies will be very difficult without accompanying breakthroughs in energy technology and consumer behavior. Although major studies (e.g., Pacala and Socolow 2004) conclude that the U.S. can achieve a 50% reduction (7 gigaton/year) in projected carbon emissions by the middle of this century, using technologies already demonstrated at industrial scales, the debate over the costs of deploying these technologies in some optimal mix is far from over. The relative costs of various solar, wind, biofuel, “clean” coal, nuclear, and other energy configurations are highly dependent on getting the posted prices “to tell the ecological truth” (Roodman 1999). Any subsidies and hidden costs must be considered in the comparative lifecycle assessment of energy technologies, as well as the net benefits they provide for people and climate stabilization.
During the transition to carbon-free energy sources, “bridging strategies” will be needed, based on energy options that have already been commercially demonstrated, with choices ranging from T. Boone Picken’s heavily marketed vision of natural gas vehicles and wind power farms to Amory Lovin’s pragmatic vision of “factor four” improvements in energy use efficiency (Weizsacker 1998).
But the most promising near-term strategies, in addition to expanded energy conservation, may rely on plug-in hybrid vehicles and distributed electrical generation of renewable energy technologies.
Plug-in hybrids (PHEVs) offer the features of battery-powered travel for local trips, backed by an internal combustion engine for more extended travel. Unlike natural gas-powered vehicles, they do not require an expensive new refueling infrastructure, since they can be plugged into common 120-volt outlets with an extension cord. The carbon-saving effectiveness of a 100-mile-per-gallon PHEV looks very promising, even when recharged in a coal-dominated electricity grid. But the total carbon and air quality benefits for society, like those of other green vehicle technologies, will depend heavily on fleet penetration (turnover) rates, which will in turn depend on perceived affordability and, perhaps, a willingness on the part of both auto manufacturers and buyers to elevate their roles as citizens, parents, and stewards – not just producers and consumers – when they make choices about transportation.
Southern California leads almost all other regions of the world in terms of its commercial potential for distributed generation of electricity from renewables. In addition to excellent solar insolation levels and nearby mountain passes noted for their wind power potential, the region offers two other key assets that support renewable energy development: huge expanses of rooftops, especially on warehouses, that will accommodate photovoltaic installations, and even larger areas of open space in the Mojave desert, suitable for both wind and solar installations. Because the development of renewable energy in the desert involves added environmental and land use conflicts, along with encroachment on existing military operations, it will be important to address systematically

Essay Monty Hempel
6565
the scale and ownership of proposed renewable enterprises in the region, especially in terms of siting compatibility, lifecycle cost, political feasibility, and overall sustainability.
Perhaps the most immediate climate solution needed in the Los Angeles region is fuel efficiency improvements in conventional highway vehicles. In this instance, the solution is not regional -- e.g., drilling for oil off our coast. Instead, we need to “drill” for oil in Detroit and other vehicle manufacturing capitals, by improving average fuel economy of new vehicles by at least 1-3 miles per gallon each year, for the foreseeable future. Nothing we can do cost-effectively on the supply side, in the face of peak oil and the geopolitics of oil imports, is likely to match what we can achieve with cost savings on the
demand side. It is simply cheaper to conserve a barrel of oil (and its avoided carbon emissions) through efficiency improvements than it is to find and extract a new one (and control its emissions). Unfortunately, the state of the economy, especially as it affects Detroit automakers, may constrain efforts to achieve higher fuel efficiency standards, despite being more than 20 years overdue. While volatile gasoline prices may foster additional growth in demand for more fuel-efficient, hybrid, and alternative fuel vehicles, not to mention mass transit, it is by no means assured that carbon emissions will respond to conventional energy market forces in a timely fashion. Just as the climate system exhibits important lag effects in its behavior, so does an economy that is heavily based on cheap oil and strategic dependence on private automobiles.
Ultimately, meeting the challenge of climate disruption will require more than technological advances and redirected market forces. It will very likely require a reconceptualization of the relationships between morality, sustainability, and community. Sustainability – i.e., the strategic integration of goals for ecological integrity, economic vitality, and social equity – is becoming the “guidestar” of planning and policy for effective climate solutions. Southern California, more than any other metropolitan region, has the image-making industry and “glocal” perspective needed to lead in this effort. Already, the concept of “sustainable communities” is being incorporated in regional planning and in California’s statewide climate initiatives (e.g., SB 375). Skeptics will rightly point out that the ideal of sustainable communities is just that, an ideal, and perhaps not worthy of serious policy and planning responses. But they need to consider that our society’s most precious ideals – freedom, democracy, faith – are, like sustainability, full of ambiguity, impossible to define with precision, and often misappropriated by people who value them more for their marketing
Climate Change and the Future of Southern California
Peak Oil and Climate Change: Scenarios and Implications66
appeal than for their power to change the future. We have not given up on democracy in these situations, and we should not hesitate to embrace sustainable communities for the same reason – it makes us a better and more secure people.
By emphasizing the importance of intercommunity cooperation in achieving sustainability, actions needed to curb greenhouse gas emissions become part of a much larger and more rewarding way of life. They help promote pedestrian-friendly villages and public transit–oriented development, urban infill, green building design and many features that enhance livability, public safety, and the environmental health of all residents. Metropolitan approaches help individual communities avoid designs, development strategies, and capital allocations that produce unsustainable outcomes for neighboring communities and for the region as a whole. It is the preferred approach because it fosters a scale of action and exchange that is big enough to address key interdependencies of climate, ecology, and socioeconomic vitality, yet small enough to provide a shared sense of place and social embeddedness.
In the face of climate disruption, metropolitan regions may provide the optimal scale at which to attempt the integration of governance, planning, economic development, and environmental monitoring.
Beyond the issues of scale and integration lies the greatest challenge of all: convincing ordinary individuals that climate solutions entail more in the way of opportunity than sacrifice. Currently, the perception of most Americans seems to be that climate protection may lead to large and unacceptable levels of sacrifice. An entire industry of climate skeptics has been organized to perpetuate that perception ( Jacques, Dunlap, and Freeman 2008). Noted author Carl Safina (2008) reaches a very different conclusion:
Of all the psychopathology in the climate issue, the most counterproductive thought is that solving the problem will require sacrifice. As though our wastefulness of energy and money is not sacrifice. As though war built around oil is not sacrifice. As though losing polar bears, ice-dependent penguins, coral reefs, and thousands of other living companions is not sacrifice. As though withered cropland is not a sacrifice, or letting the freshwater of cities dry up as glacier-fed rivers shrink. As though risking seawater inundation and the displacement of hundreds of millions of coastal people is not a sacrifice – and reckless risk. But don’t tell me to own a more efficient car; that would be a sacrifice!
About the Author
Monty Hempel is Hedco Professor of Environmental Studies and Director of the Center for Environmental Studies at the University of Redlands. Through a series of articles, two books, and a dozen documentary films, he has addressed a wide range of environmental science and policy issues, ranging from coral reef protection in Palau to the human dimensions of global climate disruption. Dr. Hempel is currently president of the Association of Environmental Studies and Sciences (AESS) and serves on the executive committee of the national Council of Environmental Deans and Directors (CEDD). He is also a founding board member of the Association for the Advancement of Sustainability in Higher Education (AASHE).

Essay Monty Hempel
6767
Additional Resources
National Academies of Sciences, Understanding and Responding to Climate Change (2008 Edition). Download report as PDF at http://dels.nas.edu/climatechange/basics.shtml (3.3 MB)
James Hansen et al, “Target Atmospheric CO2: Where Should Humanity Aim?” (March 31, 2008). Download report as PDF at http://www.columbia.edu/~jeh1/2008/TargetCO2_20080407.pdf
Intergovernmental Panel on Climate Change:http://www.ipcc.ch/
California Climate Risks and Estimated Costs:http://www.next10.org/research/research_ccrr.html
“Green L.A.: An Action Plan to Lead the Nation in Fighting Global Warming:”http://www.lacity.org/ead/EADWeb-AQD/GreenLA_CAP_2007.pdf
For broad coverage of climate science, politics and economics, go to the Pew Center for Global Climate Change: http://www.pewclimate.org/
For access to science debates and technical discussions about climate, go to Real Climate: http://www.realclimate.org/
For point-counterpoint analysis of climate arguments and controversies, see Coby Beck’s detailed guide, “How to Talk to a Climate Skeptic”: http://gristmill.grist.org/skeptics
References
Jacques, Peter, Dunlap, Riley, and Freeman, Mark, 2008. “The Organization of Denial: Conservative Think Tanks and Environmental Scepticism,” Environmental Politics 17 (3), 340-385.
Pacala, Stephen, and Socolow, Robert, 2004. “Stabilization Wedges: Solving the Climate Problem for the Next 50 Years with Current Technologies,” Science 305 (5686): 968-972.
Roland-Holst, David, and Fredrich Kahrl, California Climate Risk and Response (November 2008, available online at www.next10.org)
Roodman, David, 1999. The Natural Wealth of Nations (Worldwatch Institute)
Safina, Carl, 2008. “The Moral Climate,” Orion (September-October 2008).
Weizsacker, Ernst, Lovins, Amory, and Lovins, L. Hunter, 1998. Factor Four: Doubling Wealth, Halving Resource Use – A Report to the Club of Rome (Earthscan).

Climate Change and the Future of Southern California
PrefaceGuest Essay Authors by Title
1. Climate Change – What Southern California Should Prepare for?
Dan Cayan, Ph.D., is a Researcher at the Scripps Institution of Oceanography, University of California, San Diego, and also with the U.S. Geological Survey, Water Resources Discipline. He directs the California Climate Change Center and the California Applications Program, multi-institution research programs to provide climate information to the State and region. Dr. Cayan was a lead researcher in the 2005-2006 California Climate Change Scenarios Assessment Project and continues to play that role in the ongoing 2008-2009 California Climate Change Assessment. He was one of the Guest Editors and a science contributor of the Special Issue on “California at a Crossroads: Climate Change Science Informing Policy”, Climatic Change Journal, March 2008.
2. Peak Oil and Climate Change: Scenarios and Implications
Bryn Davidson is a LEED accredited designer and sustainability consultant holding degrees in mechanical engineering (U.C. Berkeley) and architecture (U. British Columbia). He is the cofounder and executive director of the Dynamic Cities Project (DCP) and is a principal of Rao/Davidson Design and Planning (Rao/D Cityworks). Mr. Davidson has given numerous presentations on the global energy transition to public and professional groups, and recently presented a talk on scenario planning at the 2008 ASPO-USA world oil conference. In parallel with his research and outreach work through the DCP, Mr. Davidson designs low-energy green buildings, and works on projects that aim to have a “net positive” impact on their community’s emissions and oil dependence.
3. How Planning Can Combat Climate Change in Southern California
William Fulton is Deputy Mayor of Ventura and a Principal in the planning consulting firm of Design, Community & Environment. He is the author of several books including Guide to California Planning and The Reluctant Metropolis. Mr. Fulton is also Publisher of California Planning & Development report and a Senior Scholar at the School of Policy, Planning & Development at the University of Southern California. He has spoken on growth and planning trends to groups throughout the United States.
4. Green Buildings – A Tool for Stemming Climate Change?
Walker Wells, AICP, LEED AP, is the Green Urbanism Program Director at the Global Green USA, a national non-profit organization headquartered in Santa Monica. He works with affordable housing developers, municipalities, and school districts across the country to further green building and sustainable development practices by providing technical assistance, conducting workshops, and developing public policy. Mr. Wells is an editor and a co-author of the 2007 book Blueprint for Greening Affordable Housing and the 2006 publication Creating Successful Green Building Programs.
Guest Essay Authors by Title
73737373
5. Education for a Green Region: Community Colleges Tackle Climate Change and Economic Development through Green Curriculum and Sustainable Building
Mona Field is currently Vice President of the Board of Trustees for the Los Angeles Community College District. She is the author of numerous articles on education, labor and the environment, as well as two college textbooks, “California Government and Politics Today” and “The People and Promise of California”. She is Professor of Political Science at Glendale Community College, and has served as a member of the Board of Governors of the Faculty Association of the California Community Colleges.
6. Governance and Financing Policy in Southern California: Transformative Changes to Achieve Climate Change Goals
Daniel A. Mazmanian, Ph.D., is the Bedrosian Chair in Governance at the School of Policy, Planning, and Development at the University of Southern California, and Director of the USC Center on Governance and the Public Enterprise. Dr. Mazmanian is the author of seven books, numerous articles, and the recipient of National Science Foundation and other research grants. His areas of interest are public policy analysis and implementation, with special emphasis on environmental policy and sustainability, and California governance and policymaking.
Mark Pisano is a Senior Fellow in the School of Policy, Planning and Development at the University of Southern California, a faculty member in the Bedrosian Center on Governance and the Public Enterprise and Chair of the Advisory Board of the Keston Institute
on Public Finance and Infrastrucure Policy. He is Co-Chairman of America 2050. Previously he served as the Executive Director of the Southern California Association of Governments for 31 years. He is a member of the National Academy of Public Administration and was the recipient of the National Public Service Award.
Richard Little is Director of the Keston Institute for Public Finance and Infrastructure Policy at the University of Southern California. He has conducted numerous studies dealing with project management and the life-cycle management and financing of infrastructure and has had written extensively on infrastructure finance. He has almost forty years experience in planning, management, and policy development relating to infrastructure and public finance. He has been certified by the American Institute of Certified Planners and in 2008 was elected to the National Academy of Construction.
Alison Linder is a PhD Candidate at the USC School of Policy, Planning and Development working towards a PhD in Urban Planning, with a focus on transportation and environmental policy. Alison has worked at the Port of Long Beach on sustainability programming and has done research for RAND Corporation as well as several USC research centers on AB 32, infrastructure planning, environmental challenges at the San Pedro Bay ports and parks and open spaces. For her dissertation, she is studying voluntary air quality programs at the San Pedro Bay ports to learn more about alternative approaches to achieving environmental improvements.

Climate Change and the Future of Southern California
Preface74
7. Climate Disruption: Searching for Sustainability in Southern California
Monty Hempel, Ph.D., is Hedco Professor of Environmental Studies and Director of the Center for Environmental Studies at the University of Redlands. Through a series of articles, two books, and a dozen documentary films, he has addressed a wide range of environmental science and policy issues, ranging from coral reef protection in Palau to the human dimensions of global climate disruption. Dr. Hempel is currently president of the Association of Environmental Studies and Sciences (AESS) and serves on the executive committee of the national Council of Environmental Deans and Directors (CEDD). He is also a founding board member of the Association for the Advancement of Sustainability in Higher Education (AASHE).

Guest Essay Authors by Title
7575

Climate Change and the Future of Southern California
Preface
AB 32, the California Global Warming Solutions Act, is the first legislation aimed at regulating greenhouse gas (GHG) emissions in the United States. AB 32 sets a mandatory target for the State to reduce its GHG emissions. Specifically, it calls for a reduction to 1990 levels by 2020. While other States, and groups of States, have created legislative policy around global warming, AB 32 is the first State law calling for specific and mandatory emissions reductions. Its numerical targets were set up to follow the international Kyoto protocol from which the United States withdrew in 2001.
AB 32 calls for the State to reduce its emissions, and authorizes a handful of State agencies, notably the Air Resources Board (ARB) to develop and implement measures to achieve the State’s target. The law describes a series of steps that the ARB and others must take, and leaves most of the details to be worked out through these future processes.
The most important early step is the creation of a “Scoping Plan” which was adopted by ARB on December 11, 2008. The AB 32 Scoping Plan identifies and describes the specific measures by which the State will achieve the reductions. The Scoping Plan is laid out by sector, and describes regulatory, market, and incentive-based measures within each sector, and ascribes to each an anticipated level of emission reduction.
The largest reductions are attributed to three key areas: new vehicle and fuel standards, energy efficiency efforts including green buildings, and the energy generation sector. In brief, the State anticipates reducing nearly half of the necessary 174 million metric tons of CO2 equivalent in these three areas. Fuels, engines, and utilities have been regulated historically by ARB, and can be addressed through relatively straightforward mechanisms. To a large degree, the amount of CO2 emitted into the atmosphere depends on
the millions of discreet choices made by government entities, businesses and individuals. Recognizing the inherent difficulty in regulating these diffuse decisions, the Scoping Plan attributes a comparatively smaller share of reductions to the land use and transportation issues addressed by SB 375.
The newly passed SB 375 ties GHG emission reduction to the exercise of land use authority by local governments, and the programming of funds for transportation improvements. SB 375 did not begin as a greenhouse gas reduction bill. It was first cast as CEQA streamlining legislation based on innovative regional planning work emerging from the State’s largest Metropolitan Planning Organizations (SCAG and its counterparts in Sacramento, San Diego and the Bay Area). Termed “blueprint planning,” these regional exercises have sought to encourage more compact and efficient regional development patterns in order to reduce vehicle trips and encourage use of public transit, among other desirable outcomes. SB 375, in its early drafts, simply sought to create incentives for this type of regional planning by allowing development projects that were consistent with the regional blueprint plans to use an easier environmental review process.
The bill was controversial from the start because it creates a State directive affecting local land use authority. The bill was continually refined through extensive negotiations involving environmental groups, the regional MPOs, local governments, the building industry and others. Of critical importance through the negotiations, SB 375 was eventually cast as implementation of AB 32, and identified the reduction of GHG emissions from the use of light duty vehicles as its goal. The bill took nearly two years to emerge from the Legislature and was signed by Governor Schwarzenegger on September 30, 2008, the last day to sign or veto bills for the 2007-8 session.
Overview of AB 32 and SB 375

Overview of AB 32 and SB 375
6969
The piece of legislation that finally emerged creates tenuous but ambitious connections between land use, transportation, housing and environmental planning. As when it was initially conceived, it relies on blueprint planning, prepared by metropolitan regions as its critical lynchpin. SB 375 requires ARB to determine GHG emission reduction targets for each metropolitan region. Regions are then required to develop new plans to meet their respective targets, and to incorporate these new efforts into the on-going regional planning work done on transportation, housing and land use.
The core of the law’s requirements is the new regional Sustainable Communities Strategy (SCS). The SCS is a regional land use and housing strategy that, when paired with the region’s transportation plan, achieves emission reductions. The SCS needs to be included in the Regional Transportation Plan, a precursor for bringing federal transportation funds to the region’s various projects. The SCS only needs to meet the emission reduction target if it is feasible to do so. If not, the region must identify what impediments it faced, and develop a separate plan, called an Alternative Planning Strategy, that sets forth what steps the region would take to meet the target if the impediments cited were not in place.
The strategies developed under SB 375 “become real” in a few different ways. First, by requiring the SCS as part of an RTP, future transportation projects need to be consistent with the region’s GHG emission reduction strategy. It should be noted, however, that the bill contained grandfathering provisions which exempted a number of current and pipeline projects. Further, there are limited, but real, hooks into local land use decision making. Specifically, through the existing Regional Housing Needs Assessment and local Housing Element update processes, local governments must accommodate, through zoning, the growth called for in the SCS.
Finally, the bill contains provisions for limited CEQA review (and some exemptions) for development projects consistent with either an SCS or APS. These provisions are meant to serve as an incentive to pursue “good projects”, particularly transit oriented development. The bill creates a new class of projects within CEQA called Transit Priority Projects. These projects, depending on whether they meet a checklist of criteria, can, in some cases, be exempt from CEQA. Even those that are not exempt, can use various types of streamlined CEQA review.
SB 375 is slated to achieve a modest portion of the State’s overall GHG reduction goals (about 3%). Further, it does not spell out sanctions should regions or local governments fail to meet its various requirements. Nevertheless, it is widely viewed as critical both to the State’s AB 32 implementation efforts, and within the context of the State/local relations.
By creating a voluntary target for regional planning, the State (and other interested parties) has a basis to compare the level of effort in meeting goals among the various regions of the State. It is widely believed that future discretionary State funding will flow to those regions that are performing best.
There have been many recent attempts to establish a State-defined interest to guide the exercise of local land use authority. The State clearly views its immense challenge under AB 32 as a turning point in asking for more consistent, coordinated and outcomes-oriented land use planning from local agencies.
At the same time, local governments and the regional planning agencies have developed momentum behind their own blueprint planning efforts. More local agencies recognize a mutual benefit in looking beyond their

Climate Change and the Future of Southern California
Preface70
own boundaries in making decisions. For example, within the SCAG region, there are more than 50 Compass Blueprint demonstration projects in which local governments participated voluntarily.
The implementation of SB 375, within the SCAG region, will play out over the space of 4 years, leading up the preparation of the 2012 RTP. In that time period, the region will develop an approach that balances the interests of various stakeholders, while achieving the intended goals of the legislation. In a region as large and complex as Southern California, this objective will likely prove challenging. For that reason, it is imperative to implement SB 375 in the most open, participatory, and transparent process possible. The region’s cities, counties, transportation commissions, private sector, and residents have a stake in how SB 375 proceeds, and it will change how planning is done in the region. For the region to succeed, we need to work together.

Overview of AB 32 and SB 375
7171

Climate Change and the Future of Southern California
PrefaceGreenhouse Gas Reduction Best Practice Guide and Resources
Best Practices Guides and Assistance
Flex Your Power Local Government Best Practices Guide Includes information on funding and approval, lighting, procurement policy, and case studies from seven local governments.http://flexyourpower.com/bpg/index.html?b=institutional
Institute for Local Governments Best Practices Framework The Best Practices Framework offers suggestions for local actions in ten Climate Leadership Opportunity Areas, both in agency operations and the community at large.http://www.cacities.org/resource_files/26286.BestPracticesFramework%20v5.0.pdf
U.S. Conference of Mayors, Energy & Environment Best Practices Guide The best practices document represents some of the many innovative ways Mayors and their cities approach complex energy and environmental issues. It includes case studies from over 50 cities on issues of municipal buildings, air quality, climate change, energy sources, housing, vehicles, fuels, and transit.http://www.usmayors.org/bestpractices/EandEBP07.pdf
Local Governments for Sustainability (ICLEI), U.S. Mayors’ Climate Protection Agreement, Climate Action Handbook The Climate Action Handbook is a resource guide on climate protection created by ICLEI (Local Governments for Sustainability) with support from the City of Seattle and the U.S. Conference of Mayors. The Handbook includes sample actions and measures related to land use, transportation planning, energy efficiency, green building, waste
management and cost effective tools to reduce greenhouse gas emissions.http://seattle.gov/climate/docs/ClimateActionHandbook.pdf
The Climate Impacts Group, Preparing for Climate Change: A Guidebook for Local, Regional, and State Governments The purpose of Preparing for Climate Change: A Guidebook for Local, Regional, and State Governments is to help you as a decision-maker in a local, regional, or state government prepare for climate change by recommending a detailed, easy-to-understand process for climate change preparedness based on familiar resources and tools.http://www.cses.washington.edu/cig/fpt/guidebook.shtml
California Air Resources Board, Local Government Operations Protocol The Local Government Operations Protocol is designed to provide a standardized set of guidelines to assist local governments in quantifying and reporting Greenhouse Gas (GHG) emissions associated with their government operations. The Protocol was developed through partnership among the California Air Resources Board (ARB), California Climate Action Registry (CCAR), and ICLEI (Local Governments for Sustainability), in collaboration with The Climate Registry and dozens of stakeholders.http://www.arb.ca.gov/cc/protocols/localgov/pubs/pubs.htm
Cool California, Local Government Toolkit The purpose of this Local Government Toolkit is to identify cost saving actions, financial resources, and case studies to assist local governments with achieving GHG emission reductions. The founding partners include State Government Agencies, Universities, and Next10, a nonprofit organization.http://www.coolcalifornia.org/

Greenhouse Gas Reduction Best Practice Guide and Resources
7777
SCAG’s Compass Blueprint can also help local governments address environmental issues with a toolbox of GHG reduction strategies, GHG inventories for proposed projects, a Tipping Point Return on Investment tool with sustainability indicators, green building guidance, and access to partnerships with local utilities that provide financial incentives for energy efficient projects. Please see the Compass Blueprint website at http://www.compassblueprint.org to learn how SCAG can help your community become more sustainable.
Carbon Footprint Calculators
California Air Resources Board The Carbon Calculator was designed specifically for California, and is offered in both English and Spanish language versions. It currently calculates households but they plan to expand it in late summer 2008. Partners include Next 10, the California Energy Commission, University of California Berkeley, Lawrence Berkeley National Laboratory, and others. The calculator is online athttp://www.coolcalifornia.org.
California Climate Action Registry The California Climate Action Registry (CCAR) Reporting Online Tool (CARROT) is the California Registry’s greenhouse gas emission calculation and reporting software. The California Registry has developed this unique, web-based tool as the online companion to the Registry’s protocols. All GHG emissions data is entered and managed via CARROT. It is used by California Registry members, verifiers, and the public. CCAR is also developing a reporting protocol for local governments.http://www.climateregistry.org/
U.S. Environmental Protection Agency EPA has developed tools to help individuals (and households) reduce greenhouse gas emissions and take actions. Businesses and organizations interested in educating their employees and members about what they can do at home to help protect our climate can also use these tools.http://www.epa.gov/climatechange/emissions/ind_calculator.html
Co-Benefits Risk Assessment Tool (COBRA) – The COBRA model is a screening tool used to: (1) approximate the impact of emission changes on ambient air pollution; (2) translate this into health effect impacts; (3) monetize these impacts; and (4) present the results in maps and tables.
Mitigation Impact Screening Tool (MIST) – MIST is an easy-to-use software tool intended to provide qualitative assessments of the likely impacts of heat island mitigation strategies averaged at the city-scale. With MIST, city officials and planners can estimate how changes in surface reflectance and tree cover will affect local air temperatures, ground-level ozone and energy consumption. MIST includes data for over 240 cities. http://www.epa.gov/climatechange/wycd/stateandlocalgov/analyticaltools.html
Zero Footprint Zero footprint Cities is an online application that enables citizens to measure, manage and track their carbon footprint, and connect and collaborate with others who share similar environmental goals. Cities could use the information gathered by the application to inform green initiatives and city-wide challenges. The application also links to a marketplace of green products and services, as well as events and news, thereby promoting sustainable commerce. Participating governments include the City of Toronto, City of Seattle, City of Boulder, City of

Climate Change and the Future of Southern California
Preface78
Evanston, City of Vaughan, Ontario; and the State of Alabama. http://zerofootprint.net/
TerraPass TerraPass allows you to calculate your carbon footprint and find ways to reduce it with energy-saving products and ideas. You can also balance your emissions by funding clean energy and carbon reduction projects that help to fight global warming. http://www.terrapass.com/
Local Resources
City of Irvine, Green Building Program The City of Irvine’s Green Building Program has developed criteria for building or remodeling homes to become “Green Certified.” Their website provides links to rebates, checklists and guidance for green buildings. http://www.cityofirvine.us/green_build.html
City of Los Angeles, GreenLA This plan details innovative steps for city departments and agencies to reduce greenhouse gas (GHG) emissions and create a more sustainable environment. It also outlines a process to facilitate emissions reductions by private businesses and residents throughout Los Angeles. The actions are designed to achieve ambitious reductions by 2030 (35% below 1990 levels by 2030). http://www.lacity.org/ead/EADWeb-AQD/GreenLA_CAP_2007.pdf
City of Manhattan Beach, Working Toward a Greater, Greener Manhattan Beach This comprehensive report documents the City’s current environmentally
friendly practices and identifies other “best management” practices that the City can consider adopting to enhance its environmental programs. This report also identifies opportunities for resident involvement. http://www.citymb.info/index.aspx?page=1506
City of Pasadena, Green City Action Plan Approved by the City Council on September 18, 2006, the Green City Action Plan is a progressive list of environmental initiatives for the City to take in its quest to become a sustainable and green community and follows the framework of the United Nations Green Cities Declaration and Urban Environmental Accords. The initiatives contained in the plan include developing a green fleet of city vehicles, using only environmentally friendly cleaning products in City buildings, and buying “green” goods where possible.http://www.ci.pasadena.ca.us/permitcenter/greencity/GreenActionplanWeb.pdf
City of Riverside, A Clean & Green Riverside In the summer of 2005, Mayor Ronald O. Loveridge appointed a Clean & Green Task Force to look into ways for the City to make residents’ lives better by improving the City’s appearance, making City practices more sustainable, and improving air quality. http://www.riversideca.gov/mayor/cleangreen.asp
Green County San Bernardino In August 2007, the Board of Supervisors launched Green County San Bernardino to spur the use of “green” technologies and building practices among residents, business owners and developers in the County. Additionally, Green County San Bernardino includes a public awareness component aimed at educating residents about steps they can take in their

Greenhouse Gas Reduction Best Practice Guide and Resources
7979
daily lives to conserve resources and protect the environment. http://www.sbcounty.gov/greencountysb/
South Bay Environmental Service Center Partnering with the South Bay Cities Council of Governments, The Gas CompanySM, Southern California Edison, West Basin Municipal Water District, the City of Torrance, and the Sanitation Districts of Los Angeles County. The South Bay Environmental Services Center (SBESC) is the South Bay's local clearinghouse for energy efficiency, water conservation and environmental information—workshops, materials and outreach. SBESC assists public agencies including cities, schools, and special districts as well as businesses and residents of the South Bay to best utilize the many resources available to them through a wide variety of statewide and local energy efficiency and water conservation programs.http://www.sbesc.com/
Ventura County Regional Energy Alliance Formed in July 2003, the Ventura County Regional Energy Alliance (VCREA) is a Joint Powers Authority ( JPA) composed of public agencies working in collaboration to approach the availability, reliability, conservation and innovative use of energy resources in Ventura County. The Alliance website includes links to energy resources for residents, businesses, and public agencies. http://www.vcenergy.org/

Climate Change and the Future of Southern California
Preface80Acronyms
ARB Air Resources Board
AQMD Air Quality Management District
ASPO Association for the Study of Peak Oil and Gas
MPO Metropolitan Planning Organization
CEQA California Environmental Quality Act
CH4 Methane
CO2 Carbon Dioxide
GCMs Global Climate Models
GFDL Geophysical Fluid Dynamics Laboratory
(of the National Oceanic and Atmospheric Administration)
GHG Greenhouse Gas
HFCs Hydrofluorocarbons
IPCC Intergovernmental Panel on Climate Change
LEED Leadership in Energy and Environmental Design
MMTCO2E Million Metric Tons of Carbon Dioxide Equivalents
NOAA National Oceanic and Atmospheric Administration
N2O Nitrous Oxide
PFCs Perfluorocarbons
SCS Sustainable Communities Strategy
SF6 Sulfur Hexafluoride
VMT Vehicle Miles Traveled

Acknowledgements
8181Acknowledgements
Our appreciation to the following members of the Benchmarks Task Force who advised staff on this project:
Hon. Ronald O. Loveridge, Mayor, City of Riverside, Task Force Chair
Hon. Glenn Duncan, Councilmember, City of Chino
Hon. Mona Field, Board of Trustees, Los Angeles Community College District
Hon. Larry McCallon, Councilmember, City of Highland
Hon. Chris Norby, Supervisor, Orange County
Hon. Pam O’Connor, Councilmember, City of Santa Monica
Rick Bishop, Western Riverside Council of Governments
Kimberly Collins, San Diego State University (Imperial Valley Campus)
Barry Engelberg, Orange County Transportation Authority
Fernando Guerra, Loyola Marymount University
Monty Hempel, University of Redlands
Dean Kubani, City of Santa Monica Environmental and Public Works
Jerilyn Lopez Mendoza, Environmental Defense
Dowell Myers, University of Southern California
Anastasia Loukaitou-Sideris, University of California, Los Angeles
Todd D. Priest, Building Industry Association of Southern California
Anil Puri, California State University, Fullerton
Ty Schuiling, San Bernardino Associated Governments
Arthur J. Shaw, Consulting Economist
Arnold Sherwood, University of California, Berkeley
Jim Stewart, Southern California Council on Environment and Development
Goetz Wolff, Harry Bridges Institute and University of California, Los Angeles
SCAG Management
Hasan Ikhrata, Executive Director
Huasha Liu, Director, Planning Methods, Assessment and Compliance
Joann Africa, Acting Chief Counsel and Director of Legal Services
Debbie Dillon, Director, Administrative Services and Human Resources
Rich Macias, Director, Regional and Comprehensive Planning
Wayne Moore, Chief Financial Officer
Sharon Neely, Director, Legislation
Sylvia Patsaouras, Deputy Director, Regional and Comprehensive Planning
Brian Williams, Director, Government, Regional and Public Affairs
Climate Change and the Future of Southern California
Preface82
Project Manager and Editor Ping Chang, Deputy Director, Planning Methods, Assessment and Compliance
Graphics Carolyn Hart, Art Direction and Graphic Design
Ludlow Brown, Graphic Design
Lynn Miracle, Graphic Design and Production
Maps Ping Wang, Senior GIS Analyst
Guest Essay Authors* Dan Cayan, Ph.D., Researcher, Scripps Institution, University of California, San Diego
Bryn Davidson, Executive Director, Dynamics Cities Project
William Fulton, Deputy Mayor, City of Ventura
Walker Wells, Green Urbanism Program Director, Global Green USA
Mona Field, Board of Trustees, Los Angeles Community College District
Dan Mazmanian, Ph.D., Bedrosian Chair in Governance, University of Southern California
Mark Pisano, Senior Fellow, School of Policy, Planning and Development, University of Southern California
Richard Little, Director, Keston Institute of Public Finance and Infrastructure Policy, University of Southern California
Alison Linder, Ph.D. Candidate, School of Policy, Planning and Development, University of Southern California
Monty Hempel, Ph.D., Director, Center for Environmental Studies, University of Redlands
(*Please see Guest Essay Authors by Title Section for additional author information)
Staff Contributors Jacob Lieb, Manager, Assessment, Housing and EIR (for preparing the AB 32/SB 375 Overview Section)
Jennifer Sarnecki, Senior Regional Planner (for preparing the Best Practice Guide Section)
Review Assistance Javier Minjares, Senior Regional Planner
Angela Rushen, Manager, Media and Public Affairs
Jim Stewart, Southern California Council on Environment and Development
Frank Wen, Manager, Model/Tool Development, Data/GIS & Forecasting

Acknowledgements
8383


Preface

Resolving Regional Challenges