Click to view Biosketch and Presentation Abstract or page down to ...
20
Patrick Kirby, PhD Toxicologist Department of Drug Safety Takeda Pharmaceuticals Click to view Biosketch and Presentation Abstract or page down to review presentation
-
Upload
dangnguyet -
Category
Documents
-
view
225 -
download
0
Transcript of Click to view Biosketch and Presentation Abstract or page down to ...
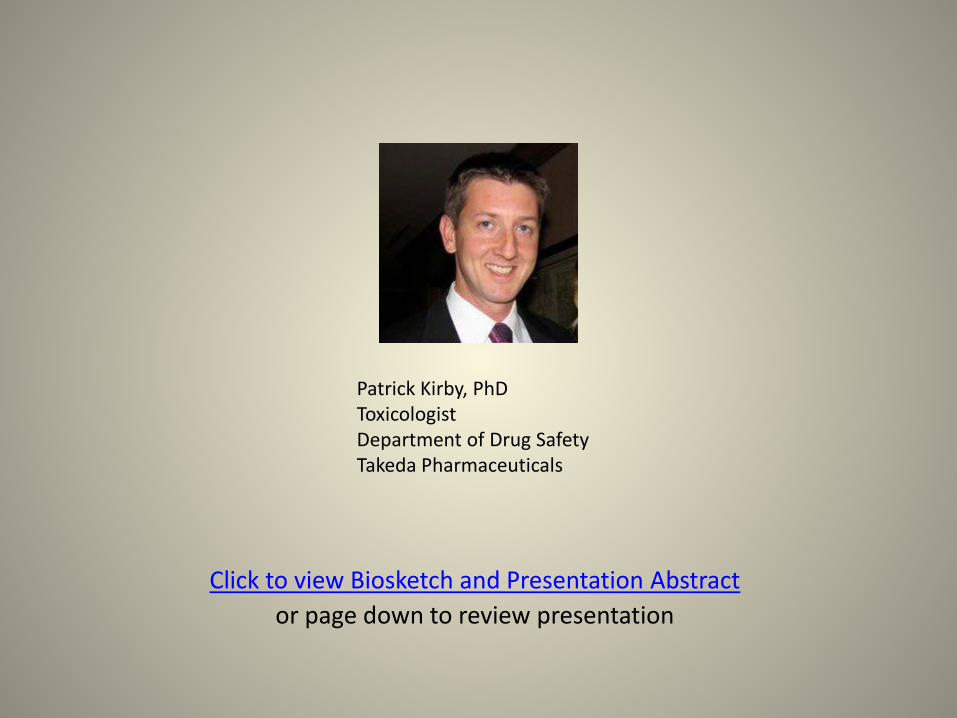
Patrick Kirby, PhD Toxicologist Department of Drug Safety Takeda Pharmaceuticals
Click to view Biosketch and Presentation Abstract or page down to review presentation
PSTC and SAFE-T Collaboration: Normal Ranges for 12 Novel Biomarkers for Liver Safety
Patrick Kirby Takeda Pharmaceuticals March 2014
Presenter
Presentation Notes
Thank you. I appreciate the opportunity to come here and talk today. I am a toxicologist in non-clinical safety. I work with rats, dogs, and monkeys, so I think about things in slightly different ways than human doctors. I am part of the Predictive Safety Testing Consortium (PSTC) funded by the Critical Path Institute, working on discovery of new drug development tools in certain gap areas. And one of those is liver injury. I have only one ALT slide to show you today. The whole idea behind this talk is whether we can find other tools to help where ALT is not giving you the information you want. This particular project is being done in collaboration with SAFE T (Safer and Faster Evidence-Based Translation). They are a group funded by the IMI, looking at new clinical biomarkers. We are specifically looking at drug-induced liver injury. The leaders of the SAFE T group are here today, Michael Merz and Gerd Ublick, and they can address any specific questions on some of their goals. I am just going to talk to you about baseline values. I am not going to show you thresholds for concern, such as 3X upper limit of normal. I am just going to show you the baseline values for 12 biomarkers in a normal, healthy volunteer population. Thresholds for concern, different baseline values for different populations, are all to be figured out. But it is a good place to start for some biomarkers that may have novel contexts of use that may be validated by ongoing clinical trials which SAFE T is running, to understand the performance of these biomarkers. That is it in a nutshell.

KEY MESSAGES
•Collaboration between Hepatotoxicity Working Group (HWG) of Predictive Safety Testing Consortium (PSTC) and Work Package 3 of Safer and Faster Evidence-Based Translation (SAFE-T) consortium •12 novel liver biomarkers were assessed by healthy volunteers (HV) with commercially available or newly developed assays
•Intra- and Inter-subject variability was low
•Only age related stratification was observed in AFP and PT
•Baseline estimation of HV liver biomarkers will be utilized by PSTC and SAFE-T consortia during biomarker qualification
•Ongoing SAFE-T clinical trials will assess performance of biomarkers in three context of use (COU) areas
2
Presenter
Presentation Notes
The key messages are: We are in a collaboration between the PSTC and SAFE T. We looked at 12 novel liver biomarkers. Some of them are already in the literature. Some of them already have kits available. Some had to have the kits created by the natural and medical NMI and Tubingen, which is an assay development group. They developed a lot of these assays for us, and I will talk about them. We looked at the normal healthy volunteer (NHV) population, where there was low intra- and inter-subject variability. I will show you that data. We did look at stratification factors. We didn't see anything except for age, and that was only observed in alpha-fetoprotein and prothrombin. What we use this information for is, hopefully, for eventual clinical qualification of biomarkers that perform well in specific context-of-use areas. A lot of this data is coming out sometime in June. SAFE-T is doing a lot of clinical trials looking at these particular biomarkers.
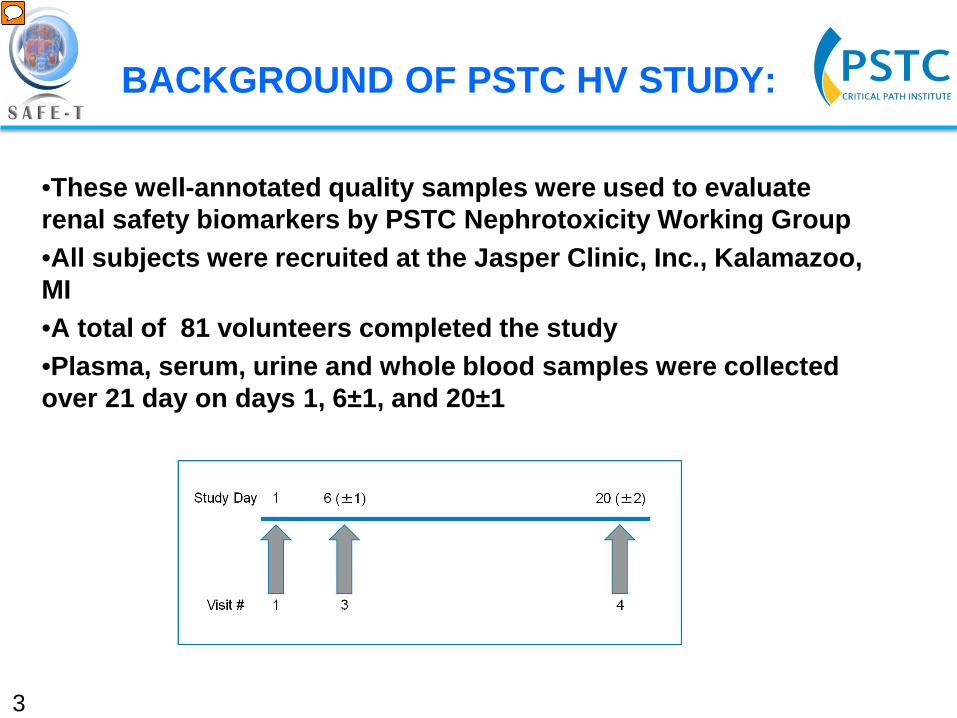
•These well-annotated quality samples were used to evaluate renal safety biomarkers by PSTC Nephrotoxicity Working Group •All subjects were recruited at the Jasper Clinic, Inc., Kalamazoo, MI •A total of 81 volunteers completed the study •Plasma, serum, urine and whole blood samples were collected over 21 day on days 1, 6±1, and 20±1
3
BACKGROUND OF PSTC HV STUDY:
Presenter
Presentation Notes
The background on this was a PSTC study that they had run in the past to look at renal biomarkers. It has already been used to help them set some thresholds and think about what to do in the renal space. The subjects were recruited in Kalamazoo, Michigan at the Jasper Clinic. So, a total of 81 volunteers over three site visits. We collected plasma, serum, urine, and blood on day 1, 6, and 20. These are all fasted samples.

INCLUSION AND EXCLUSION
•Standard inclusion and exclusion criteria for HV study •Original intent of the this HV study was to assess renal biomarkers thus there was emphasis on glomerular filtration rate (GFR) criteria •Most ALP, ALT, AST and Bilirubin values were below ULN of Jasper clinic reference ranges, and no apparent liver injury was found among the 81 subjects
4
Presenter
Presentation Notes
This is my only ALT slide. Standard inclusion/exclusion criteria. We looked for hepatitis and things like that. The original intent of this healthy volunteer study was to look at renal function. So, there was an emphasis on glomerular filtration rate. Most of the ALT values were below the upper limit of normal. We had maybe five patients that were above the upper limit of normal. When you look at ALP, we had maybe one patient above the upper limit of normal. For this analysis, we included everybody. In the future, we could do more sophisticated statistical analysis and pull out subsets. When we did some initial correlation analysis to ALT, everything was all over the place, because I think everybody is within that normal reference range. Those are our 81 subjects. You can see they are all on the bottom. About 5 people were above the upper limit of normal.
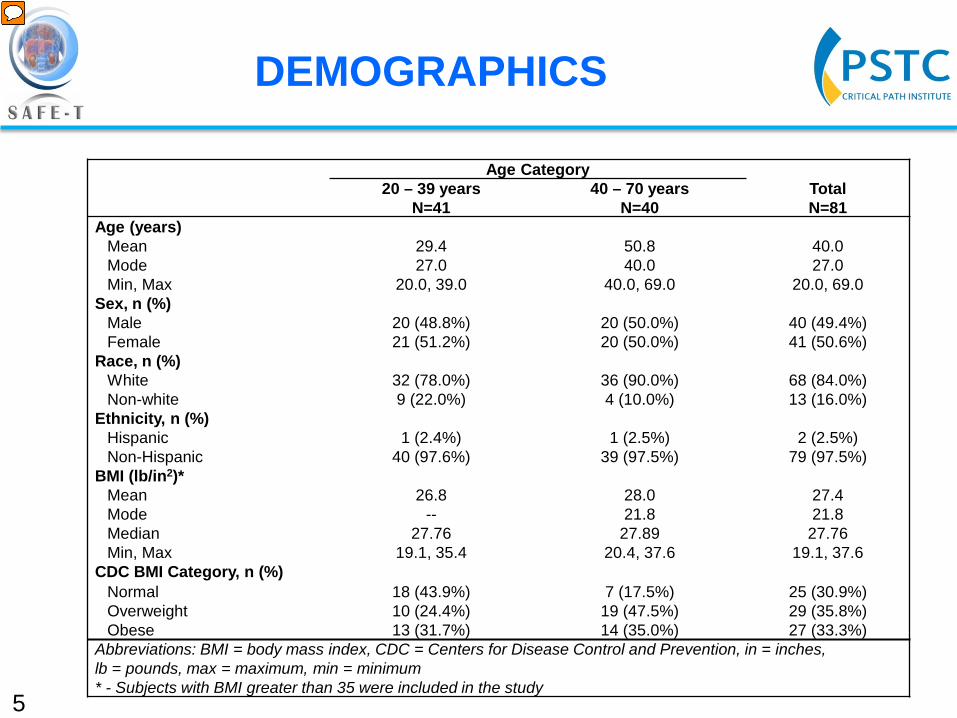
DEMOGRAPHICS
5
Age Category Total N=81
20 – 39 years N=41
40 – 70 years N=40
Age (years) Mean 29.4 50.8 40.0 Mode 27.0 40.0 27.0 Min, Max 20.0, 39.0 40.0, 69.0 20.0, 69.0
Sex, n (%) Male 20 (48.8%) 20 (50.0%) 40 (49.4%) Female 21 (51.2%) 20 (50.0%) 41 (50.6%)
Race, n (%) White 32 (78.0%) 36 (90.0%) 68 (84.0%) Non-white 9 (22.0%) 4 (10.0%) 13 (16.0%)
Ethnicity, n (%) Hispanic 1 (2.4%) 1 (2.5%) 2 (2.5%) Non-Hispanic 40 (97.6%) 39 (97.5%) 79 (97.5%)
BMI (lb/in2)* Mean 26.8 28.0 27.4 Mode -- 21.8 21.8 Median 27.76 27.89 27.76 Min, Max 19.1, 35.4 20.4, 37.6 19.1, 37.6
CDC BMI Category, n (%) Normal 18 (43.9%) 7 (17.5%) 25 (30.9%) Overweight 10 (24.4%) 19 (47.5%) 29 (35.8%) Obese 13 (31.7%) 14 (35.0%) 27 (33.3%)
Abbreviations: BMI = body mass index, CDC = Centers for Disease Control and Prevention, in = inches, lb = pounds, max = maximum, min = minimum * - Subjects with BMI greater than 35 were included in the study
Presenter
Presentation Notes
Demographics. These are people from Michigan, about 81, 41 between 20 and 39, the other 40 between 40 and 70. One thing I would point out, it was mostly a Caucasian population and in addition, these are not light people, with a pretty healthy BMI. Some people were obese, about 33 percent of the population and 60 percent overweight. That is something else we have to take into account.
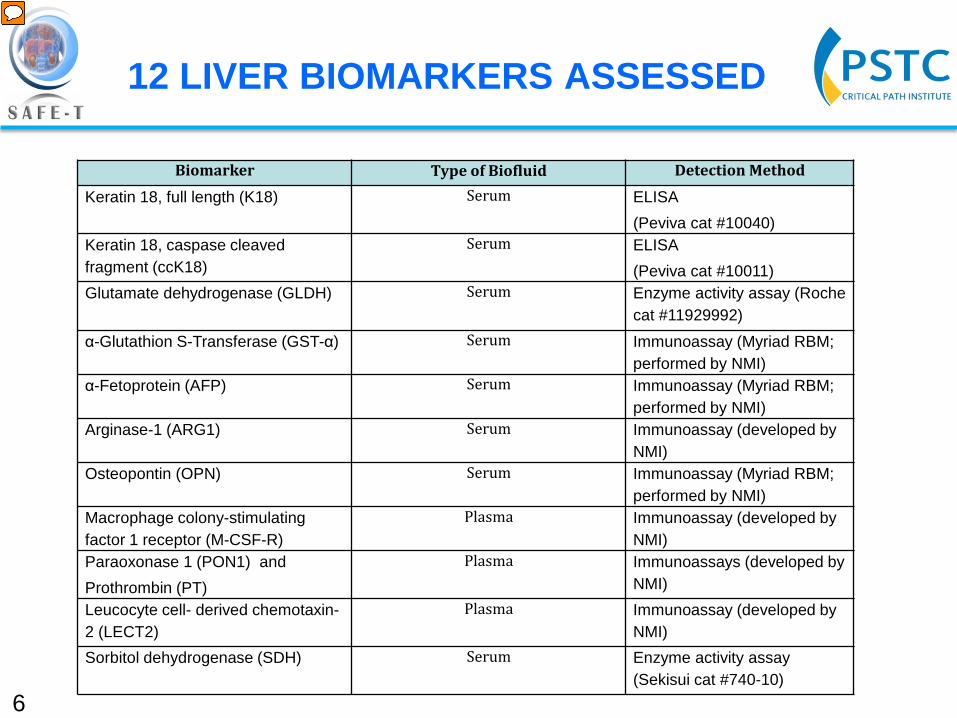
12 LIVER BIOMARKERS ASSESSED
6
Biomarker Type of Biofluid Detection Method
Keratin 18, full length (K18) Serum ELISA (Peviva cat #10040)
Keratin 18, caspase cleaved fragment (ccK18)
Serum ELISA (Peviva cat #10011)
Glutamate dehydrogenase (GLDH) Serum Enzyme activity assay (Roche cat #11929992)
α-Glutathion S-Transferase (GST-α) Serum Immunoassay (Myriad RBM; performed by NMI)
α-Fetoprotein (AFP) Serum
Immunoassay (Myriad RBM; performed by NMI)
Arginase-1 (ARG1) Serum Immunoassay (developed by NMI)
Osteopontin (OPN) Serum Immunoassay (Myriad RBM; performed by NMI)
Macrophage colony-stimulating factor 1 receptor (M-CSF-R)
Plasma Immunoassay (developed by NMI)
Paraoxonase 1 (PON1) and Prothrombin (PT)
Plasma Immunoassays (developed by NMI)
Leucocyte cell- derived chemotaxin-2 (LECT2)
Plasma Immunoassay (developed by NMI)
Sorbitol dehydrogenase (SDH) Serum Enzyme activity assay (Sekisui cat #740-10)
Presenter
Presentation Notes
These are the 12 biomarkers that we assessed, listed here. Cytokeratin full length, the caspase cleaved, GLDH, GSTL-alpha, alpha feto-protein, macrophage colony-stimulating factor 1 receptor, arginase-1, osteopontin, PON1, LECT2, and SDH. These were either serum or plasma biomarkers. The detection was either by ELISA or colorimetric assay, some commercially-available, some developed by NMI, which is a SAFE T affiliate.
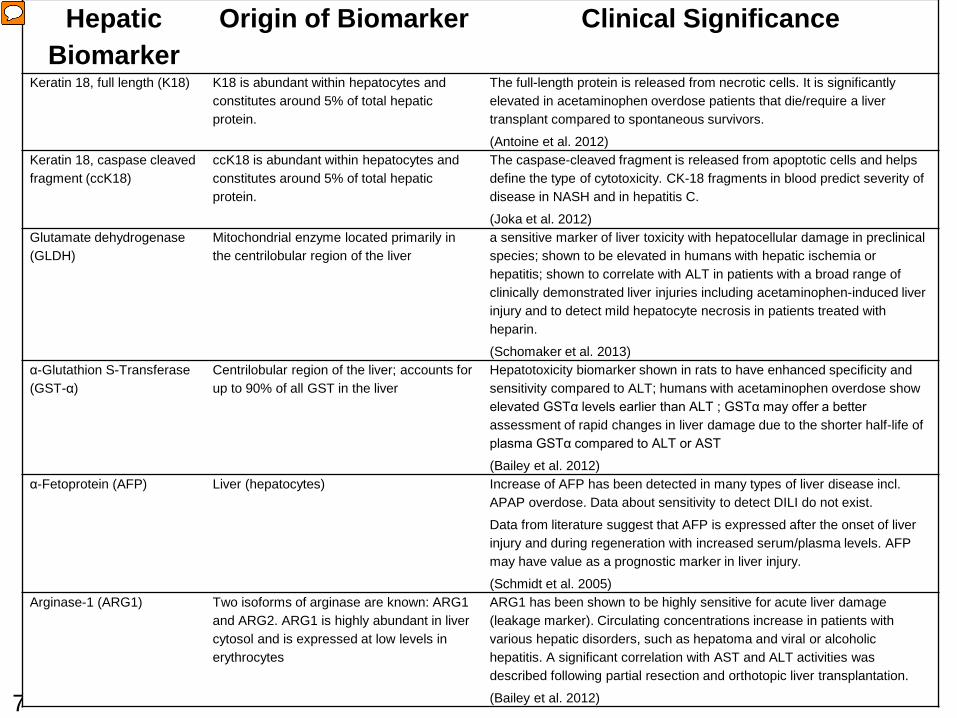
7
Hepatic Biomarker
Origin of Biomarker Clinical Significance
Keratin 18, full length (K18) K18 is abundant within hepatocytes and constitutes around 5% of total hepatic protein.
The full-length protein is released from necrotic cells. It is significantly elevated in acetaminophen overdose patients that die/require a liver transplant compared to spontaneous survivors.
(Antoine et al. 2012) Keratin 18, caspase cleaved fragment (ccK18)
ccK18 is abundant within hepatocytes and constitutes around 5% of total hepatic protein.
The caspase-cleaved fragment is released from apoptotic cells and helps define the type of cytotoxicity. CK-18 fragments in blood predict severity of disease in NASH and in hepatitis C.
(Joka et al. 2012) Glutamate dehydrogenase (GLDH)
Mitochondrial enzyme located primarily in the centrilobular region of the liver
a sensitive marker of liver toxicity with hepatocellular damage in preclinical species; shown to be elevated in humans with hepatic ischemia or hepatitis; shown to correlate with ALT in patients with a broad range of clinically demonstrated liver injuries including acetaminophen-induced liver injury and to detect mild hepatocyte necrosis in patients treated with heparin.
(Schomaker et al. 2013) α-Glutathion S-Transferase (GST-α)
Centrilobular region of the liver; accounts for up to 90% of all GST in the liver
Hepatotoxicity biomarker shown in rats to have enhanced specificity and sensitivity compared to ALT; humans with acetaminophen overdose show elevated GSTα levels earlier than ALT ; GSTα may offer a better assessment of rapid changes in liver damage due to the shorter half-life of plasma GSTα compared to ALT or AST
(Bailey et al. 2012) α-Fetoprotein (AFP) Liver (hepatocytes) Increase of AFP has been detected in many types of liver disease incl.
APAP overdose. Data about sensitivity to detect DILI do not exist.
Data from literature suggest that AFP is expressed after the onset of liver injury and during regeneration with increased serum/plasma levels. AFP may have value as a prognostic marker in liver injury.
(Schmidt et al. 2005) Arginase-1 (ARG1) Two isoforms of arginase are known: ARG1
and ARG2. ARG1 is highly abundant in liver cytosol and is expressed at low levels in erythrocytes
ARG1 has been shown to be highly sensitive for acute liver damage (leakage marker). Circulating concentrations increase in patients with various hepatic disorders, such as hepatoma and viral or alcoholic hepatitis. A significant correlation with AST and ALT activities was described following partial resection and orthotopic liver transplantation.
(Bailey et al. 2012)
Presenter
Presentation Notes
I have included a table which has all the information on these 12 biomarkers. I am not going to go through each one, because it would take a lot of time. One thing I would point out, is that Brett Howell of the Hamner is going to talk about cytokeratin tomorrow. So, he will give you some background on that. But the full length is a biomarker of necrosis. The caspase cleaved cytokeratin is a biomarker of apoptosis. GLDH, it is thought to have better specificity than ALT. Maybe you can use it to differentiate ALT sample from liver of muscle. You can look at these. There're references for you. I have this next slide here. I would add that these are a subset of some of the biomarkers SAFE T is looking at. I know they are also looking at miR 122 and some bile acids. We didn't run those because the assays weren't ready when we pulled the trigger on these samples.
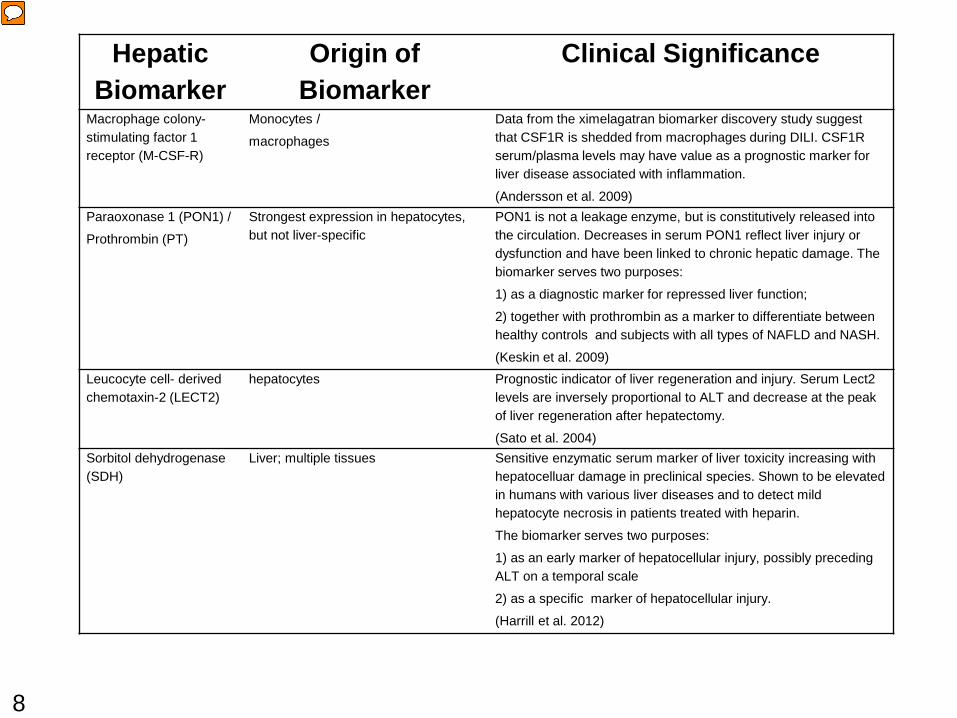
8
Hepatic Biomarker
Origin of Biomarker
Clinical Significance
Macrophage colony-stimulating factor 1 receptor (M-CSF-R)
Monocytes /
macrophages
Data from the ximelagatran biomarker discovery study suggest that CSF1R is shedded from macrophages during DILI. CSF1R serum/plasma levels may have value as a prognostic marker for liver disease associated with inflammation.
(Andersson et al. 2009) Paraoxonase 1 (PON1) /
Prothrombin (PT)
Strongest expression in hepatocytes, but not liver-specific
PON1 is not a leakage enzyme, but is constitutively released into the circulation. Decreases in serum PON1 reflect liver injury or dysfunction and have been linked to chronic hepatic damage. The biomarker serves two purposes:
1) as a diagnostic marker for repressed liver function;
2) together with prothrombin as a marker to differentiate between healthy controls and subjects with all types of NAFLD and NASH.
(Keskin et al. 2009) Leucocyte cell- derived chemotaxin-2 (LECT2)
hepatocytes Prognostic indicator of liver regeneration and injury. Serum Lect2 levels are inversely proportional to ALT and decrease at the peak of liver regeneration after hepatectomy.
(Sato et al. 2004) Sorbitol dehydrogenase (SDH)
Liver; multiple tissues Sensitive enzymatic serum marker of liver toxicity increasing with hepatocelluar damage in preclinical species. Shown to be elevated in humans with various liver diseases and to detect mild hepatocyte necrosis in patients treated with heparin.
The biomarker serves two purposes:
1) as an early marker of hepatocellular injury, possibly preceding ALT on a temporal scale
2) as a specific marker of hepatocellular injury.
(Harrill et al. 2012)
Presenter
Presentation Notes
In the Predictive Safety Testing Consortium, we do see some overlap in these assays that we are looking at in rats, specifically, GST-alpha, Arg1, GLDH, miR 122. And so, we could couple this data together and just see how these biomarkers translate across specifies in the various contexts of use that we will discuss. These samples were three years old, in the freezer, at minus 80. For long-term stability, there haven't been dedicated studies done yet for all the various kits, but what was done is that new kits or new lots arrived. They assessed previously measured samples. The data were pretty tight at this point, but we still need to run long-term stability experiments, and that will be done. For the concentrations we observed, they were consistent with what was in the literature so that was good except for the CSF and PON1 where there were slight differences with the newly-created kits, but the guys at NMI are planning to use mass spec to add a correction factor to have more realistic values.
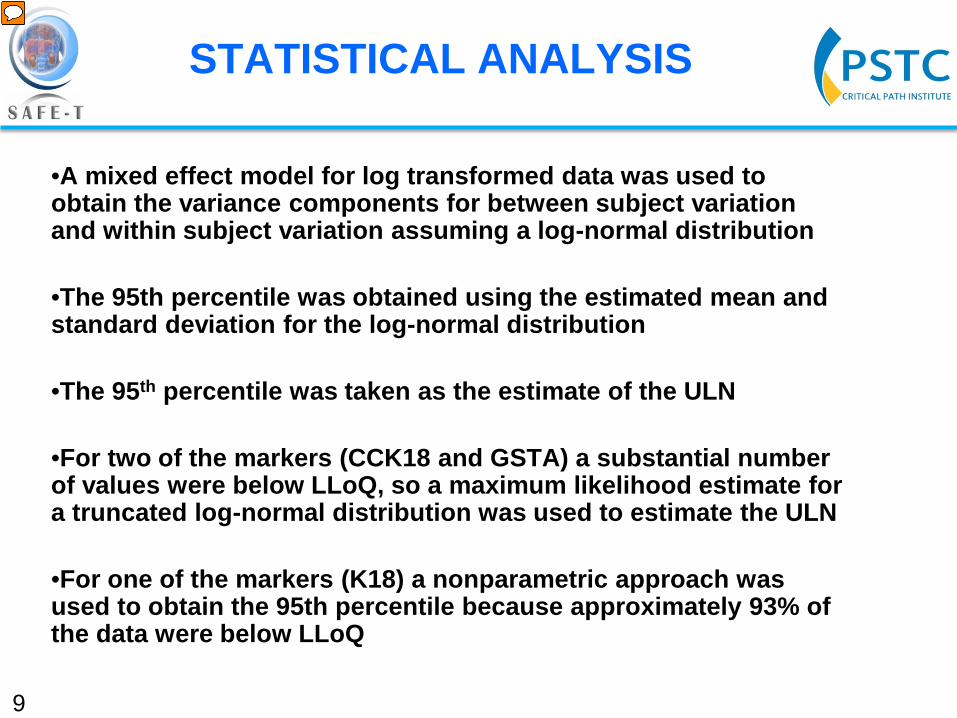
STATISTICAL ANALYSIS
•A mixed effect model for log transformed data was used to obtain the variance components for between subject variation and within subject variation assuming a log-normal distribution
•The 95th percentile was obtained using the estimated mean and standard deviation for the log-normal distribution
•The 95th percentile was taken as the estimate of the ULN
•For two of the markers (CCK18 and GSTA) a substantial number of values were below LLoQ, so a maximum likelihood estimate for a truncated log-normal distribution was used to estimate the ULN
•For one of the markers (K18) a nonparametric approach was used to obtain the 95th percentile because approximately 93% of the data were below LLoQ
9
Presenter
Presentation Notes
The statistical analysis is just for your reference. Basically, we have three types of data, one type where everything was above our limit of quantification. So, it was a little bit easier to do our stats on that. We had a second set that included the caspase cleaved 18 and GST-alpha, where some of the values were below our limit of quantification. For the full-length cytokeratin, where most of your values from healthy volunteers are below the limit of quantification, because you don't expect that biomarker to be up in normal healthy volunteer patients, we had to use different statistical analysis for different sets of biomarkers.
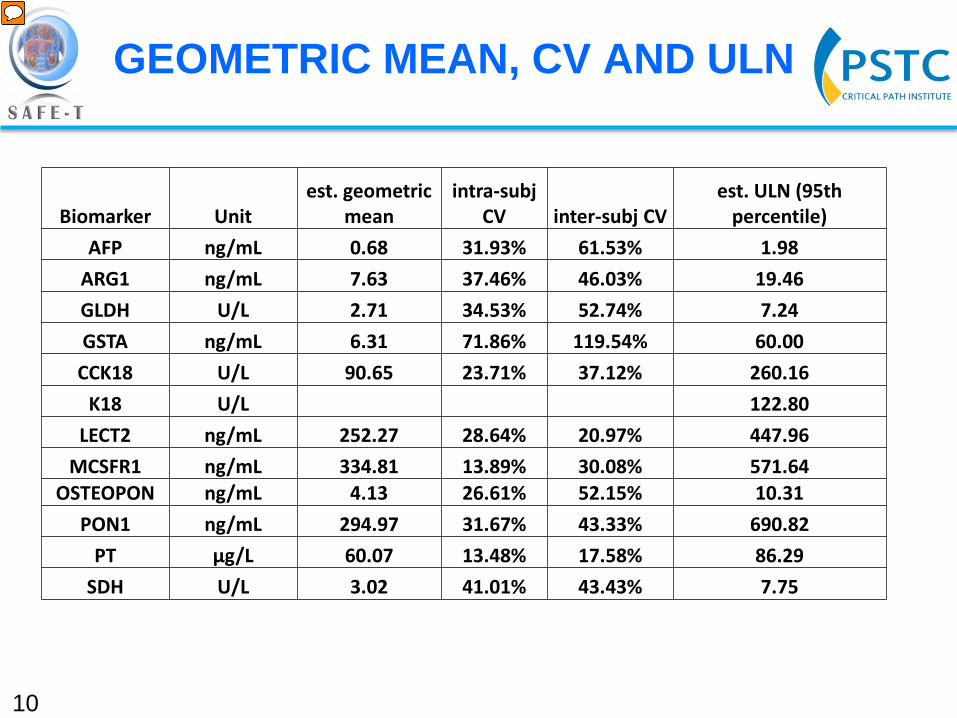
GEOMETRIC MEAN, CV AND ULN
10
Biomarker Unit est. geometric
mean intra-subj
CV inter-subj CV est. ULN (95th
percentile) AFP ng/mL 0.68 31.93% 61.53% 1.98
ARG1 ng/mL 7.63 37.46% 46.03% 19.46 GLDH U/L 2.71 34.53% 52.74% 7.24 GSTA ng/mL 6.31 71.86% 119.54% 60.00
CCK18 U/L 90.65 23.71% 37.12% 260.16 K18 U/L 122.80
LECT2 ng/mL 252.27 28.64% 20.97% 447.96 MCSFR1 ng/mL 334.81 13.89% 30.08% 571.64
OSTEOPON ng/mL 4.13 26.61% 52.15% 10.31 PON1 ng/mL 294.97 31.67% 43.33% 690.82
PT μg/L 60.07 13.48% 17.58% 86.29 SDH U/L 3.02 41.01% 43.43% 7.75
Presenter
Presentation Notes
So, this is the real money slide with all the data and information that may be useful, just with all the different biomarkers here listed, you know, the united, the estimated geometric mean, intra-subject CV, inter-subject CV, and then, the estimated upper limit of normal by the 95th percentile. I would have to say that the intra-subject CV is over the three different site visits. Overall, there was low variation but intra-subject CV was a little bit higher than inter-subject, except for LECT2.
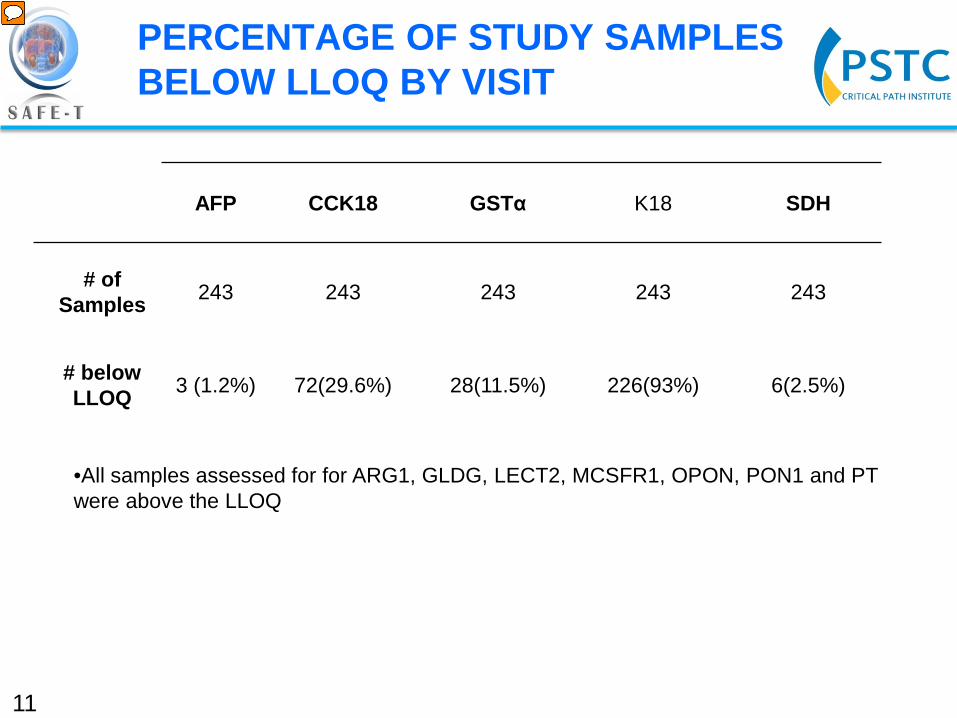
11
AFP CCK18 GSTα K18 SDH
# of Samples 243 243 243 243 243
# below LLOQ 3 (1.2%) 72(29.6%) 28(11.5%) 226(93%) 6(2.5%)
•All samples assessed for for ARG1, GLDG, LECT2, MCSFR1, OPON, PON1 and PT were above the LLOQ
PERCENTAGE OF STUDY SAMPLES BELOW LLOQ BY VISIT
Presenter
Presentation Notes
And now I can go into some of the raw data, just to give you a view. For the LLoQ, just what samples were below the limit of quantification. For the most part, 7 of the 12 biomarkers were all above the LLoQ. Full-length cytokeratin 18, most of them, 93 percent were below the LLoQ. And so, that is why on the previous slide we don't have this geometric mean, just because you couldn't calculate it. A few others there that were below the LLoQ.
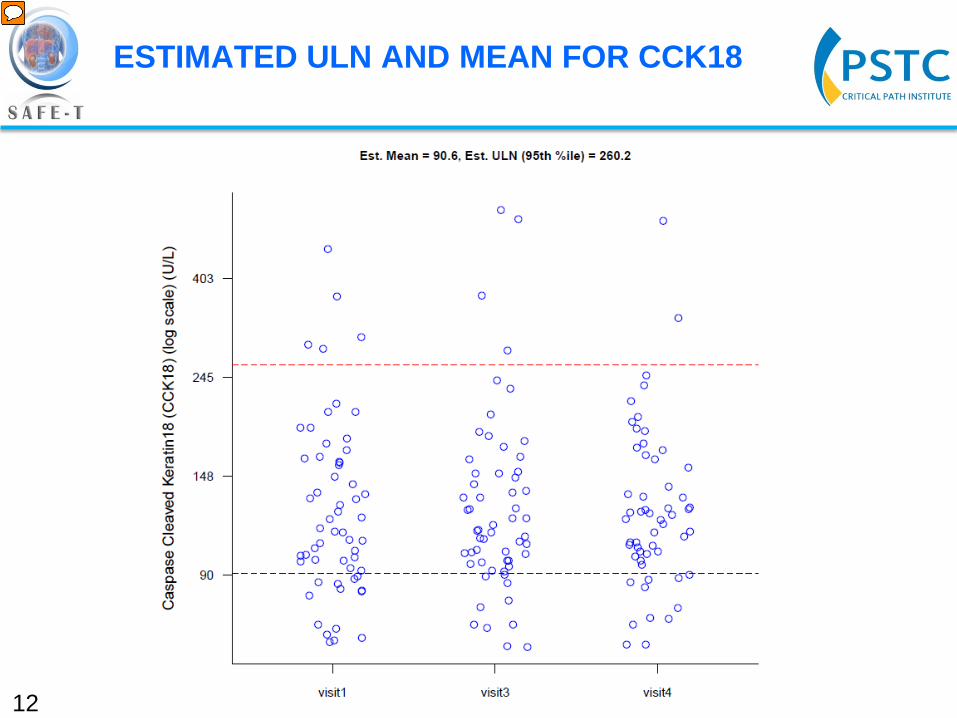
12
ESTIMATED ULN AND MEAN FOR CCK18
Presenter
Presentation Notes
This is cytokeratin 18, the caspase cleaved, a biomarker of apoptosis. The red line is your estimated upper limit of normal by the 95th percentile. This is your geometric mean, the lower black line. Then, the three site visits, visit 1, visit 3 and 4. The reason why there are different numbers is that they didn't collect blood or serum or plasma on visit 2.
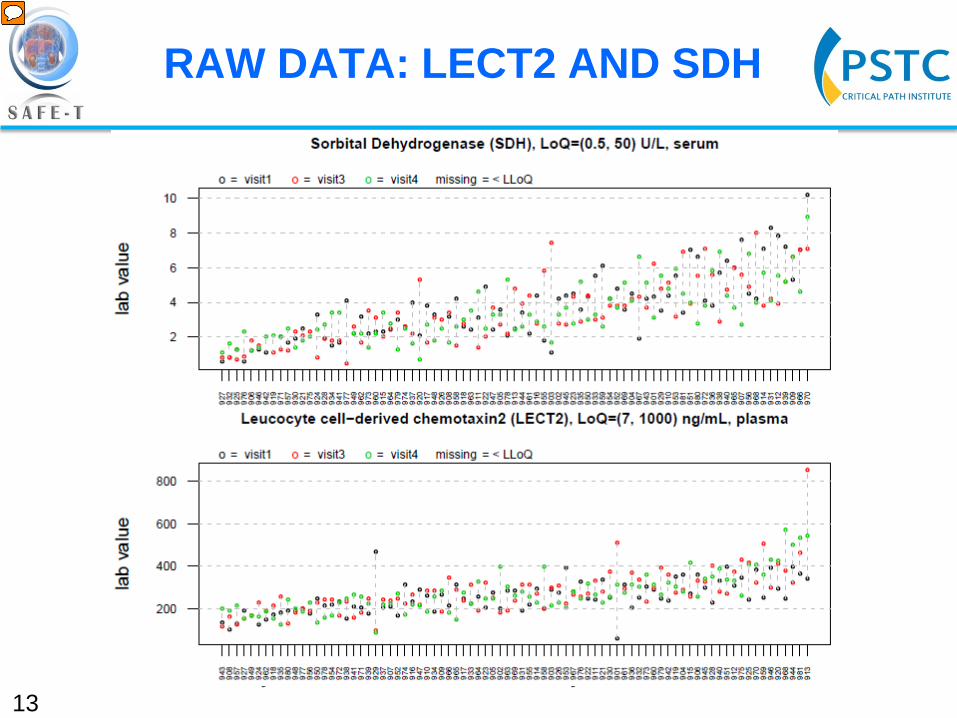
13 Ordered by mean value, x-label is anonymous id
RAW DATA: LECT2 AND SDH
Presenter
Presentation Notes
To give you kind of an idea how patients looked over the site visits, what you are seeing here is all 81 subjects. On the top is SDH; on the bottom is LECT2. The different colored dots are the spread over the three different site visits. So, overall, it was pretty tight for both of them. We were pleased with the data.
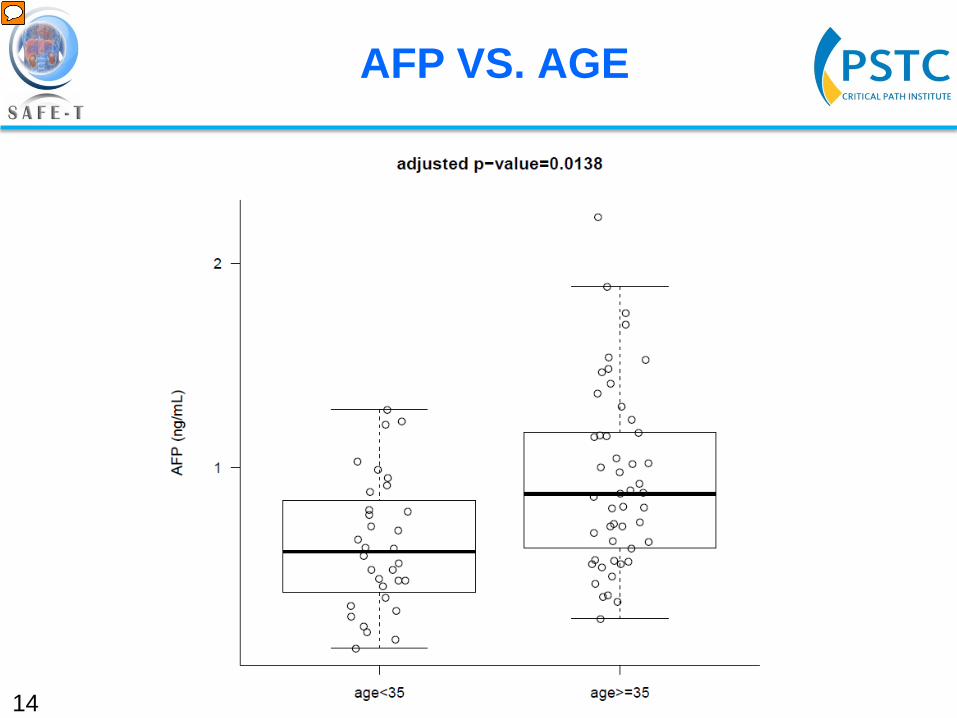
14
AFP VS. AGE
Presenter
Presentation Notes
In terms of stratification factors, we looked at the 12 biomarkers. The first thing I wanted to look at was BMI, just because these were very obese patients, you know, 60 percent of them. We didn't see any stratification based on BMI. We didn't see any stratification based on gender, ethnicity. The only thing we saw was age-related stratification just in two biomarkers, AFP here, where you can see that there is a slight elevation in older patients, greater than 35, ---
15
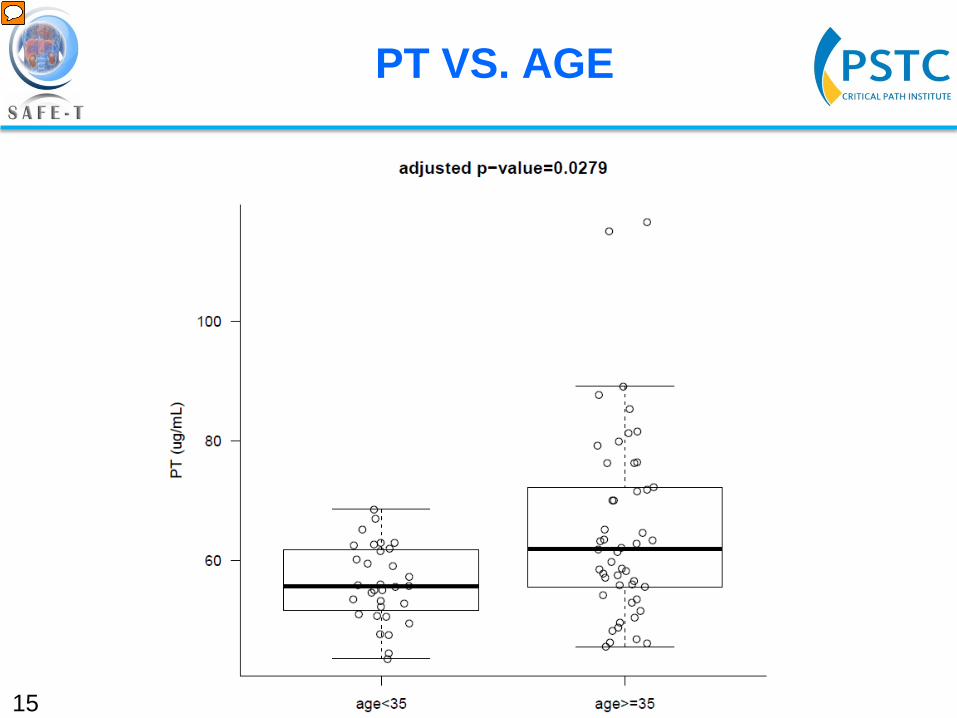
PT VS. AGE
Presenter
Presentation Notes
--- and prothrombin as well. Overall, there was nothing that really jumped out to us.
NEXT STEPS
•Mir-122 and individual bile acid quantification from PSTC HV study sample •SAFE-T assessment of clinical performance performance of 12 liver biomarkers
16
Presenter
Presentation Notes
Some of the next steps that we have to do are to look at some additional biomarkers in this patient population because we have a lot of samples saved. That includes miR 122 analysis, potential bile acid quantification, as well as individual bile acids because it is a nice study population. In addition, as I mentioned, the work package 3 of SAFE T is in the process right now of looking at all these biomarkers with the same assays in various clinical trials that actually cause liver injury. They are looking at three different context-of-use areas. This kind of gets back to what Arie was talking about before, getting these new drug development tools, if feasible.
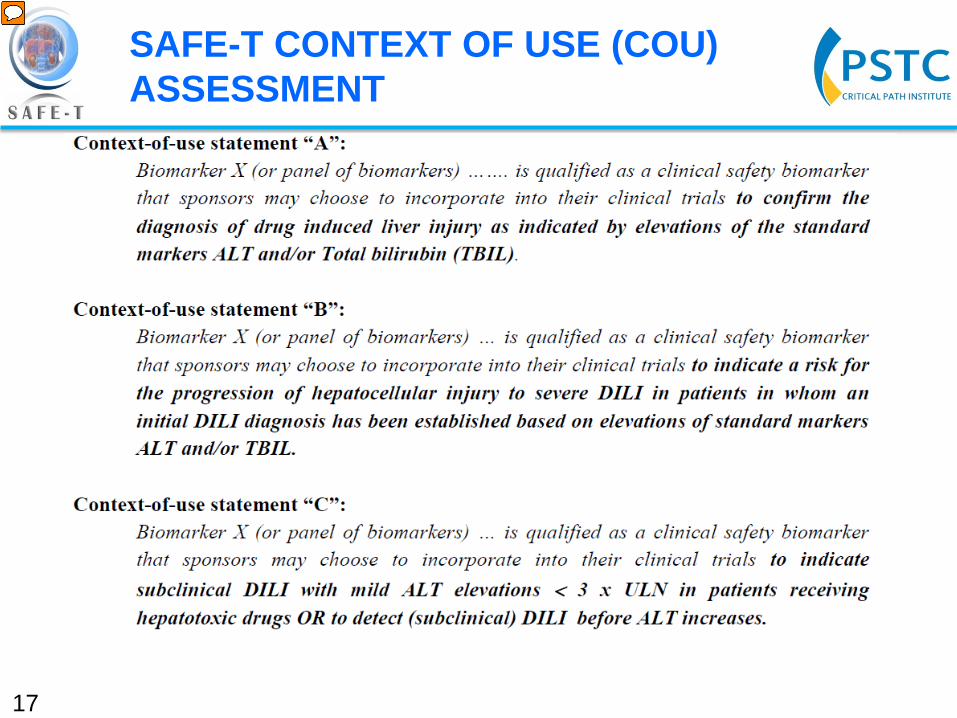
SAFE-T CONTEXT OF USE (COU) ASSESSMENT
17
Presenter
Presentation Notes
So, just to show you some of the things they are thinking about, and they will use this baseline data, this normal healthy volunteer data, to help them think about the changes they will see in their different indications in these clinical trials that SAFE T is running. One context of use that they are looking at is something to confirm DILI beyond just ALT or bilirubin, like is this sensitive for that? That is a very general context of use. Another thing they want to see, are you going to progress to DILI? Can you use some of these biomarkers to say, hey, this person has ALT, bilirubin, but you also have this biomarker, and you have a greater chance to progression? Can they see that in their patient population? Then, additionally, can these biomarkers help you detect subclinical DILI where ALT is less than threefold upper limit of normal? The same thing with bilirubin. So, hopefully, some of these biomarkers will perform. I think when you are in biomarker discovery and you get this big list and you keep on whittling down and down, but the hope is to get new tools that you can really add to your toolbox that can give you information about potential progression of the DILI or predicting which patients will progress to DILI. And so, that is kind of the direction we are going.
KEY MESSAGES
•Collaboration between Hepatotoxicity Working Group (HWG) of Predictive Safety Testing Consortium (PSTC) and Work Package 3 of Safer and Faster Evidence-Based Translation (SAFE-T) consortium •12 novel liver biomarkers were assessed by healthy volunteers (HV) with commercially available or newly developed assays
•Intra- and Inter-subject variability was low
•Only age related stratification was observed in AFP and PT
•Baseline estimation of HV liver biomarkers will be utilized by PSTC and SAFE-T consortia during biomarker qualification
•Ongoing SAFE-T clinical trials will assess performance of biomarkers in three context of use (COU) areas
18
Presenter
Presentation Notes
Just to recap, it was collaboration between two different biomarker consortia, which is a great activity because so often in the drug development business you are very competitive, but I think these consortias really push we shouldn't be competing on safety. This is where we should be really collaborating and working together. And so, we have some baseline data from healthy volunteers, but with a slightly-elevated BMI. The data look good, some minor age stratification. Hopefully, we will be able to use this data once we see how these biomarkers perform in clinical trials with actual liver injury.
ACKNOWLEDGEMENTS
Hepatotoxicity Working Group of PSTC SAFE-T WP3 Jens Göpfert Shelli Schomaker Jeff Lawrence Nicholas M.P. King John-Michael Sauer Marty Cisneroz John Marcinak Feng Gao Denise Robinson-Gravatt Gerd Kullak-Ublick Rachel Church Thomas Joos
Thomas Knorpp Michael Merz
19
Presenter
Presentation Notes
To thank people, the Biotoxicity Working Group, the SAFE T group, a lot of people here, like Will Proctor, Phil Schrott from PSDC, and John Marciniak from Takeda helped me look at the ALT values of a lot of these samples. So, thank you.