City of Alameda Budget and Forecast Budget Process / Basis ...
John Foss, City Administrator
Presented to Council: November 2017
2018
City of Weyauwega Budget
Executive Summary
“Life Out of the Fast Lane”

City of Weyauwega Budget 2018______________________________
1 City Budget 2018
Table of Contents
Letter to the Common Council…………………………………………………………2
Goals and Objectives…………………………………………………….……………..3
Weyauwega Common Council……………………………………………….………..4
Committees and Commissions……….………………………………………....…….5
City Staff………….……………………………………………………………………...6
Community Profile………………………………………………………………………7
Weyauwega Schools……………………………………………………………………8
City Revenue…………………………………………………………………………….9
Utilities…………………………………………………………………………………..10
Use of Public Funds…………………………………………………………………...12
Revenue Budget……………………………………………………………………….13
Expenditure Budget………………………………………………….……………......18
Police Budget…………………………………………………………………………..21
Debt Payment Schedule………………………………………………………………24
Utility Budgets………………………………………………………………………….25
Resolution………………………………………………………………………………27
City of Weyauwega Budget 2018______________________________
2 City Budget 2018
Letter to the Common Council from
John J. Foss, City Administrator
First and foremost, I’d like to thank the mayor and council for allowing me the opportunity to serve the people of the city of Weyauwega. It has been a pleasure getting to know the staff, council, and citizens of the city and I look forward to the future. Although the city had not seen as much growth as we had hoped in 2017, it was definitely a building year with many prospective projects and opportunities coming down the pike. With the state economy growing, we hope 2018 will bring even more opportunities. That doesn’t mean that the planning stops; we need to harness that momentum and keep expanding our goals and build off of the energy. Planning will be the key to success by ensuring that growth meets the needs of the community and aligns with the city’s ideals. Comprehensive Planning, the Capital Improvement Plan, the CORP Plan (Comprehensive Outdoor Recreational Planning), creating a Downtown Vision and expanding our residential and commercial sectors are all in the works. Along with formulating our mission and vision for the citizens of Weyauwega we must ensure that we continue to provide exceptional service. This budget serves to ensure the taxpayers that their money is being spent responsibly and with their interests at the forefront. The budget is not just a task that comes around every fall, it’s a year-
long process. When the 2018 Budget is submitted and approved by
the Common Council, the 2019 Budget Process begins. Each
expenditure is carefully tracked to make sure that every cent being
spent benefits the community in the best way possible.
City of Weyauwega Budget 2018______________________________
3 City Budget 2018
Goals and Objectives
Revise and Develop Strategies to Plan for the
Future of the City of Weyauwega
10-year Comprehensive Planning
o Community Needs Analysis o Structured Visioning o Community Input and Involvement
Capital Improvement Plan
o Maintain and Upgrade City Roads
o Maintain and Upgrade City Utilities
o Upgrade Safety Equipment and Facilities
CORP Plan
o Identify Recreational Needs
o Develop Strategies to Upgrade Park Equipment and Facilities
o Expand the City’s Park System and Facilities
Maintain a Proactive,
Responsible Government
o Build Trust Within the Community
o Develop Policies and Procedures That
Improve the Quality of Life
o Develop and Implement a Transparent Budget
o Plan Ahead and Anticipate the Needs for the
Future of the City

City of Weyauwega Budget 2018______________________________
4 City Budget 2018
Weyauwega Common Council
Mayor
Jack Spierings
Common Council
Ward One
Keith Najdowski Rich Luedke Council President
Ward Two
Shani Appleby Nick Gunderson
Ward Three
Bruce Goetsch Rick Binley
City of Weyauwega Budget 2018______________________________
5 City Budget 2018
Committees and Commissions
Finance Committee
Keith Najdowski (chair) – Rich Luedke – Shani Appleby
Public Works Committee
Bruce Goetsch (chair) – Nick Gunderson – Keith Najdowski
Police, Fire, and Ambulance Committee
Rich Luedke (chair) – Bruce Goetsch – Nick Gunderson
Public Property and Purchasing Committee
Rick Binley (chair) – Bruce Goetsch – Rich Luedke
Public Health and Relief (Ordinance)
Shani Appleby (chair) – Keith Najdowski – Rick Binley
Recreation Committee
Nick Gunderson (chair) – Rick Binley – Shani Appleby
Planning Commission
Jack Spierings - Nick Gunderson - Rick Binley,
Rory Koch - Bob Anibas - Steve Ebert

City of Weyauwega Budget 2018______________________________
6 City Budget 2018
City Staff
Administration
City Administrator: John Foss
City Clerk: Becky Loehrke
City Treasurer: Trina Herbst-Gutche
City Building Inspector: Bob Underberg
Public Works/Parks
Community Operations Supervisor: Don Anzia
Water Operator in Charge: Tyler Mueller
Wastewater Plant Operator in Charge: Paul Wittlinger
Public Works/Utility Worker: Kyle Young
Police Department
Police Chief: Jerry Poltrock
Sergeant: Brandon Leschke
Patrol: Lydia Buntrock
Patrol: Justin Malueg
PT Patrol: Heather Dahm
PT Patrol: Josh Pawlosky
PT Patrol: Elmer Keberlein
PT Patrol: Chad Repinski
Contracted Services
City Engineer: Thad Majikowski, Cedar Corporation
City Attorney: James Kalny, Davis & Kuelthau Attorneys
Municipal Advisor: Jon Cameron, Ehlers
City Assessors: Associated Appraisal Consultants, Inc.
Solid Waste Services: Harter’s Disposal

City of Weyauwega Budget 2018______________________________
7 City Budget 2018
Community Profile
The quaint, rural community of Weyauwega is located in the heart of
Central Wisconsin River Country built around the 250-acre Lake
Weyauwega. The city bodes an outstanding educational system, excellent
parks with a man-made swimming lake, progressive industry, and
worldwide award-winning cheeses. Weyauwega is a full-service community
aimed at providing its citizens with quality first-name basis care, safety, and
services.
Our quintessential downtown offers an array of boutiques, antique shops, bars, and restaurants; perfect for a day trip. Weyauwega's industrial parks and commercial districts offer many opportunities to start, grow, and expand your business. The city's top employers include Agropur, Presto Products, and Star Dairy.

City of Weyauwega Budget 2018______________________________
8 City Budget 2018
Schools Serving the City of Weyauwega
The City of Weyauwega is served by the
Weyauwega-Fremont School District. The district
has two elementary schools, one in Fremont and
one in Weyauwega, the latter being colocated with
the middle school and high school buildings. There
is also a parochial elementary school, St. Peter
Lutheran School.
Over the summer, the school system began a $21 million upgrade and
renovation project to the high school building which will include a new
secure entry, four new classrooms for science, a 400-seat auditorium, new
mechanical upgrades, and a multipurpose gym. The work is expected to be
completed in the fall of 2018.

City of Weyauwega Budget 2018______________________________
9 City Budget 2018
City Revenue
The City of Weyauwega requires funds from the public in order to operate
city hall, provide services, and keep the community safe. Accounting
methods are utilized to track expenditures and revenue which aid in the
process of forecasting a budget for the upcoming fiscal year. Proper
accounting practices ensure compliance with legal requirements to which
municipalities must adhere. Revenue can be categorized into two main
groups: the General Fund and the Utility Fund.
The General Fund is used to provide for all general operations of the city.
The primary source of revenue for this fund is the tax levy. Other sources
which provide to the General Fund are intergovernmental shared revenues,
fees for services, licenses and permits, and site rental fees. This fund is
primarily used for general government expenses, public works and parks,
and public safety services.
The Utility Fund is separate from the General Fund and is subdivided into
two separate utility funds: the Water Fund and the Sewer Fund. In more
suburban areas these services can be contracted jointly with other
communities to share costs, but Weyauwega operates its own by means of
user fees. When you pay your utility bill, the water and sewer charges are
separated and go back into each individual utility to provide for operational
costs, maintenance, wages of employees, and upgrades to the system.
29%
14%57%
Revenue Breakdown
Sewer Fund
Water Fund
General Fund

City of Weyauwega Budget 2018______________________________
10 City Budget 2018
Water and Sewer Rates
Water
The City of Weyauwega commissioned a study to
determine water rates for the next year. The study
concluded that rates should increase by around
14%, which is within the guidelines of the
Wisconsin Public Service Commission. This will
help alleviate rising operating costs of the city’s
water system. These changes will not take effect
until at least the second quarter of 2018.
Current rate: $1.35 per 1000 gallons
Suggested increase: $1.54 per 1000 gallons
Sewer
In 2016 the city completed an upgrade to the
Wastewater Treatment Facility. To accommodate
costs of the upgrade, rates were slightly increased.
These rates will remain steady for 2018 with no
increase expected.
Current rate: $ 2.998 per 1000 gallons
As a public utility, our rates and
the rules under which we
operate are regulated by the
Wisconsin Public Service
Commission.
How Does Weyauwega Compare?
Water Rates
Per 1000 Gallons
Clintonville: $4.40
Manawa: $4.00
New London: $3.08
Waupaca: $3.69
Sewer Rates
Per 1000 Gallons
Clintonville: $3.90
Manawa: $4.12
New London: $7.19
Waupaca: $2.44

City of Weyauwega Budget 2018______________________________
11 City Budget 2018
Where Do My Utility Payments Go?
When we make utility payments, those funds go back into the city’s utilities.
Payments for water go back into the water system for things such as water
tower maintenance, pump house repairs, wages for water utility employees,
equipment upgrades, and day-to-day costs of operation. Sewer payments
are utilized for a similar breakdown for the city’s sewer system and
Wastewater Treatment Plant.
$99,000
$44,000
$43,900
$42,250
$22,500 $20,000
$13,750
$168,897.50
Water Budget
Wages & Benefits Electricity Supplies
Service and Repairs Insurance Capital Improvements
Training & Misc. Debt Payments
$189,000.00
$51,250.00
$46,500.00 $165,200.00
$25,000.00 $75,000.00
$3,900.00
$402,935.00
Sewer Budget
Wages & Benefits Electricity Supplies
Service and Repairs Insurance Capital Improvements
Training & Misc. Debt Payments

City of Weyauwega Budget 2018______________________________
12 City Budget 2018
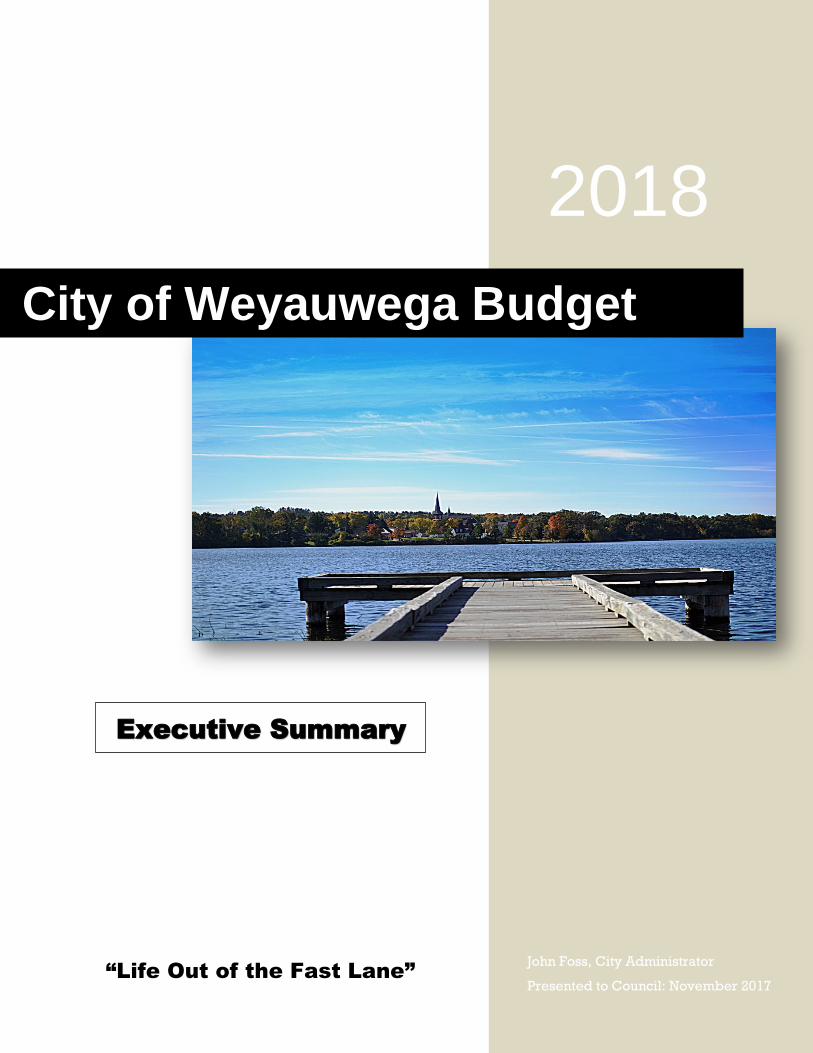
Use of Public Funds
Transparency is a government’s obligation to residents who deserve to
know where their money is being spent. Below is a chart which illustrates
where tax dollars are being spent for a home with an average value, which
is roughly $100,000 in the City of Weyauwega.
Property Values
While the housing market has stagnated and even regressed during the
recession, home sales and property values have been increasing this past
year. As we move past the recession and hopefully onward to substaniated
growth in the United States, the State of Wisconsin, and in the City of
Weyauwega, we expect home values to increase. Along with the city’s
industrial sector expanding, this will create a greater demand for housing.
The city plans to work with developers in the coming years to expand the
housing market to give residents and employees who work in the city more
options.
Administration and Finance
16%
Public Safety25%
Public Works 11%
Solid Waste Services
5%
Parks and Recreation
4%
Planning and Economic
Development 1%
Capital Improvement Projects
12%
Debt17%
Library9%
Where Do Property Taxes Go?

City of Weyauwega Budget 2018______________________________
13 City Budget 2018
General Government Expected Revenues
Summary of General Revenues
*prior year’s year-to-date (YTD) totals are from budget time (Oct-Nov) to give comparison
We expect revenues to rise slightly this upcoming year by 3.22%. This
increase will come from a slim rise in intergovernmental revenues from the
state and a rise in taxable value in the city’s four Tax Incremental Financing
Districts. Overall, the city’s Equalized Value (EV) remained flat from the
year prior only adding 0.53%, which necessitated a tax rate increase from
$8.53 to $8.80 (27 cents) per $1000 of EV. Our goal is to foster residential
and commercial development in the upcoming year which will help to
increase the EV. The Common Council approved a new contract for solid
waste collection this year which will take effect January 1, 2018. The
charges for these and other services are expected to remain unchanged.
Taxes
REVENUES
2015
Budget 2015 Actual
2016
Budget 2016 YTD
2017
Budget 2017 YTD
2018
Budget
Percent
Change
Gen Property Tax 745,442$ 745,442$ 754,626$ 754,626$ 795,232$ 795,232$ 799,423$ 0.53%
TIF District Tax 152,000$ 146,048$ 110,000$ 103,400$ 199,000$ 190,170$ 246,206$ 23.72%
Debt Service Tax -$ -$ -$
Mobile Home Fees 9,600$ 8,163$ 10,000$ 5,727$ 9,000$ 6,328$ 9,000$ 0.00%
Special Assmts 11,987$ 11,987$ 2,500$ 3,763$ 1,000$ -$ 1,000$ 0.00%
Intergovernmental 687,258$ 687,948$ 684,820$ 561,601$ 685,771$ 633,641$ 695,048$ 1.35%
Regulation & Compl 47,139$ 47,364$ 40,700$ 35,971$ 40,525$ 32,195$ 40,525$ 0.00%
Charges for Services 132,405$ 132,537$ 130,400$ 89,001$ 132,750$ 96,629$ 132,750$ 0.00%
Other Gen Revenues 17,900$ 27,251$ 19,925$ 26,499$ 20,325$ 13,261$ 20,325$ 0.00%
Commercial Revenue 3,863$ 3,588$ 1,775$ 590$ 3,250$ 5,782$ 3,250$ 0.00%
Other/W/Sdebt/Borrw -$ -$ -$
Total Revenues 1,807,594$ 1,810,328$ 1,754,746$ 1,581,178$ 1,886,853$ 1,583,067$ 1,947,527$ 3.22%
TAXES
2015
Budget
2015
Actual
2016
Budget
2016
Actual
2017
Budget
2017
YTD
2018
Proposed
%
Change
General Property Taxes 745,442 745,442 754,626 794,006 795,232 795,232 799,423 0.53%
Debt Service Taxes
TIF District Tax 152,000 146,048 110,000 104,308 199,000 104,308 246,206 23.72%
Mobile Home Tax 9,600 8,163 10,000 9,767 9,000 6,091 9,000 0.00%
Total Taxes 907,042 899,653 874,626 908,080 1,003,232 905,631 1,054,629 5.12%

City of Weyauwega Budget 2018______________________________
14 City Budget 2018
Intergovernmental Revenues
Intergovernmental revenue consists of monies obtained from other
governments and can include grants, shared taxes, and contingent loans
and advances. This funding can flow from the federal government to state
and local governments, and from state government to local governments.
The City of Weyauwega receives from the State of Wisconsin shared
revenue in an amount calculated by the value of taxable property
(excluding manufacturing) within city limits divided by the city’s population.
The city also receives a payment from the state called Expenditure
Restraint. This is an incentive to qualifying municipalities to keep spending
under control from one year to the next. Expenditures can only grow at the
rate of inflation plus growth in order to qualify.
Other sources of intergovernmental revenue come from state aid and
grants. Grant opportunities generally come from the state or county, but
they can come from the federal government or other organizations. Every
year we try to apply for as many grants and aid programs as possible to
make sure we are not missing out on an opportunity. Intergovernmental aid
is given to municipalities to help with projects or facilities that generally do
not bring in enough income on their own during the year to pay for
expenses, such as roads or libraries.
INTERGOVERNMENTAL REVENUES
2015
Budget
2015
Actual
2016
Budget
2016
Actual
2017
Budget
2017
YTD
2018
Proposed
%
Change
Police Grant 3,893
State Shared Revs 522,377 522,377 521,560 521,560 519,522 518,848 519,522 0.00%
Expenditure Restraint 25,444 25,444 24,301 24,301 23,716 25,660 23,716 0.00%
State Fire Dues 0 0 0 0 0 0.00%
State Road Aid 72,988 72,847 71,500 53,625 70,333 17,545 80,707 14.75%
State Computer Aid 2,600 2,319 2,600 2,454 2,600 0 2,638 1.47%
Recycling Grant 3,800 3,791 3,040 3,587 3,600 3,779 3,600 0.00%
Emergency Management 0 - 0 0.00%
Park Grant-Urban Forestry 0 - 0 0.00%
CDBG Grant 0 - 0 0.00%
Public Works Grant 0 - 0 0.00%
Library Aid 60,049 60,049 60,819 60,819 65,000 67,809 63,864 -1.75%
Neighborhood Fix-Up 0 0 0.00%
Other Law Enforcement 1,120 1,000 660 1,000 0 1,000 0.00%
Total Intergovernmental Revs687,258 687,948 684,820 667,006 685,771 637,534 695,048 1.35%

City of Weyauwega Budget 2018______________________________
15 City Budget 2018
Regulation and Compliance Revenues
Regulation and compliance revenues
come from licenses and permits. These
are issued by the city to ensure all
regulated practices are amenable with city
ordinance. Licenses are needed to sell
regulated merchandise, own certain pets,
and operate certain equipment. When
changes are planned to be made to
someone’s property, a permit is required to ensure that all safety
procedures are being met and to confirm that the changes will not
negatively affect others or another’s property. We expect these revenues to
remain unchanged. Budgeting for this is done by looking at averages of
years’ past. In this section it can be difficult to predict the amount of permits
and licenses that will be issued in the forthcoming year. The economy can
be an indicator for building permits; when the economy goes up, more
people impove their properties or build new homes.
REGULATION & COMPLIANCE REVENUES
Licenses:
2015
Budget
2015
Actual
2016
Budget
2016
Actual
2017
Budget
2017
YTD
2018
Proposed
%
Change
Liquor & Malt Bev 4,200 4,210 4,600 4,210 4,600 4,003 4,600 0.00%
Operators and occupational 1,250 1,300 1,250 1,540 1,300 1,417 1,300 0.00%
Cigarette 40 60 50 40 50 60 50 0.00%
Mobile Home Park 250 250 - 25 0 25 0.00%
Bicycle 50 50 - 50 0 50 0.00%
Garbage Hauler 120 120 60 120 0 120 0.00%
Cat license 80 36 80 51 80 47 80 0.00%
Dog Lic 1,000 1,137 1,100 473 1,100 70 1,100 0.00%
Permits:
Building 10,833 10,883 7,000 6,119 7,000 9,408 7,000 0.00%
Signs 767 175 35 175 54 175 0.00%
Law & Ordinance Violations 500 540 500 660 500 572 500 0.00%
Court Penalties & Costs 28,291 28,251 25,000 20,280 25,000 16,514 25,000 0.00%
Parking Violations 500 105 500 70 500 0 500 0.00%
W-F School Liaison Officer 0 0 0 #DIV/0!
Sellers Permit 25 75 25 - 25 50 25 0.00%
Total Regulation & Cmpl Rev 47,139 47,364 40,700 33,538 40,525 32,195 40,525 0.00%

City of Weyauwega Budget 2018______________________________
16 City Budget 2018
Charges for Services
This section covers the charges that are collected for services the city
provides such as garbage collection, fees to use the swim lake, and rental
fees for using park shelters. This is easier to project by averages because
revenues through charges stay relatively the same from year to year. We
expect no change in budget from the previous year’s projection.
Commercial Revenues
Commercial revenues are a small portion of the budget, but can be
significant. The majority of these funds come from interest earned on
accounts and sale of city-owned property. We expect these outlooks to
remain unchanged in 2018.
CHARGES FOR SERVICES
2015
Budget
2015
Actual
2016
Budget
2016
Actual
2017
Budget
2017
YTD
2018
Proposed
%
Change
License Publication Fees 300 266.4 300 57 300 280 300 0.00%
Refuse Collection 105,110 105,110 105,000 71,705 105,000 79,763 105,000 0.00%
Snow Removal 700 0 700 - 700 0 700 0.00%
Curbs/Gutter 0 0 0 - 0 0.00%
Swimming Pool Fees 15,000 15,711 20,000 15,025 17,000 12,155 17,000 0.00%
Library Fees 7,795 7,795 0 - 0 4,796 0 0.00%
Park Shelters, Playgrounds 3,000 2,880 3,700 3,530 3,800 3,460 3,800 0.00%
Community Room Rent 0 160 5,000 4,055 5,000 0.00%
Weed Cutting Fees 0 0 - 100 0 100 0.00%
Special Assessment Fee/Realtors 500 775 700 960 850 1,020 850 0.00%
Industrial Park Sales 0 0 34,165 0 0 0 0.00%
E-Rate Return 0 - 0 0 0 0.00%
Total Charges for Services 132,405 132,537 130,400 125,602 132,750 105,529 132,750 0.00%
COMMERCIAL REVENUES
2015
Budget
2015
Actual
2016
Budget
2016
Actual
2017
Budget
2017
YTD
2018
Proposed
%
Change
Interest on General Fund Invmts 3,588 3,588 1,500 3,739 3,000 6,201 3,000 0.00%
Interest on Spec Assessments 275 0 275 250 0 250 0.00%
Int Delinquent Taxes 0 0 59 0 0.00%
Sale of Property 0 0 0 0 0.00%
Total Commercial Revenues 3,863 3,588 1,775 3,739 3,250 6,260 3,250 0.00%

City of Weyauwega Budget 2018______________________________
17 City Budget 2018
Other General Revenues
Finally, all the other miscellaneous revenue that the city generates is listed
in the charts above. Every dollar that comes in must be tracked, accounted,
and spent in a manner that benefits the citizens of Weyauwega the most. In
today’s world with state mandates and rising costs, municipal governments
need to find ways to do more with less. This is why this budget document is
so important – because this process affects you. We need to ensure
everyone’s needs and concerns are being met.
OTHER GENERAL REVENUES
2015
Budget
2015
Actual
2016
Budget
2016
Actual
2017
Budget
2017
YTD
2018
Proposed
%
Change
Misc. Police 0 631 1,000 818 1,000 394 1,000 0.00%
Sales of Used Equip 500 500 - 500 0 500 0.00%
Miscellaneous 5,500 19,087 5,500 2,325 6,000 2,650 6,000 0.00%
WPRA Summer Ticket Rebate 27 25 28 25 0 25 0.00%
Credit Card Rebates 1,000 809 1,000 939 1,000 84 1,000 0.00%
Cable Franchise Fees 10,800 6,006 10,800 8,659 10,800 2,950 10,800 0.00%
Dam/loss Property 0 8,652 0 4,797 0 0.00%
Insurance Dividend Revenue 671 1,000 1,694 1,000 2,602 1,000 0.00%
Wireless Internet Franchise 0 0 0 0.00%
Donations 0 250 0.00%
NSF Fee for Returned Payments 100 20 100 0 0 0 0.00%
Transfer from Designated Reserve 0 0.00%
Transfer from Undesignated Reserve 0 0.00%
Total Other General Revenues 17,900 27,251 19,925 23,114 20,325 13,728 20,325 0.00%
SPECIAL ASSESSMENTS
2015
Budget
2015
Actual
2016
Budget
2016
Actual
2017
Budget
2017
YTD
2018
Proposed
%
Change
Sidewalks 0 - 0 0 0 0.00%
Curb & Gutter 11,987 11,987 2,500 - 1,000 0 1,000 0.00%
Total Special Assessments 11,987 11,987 2,500 - 1,000 0 1,000 0.00%

City of Weyauwega Budget 2018______________________________
18 City Budget 2018
General Government Expenditure Budget
Summary of 2018 Expenditures
*prior year’s year-to-date (YTD) totals are from budget time (Oct-Nov) to give comparison
Knowing that revenues will remain relatively unchanged in 2018, we
worked hard to keep rising costs down. Slight adjustments were needed,
but nothing dramatic. We expect expenditures to rise only slightly, 3.07%,
in 2018. The slight rise in expenses correlate with the planned road and
utility upgrade projects the city anticipates completing in the upcoming year
and rising costs of insurance. These figures are just a prediction of how
much the city will need to pay for wages, maintenance, repairs, contracted
services, and debt. As we all know, circumstances can change such as a
wind storm, more or less snowfall than expected, or turnover in personnel
which will have an effect on these figures. Some of the accounts which pay
for services that have a high fluctuation from year to year were given a
predictive amount higher than the running average to accomodate the
possible increase in expense.
EXPENDITURES
2015
Budget 2015 Actual
2016
Budget 2016 YTD
2017
Budget 2017 YTD
2018
Budget
Percent
Change
General Government 348,592$ 350,493$ 291,917$ 233,264$ 309,133$ 257,942$ 301,900$ -2.34%
Public Safety 471,290$ 482,547$ 467,891$ 406,650$ 466,250$ 365,620$ 476,950$ 2.29%
Health & Soc Service 1,500$ 1,159$ 1,000$ 666$ 1,000$ 300$ 1,000$ 0.00%
Public Works 273,097$ 264,034$ 281,825$ 187,897$ 288,450$ 197,355$ 286,950$ -0.52%
Leisure Activities 250,912$ 247,031$ 248,902$ 199,225$ 253,800$ 178,305$ 255,500$ 0.67%
Other Expenses 13,226$ 12,190$ 11,400$ 45,522$ 11,400$ 38,612$ 11,400$ 0.00%
Transfer to Capital Expenditure Fund245,000$ 245,000$ 235,000$ 235,000$ 150,000$ 327,822$ 225,000$ 50.00%
Gen Debt Service 203,977$ 203,977$ 216,810$ 216,810$ 311,593$ 207,846$ 258,033$ -17.19%
Sp Dist Debt Ret TIF 95,226$ 95,226$ 128,061$ 34.48%
Total Gen Fund Exp 1,807,594$ 1,806,431$ 1,754,746$ 1,525,034$ 1,886,853$ 1,669,028$ 1,944,794$ 3.07%

City of Weyauwega Budget 2018______________________________
19 City Budget 2018
General Government Expenditures
With some due dilligence we were able to keep costs down and make slight
cuts in some areas to offset the need for funds in other sections of the
budget. Wages for the council and mayor have not changed, but are now
coming out of the General Fund entirely. In the past these wages were split
between the General Fund and the Utility Funds. In other areas, averages
of expenditures were taken into account to make adjustments from the
previous year.
The hurricanes and flooding in the south have driven up the price of goods
in the US, raising the Consumer Price Index. Due to these costs, hourly
Public Works personnel will be receiving a 2% raise as a Cost of Living
Adjustment, with the rest of the city personnel having already received a
raise earlier in 2017.
GENERAL GOVERNMENT
2015
Budget
2015
Actual
2016
Budget
2016
Actual
2017
Budget
2017
YTD
2018
Proposed
%
Change
Council 5,250 6,032 5,250 9,985 5,600 10,374 10,000 78.57%
Mayor 2,000 1,922 2,000 3,418 2,500 3,256 4,500 80.00%
Administrator's Expenses 3,800 3,533 3,800 2,668 3,800 1,342 2,000 -47.37%
Administrator 50,000 53,557 51,000 46,783 52,000 39,115 46,000 -11.54%
Publications 3,000 3,540 2,700 1,034 3,000 1,020 1,500 -50.00%
Elections 3,000 1,854 4,000 3,707 4,000 1,364 2,500 -37.50%
Office Supplies 10,900 7,241 10,900 7,248 10,900 7,731 9,400 -13.76%
Assessment of Prop 4,900 6,178 4,900 4,758 5,000 3,460 5,000 0.00%
Treasurer 25,000 28,366 25,500 21,885 27,000 31,056 32,500 20.37%
Auditing 13,430 13,430 12,000 11,450 13,000 14,400 13,000 0.00%
Codification 2,500 1,192 1,500 1,192 1,500 1,192 1,500 0.00%
City Attorney - General 30,000 31,205 20,000 6,628 25,000 19,612 25,000 0.00%
City Attorney - Prosecution 102,000 101,141 40,000 17,801 25,000 27,210 25,000 0.00%
City Attorney - Railroad Prosecution 0.00%
Legal/Professional fees 0 0 - 0 0 0 0.00%
Municipal Building 20,400 20,400 25,000 30,703 50,000 27,773 39,500 -21.00%
Self Fund Health Ins/EAP/Screening2,000 1,075 1,500 1,066 1,500 1,293 1,500 0.00%
Prop & Liability Ins & Workmans Comp34,112 34,112 35,000 38,265 33,000 32,233 33,000 0.00%
Contingency 10,550 10,550 20,867 4,890 18,333 27,120 20,000 9.09%
Sales Tax 500 133 250 137 250 238 250 0.00%
Memberships,Dues&Fees 1,750 1,707 1,750 1,485 1,750 257 1,750 0.00%
Unemployment Ins. Assesment 500 0 - 0 0 0 0.00%
Clerk 23,000 23,325 24,000 18,161 26,000 21,563 28,000 7.69%
Tuition/Training Program 1,000 500 1,000 - 500 0 500 0.00%
Total General Government 348,592 350,493 291,917 233,264 309,133 271,612 301,900 -2.34%
City of Weyauwega Budget 2018______________________________
20 City Budget 2018
Public Safety and Social Services
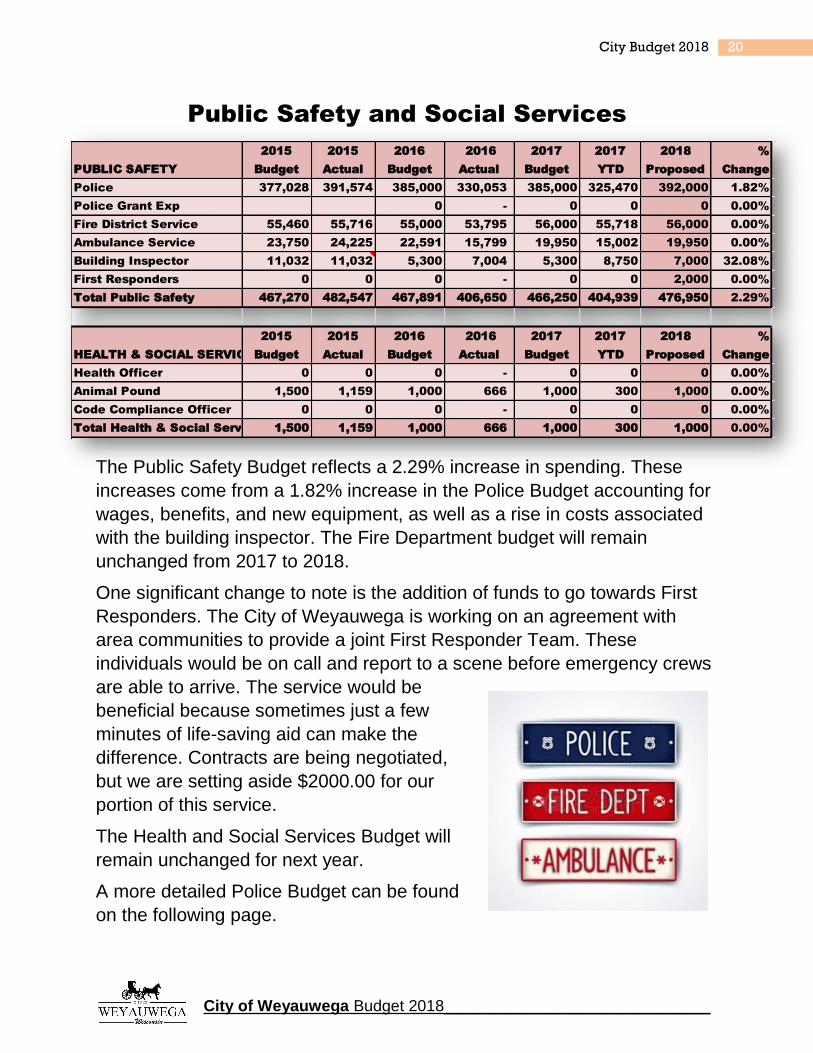
The Public Safety Budget reflects a 2.29% increase in spending. These
increases come from a 1.82% increase in the Police Budget accounting for
wages, benefits, and new equipment, as well as a rise in costs associated
with the building inspector. The Fire Department budget will remain
unchanged from 2017 to 2018.
One significant change to note is the addition of funds to go towards First
Responders. The City of Weyauwega is working on an agreement with
area communities to provide a joint First Responder Team. These
individuals would be on call and report to a scene before emergency crews
are able to arrive. The service would be
beneficial because sometimes just a few
minutes of life-saving aid can make the
difference. Contracts are being negotiated,
but we are setting aside $2000.00 for our
portion of this service.
The Health and Social Services Budget will
remain unchanged for next year.
A more detailed Police Budget can be found
on the following page.
PUBLIC SAFETY
2015
Budget
2015
Actual
2016
Budget
2016
Actual
2017
Budget
2017
YTD
2018
Proposed
%
Change
Police 377,028 391,574 385,000 330,053 385,000 325,470 392,000 1.82%
Police Grant Exp 0 - 0 0 0 0.00%
Fire District Service 55,460 55,716 55,000 53,795 56,000 55,718 56,000 0.00%
Ambulance Service 23,750 24,225 22,591 15,799 19,950 15,002 19,950 0.00%
Building Inspector 11,032 11,032 5,300 7,004 5,300 8,750 7,000 32.08%
First Responders 0 0 0 - 0 0 2,000 0.00%
Total Public Safety 467,270 482,547 467,891 406,650 466,250 404,939 476,950 2.29%
HEALTH & SOCIAL SERVICES
2015
Budget
2015
Actual
2016
Budget
2016
Actual
2017
Budget
2017
YTD
2018
Proposed
%
Change
Health Officer 0 0 0 - 0 0 0 0.00%
Animal Pound 1,500 1,159 1,000 666 1,000 300 1,000 0.00%
Code Compliance Officer 0 0 0 - 0 0 0 0.00%
Total Health & Social Services 1,500 1,159 1,000 666 1,000 300 1,000 0.00%

City of Weyauwega Budget 2018______________________________
21 City Budget 2018
Police Budget
Public Works Budget
2018 POLICE BUDGET DETAIL - Dept 52110
Category 2015 Budget 2015 YTD 2016 Budget 2016 YTD % Used 2017 Budget 2017 YTD 2018 Budget % Change
PERSONNEL SERVICES
Full Time Wage/Salary211,016.42$ 199,065.00$ 215,236.75$ 218,227.98$ 101.39% 210,061.63$ 156,279.00$ 216,153.00$ 2.90%
Part-Time/Temporary Wage32,500.00$ 29,556.00$ 32,500.00$ 49,873.57$ 153.46% 35,000.00$ 30,297.00$ 35,000.00$ 0.00%
Overtime 8,000.00$ 439.02$ 6,000.00$ ? #VALUE! 6,000.00$ 6,000.00$ 0.00%
TOTAL PERSONNEL SERVICES251,516.42$ 229,060.02$ 253,736.75$ 268,101.55$ 105.66% 251,061.63$ 186,576.00$ 257,153.00$ 2.43%
#DIV/0!
EMPLOYEE BENEFITS #DIV/0!
Social Security 15,594.02$ 14,059.13$ 15,731.68$ 16,438.93$ 104.50% 15,565.82$ 11,438.00$ 15,943.49$ 2.43% 6.20%
Medicare 3,646.99$ 3,288.00$ 3,679.18$ 3,844.62$ 104.50% 3,640.39$ 2,675.00$ 3,728.72$ 2.43% 1.45%
Retirement 20,320.88$ 20,325.00$ 20,425.97$ 20,823.30$ 101.95% 22,331.53$ 16,624.00$ 24,281.32$ 8.73% 9.75%
Health Insurance 38,000.00 33,628.72 39,000.00 30,373.07 77.88% 32,000.00 18,642.00 32,000.00 0.00% 118.00%
Life Insurance 150.00 203.28 150.00 185.06 123.37% 185.06 132.00 200.00 8.07%
Unemployment Comp - - #DIV/0!
Tax Shelter Annuity 2,500.00 2,500.00 2,000.00 2,000.00 100.00% 2,000.00 2,000.00 1,000.00 -50.00%
TOTAL BENEFITS 80,211.89 74,004.13 80,986.83 73,664.98 90.96% 75,722.81 51,511.00 77,153.53 1.89%
#DIV/0!
DEPARTMENT SUPPLIES #DIV/0!
Telephone 3,600.00$ 2,751.57$ 3,600.00$ 2,386.78$ 66.30% 3,600.00$ 1,193.00$ 2,000.00$ -44.44%
Cell Phones 3,600.00$ 1,681.00$ 3,600.00$ 3,575.80$ 99.33% 2,400.00$ 3,038.00$ 3,600.00$ 50.00%
Office Supplies 1,200.00$ 462.67$ 1,200.00$ 754.40$ 62.87% 1,500.00$ 819.00$ 1,500.00$ 0.00%
Postage Bulk Mail 200.00$ 247.23$ 300.00$ 258.25$ 86.08% 350.00$ 350.00$ 350.00$ 0.00%
Memberships 3,654.00$ 3,675.00$ 4,544.00$ 123.65% 4,500.00$ 4,500.00$ 4,500.00$ 0.00%
Operating Supplies 4,500.00$ 4,343.26$ 5,200.00$ 10,780.97$ 207.33% 5,750.00$ 5,711.00$ 5,750.00$ 0.00%
Other Operating Exp 1,094.42$ 836.41$ -$ 3,500.00$ #DIV/0!
Computer Supplies/Repairs3,000.00$ 3,137.77$ 3,500.00$ 1,476.52$ 42.19% 5,000.00$ 4,172.00$ 5,000.00$ 0.00%
Equipment Repairs/Parts3,000.00$ 345.29$ 3,000.00$ 1,138.70$ 37.96% 3,000.00$ 768.00$ 2,000.00$ -33.33%
TOTAL SUPPLIES 19,100.00$ 17,717.21$ 24,075.00$ 25,751.83$ 106.97% 26,100.00$ 20,551.00$ 28,200.00$ 8.05%
#DIV/0!
VEHICLE EXPENSES #DIV/0!
Gas/Oil/Grease 13,500.00$ 10,092.28$ 13,500.00$ 11,078.88$ 82.07% 13,500.00$ 6,232.00$ 10,000.00$ -25.93%
Vehicle Repairs / Parts4,500.00$ 4,198.82$ 4,500.00$ 14,775.32$ 328.34% 5,000.00$ 2,877.00$ 5,000.00$ 0.00%
TOTAL VEHICLES 18,000.00$ 14,291.10$ 18,000.00$ 25,854.20$ 143.63% 18,500.00$ 9,109.00$ 15,000.00$ -18.92%
#DIV/0!
GENERAL EMPLOYEE EXP #DIV/0!
Clothing/Uniform Allowance3,200.00$ 1,646.53$ 3,200.00$ 4,988.72$ 155.90% 5,000.00$ 4,614.00$ 5,000.00$ 0.00%
Seminars/Schooling 350.00$ 155.00$ #DIV/0! -$ #DIV/0!
Mileage 500.00$ 0.00% 150.00$ -$ 150.00$ 0.00%
Meals 152.86$ 500.00$ 252.46$ 50.49% 1,000.00$ 167.08$ 500.00$ -50.00%
Lodging 618.04$ 1,000.00$ 1,853.57$ 185.36% 1,500.00$ 312.00$ 2,000.00$ 33.33%
Training 5,000.00$ 1,637.95$ 3,000.00$ 5,832.00$ 194.40% 6,000.00$ 772.00$ 6,000.00$ 0.00%
TOTAL GENERAL EMPLOYEE EXP8,200.00$ 4,405.38$ 8,200.00$ 13,081.75$ 159.53% 13,650.00$ 5,865.08$ 13,650.00$ 0.00%
#DIV/0!
GRAND TOTAL 377,028.31$ 339,477.84$ 384,998.58$ 406,454.31$ 105.57% 385,034.44$ 273,612.08$ 391,156.53$ 0.01%

City of Weyauwega Budget 2018______________________________
22 City Budget 2018
Public Works
The city’s Public Works Department works hard to keep our utilities
running, streets maintained, and parks clean and landscaped. We expect
the Public Works Budget to remain steady, with a forecasted 0.52%
reduction in expenditures. This is due to a decrease in expected costs
associated with the yardwaste site. In years past, the site had to upgrade to
accommodate DNR regulations which we do not expect to cost as much in
2018. All full-time hourly Public Works personnel will see a 2% increase in
their base hourly rates to account for a cost of living increase. This is
evident in the line items relating to pay.
Capital Improvements
The City of Weyauwega sets aside a certain amount each year from
general revenues for the Capital Improvement Fund. This fund is used to
finance large-ticket items that are not a typical annual expense. For the
2018 fiscal year, we expect to purchase a new squad car for the Police
Department, tear down properties on Old Mill Street, and make upgrades to
South Street. The amount set aside for these expenses for 2018 is
$225,000.
PUBLIC WORKS
2015
Budget
2015
Actual
2016
Budget
2016
Actual
2017
Budget
2017
YTD
2018
Proposed
%
Change
Machinery & equipment 4,800 4,619 4,800 3,762 4,800 5,978 5,800 20.83%
Garage & sheds 3,000 2,550 3,000 2,229 3,000 2,771 3,000 0.00%
Street Laborer 46,000 47,664 30,000 15,689 32,000 20,311 32,900 2.81%
Public Works/Operations Supervisor 0 150 19,000 16,137 20,500 17,778 21,500 4.88%
Outside engineering service 2,757 2,757 5,000 2,150 5,000 2,117 5,000 0.00%
Street Maintenance 13,393 13,393 10,000 1,067 11,000 8,031 11,000 0.00%
Bridges & culverts 500 0 500 - 500 0 500 0.00%
Street sweeping 4,400 4,400 9,000 4,550 8,500 6,755 9,000 5.88%
Snow & ice removal 34,814 34,814 50,000 37,227 48,500 35,949 48,500 0.00%
Signs & markings 2,500 1,473 2,500 75 2,500 170 2,500 0.00%
Street lighting 51,082 51,082 47,500 36,804 48,500 36,294 48,500 0.00%
Sidewalks 2,000 0 1,000 8 1,000 0 1,000 0.00%
Storm sewers 1,000 1,555 515 - 1,000 2,106 1,000 0.00%
Parking lots 250 0 250 - 250 0 250 0.00%
Recycling 25,000 18,475 19,000 14,593 19,400 14,593 21,000 8.25%
Yard Waste Site 15,941 15,941 15,000 5,013 15,000 10,905 12,000 -20.00%
Weed Control 500 0 500 1,152 1,500 1,697 1,500 0.00%
Garbage collection 65,160 65,160 64,260 47,442 65,500 47,442 62,000 -5.34%
Total Public Works 273,097 264,034 281,825 187,897 288,450 212,897 286,950 -0.52%

City of Weyauwega Budget 2018______________________________
23 City Budget 2018
Library, Recreation, and Misc. Expenditures
The library submits their own
budget each year to prepare for
the costs of maintenance, wages,
programs, and new books. For
2018 the library anticipates a
reduction in shared library aid. To
offset this, cuts were made to
some areas and the city will
contribute $1200 as well.
We hope to begin the process of
upgrading playground equipment
at the city parks. The parks budget
was increased to begin the transition. A Comprehensive Outdoor
Recreation Plan (CORP) is in the final stages working towards completion
which will highlight public recreational spaces that need attention and plan
for the future. The budget for parks was increased slightly at 6.38% from
the previous year to ease into the upgrades that will take place.
LEISURE ACTIVITIES/EDUCATION
2015
Budget
2015
Actual
2016
Budget
2016
Actual
2017
Budget
2017
YTD
2018
Proposed
%
Change
Library 165,932 163,700 166,702 118,958 171,000 110,091 172,200 0.70%
Community center 1,500 0 1,500 - 1,500 157 500 -66.67%
Recreation - Tennis/Ball field 1,700 1,488 1,700 2,375 1,800 1,951 1,800 0.00%
Swimming Lake 51,704 51,704 48,500 50,347 49,000 44,540 49,000 0.00%
Other recreation 0 0 0 - 0 0 0.00%
Celebrations & entertainment 6,576 6,576 7,000 7,009 7,000 6,851 7,000 0.00%
Parks & playgrounds 23,500 23,564 23,500 20,536 23,500 22,099 25,000 6.38%
Total Leisure Activities 250,912 247,031 248,902 199,225 253,800 185,689 255,500 0.67%
OTHER GENERAL EXPENSES
2015
Budget
2015
Actual
2016
Budget
2016
Actual
2017
Budget
2017
YTD
2018
Proposed
%
Change
Regional Planning/Tourism 2,860 2,860 3,500 2,860 3,500 2,860 3,500 0.00%
Tree maintenance 7,166 7,166 4,000 - 4,000 2,161 4,000 0.00%
Zoning review 700 0 500 - 500 35 500 0.00%
TIF District 0 0 0 40,762 0 27,933 0 0.00%
Ads/Promotions/web site 1,200 2,164 2,000 1,900 2,000 2,811 2,000 0.00%
Industrial Development 0 - 0 0 0 0.00%
Citizen Survey 1,300 1,400 - 1,400 0 1,400 0.00%
Total Other Expenses 13,226 12,190 11,400 45,522 11,400 35,801 11,400 0.00%

City of Weyauwega Budget 2018______________________________
24 City Budget 2018
Debt
Debt stemming from borrowing for projects must be paid each year. The
City Hall project was funded by General Obligation Bonds which are paid
entirely from General Fund revenue (tax levy, shared revenues, user fees,
etc.) and is expected to be paid off in 2036. Payments in 2018 will be
$135,000 in principal and $71,388 in interest.
A separate General Obligation Bond was refinanced in 2010 which was
used to fund public works projects such as road resurfacing and utility
upgrades. Half of the principal payments for these bonds are paid from Tax
Incremental District 4, $2600 from the Water Fund, with the remainder
coming from the General Fund. This debt is expected to be completely paid
off in 2022.
2018 Debt Payment Schedule
MONTH/DAY PAYMENT PRINCIPAL INTEREST TOTAL AMOUNT
February 1, 2018 2003 GO Note $0.00
2010 GO Note $45,000.00 $6,645.00 $51,645.00
Monthly Totals $45,000.00 $6,645.00 $51,645.00
May 1, 2018 2013 Sewer Rev. Bond $258,107.00 $75,983.50 $334,090.50
2011 Water Rev. Bond $90,000.00 $39,449.00 $129,449.00
2016 GO - City Hall $135,000.00 $35,694.00 $170,694.00
Monthly Totals $483,107.00 $151,126.50 $634,233.50
August 1, 2018 2003 GO Note 0.00
2010 GO Note $2,940.00 2,940.00
Monthly Totals $2,940.00 2,940.00
November 1, 2018 2013 Sewer Rev. Bond $75,983.50 $75,983.50
2011 Water Rev. Bond $39,449.00 $39,449.00
2016 GO - City Hall $35,694.00
Monthly Totals $151,126.50 $115,432.50
Yearly Totals $528,107.00 $311,838.00 $804,251.00
GENERAL DEBT SERVICE
2015
Budget
2015
Actual
2016
Budget
2016
Actual
2017
Budget
2017
YTD
2018
Proposed
%
Change
Principal Long Term Notes 177,828 177,828 197,641 510,000 198,484 200,000 180,000 -9.31%
Interest Long Term Notes 26,149 26,149 19,169 272,002 113,109 7,846 78,033 -31.01%
Sp Dist Debt Retirement
Total General Debt Service 203,977 203,977 216,810 782,002 311,593 207,846 258,033 -17.19%

City of Weyauwega Budget 2018______________________________
25 City Budget 2018
Utility Budgets
2018 Water Budget
The 2018 Water Budget calculates how much the city forecasts to spend
next year by comparing the expenditures from previous years and factoring
any changes that may increase or decrease need. Expenditures from the
Water Budget include wages, benefits for employees, chemicals and
supplies, maintenance, and repairs. Expenditures are expected to be
$452,153.00, while revenues are expected to be $463,213.00. With
increased usage coming from increased production in the city’s industrial
sector, revenues are expected to increase from the previous year.
2015 Budget 2015 YTD 2016 Budget 2016 YTD 2017 Budget 2017 YTD 2018 Budget
Salaries / Wages 49,677.77$ 44,037.00 52,500.00$ 40,898.29$ 52,500.00$ 52,724.39$ 59,000.00$
Fuel / Power Purchased 42,423.00$ 42,170.69 44,000.00$ 37,993.89$ 44,000.00$ 33,387.70$ 48,000.00$
Chemicals Purchased 22,000.00$ 10,542.64 22,000.00$ 16,566.35$ 22,000.00$ 14,025.13$ 16,900.00$
Supplies / Expenses $14,700.00 24,154.53 $14,700.00 13,501.18$ $14,700.00 20,944.62$ $22,650.00
Hydrant Service 2,070.00$ 2,117.90 2,070.00$ 1,702.99$ 2,070.00$ 1,440.00$ 1,750.00$
Cross Connection Inspection -$ - 4,000.00$ -$ 4,000.00$ 3,675.00$ -$
Repairs Water Plant 21,500.00$ 21,661.15 21,500.00$ 21,500.00$ 7,235.70$ 7,250.00$
Transportation Water Dept 3,500.00$ 2,662.47 3,500.00$ 1,440.40$ 3,500.00$ 2,479.20$ 2,550.00$
Administration/Mayor-Council 47,009.82$ 44,883.04 40,000.00$ 30,591.28$ 40,000.00$ 31,439.54$ 37,000.00$
Office Supplies 4,350.00$ 4,563.31 4,350.00$ 3,703.26$ 4,350.00$ 3,187.56$ 5,350.00$
Outside Services 11,000.00$ 11,974.50 11,000.00$ 9,300.00$ 11,000.00$ 21,096.14$ 29,730.00$
Insurance Expenses 13,000.00$ 21,404.25 13,000.00$ 23,583.33$ 13,000.00$ 21,719.67$ 24,000.00$
Employee Benefits / Pension 325.00$ 34.19 325.00$ 32.92$ 325.00$ 32.65$ 9,875.00$
PSC Regulatory Expenses 500.00$ 368.36 500.00$ 441.33$ 500.00$ 383.44$ -$
Misc Expenses Water 2,450.00$ 9,671.16 2,450.00$ 8,247.18$ 2,450.00$ 9,467.31$ 9,200.00$
Capital Equipment Replacement 20,000.00$ 35,364.03 20,000.00$ -$ 20,000.00$ 22,723.00$ 10,000.00$
Principal Long Term Notes 82,171.00$ 82,171.00 82,171.00$ 87,338.00$ 82,171.00$ 1,503.00$ 90,000.00$
Interest Long Term Notes 87,438.78$ 87,420.79 87,438.78$ 43,292.36$ 87,438.78$ 148.17$ 78,898.00$
Total 424,115.37$ 445,201.01$ 425,504.78$ 318,632.76$ 425,504.78$ 247,612.22$ 452,153.00$
REVENUE 314,200.22$ 304,600.06$ 463,213.00$

City of Weyauwega Budget 2018______________________________
26 City Budget 2018
2018 Sewer Budget
The 2018 Sewer Budget calculates how much
the city forecasts to spend and bring in next year
by comparing the expenditures and revenues
from previous years and taking into account any
changes. Expenditures from the Sewer Budget
include wages, benefits for employees, chemicals
and supplies, maintenance, and repairs.
Expenditures are expected to be $953,760.34,
while revenues are expected to be $1,065,000.00. With increased flow
coming from increased production in the city’s industrial sector, revenues
are expected to increase compared to the year prior.
2015 Budget 2015 YTD 2016 Budget 2016 YTD 2017 Budget 2017 YTD 2018 Budget
Operator/Labor 124,157.88$ 100,638.41$ 126,994.22$ 103,468.83$ 126,994.22$ 112,632.53$ 138,000.00$
Power / Fuel for Pumping 4,620.00$ 2,804.95$ 4,620.00$ 2,619.15$ 4,620.00$ 2,603.80$ 4,500.00$
Power / Fuel for Aerating 26,305.00$ 21,972.57$ 26,305.00$ 7,112.16$ 26,305.00$ 39,544.55$ 40,500.00$
Chlorine 3,200.00$ 2,515.50$ 3,200.00$ -$ 3,200.00$ -$ -$
Phosphorus/Ferric 42,500.00$ 25,884.91$ 42,500.00$ 40,915.35$ 42,500.00$ 28,156.58$ 35,500.00$
Sludge Condition / Polymer 11,500.00$ 10,267.94$ 11,500.00$ 5,039.74$ 11,500.00$ 2,985.20$ 4,500.00$
Other Chemicals 10,000.00$ 445.25$ 10,000.00$ 7,288.49$ 10,000.00$ 3,794.46$ 6,000.00$
Other Operating Supplies / Exp 87,600.00$ 80,823.54$ 87,600.00$ 76,205.24$ 87,600.00$ 29,889.19$ 63,600.00$
Transportation 2,950.00$ 572.62$ 2,950.00$ 1,512.19$ 2,950.00$ 4,002.25$ 2,200.00$
Maint Sewage Collection System 31,000.00$ 3,922.13$ 31,000.00$ 3,029.62$ 31,000.00$ 1,448.71$ 31,000.00$
Maint Treat / Disp Plant Equip 30,000.00$ 10,473.90$ 30,000.00$ 1,780.55$ 30,000.00$ 8,970.00$ 30,000.00$
Maint Plant / Structure / Equip 5,000.00$ 6,559.18$ 5,000.00$ 2,012.05$ 5,000.00$ 2,409.43$ 5,300.00$
Billing Collection Account 14,000.00$ 12,560.27$ 14,000.00$ 11,214.17$ 14,000.00$ 11,249.20$ 14,000.00$
Admin / Gen Salaries Sewer 56,066.37$ 34,135.67$ 42,054.49$ 28,955.22$ 42,054.49$ 27,143.52$ 51,000.00$
Mayor/Council Salaries 2,900.00$ 2,900.00$ -$ 2,900.00$ -$ -$
Office Supplies / Expenses 4,500.00$ 3,295.52$ 4,500.00$ 4,395.33$ 4,500.00$ 4,601.65$ 4,500.00$
Outside Services 16,000.00$ 24,157.05$ 16,000.00$ 10,690.80$ 16,000.00$ 36,797.67$ 16,000.00$
Insurances 25,000.00$ 21,404.25$ 25,000.00$ 23,583.33$ 25,000.00$ 24,542.92$ 25,000.00$
Employees Pension / Benefits 325.00$ 34.20$ 325.00$ 32.93$ 325.00$ 32.65$ 325.00$
Misc. Expense Sewer 3,800.00$ 3,987.83$ 3,800.00$ 2,820.87$ 3,800.00$ 4,365.23$ 3,900.00$
Capital Equipment Replacement 75,000.00$ 42,486.68$ 75,000.00$ 35,410.74$ 75,000.00$ 28,706.34$ 75,000.00$
Principal Long Term Notes 215,000.00$ 215,000.00$ 225,000.00$ 225,000.00$ 225,000.00$ 200,000.00$ 253,613.96$
Interest Long Term 57,598.75$ 57,598.75$ 52,367.50$ 183,722.38$ 52,367.50$ -$ 149,321.38$
Total Expenses $849,023.00 $681,541.12 $842,616.21 $573,875.88 $953,760.34
Revenue 1,065,000.00$