Citi’s mission is to serve as a trusted partner to our
59
Transcript of Citi’s mission is to serve as a trusted partner to our


Citi’s mission is to serve as a trusted partner to our
clients by responsibly providing financial services that
enable growth and economic progress. Our core activ-
ities are safeguarding assets, lending money, making
payments and accessing the capital markets on behalf
of our clients. We have 200 years of experience help-
ing our clients meet the world’s toughest challenges
and embrace its greatest opportunities. We are Citi, the
global bank – an institution connecting millions of
people across hundreds of countries and cities.

032015CEO Message
2015 was a crucial year for China. It marked the end of the
12th Five-Year Plan period, and also a year as China’s eco-
nomic transition is making headway. Against this backdrop,
CCCL has worked hard in 2015 to dedicate resources to
generate the right long-term growth.
From a global context, 2015 was certainly a pivotal year for
Citi. Earning a net income of over US$ 17 billion, our per-
formance in 2015 became the best year since 2006. Asia
continues to be the largest contributor outside of North
America. In China, despite of a challenging environment,
we delivered operating revenue growth of 3.6% year-on-
year to RMB 5.67 billion. We have also continued to maintain
healthy regulatory ratios with the Capital Adequacy Ratio
standing at 15.54% - well above the regulatory requirement.
The Institutional Clients Group has maintained steady
growth throughout the year. We have continued combin-
ing local market understanding with global expertise and
market-leading product platforms in introducing solutions
and services for our clients in China. This paved the way for
a series of first-to-market cross-border treasury products
launch in 2015, notably the first Global RMB Netting Solution
nationwide in cooperation with a South Korean multination-
al, which now covers Korea, London, Hong Kong and Beijing.
Moreover, CCCL participated for the first time in the onshore
bond underwriting market in 2015. Acting as a Joint Un-
derwriter, our team underwrote a 3-year senior unsecured
bond with total volume reaching RMB 3 billion. Issued by the
Republic of Korea in the China Interbank Bond Market, this
bond also became the first RMB denominated sovereign
debt instrument issued by a foreign government in China.
This held milestone significance not only for our client and
CCCL, but also the broader China market.
On the Global Consumer Banking front, our team continued
to improve customer value propositions and enhance conve-
nience across service channels and platforms in 2015. With
Chinese consumers increasingly favoring digital channels,
we started recalibrating our focus to accelerate efforts and
investments in our digital capabilities, so to become a lead-
ing digital consumer bank. Our partnership with AIA bore
new fruit in 2015 – we jointly published the China Retirement
Readiness Insight Report. In addition to highlighting the
growing importance of sound financial planning ahead of re-
tirement, it allowed us to leverage the insights, and together
develop innovative products for China’s aging society.
We strive to succeed in every aspect of our operation in
China – be it serving clients, keeping the best talent or giving
back to our local communities. Our success over the past
year was reflected through the awards and recognitions we
received. These included being named “Best Global Bank” by
Asia’s top financial magazine The Asset, “Best Foreign Bank
Employer in China” by global employer branding company
Universum, as well as “China CSR Excellence Award” by the
China Philanthropy Times.
2015 was a year of transition as CCCL geared up for China’s
ongoing transformation. By laying a solid foundation, we
are confident that we are well-positioned to respond in ways
that are more meaningful and relevant to our clients’ and
customers’ changing realities. We believe we have the right
tools, strategy and talent to continue providing our clients
and customers with exceptional and innovative banking ser-
vices and solutions that are simple, convenient, and respon-
sible. Guided by or local insights, global expertise as well as
ongoing drive to innovate, we remain confident about our
long-term growth here.
Sincerely,
Christine Lam
Chief Executive Officer, Citi China
The values that guide our mission:
Common Purpose One team, with one goal: serving our clients and stakeholders
Responsible FinanceConduct that is transparent, prudent and dependable
IngenuityEnhancing our clients’ lives through innovation that harnesses the breadth and depth of our information, global network and world-class products
LeadershipTalented people with the best training, who thrive in a diverse meritocracy that demands excellence, initiative and courage
02 ANNUAL REPORT 2015

INSTITUTIONAL CLIENTS GROUP
GLOBAL CONSUMER BANKING
CORPORATE GOVERNANCE
GIVING BACK TO THE COMMUNITY
AWARDS AND RECOGNITIONS
AUDITORS' REPORT
CONTENT

06 07ANNUAL REPORT 2015 2015INSTITUTIONAL CLIENTS GROUP
Citi’s Corporate and Investment Banking arm is responsible
for the coverage of large Chinese corporates. We provide
comprehensive relationship coverage services to ensure the
best possible services and responsiveness to our clients.
In 2015, we supported clients across five continents through
our nine China Desks based in key cities around the globe.
This provides our clients with round-the-clock access to
Citi’s market-leading platforms in over 100 countries.
We also hosted multiple ‘China Day’ events in five countries
throughout the year to share with clients relevant insights
and updates on their related industries and economies. In
November, two ‘China Desk Network Days’ were organized
in Beijing and Guangzhou respectively. The events gathered
bankers from all our China Desks and provided a platform
for them to meet our clients’ headquarters executives and
explore new collaboration avenues.
Driven by institutional clients’ special needs, the Finan-
cial Institutions Group (FIG) and Public Sector Group (PSG)
provide comprehensive financial solutions to a wide
range of clients, including banks, insurance companies,
securities firms, fund managers, trust and leasing com-
panies, and sovereign wealth funds.
As the China market underwent economic slowdown in
2015, FIG and PSG clients’ trade financing needs declined
accordingly. In face of market uncertainties, the team invest-
ed tremendous effort to seize market opportunities so to
be able to continue booking trade assets and maintain our
market share.
After two years of preparation, a growing number of Chi-
nese insurance companies are now rapidly implementing
global asset allocation. This reflects these companies now
possess an expanding overseas asset, and are also mov-
ing toward investing in a diversified geography. Serving as
several major insurance companies’ global custodian bank,
while also retaining the largest market share in terms of
insurance QDII quota, we continue to leverage our global
platform to proactively update clients with timely market
information. We have also assisted our securities service
product partners in their efforts to improve the compre-
hensiveness, convenience, and efficiency of our custodian
service offering.
Global regulators have continued enhancing regulations
and standards for capital management in the banking
industry. In 2015, we have maintained active dialogue with
Chinese banks to share our understanding of new regulato-
ry requirements in different markets. This serves to better
support their capital plan establishment and take a more
comprehensive medium-to- long-term perspective.
Citi has traditionally been a leading financial services
provider to multinational corporations and committed to
promoting their success in China. Our focus is on holistic
client advisory combined with strong execution around
our core banking products: debt financing, transaction
banking, and markets activities.
Our leadership is proven by our client satisfaction indices,
which has stayed well-above industry norms and our busi-
ness also continues to grow. We help clients raise funds from
capital markets and reduce transactional risks by means of
innovating and implementing cross-border solutions, as well
as continually leveraging our global network and expertise.
We maintained a high level of focus on further developing
relationships with emerging markets-parented clients. We
also continue to invest heavily in our traditional business by
supporting subsidiaries of multinationals headquartered in
the United States, Europe and Japan.
During 2015, we also hosted forums by vertical industries,
functions and geographies. These forums provided essential
platforms for our clients to discuss their most current chal-
lenges and needs, as well as gain strategic investment and
corporate banking market insights and ideas.
In 2015, the Institutional Clients Group continued combining our local insights and global expertise. A series of new solutions and services in China were launched. Notably, the first Global RMB Netting Solution was rolled out nationwide.
We also participated for the first time in the onshore bond underwriting market in 2015 - acting as lead Underwriter in the Republic of Korea panda bond issuance. This was also the first sovereign panda in China.
INSTITUTIONAL CLIENTS GROUP
Financial Institutions Group (FIG) and Public Sector Group (PSG)
Corporate and Investment Banking
Global Subsidiaries Group

08 09ANNUAL REPORT 2015 2015INSTITUTIONAL CLIENTS GROUP
Treasury and Trade Solutions
MarketsSecurities Services
Citi’s Treasury and Trade Solutions (TTS) delivers cash
management and trade solutions that help clients
streamline and automate processes, mitigate risk and
expand their reach.
We have launched a series of first-to-market cross-border
products in 2015 by combining our in-depth local market
understanding - including insights into China’s move toward
deregulation - as well as unique and market-leading global
product platforms. By leveraging opportunities presented by
the incremental reforms in the Shanghai Free Trade Zone
(SFTZ), we are also able to efficiently connect our clients’
liquidity in China with the rest of the world. In addition, we
actively provided local corporate clients with a number of
trade solutions through our global network and platforms
for trade finance and services. With Citi’s rich business
experiences in other regions and countries, we were also
able to help our clients mitigate increasing market and
credit risks during recent years by actively providing local
corporate clients with various trade solutions while also
supporting the local economy’s development.
In 2015, Citi China became the only foreign bank to receive
the “Shanghai Financial Innovation Second Prize” awarded
by the Shanghai government for our Cross-border Treasury
Management Innovation. In May, the TTS Trade Product
team was also recognized by the Shanghai Financial Associ-
ation for its outstanding work on driving Uniform Practices
for Shanghai Interbank Forfeiting trade businesses and
received the “First Prize in Shanghai Financial Reformation,
Development and Excellence”.
Shanghai (Pilot) Free Trade Zone (SFTZ) and Na-
tionwide Programs
Citi China continued to maintain our market leadership
position in both the SFTZ and across the country. We
have launched several industry-leading solutions for
multinational clients, Chinese subsidiaries and local clients.
Notable 2015 Examples:
Samsung Cooperation: We launched the first Global RMB
Netting Solution nationwide in cooperation with Samsung,
which covers Korea, London, Hong Kong and Beijing. This
marked a major milestone as the RMB netting project expanded
from initially within the SFTZ to the rest of the country.
As one of the top Markets teams among international
banks in China, Citi offers a broad range of market-
leading and innovative financial products to corporate,
institutional, government and public sector clients.
In recent years, with many Chinese companies showing a
large interest in going global, the Markets team has been
focused on enabling them to do so and begun offering total
solutions to these internationalizing Chinese companies.
In 2015, we helped various corporates set up global
risk management platforms, manage foreign exchange
exposures, and also help them conduct structured finance
and customized structured solutions in emerging markets.
Meanwhile, Citi China also partners with other banks and
financial institutions including mutual fund, insurance,
pension and sovereign fund companies, to leverage on each
other’s strengths to bring added benefits to customers by
offering more comprehensive solutions tailored for their
unique needs.
In the 2015 survey by the finance publication Risk and IFR,
our work was recognized as the ‘Derivatives House of the
Year.
CCCL was also Lead Underwriter in the Republic of Korea
panda bond issuance, which is also the first sovereign panda
in China.
Securities and Fund Services (SFS) offers a large portfo-
lio of products and services including custody, fund ser-
vices, prime finance and futures, as well as escrow and
related services, and agency and trust. We also support
international securities trading and investment activities
of leading institutions through efficient receipt, delivery
and safekeeping of securities as well as the related cash
and FX functions.
All these services are offered to a wide range of
sophisticated investors, including mutual funds, pension
funds, hedge funds, banks, and insurers. We have substantial
market share in China QFII/RQFII and QDII custody business
and possess a rich local market service experience and
localized service teams.
Global industry surveys consistently rank us as a premier
choice for custody, clearing, agency and trust services in
more markets than any other bank.
We also maintain close communication with both multina-
tional and Chinese corporate clients. Through publications
and conferences, we proactively provide them with the
latest market trend information, industry best practices as
well as Citi’s in-house thought leadership on treasury man-
agement on a regular basis.
Foreign Currency Cross-Border Pooling for Multination-
als: We provided services such as POBO/ROBO and Netting
to a number of world leading multinationals – including IBM
and BASF – to support their realization of foreign currency
cross-border pooling. This not only helped elevate overall
economic efficiency, but also delivered cost savings. Citi
China and BASF’s two-way foreign currency cross-border
pooling was also awarded the highly prestigious “Tao Zhu
Gong Prize for Best Cash Management Deal” .
Sharp Rise in Cross-Border Transactions: In 2015, Citi Chi-
na saw an exponential rise in cross-border transactions. In
particular, Citi Beijing was ranked top place among all local
and foreign banks in cross-border transactions earnings.
Implemented over 60 RMB and Foreign Currency
Cross-Border Structure: By the end of 2015, Citi China
carried out over 60 RMB and Foreign Currency Cross-border
Pooling, POBO/ROBO and Netting structure within the SFTZ
as well as across China.
Citi China’s IBM Recognized as Representative Case
Study: In November, Citi’s FCY XB Pilot Program for IBM
was recognized as a “Representative Case” , which was pre-
sented to Premier Li Keqiang during his SFTZ trip to mark
its two-year anniversary.
Top Recognitions from Leading Financial Publications:
Citi China was recognized by the Lujiazui Magazine as “The
Best Cross-border Treasury Management Bank”. The Top
CFO Magazine also recognized Citi as “The Best Global Cash
Management Bank”.
The solutions outlined above aim to help customers
mitigate risks, reduce costs and effectively manage foreign
exchange exposure. This ultimately supports our customers
to improve treasury efficiency.
Our ongoing efforts throughout 2015 also earned us a
number of prestigious industry recognitions. Citi China’s
SFTZ branch was recognized as the “Outstanding Enterprise
” by the SFTZ committee. The Shanghai Financial Labor
Union also awarded the FCY XB Pilot Program handled by
the SFTZ branch with the “2015 Outstanding Innovative
Case Award”.
To ensure our existing and potential customers can accu-
rately identify the right business opportunities, Citi China
continues to provide them with the latest SFTZ as well as
national industry development updates.

10 11ANNUAL REPORT 2015 2015GLOBAL CONSUMER BANKING
In 2015, Citi's Global Consumer Bank (GCB) continued improving its customer value propositions while enhancing convenience across its service channels and platforms. At the same time, we have continued to uphold the bank’s unique global network, premium brand, distinctive products and services. These were all essential in our ongoing drive to serve the affluent and emerging af-fluent customer segments in top-tier cities by delivering a remarkable experience through industry-leading products and services, next genera-tion retail formats and world-class digital channels.
Throughout the past year, Citi Chi-na continued to roll out the “Blue Wave” brand campaign in Beijing and Shanghai with a focus on communi-cating our credit card value proposi-tions and offers. We have also placed particular emphasis on highlighting Citi Credit Cards’ superior privileges for overseas spending. Compared to the previous year, our mother brand preference has increased by 7%.
Citi’s Wealth Management Forum (WMF) is a well-estab-
lished advisory platform that features insights from Citi
experts and leading global fund houses.
By providing unique opportunities to better understand eco-
nomic and investment trends, as well as a chance to interact
with seasoned investment experts, the advisory platform
has become vital in allowing our clients to tap into exclusive
insights and updated investment advice - something that is
particularly important during current market uncertainties.
64 events reaching over 25,000 clients were held between
2010 and 2015. In 2015, ten WMFs were organized and over
4,378 clients attended. The average customer satisfaction
rate for 2015’s WMF reached up to 97%.
In 2015, we fully embraced the use of various digital
channels to enhance engagement with our key stakeholders
during the events. Through leveraging WeChat Key
Opinion Leaders (KOLs), we were able to drive greater
event promotion and increase our brand awareness. We
also adopted the use of Digital Kiosk at the event to boost
interaction with attendees. Finally, leveraging cutting-edge
iPad registration and offering real-time WeChat interactions
between attendees and speakers, we were able to create
new and effective touchpoints with our key stakeholders
this year.
Wealth Management Forum
Citi-AIA Bancassurance Partnership
GLOBAL CONSUMER BANKING

12 13ANNUAL REPORT 2015 2015
Credit Cards
Digital Acquisition
We have witnessed a shift in customers’ behaviors as
China undergoes one of the fastest and most compre-
hensive digital disruption of any markets in the world.
To deliver service offerings that are contemporary and
meaningful for our customers, while at the same time
allowing us to better reach potential customers, we have
launched a number of digital channels in 2015.
We have begun working with Wacai.com, a new aggregator
in May. In the same month, we began displaying digital ads
on top China online portal websites such as MSN China and
Sina.
Throughout the past year, our online customer acquisition
number has increased by 20%. Looking at 2016, we are set
to continue exploring innovative solutions with easy-to-use
online processes to better serve our customers, and deliver
a truly digital and smart experience.
Continually enhancing our digital capabilities is one of our
major priorities and we are confident that digital banking
usage will achieve exponential growth as our customers’
preference shift toward the digital channels.
Citi works tirelessly to serve as a trusted financial ad-
visor and strategic partner to each and every one of our
small and medium private enterprises (SMEs) customer.
In 2015, Citi Commercial Bank China (CCB) grew steadily and
acquired new clients as well as achieved growth in customer
deposits and credit balance of assets.
Leveraging Citi’s unique global network, we offer a wide
range of global cash management services and strong
local market intelligence support in both the domestic and
overseas markets. As a result, CCB has been particularly
recognized by globally-minded Chinese companies as an
important partner of choice. We have also supported for-
eign enterprises in their China business expansion by offer-
ing various cross-border financing solutions, including the
Approval Elsewhere Program (AEP).
In 2015, we have been focused on bringing innovation and
world-class services to our targeted clients. Throughout the
year, several clients opened accounts in our Shanghai Free
Trade Zone (SFTZ) Sub-branch and we were able to better
support these clients by effectively managing the RMB capi-
tal through FT accounts and Citi’s global platform.
One of the new highlights during China’s economic transition
is the service sector. The CCB has been focused on exploring
Commercial Bank more tailor-made solutions to better serve these players
and tap into this sector. In 2015, a number of travel agencies
and trading clients have utilized our payment solutions and
products to reduce their cross-border transaction costs and
maintain healthier cash flows. For clients whose companies
were undergoing rapid business expansion, our Host-to-
Host solutions offered essential support throughout the
year via automatically linking the online banking platform
with companies’ ERP. We have also provided clients with
sophisticated and comprehensive reconciliation reports.
This is part of our overall drive to enhance companies’ cash
management efficiency through improving automation,
connectivity and security.
In order to better navigate the market landscape and es-
tablish sustainable business strategies, it is vital that our
SME customers are kept apprised of market movements.
Throughout 2015, we partnered with a number of SMEs and
industry associations to deliver different events, including
trainings, seminars and networking events focusing on cash
management, supplier finance management and “Going
Overseas” strategies. We have also provided existing clients
with ongoing training programs that offered Citi’s insights
on the latest market hotspots, including RMB trend and For-
eign Exchange, Cross-border Cash Management, E-Banking
Utilization as well as Free Trade Zone policies and strategies.
All of these aimed to provide greater benefits to our clients
and they have been well-received.
GLOBAL CONSUMER BANKING

14 15ANNUAL REPORT 2015 2015
At Citi, we aspire to the highest standards of corporate governance and ethical conduct. We act in the best interests of all our stakeholders, maintain the highest ethical standards, and ensure full compliance with the laws and regulations that govern our company.
As of December 31, 2015, there were 9 directors in total:
1) 4 Non-Executive Directors;
2) 3 Executive Directors ; and
3) 2 Independent Directors. Executive Directors
Besides 3 Executive directors, CCCL’s headquarter had 11
additional senior managers approved by the China Banking
Regulatory Commission (CBRC). Details regarding directors
are as follows:
Executive Directors
Independent Directors
Non-Executive Directors
Chairman/Director
Director
Director
Director
Director
Director
Director
Independent Director
Independent Director
Andrew Au
Daisy Yao
Tim Sedgwick
Agnes Liew
Anand Selvakesari
Piyush Agrawal
Weber Lo
Stephen Long
Zhe Sun
Legal Representative
Chief Financial Officer
Chief Risk Officer
Approved by CBRC on September 2, 2015
Approved by CBRC on September 2, 2015
Approved by CBRC on December 29, 2015
Approved by CBRC on December 15, 2015
Board Composition
The directors of CCCL fully understand the fiduciary respon-
sibilities of a banks’ Board are more important than those of
non-financial corporations. Each and every director per-
formed his/her duties diligently. They have actively partici-
pated in Board meetings, reviewed Board meeting materials,
had robust discussion and raised valuable comments and
suggestions to enhance the Bank’s business operation and
to ensure Bank’s healthy and sustainable development.
In 2015, CCCL held 4 Board meetings at an average of once
every quarter. The Board resolved or heard the reports of a
total of 64 matters (including 35 resolutions and 29 reports),
reviewed and discussed the internal audit quarterly report,
capital adequacy compliance plan and policy, stress test
plan, various risk limits, continuity of business report and
plan, information and technology strategy, material related
party transactions, etc. In addition, the Board has exercised
10 written resolutions to 10 key matters.
During the intersession of the board meetings, CCCL also
provided 9 newsletters to the Board in terms of CCCL’s
monthly/quarterly financial information, regulatory inspec-
tion, and other important information.
As of the end of December 2015, CCCL has two indepen-
dent directors, i.e., Mr. Stephen Long and Mr. Zhe Sun.
Mr. Stephen Long is the voting member of the Audit
Committee, the Risk Management Committee and the
Related Party Transaction Committee under the CCCL
Board, and also chairs the Audit Committee. Mr. Stephen
Long attended all the Board meetings and the relevant
committee meetings, and was involved in the consider-
ation and approval of the related matters.
Mr. Zhe Sun is the voting member of the Risk Man-
agement Committee and the Related Party Transaction
Control Committee, and he is also the chairman of the
Related Party Transaction Control Committee. Mr. Zhe
Sun attended all the Board meetings and relevant com-
mittee meetings and was involved in the consideration
and approval of the related matters.
During the intersession of the Board meetings, the inde-
pendent directors kept themselves abreast with CCCL’s
monthly financial information through CCCL’s newsletters.
Furthermore, the independent directors have issued their
Independent Directors
written opinions on all material related party transactions
reviewed under the Board. The independent directors
have actively participated in the decisions of the Board
and provided their independent opinions.
CCCL does not have a board of supervisors, but has a
single supervisor designated by the shareholder.
In 2015, the supervisor of CCCL, Mr. Mark Hart per-
formed his duties diligently and attended all of the Board
meetings, and issued confirmation letters to the meetings
he attended accordingly. In addition, Mr. Hart supervised
the Bank’s financials and the performance of directors
and senior management personnel. The supervisor also
provided opinions to the matters in relation to the 2014
audited financials, the performance of directors and
senior management personnel and their performance
relating to management of liquidity risk.
Supervisor
Upholding World-Class Corporate Governance
Upholding World-ClassCorporate Governance

16 17ANNUAL REPORT 2015 2015
As of December 31, 2015, there were four professional com-
mittees under the CCCL Board. These were:
In 2015, the four special committees held in total 13 meet-
ings, reviewed 35 motions and heard 68 reports.
Each of the four committees effectively operates with dis-
tinct division of responsibilities and has provided profession-
al advices and suggestions in terms of audit, risk manage-
ment and related party transaction control. They provided
solid ground for the Board so that the Board can review and
discuss the matters correctly and efficiently.
The senior management team of the Bank has performed
an active and leading role in optimizing the Bank’s corporate
governance, expanding the Bank’s footprint, enhancing the
Bank’s performance and risk management, and promoting
the Bank’s reputation. Therefore, they have formed an
effective and strong framework of corporate governance
and of the Bank’s development in coordination of interests
demanded from various stakeholders.
Moreover, maintaining a comprehensive communication
system with Directors and regulators was consistently
achieved by senior management. In terms of communica-
tion with Directors, besides reporting the Bank’s progress in
Board meetings, senior management also updated Directors
on certain important matters relating to the Bank’s business
and operation from time to time, including monthly financial
information. In terms of communication with regulators, se-
nior management disclosed CCCL and Citigroup’s business
and operating information to regulators in various ways and
these communications included reporting the internal and
external inspections, audits, and relevant corrective actions.
Through effective communication, Directors were kept
abreast of the overall operations of the Bank and the latest
regulatory trends, and regulators, internal control and an-
ti-fraud could be timely informed of the Bank’s business and
provide comments and guidance in response.
In 2015, the team will continually keep up to update with the
relevant laws and regulations and the regulator’s require-
ments, constantly procure the enhancement and optimiza-
tion of corporate governance work of the Bank, balance the
interests of the Shareholder and other stakeholders, and
further deepen the Bank’s corporate governance practices,
to ensure the Bank has sustainable growth.
Four Professional Board Committees Composition
(a)
(b)
(c)
(d)
an Audit Committee established on June 13, 2007
a Related Party Transaction Control Committee estab-
lished on June 13, 2007
a Risk Management Committee established on Septem-
ber 12, 2007
a Remuneration Committee established on January 10,
2014
Senior Management
Upholding World-Class Corporate Governance
Stephen Long
Weber Lo
Zhe Sun
Piyush Agrawal
Andrew Au
Andrew Au
Andrew Au
Andrew Au
Weber Lo
Agnes Liew
Agnes Liew
Stephen Long
Daisy Yao
Stephen Long
Agnes Liew
Simon Nie
Lili Qin
Zhe Sun
Tim Sedgwick
Marine Mao
Lili Qin
Daisy Yao
Alex Lee
Independent Director
Approved by Board on November 5, 2015
Approved by CBRC on December 15, 2015
Approved by Board on November 5, 2015
Approved by CBRC on September 2, 2015
Approved by Board on December 7, 2015
Approved by Board on December 7, 2015
Independent Director
Independent Director
Independent Director
Independent Director
Audit Committee
Remuneration Committee
Related Party Transaction Control Committee
Risk Management Committee
Chairman
Chairman
Chairman
Chairman
Committee Voting-Member
Committee Voting-Member
Committee Voting-Member
Committee Voting-Member
Committee Voting-Member
Committee Voting-Member
Committee Voting-Member
Committee Voting-Member
Committee Voting-Member
Committee Voting-Member
Committee Voting-Member
Committee Non-Voting Member
Committee Non-Voting Member
Committee Voting-Member
Committee Non-Voting Member
Committee Non-Voting Member
Committee Non-Voting Member
Committee Non-Voting Member
Committee Non-Voting Member

18 19ANNUAL REPORT 2015 2015
The Audit Committee resolved 11 motions and heard 11 re-
porting items, and returned during the intersession of meet-
ings. In addition, to ensure timely and effective communi-
cation with external auditors, our external auditors were
invited to participate in each Audit Committee meeting.
KPMG exchanged its view on Bank’s operation with commit-
tee members and also shared regulatory focus and market
trends, which helped to better equip the Audit Committee
in their decision on Internal Audit Committee motions. The
resolutions made by Audit Committee include: 2014 internal
audit work summary, 2015 internal audit plan, extension of
appointment of external auditor, update of internal audit
Charter, and quarterly reports of internal audit.
The Related Party Transaction Control Committee had
4 quarterly meetings, with an average attendance rate of
95%. Those voting-members who could not attend the
meeting also authorized other voting members to present
and vote on their behalf by issuing power of attorney be-
fore the meeting. The Committee resolved 12 resolutions
and heard 3 reporting items. In 2015, the Committee con-
sidered and confirmed a list of all related parties of CCCL,
reviewed new related party transactions and the intra-group
payments under intra-Citi outsourcing agreements in 2015.
When the matters subject to Committee’s discussion in-
volves any conflict of interest, the relevant voting member
would abstain from voting on such matters. The Commit-
tee’s work ensured our compliance with regulators’ require-
ments.
The Risk Management Committee has held 4 meetings and
the average rate of personal attendance of voting-members
of the Committee reached 90%. Those voting-members
who could not attend the meeting also authorized other
voting members to present and vote on their behalf by
issuing power of attorney before the meeting. The Commit-
tee made 10 resolutions and heard 54 reporting items. Risk
portfolio seasonal report, classified portfolios, NPLs and loss
provisions, and key risk limits against actual exposures were
reviewed at each Committee meeting. In addition, in 2015,
Risk Management also paid attention to credit card portfolio,
derivative risk assessment and stress test, and continued to
focus on the following key risk areas facing CCCL according
to regulatory requirement and market changes: reputation
risk, information technology risk, fraud case prevention and
outsourcing risk, etc.
The Remuneration Committee has held 1 meeting and the
average rate of personal attendance of voting –members
of the Committee reached 100%. The Committee made 2
resolutions on 2014 Performance Linked Compensation and
2015 Salary Increase Budget.
GIVING BACK TO THE COMMUNITYRisk Management and Internal Control
prudent and dependable. Though it has also evolved from
traditional philanthropy and volunteering to “More than
Philanthropy”, that is to strategically target challenges we
can help address as a business and is fueled by engagement
of Citi’s employees.
In pursuing our citizenship agenda in China, we continue
to consider the viewpoints of our stakeholders, the lessons
of Citi’s experiences and the risks and opportunities of our
business. Through harnessing the resources and expertise
of Citi China and the Citi Foundation, we remain committed
to delivering innovative solutions and positive impact to the
communities in which we live and work.
In 2015, Citi China supported 13 community programs
focusing on four key areas: Inclusive Finance , Financial
Capability , Youth Economic Opportunities and Enterprises
Development .
Citizenship is core to Citi and a responsibility shared by
all of our businesses, clients, suppliers and communities.
It is embedded in our mission and culture, and is brought
to life by our employees who work to promote social
and economic progress to improve the lives of people in
low-income communities around the world.
In support of the Citi Foundation, much of our citizenship
work focuses on promoting economic progress and im-
proving the lives of people in low-income communities by
investing in efforts that increase financial inclusion, catalyze
job opportunities for youth, and reimagine approaches to
building vibrant cities.
Our approach has always been rooted in our commitment to
Responsible Finance – business conduct that is transparent,
GIVING BACK TO THE COMMUNITY

20 21ANNUAL REPORT 2015 2015
Sponsored and led by Citi, the CMA became one of the first to introduce and establish such an award here in China. This truly reflected the high level of importance Citi attaches to corporate social respon-sibility. I have also had the opportunity to learn more and also participate in Citi’s citizenship programs and activities both here in China and worldwide. I would like to take this opportunity to express my gratitude for Citi’s ongoing commitment to citizen-ship. I also hope Citi will continue their efforts in this area so to achieve new heights.
Du Xiaoshan, Deputy Chairman of China Association of Microfinance
Over the past 200 years, Citi China has helped our clients
meet the world’s toughest challenges and embrace its
greatest opportunities. Leveraging our expertise, we are
also committed to supporting disadvantaged groups and
facilitating the development of Inclusive Finance.
Microfinance is widely acknowledged as one of the best
and most effective means to driving Inclusive Finance and
enabling low-income individuals, families and communities
to overcome poverty. This forms the cornerstone to improv-
ing standards of living for those in need and driving forward
economic progress.
Case Study: China Banking Association-Citi Mi-
croentrepreneurship Awards
Being the leading corporate supporter of microfinance in
China, Citi China has in its eleventh year supported the Citi
Microentrepreneurship Awards (“CMA”) program. Estab-
lished in 2005, the program is committed, at a national
level, to recognize successful microentrepreneurs and
outstanding microfinance practitioners. It also raises aware-
ness of the role microfinance plays in increasing access to
finance and poverty alleviation for disadvantaged popula-
tion. Through the program, Citi also aims to accelerate the
implementation of relevant policies and continually improve
China’s financial inclusion system.
Inclusive Finance
2015 Highlights
2015 marked the 11th annual CMA in China. The awards
ceremony was held in Beijing and was joined by over 300
microfinance practitioners and other supporters to com-
mend outstanding microentrepreneurs and institutions in
the microfinance field.
During the ceremony, the 2015 Chinese Microfinance Indus-
try Development Report was also officially launched, which
featured 82 microfinance institutions, including analysis on
their organization background and governance, to financial
performance and social contribution, and their innovation
on microfinance products and services. It also summariz-
es the state of development of the Chinese microfinance
industry and different types of microfinance organizations,
and analyzes trends of inclusive finance and microfinance
industry in China. Furthermore, for the first time, the Micro-
finance Institutions Case Studies Collection was also pub-
lished to summarize the sector’s previous successful experi-
ences and serve as a reference for the next ten years.
In addition to the two highlight awards – the Microfinance
Institution of the Year and the Microentrepreneur of the
Year - the 2015 CMA program also awarded 50 individual
awards, as well as five categorical institutional awards for
eight microfinance institutions.
using the new mobile phone system for daily operations,
which has helped clients save 10-30% time when applying
for loans. Furthermore, it has boosted credit officers’ effi-
ciency by 15-30% when conducting loan interviews.
As a social enterprise that focuses on providing microfinance support to China’s low-income rural areas, the CFPA Microfinance has always main-tained a close partnership with the Citi Foundation. We were also one of the direct beneficiaries of Citi China’s strategic support to the microfinance sector. Through Citi Foundation’s long-term support, we were able to transition from a project based non-profit microfinance institution into a professional microfinance service provider. In addition, as the Foundation helped us enhance our organization-al capacity as well as provide ongoing support to our financial educational programs, we were able to broaden our impact and directly serve almost a million low-income people in rural areas.
Liu Dongwen, Deputy Secretary General of China Foundation for Poverty Alleviation, General Manager of CFPA Microfinance
Case Study: CFPA Microfinance Inclusive Finance
Innovation and Capacity Building Program
Established at the end of 2008, CFPA Microfinance is an
NGO Microfinance Institution (NGO MFI) under the China
Foundation for Poverty Alleviation (CFPA). Its mission is to
provide financial services to disadvantaged population -
many of whom live in remote rural areas and have never
been included into the financial system.
The Citi Foundation began supporting the CFPA Microfi-
nance (CFPA MF) since 2010 to advance its organizational
capacity by developing or improving its information system,
risk management, training, as well as providing financial
education to clients.
At that time, it had a client base of 40,000. However, over
the years, CFPA MF has become a full-fledged leading mi-
crofinance institution in China with over 320,000 clients by
the end of 2015.
2015 Highlights
With Citi’s support, CFPA MF was able to develop and equip
all local staff with a mobile system on loan management.
Despite adding 35 new branches and 80,000 more new cus-
tomers, PAR over 30 days of loans remained below 1% after
adopting the new system. All 1,200 loan officers are now
GIVING BACK TO THE COMMUNITY

22 23ANNUAL REPORT 2015 2015
To effectively compete for economic opportunities and
succeed in the 21st century economy, young people will
require a mix of education, employability, entrepreneur-
ship, and leadership skills.
The Citi Foundation is focused on programs that help young
people, especially those from disadvantaged families, link
education goals with leadership skills training, profession-
al networks, and onramps to employment. This serves to
increase the number of low-income youth, aged between
16-25, to join the workforce or start an income-generating
business.
Case Study: Citi-BN Vocational School Program
Established in 2005, BN Vocational School (BNVS) is China’s
first tuition-free, non-profit charitable vocational school
offering migrant youth from disadvantaged families with
3-year formal vocational education. All expenses during the
three years’ study are totally free of charge.
Citi Foundation began supporting BNVS since 2011. Through-
out 2014-2015, we have focused on supporting its capacity
building efforts. With an aim to further promote its model
in China so more disadvantaged youth can be benefited,
Citi Foundation has helped BNVS to summarize its success-
ful experiences during the past ten years so it can better
demonstrate their longstanding efforts in Citi Foundation
also provided provided key support to allow the organization
to overcome challenges during its ongoing development
process.
Youth Economic Opportunities
For many individuals, the abilities to use financial prod-
ucts, establish financial plans, work toward achieving
their financial goals, and develop strategies for preserv-
ing their financial position during times of both economic
prosperity and instability are critical in attaining eco-
nomic success.
As hundreds of millions of people gain access to formal
financial services and become financially included for the
first time in their lives, investments into efforts that help
these individuals build financial capability and adopt positive
financial behaviors are more important than ever.
Providing effective and impactful financial education to
adults as well as empowering children and youth to form
sound financial habits have become vital components to our
philanthropic investment in China.
Case Study: The Aflateen Youth Program
The Aflateen Youth Program is an internationally acclaimed
financial education program. It aims to cultivate financial
capability in youth aged between 16-25 by equipping them
with financial knowledge and social skills through interactive
learning and activities. In 2012, Citi Foundation began sup-
porting the Shanghai Better Education Development Center
(Be Better) to bring the program to China. By the end of
2015, the program covers 12 cities in China including Beijing,
Shanghai, Nanjing, Shenzhen, Chengdu, Guangzhou, Gui-
yang, Xi’an, and Suzhou. The program has already reached
over 30,000 youth to date.
Financial Capability
2015 Highlights
The Aflateen Program’s flagship “Financial Education Makes
Better Future” Carnival took place in Beijing on December 12,
2015. During the event, the 2015 National Youth Financial Edu-
cation Research Report was also published, which provided key
stakeholders with the program’s latest updates. The program
continues to focus on supporting youth, mostly from voca-
tional schools, to better thrive in cities by nurturing a positive
attitude and entrepreneurial spirit. We hope to empower them
to have the confidence to secure career opportunities, learn
new skills, seek fair pay and group support.
In 2015, the program continued to expand and now incor-
porate 27 vocational schools, 9 universities and 29 middle
schools in 12 Chinese cities. To date, it has directly benefit-
ed around 12,000 youth and further benefited over 4,000
youth indirectly.
Case Study: College Financial Education for
Better Future Program
The program has been implemented by China Foundation
for Poverty Alleviation (CFPA) since 2014. It has developed a
set of financial education courses and teaching materials to
help raise awareness on the importance of financial man-
agement in college students. It also serves to enable them
to obtain skills vital to fostering better self-management
and self-discipline, and ultimately enabling them to cultivate
good financial habits. The program also established a moni-
toring and evaluation system to assess actual impact.
In 2014, the “Zi Qiang Club” - an on-campus club comprising
of both college students from impoverished families and
other students – was established for ten selected universi-
ties in Beijing and Tianjin. Around 2,000 students registered
to participate.
2015 Highlights
Based on assessment results shown from the monitoring
and evaluation system, 821 students – out of 1,359 students
who successfully completed the program – developed their
saving goals and were able to build up personal assets in
four months. 234 students were also able to maintain their
target personal monthly budget for three consecutive
months.
The second phase of the program was rolled out in late
2015. It now covers 15 universities in six cities, around 4,000
students have registered to participate.
GIVING BACK TO THE COMMUNITY
When it comes to finance management, my first im-pressions are stock market, account books, money management and related theories. I find them bor-ing and difficult to understand. But to my surprise, the Aflateen class was a combination of games, activities and courses. I realized that they are not as boring as I thought, and in fact I have learned a lot. With the guidance of the teacher, we came to un-derstand ourselves, found out about our strengths, weaknesses and interests, so we can make plans for our future career. To be honest, I never tried to properly understand myself before I always seemed to be wasting time, starting things without finishing. I could not achieve desired outcomes and did not know how to make changes. After the program, I began to make short-term and long-term plans, and tried hard to achieve targets.
Dai Yimin, Student from the Beijing Rural Women School
Through the teaching courses, not only did I ac-cumulate hard skills, I was also able to gradually change my way of thinking. For example, I now understand the importance in developing a habit of keeping track of my finances. After participating in the program, it has also greatly inspired my interest in finance. As written in Robert Shiller’s Finance and the Good Society, finance can make the society a better place. However, we must first enhance our financial literacy, which is one of the key reflections of the state of a society.
Pu Fei, Level 14 Administrative Professional and a Student at the Nankai University
Our partnership with Citi has spanned over six years now. Over the years, we have together established BNVS’ brand and model for our vocational schools. Not only were we able to provide a better future for thousands of impoverished youths in China, we have also established a capable, sustainable and easily replicated model that can continue benefiting young people in the future. Citi’s support to one organiza-tion has brought far greater social significance than just to BNVS.
Diao Wen, BN Vocational School

24 25ANNUAL REPORT 2015 2015
2015 Highlights
The successful execution of the pilot BNVS Vocational Edu-
cational Workshop provided ongoing support to educational
reform and innovation. It is also enabled BNVS to contin-
ually strive to realize innovation through introducing new
international training methods such as exploring the use of
situational learning, utilizing school networks for teaching,
bringing in new skills-based curriculum as well as encourag-
ing inter-school exchange for students.
In 2015, BNVS conducted a series of workshop both in
China and worldwide to provide skills training and teach-
ing training. They also provided workshops to enable the
management team to continually improve internal quality
control and supervision. Through providing exchange and
training on BNVS’ innovative teaching model to over 80
Chinese and international professional teachers, industry
professionals and government stakeholders, BNVS was
able to expand their reach to support more young people
– in particular marginalized migrant youth.
Against the backdrop of government policy surrounding
vocational education, BNVS’ tuition-free vocational ed-
ucation model has become a successful case model on
a national level. This has also helped to increase public
awareness on the importance of providing vocational
education to migrant youth.
Case Study: Wings to Succeed Program
“The Wings to Succeed” program was officially launched in
Shanghai in September 2013 and is implemented by Save
the Children, an international nonprofit organization. It
focuses on increasing employment prospects in migrant
youth by enhancing their soft and hard skills. The phased
program has provided soft skills training to 1,320 students
from three vocational schools to date. During the initial
phase, the program mainly targeted migrant teenagers. In
the second phase, the program partnered with vocational
schools in Shanghai and migrant communities in Beijing to
further deliver vocational and soft skills training. This aims
to address employment retention and career development
among migrant youth.
2015 Highlights
In 2015, the program developed an innovative text book that
provides workplace knowledge for the hospitality industry.
Incorporating interactive pictures, the publication was pro-
vided to 300 migrant youth in Shanghai.
Upon completion of the program, 560 of the 800 migrant
youth, who have participated in the program, have markedly
demonstrated new entrepreneurship, academic and em-
ployability skills. These range from improvement in com-
munication, interview, career planning and other essential
workplace skills.
While the common perception is that large multinational
companies tend to be the lead job creators, in developed
countries, small and high-growth enterprises create more
jobs than any other segment of the economy. In these
countries, small businesses account for 57% of total em-
ployment and more than 50% of gross domestic product.
At Citi, we seek to support the launch of micro or small
enterprises – specifically, those that can provide employ-
ment prospects and income generation opportunities for
low-income individuals – to enable entrepreneurs to grow
or launch businesses that create jobs and strengthen and
transform communities. All our programs aim to ensure
alignment on multiple factors, including appropriate financ-
ing, human capital development, advancement in product
chain and product design, environmental impact and sup-
portive government policies.
Enterprises Development
2015 Highlights
Nearly 6,000 households and over 20,000 individuals have
benefitted from the program to date. The beneficiaries also
reported an increase in average annual income of above
30% year-over-year. The program has also helped to reg-
ister and establish the Blue Flower Brand – the first local
charitable brand – for artisans to sell their products under.
The brand also serves as a symbol that allows artisans to
leverage and raise awareness for their handicrafts.
A series of public events and exhibitions have also been held
to increase understanding and awareness for the heritage
surrounding Guizhou’s indigenous craftwork. These includ-
ed “Blue Flowers in Time: The Stories of 100 Miao Families
Philanthropic Sale” (2011); “Cross-Boundary I: Guizhou
Public Welfare Art Salon and Book Launching” (2012);
“Born in Villages/Reborn Exhibition and Design Workshop”
(2013); “Cross-Boundary II: Folk Craft Exhibition” (2014);
and “Cross-Boundary III: 5-Year Retrospective Exhibition in
Beijing” (2015).
Case Study: Chongqing Rural Microenterprise De-
velopment Program
Over the past five years, the Chongqing Rural Microenter-
prise Development Program was implemented by Humana
People to People (“HPP”) in cooperation with Chongqing’s
local Poverty Alleviation and Development Office. The pro-
gram provided around 3,400 household enterprises (13,600
individuals) from villages across Chongqing’s rural area with
essential technical and field training on sustainable agricul-
tural production and animal husbandry. Participating enter-
prises saw a marked increase in earning as they obtained
advanced skills.
2015 Highlights
In 2015, the program supported 1,700 microenterprises
expand or improve their businesses. Most microenterprises
reported earnings increase of at least 10%.
Case Study: Citi Guizhou Indigenous Craftwork
Development Program
Launched in 2010, the Citi Guizhou Indigenous Craftwork
Development Program was implemented by the Communi-
ty-Based Conservation and Development Research Center
of Guizhou (“CCDRC”) and the “Xiaomei Interview”, a special
column in the Guizhou Daily. It targets to increase income
levels of impoverished rural artisan household enterprises
in the Guizhou Province by enhancing their production and
marketing skills for traditional handicrafts. The program also
aims to protect and preserve the traditional skills and culture
embedded into the handicrafts. Through strong collaboration
amongst corporations, grass-root non-profit organizations
and the government, the program sought to create a sustain-
able development model for impoverished villages to attain
three vital benefits: economic, environmental and social.
GIVING BACK TO THE COMMUNITY
In cities like Beijing, Shanghai, Guangzhou, migrant youth are relatively vulnerable groups. But they are also the driving force for the development of cit-ies. Vocational education programs funded by the Citi Foundation enhance young people’s vocational competencies in a professional way. It is the best investment for the future of the city.
Dr. Jia Ying, Shanghai Program Manager, Save the Children
The project achieved great achievements over these past two years. We have worked closely together with farmers to discover solutions that can over-come their existing challenges. The participants all demonstrated great interest in the program follow-ing the annual evaluation, and they hoped to see it can continue providing them support.
Zhang Huijun, Program Evaluation Expert at the Yunnan Academy of Social Sciences
With Citi Foundation’s support, the Citi-Guizhou Indigenous Craftwork Development Program has helped equip over 6,000 ethnic minority female artisans in the Guizhou Province with practical skills to increase the quality and production capacity of traditional handcrafts; sustainably manage natural, cultural, and financial resources; and establish effec-tive market relationships between village handcraft cooperatives, commercial enterprises, and urban consumers. With help from Citi’s highly profession-al, accessible, and supportive CSR team, we have pioneered new models for combining poverty allevi-ation with cultural heritage protection and environ-mental stewardship.
Sarah Horowitz, Program Officer, Community Based Conservations and Development Research Center

26 ANNUAL REPORT 2015 2015 27
2015 Best Foreign Bank Consumer Satisfaction Award
Bankrate
2015 China CSR Award - Group Award
China Charity Festival
2015 Outstanding Foreign Bank
jrj.com
2015 Best Global Bank and Best Global Corporate Bank in China
The Asset
2015 Best Cross-border Treasury Management
Lujiazui Magazine, CBN
2015 Best Foreign Bank Employer in China
Universum
2015 Best in Treasury & Working Capital for MNC / LLCs Best Service Provider for E-Solutions
The Asset
AWARDS AND RECOGNITIONS
2015 Best Wealth Management Bank
Oriental Morning Post
2015 Annual Most Trusted Bank by CFOs - Best Global Cash Management Award
TOP CFO
Golden Shell Award - Best Foreign Bank in Wealth Management 2015
21st Century Business Herald
2015 China Best Wealth Management Institution - 2015 China’s Best Global Allocation Wealth Management Product
Securities Times
AWARDS AND RECOGNITIONS

29ANNUAL REPORT 201528 ANNUAL REPORT 2015
The Board of Directors of Citibank (China) Company Limited:
We have audited the accompanying financial statements of
Citibank (China) Company Limited (the “Bank”) on page 29
to 112, which comprise the balance sheet as at 31 December
2015, the income statement, the cash flow statement, the
statement of changes in owner’s equity for the year then
ended, and notes to the financial statements.
The Bank’s management is responsible for the preparation
and fair presentation of these financial statements. This re-
sponsibility incudes: (1) preparing these financial statements
in accordance with Accounting Standards for Business
Enterprises issued by the Ministry of Finance of the People’s
Republic of China, and fairly presenting them; (2) designing,
implementing and maintaining internal control which is nec-
essary to enable that the financial statements are free from
material misstatement, whether due to fraud or error.
Our responsibility is to express an opinion on these financial
statements based on our audit. We conducted our audit in
accordance with China Standards on Auditing for Certified
Public Accountants. Those standards require that we comply
with China Code of Ethics for Certified Public Accountants,
and plan and perform the audit to obtain reasonable assur-
ance about whether the financial statements are free from
material misstatement.
An audit involves performing procedures to obtain audit
evidence about the amounts and disclosures in the financial
statements. The procedures selected depend on the audi-
In our opinion, the financial statements present fairly, in all
material respects, the financial position of the Bank as at 31
December 2015, and the financial performance and the cash
flows of the Bank for the year then ended in accordance
with the requirements of Accounting Standards for Business
Enterprises issued by the Ministry of Finance of the People’s
Republic of China.
KPMG Huazhen LLP
Shanghai Branch
Certified Public Accountants Registered in People’s Re-
public of China
Shi Haiyun
Xue Chenjun
China Shanghai
April 22, 2016
tors’ judgement, including the assessment of the risks of
materials misstatement of the financial statements, whether
due to fraud or error. In making those risk assessments, the
auditors consider internal control relevant to the entity’s
preparation and fair presentation of the financial statements
in order to design audit procedures that are appropriate in
the circumstances, but not for the purpose of expressing an
opinion on the effectiveness of the entity’s internal control.
An audit also includes evaluating the appropriateness of ac-
counting policies used and the reasonableness of account-
ing estimates made by management, as well as evaluating
the overall presentation of the financial statements.
We believe that the audit evidence we have obtained is suffi-
cient and appropriate to provide a basis for our audit opinion.
Opinion
Auditors’ Responsibility
Management’s Responsibilityfor the Financial Statements
AUDITORS' REPORT
CITIBANK (CHINA) COMPANY LIMITED
ENGLISH TRANSLATION OF FINANCIAL STATEMENTS FOR THE YEAR 1 JANUARY 2015 TO 31 DECEMBER 2015
IF THERE IS ANY CONFLICT BETWEEN THE CHINESE VERSION AND ITSENGLISH TRANSLATION, THE CHINESE VERSION WILL PREVAIL

30 31ANNUAL REPORT ANNUAL REPORT 2015 2015
Citibank (China) Company LimitedBalance Sheet as at 31 December 2015 (continued)(Expressed in Renminbi Yuan)
Liabilities and owner’s equity
Liabilities
Owner’s equity
Total liabilities and owner’s equity
Deposits from inter-banks and non-bank financial institutions
Borrowings from inter-banks
Derivative financial liabilities
Deposits from customers
Employee benefits payable
Taxes payable
Interest payable
Other liabilities
Total liabilities
Paid-in capital
Capital reserve
Other comprehensive income
Surplus reserve
General reserve
Retained earnings
Total owner’s equity
17
18
9
19
20
4(3)
21
22
23
24
25
26
27
15,102,693,719
1,577,571,337
2,510,257,292
124,812,369,754
246,469,761
255,542,154
180,950,407
4,443,736,730
149,129,591,154
3,970,000,000
25,911,657
36,119,265
968,149,128
1,762,205,017
7,434,607,215
14,196,992,282
163,326,583,436
23,930,800,080
9,105,409,697
2,222,005,781
99,885,561,822
311,394,648
246,082,632
385,327,849
8,401,746,684
144,488,329,193
3,970,000,000
24,842,427
46,712,731
861,856,214
1,582,402,522
6,657,773,489
13,143,587,383
157,631,916,576
These financial statements were approved by the Board of Directors of Citibank (China) Company Limited.
Andrew Au Timothy Robert Sedgwick Company stamp
Chief Executive Officer Chief Financial Officer
Date: 22 April 2016
The notes on pages 37 to 112 form part of these financial statements.
Note 2015 2014
Assets
Total assets
Citibank (China) Company LimitedBalance Sheet as at 31 December 2015(Expressed in Renminbi Yuan)
Cash on hand and deposits with central bank
Deposits with inter-banks and non-bank financial institutions
Placements with inter-banks and non-bank financial institutions
Financial assets at fair value through profit or loss
Derivative financial assets
Interest receivable
Loans and advances to customers
Available-for-sale financial assets
Fixed assets
Intangible assets
Deferred tax assets
Other assets
The notes on pages 37 to 112 form part of these financial statements.
5
6
7
8
9
10
11
12
13
14
15
16
32,236,245,751
18,872,846,668
16,500,427,571
6,129,108,305
2,824,762,203
452,165,414
63,905,823,042
21,053,400,460
37,965,957
38,688,781
212,219,156
1,062,930,128
163,326,583,436
27,625,131,061
13,669,061,054
16,541,638,662
8,506,538,388
2,238,549,098
617,321,657
66,262,410,248
20,322,383,530
49,614,382
56,131,813
203,174,424
1,539,962,259
157,631,916,576
Note 2015 2014

32 33ANNUAL REPORT ANNUAL REPORT 2015 2015
Citibank (China) Company LimitedCash Flow Statement for the year ended 31 December 2015(Expressed in Renminbi Yuan)
80,642,349
-
6,261,198,954
4,197,422,530
287,623,290
5,247,653,122
11,855,876
596,734,844
16,683,130,965
-
(5,371,966,886)
(2,209,424,387)
(5,042,569,024)
-
(1,833,262,020)
(1,484,200,677)
(697,713,036)
(711,452,945)
(17,350,588,975)
(667,458,010)
-
1,555,890,837
-
13,873,282,302
657,777,090
5,014,984,652
7,672,709
469,467,638
21,579,075,228
(2,864,492,643)
(1,713,751,745)
(1,592,885,716)
-
(9,581,594,645)
(1,756,570,941)
(1,634,036,378)
(528,464,299)
(1,420,045,249)
(21,091,841,616)
487,233,612
Note 2015 2014
Cash flows from operating activities
Net decrease in deposits with central bank and inter-banks
Net decrease in loans and advances to customers
Net increase in borrowings from inter-banks
and non-bank financial institutions
Net increase in deposits from customers,
inter-banks and non-bank financial institutions
Investment returns received from financial
assets at fair value through profit or loss
Interest, fee and commission receipts
Refund of taxes
Proceeds from other operating activities
Sub-total of cash inflows from operating activities
Net increase in deposits with central bank and inter-banks
Net increase in deposits with inter-banks with limited usage
Payment for acquisition of financial assets
at fair value through profit or loss
Net increase in loans and advances to customers
Net decrease in borrowings from inter-banks
and non-bank financial institutions
Interest, fee and commission payments
Payment to and for employees
Payment of various taxes
Payment for other operating activities
Sub-total of cash outflows from operating activities
Net cash inflow / (outflow) from operating activities
The notes on pages 37 to 112 form part of these financial statements.
37(1)
Net interest income
Interest income
Interest expenses
Net fee and commission income
Fee and commission income
Fee and commission expenses
Investment income
Gains from changes in fair value
Foreign exchange gains
Other operating income
Business taxes and surcharges
General and administrative expenses
Impairment losses
Add: Non-operating income
Less: Non-operating expenses
Less: Income tax expense
Item that may be reclassified to profit or loss
- Gains or losses arising from changes in fair value of
available-for-sale financial assets
The notes on pages 37 to 112 form part of these financial statements.
Operating income
Operating expenses
Operating profit
Profit before income tax
Net profit for the year
Other comprehensive income, net of tax:
Total comprehensive income for the year
Citibank (China) Company LimitedIncome Statement for the year ended 31 December 2015(Expressed in Renminbi Yuan)
Note 2015 2014
29
30
31
32
4(1)
33
34
4(2), 35
36
5,672,621,881
2,477,432,261
3,937,889,364
(1,460,457,103)
1,022,325,132
1,119,255,745
(96,930,613)
1,367,643,146
291,222,295
470,096,120
43,902,927
(4,391,621,576)
(330,205,682)
(3,183,932,587)
(877,483,307)
1,281,000,305
2,663,219
(5,371,635)
1,278,291,889
(215,362,754)
1,062,929,135
(10,593,466)
1,052,335,669
5,511,105,525
2,792,407,099
4,486,713,195
(1,694,306,096)
938,273,379
1,028,039,746
(89,766,367)
1,092,109,762
47,812,643
602,330,139
38,172,503
(3,548,359,494)
(317,101,421)
(3,087,297,605)
(143,960,468)
1,962,746,031
6,163,801
(2,097,802)
1,966,812,030
(368,683,020)
1,598,129,010
157,900,654
1,756,029,664
34 35ANNUAL REPORT ANNUAL REPORT 2015 2015
24
26, 28
27, 28
13,143,587,383
1,052,335,669
1,069,230
-
-
1,053,404,899
14,196,992,282
6,657,773,489
1,062,929,135
-
(106,292,914)
(179,802,495)
776,833,726
7,434,607,215
1,582,402,522
-
-
-
179,802,495
179,802,495
1,762,205,017
861,856,214
-
-
106,292,914
-
106,292,914
968,149,128
46,712,731
(10,593,466)
-
-
-
(10,593,466)
36,119,265
24,842,427
-
1,069,230
-
-
1,069,230
25,911,657
3,970,000,000
-
-
-
-
-
3,970,000,000
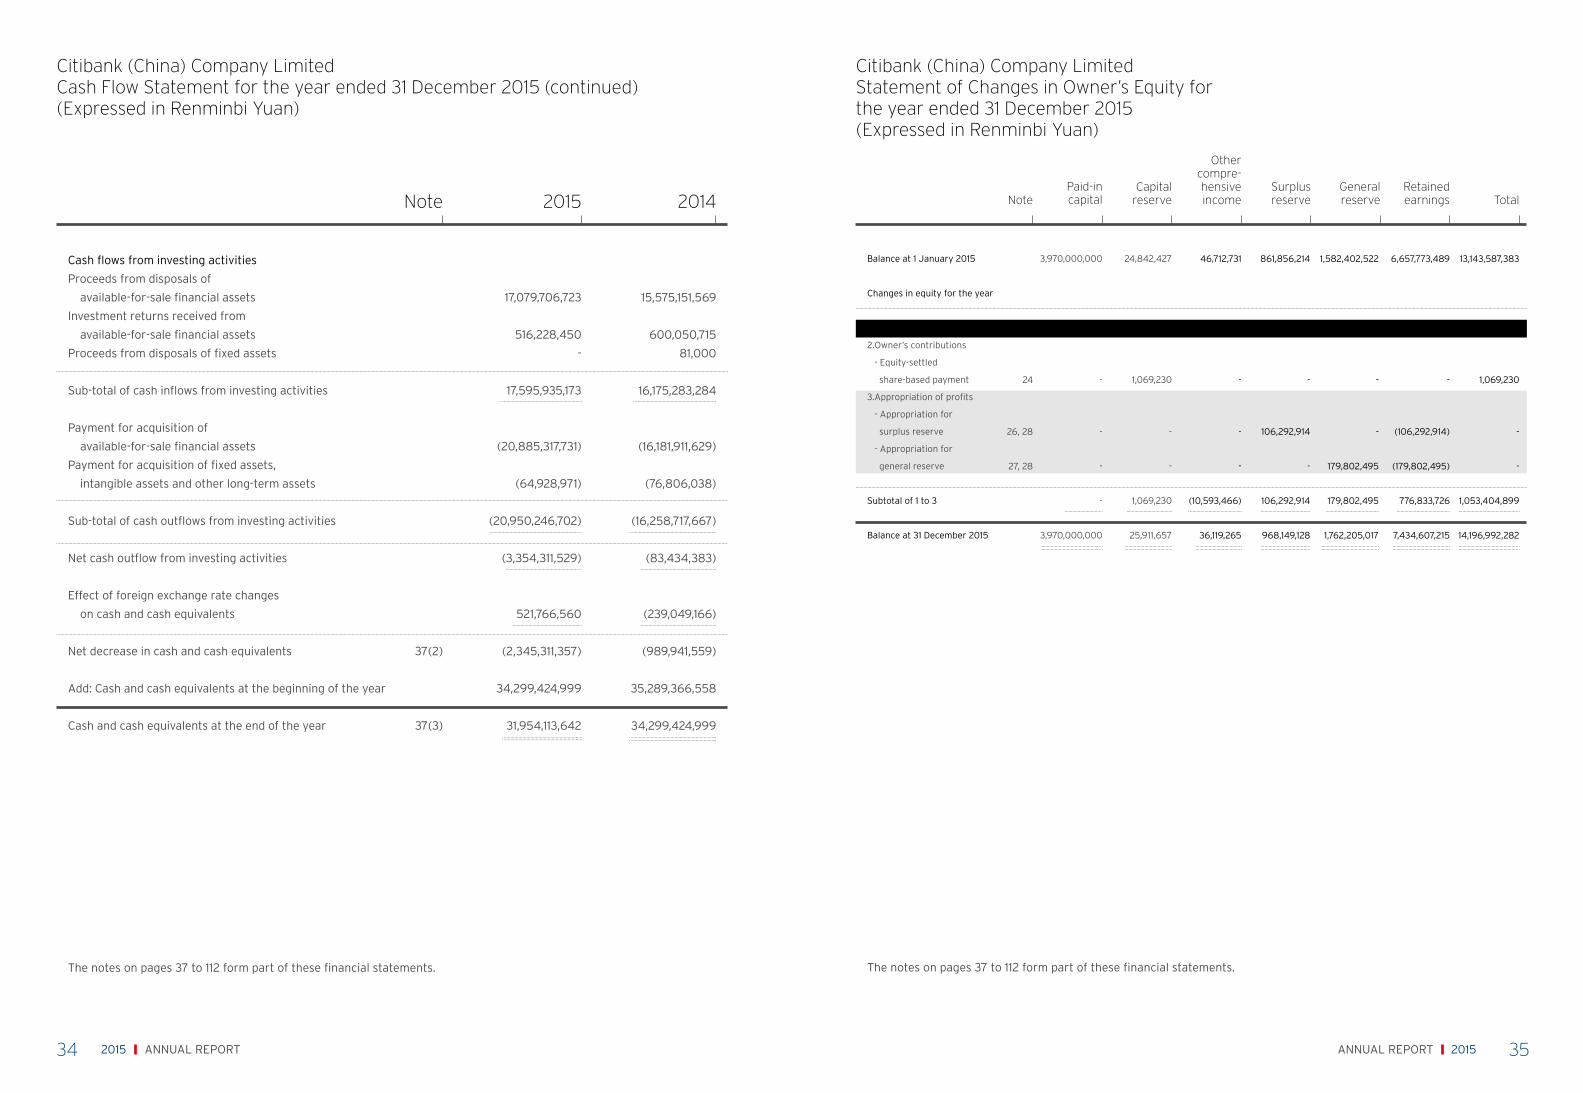
Balance at 1 January 2015
Changes in equity for the year
1.Total comprehensive income
2.Owner’s contributions
- Equity-settled
share-based payment
3.Appropriation of profits
- Appropriation for
surplus reserve
- Appropriation for
general reserve
Subtotal of 1 to 3
Balance at 31 December 2015
NotePaid-incapital
Capitalreserve
Othercompre-hensiveincome
Surplus reserve
Generalreserve
Retainedearnings Total
The notes on pages 37 to 112 form part of these financial statements.
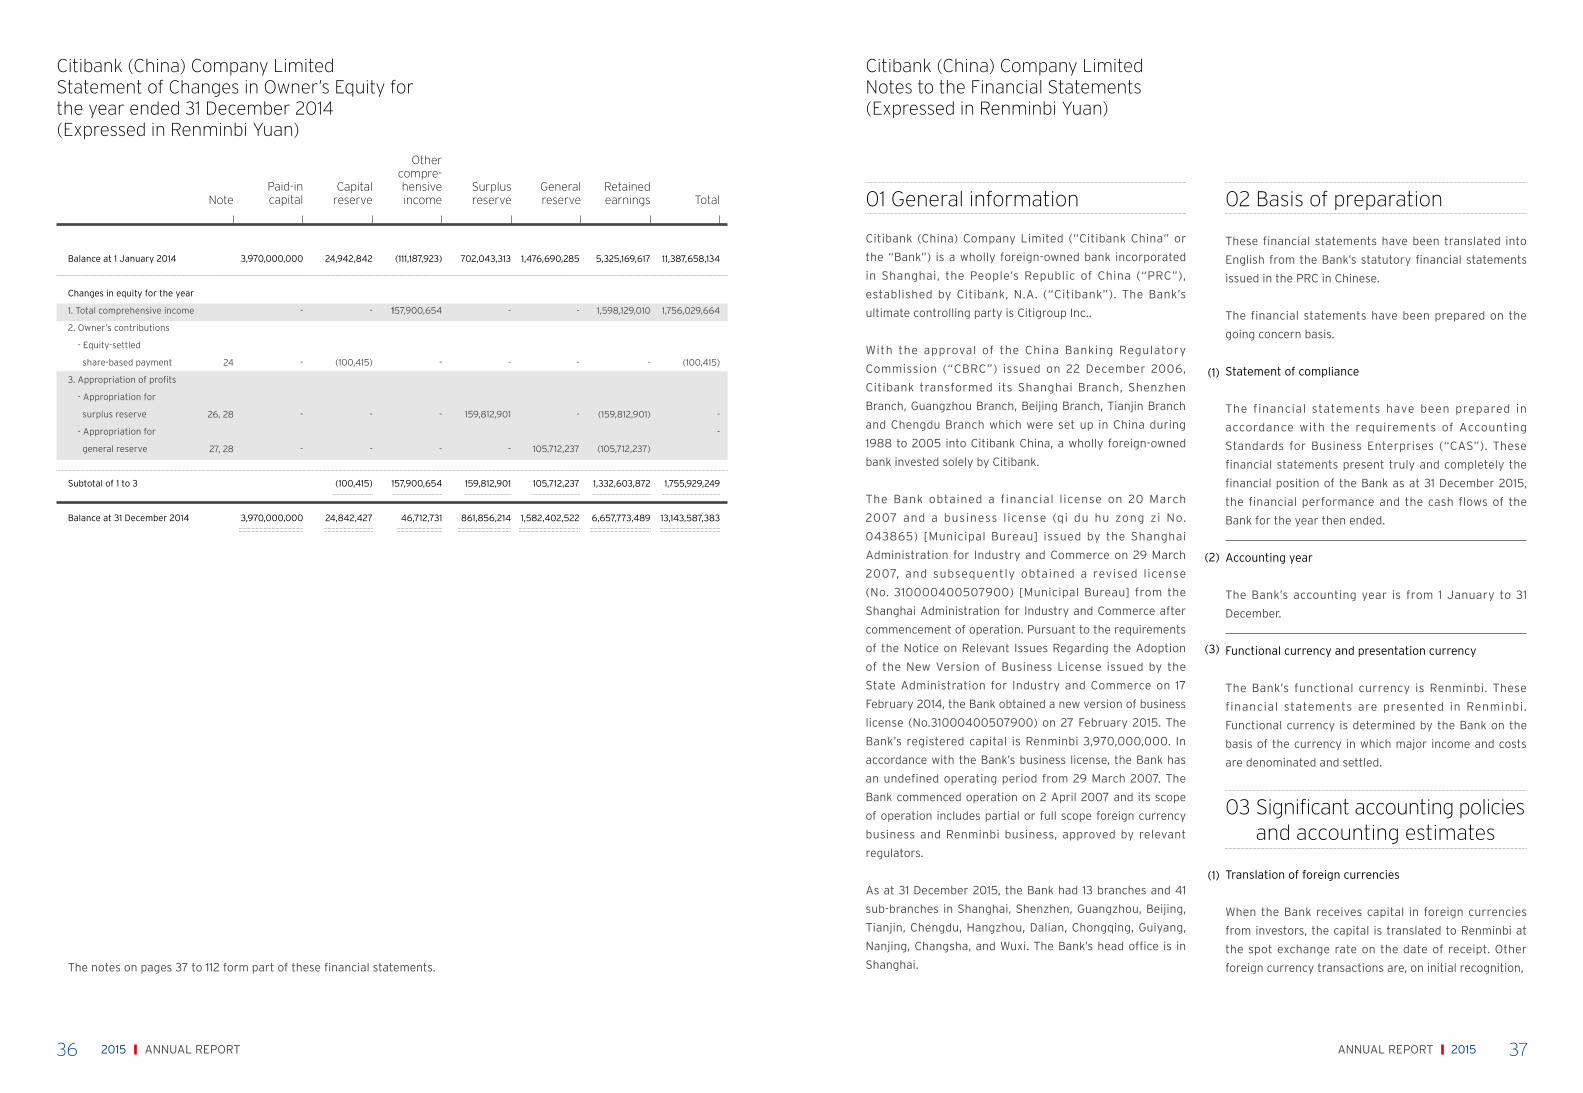
Citibank (China) Company LimitedStatement of Changes in Owner’s Equity for the year ended 31 December 2015(Expressed in Renminbi Yuan)
17,079,706,723
516,228,450
-
17,595,935,173
(20,885,317,731)
(64,928,971)
(20,950,246,702)
(3,354,311,529)
521,766,560
(2,345,311,357)
34,299,424,999
31,954,113,642
15,575,151,569
600,050,715
81,000
16,175,283,284
(16,181,911,629)
(76,806,038)
(16,258,717,667)
(83,434,383)
(239,049,166)
(989,941,559)
35,289,366,558
34,299,424,999
Citibank (China) Company LimitedCash Flow Statement for the year ended 31 December 2015 (continued)(Expressed in Renminbi Yuan)
Note 2015 2014
Cash flows from investing activities
Proceeds from disposals of
available-for-sale financial assets
Investment returns received from
available-for-sale financial assets
Proceeds from disposals of fixed assets
Sub-total of cash inflows from investing activities
Payment for acquisition of
available-for-sale financial assets
Payment for acquisition of fixed assets,
intangible assets and other long-term assets
Sub-total of cash outflows from investing activities
Net cash outflow from investing activities
Effect of foreign exchange rate changes
on cash and cash equivalents
Net decrease in cash and cash equivalents
Add: Cash and cash equivalents at the beginning of the year
Cash and cash equivalents at the end of the year
The notes on pages 37 to 112 form part of these financial statements.
37(2)
37(3)
36 37ANNUAL REPORT ANNUAL REPORT 2015 2015
(1)
(2)
(3)
(1)
Citibank (China) Company LimitedNotes to the Financial Statements(Expressed in Renminbi Yuan)
01 General information
Citibank (China) Company Limited (“Citibank China” or
the “Bank”) is a wholly foreign-owned bank incorporated
in Shanghai, the People’s Republic of China (“PRC”),
established by Citibank, N.A. (“Citibank”). The Bank’s
ultimate controlling party is Citigroup Inc..
With the approval of the China Banking Regulatory
Commission (“CBRC”) issued on 22 December 2006,
Citibank transformed its Shanghai Branch, Shenzhen
Branch, Guangzhou Branch, Beijing Branch, Tianjin Branch
and Chengdu Branch which were set up in China during
1988 to 2005 into Citibank China, a wholly foreign-owned
bank invested solely by Citibank.
The Bank obtained a financial license on 20 March
2007 and a business license (qi du hu zong zi No.
043865) [Municipal Bureau] issued by the Shanghai
Administration for Industry and Commerce on 29 March
2007, and subsequently obtained a revised license
(No. 310000400507900) [Municipal Bureau] from the
Shanghai Administration for Industry and Commerce after
commencement of operation. Pursuant to the requirements
of the Notice on Relevant Issues Regarding the Adoption
of the New Version of Business License issued by the
State Administration for Industry and Commerce on 17
February 2014, the Bank obtained a new version of business
license (No.31000400507900) on 27 February 2015. The
Bank’s registered capital is Renminbi 3,970,000,000. In
accordance with the Bank’s business license, the Bank has
an undefined operating period from 29 March 2007. The
Bank commenced operation on 2 April 2007 and its scope
of operation includes partial or full scope foreign currency
business and Renminbi business, approved by relevant
regulators.
As at 31 December 2015, the Bank had 13 branches and 41
sub-branches in Shanghai, Shenzhen, Guangzhou, Beijing,
Tianjin, Chengdu, Hangzhou, Dalian, Chongqing, Guiyang,
Nanjing, Changsha, and Wuxi. The Bank’s head office is in
Shanghai.
02 Basis of preparation
These financial statements have been translated into
English from the Bank’s statutory financial statements
issued in the PRC in Chinese.
The financial statements have been prepared on the
going concern basis.
Statement of compliance
The financial statements have been prepared in
accordance with the requirements of Accounting
Standards for Business Enterprises (“CAS”). These
financial statements present truly and completely the
financial position of the Bank as at 31 December 2015,
the financial performance and the cash flows of the
Bank for the year then ended.
Accounting year
The Bank’s accounting year is from 1 January to 31
December.
Functional currency and presentation currency
The Bank’s functional currency is Renminbi. These
financial statements are presented in Renminbi.
Functional currency is determined by the Bank on the
basis of the currency in which major income and costs
are denominated and settled.
03 Significant accounting policies and accounting estimates
Translation of foreign currencies
When the Bank receives capital in foreign currencies
from investors, the capital is translated to Renminbi at
the spot exchange rate on the date of receipt. Other
foreign currency transactions are, on initial recognition, The notes on pages 37 to 112 form part of these financial statements.
Citibank (China) Company Limited Statement of Changes in Owner’s Equity for the year ended 31 December 2014 (Expressed in Renminbi Yuan)
24
26, 28
27, 28
11,387,658,134
1,756,029,664
(100,415)
-
-
1,755,929,249
13,143,587,383
5,325,169,617
1,598,129,010
-
(159,812,901)
(105,712,237)
1,332,603,872
6,657,773,489
1,476,690,285
-
-
-
105,712,237
105,712,237
1,582,402,522
702,043,313
-
-
159,812,901
-
159,812,901
861,856,214
(111,187,923)
157,900,654
-
-
-
157,900,654
46,712,731
24,942,842
-
(100,415)
-
-
(100,415)
24,842,427
3,970,000,000
-
-
-
-
3,970,000,000
Balance at 1 January 2014
Changes in equity for the year
1. Total comprehensive income
2. Owner’s contributions
- Equity-settled
share-based payment
3. Appropriation of profits
- Appropriation for
surplus reserve
- Appropriation for
general reserve
Subtotal of 1 to 3
Balance at 31 December 2014
NotePaid-incapital
Capitalreserve
Othercompre-hensiveincome
Surplus reserve
Generalreserve
Retainedearnings Total

38 39ANNUAL REPORT ANNUAL REPORT 2015 2015
-
(b)
-
-
(c)
-
-
(d)
(3)
(4)
Financial liabilities other than those at fair value through profit
or loss are subsequently measured at amortised cost using
the effective interest method. However, a financial guarantee
issued by the Bank is subsequently measured at the higher of
the amount initially recognised less accumulated amortisation
and the amount of a provision determined in accordance with
the principles for contingent liabilities (see Note 3(11)).
Presentation of financial assets and financial liabilities
Financial assets and financial liabilities are generally
presented separately in the balance sheet and are not
offset. However, a financial asset and a financial liability are
offset and the net amount is presented in the balance sheet
when both of the following conditions are satisfied:
the Bank currently has a legally enforceable right to set off
the recognised amounts; and
the Bank intends either to settle on a net basis, or to
realise the financial asset and settle the financial liability
simultaneously.
Derecognition of financial assets and financial liabilities
A financial asset is derecognised if the Bank’s contractual
rights to the cash flows from the financial asset expire or if
the Bank transfers substantially all the risks and rewards of
ownership of the financial asset to another party.
Where a transfer of a financial asset in its entirety meets
the criteria for derecognition, the difference between the
two amounts below is recognised in profit or loss:
the carrying amount of the financial asset transferred
the sum of the consideration received from the transfer
and any cumulative gain or loss that has been recognised
directly in equity
The Bank derecognises a financial liability (or part of it) only
when its contractual obligation (or part of it) is discharged
or cancelled or expires.
Equity instrument
The consideration received from the issuance of equity
instruments net of transaction costs is recognised in
owner’s equity.
Consideration and transaction costs paid by the Bank
for repurchasing self-issued equity instruments are
deducted from owner’s equity.
Cash and cash equivalents
Cash and cash equivalents comprise cash on hand,
non-restricted balances with central banks, deposits
with inter-banks and non-bank financial institutions,
placements with inter-banks and non-bank financial
institutions, and short-term, highly liquid investments,
that are readily convertible into known amounts of cash
and are subject to an insignificant risk of change in
value.
Fixed assets
Fixed assets represent the tangible assets held by the
Bank for administrative purposes with useful lives over
one year. Fixed assets are stated in the balance sheet
at cost less accumulated depreciation and impairment
losses (see Note 3(7)(b)).
The cost of a purchased fixed asset comprises
the purchase price, related taxes, and any directly
attributable expenditure for bringing the asset to
working condition for its intended use. The cost of self-
constructed assets includes the cost of materials, direct
labour, capitalised borrowing costs, and any other costs
directly attributable to bringing the asset to working
condition for its intended use.
Any subsequent costs including the cost of replacing
part of an item of fixed assets are recognised as
assets when it is probable that the economic benefits
associated with the costs will flow to the Bank, and the
carrying amount of the replaced part is derecognised.
(1)
(2)
(a)
-
-
-
-
03 Significant accounting policies and accounting estimates (continued)
Translation of foreign currencies (continued)
translated to Renminbi at the spot exchange rates on the
dates of the transactions.translated to Renminbi at the
spot exchange rates on the dates of the transactions. A
spot exchange rate is an exchange rate quoted by the
People’s Bank of China (“PBOC”), the State Administration
of Foreign Exchanges or a cross rate determined based on
quoted exchange rates.
Monetary items denominated in foreign currencies are
translated to Renminbi at the spot exchange rate at the
balance sheet date and the resulting exchange differences
are recognised in profit or loss. Non-monetary items that
are measured at historical cost in foreign currencies are
translated to Renminbi using the exchange rate at the
transaction date.
Financial instruments
Financial instruments of the Bank include cash on hand and
deposits with central bank, deposits with inter-banks and
non-bank financial institutions, placements with inter-banks
and non-bank financial institutions, financial assets at fair
value through profit or loss, derivative financial assets,
interest receivable, loans and advances to customers,
available-for-sale financial assets, deposits from inter-
banks and non-bank financial institutions, borrowings from
inter-banks, derivative financial liabilities, deposits from
customers, interest payable and paid-in capital.
Recognition and measurement of financial assets and
financial liabilities
A financial asset or financial liability is recognised in the
balance sheet when the Bank becomes a party to the
contractual provisions of a financial instrument.
The Bank classifies financial assets and liabilities into
different categories at initial recognition based on the
purpose of acquiring assets or assuming liabilities:
financial assets and financial liabilities at fair value
through profit or loss, loans and receivables, held-to-
maturity investments, available-for-sale financial assets
and other financial liabilities.
Financial assets and financial liabilities are measured
initially at fair value. For financial assets and financial
liabilities at fair value through profit or loss, any related
directly attributable transaction costs are charged to
profit or loss; for other categories of financial assets
and financial liabilities, any related directly attributable
transaction costs are included in their initial costs.
Subsequent to initial recognition, financial assets and
liabilities are measured as follows:
Financial assets and financial liabilities at fair value
through profit or loss are measured at fair value, and
changes therein are recognised in profit or loss.
Loans and receivables are measured at amortised cost
using the effective interest method.
Held-to-maturity investments are measured at amortised
cost using the effective interest method.
Available-for-sale investments in equity instruments whose
fair value cannot be measured reliably are measured at
cost. Other available-for-sale financial assets are measured
at fair value and changes therein are recognised in other
comprehensive income, except for impairment losses
and foreign exchange gains and losses from monetary
financial assets which are recognised directly in profit
or loss. When an investment is derecognised, the gain or
loss accumulated in equity is reclassified to profit or loss.
Dividend income is recognised in profit or loss when the
investee approves the dividends. Interest is recognised in
profit or loss using the effective interest method.
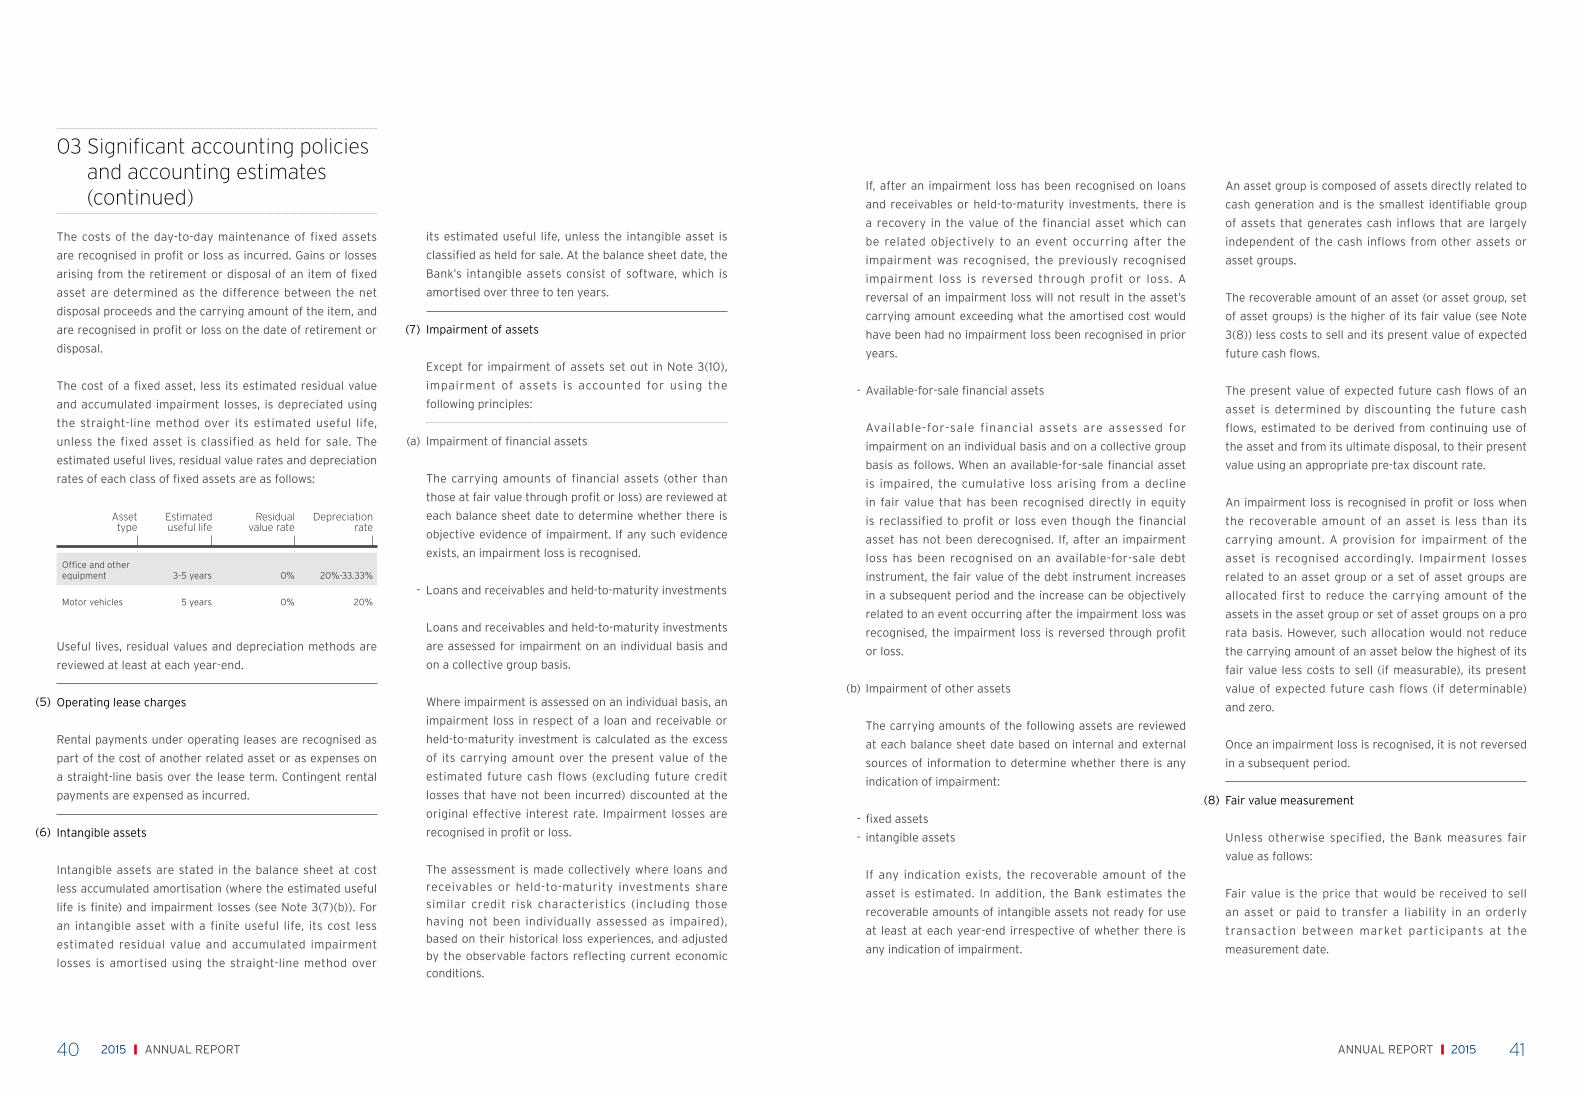
40 41ANNUAL REPORT ANNUAL REPORT 2015 2015
(5)
(6)
(7)
(a)
-
03 Significant accounting policies and accounting estimates (continued)
The costs of the day-to-day maintenance of fixed assets
are recognised in profit or loss as incurred. Gains or losses
arising from the retirement or disposal of an item of fixed
asset are determined as the difference between the net
disposal proceeds and the carrying amount of the item, and
are recognised in profit or loss on the date of retirement or
disposal.
The cost of a fixed asset, less its estimated residual value
and accumulated impairment losses, is depreciated using
the straight-line method over its estimated useful life,
unless the fixed asset is classified as held for sale. The
estimated useful lives, residual value rates and depreciation
rates of each class of fixed assets are as follows:
Useful lives, residual values and depreciation methods are
reviewed at least at each year-end.
Operating lease charges
Rental payments under operating leases are recognised as
part of the cost of another related asset or as expenses on
a straight-line basis over the lease term. Contingent rental
payments are expensed as incurred.
Intangible assets
Intangible assets are stated in the balance sheet at cost
less accumulated amortisation (where the estimated useful
life is finite) and impairment losses (see Note 3(7)(b)). For
an intangible asset with a finite useful life, its cost less
estimated residual value and accumulated impairment
losses is amortised using the straight-line method over
its estimated useful life, unless the intangible asset is
classified as held for sale. At the balance sheet date, the
Bank’s intangible assets consist of software, which is
amortised over three to ten years.
Impairment of assets
Except for impairment of assets set out in Note 3(10),
impairment of assets is accounted for using the
following principles:
Impairment of financial assets
The carrying amounts of financial assets (other than
those at fair value through profit or loss) are reviewed at
each balance sheet date to determine whether there is
objective evidence of impairment. If any such evidence
exists, an impairment loss is recognised.
Loans and receivables and held-to-maturity investments
Loans and receivables and held-to-maturity investments
are assessed for impairment on an individual basis and
on a collective group basis.
Where impairment is assessed on an individual basis, an
impairment loss in respect of a loan and receivable or
held-to-maturity investment is calculated as the excess
of its carrying amount over the present value of the
estimated future cash flows (excluding future credit
losses that have not been incurred) discounted at the
original effective interest rate. Impairment losses are
recognised in profit or loss.
The assessment is made collectively where loans and
receivables or held-to-maturity investments share
similar credit risk characteristics (including those
having not been individually assessed as impaired),
based on their historical loss experiences, and adjusted
by the observable factors reflecting current economic
conditions.
Asset type
Office and other equipment
Motor vehicles
3-5 years
5 years
0%
0%
20%-33.33%
20%
Estimateduseful life
Residualvalue rate
Depreciationrate
-
(b)
-
-
(8)
If, after an impairment loss has been recognised on loans
and receivables or held-to-maturity investments, there is
a recovery in the value of the financial asset which can
be related objectively to an event occurring after the
impairment was recognised, the previously recognised
impairment loss is reversed through profit or loss. A
reversal of an impairment loss will not result in the asset’s
carrying amount exceeding what the amortised cost would
have been had no impairment loss been recognised in prior
years.
Available-for-sale financial assets
Available-for-sale financial assets are assessed for
impairment on an individual basis and on a collective group
basis as follows. When an available-for-sale financial asset
is impaired, the cumulative loss arising from a decline
in fair value that has been recognised directly in equity
is reclassified to profit or loss even though the financial
asset has not been derecognised. If, after an impairment
loss has been recognised on an available-for-sale debt
instrument, the fair value of the debt instrument increases
in a subsequent period and the increase can be objectively
related to an event occurring after the impairment loss was
recognised, the impairment loss is reversed through profit
or loss.
Impairment of other assets
The carrying amounts of the following assets are reviewed
at each balance sheet date based on internal and external
sources of information to determine whether there is any
indication of impairment:
fixed assets
intangible assets
If any indication exists, the recoverable amount of the
asset is estimated. In addition, the Bank estimates the
recoverable amounts of intangible assets not ready for use
at least at each year-end irrespective of whether there is
any indication of impairment.
An asset group is composed of assets directly related to
cash generation and is the smallest identifiable group
of assets that generates cash inflows that are largely
independent of the cash inflows from other assets or
asset groups.
The recoverable amount of an asset (or asset group, set
of asset groups) is the higher of its fair value (see Note
3(8)) less costs to sell and its present value of expected
future cash flows.
The present value of expected future cash flows of an
asset is determined by discounting the future cash
flows, estimated to be derived from continuing use of
the asset and from its ultimate disposal, to their present
value using an appropriate pre-tax discount rate.
An impairment loss is recognised in profit or loss when
the recoverable amount of an asset is less than its
carrying amount. A provision for impairment of the
asset is recognised accordingly. Impairment losses
related to an asset group or a set of asset groups are
allocated first to reduce the carrying amount of the
assets in the asset group or set of asset groups on a pro
rata basis. However, such allocation would not reduce
the carrying amount of an asset below the highest of its
fair value less costs to sell (if measurable), its present
value of expected future cash flows (if determinable)
and zero.
Once an impairment loss is recognised, it is not reversed
in a subsequent period.
Fair value measurement
Unless otherwise specified, the Bank measures fair
value as follows:
Fair value is the price that would be received to sell
an asset or paid to transfer a liability in an orderly
transaction between market participants at the
measurement date.

42 43ANNUAL REPORT ANNUAL REPORT 2015 2015
(9)
(a)
(b)
(c)
(d)
When measuring fair value, the Bank takes into account the
characteristics of the particular asset or liability (including
the condition and location of the asset and restrictions, if
any, on the sale or use of the asset) that market participants
would consider when pricing the asset or liability at the
measurement date, and uses valuation techniques that are
appropriate in the circumstances and for which sufficient
data and other information are available to measure fair
value. Valuation techniques mainly include the market
approach, the income approach and the cost approach.
Employee benefits
Short-term employee benefits
Employee wages or salaries, bonuses, social security
contributions such as medical insurance, work injury
insurance, maternity insurance and housing fund, measured
at the amount incurred or accrued at the applicable
benchmarks and rates, are recognised as a liability as the
employee provides services, with a corresponding charge
to profit or loss or included in the cost of assets where
appropriate.
Post-employment benefits – defined contribution plans
The defined contribution plans participated in by the Bank
include basic pension insurance in the social insurance
system and annuity plan.
Pursuant to the relevant laws and regulations of the PRC,
the Bank participated in a defined contribution basic
pension insurance plan in the social insurance system
established and managed by government organisations. The
Bank makes contributions to basic pension insurance plans
based on the applicable benchmarks and rates stipulated by
the government. Basic pension insurance contributions are
recognised as a liability as the employee provides services,
with a corresponding charge to profit or loss or included in
the cost of assets where appropriate.
Besides, the Bank provides an annuity plan to
the eligible employees. The Bank makes annuity
contributions in proportion to its employees’ gross
salaries on an accrual basis.
Share-based payments
Share-based payment transactions in the Bank are
equity-settled share-based payments.
When the Bank uses shares or other equity instruments
as consideration for services received from employees,
the payment is measured at the fair value of the equity
instruments granted to the employees, in accordance
with CAS 11 – Share-based Payments. If the equity
instruments granted to employees vest immediately,
the fair value of the equity instruments granted is fully
recognised as costs or expenses on the grant date, with
a corresponding increase in capital reserve. If the equity
instruments granted do not vest until the completion
of services for a period, or until the achievement of a
specified performance condition, the Bank recognises
an amount during the vesting period, based on the best
estimate of the number of equity instruments expected
to vest. The Bank measures the services received at
the grant-date fair value of the equity instruments
and recognises the costs or expenses as the services
are received, with a corresponding increase in capital
reserve.
When the Bank receives services but has no obligation
to settle the transaction because the relevant equity
instruments are issued by the Bank’s ultimate parent,
the Bank also classifies the transaction as equity-
settled.
Termination benefits
When the Bank terminates the employment with
employees before the employment contracts expire,
03 Significant accounting polices and accounting estimates (continued)
-
-
(e)
(10)
-
-
-
-
or provides compensation under an offer to encourage
employees to accept voluntary redundancy, a provision is
recognised with a corresponding expense in profit or loss at
the earlier of the following dates:
When the Bank cannot unilaterally withdraw the offer of
termination benefits because of an employee termination
plan or a curtailment proposal.
When the Bank has a formal detailed employee termination
plan or curtailment proposal involving the payment of
termination benefits and has raised a valid expectation in
those affected that it will carry out the restructuring by
starting to implement that plan or proposal or announcing
its main features to those affected by it.
Other long-term employee benefits
Other long-term employee benefits represent the Bank’s
payment obligation in exchange for services rendered by
employees, which is computed based on certain standards.
The obligation is settled after twelve months after the end
of the annual reporting period.
Income tax
Current tax and deferred tax are recognised in profit or
loss except to the extent that they relate to a business
combination or items recognised directly in equity (including
other comprehensive income).
Current tax is the expected tax payable calculated at the
applicable tax rate on taxable income for the year, plus any
adjustment to tax payable in respect of previous years.
At the balance sheet date, current tax assets and liabilities
are offset only if the Bank has a legally enforceable right to
set them off and also intends either to settle on a net basis
or to realise the asset and settle the liability simultaneously.
Deferred tax assets and liabilities arise from deductible
and taxable temporary differences respectively, being the
differences between the carrying amounts of assets and
liabilities for financial reporting purposes and their
tax bases, which include the deductible tax losses and
tax credits carried forward to subsequent periods.
Deferred tax assets are recognised to the extent that it
is probable that future taxable profits will be available
against which deductible temporary differences can be
utilised.
Deferred tax is not recognised for the temporary
differences arising from the initial recognition of assets
or liabilities in a transaction that is not a business
combination and that affects neither accounting profit
nor taxable profit (or deductible loss).
At the balance sheet date, deferred tax is measured
based on the tax consequences that would follow from
the expected manner of recovery or settlement of the
carrying amount of the assets and liabilities, using tax
rates enacted at the reporting date that are expected to
be applied in the period when the asset is recovered or
the liability is settled.
The carrying amount of a deferred tax asset is reviewed
at each balance sheet date, and is reduced to the extent
that it is no longer probable that the related tax benefits
will be utilised. Such reduction is reversed to the extent
that it becomes probable that sufficient taxable profits
will be available.
At the balance sheet date, deferred tax assets and
liabilities are offset if all of the following conditions are
met:
the taxable entity has a legally enforceable right to
offset current tax liabilities and assets, and
they relate to income taxes levied by the same tax
authority on either:
the same taxable entity; or
different taxable entities which intend either to settle
the current tax liabilities and assets on a net basis, or to

44 45ANNUAL REPORT ANNUAL REPORT 2015 2015
realise the assets and settle the liabilities simultaneously,
in each future period in which significant amounts of
deferred tax liabilities or assets are expected to be settled
or recovered.
Provisions
A provision is recognised for an obligation related to a
contingency if the Bank has a present obligation that can
be estimated reliably, and it is probable that an outflow of
economic benefits will be required to settle the obligation.
Where the effect of the time value of money is material,
provisions are determined by discounting the expected
future cash flows.
Fiduciary activities
The Bank acts in a fiduciary capacity as a custodian, trustee
or an agent for its customers. Assets held by the Bank and
the related undertakings to return such assets to customers
are excluded from the financial statements as the risks and
rewards of the assets reside with the customers.
Entrusted lending is the business where the Bank enters
into entrusted loan agreements with customers, whereby
the customers provide funding (entrusted funds) to the
Bank, and the Bank grants loans to third parties (entrusted
loans) at the instruction of the customers. As the Bank does
not assume the risks and rewards of the entrusted loans
and the corresponding entrusted funds, entrusted loans
and funds are recorded as off-balance sheet items at their
principal amounts and no impairment assessments are
made for these entrusted loans.
Wealth management business refers to agreements
between the Bank and its customers to raise funds from
them for investment in the assets of the Bank or third
parties. In this business, the Bank performs its management
duties and collects corresponding fees in accordance with
the relevant agreements. As the Bank does not assume the
03 Significant accounting policies and accounting estimates (continued)
(11)
(12)
risks and rewards of the funds and investments of the
wealth management business, the corresponding funds
and investments are recorded as off-balance sheet
items.
Revenue recognition
Revenue is the gross inflow of economic benefits
arising in the course of the Bank’s ordinary activities
when those inflows result in increases in equity, other
than increases relating to contributions from owners.
Revenue is recognised in profit or loss when it is
probable that the economic benefits will flow to the
Bank, the revenue and costs can be measured reliably
and the following conditions are met:
Interest income
Interest income arising from the use by others of entity
assets is recognised in the income statement based on
the duration and the effective interest rate. Interest
income includes the amortisation of any discount or
premium or differences between the initial carrying
amount of an interest-bearing instrument and its
amount at maturity calculated on an effective interest
rate basis.
The effective interest method is a method of calculating
the amortised cost of financial assets and liabilities and
of allocating the interest income and interest expense
over the relevant period. The effective interest rate is
the rate that exactly discounts estimated future cash
payments or receipts through the expected life of the
financial instrument, or, when appropriate, a shorter
period, to the net carrying amount of the financial
instrument. When calculating the effective interest
rate, the Bank estimates cash flows considering all
the contractual terms of the financial instrument (for
example, prepayment, call and similar options) but
does not consider future credit losses. The calculation
includes all fees and points paid or received between parties
to the contract that are an integral part of the effective
interest rate, transaction costs and all other premiums or
discounts.
Interest on the impaired financial assets (“unwinding of
discount”) is calculated and recognised using the rate of
interest used to discount future cash flows for the purpose
of measuring the related impairment loss.
Fee and commission income
Fee and commission income is recognised in the income
statement when the corresponding service is provided.
Origination or commitment fees received by the Bank which
result in the creation or acquisition of a financial asset are
deferred and recognised as an adjustment to the effective
interest rate. If the commitment expires without the Bank
making a loan, the fee is recognised as revenue on expiry.
Government grants
Government grants are non-reciprocal transfers of
monetary or non-monetary assets from the government
to the Bank except for capital contributions from the
government in the capacity as a shareholder of the Bank.
Special transfers from the government, such as investment
grants that have been clearly defined in official documents
as part of “capital reserve” are also dealt with as capital
contributions rather than government grants.
A government grant is recognised when there is reasonable
assurance that the grant will be received and that the Bank
will comply with the conditions attaching to the grant.
If a government grant is in the form of a transfer of a
monetary asset, it is measured at the amount received or
receivable. If a government grant is in the form of a transfer
of a non-monetary asset, it is measured at fair value.
A government grant related to an asset is recognised
initially as deferred income and amortised to profit or loss
(13)
(a)
(b)
(14)
on a straight-line basis over the useful life of the asset.
A grant that compensates the Bank for expenses to be
incurred in the future is recognised initially as deferred
income, and released to profit or loss in the periods
in which the expenses are recognised. A grant that
compensates the Bank for expenses already incurred is
recognised in profit or loss immediately.
Profit distributions to owners
Distr ibut ions of prof i t proposed in the prof i t
appropriation plan to be authorised by the Board of
Directors and declared after the balance sheet date are
not recognised as a liability at the balance sheet date
but are disclosed in the notes separately.
Related parties
If a party has the power to control, jointly control or
exercise significant influence over another party, or
vice versa, or where two or more parties are subject
to common control or joint control from another party,
they are considered to be related parties. Related
parties may be individuals or enterprises. Enterprises
with which the Bank is under common control only
from the State and that have no other related-party
relationships are not regarded as related parties.
Segment reporting
Reportable segments are identified based on operating
segments which are determined based on the structure
of the Bank’s internal organisation, management
requirements and internal reporting system after taking
materiality principle into account.
Two or more operating segments may be aggregated
into a single operating segment if the segments have
the same or similar economic characteristics and are
similar in respect of the nature of each segment’s
products and services, the nature of production
processes, the types or classes of customers for the
products and services, the methods used to distribute
(15)
(16)
(17)

46 47ANNUAL REPORT ANNUAL REPORT 2015 2015
(18)
(a)
(b)
(c)
(d)
(e)
03 Significant accounting policies and accounting estimates (continued)
the products or provide the services, and the nature of the
regulatory environment.
Inter-segment revenues are measured on the basis of the
actual transaction price for such transactions for segment
reporting, and segment accounting policies are consistent
with those for the Bank’s financial statements.
Significant accounting estimates and judgements
The preparation of f inancial statements requires
management to make estimates and assumptions that
affect the application of accounting policies and the
reported amounts of assets, liabilities, income and
expenses. Actual results may differ from these estimates.
Estimates as well as underlying assumptions and
uncertainties involved are reviewed on an ongoing basis.
Revisions to accounting estimates are recognised in the
period in which the estimate is revised and in any future
periods affected. Key sources of estimation uncertainty are
as follows:
Impairment losses of loans and advances
The Bank reviews the portfolios of loans and advances
periodically to assess whether impairment losses exist
and if they exist, an impairment loss is recognised.
Objective evidence for impairment includes observable
data indicating that there is a measurable decrease in the
estimated future cash flows identified with an individual
loan. It also includes observable data indicating adverse
changes in the repayment status of borrowers or issuers in
the assets portfolio or national or local economic conditions
that correlate with defaults on the assets in the portfolio.
The impairment loss for a loan that is individually assessed
for impairment is the decrease in the estimated discounted
future cash flow of that asset. When loans and advances
are collectively assessed for impairment, the estimate is
based on historical loss experience for assets with credit
risk characteristics similar to the loans and advances.
Historical loss experience is adjusted on the basis of the
relevant observable data that reflect current economic
conditions. Management reviews the methodology
and assumptions used in estimating future cash flows
periodically to reduce any difference between estimated
and actual losses.
Fair value of financial instruments
Financial instruments are carried at fair value in the
financial statements. The Bank adopts the valuation
techniques applicable in current circumstance and
supported by sufficient available data and other
information, to make the estimate on the price that
would be received to sell an asset or paid to transfer
a liability in an orderly transaction between market
participants at the measurement date. In adopting
the valuation techniques, the Bank makes sure of the
priority of use on observable inputs. However, in the
case that the observable inputs are not able to be
obtained or it is not feasible to obtain such inputs,
the Bank will use unobservable inputs and makes sure
that the relevant valuation techniques reflects the
observable market data. The unobservable inputs reflect
the most proper assumptions used by information-
obtainable market participants in relevant assets or
liabilities pricing. It shall be noted that some valuation
techniques require management estimates and
assumptions. Management estimates and assumptions
are reviewed periodically and are adjusted if necessary.
Impairment of fixed assets and intangible assets
As described in Note 3(7)(b), fixed assets and intangible
assets are reviewed at each balance sheet date to
determine whether the carrying amount exceeds the
recoverable amount of the assets. If any such indication
exists, related assets are regarded as impaired and
impairment losses recognised accordingly.
The recoverable amount of an asset (asset group) is the
greater of its fair value less costs to sell and its present
value of the expected future cash flows. When a market
price of the asset (the asset group) cannot be obtained
reliably, and the fair value of the asset cannot be estimated
reliably, the recoverable amount is calculated based on the
present value of estimated future cash flows. In assessing
the present value of estimated future cash flows, significant
judgements are exercised to estimate the asset’s selling
price, related operating expenses and discount rate to
calculate the present value. All relevant materials which can
be obtained are used for estimation of recoverable amount,
including the estimation of the selling price and related
operating expenses based on reasonable and supportable
assumptions.
Depreciation and amortization of assets such as fixed
assets and intangible assets
As described in Note 3(4) and 3(6), fixed assets and
intangible assets are depreciated and amortised over
their useful lives after taking into account residual value.
The useful lives of the assets are regularly reviewed to
determine the depreciation and amortisation costs charged
in each reporting period. The useful lives of the assets
are determined based on historical experience of similar
assets and estimated technical changes. If there have been
significant changes in the factors used to determine the
depreciation or amortisation, the rate of depreciation or
amortisation is revised prospectively.
Deferred income tax
When assessing whether there will be sufficient future
taxable profits available against which the deductible
temporary differences can be utilised, the Bank recognises
deferred tax assets to the extent that it is probable that
future taxable profits will be available against which the
deductible temporary differences can be utilised, using tax
rates that would apply in the period when the asset would
be utilised. In determining the amount of deferred tax
assets, the Bank exercises judgements about the estimated
timing and amount of taxable profits of the following
periods, and of the tax rates applicable in the future
according to the existing tax policies and other relevant
regulations. Differences between such estimates and
the actual timing and amount of future taxable profits
and the actual applicable tax rates affect the amount of
deferred tax assets that should be recognised.

48 49ANNUAL REPORT ANNUAL REPORT 2015 2015
(1)
(2)
(3)
04 Taxation
The major types of taxes applicable to the Bank and the tax
rates are as follows:
Business tax
Business tax is charged at 5% on taxable income (2014: 5%).
Income tax
The statutory income tax rate applicable to the Bank is
25%. The applicable income tax rate for the year is the
statutory rate (2014: 25%).
Taxes payable
Income tax payable
Business taxes and
surcharges payable
Withholding taxes payable
Total
132,958,123
78,495,251
44,088,780
255,542,154
111,489,967
89,738,459
44,854,206
246,082,632
05 Cash on hand and deposits with central bank
The Bank places statutory deposit reserves with the
People’s Bank of China (“PBOC”) in accordance with
the Regulation of the PRC on the Administration
of Foreign-funded Banks (the “Administrat ive
Regulation”) and relevant regulations. The statutory
deposit reserves are not available for use in the
Bank’s daily business. As at the balance sheet date,
the statutory deposit reserve rates applicable to the
Bank were as follows:
The surplus deposit reserves are maintained with the
PBOC mainly for settlement purposes.
The Bank places foreign exchange risk reserve with
the PBOC in accordance with relevant regulation since
October 2015. As at 31 December 2015, the foreign
exchange reserve rate is 20% of contract amount of
forward foreign exchange selling transactions for the
previous month.
Cash on hand
Statutory deposit reserves
with central bank
Surplus deposit reserve
with central bank
Foreign exchange risk
reserve with central bank
Total
Renminbi deposits
Foreign currency deposits
217,546,299
14,863,695,863
13,692,014,055
3,462,989,534
32,236,245,751
15.5%
5%
(1)
(2)
(3)
240,275,817
15,462,192,754
11,922,662,490
-
27,625,131,061
18%
5%
2015
2015
Note 2014
2014
(1)
(2)
(3)
2015 2014
(1)
(2)
(1)
(a)
(2)
06 Deposits with inter-banks and non-bank financial institutions
Analysed by counterparty
As at 31 December 2015, the Bank’s deposits with other
banks outside Mainland China included the part of the
investment funds regarding custodian services absorbed
from Qualified Domestic Institutional Investors business
(“QDII”), which was temporarily placed in investment
settlement accounts of other custodian bank outside
Mainland China, amounting to Renminbi 7,085,718,631
equivalent. The Bank operates these deposits with inter-
banks upon receiving instructions from QDII customers.
These deposits with inter-banks were with limited usage
(2014: Renminbi 5,371,966,886 equivalent).
Movements of allowance for impairment losses
34
Note
34
Note
6(1)(a)
6(2) 7(2)
Note Note
Deposits with other banks
- in Mainland China
- outside Mainland China
Subtotal
Deposits with non-bank financial institutions in Mainland China
Subtotal
Less:Allowance for impairment losses
Total
Placements with inter-banks
- in Mainland China
- outside Mainland China
Subtotal
Placements with non-bank financial institutions in Mainland China
Subtotal
Less:Allowance for impairment losses
Total
9,166,210,911
9,644,116,545
18,810,327,456
110,739,421
18,921,066,877
(48,220,209)
18,872,846,668
6,594,443,030
1,890,141,136
8,484,584,166
8,039,160,000
16,523,744,166
(23,316,595)
16,500,427,571
803,496,887
12,828,837,068
13,632,333,955
98,982,269
13,731,316,224
(62,255,170)
13,669,061,054
2,850,474,887
6,094,231,849
8,944,706,736
7,638,400,000
16,583,106,736
(41,468,074)
16,541,638,662
2015 20152014 2014
As at 1 January
(Reversal) / charge for the year
As at 31 December
As at 1 January (Reversal)
/ charge for the year
As at 31 December
62,255,170
(14,034,961)
48,220,209
41,468,074
(18,151,479)
23,316,595
31,885,890
30,369,280
62,255,170
41,050,762
417,312
41,468,074
2015
2015
2014
2014
07 Placements with inter-banks and non-bank financial institutions
Analysed by counterparty
Movements of allowance for impairment losses
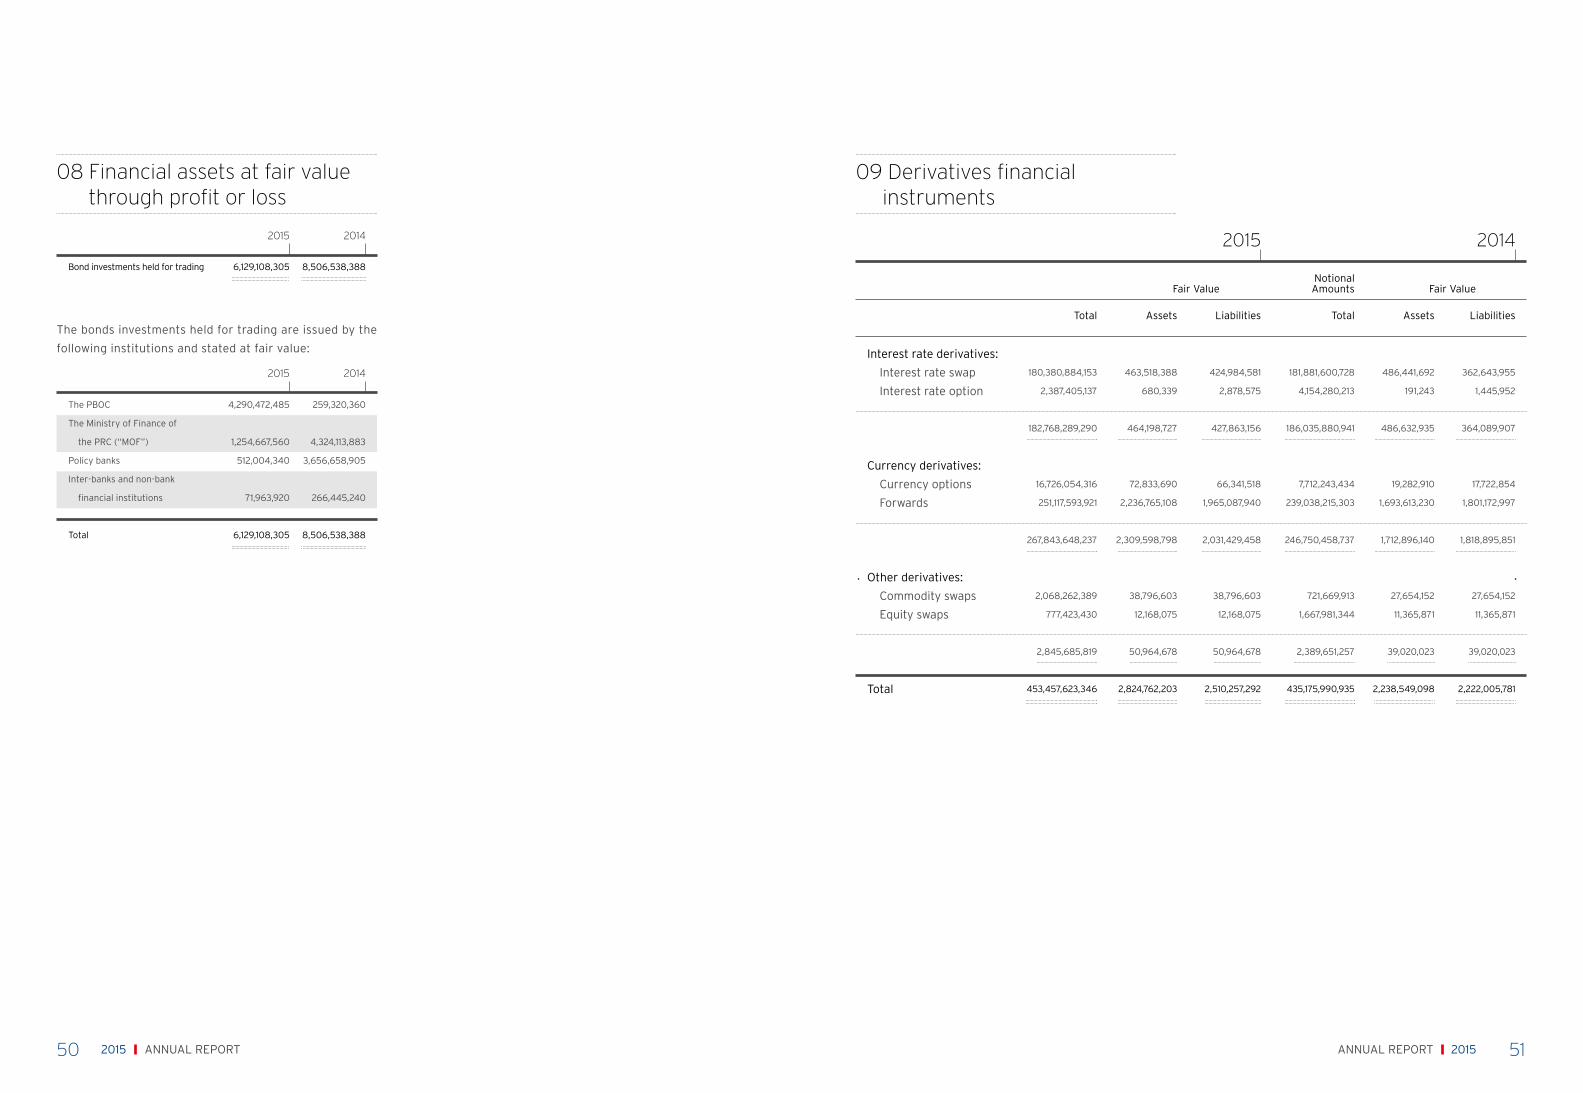
50 51ANNUAL REPORT ANNUAL REPORT 2015 2015
08 Financial assets at fair value through profit or loss
The bonds investments held for trading are issued by the
following institutions and stated at fair value:
2015 2014
Bond investments held for trading 6,129,108,305 8,506,538,388
2015 2014
The PBOC
The Ministry of Finance of
the PRC (“MOF”)
Policy banks
Inter-banks and non-bank
financial institutions
Total
4,290,472,485
1,254,667,560
512,004,340
71,963,920
6,129,108,305
259,320,360
4,324,113,883
3,656,658,905
266,445,240
8,506,538,388
09 Derivatives financial instruments
Interest rate derivatives:
Interest rate swap
Interest rate option
Currency derivatives:
Currency options
Forwards
Other derivatives:
Commodity swaps
Equity swaps
Total
180,380,884,153
2,387,405,137
182,768,289,290
16,726,054,316
251,117,593,921
267,843,648,237
2,068,262,389
777,423,430
2,845,685,819
453,457,623,346
181,881,600,728
4,154,280,213
186,035,880,941
7,712,243,434
239,038,215,303
246,750,458,737
721,669,913
1,667,981,344
2,389,651,257
435,175,990,935
463,518,388
680,339
464,198,727
72,833,690
2,236,765,108
2,309,598,798
38,796,603
12,168,075
50,964,678
2,824,762,203
486,441,692
191,243
486,632,935
19,282,910
1,693,613,230
1,712,896,140
27,654,152
11,365,871
39,020,023
2,238,549,098
424,984,581
2,878,575
427,863,156
66,341,518
1,965,087,940
2,031,429,458
38,796,603
12,168,075
50,964,678
2,510,257,292
362,643,955
1,445,952
364,089,907
17,722,854
1,801,172,997
1,818,895,851
27,654,152
11,365,871
39,020,023
2,222,005,781
2015 2014
Total TotalAssets AssetsLiabilities Liabilities
NotionalAmountsFair Value Fair Value

52 53ANNUAL REPORT ANNUAL REPORT 2015 2015
2015 2014Note
Corporate loans and advances
- loans
- discounted bills
Personal loans and advances
- residential mortgages
- personal consumer loans
- credit cards
Gross loans and advances
Less:Allowances for
impairment losses
Net loans and advances to customers
34,729,340,764
7,663,639,023
16,534,047,646
1,674,137,053
4,535,704,078
65,136,868,564
(1,231,045,522)
63,905,823,042
37,922,507,225
8,687,433,758
15,654,968,528
1,637,858,312
3,015,114,530
66,917,882,353
(655,472,105)
66,262,410,248
11(6)
11 Loans and advances to customers
10 Interest receivable
Movements of interest receivable during the year are as follows:
Analysed by nature(1)
Interest receivable 617,321,657 4,016,712,343 (4,181,868,586)
Balance at 1January 2015
Additionduring the year
Decreaseduring the year
Balance at 31 December 2015
452,165,414
Analysed by industry sector
* The percentages of these items are less than 1%.
Manufacturing
Wholesale and retail trade
Leasing and commercial services
Financial services
Mining
Telecommunications, IT services and software
Hotel and restaurant
Transportation, storage and postal services
Culture, sports and entertainment
Fisheries and agriculture
Resident services and other services
Real estate
Production and supply of electricity, gas and water
Others
Subtotal
Discounted bills
Personal loans and advances
Gross loans and advances
Less: Allowances for impairment losses
Net loans and advances to customers
18,802,491,710
4,789,473,609
4,056,670,649
1,775,428,898
1,770,846,151
1,203,294,495
925,634,887
745,242,095
393,440,875
90,098,708
88,555,741
53,154,314
3,133,613
31,875,019
34,729,340,764
7,663,639,023
22,743,888,777
65,136,868,564
(1,231,045,522)
63,905,823,042
29%7%6%3%3%2%1%1%1%
*0%*0%*0%*0%*0%
53%12%35%
100%
2015
11(6)
Note Amount %
2014
17,551,524,789
6,694,202,615
2,335,956,866
5,891,362,273
945,849,378
1,243,521,389
839,806,501
1,690,586,671
400,384,158
58,689,346
22,689,117
104,319,603
127,275,200
16,339,319
37,922,507,225
8,687,433,758
20,307,941,370
66,917,882,353
(655,472,105)
66,262,410,248
26%10%4%9%1%2%1%3%1%
*0%*0%*0%*0%*0%
57%13%
30%
100%
Amount %
11 Loans and advances to customers (continued)
(2)

54 55ANNUAL REPORT ANNUAL REPORT 2015 2015
11 Loans and advances to customers (continued)
Analysed by geographical sector
Analysed by security type
Yangtze River Delta
Bohai Rim
Pearl River Delta
Middle and western region
Northeastern region
Gross loans and advances
Less: Allowance for impairment losses
Net loans and advances to customers
Unsecured loans
Guaranteed loans
Secured loans
- by tangible assets other
than monetary assets
- by monetary assets
Gross loans and advances
Less: Allowance for impairment losses
Net loans and advances to customers
35,702,076,501
15,755,683,716
11,365,711,690
1,712,443,036
600,953,621
65,136,868,564
(1,231,045,522)
63,905,823,042
32,261,059,437
12,750,614,103
20,125,195,024
17,748,724,047
2,376,470,977
65,136,868,564
(1,231,045,522)
63,905,823,042
55%24%17%3%1%
100%
2015
2015
11(6)
Note
11(6)
Note Amount %
(3)
(4)
2014
2014
37,982,885,118
12,923,573,721
13,086,388,018
2,312,020,342
613,015,154
66,917,882,353
(655,472,105)
66,262,410,248
31,298,405,222
13,641,901,139
21,977,575,992
17,066,971,949
4,910,604,043
66,917,882,353
(655,472,105)
66,262,410,248
57%19%
20%3%1%
100%
Amount %
Unsecured loans
Guaranteed loans
Secured loans
- by tangible assets other
than monetary assets
Total
Unsecured loans
Guaranteed loans
Secured loans
- by tangible assets other
than monetary assets
- by monetary assets
Total
84,409,528
3,527,853
55,186,666
55,186,666
143,124,047
78,141,901
43,744,545
60,853,579
57,007,631
3,845,948
182,740,025
98,488,593
62,056,528
182,396,411
182,396,411
342,941,532
109,540,971
69,066,913
74,603,414
74,603,414
-
253,211,298
2015
Withinthree months
(inclusive)
Withinthree months
(inclusive)
Between three monthsand one year
(inclusive)
Between three monthsand one year
(inclusive)
Between one year and
three years(inclusive)
Between one year and
three years(inclusive)
2,066,587
32,135,972
83,828,622
83,828,622
118,031,181
8,329,541
15,251,076
73,534,912
73,534,912
-
97,115,529
Total
Total
185,104,159
97,720,353
332,821,646
332,821,646
615,646,158
197,656,843
130,862,037
303,464,219
299,618,271
3,845,948
631,983,099
2014
Over three years
139,451
-
11,409,947
11,409,947
11,549,398
1,644,430
2,799,503
94,472,314
94,472,314
-
98,916,247
Over three years
Overdue loans analysed by overdue period
Overdue loans represent loans and advances to customers,
of which the whole or part of the principal or interest was overdue.
(5)

56 57ANNUAL REPORT ANNUAL REPORT 2015 2015
Movements of allowances for impairment losses
Restructured loans and advances to customers
(6)
(7)
As at 1 January
Charge for the year
Written off for the year
Recoveries of loans and advances
previously written off
Exchange differences
As at 31 December
As at 1 January
(Reversal) / charge for the year
Unwinding of discount
Written off for the year
Exchange differences
As at 31 December
Restructured loans and advances to customers
243,761,903
501,354,285
-
-
10,344,584
755,460,772
331,332,619
(88,250,758)
-
-
680,042
243,761,903
411,710,202
418,373,378
(356,306,595)
1,807,765
-
475,584,750
263,485,385
194,382,817
(50,084)
(46,126,853)
18,937
411,710,202
-
Collectiveassessment
Collectiveassessment
Individualassessment
Individualassessment
2015
2015
Total
655,472,105
919,727,663
(356,306,595)
1,807,765
10,344,584
1,231,045,522
594,818,004
106,132,059
(50,084)
(46,126,853)
698,979
655,472,105
93,636,519
2014
2014
Total
As at 31 December 2015, the Bank’s loan provision ratio was 1.89% (2014: 0.98%), the provision coverage ratio was 256.78%
(2014: 134.30%).
Loan provision ratio represents ratio of loan loss provision over gross loans and advances to customers at the balance sheet date.
Provision coverage ratio represents ratio of loan loss provision over non-performing loans. According to the five-tier risk classifica-
tion in the Notice of the CBRC on Distributing the Guidelines on Loan Risk Classification (Yin Jian Fa [2007] No. 54), non-performing
loans represent loans and advances classified as substandard, doubtful and loss.
34
34
Note
Note
11 Loans and advances to customers (continued)
The available-for-sale bond investments are issued by the
following institutions and stated at fair value:
As at 31 December 2015, management considered that no al-
lowance for impairment losses on available-for-sale financial
assets was necessary (2014: nil).
As at 31 December 2015, management considered that
no allowance for impairment losses on fixed assets was
necessary (2014: nil).
12 Available-for-sale financial assets 13 Fixed Assets
21,053,400,460
19,946,532,960
1,106,867,500
21,053,400,460
20,322,383,530
20,222,644,930
99,738,600
20,322,383,530
2015 2014
2015 2014
Cost
As at 1 January 2014
Additions during the year
Disposals during the year
As at 31 December 2014
Additions during the year
Disposals during the year
As at 31 December 2015
Less: Accumulated depreciation
As at 1 January 2014
Charge for the year
Written off on disposal
As at 31 December 2014
Charge for the year
Written off on disposal
As at 31 December 2015
Carrying amount
As at 31 December 2015
As at 31 December 2014
363,840,662
16,361,590
(35,373,426)
344,828,826
13,064,444
(13,594,673)
344,298,597
(302,789,159)
(27,735,028)
34,361,717
(296,162,470)
(23,980,362)
13,133,031
(307,009,801)
37,288,796
48,666,356
4,498,155
-
(387,938)
4,110,217
-
(250,940)
3,859,277
(3,166,373)
(383,756)
387,938
(3,162,191)
(270,865)
250,940
(3,182,116)
677,161
948,026
368,338,817
16,361,590
(35,761,364)
348,939,043
13,064,444
(13,845,613)
348,157,874
(305,955,532)
(28,118,784)
34,749,655
(299,324,661)
(24,251,227)
13,383,971
(310,191,917)
37,965,957
49,614,382
Office & otherequipment
Motor vehicles Total
Bond investments
The MOF
The PBOC
Total

58 59ANNUAL REPORT ANNUAL REPORT 2015 2015
As at 31 December 2015, management considered that no allowance for impairment losses on intangible assets was necessary
(2014: nil).
14 Intangible assets
Software
Cost
Balance at 1 January 2014
Additions during the year
As at 31 December 2014
Additions during the year
Disposal during the year
Balance at 31 December 2015
Less: Accumulated amortisation
Balance at 1 January 2014
Charge for the year
Balance at 31 December 2014
Charge for the year
Written off on the disposal
Balance at 31 December 2015
Carrying amounts
At 31 December 2015
At 31 December 2014
174,699,426
3,293,152
177,992,578
218,898
(2,616,479)
175,594,997
(105,344,072)
(16,516,693)
(121,860,765)
(15,110,521)
65,070
(136,906,216)
38,688,781
56,131,813
At the balance sheet dates, the deferred tax assets and liabilities on the balance sheet, after offsetting each other, were
as follows:
Fair value adjustments for
derivative financial instruments
Fair value adjustments for
available-for-sale financial assets
Fair value adjustments for
financial assets at fair
value through profit or loss
Adjustments for accrued expenses
Allowance for impairment
losses against assets
Others
Total
Deferred tax assets
Deferred tax liabilities
Total
(3,524,661)
(15,570,911)
(1,545,080)
196,876,535
17,054,998
9,883,543
203,174,424
(79,188,647)
-
(2,924,356)
(74,674,591)
169,987,689
(7,686,519)
5,513,576
311,441,655
(99,222,499)
212,219,156
-
3,531,156
-
-
-
-
3,531,156
Deferred tax assets/(liabilities)
Balance at 1January 2015
Current yearincrease/decrease
charged toprofit or loss
Current yearincrease/decrease
recognisedin equity
Balance at 31December 2015
(82,713,308)
(12,039,755)
(4,469,436)
122,201,944
187,042,687
2,197,024
212,219,156
223,815,076
(20,640,652)
203,174,424
20142015
15 Deferred tax assets

60 61ANNUAL REPORT ANNUAL REPORT 2015 2015
16 Other assets
1,072,864,785
196,376,697
140,173,905
164,991,776
37,871
1,574,445,034
(34,482,775)
1,539,962,259
2014
1,577,571,337
18 Borrowings from other banks
Borrowings from other
banks
- outside Mainland China 9,105,409,697
2015 2014
Note 2015
As at 1 January
(Reversal) / charge for the year
Written off for the year
Exchange differences
As at 31 December
27,341,850
7,041,817
-
99,108
34,482,775
2014Note
34,482,775
(10,057,916)
(4,184,550)
593,105
20,833,414
2015
17 Deposits from inter-banks and non-bank financial institutions
Deposits from inter-banks
- in Mainland China
- outside Mainland China
Subtotal
Deposits from non-bank
financial institutions
- in Mainland China
- outside Mainland China
Subtotal
Total
114,825,373
11,492,284,833
11,607,110,206
849,646,326
11,474,043,548
12,323,689,874
23,930,800,080
2014
119,897,333
4,750,770,956
4,870,668,289
1,122,085,568
9,109,939,862
10,232,025,430
15,102,693,719
2015
Suspense settlement
Deferred expenses
Refundable deposits
Leasehold improvements
Others
Subtotal
Less: Allowance for
impairment losses
Total
544,266,050
191,997,804
174,396,393
173,103,295
-
1,083,763,542
(20,833,414)
1,062,930,128
Movements of provisions for other assets (1)
16(1)
34
20142015
Current deposits
- corporate customers
- personal customers
Subtotal of current deposits
Time deposits (including call deposits)
- corporate customers
- personal customers
Subtotal of time deposits
Other deposits
- inward and outward remittances
Total
56,077,137,472
5,401,036,277
61,478,173,749
29,385,696,708
8,917,560,941
38,303,257,649
104,130,424
99,885,561,822
71,536,521,309
6,314,455,717
77,850,977,026
38,429,914,664
8,290,136,417
46,720,051,081
241,341,647
124,812,369,754
19 Deposits from customers
20 Employee benefits payable
2015 2014
short-term employees benefits
post-employment benefits
- defined contribution plans
Other long-term employee benefits
Termination benefits
Total
(1)
(2)
(3)
271,078,110
16,837,177
14,313,620
9,165,741
311,394,648
214,360,705
13,522,416
18,586,640
-
246,469,761
Note

62 63ANNUAL REPORT ANNUAL REPORT 2015 2015
2015
Salaries, bonuses, allowances
Social insurances
Medical insurance
Work-related injury insurance
Maternity insurance
Housing fund
Non-monetary benefits
Other short-term employee benefits
Total
253,112,318
14,352,258
13,257,624
459,889
634,745
3,613,534
-
-
271,078,110
1,300,196,370
58,352,391
51,575,367
2,303,313
4,473,711
44,977,503
43,801,729
21,820,503
1,469,148,496
Balance at 31 December 2015
Accrued duringthe year
Paid duringthe year
Balance at 1 January 2015
(1,350,214,958)
(64,960,884)
(58,221,159)
(2,289,443)
(4,450,282)
(45,067,827)
(43,801,729)
(21,820,503)
(1,525,865,901)
203,093,730
7,743,765
6,611,832
473,759
658,174
3,523,210
-
-
214,360,705
(1) Short-term employee benefits
Non-monetary benefits mainly include rental residence and other welfare provided to employees. Relevant amounts are measured
based on the rent or service charges paid by the Bank.
20 Employee benefits payable (continued)
2014
Salaries, bonuses, allowances
Social insurances
Medical insurance
Work-related injury insurance
Maternity insurance
Housing fund
Non-monetary benefits
Other short-term employee benefits
Total
215,014,504
6,282,057
5,578,338
329,306
374,413
2,812,929
-
-
224,109,490
1,209,422,902
54,218,872
47,861,619
2,161,542
4,195,711
40,167,200
39,372,312
62,773,720
1,405,955,006
Balance at 31 December 2014
Accrued duringthe year
Paid duringthe year
Balance at 1 January 2014
(1,171,325,088)
(46,148,671)
(40,182,333)
(2,030,959)
(3,935,379)
(39,366,595)
(39,372,312)
(62,773,720)
(1,358,986,386)
253,112,318
14,352,258
13,257,624
459,889
634,745
3,613,534
-
-
271,078,110 Other long-term employee benefits represent deferred cash awards, which the Bank has granted to eligible employees based on
Citigroup internal policies and the Regulatory Guidelines for the Stability of Remuneration in Commercial Banks issued by the CBRC.
Instalments of deferred cash awards are paid to employees in certain proportion over the deferral period.
Basic pension insurance
Unemployment insurance
Annuity
Total
12,557,562
1,081,111
3,198,504
16,837,177
96,255,560
6,421,823
35,827,159
138,504,542
Balance at 31 December 2015
Accrued duringthe year
Paid duringthe year
Balance at 1 January 2015
(99,579,186)
(6,386,680)
(35,853,437)
(141,819,303)
9,233,936
1,116,254
3,172,226
13,522,416
Post-employment benefits-defined contribution plans
Other long-term employee benefits
(2)
(3)
2015
Basic pension insurance
Unemployment insurance
Annuity
Total
10,384,238
690,915
2,977,504
14,052,657
94,060,112
6,440,643
34,083,642
134,584,397
Balance at 31 December 2014
Accrued duringthe year
Paid duringthe year
Balance at 1 January 2014
(91,886,788)
(6,050,447)
(33,862,642)
(131,799,877)
12,557,562
1,081,111
3,198,504
16,837,177
2014
Balance at 31 December 18,586,640
2015 2014
14,313,620

64 65ANNUAL REPORT ANNUAL REPORT 2015 2015
21 Interest payable
Movements of interest payable during the year are as follows:
Interest payable 385,327,849 1,442,971,021 (1,647,348,463)
Balance at 1January 2015
Additionduring the year
Decreaseduring the year
Balance at 31 December 2015
180,950,407
Cash collaterals
Suspensed settlement
Accrued expenses
Deferred income
Others
Total
2,758,229,877
1,050,917,326
350,896,026
104,471,399
179,222,102
4,443,736,730
20142015
4,981,001,523
2,759,526,735
349,461,505
130,875,135
180,881,786
8,401,746,684
22 Other liabilities
24 Capital reserve
Citibank 3,970,000,000
2015 and 2014
Amount
100%
%Registered capital and paid-in capital
23 Paid-in capital
As at 31 December, the Bank’s registered capital and paid-in capital are as follows:
Capital contributions in foreign currency were translated into Renminbi at the exchange rate at the date of the contributions
received as quoted by the PBOC.
Certified Public Accountants have verified the above paid-in capital and issued related capital verification reports.
Equity-settled share-
based payments 25,911,6571,069,23024,842,427
2015
Balance at the beginning of the year
Addition duringthe year
Balance at the end of the year
Equity-settled share-
based payments 24,842,427(100,415)24,942,842
2014
Balance at the beginning of the year
Decrease duringthe year
Balance at the end of the year

66 67ANNUAL REPORT ANNUAL REPORT 2015 2015
Gain or losses arising from changes
in fair value of available-for-sale financial assets
25 Other comprehensive income
Balance at 1 January 2014
Increase during the year
Balance at 31 December 2014
Decrease during the year
Balance at 31 December 2015
(111,187,923)
157,900,654
46,712,731
(10,593,466)
36,119,265
26 Surplus reserve
27 General reserve
Balance at 1 January 2014
Profit appropriation
Balance at 31 December 2014
Profit appropriation
Balance at 31 December 2015
702,043,313
159,812,901
861,856,214
106,292,914
968,149,128
28(1)
28(1)
NoteStatutory
surplus reserve
General reserve appropriated in
accordance with the regulations issued by
the MOF
According to the Notice on Administrative Measures on
Accrual of Provisions by Financial Enterprises (Cai Jin
[2012] No.20) issued by the MOF on 30 March 2012, a
financial enterprise shall appropriate from net profits an
amount of not less than 1.5% of its risk-bearing assets at
the year-end as general reserve. Where the general pro-
vision ratio cannot reach 1.5% immediately, it is accepta-
ble to reach the ratio gradually over a period of not more
than five years in principle. This notice came effective on
1 July 2012. The Bank appropriates the general reserve in
accordance with the requirements of this notice.
Balance at 1 January 2014
Profit appropriation
Balance at 31 December 2014
Profit appropriation
Balance at 31 December 2015
1,476,690,285
105,712,237
1,582,402,522
179,802,495
1,762,205,017
28(2)
28(2)
Note
The statutory surplus reserve is as follows:
Appropriations to surplus reserve
The Bank appropriated an amount of Renminbi 106,292,914,
representing 10% of profit after tax for the year as surplus
reserve in accordance with relevant regulations and its
articles of association (2014: Renminbi 159,812,901).
Appropriations to general reserve
In accordance with the Notice on Administrative Measures on
Accrual of Provisions by Financial Enterprises (Cai Jin [2012]
No.20) (see Note 27), the Bank appropriated an amount of
Renminbi 179,802,495 from profit after tax for the year as
general reserve (2014: Renminbi 105,712,237). Such general
reserve forms part of the owner’s equity of the Bank.
28 Profit appropriation
Appropriations to surplus reserve
Appropriations to general reserve
(1)
(2)
106,292,914
179,802,495
286,095,409
159,812,901
105,712,237
265,525,138
20142015Note
(1)
(2)

68 69ANNUAL REPORT ANNUAL REPORT 2015 2015
The interest income from loans and advances to customers of the Bank for the year ended 31 December 2015 includes no
interest income from impaired financial assets (2014: Renminbi 50,084).
29 Net interest income
Interest income:
Loans and advances to customers
- corporate loans and advances
- discounted bills
- personal loans and advances
Placements with inter-banks and
non-bank financial institutions
Deposits with central bank
Deposits with inter-banks and
non-bank financial institutions
Others
Total interest income
Interest expenses:
Deposits from customers
Deposits from inter-banks and
non-bank financial institutions
Borrowings from inter-banks
Financial assets sold under repurchase agreements
Total interest expenses
Net interest income
1,532,204,096
355,981,835
1,319,990,371
440,627,387
261,035,459
20,518,592
7,531,624
3,937,889,364
(1,280,390,845)
(132,836,150)
(40,370,300)
(6,859,808)
(1,460,457,103)
2,477,432,261
(1) 2,060,689,694
423,840,283
1,200,388,562
496,995,506
274,775,031
25,825,465
4,198,654
4,486,713,195
(1,276,896,083)
(280,334,585)
(122,414,967)
(14,660,461)
(1,694,306,096)
2,792,407,099
2015 2014Note
(1)
Fee and commission income:
Commission on trust and custodian activities
Fees for agency services
Bank card fees
Trade finance and guarantee services fees
Settlement and clearance fees
Credit commitment fees
Others
Total fee and commission income
Fee and commission expenses:
Inter-bank transaction fees
Brokerage fees
Bank card settlement fees
Trust and custodian fees
Others
Total fee and commission expenses
Net fee and commission income
479,774,204
290,969,903
100,621,036
75,884,635
55,235,831
45,840,925
70,929,211
1,119,255,745
(49,464,720)
(31,408,710)
(9,442,212)
(1,895,467)
(4,719,504)
(96,930,613)
1,022,325,132
427,614,720
308,202,407
65,424,309
69,534,343
52,873,379
54,102,522
50,288,066
1,028,039,746
(43,652,534)
(35,058,785)
(6,410,048)
(631,993)
(4,013,007)
(89,766,367)
938,273,379
20142015
30 Net fee and commission income

70 71ANNUAL REPORT ANNUAL REPORT 2015 2015
Available-for-sale financial assets
- Interest income
- Net gains on sale of financial assets
and transferred from other
comprehensive income
Financial assets at fair value through profit or loss
- Interest income
- Net gains on sale of financial assets
Derivative financial instruments
Total
490,345,901
95,271,400
305,073,025
259,704,089
217,248,731
1,367,643,146
655,690,165
11,619,792
241,535,758
146,244,365
37,019,682
1,092,109,762
20142015
31 Investment income
Derivative financial instruments
Financial assets at fair value
through profit or loss
Total
38,186,542
9,626,101
47,812,643
279,524,872
11,697,423
291,222,295
2014
2014
2015
2015
32 Gains from changes in fair value
33 General and administrative expenses
Staff costs
- Salaries, bonuses and allowances, etc.
- Staff welfare
Service fees
Rental and property maintenance fees
Business promotion expenses
Depreciation and amortisation
Meetings and office expenses
IT equipment maintenance fees
Travelling expenses
Union fees
Utilities
Business entertainment expenses
Stamp duties
Others
Total
1,278,672,284
307,456,668
1,586,128,952
502,702,196
350,639,802
126,664,926
81,378,237
68,029,293
66,988,355
30,326,944
25,961,183
16,311,998
7,488,467
5,328,145
315,984,089
3,183,932,587
1,211,258,635
307,588,657
1,518,847,292
473,908,302
312,138,113
190,650,611
82,755,602
61,203,176
77,701,866
30,460,818
23,527,845
15,905,217
7,471,951
6,292,190
286,434,622
3,087,297,605

72 73ANNUAL REPORT ANNUAL REPORT 2015 2015
34 Impairment losses
Impairment losses charge for
loans and advances to customers
Impairment losses (reversal) / charge
for deposits with inter-banks and
non-bank financial institutions
Impairment losses (reversal) / charge
for placements with inter-banks and
non-bank financial institutions
Impairment losses (reversal) / charge
for other assets
Total
919,727,663
(14,034,961)
(18,151,479)
(10,057,916)
877,483,307
106,132,059
30,369,280
417,312
7,041,817
143,960,468
11(6)
6(2)
7(2)
16(1)
2015 2014Note Income tax expense for the year represents
Reconciliation between income tax expense and accounting profit is as follows:
Current tax expense for the year
Tax filling differences
Changes in deferred tax assets / liabilities
Total
263,695,730
(42,819,400)
(5,513,576)
215,362,754
20142015
414,156,804
(2,316,738)
(43,157,046)
368,683,020
35 Income tax expense
(1)
(2)
Profits before taxation
Expected income tax expense at a tax rate of 25%Tax effect of non-deductible expenses
Tax effect of non-taxable income
Tax filing differences
Adjustment in respect of deferred tax of prior year
Income tax expense
1,278,291,889
319,572,972
33,808,371
(141,309,084)
(42,819,400)
46,109,895
215,362,754
1,966,812,030
491,703,008
7,601,202
(128,304,452)
(2,316,738)
-
368,683,020
20142015

74 75ANNUAL REPORT ANNUAL REPORT 2015 2015
36 Other comprehensive income, net of tax
Items that may be reclassified to profit or loss
Gains arising from changes in fair value of
available-for-sale financial assets
Add: Reclassification adjustments for
amounts transferred to profit or loss
Less: Income tax
Total
49,420,420
(63,545,042)
3,531,156
(10,593,466)
134,239,329
77,062,461
(53,401,136)
157,900,654
20142015
Net profit
Add: Impairment losses charge for loans
and advances to customers
Impairment losses (reversal) / charge for deposits with
inter-banks and non-bank financial institutions
Impairment losses (reversal) / charge for placements with
inter-banks and non-bank financial institutions
Impairment losses (reversal) / charge for other assets
Depreciation of fixed assets
Amortisation of intangible assets
Amortisation of leasehold improvements
Losses on disposal of fixed assets, intangible assets
and other long-term assets
Investment income
Gains from changes in fair value
Increase in deferred tax assets
Interest income from impaired financial assets
Unrealised foreign exchange (gains) / losses
Increase in operating receivables
Increase in operating payables
Net cash inflow/(outflow) from operating activities
1,062,929,135
919,727,663
(14,034,961)
(18,151,479)
(10,057,916)
24,251,227
15,110,521
42,016,489
4,627,255
(538,134,599)
(291,222,295)
(5,513,576)
-
(531,845,670)
(4,523,204,993)
4,350,736,811
487,233,612
2015
37 Supplement to cash flow statement
1,598,129,010
106,132,059
30,369,280
417,312
7,041,817
28,118,784
16,516,693
38,120,125
1,119,408
(681,950,377)
(47,812,643)
(43,157,046)
(50,084)
247,173,983
(5,716,529,995)
3,748,903,664
(667,458,010)
2014
Reconciliation of net profit to cash flows from operating activities:(1)

76 77ANNUAL REPORT ANNUAL REPORT 2015 2015
2015
2015
2014
2014
Cash and cash equivalents at the end of the year
Less: Cash and cash equivalents at the beginning of the year
Net decrease in cash and cash equivalents
Cash on hand
Deposits with central bank available on demand
Deposits with inter-banks and non-bank
financial institutions with a maturity of three months or less
Placements with inter-banks and
non-bank financial institutions with a
maturity of three months or less
Financial assets at fair value through
profit or loss with a maturity of three months or less
Available-for-sale financial assets with
a maturity of three months or less
Total
Less:Deposits with inter-banks with limited usage
Cash and cash equivalents
31,954,113,642
(34,299,424,999)
(2,345,311,357)
217,546,299
13,692,014,055
18,921,066,877
5,214,586,042
994,619,000
-
39,039,832,273
(7,085,718,631)
31,954,113,642
34,299,424,999
(35,289,366,558)
(989,941,559)
240,275,817
11,922,662,490
13,731,316,224
7,327,704,897
3,224,282,457
3,225,150,000
39,671,391,885
(5,371,966,886)
34,299,424,999
Change in cash and cash equivalents:
Cash and cash equivalents held by the Bank are as follows:
(2)
(3)
37 Supplement to cash flow statement (continued)
Entrusted lending business
At the balance sheet dates, the entrusted loans and
funds were as follows:
Custodian business
At the balance sheet dates, the Bank’s Qualified Foreign
Institutional Investors business (“QFII”) and the Bank’s
Qualified Domestic Institutional Investors business
(“QDII”) balances were as follows:
Off-shore wealth management services
At the balance sheet dates, the Bank’s off-shore wealth
management services balances were as follows:
11,260,303,982
11,260,303,982
137,632,688,290
68,820,580,424
11,644,392,300
13,050,691,094
13,050,691,094
130,930,626,603
42,609,330,573
11,878,023,228
Expenses recognised for the year arising from share-based
payments are as follows:
The Bank’s share-based payment scheme is devised to re-
ward staff for their services.
As at 31 December 2015, the outstanding number of shares
in connection with share-based payments which the Bank
granted to its staff but not exercised is 97,042 (2014:
244,858). The above shares are the shares of Citigroup Inc..
38 Share-based payments 39 Fiduciary activities
Equity-settled share-based payments 8,170,471
(1)
(2)
(3)
Entrusted loans
Entrusted funds
QFII
QDII
Off-shore wealth
management services
2015
201517,898,575
2014
2014
2015 2014
2015 2014

78 79ANNUAL REPORT ANNUAL REPORT 2015 2015
Credit commitments
At any given time the Bank has outstanding commitments to
extend credit. The Bank provides loan commitments, unused
credit card facilities, financial guarantees and letters of credit
to guarantee the performance of customers to third parties.
The Bank assesses the potential loss of credit commitment on
a periodic basis and recognises provisions if necessary.
The contractual amounts for loan commitments and unused
credit card facilities represent the total amounts if the Bank
makes full payments. The amounts in the table for guarantees
and letters of credit represent the maximum potential loss that
would be recognised at the balance sheet date if counterpar-
ties failed to completely perform as contracted. Acceptances
comprise undertakings by the Bank to pay bills of exchange
drawn by customers. The Bank expects most acceptances to be
settled simultaneously with reimbursement from customers.
As the credit facilities may not be fully used upon maturity, the
contractual amount as set out below does not represent the
expected cash outflow in the future.
(1)
40 Commitments and contingent liabilities
Contractual amount
Unused credit card facilities
Loan commitments
- with an original maturity over
one year
- with an original maturity over
one year (inclusive)
Subtotal
Standby letters of credit and
guarantee letters issued
Bank drafts accepted
Letters of credit accepted
Letters of credit issued
Letters of credit confirmed
Subtotal
Total
15,867,986,565
2,638,362,196
211,879,929
2,426,482,267
18,506,348,761
6,631,902,850
499,008,621
213,417,878
329,452,374
21,296,309
7,695,078,032
26,201,426,793
11,996,975,373
2,351,999,105
123,428,000
2,228,571,105
14,348,974,478
5,451,032,810
799,910,000
309,600,625
561,958,811
26,512,004
7,149,014,250
21,497,988,728
20142015 Capital commitments
As at 31 December, the capital commitments of the Bank
were as follows:
Credit risk weighted amount of contingent liabilities and
commitments
The credit risk weighted amount refers to the amount as
computed in accordance with the Administrative Meas-
ures on Capitals of Commercial Bank (For Trial Implemen-
tation) (Yin Jian Hui Ling [2012] No.1) set out by the CBRC
and depends on the credit status of the counterparty and
the maturity characteristics.
Operating lease commitments
As at 31 December, the total future minimum lease payments
under non-cancellable operating leases of properties were
payable as follows:
Credit risk weighted amount of
contingent liabilities
and commitments
Within 1 year (inclusive)
After 1 year but within 2 years (inclusive)
After 2 years but within 3 years (inclusive)
After 3 years
Total
7,364,874,234
353,143,085
278,492,027
155,946,861
112,845,159
900,427,132
6,517,415,509
298,776,205
216,548,341
148,952,678
70,152,000
734,429,224
Leasehold improvement contracts
entered into but not performed or
performed partially
(2)
(3)
7,641,593 6,695,492
(4)
20142015
2015 2014
20142015

80 81ANNUAL REPORT ANNUAL REPORT 2015 2015
The MOF and the State Administration of Taxation jointly is-
sued the Notice on Full Launch of the Pilot Scheme on Levy-
ing Value Added Tax in Place for Business Tax (Cai Shui [2016]
No.36, the “Notice”) on 23 March 2016, effective 1 May 2016.
The Bank is mainly engaged in the financial services industry,
and is currently a taxpayer of business tax (see Note 4 for the
information of the business tax rate currently applicable to the
Bank). According to the Notice, the Bank shall pay value added
tax (“VAT”) starting on 1 May 2016. The basis for VAT payable
is to deduct input VAT from the output VAT calculated at the
applicable tax rates for the period. The Notice has no impact on
the carrying amount of the taxes payable on the balance sheet
of the Bank as at 31 December 2015. The Bank is still assessing
the impact of the Notice on its future tax burden.
41 Non-adjusting post balance sheet date events
Information on the parent of the Bank is listed as follows:
Transactions with the parent:
The balances of transactions with the parent at 31 December are set out as follows:
42 Related party relationships and transactions
(1)
(a)
(b)
Proportion ofvoting rights
Shareholdingpercentage
Stockholder’sequity
Principalactivities
Citibank 100% 100%USD
144,721 million
Banking and
inancial services
United States
RegisteredplaceCompany name
Deposits with inter-banks and
non-bank financial institutions
Placements with inter-banks and
non-bank financial institutions
Derivative financial assets
Interest receivable
Other assets
Deposits from inter-banks and
non-bank financial institutions
Borrowings from inter-banks
Derivative financial liabilities
Interest payable
Other liabilities
9,643,681,851
1,890,141,136
117,708,469
2,950,528
186,332,005
(569,180,924)
(1,577,571,337)
(187,133,251)
(3,765,600)
(259,439,476)
Interest income
Interest expenses
Fee and commission income
Fee and commission expenses
Investment losses
Gains /(losses) from changes in fair value
Other operating income
General and administrative expenses
42,967,661
(92,492,765)
196,005,953
(977)
(143,092,696)
248,375,919
18,550,019
(229,414,609)
40,077,830
(290,525,777)
215,788,092
(23,004)
(38,799,850)
(249,731,082)
3,432,172
(225,415,112)
12,827,220,477
6,094,231,849
191,821,508
3,146,721
428,407,830
(11,416,792,221)
(7,388,975,451)
(505,440,626)
(67,181,406)
(227,998,373)
2015
2015
2014
2014

82 83ANNUAL REPORT ANNUAL REPORT 2015 2015
The national amounts of derivative contracts with the parent at 31 December are set out as follows:
The balances of commitments with the parent at 31 December are set out as follows:
Forwards
Interest rate swaps
Interest rate options
Commodity swaps
Equity swaps
Currency options
Operating lease commitments
17,299,535,419
7,397,018,041
2,163,375,937
1,022,294,298
388,711,715
335,473,180
901,260
11,394,621,636
3,153,892,397
4,154,280,213
213,301,800
833,990,672
533,442
5,944,878
(c)
(d)
(e)
2015
2015
2014
2014
In addition, significant related party transactions with the Bank’s parent approved by Related Party Transaction Control Com-
mittee and the Board of Directors during the year are set out as follows:
The Bank outsourced the non-Renminbi cash operation, funds and securities operation and technology related service to
Citibank N.A. Singapore Branch. Such outsourcing services cost the Bank Renminbi 218,917,123 in general and administrative
expenses in the year 2015 (2014: Renminbi 213,605,184).
A significant related party transaction represents a single transaction conducted between the Bank and a related party where
the transaction amount is 1% or more of the total equity of the Bank, or after this transaction, the total balance with the related
party is 5% or more of the total equity of the Bank.
42 Related party relationships and transactions (continued)
Transactions between the Bank and its key management personnel and their close family members
Transactions with the key management personnel and their close family members:
The balances of transactions with the Bank’s key management personnel and their close family members at 31 December are
set out as follows:
The balance of credit commitments with the Bank’s key management personnel and their close family members at 31 December
are set out as follows:
94,330,292
3,488,544
1,039,140
1,062,151
(12,958,835)
(24,759,453)
8,797,849
97,877,776
2,646,477
1,159,807
766,779
(12,589,787)
(25,284,121)
8,433,221
(2)
(a)
(b)
(c)
Remuneration of key management personnel
Maximum loans and advances issued to key
management personnel and their close family members
Residential mortgages
Credit cards loans
Deposits from customers
Employee benefits payable
Credit commitments
2015
2015
2015
2014
2014
2014
Related parties of the Bank include close family members of its key management personnel, key management personnel of the
Bank’s parent, close family members of key management personnel of the Bank’s parent, other enterprises that are controlled
or jointly controlled by its key management personnel and close family members of such individuals. The Bank’s transactions
with these related parties are insignificant, thus not disclosed separately.

84 85ANNUAL REPORT ANNUAL REPORT 2015 2015
Credit transactions between the Bank and its related personnel
Basic information of the related personnel that have residential mortgage transactions with the Bank
85 other related personnel are involved in credit card transactions with the Bank.
The credit balances with the Bank’s other related personnel are set out as follows:
(3)
(a)
(b)
(c)
Besides the key management personnel information listed in Note 42(2), the Bank discloses the credit transactions be-
tween the Bank and its related personnel according to the requirement of paragraph 38 of the Administrative Measures
for the Related Party Transactions between Commercial Banks and Their Insiders or Shareholders (Order of the CBRC
(2004) No.3).
The Bank’s related personnel include the Bank’s insiders, controlling shareholders, directors or key management person-
nel of the Bank’s related legal entities or other organisations. Insiders include the Bank’s directors, senior management
personnel of the head office and branches and other personnel who have the power to decide or participate in the exten-
sion of credit or transfer of assets by the Bank.
The credit transaction information relating to the Bank’s executive vice president, Yu Jin, is disclosed in Note 40(2) and thus
not included here.
Yu Jin
Zhang Xiaomeng
Ye Yan
Yuan Ying
Executive vice president
Vice president of Shanghai Branch
Branch manager of Shanghai West Nanjing Road Sub-branch
Branch manager of Guangzhou Fortune Plaza Sub-branch
Name Title
1,495,120
1,276,369
Loans and advances to customers
- Residential mortgage
- Credit card loans
1,717,050
767,036
2015 2014
42 Related party relationships and transactions (continued)
The credit commitments with the Bank’s other related personnel is set out as follows:
The Bank has credit commitments with 104 other related personnel.
Transactions between the Bank and other related parties
Transactions with other related parties:
The transactions and percentages between the Bank and its non-bank related parties are set out as follows:
(d)
(4)
(a)
8,709,631 5,805,964Credit commitments
2015 2014
10.82%2.73%
344,457,426
87,057,189
10.72%2.22%
330,671,696
68,466,271
General and administrative expenses
- Services received
- Rental of properties
%2015 %2014
11,840,832
(1,959,494)
3,051,921
(3,152,157)
(127,825,940)
(3,302,845)
4,489,788
(431,514,615)
14,891,800
(818,900)
3,674,768
(2,495,838)
(124,552,482)
83,007
3,432,130
(399,137,967)
Interest income
Interest expenses
Fee and commission income
Fee and commission expenses
Investment losses
(Losses) / gains from changes in fair value
Other operating income
General and administrative expenses
2015 2014

86 87ANNUAL REPORT ANNUAL REPORT 2015 2015
Transactions between the Bank and other related parties (continued)
The balances of transactions with other related parties at 31 December are set out as follows:
The balances and percentages of transactions with non-bank related parties at 31 December are set out as follows:
(4)
(b)
1.75%
0.98%0.13%
289,800,000
43,559,852
5,989,027
1.44%
0.70%0.08%
239,500,000
58,778,743
6,593,262
Placement with non-bank financial institutions
Other liabilities
- Service fee payable
- Rental fee payable
%2015 %2014
42 Related party relationships and transactions (continued)
27,238
289,800,000
124,894
1,059,437
8,739,506
(366,172,473)
(703,259)
(350,994,843)
(77,580)
(51,626,325)
86,571
296,500,000
8,493,269
1,793,889
8,195,795
(307,983,593)
(26,664,777)
(376,673,435)
(60,899)
(66,046,281)
Deposits with inter-banks and non-bank financial institutions
Placements with inter-banks and non-bank financial institutions
Derivative financial assets
Interest receivable
Other assets
Deposits from inter-banks and non-bank financial institutions
Derivative financial liabilities
Deposits from customers
Interest payable
Other liabilities
2015 2014
The notional amounts of derivative contracts with other related parties at 31 December are set out as follows:
The balances of commitments with other related parties at 31 December are set out as follows:
In addition, the significant related party transactions with other related parties approved by the Bank’s Related Party
Transaction Control Committee and the Board of Directors are set out as follows:
Outsourcing of China Data Centre processing and management services, software application and enhancement and technical
support to Citigroup Services and Technology (China) Ltd. (previously named “Citigroup Software Technology and Services
(China) Ltd.”), was approved in prior years. Such outsourcing services cost the Bank Renminbi 324,148,630 in general and
administrative expenses in the year 2015 (2014: Renminbi 323,351,484).
(c)
(d)
(e)
155,025,232175,505,147Operating lease commitments
2015 2014
Interest rate swaps
Currency options
Forwards
Commodity swaps
1,245,247,802
644,330,979
462,648
-
1,817,417,697
2,279,674,519
8,558,420
142,732,240
2015 2014

88 89ANNUAL REPORT ANNUAL REPORT 2015 2015
Company type
Relationshipswith the Bank
Companyname
Principle activities
Citigroup Services and Technology
(China) Ltd. (previously named
“Citigroup Software and Technology
Services (China) Ltd.”)
Hubei Jingzhou Gong’an
Citi Lending Co., Ltd.
Dalian Wafangdian
Citi Lending Co., Ltd.
Hubei Xian’ning Chibi
Citi Lending Co., Ltd.
Chongqing Beibei Citi Lending
Co., Ltd.
Citigroup Commodity (Shanghai)
Co., Ltd.
CitiRealty China (BVI) Limited
Citigroup Trade Services
(Malaysia) Sendirian Berhad
Citicorp International Limited
Citicorp Service India Private Limited
Diners Club International (Hong Kong) Ltd.
Citishare Corporation
Citibank Singapore Ltd.
Citigroup Global Market Asia Ltd.
Citibank Taiwan Limited
Citibank Uganda Limited
Citibank Japan Ltd.
Citibank Europe PLC
Limited liabilities
company (WOFE)
Limited liabilities
company (WOFE)
Limited liabilities
company (WOFE)
Limited liabilities
company (WOFE)
Limited liabilities
company (WOFE)
Limited liabilities
company (WOFE)
Private company
Private company
Private company
Private company
Private company
Private company
Public company
Private company
Public company
Private company
Private company
Public company
Group subsidiary
Group subsidiary
Group subsidiary
Group subsidiary
Group subsidiary
Group subsidiary
Group subsidiary
Group subsidiary
Group subsidiary
Group subsidiary
Group subsidiary
Group subsidiary
Group subsidiary
Group subsidiary
Group subsidiary
Group subsidiary
Group subsidiary
Group subsidiary
Software development,
back office operation and
consulting and training
on finance knowledge
Credit business
Credit business
Credit business
Credit business
Commodity trading
Property holding
Outsourcing service
Banking
Decision support
and vendor oversight
Charge card business
ATM processing
Banking
Investment banking business
Banking
Banking
Banking
Banking
Transactions between the Bank and other related parties (continued)
Relationships between the Bank and related parties under the transactions stated in 42(4)(a) to (e) above
*These related parties were registered outside Mainland China where legal representatives are not required.
(4)
(f)
42 Related party relationships and transactions (continued)
Changes inregistered capital
for the yearRegistered
placeRegistered
capitalLegal
representative
PRC
PRC
PRC
PRC
PRC
PRC
British Virgin
Island
Malaysia
Hong Kong
India
Hong Kong
United States
Singapore
Hong Kong
Taiwan
Uganda
Japan
Ireland
USD 17,350 thousand
Renminbi
34,000 thousand
Renminbi
34,000 thousand
Renminbi
34,000 thousand
Renminbi
38,800 thousand
USD 3,000 thousand
USD 50 thousand
MYR 5,000 thousand
HKD 187,556 thousand
INR 2,500 million
HKD 800 thousand
USD 1 thousand
SGD 1,527,730 thousand
HKD 301,951 thousand
NT$ 66,033 million
UGX 43,923,900 thousand
JPY 123,100 million
USD 10,071 thousand
No changes
No changes
No changes
No changes
No changes
No changes
No changes
No changes
No changes
No changes
No changes
No changes
No changes
No changes
No changes
No changes
No changes
No changes
Low Fatt Leong
Liu Jie
Liu Shilu
Li Sizhen
Li Zhengquan
Zhao Qingqing
*
*
*
*
*
*
*
*
Guan Guolin
*
*
*
90 91ANNUAL REPORT ANNUAL REPORT 2015 2015
(5) Transactions with the annuity plan
Apart from the obligations for defined contributions to
the annuity plan, no other transactions were conducted
between the Bank and the annuity plan during the year.
42 Related party relationships and transactions (continued)
(1)The Bank has two reportable segments, which are corporate
banking and personal banking segment, determined based
on the structure of its internal organisation, management
requirements and internal reporting system. Each reportable
segment is a separate business unit which offers different
products and services, and is managed separately because
they require different technology and marketing strategies.
The financial information of the different segments is
regularly reviewed by the Bank’s management to make
decisions about resources to be allocated to each segment
and assess its performance.
Corporate banking
This segment provides a range of financial products and
services to corporations and financial institutions, including:
corporate deposit taking activities, corporate short-term,
medium-term and long-term loans, bank acceptances and
bills discounted, government bonds and financial bonds
transactions, foreign currency securities transactions other
than stocks, letters of credit and guarantees, corporate
domestic and foreign settlements, foreign exchange trade
and agent services, inter-bank placements and borrowings,
safe deposit box services, credit investigation and advisory
services.
Personal banking
This segment provides a range of financial products and
services to individual customers, including: personal deposit
taking activities, personal short-term, medium-term and
long-term loans, personal domestic and foreign settlement,
foreign exchange trade and agent services, insurance agent
services, bank card services and safe deposit box services.
Unallocated items
This segment mainly includes assets, liabilities, income and
expenses which cannot be directly attributed to or divided
reasonably to segments.
Segment results, assets and liabilities
For the purposes of assessing segment performance
and allocating resources between segments, the Bank’s
management regularly reviews the assets, liabilities, revenue,
expenses and financial performance, attributable to each
reportable segment on the following basis:
Segment assets include all tangible, intangible, other non-
current and current assets such as receivables, with the
exception of deferred tax assets and other unallocated
corporate assets. Segment liabilities include deposits
from customers, deposits from inter-banks and non-bank
financial institutions, borrowings from inter-banks and
other liabilities attributable to the individual segments.
Financial performance of each segment is operating
income (including operating income from external
customers and inter-segment operating income) after
deducting expenses, depreciation, amortisation and
impairment losses attributable to the individual segments.
Inter-segment sales are determined with reference to
prices charged to external parties for similar orders. Non-
operating income and expenses and tax expenses are not
allocated to individual segments. Information regarding
the Bank’s reportable segments set out below includes
the information used for assessing segment performance
and allocating segment assets and liabilities by the Bank’s
management or not used but regularly reviewed by the
Bank’s management:
43 Segment reporting

92 93ANNUAL REPORT ANNUAL REPORT 2015 2015
Corporate banking
2015 2014
1. Operating income
Net interest income
Net fee and commission income
Other income (Footnote)
2. Operating expenses
Include: Depreciation and amortisation
Impairment losses
3. Operating profit / (loss)
Add: Non-operating income
Less: Non-operating expenses
4. Profit / (loss) before income tax
5. Total assets
6. Total liabilities
3,713,713,003
1,753,167,156
236,825,906
1,723,719,941
(1,625,240,325)
(36,252,351)
(27,112,628)
2,088,472,678
-
-
2,088,472,678
136,236,998,744
120,557,561,181
3,702,295,635
1,294,519,995
299,631,481
2,108,144,159
(2,178,404,554)
(31,262,100)
(543,909,542)
1,523,891,081
-
-
1,523,891,081
139,811,130,748
122,769,136,506
2015 2014
Personal banking
1,797,392,522
1,039,239,943
701,447,473
56,705,106
(1,923,119,169)
(46,503,251)
(116,847,840)
(125,726,647)
-
-
(125,726,647)
21,191,743,408
23,930,768,012
1,970,326,246
1,182,912,266
722,693,651
64,720,329
(2,213,217,022)
(50,116,137)
(333,573,765)
(242,890,776)
-
-
(242,890,776)
23,303,233,532
26,360,454,648
Footnote: Other income includes investment income, gains or losses from changes in fair value, foreign exchange gains or losses and other operating income.
43 Segment reporting (continued)
2015 2014
-
-
-
-
-
-
-
-
6,163,801
(2,097,802)
4,065,999
203,174,424
-
-
-
-
-
-
-
-
-
2,663,219
(5,371,635)
(2,708,416)
212,219,156
-
Unallocated items
2015 2014
5,511,105,525
2,792,407,099
938,273,379
1,780,425,047
(3,548,359,494)
(82,755,602)
(143,960,468)
1,962,746,031
6,163,801
(2,097,802)
1,966,812,030
157,631,916,576
144,488,329,193
5,672,621,881
2,477,432,261
1,022,325,132
2,172,864,488
(4,391,621,576)
(81,378,237)
(877,483,307)
1,281,000,305
2,663,219
(5,371,635)
1,278,291,889
163,326,583,436
149,129,591,154
Total

94 95ANNUAL REPORT ANNUAL REPORT 2015 2015
Operating incomefrom external customers
Major customers
Operating income from each individual customer of the Bank is below 10% of the Bank’s total operating income in both 2015
and 2014.
(2)
(3)
Geographic information
The following table sets out information about the geographical location of the Bank’s operating income from external
customers and the Bank’s non-current assets (excluding financial assets, deferred tax assets, same as below). The
geographical information is based on the location of customers receiving services. The geographical location of the specified
non-current assets is based on the physical location of the asset, in the case of fixed assets; and the location of the operation
to which they are allocated, in the case of intangible assets.
In Mainland China
Outside Mainland China
2015 2014
Specifiednon-current assets
270,737,971
-
270,737,971
249,758,033
-
249,758,033
2015 2014
6,549,150,043
746,027,945
7,295,177,988
6,752,869,091
477,140,506
7,230,009,597
43 Segment reporting (continued)
(1)The Bank is exposed to many financial risks due to its
operating activities. The Bank analyses, evaluates, accepts
and manages risks, or risk portfolios at different levels.
The Bank’s main operating risks include credit risk, market
risk, liquidity risk and country risk. Market risks include
interest rate risk, foreign currency risk and other price risk.
The Bank’s objective is to reach an appropriate balance
between risks and rewards, while minimising the negative
impact on its financial statements.
The Bank’s risk management policies aim to identify
and analyse risks to establish appropriate risk limits and
control measures, and to monitor risks and risk limits via
an information system.
The Bank’s Board of Directors is responsible for
establishing the Bank’s risk management strategy. The
Bank’s Risk Management Committee is in charge of the
management and supervision responsibilities related to
risk control of the Bank, including periodically assessing
the Bank’s overall risk exposures, providing guidance
for developing a sound risk management and internal
control strategies and policies, and monitoring their
implementation. The Risk Management Committee reports
to the Board of Directors. The Bank’s senior management is
responsible for establishing risk management policies and
procedures, including specific risk management policies
for credit risk, interest rate risk and foreign currency risk
based on the risk management strategy approved by the
Risk Management Committee and Board of Directors.
These risk management policies are performed by different
head office departments upon approval from the Board of
Directors. The Internal Audit Department of the Bank is
responsible for independently inspecting risk management
and internal control.
Credit risk
Credit risk is the risk that one party to a financial
instrument will cause a financial loss for the other
party by failing to discharge an obligation. Credit
risk mainly arises from credit business. In treasury
transactions, credit risk refers to the possibility
that the value of the assets held by the Bank may
decrease due to a fall in the rating of the issuer of
the debt securities.
Credit business
Considering the market economic environment,
b u s i n e s s d e v e l o p m e n t s t r a t e g y a n d t h e
requirements of clients, the Bank provides various
direct credit, credit commitment and derivative
financial businesses in the scope of risk control
to foreign-invested companies set up in the PRC
by multinationals, domestic companies with good
credit standing, as well as individual customers of
good credit.
T h e B a n k h a s e s t a b l i s h e d a s t r i c t c r e d i t
management system, including credit approval,
daily credit monitoring, remedial management,
policies for loan loss provisioning and loan write-
off and restructuring.
The Bank adopts the loan r i sk c lass i f i cat ion
approach introduced by Citigroup to monitor the
risk condition of its loan portfol ios. Loans are
classified by a five-tier grading system: pass / Pass
Watch List (PWL), special mention/substandard
(accruing), substandard (non-accruing), doubtful
and loss, according to risk levels. The five-tier
grading for loans and advances is def ined as
follows:
44 Risk management

96 97ANNUAL REPORT ANNUAL REPORT 2015 2015
Definition of consumerbanking*/ corporatebanking
Definition of corporatebanking
Internal creditgrading
Pass
PWL
Special Mention
Substandard
(accruing)
Substandard
(non-accruing)
Doubtful
Loss
No evident weakness
Has potential weakness, yet the borrower is in
stable condition and can fulfil the contract at
present. The borrower will not be affected by the
potential weakness in the coming twelve to eight-
een months. There is no doubt that the principal
and interest will be overdue.
Has potential weakness that deserves manage-
ment’s close attention. If left uncorrected, the
potential weakness may result in deterioration of
the repayment capacity or credit position of the
borrower in the future.
Has potential weakness, yet no material impact
on overall repayment capacity of the borrower
and the probability of credit loss is low.
Inadequately protected by the current net assets
and repayment capacity of the borrower. Assets
so classified must have one or more evident
weaknesses that jeopardise the timely repay-
ment of its obligations. Certain losses might
incur even if collaterals are realised.
Repayment in full is with significant doubt or even
impossible considering the current weakness noted.
Nearly uncollectible or only collectible for minor
part, which indicates that it shall no-longer be rec-
ognised due to the few recovery.
No overdue records
No overdue records
1-89 days overdue
1-89 days overdue
90-179 days overdue
180-359 days overdue
Over 360 days overdue
* The definition is taking personal mortgage loan for example. The consumer banking sets out different internal credit gradings according to the overdue days for different products.
44 Risk management (continued)
(1) Credit risk (continued) A comparison of the Bank’s loan risk classification criteria and Yin Jian Fa [2007] No. 54 has been filed with the CBRC as follows:
DefinitionFive-tiergradingDefinition
Internal credit grading
Pass/PWL
Special mention /
substandard (accruing)
Substandard (non-accruing)
Doubtful
Loss
No evident weakness
Has potential weakness that
deserves close attention
Has evident weaknesses that
jeopardise the repayment
capacity of the borrower
Highly questionable or
improbable for repayment
in full
Uncollectible
Normal
Special mention
Substandard
Doubtful
Loss
Normal loans
The repayment might be
adversely affected by some
factors
The borrower’s capacity to repay
is apparently in question and
certain losses might occur even
when guarantees are executed
Cannot repay principal and
interest in full and significant
losses will occur even when
guarantees are executed
Principal and interest cannot be
recovered after taking all possible
measures

98 99ANNUAL REPORT ANNUAL REPORT 2015 2015
(1)
(a)
Credit risk (continued)
The Bank manages, restricts and controls identified credit
concentration risks, especially credit risks concentrated on
a single borrower, group or industry. The Bank sets limits on
the same borrower, group or industry to optimise its credit
risk structure. The Bank monitors these risks regularly, and
reviews them annually or more frequently if necessary. The
Bank manages credit risk via timely analysis of the borrow-
er’s ability to repay the principal and interest, and adjusts
its credit lines accordingly. Other specific risk management
and mitigation measures include the following:
The Bank mitigates credit risk by obtaining collateral,
guarantees and security from companies or individuals.
The Bank has specified categories of acceptable collateral,
including properties, commercial assets (commercial prop-
erties and accounts receivables), and financial instruments
(bonds and stocks). To reduce credit risk, the Bank has
stipulated discount rates for different collaterals (the ratio
between the fast cash realisable value to the market fair
value of the collateral) to reflect the cash realisable value.
For a loan guaranteed by a third party, the Bank assesses
the guarantor’s financial condition, historical credit record
and ability to settle the debts on behalf of the borrower.
Except for loans, collaterals or guarantees needed for other
financial assets shall be determined by the nature of the
instruments. Generally, no collaterals are designated for
investments in debt securities, treasury bonds and other
notes.
Treasury business
The Bank sets credit limits based on the credit risk in-
herent in the products, counterparties and geographical
area. The system closely monitors the credit exposure
on a real-time basis. The Bank regularly reviews its cred-
it limit policies and routinely updates the credit limits.
Maximum credit risk exposure
The maximum exposure to credit risk is represented by
the carrying amount of each financial asset, including
derivative financial instruments, in the balance sheet.
The maximum exposure to credit risk in respect of these
financial guarantees at the balance sheet date is dis-
closed in Note 40(1).
44 Risk management (continued)
Distribution of loans and advances to customers in terms of credit quality
479,420,156
(475,584,750)
3,835,406
136,226,002
(2,168,323)
134,057,679
64,521,222,406
(753,292,449)
63,767,929,957
63,905,823,042
488,076,462
(411,710,202)
76,366,260
143,906,637
(1,705,370)
142,201,267
66,285,899,254
(242,056,533)
66,043,842,721
66,262,410,248
20142015Note
Impaired
Individually assessed and impaired gross amount
Allowance for impairment losses
Carrying amount subtotal
Overdue but not impaired
- within three months (inclusive)
Allowances for Impairment losses
Carrying amount subtotal
Neither overdue nor impaired
Gross amount
Allowances for Impairment losses
Carrying amount subtotal
Total carrying amount
(i)
(ii)
(ii)
(b)
(i) As at 31 December 2015, the overdue but not impaired loans and advances to customers amounted to Renminbi 136,226,002
(2014: Renminbi 143,906,637). The covered portion and uncovered portion of these loans and advances were Renminbi
55,186,666 (2014: Renminbi 60,853,579) and Renminbi 81,039,336 (2014: Renminbi 83,053,058), respectively. The fair val-
ue of collaterals held against these loans and advances to customers amounted to Renminbi 153,987,293 (2014: Renminbi
170,564,586).
The fair value of these collaterals was estimated by the Bank based on the external valuations adjusted after taking into ac-
count the current realisation experience in view of the collaterals and pledges as well as the latest market situation.
The balances represent collectively assessed allowance of impairment losses.(ii)

100 101ANNUAL REPORT ANNUAL REPORT 2015 2015
266,445,240
28,562,476,678
28,828,921,918
32,063,702,989
2,079,870,971
1,301,237,083
35,444,811,043
27,226,293,199
1,212,451,750
1,875,678,011
30,314,422,960
71,963,920
27,110,544,845
27,182,508,765
AAA
AA - to AA+
Total
Distribution of debt securities in terms of credit quality
Debt securities include financial assets at fair value through profit or loss and available-for-sale financial assets.
The carrying amounts of debt securities analysed by the external rating agency Standard & Poors’ designations at the balance
sheet dates were as follows:
(1)
(c)
(d)
Credit risk (continued)
Distribution of amounts due from inter-banks in terms of credit ratings of counterparties
Amounts due from inter-banks include deposits and placements with inter-banks and non-bank financial institutions. As
at balance sheet date, distribution of amounts due from inter-banks in terms of credit quality mainly with reference to the
external rating agency Standard & Poors’ was as follows (counterparties without external ratings are presented using their
parent companies’ ratings):
Neither overdue nor impaired
- A to AAA
- B to BBB+
- unrated
Total
2015
2015
2014
2014
44 Risk management (continued)
(2) Market risk
Market risk management involves an overall process of mar-
ket risks identification, measurement, monitoring and con-
trol. Market risk refers to the risk of financial instruments’
fair value or future cash flow fluctuations due to changes in
market prices, including interest rate risk, foreign currency
risk and other price risk. Interest rate risk refers to the risk
of financial instruments’ fair value or future cash flow fluctu-
ations due to changes in interest rates; foreign currency risk
refers to the risk of financial instruments’ fair value or future
cash flow fluctuations due to changes in foreign exchange
rates; other price risk refers to the market risks other than
foreign currency risk and interest rate risk.
The Bank’s interest rate risk includes the risks arising from
mismatches of the term structures of assets and liabilities
related to banking business and from positions held for trad-
ing purpose in treasury transactions. The Bank calculates its
interest rate risk exposure according to the maturity dates
of all its interest-bearing assets and liabilities, and performs
daily interest rate sensitivity analysis and periodical stress
test. Meanwhile, by closely observing interest rate trends
(both in Renminbi and foreign currency) and market interest
rate changes, the Bank conducts proper scenario analysis
and makes timely adjustments to the loan and deposit inter-
est rates (both in Renminbi and foreign currency) in line with
the benchmark interest rates to reduce its interest rate risk.
The Bank’s foreign currency risk exposures mainly arise
from on balance sheet assets and liabilities designated in
foreign currencies and off balance sheet derivatives des-
ignated in foreign currencies. The Bank’s main principle of
currency risk control is to match the assets and liabilities of
the respective individual currency to minimize the foreign
exchange risk, and to control the currency risk within limits
set by the Bank. The Bank, based on the guiding principles
of Risk Management Committee, relevant laws and regula-
tions and the management’s evaluation of the current en-
vironment, has set risk tolerance limits, and minimises the
mismatch of assets and liabilities in different currencies
via reasonable arrangements on the source and usage
of foreign currency capital. Foreign currency exposures
are managed based on business category, delegated
trader authorisation limits, currencies and risk factors.
The Bank conducts hedge transactions with overseas
branches of Citibank to offset foreign currency risks for
derivatives designated in foreign currencies.
The Bank classifies financial instruments into invest-
ment portfolios held for trading and non-trading invest-
ment portfolios to effectively monitor market risk. The
Bank mainly manages market risk via its market risk limit
policy. According to the Market Risk Management Guide-
lines for Commercial Banks issued by the CBRC and Citi-
group’s global risk management policy, the Bank has es-
tablished market risk limits and measurement policies to
set related limits and approval mechanism on all market
risk exposures. The policies illustrate the structure and
approval system of market risk limits. Market risk limits
mainly include risk factor limits, position limits, value-at-
risk (VaR) limits and stop-loss trigger.
VaR analysis
For investment portfolios held for trading, the Bank
adopts VaR analysis to evaluate market risk. VaR esti-
mates potential losses arising from changes in market
interest rates and prices within a defined period and
confidence interval. The Bank’s market risk management
department calculates the VaR of investment portfolios
held for trading according to the historical changes of
the market interest rates and prices (confidence interval:
99%, observation time: 1 trading day).

102 103ANNUAL REPORT ANNUAL REPORT 2015 2015
A summary of the VaR of the Bank’s trading portfolios at
the balance sheet date and during the respective year is
as follows: (Renminbi million)
To address the above limitations in VaR analysis, the
Bank performs retrospective tests periodically to ensure
the effectiveness of the relevant models. Furthermore,
the Bank performs market risk stress testing periodically
to assess the maximum losses under extreme price fluc-
tuation scenarios.
Interest rate risk
Foreign currency risk
Total VaR
Interest rate risk
Foreign currency risk
Total VaR
32.52
37.34
43.68
29.47
18.81
34.82
19.91
17.52
26.46
19.98
8.74
22.45
12.11
23.06
26.43
13.23
10.96
17.66
10.04
7.72
16.38
6.00
1.07
6.76
2015
2014
Minimum
Minimum
Maximum
Maximum
Average
Average
As at 31December
As at 31December
(2)
-
-
-
-
Market risk (continued)
Although VaR is an important tool for measuring market
risk, the assumptions on which the model is based do give
rise to some limitations, including the following:
A 1-day holding period assumes that it is possible to hedge
or dispose of positions within that period. This is considered
to be a realistic assumption in almost all cases but may not
be the case in situations in which there is severe market il-
liquidity for a prolonged period;
A 99% confidence level does not reflect losses that may oc-
cur beyond this level. Even with the model used there is 1%
probability that losses could exceed the VaR;
VaR is calculated on an end-of-day basis and does not re-
flect exposures that may arise on positions during the trad-
ing day; and
The use of historical data as a basis for determining the pos-
sible range of future outcomes may not always cover all pos-
sible scenarios, especially those of an exceptional nature.
44 Risk management (continued)
(3) Liquidity risk
Liquidity risk is the risk that a financial institution may
encounter deficiency of funds in meeting its obligations
associated with the settlement of financial liabilities us-
ing cash or other financial assets, caused by mismatches
between the amounts and maturity dates of assets and
liabilities.
The primary liquidity risk management measure adopted
by the Bank is to match the maturity date structures be-
tween assets and liabilities. Due to differences between
various businesses and maturity tenors, it is impractical
to maintain a perfect match between assets and liabili-
ties. To meet relevant liquidity requirements, the Bank has
established a set of thresholds for managing, measuring,
monitoring and reporting liquidity risk, including liquid-
ity limits for normal operations, liquidity ratios, market
triggers and regular stress testing. In addition, the Bank
established Liquidity Funding Plan and Contingency Fund-
ing Plan to maintain an appropriate balance of cash flows
and to ensure all the required funds can be provided at
maturity.
The Finance Department provides a daily calculation of
regulatory liquidity ratios to relevant departments of the
Bank. Global Markets Department is responsible for man-
aging the liquidity risk on daily basis and executes the liq-
uid funds instructions. Market Risk Management monitors
the liquidity risk independently. The Asset Liability Com-
mittee regularly reviews the liquidity status of the Bank.

104 105ANNUAL REPORT ANNUAL REPORT 2015 2015
The following tables show the remaining contractual maturities at the balance sheet date of the Bank’s financial liabilities,
which are based on contractual cash flows (including interest payments computed using contractual rates or, if floating, based
on rates current at the balance sheet date) and the earliest date the Bank can be required to pay:
Footnote: The derivative financial liabilities are presented under the item “repayable on demand / terms undated” to reflect the short-term characters of such transactions.
Deposits and borrowings from inter-banks
and non-bank financial institutions
Derivative financial liabilities
(Footnote)
Deposits from customers
Other financial liabilities
Total
Contractual undiscounted
cash flow
16,688,591,355
2,510,257,292
124,907,909,928
4,545,968,182
148,652,726,757
Carryingamount
Repayable on demand /
terms undated
15,063,732,119
2,510,257,292
87,429,510,966
1,860,455,274
106,863,955,651
16,680,265,056
2,510,257,292
124,812,369,754
4,520,215,738
148,523,107,840
44 Risk management (continued)
Deposits and borrowings from inter-banks
and non-bank financial institutions
Derivative financial liabilities
(Footnote)
Deposits from customers
Other financial liabilities
Total
Contractual undiscounted
cash flow
33,097,528,546
2,222,005,781
100,003,887,116
8,733,247,651
144,056,669,094
Carryingamount
Repayable on demand /
terms undated
12,881,500,082
2,222,005,781
66,976,816,514
3,509,982,553
85,590,304,930
33,036,209,777
2,222,005,781
99,885,561,822
8,656,199,398
143,799,976,778
Between one month
and three months
2,976,649,108
-
7,977,534,280
1,918,877,606
12,873,060,994
Between three months and one year
5,233,049,230
-
6,153,416,707
1,880,729,790
13,267,195,727
Between one year and
five year
1,641,299,460
-
34,557,601
777,210,190
2,453,067,251
Within one month
10,365,030,666
-
18,861,562,014
646,447,512
29,873,040,192
2014 contractual undiscounted cash flow
Between one month
and three months
235,139,036
-
7,413,226,769
987,194,890
8,635,560,695
Between three months and one year
781,815,490
-
5,675,723,941
1,523,910,137
7,981,449,568
Between one year and
five year
221,658,451
-
170,371,327
18,494,355
410,524,133
Within one month
386,246,259
-
24,219,076,925
155,913,526
24,761,236,710
2015 contractual undiscounted cash flow
106 107ANNUAL REPORT ANNUAL REPORT 2015 2015
(4) Country risk
Country risk is the risk that due to the economic, political or
social changes or events in a certain country or region, the
borrowers or debtors in that country or region are unable to
or refuse to repay debts to the Bank, which causes that the
Bank suffers losses. The Bank’s country risk management
strategy which matches with the operating principles of the
Bank aims at ensuring the security of the Bank’s assets and
being in compliance with relevant regulatory requirements.
Such strategy is to maintain the sustainable development
of cross-board transactions and concerts with the business
development strategy, the available resources and the scale
and complexity of exposures to country risk. In accordance
with the Guidelines on the Management of Country Risk by
Banking Financial Institutions (Yin Jian Fa [2010] No.45) is-
sued by the CBRC, the Bank sets out policy and operating
manual regarding country risk management to ensure iden-
tifying, measuring, monitoring and controlling the exposure
of the Bank to country risk.
44 Risk management (continued)
The capital management of the Bank covers the computa-
tion and reporting of capital adequacy ratio (“CAR”), capital
assessment and capital planning. The CAR of the Bank rep-
resent its ability to operate healthily and deal with risks. The
CAR management of the Bank aims to ensure the Bank holds
adequate capital, which is appropriate to risk exposure and
consistent with risk assessment results of the Bank, to meet
the demand of business operation and relevant regulatory
requirements. The capital planning aims to set a target CAR
which satisfies the Bank with the demand of future business
development strategy, risk appetite, risk management, ex-
ternal business environment and long-term sustainability of
various capital sources.
The prudent and solid concept of capital management en-
sures the Bank to retain its capital at an adequate level to
support business development under all conditions and to
adjust CAR to a reasonable level timely and effectively, if
necessary.
The Bank calculates CAR according to the guidance of the
CBRC. The capital of the Bank is composed of core tier one
capital, other tier one capital and tier two capital. The Bank’s
management monitors the utilisation of CAR and regulatory
capital according to the requirements of the CBRC. The Bank
reports relevant information to the CBRC on a quarterly basis.
Commercial banks shall conform to the CBRC’s requirements
relating to CAR. For the Bank, the adequacy ratio of core tier
one capital shall not be less than 7.5%; the adequacy ratio
of tier one capital shall not be less than 8.5%; and the CAR
shall not be less than 10.5%, as at 31 December 2018.
The risk weighted assets of on-balance sheet assets are cal-
culated based on various risk weights. The risk weights are
determined in consideration of the risk factors of various as-
sets, counterparties, markets and other relevant aspects, as
well as qualified collateral and guarantee. The off-balance
sheet exposures are calculated by the similar methodol-
ogy with adjustments of contingent losses. The credit risk
45 Capital management
weighted assets for counterparties in terms of over-the-
counter derivative transactions are the summation of
defaulted risk weighted assets and credit valuation ad-
justment risk weighted assets. The market risk weighted
assets are measured by the standard method. The opera-
tional risk weighted assets are measured by basic indica-
tor method.
The CAR and relevant data of the Bank are calculated on
the basis of the financial statements prepared in accord-
ance with the CAS. The Bank is in compliance with the
regulatory capital requirements during the year.
The adequacy ratio of core tier one capital, the adequacy
ratio of tier one capital and the CAR as at 31 December
2015 calculated in accordance with the Administrative
Measures on Capitals of Commercial Bank (For Trial Im-
plementation) and other relevant laws and regulations
are as follows:

108 109ANNUAL REPORT ANNUAL REPORT 2015 2015
The total risk assets are composed of weighted credit risk assets, weighted market risk assets and weighted operational risk
assets. Weighted market risk assets include 12.5x market risk assets.
Net core tier one capital
Net tier one capital
Net capital
Total risk assets
Adequacy ratio of core tier one capital
Adequacy ratio of tier one capital
CAR
13,087,455,583
13,087,455,583
13,358,574,825
88,255,084,468
14.83%14.83%15.14%
14,158,303,501
14,158,303,501
14,909,478,901
95,960,835,416
14.75%14.75%15.54%
(1)
20142015Note
45 Capital management (continued)
(1)
(1)
(a)
Fair value measurement
Fair value hierarchy
The following tables present fair value information and the
fair value hierarchy, at the end of the current reporting pe-
riod, of the Bank’s assets and liabilities which are measured
at fair value at each balance sheet date on a recurring or
non-recurring basis. At the end of each reporting period, the
Bank did not have any assets which were measured at fair
value on a non-recurring basis.
The level in which fair value measurement is categorised is
determined by the level of the fair value hierarchy of the
lowest level input that is significant to the entire fair value
measurement. The levels of inputs are defined as follows:
Level 1 input: unadjusted quoted prices in active markets
that are observable at the measurement
date for indentical asssets or liabilities;
Level 2 input: inputs other than Level 1 inputs that are
either directly or indirectly observable for
underlying assets or liabilities;
Level 3 input: inputs that are unobservable for underlying
assets or liabilities
46 Fair value
Level Level Level Total
Recurring fair value measurement
Assets
Financial assets at fair value
through profit or loss
Derivative financial assets
Available-for-sale financial assets
Total
Liabilities
Derivative financial liabilities
-
2,823,854,446
-
2,823,854,446
2,509,349,535
-
907,757
-
907,757
907,757
6,129,108,305
-
21,053,400,460
27,182,508,765
-
6,129,108,305
2,824,762,203
21,053,400,460
30,007,270,968
2,510,257,292
8
9
12
9
2015
Note
Level Level Level Total
Recurring fair value measurement
Assets
Financial assets at fair value
through profit or loss
Derivative financial assets
Available-for-sale financial assets
Total
Liabilities
Derivative financial liabilities
-
2,238,136,068
-
2,238,136,068
2,221,592,751
-
413,030
-
413,030
413,030
8,506,538,388
-
20,322,383,530
28,828,921,918
-
8,506,538,388
2,238,549,098
20,322,383,530
31,067,471,016
2,222,005,781
8
9
12
9
2014
Note
(a) Fair value hierarchy (continued)
46 Fair value (continued)

110 111ANNUAL REPORT ANNUAL REPORT 2015 2015
Fair value hierarchy (continued)
During the year ended 31 December 2015, there were no
transfers, between Level 1 and Level 2, of the Bank’s assets
and liabilities above which are measured at fair value on a
recurring basis. The Bank recognises transfers between dif-
ferent levels at the end of the current reporting period dur-
ing which such transfers are made.
Fair values of financial assets and financial liabilities that
are traded in active markets are based on quoted market
prices or dealer price quotations. For all other financial in-
struments, the Bank determines fair values using valuation
techniques.
Valuation techniques include net present value and discount-
ed cash flow models, comparison approach by reference to
similar instruments for which market observable prices are
available, polynomial option pricing models and other valua-
tion models. Assumptions and inputs used in valuation tech-
niques include risk-free interest rates, benchmark interest
rates, credit spreads and other parameters used in estimat-
ing discount rates, bond and equity prices, foreign currency
exchange rates, price index and expected price volatilities
and correlations. The objective of valuation techniques is to
arrive at a fair value determination that reflects the price
that would be received to sell an asset or paid to transfer
a liability in an orderly transaction between market partici-
pants at the measurement date.
The Bank uses widely recognised valuation models for de-
termining the fair value of relatively common and simple
financial instruments, like interest rate and currency swaps
that use only observable market data and require little man-
agement judgement and estimation. Observable prices and
model inputs are usually available in the market for listed
debt and equity securities, exchange traded derivatives and
simple over-the-counter derivatives like interest rate swaps.
For more complex financial instruments, the Bank uses pro-
prietary valuation models, which usually are developed
based on widely recognised valuation models. Some or
all of the significant inputs into these models may not be
observable in the market, and are derived from market
prices or rates or are estimated based on assumptions.
Examples of instruments involving significant unobserv-
able inputs include certain over-the-counter structured
derivatives, certain loans and securities for which there
is no active market and retained interests in securiti-
sations. Valuation models that employ significant un-
observable inputs require a higher degree of manage-
ment judgement and estimation in the determination of
fair value. Management judgement and estimation are
usually required for selection of the appropriate valu-
ation model to be used, determination of expected fu-
ture cash flows on the financial instrument being val-
ued, determination of probability of counterpart default
and prepayments and selection of appropriate discount
rates. For those more complex financial instruments, the
Bank performs calibration and back testing of models
against observed market transactions and conduct reg-
ular stress testing.
The Bank has an established control framework with re-
spect to the measurement of fair values. The Bank’s pro-
cesses include a number of key controls that are designed
to ensure that fair value is measured appropriately, par-
ticularly where a fair value model is internally developed
and used to price a significant product. Such controls in-
clude a model validation policy requiring that valuation
models be validated by qualified personnel, independ-
ent from those who created the models and escalation
procedures, to ensure that valuations using unverifiable
inputs are identified and monitored on a regular basis
by senior management. Approvals from both market risk
department and product control department must be ob-
tained prior to the use of valuation methodologies. The
Bank’s valuation models are reviewed and approved by
market risk department which is independent from the
front office.
46 Fair value (continued)
(a) (b)
(c)
Balanceat the beginning of the year
Total gains / (losses) for the year
- in profit or loss
Settlements
Balance at the end of the year
Changes of unrealised gains or losses for the year included in profit or loss for assets and liabilities held at the end of the year
Total
Derivativefinancialliabilities
DerivativeFinancial
assets
(413,030)
(3,784,585)
3,289,858
(907,757)
(907,757)
-
7,830,209
(7,830,209)
-
-
413,030
11,614,794
(11,120,067)
907,757
907,757
2015
Balanceat the beginning of the year
Total gains / (losses) for the year
- in profit or loss
Settlements
Balance at the end of the year
Changes of unrealised gains or losses for the year included in profit or loss for assets and liabilities held at the end of the year
Derivativefinancialliabilities
(256,867)
(4,169,915)
4,013,752
(413,030)
(413,030)
-
-
-
-
-
256,867
4,169,915
(4,013,752)
413,030
413,030
2014
Level 2 fair value measurement
This category includes instruments using valuation tech-
nique: quoted market prices in active markets for similar in-
struments; quoted prices for identical or similar instruments
in markets that are considered less than active; or other
valuation techniques where all significant inputs are directly
or indirectly observable from market data.
The fair value of forward exchange contracts included in
derivative financial assets is determined by discounting the
difference between the contractual exercise price and the
market forward price.
The fair value of interest rate swaps included in derivative
financial assets is the estimated amount that would be re-
ceived or paid to terminate the swap at the end of report-
ing period, taking into account current interest rates and the
current creditworthiness of the swap counterparties.
During the year ended 31 December 2015, there were no
changes in valuation techniques for Level 2 fair value meas-
urement.
Level 3 fair value measurement
This category includes all instruments where the valuation
technique includes inputs not based on observable data and
the unobservable inputs have a significant effect on the in-
strument’s valuation. This category includes instruments
that are valued based on quoted prices for similar instru-
ments where significant unobservable adjustments or as-
sumptions are required to reflect differences between the
instruments.
The Bank’s Level 3 financial instruments are mainly struc-
tured derivatives. The fair value of such structured deriva-
tives is determined by using discounted cash flow model
and the significant unobservable input used in the fair value
measurement is expected volatility of the market interest
rates. The fair value measurement is negatively corre-
lated to the expected volatility.
During the year ended 31 December 2015, there were no
changes in valuation techniques for the Level 3 fair value
measurement.
Reconciliation between the opening and closing balances
of the assets and liabilities under the recurring Level 3
fair value measurement is as follows:
112 ANNUAL REPORT 2015
(c)
(2)
The comparative figures of 2014 represent figures for
the year from 1 January 2014 to 31 December 2014. Cer-
tain items in these comparative figures have been reclas-
sified to conform with the current year’s presentation to
facilitate comparison.
Level 3 fair value measurement (continued)
During the year ended 31 December 2015, there were no
transfers, between Level 3 and other levels, of the Bank’s
assets and liabilities above which are measured at fair value
on a recurring basis.
Sensitivity analysis on fair value measurement in Level 3 of
the fair value hierarchy
Any deals between the Bank and its customers are fully
squared with other financial institutions and there is no
open position. As a result, although fair value measurement
of Level 3 uses unobservable inputs and the measurement
is uncertain, there is no impact on the Bank’s items listed in
the income statement, profit for the year or equity if such
judgement and estimation on unobservable inputs change.
Fair value of other financial instruments (items not meas-
ured at fair value at the end of year)
The Bank’s other financial assets mainly include deposits
with central bank, deposits with inter-banks and non-bank
financial institutions, placements with inter-banks and non-
bank financial institutions, loans and advances to custom-
ers, -deposits from inter-banks and non-bank financial in-
stitutions, borrowings from inter-banks and deposits from
customers. There are no significant differences between the
carrying amount and the fair value of these financial assets
and liabilities.
46 Fair value (continued) 47 Comparative figures