Chunghwa Precision Test Tech. Co., Ltd. and Subsidiaries · Chunghwa Precision Test Tech. Co., Ltd....
38
Chunghwa Precision Test Tech. Co., Ltd. and Subsidiaries Consolidated Financial Statements for the Six Months Ended June 30, 2016 and 2015 and Independent Auditors’ Review Report
Transcript of Chunghwa Precision Test Tech. Co., Ltd. and Subsidiaries · Chunghwa Precision Test Tech. Co., Ltd....
Chunghwa Precision Test Tech. Co., Ltd. and Subsidiaries Consolidated Financial Statements for the Six Months Ended June 30, 2016 and 2015 and Independent Auditors’ Review Report
- 1 -
INDEPENDENT AUDITORS’ REVIEW REPORT
The Board of Directors and Stockholders
Chunghwa Precision Test Tech. Co., Ltd.
We have reviewed the accompanying consolidated balance sheets of Chunghwa Precision Test Tech. Co.,
Ltd. and its subsidiaries (the “Company”) as of June 30, 2016 and 2015, and the related consolidated
statements of comprehensive income for the three months ended June 30, 2016 and 2015, and for the six
months ended June 30, 2016 and 2015, as well as the consolidated statements of changes in equity and
cash flows for the six months ended June 30, 2016 and 2015. These consolidated financial statements
are the responsibility of the Company’s management. Our responsibility is to issue a report on these
consolidated financial statements based on our reviews.
We conducted our reviews in accordance with the Statement of Auditing Standards No. 36, “Review of
Financial Statements”, issued by the Auditing Committee of the Accounting Research and Development
Foundation of the Republic of China. A review consists principally of applying analytical procedures to
financial data and making inquiries of persons responsible for financial and accounting matters. It is
substantially less in scope than an audit conducted in accordance with auditing standards generally
accepted in the Republic of China, the objective of which is the expression of an opinion regarding the
financial statements taken as a whole. Accordingly, we do not express such an audit opinion.
Based on our reviews, we are not aware of any material modifications that should be made to the
consolidated financial statements referred to above for them to be in conformity with the Regulations
Governing the Preparation of Financial Reports by Securities Issuers and International Accounting
Standard 34, “Interim Financial Reporting” endorsed by the Financial Supervisory Commission of the
Republic of China.
August 2, 2016
Notice to Readers
The accompanying consolidated financial statements are intended only to present the financial position,
financial performance and cash flows in accordance with accounting principles and practices generally
accepted in the Republic of China and not those of any other jurisdictions. The standards, procedures
and practices to review such consolidated financial statements are those generally accepted and applied
in the Republic of China.
For the convenience of readers, the auditors’ review report and the accompanying consolidated financial
statements have been translated into English from the original Chinese version prepared and used in the
Republic of China. If there is any conflict between the English version and the original Chinese version
or any difference in the interpretation of the two versions, the Chinese-language auditors’ review report
and consolidated financial statements shall prevail.
- 2 -
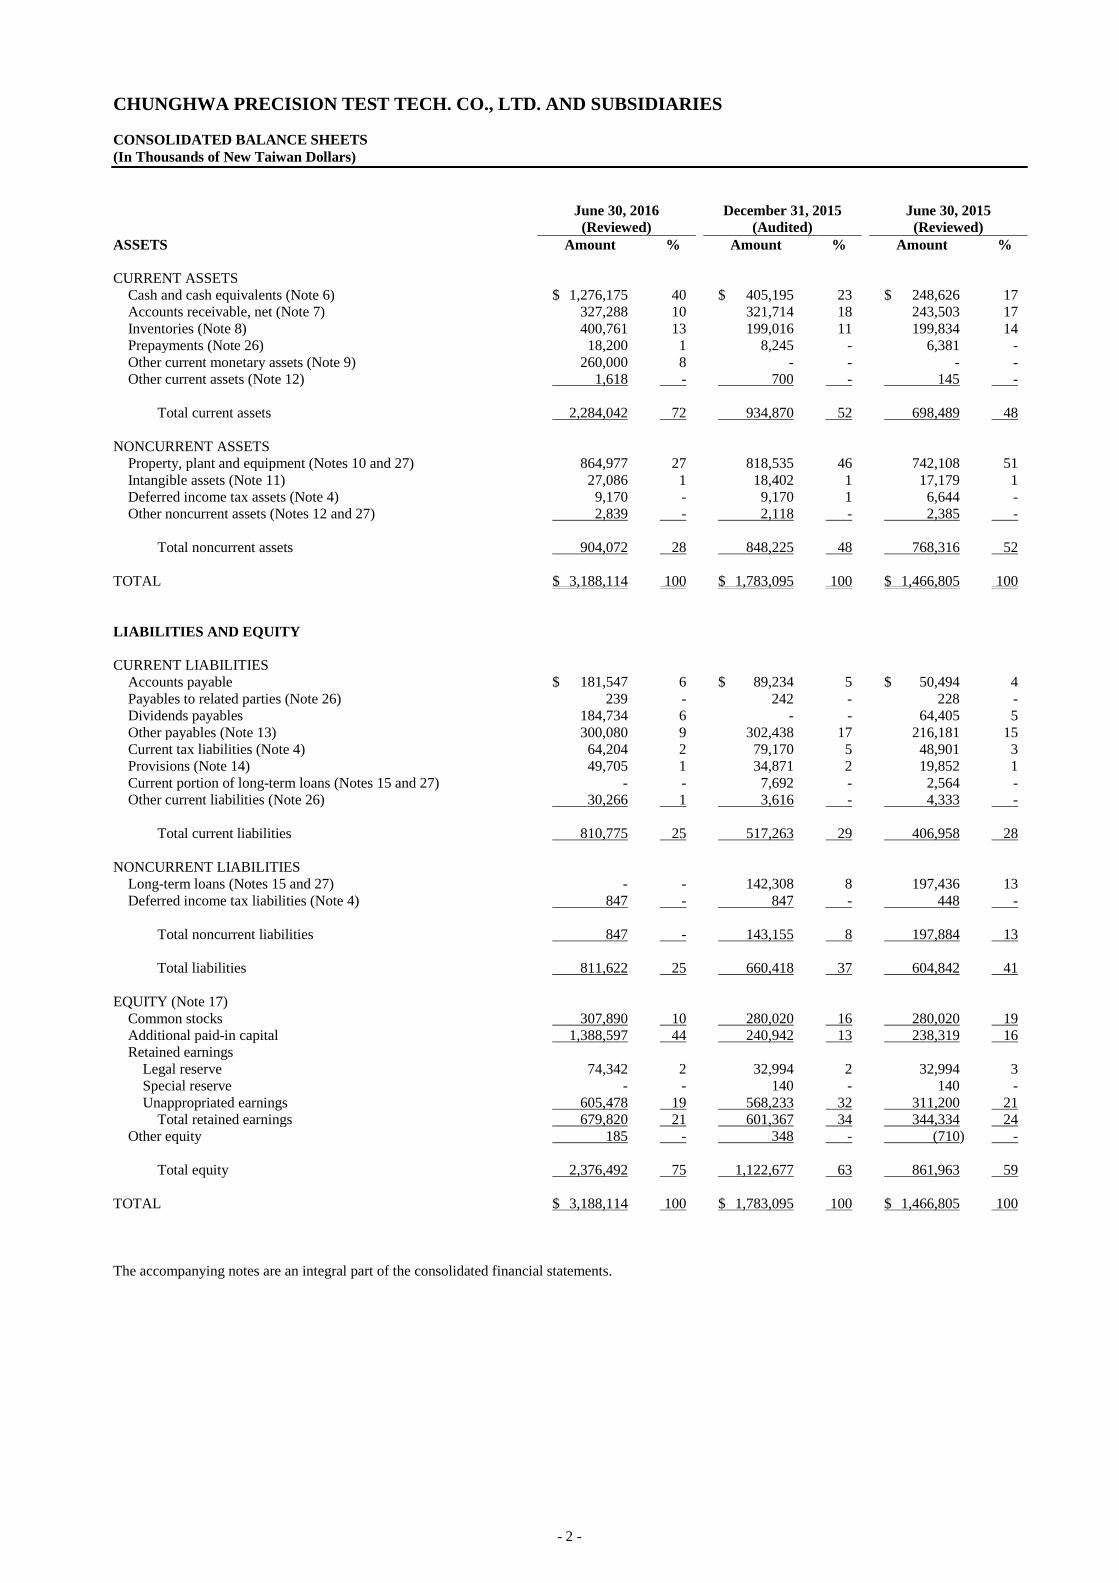
CHUNGHWA PRECISION TEST TECH. CO., LTD. AND SUBSIDIARIES
CONSOLIDATED BALANCE SHEETS
(In Thousands of New Taiwan Dollars)
June 30, 2016
(Reviewed)
December 31, 2015
(Audited)
June 30, 2015
(Reviewed)
ASSETS Amount % Amount % Amount %
CURRENT ASSETS
Cash and cash equivalents (Note 6) $ 1,276,175 40 $ 405,195 23 $ 248,626 17
Accounts receivable, net (Note 7) 327,288 10 321,714 18 243,503 17
Inventories (Note 8) 400,761 13 199,016 11 199,834 14
Prepayments (Note 26) 18,200 1 8,245 - 6,381 -
Other current monetary assets (Note 9) 260,000 8 - - - -
Other current assets (Note 12) 1,618 - 700 - 145 -
Total current assets 2,284,042 72 934,870 52 698,489 48
NONCURRENT ASSETS
Property, plant and equipment (Notes 10 and 27) 864,977 27 818,535 46 742,108 51
Intangible assets (Note 11) 27,086 1 18,402 1 17,179 1
Deferred income tax assets (Note 4) 9,170 - 9,170 1 6,644 -
Other noncurrent assets (Notes 12 and 27) 2,839 - 2,118 - 2,385 -
Total noncurrent assets 904,072 28 848,225 48 768,316 52
TOTAL $ 3,188,114 100 $ 1,783,095 100 $ 1,466,805 100
LIABILITIES AND EQUITY
CURRENT LIABILITIES
Accounts payable $ 181,547 6 $ 89,234 5 $ 50,494 4
Payables to related parties (Note 26) 239 - 242 - 228 -
Dividends payables 184,734 6 - - 64,405 5
Other payables (Note 13) 300,080 9 302,438 17 216,181 15
Current tax liabilities (Note 4) 64,204 2 79,170 5 48,901 3
Provisions (Note 14) 49,705 1 34,871 2 19,852 1
Current portion of long-term loans (Notes 15 and 27) - - 7,692 - 2,564 -
Other current liabilities (Note 26) 30,266 1 3,616 - 4,333 -
Total current liabilities 810,775 25 517,263 29 406,958 28
NONCURRENT LIABILITIES
Long-term loans (Notes 15 and 27) - - 142,308 8 197,436 13
Deferred income tax liabilities (Note 4) 847 - 847 - 448 -
Total noncurrent liabilities 847 - 143,155 8 197,884 13
Total liabilities 811,622 25 660,418 37 604,842 41
EQUITY (Note 17)
Common stocks 307,890 10 280,020 16 280,020 19
Additional paid-in capital 1,388,597 44 240,942 13 238,319 16
Retained earnings
Legal reserve 74,342 2 32,994 2 32,994 3
Special reserve - - 140 - 140 -
Unappropriated earnings 605,478 19 568,233 32 311,200 21
Total retained earnings 679,820 21 601,367 34 344,334 24
Other equity 185 - 348 - (710) -
Total equity 2,376,492 75 1,122,677 63 861,963 59
TOTAL $ 3,188,114 100 $ 1,783,095 100 $ 1,466,805 100
The accompanying notes are an integral part of the consolidated financial statements.
- 3 -
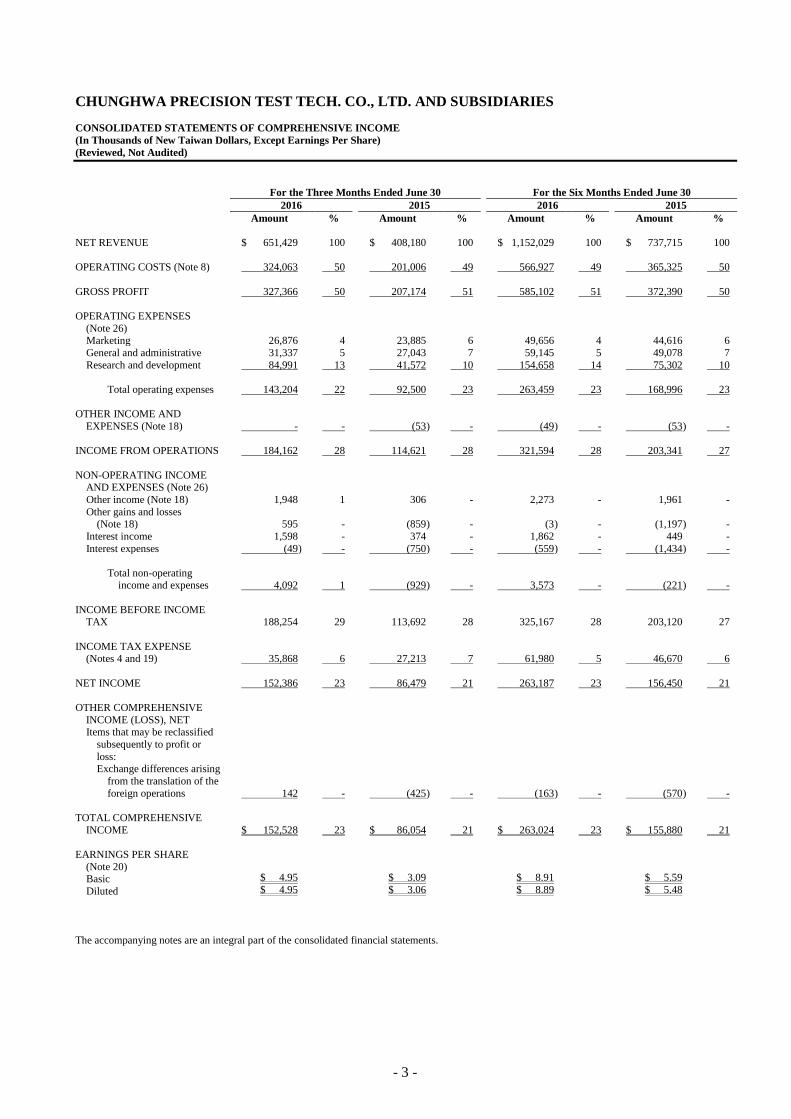
CHUNGHWA PRECISION TEST TECH. CO., LTD. AND SUBSIDIARIES
CONSOLIDATED STATEMENTS OF COMPREHENSIVE INCOME
(In Thousands of New Taiwan Dollars, Except Earnings Per Share)
(Reviewed, Not Audited)
For the Three Months Ended June 30 For the Six Months Ended June 30
2016 2015 2016 2015
Amount % Amount % Amount % Amount %
NET REVENUE $ 651,429 100 $ 408,180 100 $ 1,152,029 100 $ 737,715 100
OPERATING COSTS (Note 8) 324,063 50 201,006 49 566,927 49 365,325 50
GROSS PROFIT 327,366 50 207,174 51 585,102 51 372,390 50
OPERATING EXPENSES
(Note 26) Marketing 26,876 4 23,885 6 49,656 4 44,616 6
General and administrative 31,337 5 27,043 7 59,145 5 49,078 7
Research and development 84,991 13 41,572 10 154,658 14 75,302 10
Total operating expenses 143,204 22 92,500 23 263,459 23 168,996 23
OTHER INCOME AND
EXPENSES (Note 18) - - (53 ) - (49 ) - (53 ) -
INCOME FROM OPERATIONS 184,162 28 114,621 28 321,594 28 203,341 27
NON-OPERATING INCOME AND EXPENSES (Note 26)
Other income (Note 18) 1,948 1 306 - 2,273 - 1,961 -
Other gains and losses (Note 18) 595 - (859 ) - (3 ) - (1,197 ) -
Interest income 1,598 - 374 - 1,862 - 449 -
Interest expenses (49 ) - (750 ) - (559 ) - (1,434 ) -
Total non-operating income and expenses 4,092 1 (929 ) - 3,573 - (221 ) -
INCOME BEFORE INCOME TAX 188,254 29 113,692 28 325,167 28 203,120 27
INCOME TAX EXPENSE (Notes 4 and 19) 35,868 6 27,213 7 61,980 5 46,670 6
NET INCOME 152,386 23 86,479 21 263,187 23 156,450 21
OTHER COMPREHENSIVE
INCOME (LOSS), NET Items that may be reclassified
subsequently to profit or
loss: Exchange differences arising
from the translation of the
foreign operations 142 - (425 ) - (163 ) - (570 ) -
TOTAL COMPREHENSIVE
INCOME $ 152,528 23 $ 86,054 21 $ 263,024 23 $ 155,880 21
EARNINGS PER SHARE
(Note 20) Basic $ 4.95 $ 3.09 $ 8.91 $ 5.59
Diluted $ 4.95 $ 3.06 $ 8.89 $ 5.48
The accompanying notes are an integral part of the consolidated financial statements.
- 4 -
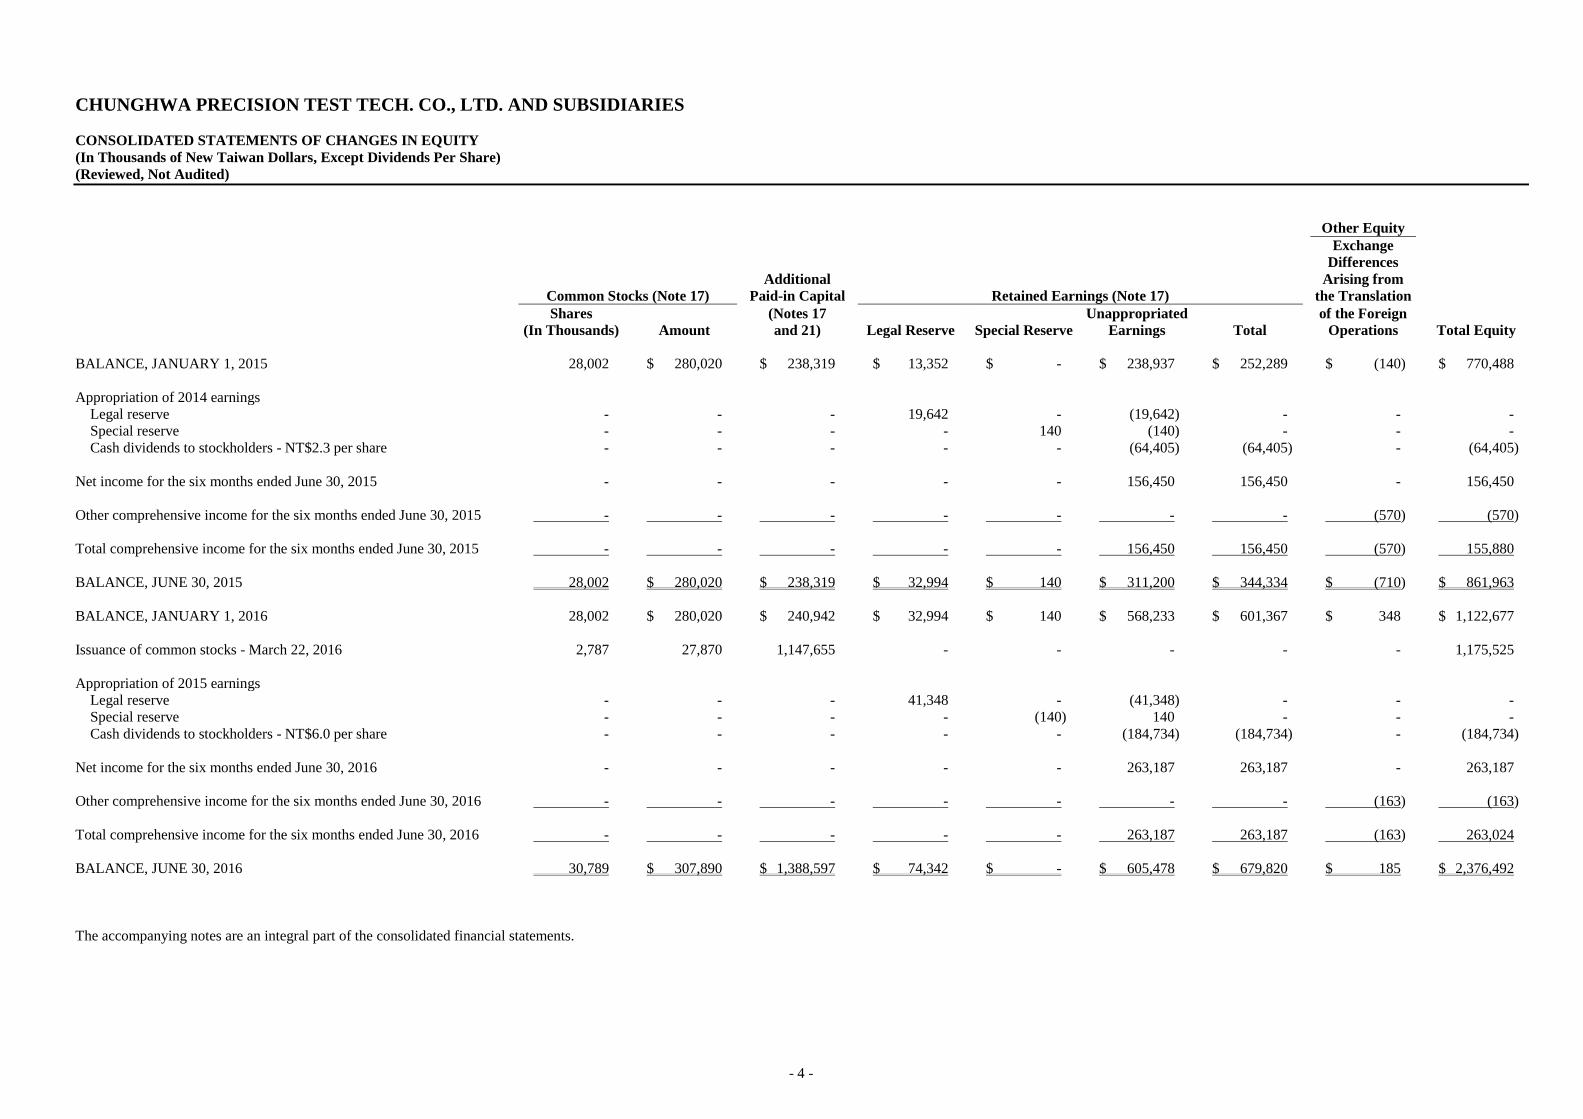
CHUNGHWA PRECISION TEST TECH. CO., LTD. AND SUBSIDIARIES
CONSOLIDATED STATEMENTS OF CHANGES IN EQUITY
(In Thousands of New Taiwan Dollars, Except Dividends Per Share)
(Reviewed, Not Audited)
Other Equity
Common Stocks (Note 17)
Additional
Paid-in Capital Retained Earnings (Note 17)
Exchange
Differences
Arising from
the Translation
Shares
(In Thousands) Amount
(Notes 17
and 21) Legal Reserve Special Reserve
Unappropriated
Earnings Total
of the Foreign
Operations Total Equity
BALANCE, JANUARY 1, 2015 28,002 $ 280,020 $ 238,319 $ 13,352 $ - $ 238,937 $ 252,289 $ (140) $ 770,488
Appropriation of 2014 earnings
Legal reserve - - - 19,642 - (19,642) - - -
Special reserve - - - - 140 (140) - - -
Cash dividends to stockholders - NT$2.3 per share - - - - - (64,405) (64,405) - (64,405)
Net income for the six months ended June 30, 2015 - - - - - 156,450 156,450 - 156,450
Other comprehensive income for the six months ended June 30, 2015 - - - - - - - (570) (570)
Total comprehensive income for the six months ended June 30, 2015 - - - - - 156,450 156,450 (570) 155,880
BALANCE, JUNE 30, 2015 28,002 $ 280,020 $ 238,319 $ 32,994 $ 140 $ 311,200 $ 344,334 $ (710) $ 861,963
BALANCE, JANUARY 1, 2016 28,002 $ 280,020 $ 240,942 $ 32,994 $ 140 $ 568,233 $ 601,367 $ 348 $ 1,122,677
Issuance of common stocks - March 22, 2016 2,787 27,870 1,147,655 - - - - - 1,175,525
Appropriation of 2015 earnings
Legal reserve - - - 41,348 - (41,348) - - -
Special reserve - - - - (140) 140 - - -
Cash dividends to stockholders - NT$6.0 per share - - - - - (184,734) (184,734) - (184,734)
Net income for the six months ended June 30, 2016 - - - - - 263,187 263,187 - 263,187
Other comprehensive income for the six months ended June 30, 2016 - - - - - - - (163) (163)
Total comprehensive income for the six months ended June 30, 2016 - - - - - 263,187 263,187 (163) 263,024
BALANCE, JUNE 30, 2016 30,789 $ 307,890 $ 1,388,597 $ 74,342 $ - $ 605,478 $ 679,820 $ 185 $ 2,376,492
The accompanying notes are an integral part of the consolidated financial statements.
- 5 -
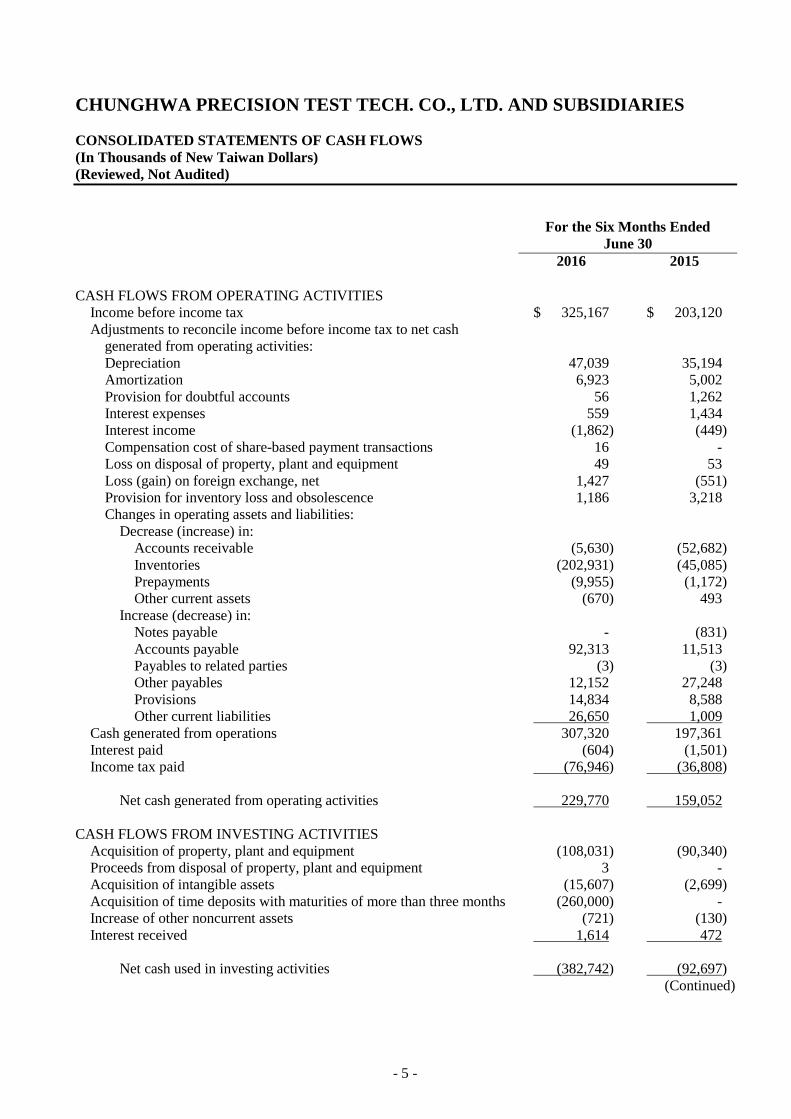
CHUNGHWA PRECISION TEST TECH. CO., LTD. AND SUBSIDIARIES
CONSOLIDATED STATEMENTS OF CASH FLOWS
(In Thousands of New Taiwan Dollars)
(Reviewed, Not Audited)
For the Six Months Ended
June 30
2016 2015
CASH FLOWS FROM OPERATING ACTIVITIES
Income before income tax $ 325,167 $ 203,120
Adjustments to reconcile income before income tax to net cash
generated from operating activities:
Depreciation 47,039 35,194
Amortization 6,923 5,002
Provision for doubtful accounts 56 1,262
Interest expenses 559 1,434
Interest income (1,862) (449)
Compensation cost of share-based payment transactions 16 -
Loss on disposal of property, plant and equipment 49 53
Loss (gain) on foreign exchange, net 1,427 (551)
Provision for inventory loss and obsolescence 1,186 3,218
Changes in operating assets and liabilities:
Decrease (increase) in:
Accounts receivable (5,630) (52,682)
Inventories (202,931) (45,085)
Prepayments (9,955) (1,172)
Other current assets (670) 493
Increase (decrease) in:
Notes payable - (831)
Accounts payable 92,313 11,513
Payables to related parties (3) (3)
Other payables 12,152 27,248
Provisions 14,834 8,588
Other current liabilities 26,650 1,009
Cash generated from operations 307,320 197,361
Interest paid (604) (1,501)
Income tax paid (76,946) (36,808)
Net cash generated from operating activities 229,770 159,052
CASH FLOWS FROM INVESTING ACTIVITIES
Acquisition of property, plant and equipment (108,031) (90,340)
Proceeds from disposal of property, plant and equipment 3 -
Acquisition of intangible assets (15,607) (2,699)
Acquisition of time deposits with maturities of more than three months (260,000) -
Increase of other noncurrent assets (721) (130)
Interest received 1,614 472
Net cash used in investing activities (382,742) (92,697)
(Continued)
- 6 -
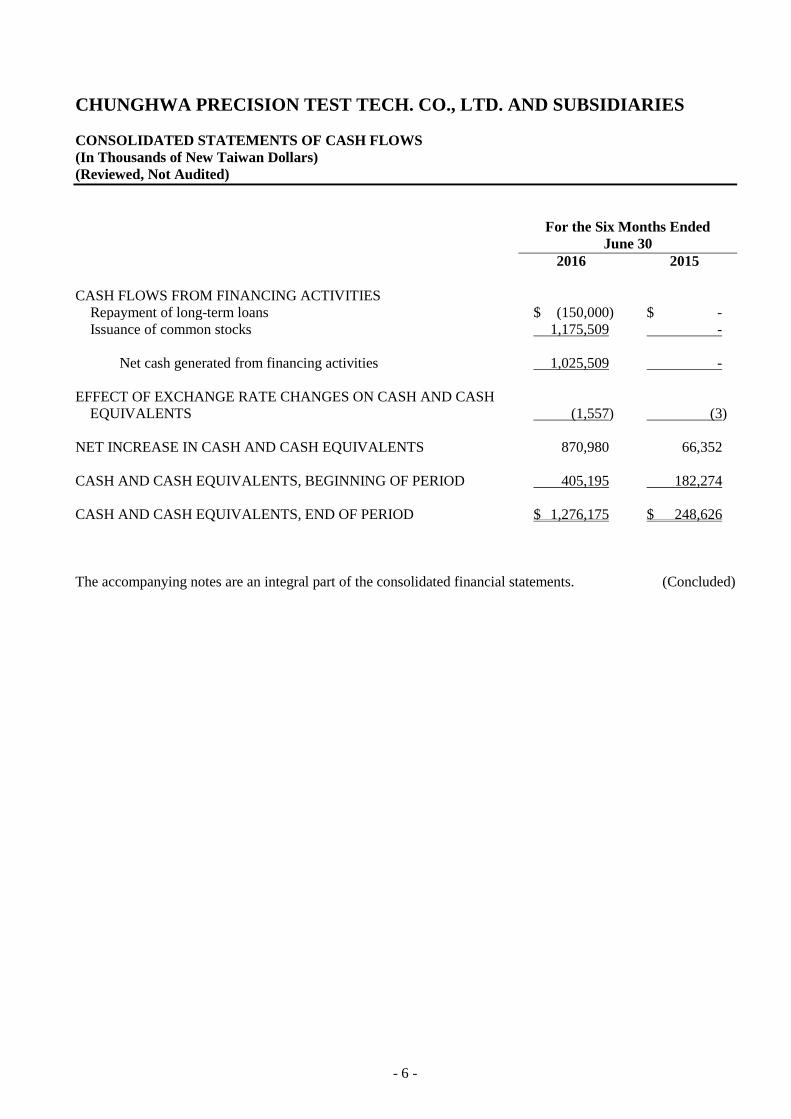
CHUNGHWA PRECISION TEST TECH. CO., LTD. AND SUBSIDIARIES
CONSOLIDATED STATEMENTS OF CASH FLOWS
(In Thousands of New Taiwan Dollars)
(Reviewed, Not Audited)
For the Six Months Ended
June 30
2016 2015
CASH FLOWS FROM FINANCING ACTIVITIES
Repayment of long-term loans $ (150,000) $ -
Issuance of common stocks 1,175,509 -
Net cash generated from financing activities 1,025,509 -
EFFECT OF EXCHANGE RATE CHANGES ON CASH AND CASH
EQUIVALENTS (1,557) (3)
NET INCREASE IN CASH AND CASH EQUIVALENTS 870,980 66,352
CASH AND CASH EQUIVALENTS, BEGINNING OF PERIOD 405,195 182,274
CASH AND CASH EQUIVALENTS, END OF PERIOD $ 1,276,175 $ 248,626
The accompanying notes are an integral part of the consolidated financial statements. (Concluded)
- 7 -
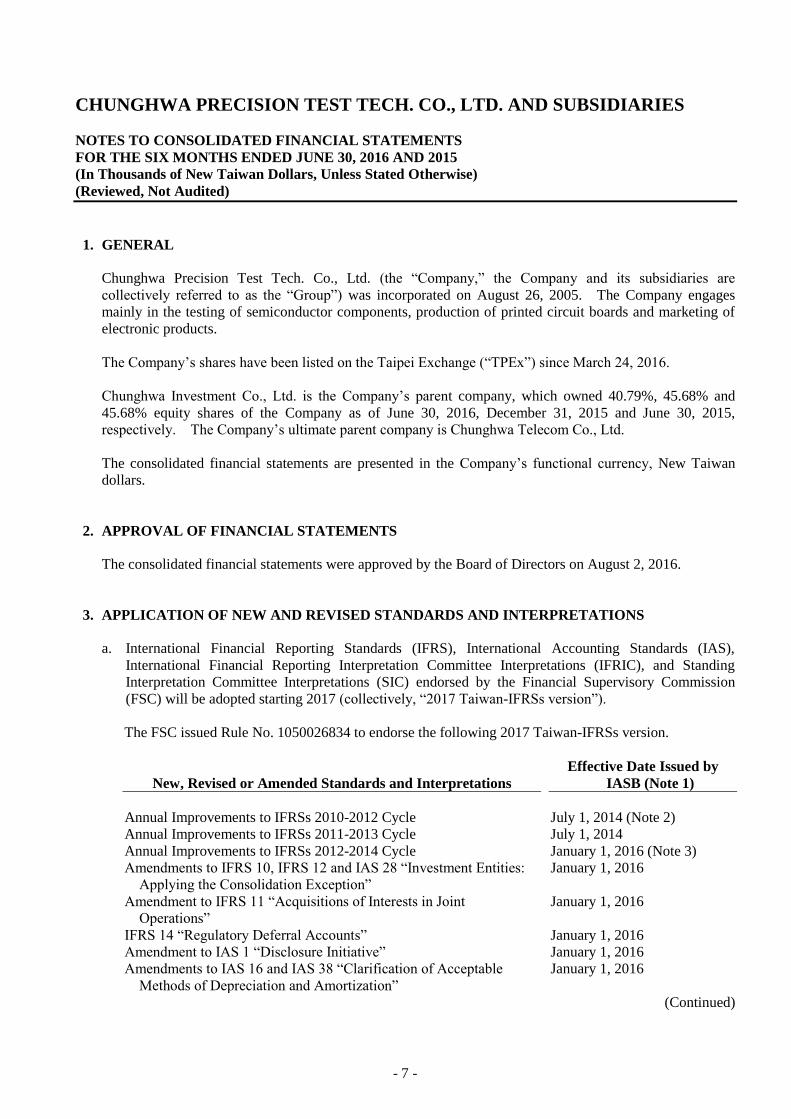
CHUNGHWA PRECISION TEST TECH. CO., LTD. AND SUBSIDIARIES
NOTES TO CONSOLIDATED FINANCIAL STATEMENTS
FOR THE SIX MONTHS ENDED JUNE 30, 2016 AND 2015
(In Thousands of New Taiwan Dollars, Unless Stated Otherwise)
(Reviewed, Not Audited)
1. GENERAL
Chunghwa Precision Test Tech. Co., Ltd. (the “Company,” the Company and its subsidiaries are
collectively referred to as the “Group”) was incorporated on August 26, 2005. The Company engages
mainly in the testing of semiconductor components, production of printed circuit boards and marketing of
electronic products.
The Company’s shares have been listed on the Taipei Exchange (“TPEx”) since March 24, 2016.
Chunghwa Investment Co., Ltd. is the Company’s parent company, which owned 40.79%, 45.68% and
45.68% equity shares of the Company as of June 30, 2016, December 31, 2015 and June 30, 2015,
respectively. The Company’s ultimate parent company is Chunghwa Telecom Co., Ltd.
The consolidated financial statements are presented in the Company’s functional currency, New Taiwan
dollars.
2. APPROVAL OF FINANCIAL STATEMENTS
The consolidated financial statements were approved by the Board of Directors on August 2, 2016.
3. APPLICATION OF NEW AND REVISED STANDARDS AND INTERPRETATIONS
a. International Financial Reporting Standards (IFRS), International Accounting Standards (IAS),
International Financial Reporting Interpretation Committee Interpretations (IFRIC), and Standing
Interpretation Committee Interpretations (SIC) endorsed by the Financial Supervisory Commission
(FSC) will be adopted starting 2017 (collectively, “2017 Taiwan-IFRSs version”).
The FSC issued Rule No. 1050026834 to endorse the following 2017 Taiwan-IFRSs version.
New, Revised or Amended Standards and Interpretations
Effective Date Issued by
IASB (Note 1)
Annual Improvements to IFRSs 2010-2012 Cycle July 1, 2014 (Note 2)
Annual Improvements to IFRSs 2011-2013 Cycle July 1, 2014
Annual Improvements to IFRSs 2012-2014 Cycle January 1, 2016 (Note 3)
Amendments to IFRS 10, IFRS 12 and IAS 28 “Investment Entities:
Applying the Consolidation Exception”
January 1, 2016
Amendment to IFRS 11 “Acquisitions of Interests in Joint
Operations”
January 1, 2016
IFRS 14 “Regulatory Deferral Accounts” January 1, 2016
Amendment to IAS 1 “Disclosure Initiative” January 1, 2016
Amendments to IAS 16 and IAS 38 “Clarification of Acceptable
Methods of Depreciation and Amortization”
January 1, 2016
(Continued)
- 8 -
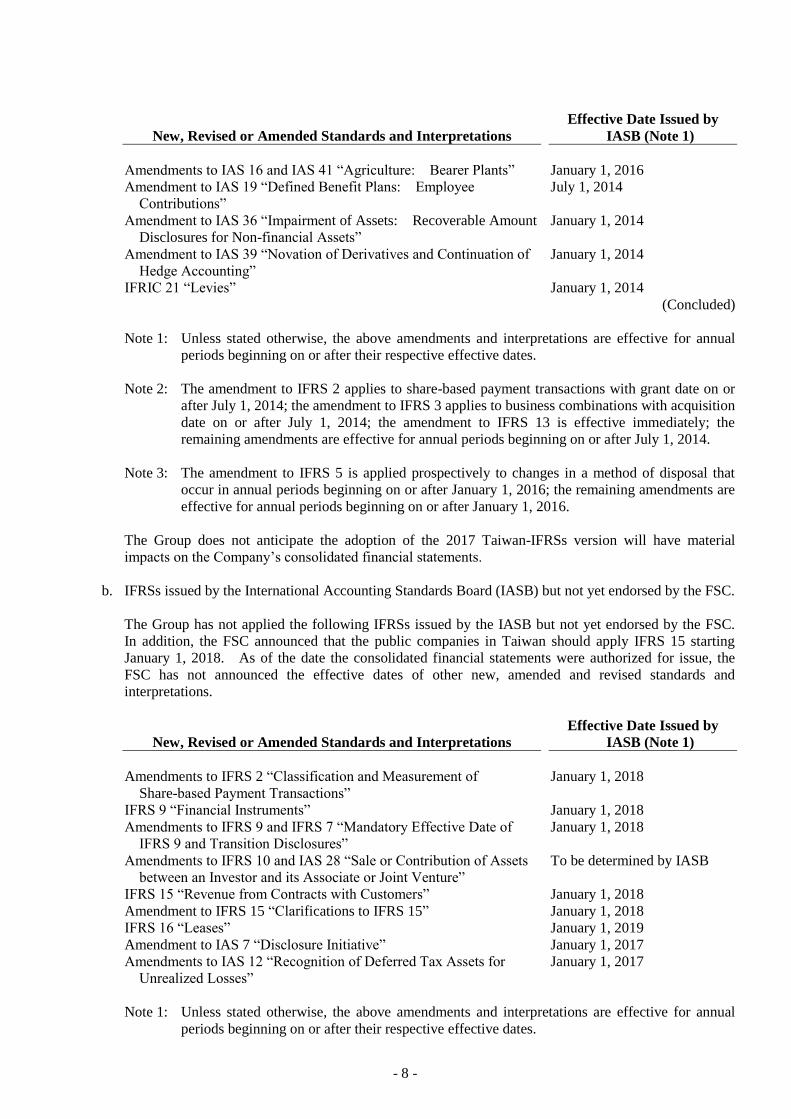
New, Revised or Amended Standards and Interpretations
Effective Date Issued by
IASB (Note 1)
Amendments to IAS 16 and IAS 41 “Agriculture: Bearer Plants” January 1, 2016
Amendment to IAS 19 “Defined Benefit Plans: Employee
Contributions”
July 1, 2014
Amendment to IAS 36 “Impairment of Assets: Recoverable Amount
Disclosures for Non-financial Assets”
January 1, 2014
Amendment to IAS 39 “Novation of Derivatives and Continuation of
Hedge Accounting”
January 1, 2014
IFRIC 21 “Levies” January 1, 2014
(Concluded)
Note 1: Unless stated otherwise, the above amendments and interpretations are effective for annual
periods beginning on or after their respective effective dates.
Note 2: The amendment to IFRS 2 applies to share-based payment transactions with grant date on or
after July 1, 2014; the amendment to IFRS 3 applies to business combinations with acquisition
date on or after July 1, 2014; the amendment to IFRS 13 is effective immediately; the
remaining amendments are effective for annual periods beginning on or after July 1, 2014.
Note 3: The amendment to IFRS 5 is applied prospectively to changes in a method of disposal that
occur in annual periods beginning on or after January 1, 2016; the remaining amendments are
effective for annual periods beginning on or after January 1, 2016.
The Group does not anticipate the adoption of the 2017 Taiwan-IFRSs version will have material
impacts on the Company’s consolidated financial statements.
b. IFRSs issued by the International Accounting Standards Board (IASB) but not yet endorsed by the FSC.
The Group has not applied the following IFRSs issued by the IASB but not yet endorsed by the FSC.
In addition, the FSC announced that the public companies in Taiwan should apply IFRS 15 starting
January 1, 2018. As of the date the consolidated financial statements were authorized for issue, the
FSC has not announced the effective dates of other new, amended and revised standards and
interpretations.
New, Revised or Amended Standards and Interpretations
Effective Date Issued by
IASB (Note 1)
Amendments to IFRS 2 “Classification and Measurement of
Share-based Payment Transactions”
January 1, 2018
IFRS 9 “Financial Instruments” January 1, 2018
Amendments to IFRS 9 and IFRS 7 “Mandatory Effective Date of
IFRS 9 and Transition Disclosures”
January 1, 2018
Amendments to IFRS 10 and IAS 28 “Sale or Contribution of Assets
between an Investor and its Associate or Joint Venture”
To be determined by IASB
IFRS 15 “Revenue from Contracts with Customers” January 1, 2018
Amendment to IFRS 15 “Clarifications to IFRS 15” January 1, 2018
IFRS 16 “Leases” January 1, 2019
Amendment to IAS 7 “Disclosure Initiative” January 1, 2017
Amendments to IAS 12 “Recognition of Deferred Tax Assets for
Unrealized Losses”
January 1, 2017
Note 1: Unless stated otherwise, the above amendments and interpretations are effective for annual
periods beginning on or after their respective effective dates.
- 9 -
Except for the following item, the application of the above new, revised or amended standards and
interpretations will not have material impact on the Group’s consolidated financial statements:
IFRS 16 “Leases”
IFRS 16 sets out the accounting standards for leases that will supersede IAS 17 and a number of related
interpretations.
Under IFRS 16, if the Group is a lessee, it shall recognize right-of-use assets and lease liabilities for all
leases on the consolidated balance sheets except for low-value and short-term leases. The Group may
elect to apply the accounting method similar to the accounting for operating lease under IAS 17 to the
low-value and short-term leases. On the consolidated statements of comprehensive income, the Group
should present the depreciation expense charged on the right-of-use asset separately from interest
expense accrued on the lease liability; interest is computed by using effective interest method. On the
consolidated statements of cash flows, cash payments for the principal portion of the lease liability are
classified within financing activities; cash payments for interest portion are classified within operating
activities.
The application of IFRS 16 is not expected to have a material impact on the accounting of the Group as
lessor.
When IFRS 16 becomes effective, the Company may elect to apply this Standard either retrospectively
to each prior reporting period presented or retrospectively with the cumulative effect of the initial
application of this Standard recognized at the date of initial application.
Except for the above impact, as of the date the consolidated financial statements were authorized for
issue, the Group is continuously assessing the possible impact that the application of other standards
and interpretations will have on the Group’s financial position and financial performance, and will
disclose the relevant impact when the assessment is completed.
4. SUMMARY OF SIGNIFICANT ACCOUNTING POLICIES
Statement of Compliance
The accompanying consolidated financial statements have been prepared in accordance with the
Regulations Governing the Preparation of Financial Reports by Securities Issuers and IAS 34 “Interim
Financial Reporting” as endorsed by the FSC. The consolidated financial statements do not present all the
disclosures required for a complete set of annual consolidated financial statements.
Basis of Consolidation
The detail information of the subsidiaries at the end of reporting period was as follows:
Percentage of Ownership
Name of Investor Name of Investee Main Businesses and Products June 30, 2016
December 31,
2015 June 30, 2015
Chunghwa Precision Test Tech.
Co., Ltd.
Chunghwa Precision Test Tech
USA Corporation (CHPT US)
Design of testing of semiconductor
components, production of
printed circuit boards, marketing
of electronic products and after
sales service
100 100 100
CHPT Japan Co., Ltd. (CHPT JP) Sale and maintenance of electronic
parts and machinery processed
products, and design of printed
circuit board
100 100 100
Chunghwa Precision Test Tech.
International, Ltd. (CHPT
International)
Electronic materials wholesale and
retail and investments
100 100 100
Chunghwa Precision Test Tech.
International, Ltd.
Shanghai Taihua Electronic
Technology Limited (CHPT SH)
Design of printed circuit board and
related consultation service
100 100 100
- 10 -
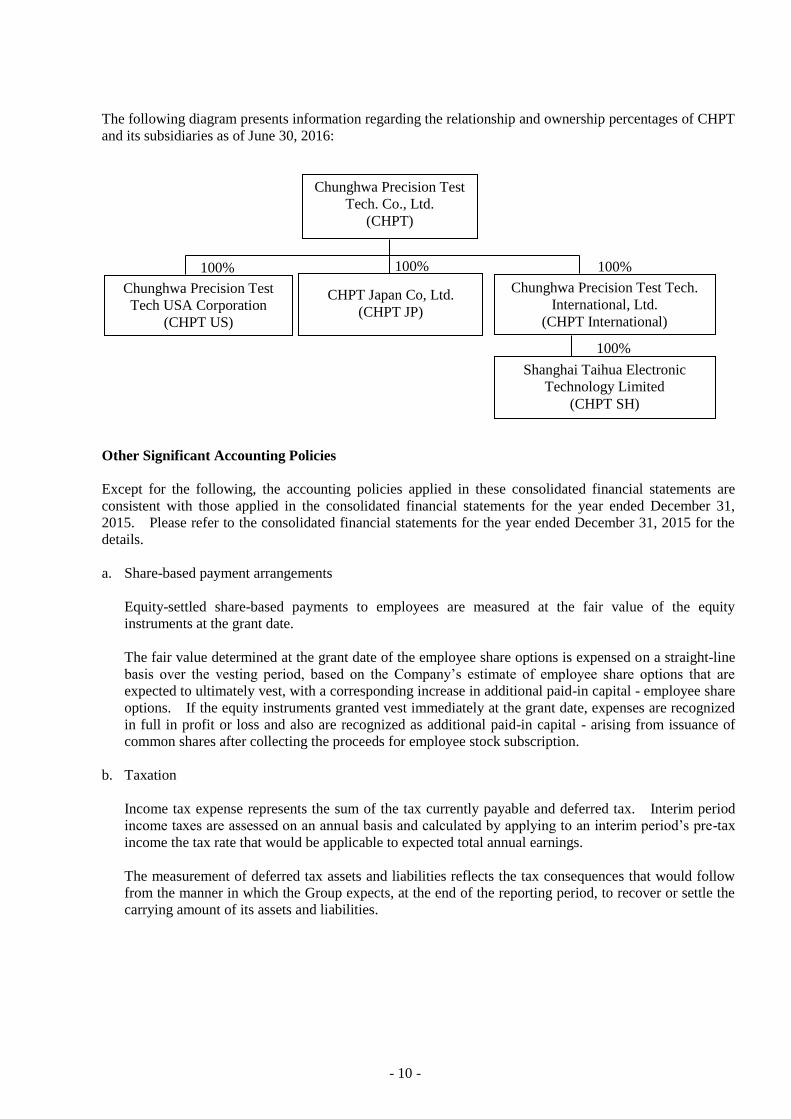
The following diagram presents information regarding the relationship and ownership percentages of CHPT
and its subsidiaries as of June 30, 2016:
Other Significant Accounting Policies
Except for the following, the accounting policies applied in these consolidated financial statements are
consistent with those applied in the consolidated financial statements for the year ended December 31,
2015. Please refer to the consolidated financial statements for the year ended December 31, 2015 for the
details.
a. Share-based payment arrangements
Equity-settled share-based payments to employees are measured at the fair value of the equity
instruments at the grant date.
The fair value determined at the grant date of the employee share options is expensed on a straight-line
basis over the vesting period, based on the Company’s estimate of employee share options that are
expected to ultimately vest, with a corresponding increase in additional paid-in capital - employee share
options. If the equity instruments granted vest immediately at the grant date, expenses are recognized
in full in profit or loss and also are recognized as additional paid-in capital - arising from issuance of
common shares after collecting the proceeds for employee stock subscription.
b. Taxation
Income tax expense represents the sum of the tax currently payable and deferred tax. Interim period
income taxes are assessed on an annual basis and calculated by applying to an interim period’s pre-tax
income the tax rate that would be applicable to expected total annual earnings.
The measurement of deferred tax assets and liabilities reflects the tax consequences that would follow
from the manner in which the Group expects, at the end of the reporting period, to recover or settle the
carrying amount of its assets and liabilities.
Chunghwa Precision Test
Tech. Co., Ltd.
(CHPT)
Shanghai Taihua Electronic
Technology Limited
(CHPT SH)
100%
100%
Chunghwa Precision Test
Tech USA Corporation
(CHPT US)
100%
CHPT Japan Co, Ltd.
(CHPT JP)
Chunghwa Precision Test Tech.
International, Ltd.
(CHPT International)
100%
- 11 -
5. CRITICAL ACCOUNTING JUDGMENTS AND KEY SOURCES OF ESTIMATION
UNCERTAINTY AND ASSUMPTION
In the application of the Group’s accounting policies, the management is required to make judgments,
estimates and assumptions which are based on historical experience and other factors that are not readily
apparent from other sources. Actual results may differ from these estimates.
The estimates and underlying assumptions are reviewed by the management on an ongoing basis.
Revisions to accounting estimates are recognized in the period in which the estimate is revised if the
revision affects only that period or in the period of the revision and future periods if the revision affects
both current and future periods.
For the critical accounting judgments and key sources of estimation uncertainty and assumption applied in
these consolidated financial statements, please refer to the consolidated financial statements for the year
ended December 31, 2015.
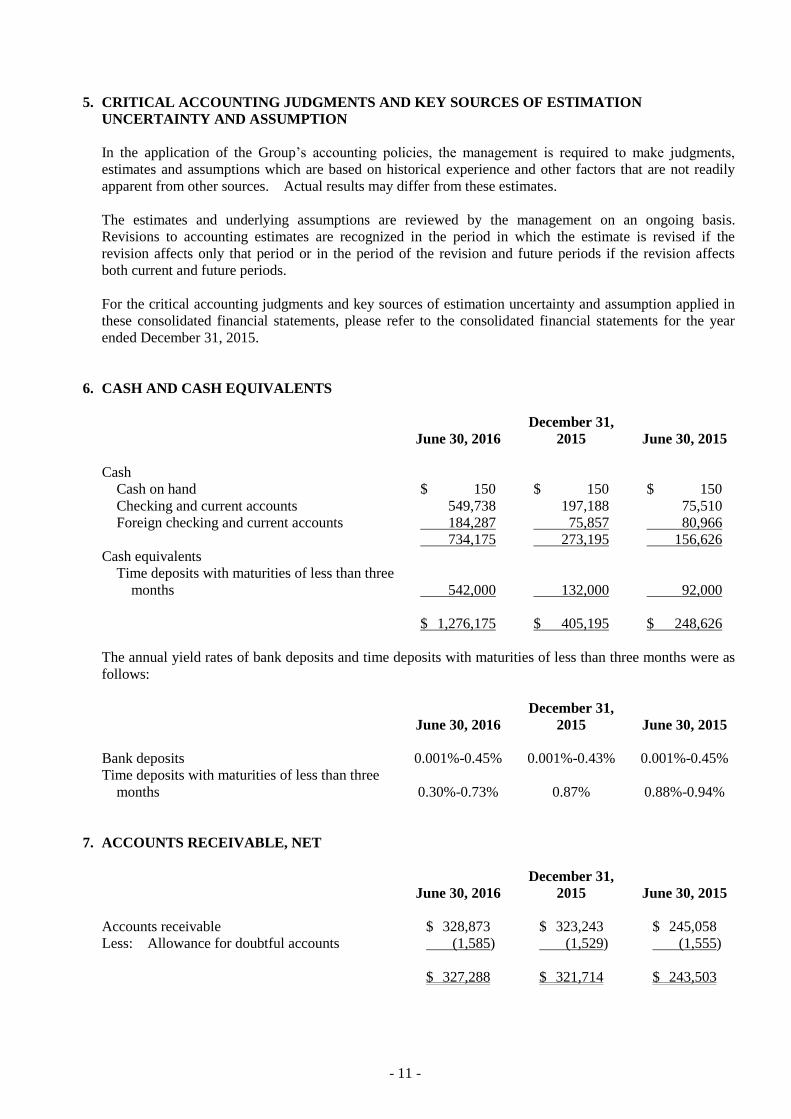
6. CASH AND CASH EQUIVALENTS
June 30, 2016
December 31,
2015 June 30, 2015
Cash
Cash on hand $ 150 $ 150 $ 150
Checking and current accounts 549,738 197,188 75,510
Foreign checking and current accounts 184,287 75,857 80,966
734,175 273,195 156,626
Cash equivalents
Time deposits with maturities of less than three
months 542,000 132,000 92,000
$ 1,276,175 $ 405,195 $ 248,626
The annual yield rates of bank deposits and time deposits with maturities of less than three months were as
follows:
June 30, 2016
December 31,
2015 June 30, 2015
Bank deposits 0.001%-0.45% 0.001%-0.43% 0.001%-0.45%
Time deposits with maturities of less than three
months 0.30%-0.73% 0.87% 0.88%-0.94%
7. ACCOUNTS RECEIVABLE, NET
June 30, 2016
December 31,
2015 June 30, 2015
Accounts receivable $ 328,873 $ 323,243 $ 245,058
Less: Allowance for doubtful accounts (1,585) (1,529) (1,555)
$ 327,288 $ 321,714 $ 243,503
- 12 -
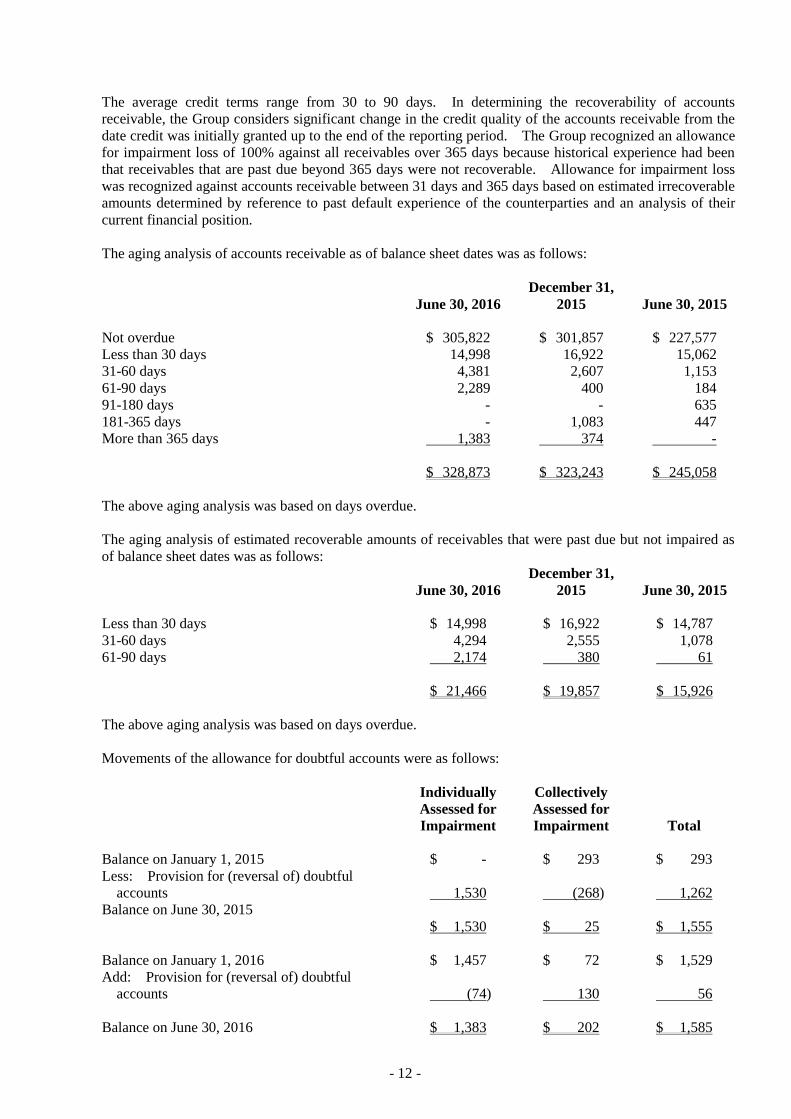
The average credit terms range from 30 to 90 days. In determining the recoverability of accounts
receivable, the Group considers significant change in the credit quality of the accounts receivable from the
date credit was initially granted up to the end of the reporting period. The Group recognized an allowance
for impairment loss of 100% against all receivables over 365 days because historical experience had been
that receivables that are past due beyond 365 days were not recoverable. Allowance for impairment loss
was recognized against accounts receivable between 31 days and 365 days based on estimated irrecoverable
amounts determined by reference to past default experience of the counterparties and an analysis of their
current financial position.
The aging analysis of accounts receivable as of balance sheet dates was as follows:
June 30, 2016
December 31,
2015 June 30, 2015
Not overdue $ 305,822 $ 301,857 $ 227,577
Less than 30 days 14,998 16,922 15,062
31-60 days 4,381 2,607 1,153
61-90 days 2,289 400 184
91-180 days - - 635
181-365 days - 1,083 447
More than 365 days 1,383 374 -
$ 328,873 $ 323,243 $ 245,058
The above aging analysis was based on days overdue.
The aging analysis of estimated recoverable amounts of receivables that were past due but not impaired as
of balance sheet dates was as follows:
June 30, 2016
December 31,
2015 June 30, 2015
Less than 30 days $ 14,998 $ 16,922 $ 14,787
31-60 days 4,294 2,555 1,078
61-90 days 2,174 380 61
$ 21,466 $ 19,857 $ 15,926
The above aging analysis was based on days overdue.
Movements of the allowance for doubtful accounts were as follows:
Individually
Assessed for
Impairment
Collectively
Assessed for
Impairment Total
Balance on January 1, 2015 $ - $ 293 $ 293
Less: Provision for (reversal of) doubtful
accounts 1,530 (268) 1,262
Balance on June 30, 2015
$ 1,530 $ 25 $ 1,555
Balance on January 1, 2016 $ 1,457 $ 72 $ 1,529
Add: Provision for (reversal of) doubtful
accounts (74) 130 56
Balance on June 30, 2016 $ 1,383 $ 202 $ 1,585
- 13 -
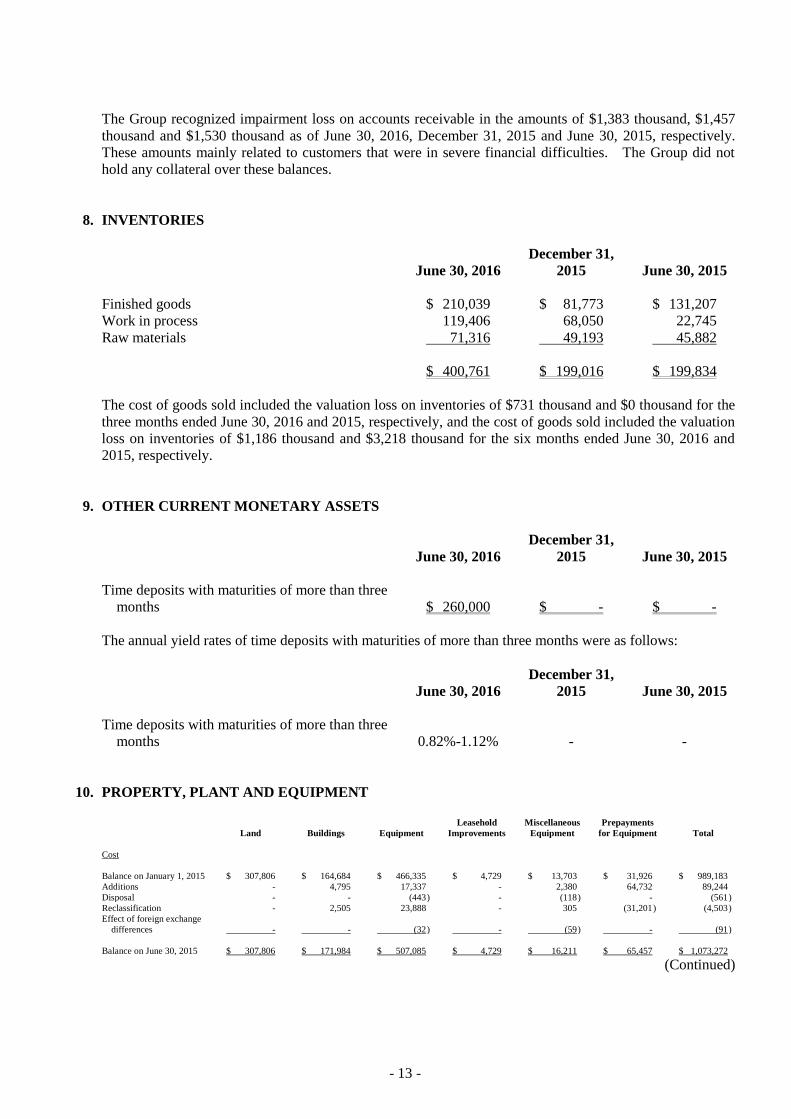
The Group recognized impairment loss on accounts receivable in the amounts of $1,383 thousand, $1,457
thousand and $1,530 thousand as of June 30, 2016, December 31, 2015 and June 30, 2015, respectively.
These amounts mainly related to customers that were in severe financial difficulties. The Group did not
hold any collateral over these balances.
8. INVENTORIES
June 30, 2016
December 31,
2015 June 30, 2015
Finished goods $ 210,039 $ 81,773 $ 131,207
Work in process 119,406 68,050 22,745
Raw materials 71,316 49,193 45,882
$ 400,761 $ 199,016 $ 199,834
The cost of goods sold included the valuation loss on inventories of $731 thousand and $0 thousand for the
three months ended June 30, 2016 and 2015, respectively, and the cost of goods sold included the valuation
loss on inventories of $1,186 thousand and $3,218 thousand for the six months ended June 30, 2016 and
2015, respectively.
9. OTHER CURRENT MONETARY ASSETS
June 30, 2016
December 31,
2015 June 30, 2015
Time deposits with maturities of more than three
months $ 260,000 $ - $ -
The annual yield rates of time deposits with maturities of more than three months were as follows:
June 30, 2016
December 31,
2015 June 30, 2015
Time deposits with maturities of more than three
months 0.82%-1.12% - -
10. PROPERTY, PLANT AND EQUIPMENT
Land Buildings Equipment
Leasehold
Improvements
Miscellaneous
Equipment
Prepayments
for Equipment Total
Cost
Balance on January 1, 2015 $ 307,806 $ 164,684 $ 466,335 $ 4,729 $ 13,703 $ 31,926 $ 989,183
Additions - 4,795 17,337 - 2,380 64,732 89,244
Disposal - - (443 ) - (118 ) - (561 )
Reclassification - 2,505 23,888 - 305 (31,201 ) (4,503 )
Effect of foreign exchange
differences - - (32 ) - (59 ) - (91 )
Balance on June 30, 2015 $ 307,806 $ 171,984 $ 507,085 $ 4,729 $ 16,211 $ 65,457 $ 1,073,272
(Continued)
- 14 -
Land Buildings Equipment
Leasehold
Improvements
Miscellaneous
Equipment
Prepayments
for Equipment Total
Accumulated depreciation
and impairment
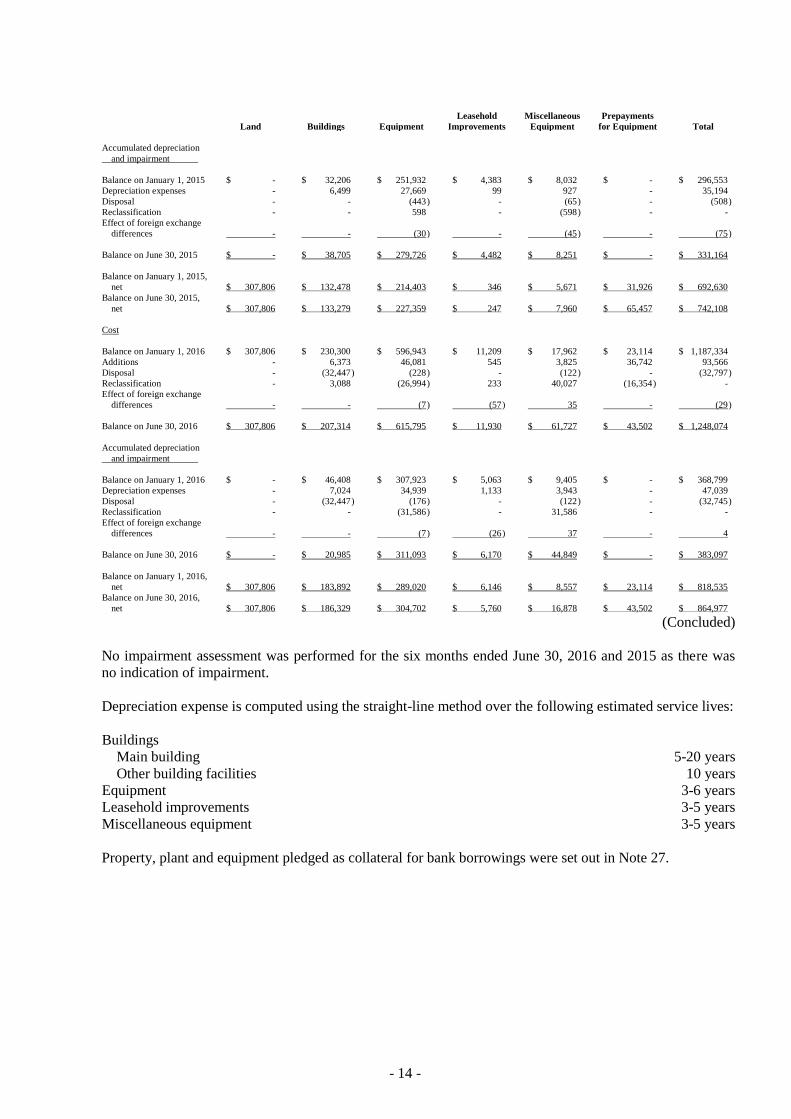
Balance on January 1, 2015 $ - $ 32,206 $ 251,932 $ 4,383 $ 8,032 $ - $ 296,553
Depreciation expenses - 6,499 27,669 99 927 - 35,194
Disposal - - (443 ) - (65 ) - (508 )
Reclassification - - 598 - (598 ) - -
Effect of foreign exchange
differences - - (30 ) - (45 ) - (75 )
Balance on June 30, 2015 $ - $ 38,705 $ 279,726 $ 4,482 $ 8,251 $ - $ 331,164
Balance on January 1, 2015,
net $ 307,806 $ 132,478 $ 214,403 $ 346 $ 5,671 $ 31,926 $ 692,630
Balance on June 30, 2015,
net $ 307,806 $ 133,279 $ 227,359 $ 247 $ 7,960 $ 65,457 $ 742,108
Cost
Balance on January 1, 2016 $ 307,806 $ 230,300 $ 596,943 $ 11,209 $ 17,962 $ 23,114 $ 1,187,334
Additions - 6,373 46,081 545 3,825 36,742 93,566
Disposal - (32,447 ) (228 ) - (122 ) - (32,797 )
Reclassification - 3,088 (26,994 ) 233 40,027 (16,354 ) -
Effect of foreign exchange
differences - - (7 ) (57 ) 35 - (29 )
Balance on June 30, 2016 $ 307,806 $ 207,314 $ 615,795 $ 11,930 $ 61,727 $ 43,502 $ 1,248,074
Accumulated depreciation
and impairment
Balance on January 1, 2016 $ - $ 46,408 $ 307,923 $ 5,063 $ 9,405 $ - $ 368,799
Depreciation expenses - 7,024 34,939 1,133 3,943 - 47,039
Disposal - (32,447 ) (176 ) - (122 ) - (32,745 )
Reclassification - - (31,586 ) - 31,586 - -
Effect of foreign exchange
differences - - (7 ) (26 ) 37 - 4
Balance on June 30, 2016 $ - $ 20,985 $ 311,093 $ 6,170 $ 44,849 $ - $ 383,097
Balance on January 1, 2016,
net $ 307,806 $ 183,892 $ 289,020 $ 6,146 $ 8,557 $ 23,114 $ 818,535
Balance on June 30, 2016,
net $ 307,806 $ 186,329 $ 304,702 $ 5,760 $ 16,878 $ 43,502 $ 864,977
(Concluded)
No impairment assessment was performed for the six months ended June 30, 2016 and 2015 as there was
no indication of impairment.
Depreciation expense is computed using the straight-line method over the following estimated service lives:
Buildings
Main building 5-20 years
Other building facilities 10 years
Equipment 3-6 years
Leasehold improvements 3-5 years
Miscellaneous equipment 3-5 years
Property, plant and equipment pledged as collateral for bank borrowings were set out in Note 27.

- 15 -
11. INTANGIBLE ASSETS
Computer
Software Patents Total
Cost
Balance on January 1, 2015 $ 79,736 $ 823 $ 80,559
Additions - acquired separately 2,699 - 2,699
Reclassification 4,503 - 4,503
Balance on June 30, 2015 $ 86,938 $ 823 $ 87,761
Accumulated amortization
Balance on January 1, 2015 $ 65,017 $ 563 $ 65,580
Amortization expenses 4,923 79 5,002
Balance on June 30, 2015 $ 69,940 $ 642 $ 70,582
Balance on January 1, 2015, net $ 14,719 $ 260 $ 14,979
Balance on June 30, 2015, net $ 16,998 $ 181 $ 17,179
Cost
Balance on January 1, 2016 $ 93,186 $ 891 $ 94,077
Additions - acquired separately 15,361 246 15,607
Balance on June 30, 2016 $ 108,547 $ 1,137 $ 109,684
Accumulated amortization
Balance on January 1, 2016 $ 74,952 $ 723 $ 75,675
Amortization expenses 6,840 83 6,923
Balance on June 30, 2016 $ 81,792 $ 806 $ 82,598
Balance on January 1, 2016, net $ 18,234 $ 168 $ 18,402
Balance on June 30, 2016, net $ 26,755 $ 331 $ 27,086
Intangible assets are amortized on a straight-line basis over the estimated useful lives as follows:
Computer software 3 years
Patents 3-5 years
- 16 -
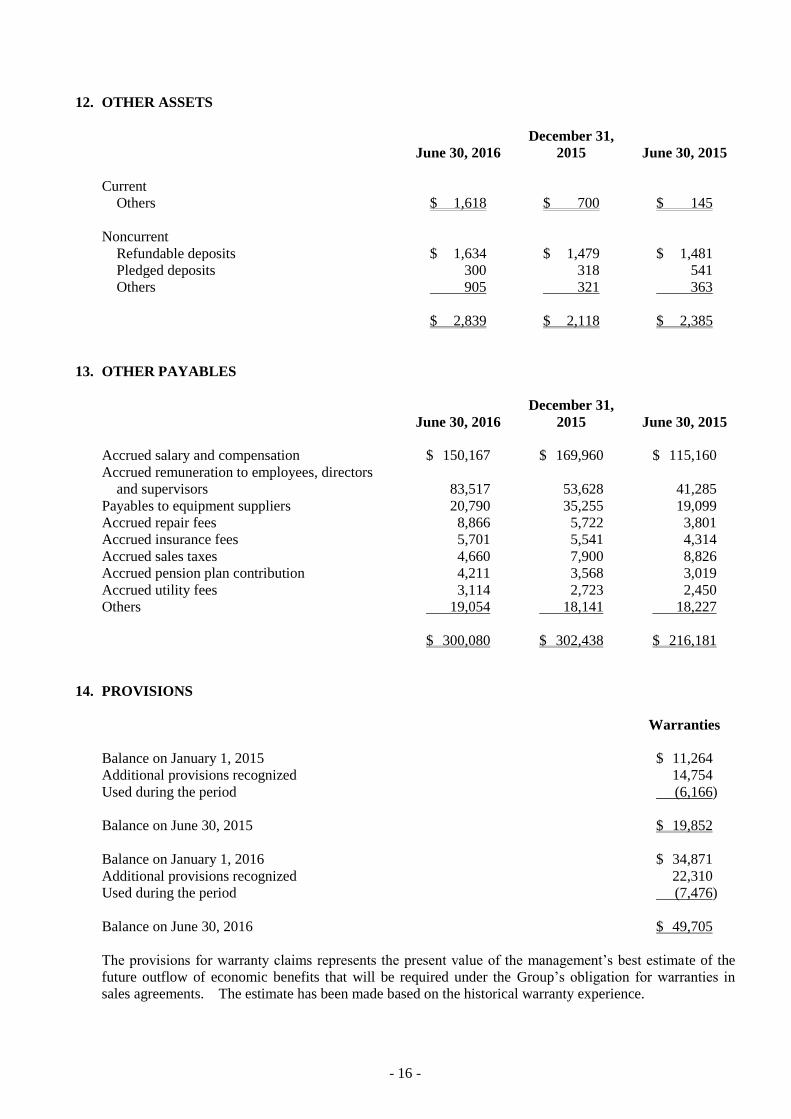
12. OTHER ASSETS
June 30, 2016
December 31,
2015 June 30, 2015
Current
Others $ 1,618 $ 700 $ 145
Noncurrent
Refundable deposits $ 1,634 $ 1,479 $ 1,481
Pledged deposits 300 318 541
Others 905 321 363
$ 2,839 $ 2,118 $ 2,385
13. OTHER PAYABLES
June 30, 2016
December 31,
2015 June 30, 2015
Accrued salary and compensation $ 150,167 $ 169,960 $ 115,160
Accrued remuneration to employees, directors
and supervisors 83,517 53,628 41,285
Payables to equipment suppliers 20,790 35,255 19,099
Accrued repair fees 8,866 5,722 3,801
Accrued insurance fees 5,701 5,541 4,314
Accrued sales taxes 4,660 7,900 8,826
Accrued pension plan contribution 4,211 3,568 3,019
Accrued utility fees 3,114 2,723 2,450
Others 19,054 18,141 18,227
$ 300,080 $ 302,438 $ 216,181
14. PROVISIONS
Warranties
Balance on January 1, 2015 $ 11,264
Additional provisions recognized 14,754
Used during the period (6,166)
Balance on June 30, 2015 $ 19,852
Balance on January 1, 2016 $ 34,871
Additional provisions recognized 22,310
Used during the period (7,476)
Balance on June 30, 2016 $ 49,705
The provisions for warranty claims represents the present value of the management’s best estimate of the
future outflow of economic benefits that will be required under the Group’s obligation for warranties in
sales agreements. The estimate has been made based on the historical warranty experience.
- 17 -
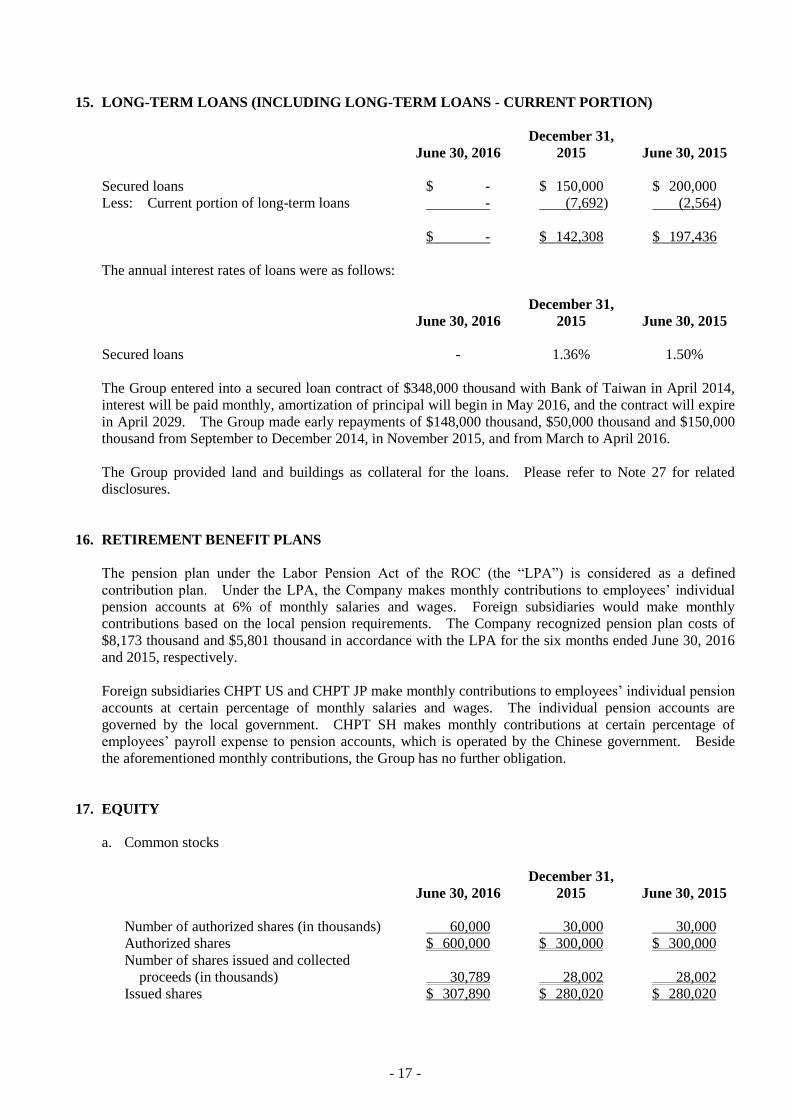
15. LONG-TERM LOANS (INCLUDING LONG-TERM LOANS - CURRENT PORTION)
June 30, 2016
December 31,
2015 June 30, 2015
Secured loans $ - $ 150,000 $ 200,000
Less: Current portion of long-term loans - (7,692) (2,564)
$ - $ 142,308 $ 197,436
The annual interest rates of loans were as follows:
June 30, 2016
December 31,
2015 June 30, 2015
Secured loans - 1.36% 1.50%
The Group entered into a secured loan contract of $348,000 thousand with Bank of Taiwan in April 2014,
interest will be paid monthly, amortization of principal will begin in May 2016, and the contract will expire
in April 2029. The Group made early repayments of $148,000 thousand, $50,000 thousand and $150,000
thousand from September to December 2014, in November 2015, and from March to April 2016.
The Group provided land and buildings as collateral for the loans. Please refer to Note 27 for related
disclosures.
16. RETIREMENT BENEFIT PLANS
The pension plan under the Labor Pension Act of the ROC (the “LPA”) is considered as a defined
contribution plan. Under the LPA, the Company makes monthly contributions to employees’ individual
pension accounts at 6% of monthly salaries and wages. Foreign subsidiaries would make monthly
contributions based on the local pension requirements. The Company recognized pension plan costs of
$8,173 thousand and $5,801 thousand in accordance with the LPA for the six months ended June 30, 2016
and 2015, respectively.
Foreign subsidiaries CHPT US and CHPT JP make monthly contributions to employees’ individual pension
accounts at certain percentage of monthly salaries and wages. The individual pension accounts are
governed by the local government. CHPT SH makes monthly contributions at certain percentage of
employees’ payroll expense to pension accounts, which is operated by the Chinese government. Beside
the aforementioned monthly contributions, the Group has no further obligation.
17. EQUITY
a. Common stocks
June 30, 2016
December 31,
2015 June 30, 2015
Number of authorized shares (in thousands) 60,000 30,000 30,000
Authorized shares $ 600,000 $ 300,000 $ 300,000
Number of shares issued and collected
proceeds (in thousands) 30,789 28,002 28,002
Issued shares $ 307,890 $ 280,020 $ 280,020
- 18 -
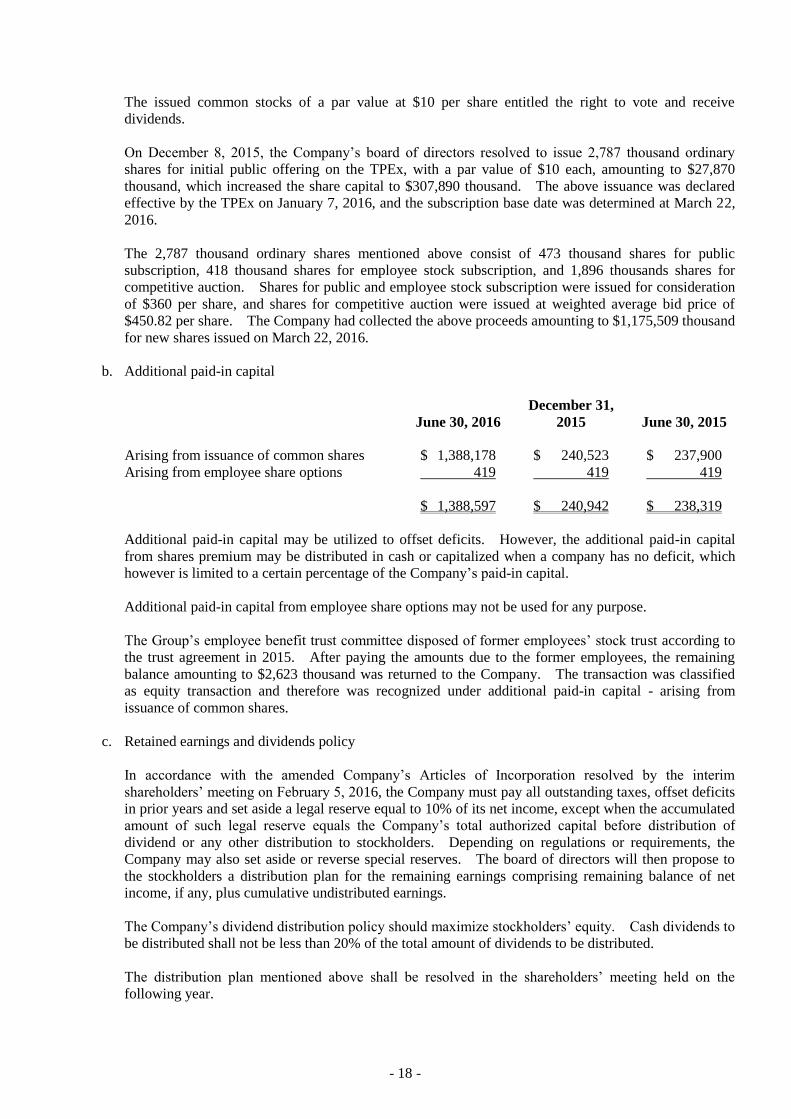
The issued common stocks of a par value at $10 per share entitled the right to vote and receive
dividends.
On December 8, 2015, the Company’s board of directors resolved to issue 2,787 thousand ordinary
shares for initial public offering on the TPEx, with a par value of $10 each, amounting to $27,870
thousand, which increased the share capital to $307,890 thousand. The above issuance was declared
effective by the TPEx on January 7, 2016, and the subscription base date was determined at March 22,
2016.
The 2,787 thousand ordinary shares mentioned above consist of 473 thousand shares for public
subscription, 418 thousand shares for employee stock subscription, and 1,896 thousands shares for
competitive auction. Shares for public and employee stock subscription were issued for consideration
of $360 per share, and shares for competitive auction were issued at weighted average bid price of
$450.82 per share. The Company had collected the above proceeds amounting to $1,175,509 thousand
for new shares issued on March 22, 2016.
b. Additional paid-in capital
June 30, 2016
December 31,
2015 June 30, 2015
Arising from issuance of common shares $ 1,388,178 $ 240,523 $ 237,900
Arising from employee share options 419 419 419
$ 1,388,597 $ 240,942 $ 238,319
Additional paid-in capital may be utilized to offset deficits. However, the additional paid-in capital
from shares premium may be distributed in cash or capitalized when a company has no deficit, which
however is limited to a certain percentage of the Company’s paid-in capital.
Additional paid-in capital from employee share options may not be used for any purpose.
The Group’s employee benefit trust committee disposed of former employees’ stock trust according to
the trust agreement in 2015. After paying the amounts due to the former employees, the remaining
balance amounting to $2,623 thousand was returned to the Company. The transaction was classified
as equity transaction and therefore was recognized under additional paid-in capital - arising from
issuance of common shares.
c. Retained earnings and dividends policy
In accordance with the amended Company’s Articles of Incorporation resolved by the interim
shareholders’ meeting on February 5, 2016, the Company must pay all outstanding taxes, offset deficits
in prior years and set aside a legal reserve equal to 10% of its net income, except when the accumulated
amount of such legal reserve equals the Company’s total authorized capital before distribution of
dividend or any other distribution to stockholders. Depending on regulations or requirements, the
Company may also set aside or reverse special reserves. The board of directors will then propose to
the stockholders a distribution plan for the remaining earnings comprising remaining balance of net
income, if any, plus cumulative undistributed earnings.
The Company’s dividend distribution policy should maximize stockholders’ equity. Cash dividends to
be distributed shall not be less than 20% of the total amount of dividends to be distributed.
The distribution plan mentioned above shall be resolved in the shareholders’ meeting held on the
following year.
- 19 -
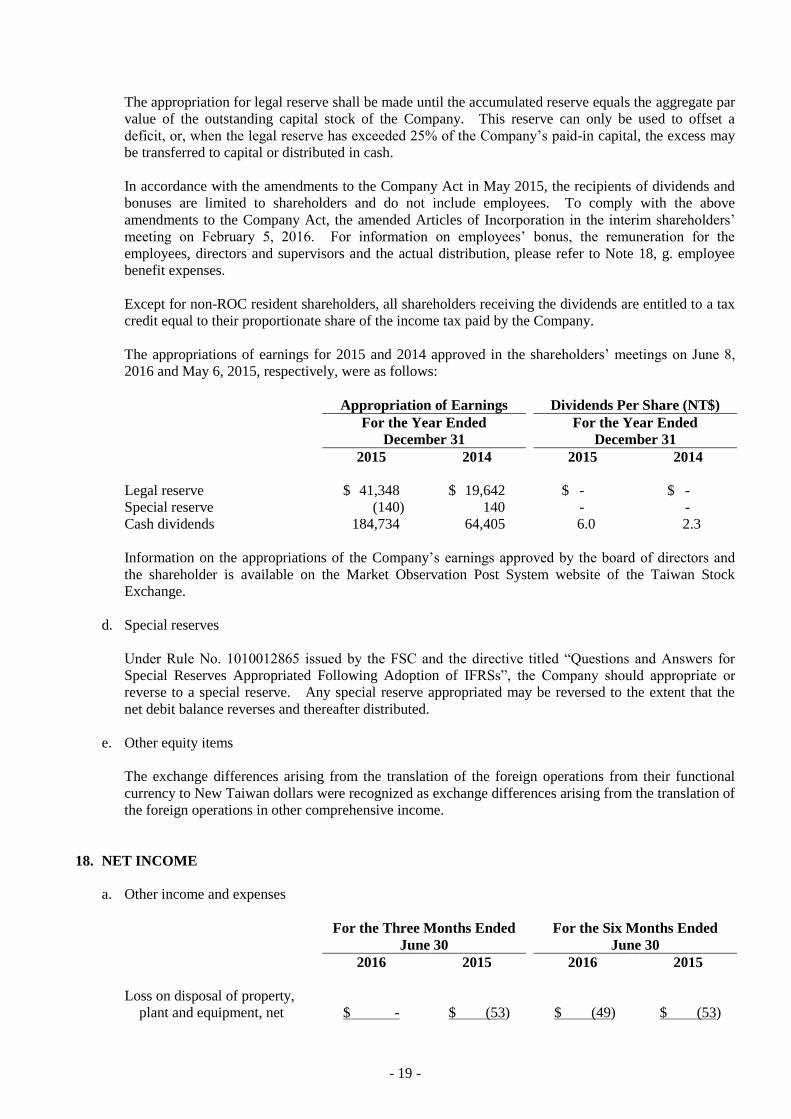
The appropriation for legal reserve shall be made until the accumulated reserve equals the aggregate par
value of the outstanding capital stock of the Company. This reserve can only be used to offset a
deficit, or, when the legal reserve has exceeded 25% of the Company’s paid-in capital, the excess may
be transferred to capital or distributed in cash.
In accordance with the amendments to the Company Act in May 2015, the recipients of dividends and
bonuses are limited to shareholders and do not include employees. To comply with the above
amendments to the Company Act, the amended Articles of Incorporation in the interim shareholders’
meeting on February 5, 2016. For information on employees’ bonus, the remuneration for the
employees, directors and supervisors and the actual distribution, please refer to Note 18, g. employee
benefit expenses.
Except for non-ROC resident shareholders, all shareholders receiving the dividends are entitled to a tax
credit equal to their proportionate share of the income tax paid by the Company.
The appropriations of earnings for 2015 and 2014 approved in the shareholders’ meetings on June 8,
2016 and May 6, 2015, respectively, were as follows:
Appropriation of Earnings Dividends Per Share (NT$)
For the Year Ended
December 31
For the Year Ended
December 31
2015 2014 2015 2014
Legal reserve $ 41,348 $ 19,642 $ - $ -
Special reserve (140) 140 - -
Cash dividends 184,734 64,405 6.0 2.3
Information on the appropriations of the Company’s earnings approved by the board of directors and
the shareholder is available on the Market Observation Post System website of the Taiwan Stock
Exchange.
d. Special reserves
Under Rule No. 1010012865 issued by the FSC and the directive titled “Questions and Answers for
Special Reserves Appropriated Following Adoption of IFRSs”, the Company should appropriate or
reverse to a special reserve. Any special reserve appropriated may be reversed to the extent that the
net debit balance reverses and thereafter distributed.
e. Other equity items
The exchange differences arising from the translation of the foreign operations from their functional
currency to New Taiwan dollars were recognized as exchange differences arising from the translation of
the foreign operations in other comprehensive income.
18. NET INCOME
a. Other income and expenses
For the Three Months Ended
June 30
For the Six Months Ended
June 30
2016 2015 2016 2015
Loss on disposal of property,
plant and equipment, net $ - $ (53) $ (49) $ (53)
- 20 -
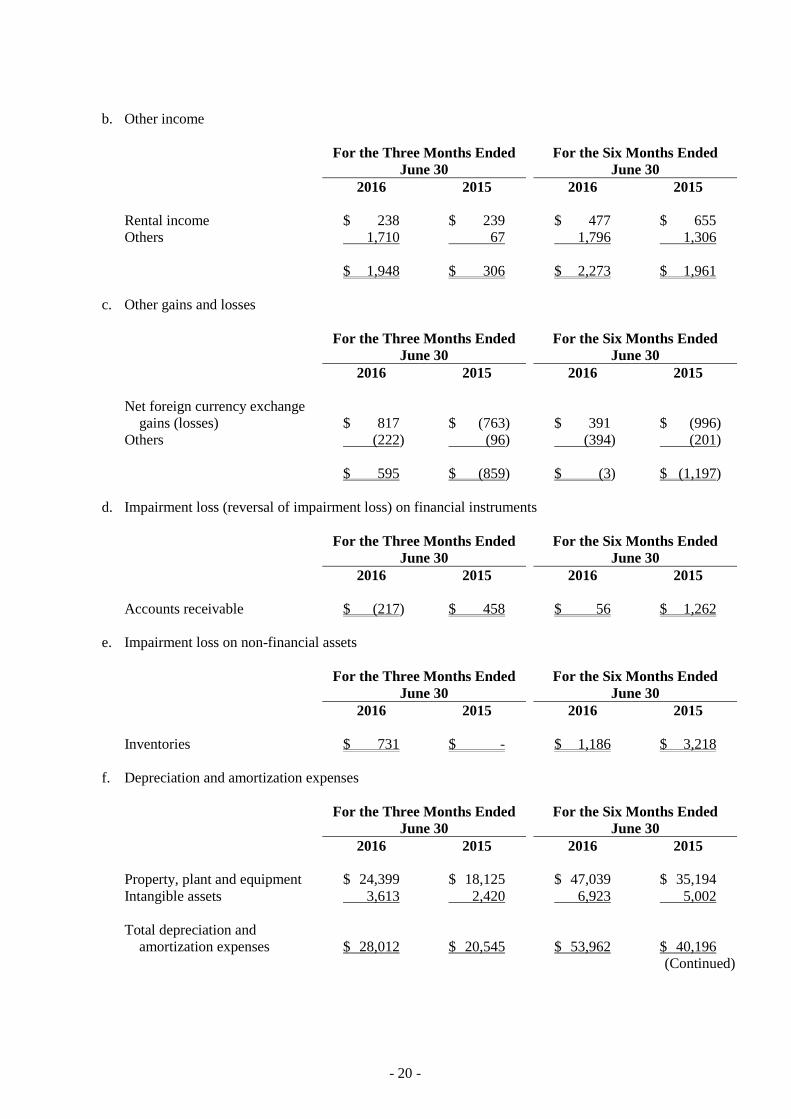
b. Other income
For the Three Months Ended
June 30
For the Six Months Ended
June 30
2016 2015 2016 2015
Rental income $ 238 $ 239 $ 477 $ 655
Others 1,710 67 1,796 1,306
$ 1,948 $ 306 $ 2,273 $ 1,961
c. Other gains and losses
For the Three Months Ended
June 30
For the Six Months Ended
June 30
2016 2015 2016 2015
Net foreign currency exchange
gains (losses) $ 817 $ (763) $ 391 $ (996)
Others (222) (96) (394) (201)
$ 595 $ (859) $ (3) $ (1,197)
d. Impairment loss (reversal of impairment loss) on financial instruments
For the Three Months Ended
June 30
For the Six Months Ended
June 30
2016 2015 2016 2015
Accounts receivable $ (217) $ 458 $ 56 $ 1,262
e. Impairment loss on non-financial assets
For the Three Months Ended
June 30
For the Six Months Ended
June 30
2016 2015 2016 2015
Inventories $ 731 $ - $ 1,186 $ 3,218
f. Depreciation and amortization expenses
For the Three Months Ended
June 30
For the Six Months Ended
June 30
2016 2015 2016 2015
Property, plant and equipment $ 24,399 $ 18,125 $ 47,039 $ 35,194
Intangible assets 3,613 2,420 6,923 5,002
Total depreciation and
amortization expenses $ 28,012 $ 20,545 $ 53,962 $ 40,196
(Continued)
- 21 -
For the Three Months Ended
June 30
For the Six Months Ended
June 30
2016 2015 2016 2015
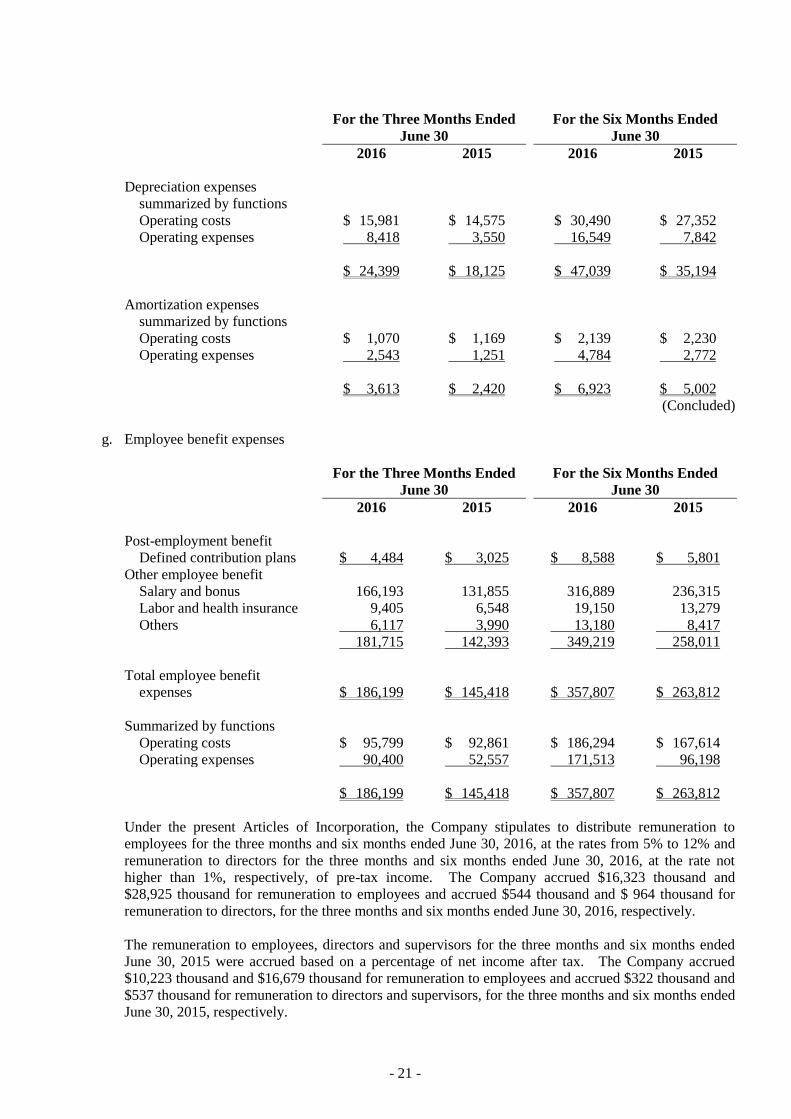
Depreciation expenses
summarized by functions
Operating costs $ 15,981 $ 14,575 $ 30,490 $ 27,352
Operating expenses 8,418 3,550 16,549 7,842
$ 24,399 $ 18,125 $ 47,039 $ 35,194
Amortization expenses
summarized by functions
Operating costs $ 1,070 $ 1,169 $ 2,139 $ 2,230
Operating expenses 2,543 1,251 4,784 2,772
$ 3,613 $ 2,420 $ 6,923 $ 5,002
(Concluded)
g. Employee benefit expenses
For the Three Months Ended
June 30
For the Six Months Ended
June 30
2016 2015 2016 2015
Post-employment benefit
Defined contribution plans $ 4,484 $ 3,025 $ 8,588 $ 5,801
Other employee benefit
Salary and bonus 166,193 131,855 316,889 236,315
Labor and health insurance 9,405 6,548 19,150 13,279
Others 6,117 3,990 13,180 8,417
181,715 142,393 349,219 258,011
Total employee benefit
expenses $ 186,199 $ 145,418 $ 357,807 $ 263,812
Summarized by functions
Operating costs $ 95,799 $ 92,861 $ 186,294 $ 167,614
Operating expenses 90,400 52,557 171,513 96,198
$ 186,199 $ 145,418 $ 357,807 $ 263,812
Under the present Articles of Incorporation, the Company stipulates to distribute remuneration to
employees for the three months and six months ended June 30, 2016, at the rates from 5% to 12% and
remuneration to directors for the three months and six months ended June 30, 2016, at the rate not
higher than 1%, respectively, of pre-tax income. The Company accrued $16,323 thousand and
$28,925 thousand for remuneration to employees and accrued $544 thousand and $ 964 thousand for
remuneration to directors, for the three months and six months ended June 30, 2016, respectively.
The remuneration to employees, directors and supervisors for the three months and six months ended
June 30, 2015 were accrued based on a percentage of net income after tax. The Company accrued
$10,223 thousand and $16,679 thousand for remuneration to employees and accrued $322 thousand and
$537 thousand for remuneration to directors and supervisors, for the three months and six months ended
June 30, 2015, respectively.
- 22 -
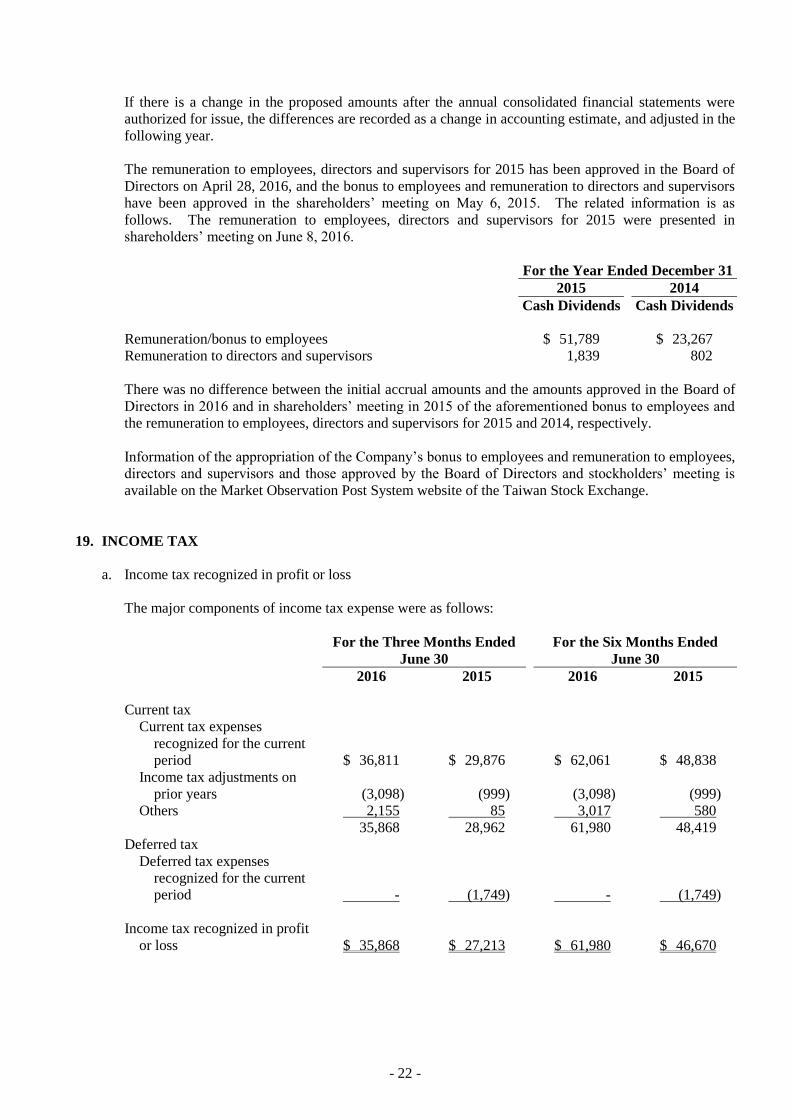
If there is a change in the proposed amounts after the annual consolidated financial statements were
authorized for issue, the differences are recorded as a change in accounting estimate, and adjusted in the
following year.
The remuneration to employees, directors and supervisors for 2015 has been approved in the Board of
Directors on April 28, 2016, and the bonus to employees and remuneration to directors and supervisors
have been approved in the shareholders’ meeting on May 6, 2015. The related information is as
follows. The remuneration to employees, directors and supervisors for 2015 were presented in
shareholders’ meeting on June 8, 2016.
For the Year Ended December 31
2015 2014
Cash Dividends Cash Dividends
Remuneration/bonus to employees $ 51,789 $ 23,267
Remuneration to directors and supervisors 1,839 802
There was no difference between the initial accrual amounts and the amounts approved in the Board of
Directors in 2016 and in shareholders’ meeting in 2015 of the aforementioned bonus to employees and
the remuneration to employees, directors and supervisors for 2015 and 2014, respectively.
Information of the appropriation of the Company’s bonus to employees and remuneration to employees,
directors and supervisors and those approved by the Board of Directors and stockholders’ meeting is
available on the Market Observation Post System website of the Taiwan Stock Exchange.
19. INCOME TAX
a. Income tax recognized in profit or loss
The major components of income tax expense were as follows:
For the Three Months Ended
June 30
For the Six Months Ended
June 30
2016 2015 2016 2015
Current tax
Current tax expenses
recognized for the current
period $ 36,811 $ 29,876 $ 62,061 $ 48,838
Income tax adjustments on
prior years (3,098) (999) (3,098) (999)
Others 2,155 85 3,017 580
35,868 28,962 61,980 48,419
Deferred tax
Deferred tax expenses
recognized for the current
period - (1,749) - (1,749)
Income tax recognized in profit
or loss $ 35,868 $ 27,213 $ 61,980 $ 46,670
- 23 -
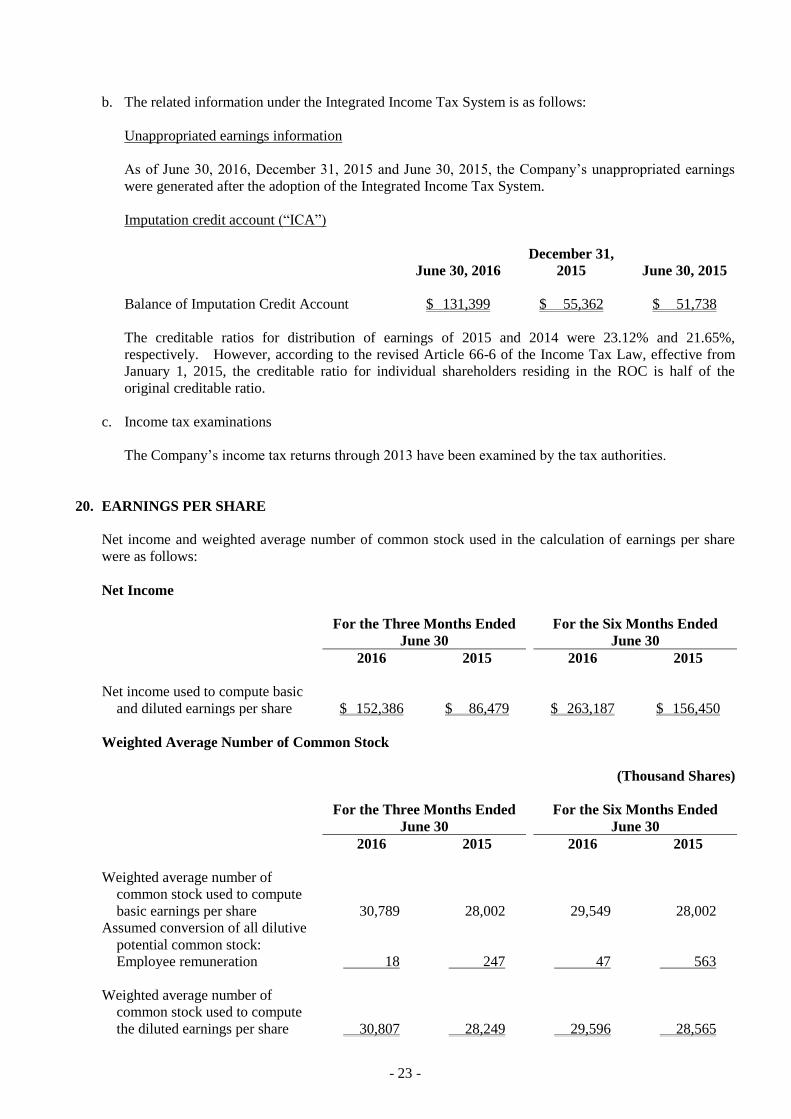
b. The related information under the Integrated Income Tax System is as follows:
Unappropriated earnings information
As of June 30, 2016, December 31, 2015 and June 30, 2015, the Company’s unappropriated earnings
were generated after the adoption of the Integrated Income Tax System.
Imputation credit account (“ICA”)
June 30, 2016
December 31,
2015 June 30, 2015
Balance of Imputation Credit Account $ 131,399 $ 55,362 $ 51,738
The creditable ratios for distribution of earnings of 2015 and 2014 were 23.12% and 21.65%,
respectively. However, according to the revised Article 66-6 of the Income Tax Law, effective from
January 1, 2015, the creditable ratio for individual shareholders residing in the ROC is half of the
original creditable ratio.
c. Income tax examinations
The Company’s income tax returns through 2013 have been examined by the tax authorities.
20. EARNINGS PER SHARE
Net income and weighted average number of common stock used in the calculation of earnings per share
were as follows:
Net Income
For the Three Months Ended
June 30
For the Six Months Ended
June 30
2016 2015 2016 2015
Net income used to compute basic
and diluted earnings per share $ 152,386 $ 86,479 $ 263,187 $ 156,450
Weighted Average Number of Common Stock
(Thousand Shares)
For the Three Months Ended
June 30
For the Six Months Ended
June 30
2016 2015 2016 2015
Weighted average number of
common stock used to compute
basic earnings per share 30,789 28,002 29,549 28,002
Assumed conversion of all dilutive
potential common stock:
Employee remuneration 18 247 47 563
Weighted average number of
common stock used to compute
the diluted earnings per share 30,807 28,249 29,596 28,565
- 24 -
If the Group may settle remuneration paid to employees in cash or shares, the Group assumed the entire
amount of the remuneration would be settled in shares and the resulting potential shares are included in the
weighted average number of shares outstanding used in the computation of diluted earnings per share, since
the effect is dilutive. Such dilutive effect of the potential shares is included in the computation of diluted
earnings per share until the number of shares to be distributed to employees is resolved in the following
year.
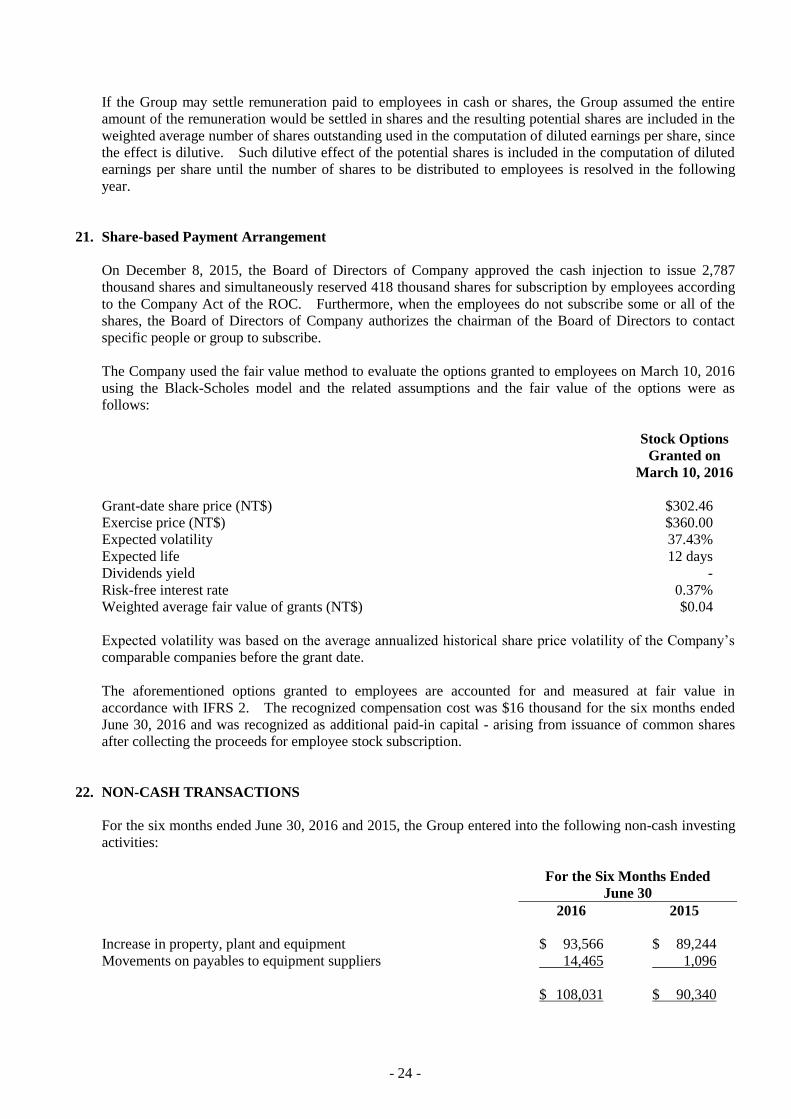
21. Share-based Payment Arrangement
On December 8, 2015, the Board of Directors of Company approved the cash injection to issue 2,787
thousand shares and simultaneously reserved 418 thousand shares for subscription by employees according
to the Company Act of the ROC. Furthermore, when the employees do not subscribe some or all of the
shares, the Board of Directors of Company authorizes the chairman of the Board of Directors to contact
specific people or group to subscribe.
The Company used the fair value method to evaluate the options granted to employees on March 10, 2016
using the Black-Scholes model and the related assumptions and the fair value of the options were as
follows:
Stock Options
Granted on
March 10, 2016
Grant-date share price (NT$) $302.46
Exercise price (NT$) $360.00
Expected volatility 37.43%
Expected life 12 days
Dividends yield -
Risk-free interest rate 0.37%
Weighted average fair value of grants (NT$) $0.04
Expected volatility was based on the average annualized historical share price volatility of the Company’s
comparable companies before the grant date.
The aforementioned options granted to employees are accounted for and measured at fair value in
accordance with IFRS 2. The recognized compensation cost was $16 thousand for the six months ended
June 30, 2016 and was recognized as additional paid-in capital - arising from issuance of common shares
after collecting the proceeds for employee stock subscription.
22. NON-CASH TRANSACTIONS
For the six months ended June 30, 2016 and 2015, the Group entered into the following non-cash investing
activities:
For the Six Months Ended
June 30
2016 2015
Increase in property, plant and equipment $ 93,566 $ 89,244
Movements on payables to equipment suppliers 14,465 1,096
$ 108,031 $ 90,340
- 25 -
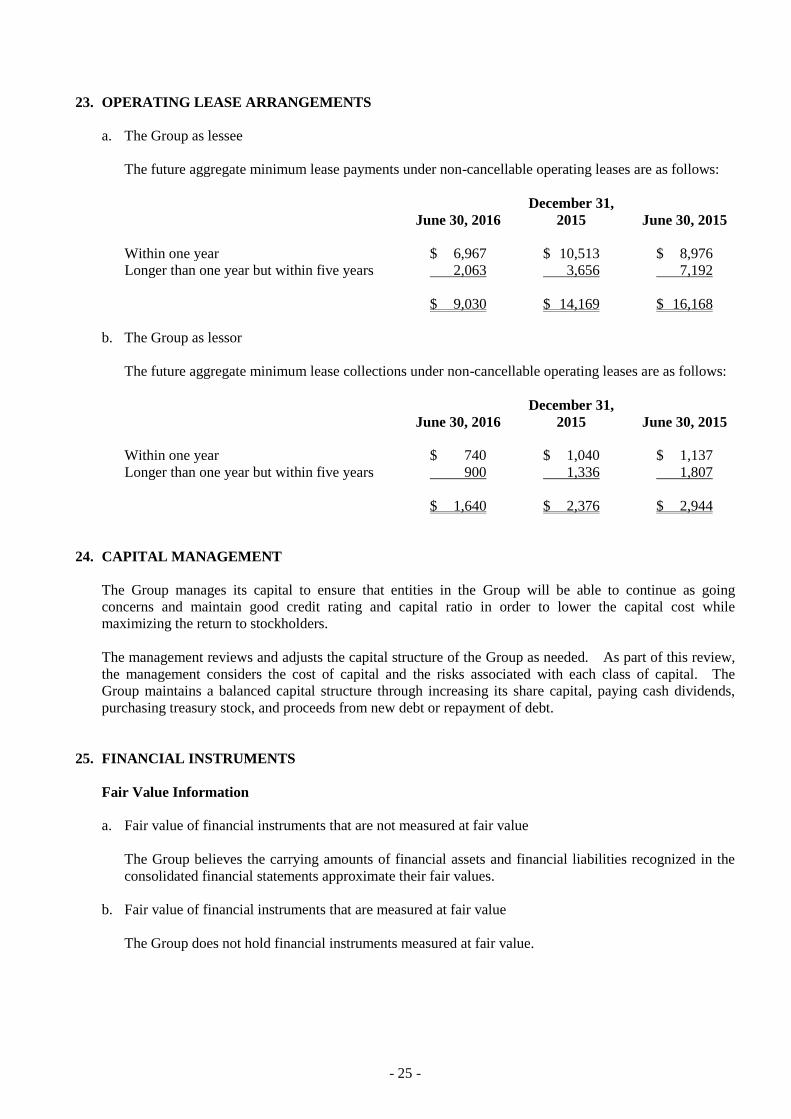
23. OPERATING LEASE ARRANGEMENTS
a. The Group as lessee
The future aggregate minimum lease payments under non-cancellable operating leases are as follows:
June 30, 2016
December 31,
2015 June 30, 2015
Within one year $ 6,967 $ 10,513 $ 8,976
Longer than one year but within five years 2,063 3,656 7,192
$ 9,030 $ 14,169 $ 16,168
b. The Group as lessor
The future aggregate minimum lease collections under non-cancellable operating leases are as follows:
June 30, 2016
December 31,
2015 June 30, 2015
Within one year $ 740 $ 1,040 $ 1,137
Longer than one year but within five years 900 1,336 1,807
$ 1,640 $ 2,376 $ 2,944
24. CAPITAL MANAGEMENT
The Group manages its capital to ensure that entities in the Group will be able to continue as going
concerns and maintain good credit rating and capital ratio in order to lower the capital cost while
maximizing the return to stockholders.
The management reviews and adjusts the capital structure of the Group as needed. As part of this review,
the management considers the cost of capital and the risks associated with each class of capital. The
Group maintains a balanced capital structure through increasing its share capital, paying cash dividends,
purchasing treasury stock, and proceeds from new debt or repayment of debt.
25. FINANCIAL INSTRUMENTS
Fair Value Information
a. Fair value of financial instruments that are not measured at fair value
The Group believes the carrying amounts of financial assets and financial liabilities recognized in the
consolidated financial statements approximate their fair values.
b. Fair value of financial instruments that are measured at fair value
The Group does not hold financial instruments measured at fair value.
- 26 -
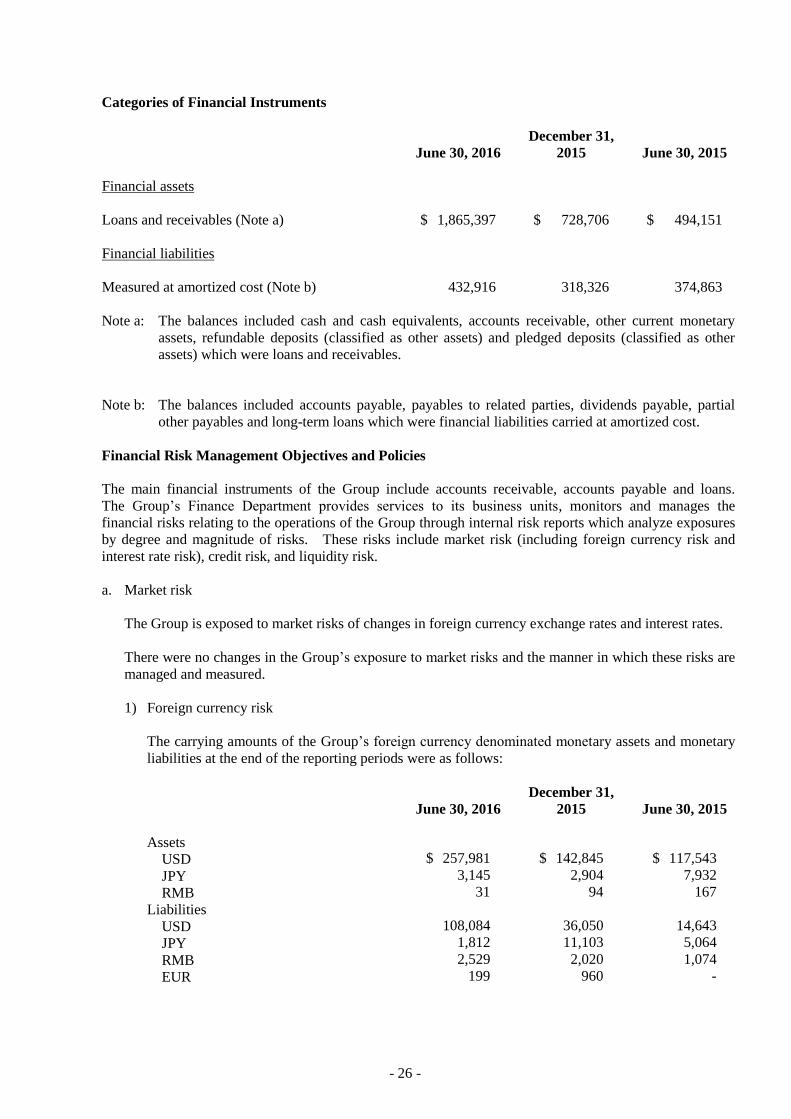
Categories of Financial Instruments
June 30, 2016
December 31,
2015 June 30, 2015
Financial assets
Loans and receivables (Note a) $ 1,865,397 $ 728,706 $ 494,151
Financial liabilities
Measured at amortized cost (Note b) 432,916 318,326 374,863
Note a: The balances included cash and cash equivalents, accounts receivable, other current monetary
assets, refundable deposits (classified as other assets) and pledged deposits (classified as other
assets) which were loans and receivables.
Note b: The balances included accounts payable, payables to related parties, dividends payable, partial
other payables and long-term loans which were financial liabilities carried at amortized cost.
Financial Risk Management Objectives and Policies
The main financial instruments of the Group include accounts receivable, accounts payable and loans.
The Group’s Finance Department provides services to its business units, monitors and manages the
financial risks relating to the operations of the Group through internal risk reports which analyze exposures
by degree and magnitude of risks. These risks include market risk (including foreign currency risk and
interest rate risk), credit risk, and liquidity risk.
a. Market risk
The Group is exposed to market risks of changes in foreign currency exchange rates and interest rates.
There were no changes in the Group’s exposure to market risks and the manner in which these risks are
managed and measured.
1) Foreign currency risk
The carrying amounts of the Group’s foreign currency denominated monetary assets and monetary
liabilities at the end of the reporting periods were as follows:
June 30, 2016
December 31,
2015 June 30, 2015
Assets
USD $ 257,981 $ 142,845 $ 117,543
JPY 3,145 2,904 7,932
RMB 31 94 167
Liabilities
USD 108,084 36,050 14,643
JPY 1,812 11,103 5,064
RMB 2,529 2,020 1,074
EUR 199 960 -
- 27 -
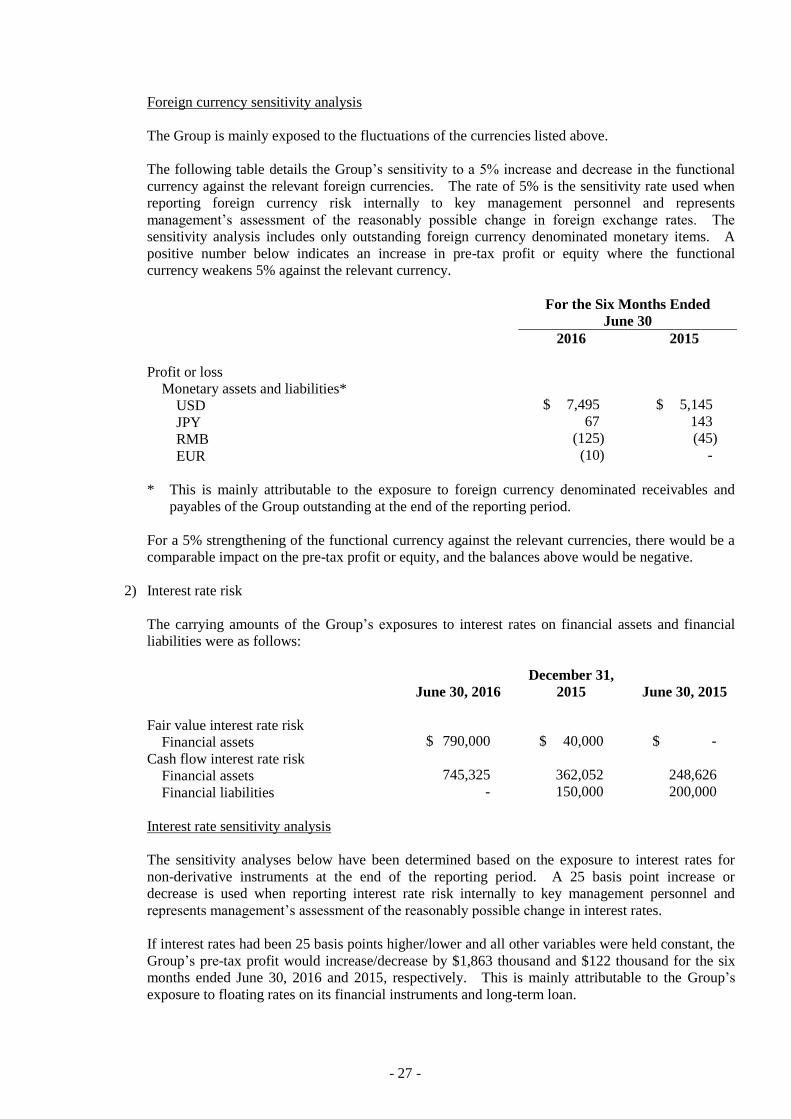
Foreign currency sensitivity analysis
The Group is mainly exposed to the fluctuations of the currencies listed above.
The following table details the Group’s sensitivity to a 5% increase and decrease in the functional
currency against the relevant foreign currencies. The rate of 5% is the sensitivity rate used when
reporting foreign currency risk internally to key management personnel and represents
management’s assessment of the reasonably possible change in foreign exchange rates. The
sensitivity analysis includes only outstanding foreign currency denominated monetary items. A
positive number below indicates an increase in pre-tax profit or equity where the functional
currency weakens 5% against the relevant currency.
For the Six Months Ended
June 30
2016 2015
Profit or loss
Monetary assets and liabilities*
USD $ 7,495 $ 5,145
JPY 67 143
RMB (125) (45)
EUR (10) -
* This is mainly attributable to the exposure to foreign currency denominated receivables and
payables of the Group outstanding at the end of the reporting period.
For a 5% strengthening of the functional currency against the relevant currencies, there would be a
comparable impact on the pre-tax profit or equity, and the balances above would be negative.
2) Interest rate risk
The carrying amounts of the Group’s exposures to interest rates on financial assets and financial
liabilities were as follows:
June 30, 2016
December 31,
2015 June 30, 2015
Fair value interest rate risk
Financial assets $ 790,000 $ 40,000 $ -
Cash flow interest rate risk
Financial assets 745,325 362,052 248,626
Financial liabilities - 150,000 200,000
Interest rate sensitivity analysis
The sensitivity analyses below have been determined based on the exposure to interest rates for
non-derivative instruments at the end of the reporting period. A 25 basis point increase or
decrease is used when reporting interest rate risk internally to key management personnel and
represents management’s assessment of the reasonably possible change in interest rates.
If interest rates had been 25 basis points higher/lower and all other variables were held constant, the
Group’s pre-tax profit would increase/decrease by $1,863 thousand and $122 thousand for the six
months ended June 30, 2016 and 2015, respectively. This is mainly attributable to the Group’s
exposure to floating rates on its financial instruments and long-term loan.
- 28 -
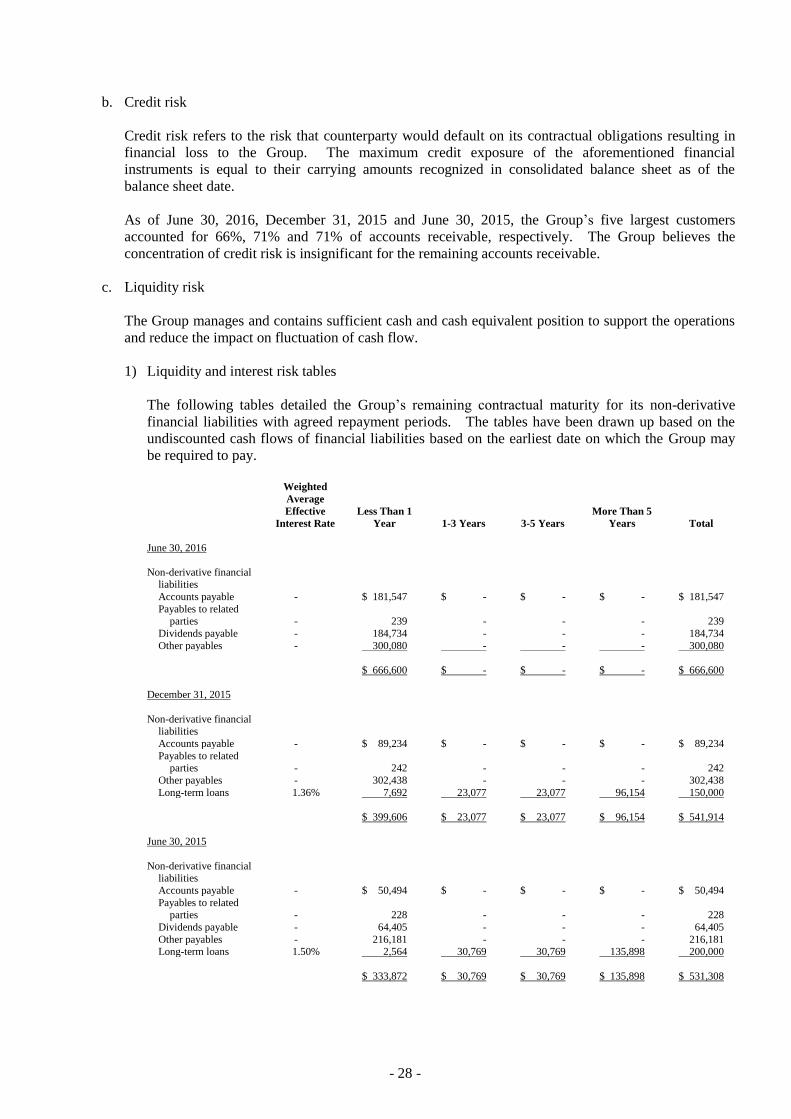
b. Credit risk
Credit risk refers to the risk that counterparty would default on its contractual obligations resulting in
financial loss to the Group. The maximum credit exposure of the aforementioned financial
instruments is equal to their carrying amounts recognized in consolidated balance sheet as of the
balance sheet date.
As of June 30, 2016, December 31, 2015 and June 30, 2015, the Group’s five largest customers
accounted for 66%, 71% and 71% of accounts receivable, respectively. The Group believes the
concentration of credit risk is insignificant for the remaining accounts receivable.
c. Liquidity risk
The Group manages and contains sufficient cash and cash equivalent position to support the operations
and reduce the impact on fluctuation of cash flow.
1) Liquidity and interest risk tables
The following tables detailed the Group’s remaining contractual maturity for its non-derivative
financial liabilities with agreed repayment periods. The tables have been drawn up based on the
undiscounted cash flows of financial liabilities based on the earliest date on which the Group may
be required to pay.
Weighted
Average
Effective
Interest Rate Less Than 1
Year 1-3 Years 3-5 Years More Than 5
Years Total
June 30, 2016
Non-derivative financial liabilities
Accounts payable - $ 181,547 $ - $ - $ - $ 181,547
Payables to related parties - 239 - - - 239
Dividends payable - 184,734 - - - 184,734
Other payables - 300,080 - - - 300,080
$ 666,600 $ - $ - $ - $ 666,600
December 31, 2015
Non-derivative financial liabilities
Accounts payable - $ 89,234 $ - $ - $ - $ 89,234
Payables to related parties - 242 - - - 242
Other payables - 302,438 - - - 302,438
Long-term loans 1.36% 7,692 23,077 23,077 96,154 150,000
$ 399,606 $ 23,077 $ 23,077 $ 96,154 $ 541,914
June 30, 2015
Non-derivative financial liabilities
Accounts payable - $ 50,494 $ - $ - $ - $ 50,494
Payables to related parties - 228 - - - 228
Dividends payable - 64,405 - - - 64,405
Other payables - 216,181 - - - 216,181 Long-term loans 1.50% 2,564 30,769 30,769 135,898 200,000
$ 333,872 $ 30,769 $ 30,769 $ 135,898 $ 531,308
- 29 -
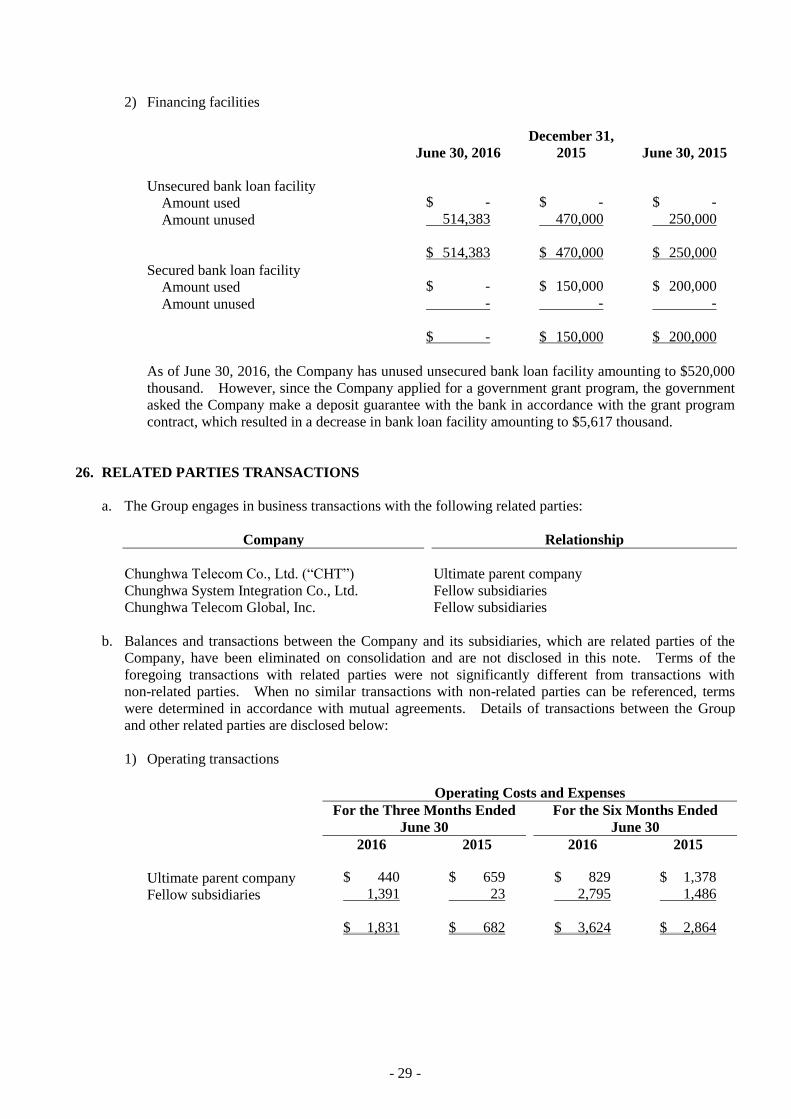
2) Financing facilities
June 30, 2016
December 31,
2015 June 30, 2015
Unsecured bank loan facility
Amount used $ - $ - $ -
Amount unused 514,383 470,000 250,000
$ 514,383 $ 470,000 $ 250,000
Secured bank loan facility
Amount used $ - $ 150,000 $ 200,000
Amount unused - - -
$ - $ 150,000 $ 200,000
As of June 30, 2016, the Company has unused unsecured bank loan facility amounting to $520,000
thousand. However, since the Company applied for a government grant program, the government
asked the Company make a deposit guarantee with the bank in accordance with the grant program
contract, which resulted in a decrease in bank loan facility amounting to $5,617 thousand.
26. RELATED PARTIES TRANSACTIONS
a. The Group engages in business transactions with the following related parties:
Company Relationship
Chunghwa Telecom Co., Ltd. (“CHT”) Ultimate parent company
Chunghwa System Integration Co., Ltd. Fellow subsidiaries
Chunghwa Telecom Global, Inc. Fellow subsidiaries
b. Balances and transactions between the Company and its subsidiaries, which are related parties of the
Company, have been eliminated on consolidation and are not disclosed in this note. Terms of the
foregoing transactions with related parties were not significantly different from transactions with
non-related parties. When no similar transactions with non-related parties can be referenced, terms
were determined in accordance with mutual agreements. Details of transactions between the Group
and other related parties are disclosed below:
1) Operating transactions
Operating Costs and Expenses
For the Three Months Ended
June 30
For the Six Months Ended
June 30
2016 2015 2016 2015
Ultimate parent company $ 440 $ 659 $ 829 $ 1,378
Fellow subsidiaries 1,391 23 2,795 1,486
$ 1,831 $ 682 $ 3,624 $ 2,864
- 30 -
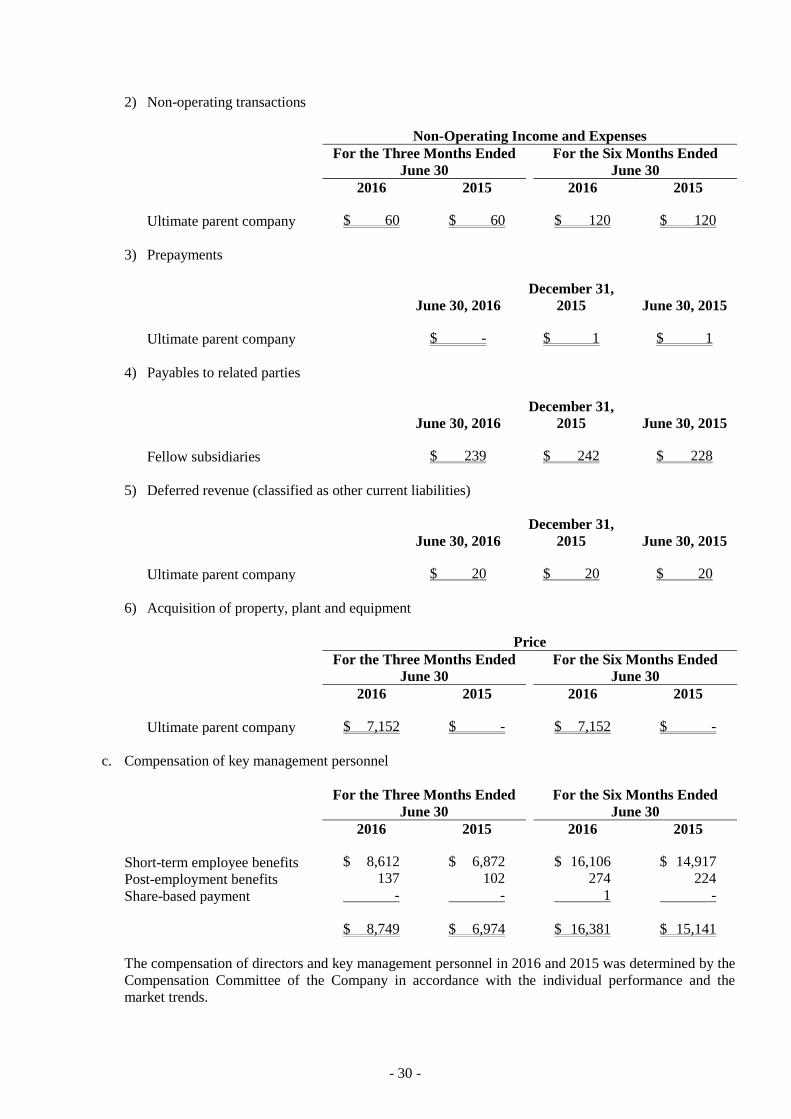
2) Non-operating transactions
Non-Operating Income and Expenses
For the Three Months Ended
June 30
For the Six Months Ended
June 30
2016 2015 2016 2015
Ultimate parent company $ 60 $ 60 $ 120 $ 120
3) Prepayments
June 30, 2016
December 31,
2015 June 30, 2015
Ultimate parent company $ - $ 1 $ 1
4) Payables to related parties
June 30, 2016
December 31,
2015 June 30, 2015
Fellow subsidiaries $ 239 $ 242 $ 228
5) Deferred revenue (classified as other current liabilities)
June 30, 2016
December 31,
2015 June 30, 2015
Ultimate parent company $ 20 $ 20 $ 20
6) Acquisition of property, plant and equipment
Price
For the Three Months Ended
June 30
For the Six Months Ended
June 30
2016 2015 2016 2015
Ultimate parent company $ 7,152 $ - $ 7,152 $ -
c. Compensation of key management personnel
For the Three Months Ended
June 30
For the Six Months Ended
June 30
2016 2015 2016 2015
Short-term employee benefits $ 8,612 $ 6,872 $ 16,106 $ 14,917
Post-employment benefits 137 102 274 224
Share-based payment - - 1 -
$ 8,749 $ 6,974 $ 16,381 $ 15,141
The compensation of directors and key management personnel in 2016 and 2015 was determined by the
Compensation Committee of the Company in accordance with the individual performance and the
market trends.
- 31 -
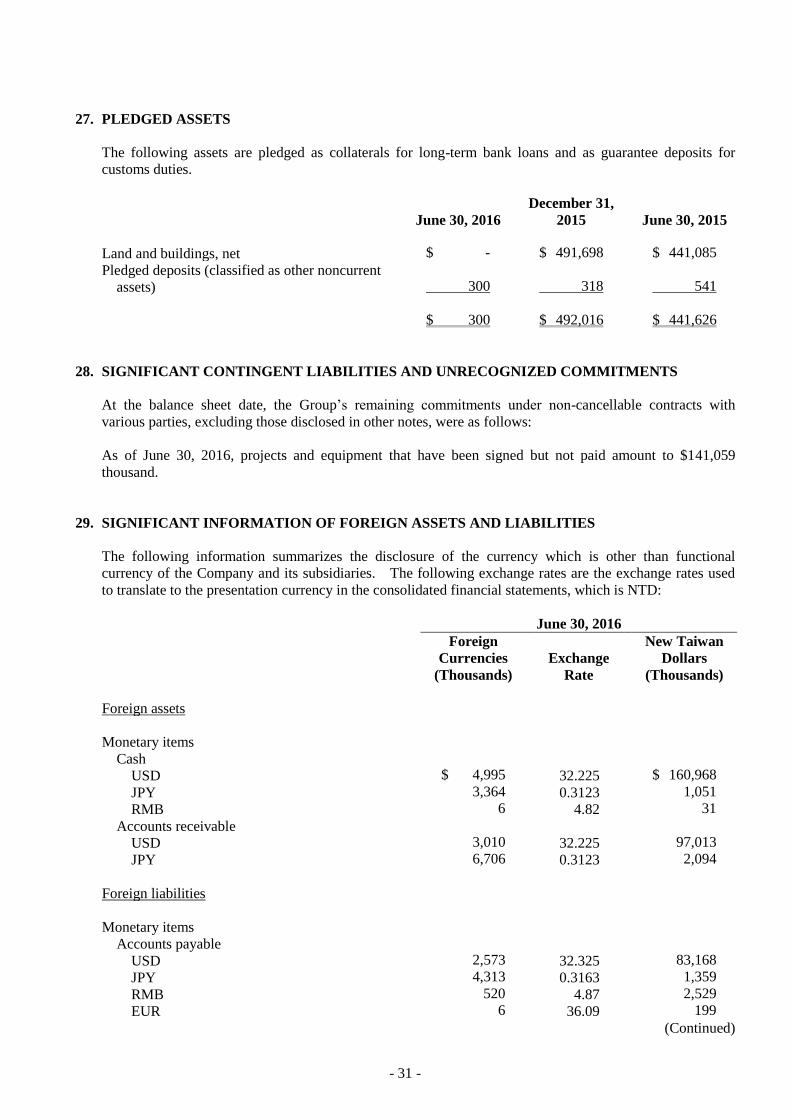
27. PLEDGED ASSETS
The following assets are pledged as collaterals for long-term bank loans and as guarantee deposits for
customs duties.
June 30, 2016
December 31,
2015 June 30, 2015
Land and buildings, net $ - $ 491,698 $ 441,085
Pledged deposits (classified as other noncurrent
assets) 300
318 541
$ 300 $ 492,016 $ 441,626
28. SIGNIFICANT CONTINGENT LIABILITIES AND UNRECOGNIZED COMMITMENTS
At the balance sheet date, the Group’s remaining commitments under non-cancellable contracts with
various parties, excluding those disclosed in other notes, were as follows:
As of June 30, 2016, projects and equipment that have been signed but not paid amount to $141,059
thousand.
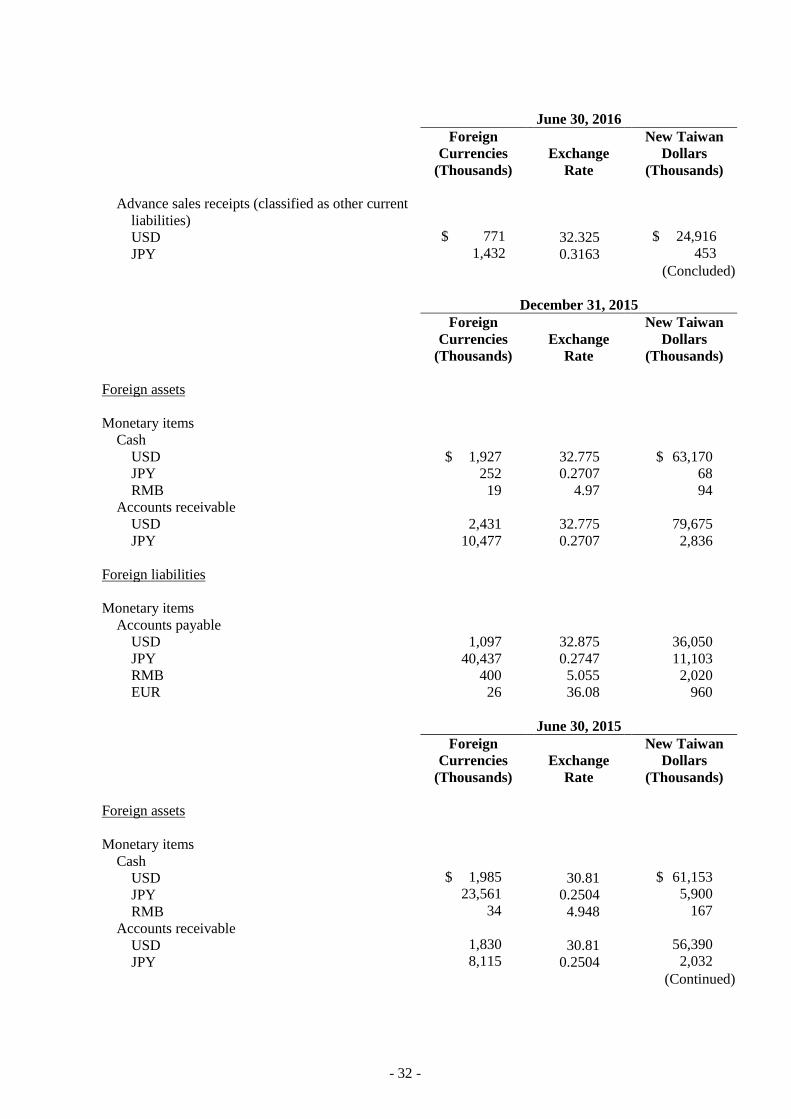
29. SIGNIFICANT INFORMATION OF FOREIGN ASSETS AND LIABILITIES
The following information summarizes the disclosure of the currency which is other than functional
currency of the Company and its subsidiaries. The following exchange rates are the exchange rates used
to translate to the presentation currency in the consolidated financial statements, which is NTD:
June 30, 2016
Foreign
Currencies
(Thousands)
Exchange
Rate
New Taiwan
Dollars
(Thousands)
Foreign assets
Monetary items
Cash
USD $ 4,995 32.225 $ 160,968
JPY 3,364 0.3123 1,051
RMB 6 4.82 31
Accounts receivable
USD 3,010 32.225 97,013
JPY 6,706 0.3123 2,094
Foreign liabilities
Monetary items
Accounts payable
USD 2,573 32.325 83,168
JPY 4,313 0.3163 1,359
RMB 520 4.87 2,529
EUR 6 36.09 199
(Continued)
- 32 -
June 30, 2016
Foreign
Currencies
(Thousands)
Exchange
Rate
New Taiwan
Dollars
(Thousands)
Advance sales receipts (classified as other current
liabilities)
USD $ 771 32.325 $ 24,916
JPY 1,432 0.3163 453
(Concluded)
December 31, 2015
Foreign
Currencies
(Thousands)
Exchange
Rate
New Taiwan
Dollars
(Thousands)
Foreign assets
Monetary items
Cash
USD $ 1,927 32.775 $ 63,170
JPY 252 0.2707 68
RMB 19 4.97 94
Accounts receivable
USD 2,431 32.775 79,675
JPY 10,477 0.2707 2,836
Foreign liabilities
Monetary items
Accounts payable
USD 1,097 32.875 36,050
JPY 40,437 0.2747 11,103
RMB 400 5.055 2,020
EUR 26 36.08 960
June 30, 2015
Foreign
Currencies
(Thousands)
Exchange
Rate
New Taiwan
Dollars
(Thousands)
Foreign assets
Monetary items
Cash
USD $ 1,985 30.81 $ 61,153
JPY 23,561 0.2504 5,900
RMB 34 4.948 167
Accounts receivable
USD 1,830 30.81 56,390
JPY 8,115 0.2504 2,032
(Continued)
- 33 -
June 30, 2015
Foreign
Currencies
(Thousands)
Exchange
Rate
New Taiwan
Dollars
(Thousands)
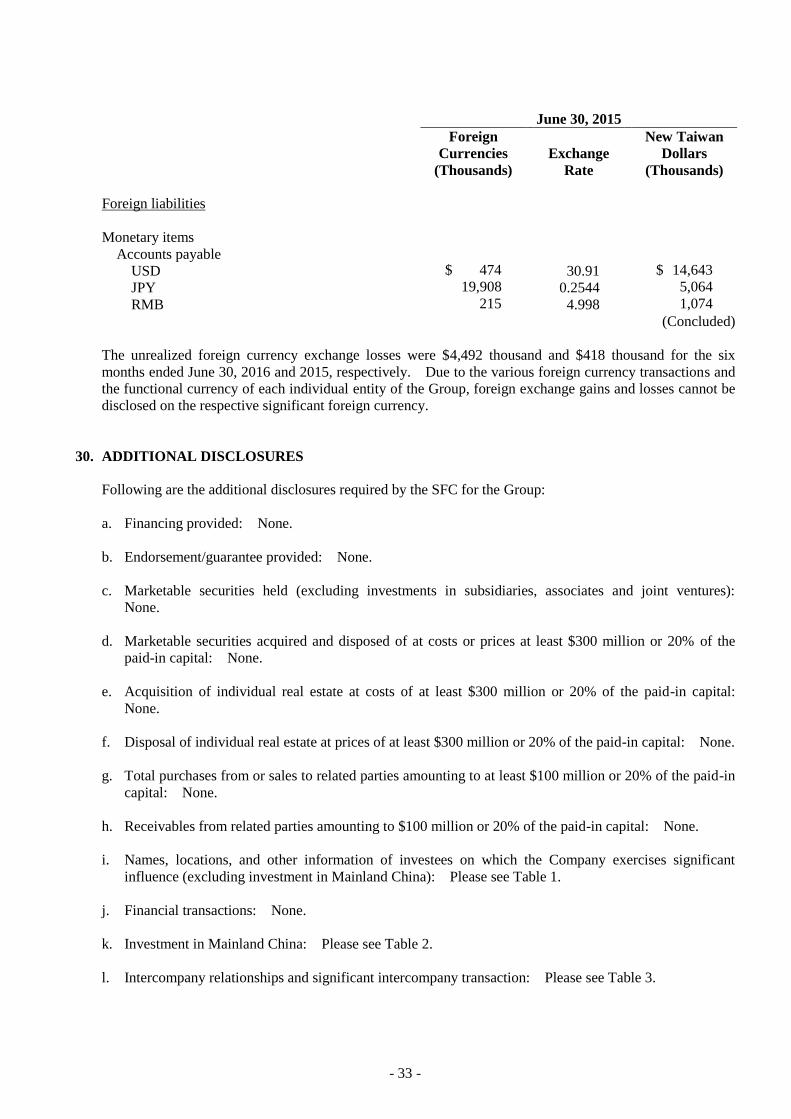
Foreign liabilities
Monetary items
Accounts payable
USD $ 474 30.91 $ 14,643
JPY 19,908 0.2544 5,064
RMB 215 4.998 1,074
(Concluded)
The unrealized foreign currency exchange losses were $4,492 thousand and $418 thousand for the six
months ended June 30, 2016 and 2015, respectively. Due to the various foreign currency transactions and
the functional currency of each individual entity of the Group, foreign exchange gains and losses cannot be
disclosed on the respective significant foreign currency.
30. ADDITIONAL DISCLOSURES
Following are the additional disclosures required by the SFC for the Group:
a. Financing provided: None.
b. Endorsement/guarantee provided: None.
c. Marketable securities held (excluding investments in subsidiaries, associates and joint ventures):
None.
d. Marketable securities acquired and disposed of at costs or prices at least $300 million or 20% of the
paid-in capital: None.
e. Acquisition of individual real estate at costs of at least $300 million or 20% of the paid-in capital:
None.
f. Disposal of individual real estate at prices of at least $300 million or 20% of the paid-in capital: None.
g. Total purchases from or sales to related parties amounting to at least $100 million or 20% of the paid-in
capital: None.
h. Receivables from related parties amounting to $100 million or 20% of the paid-in capital: None.
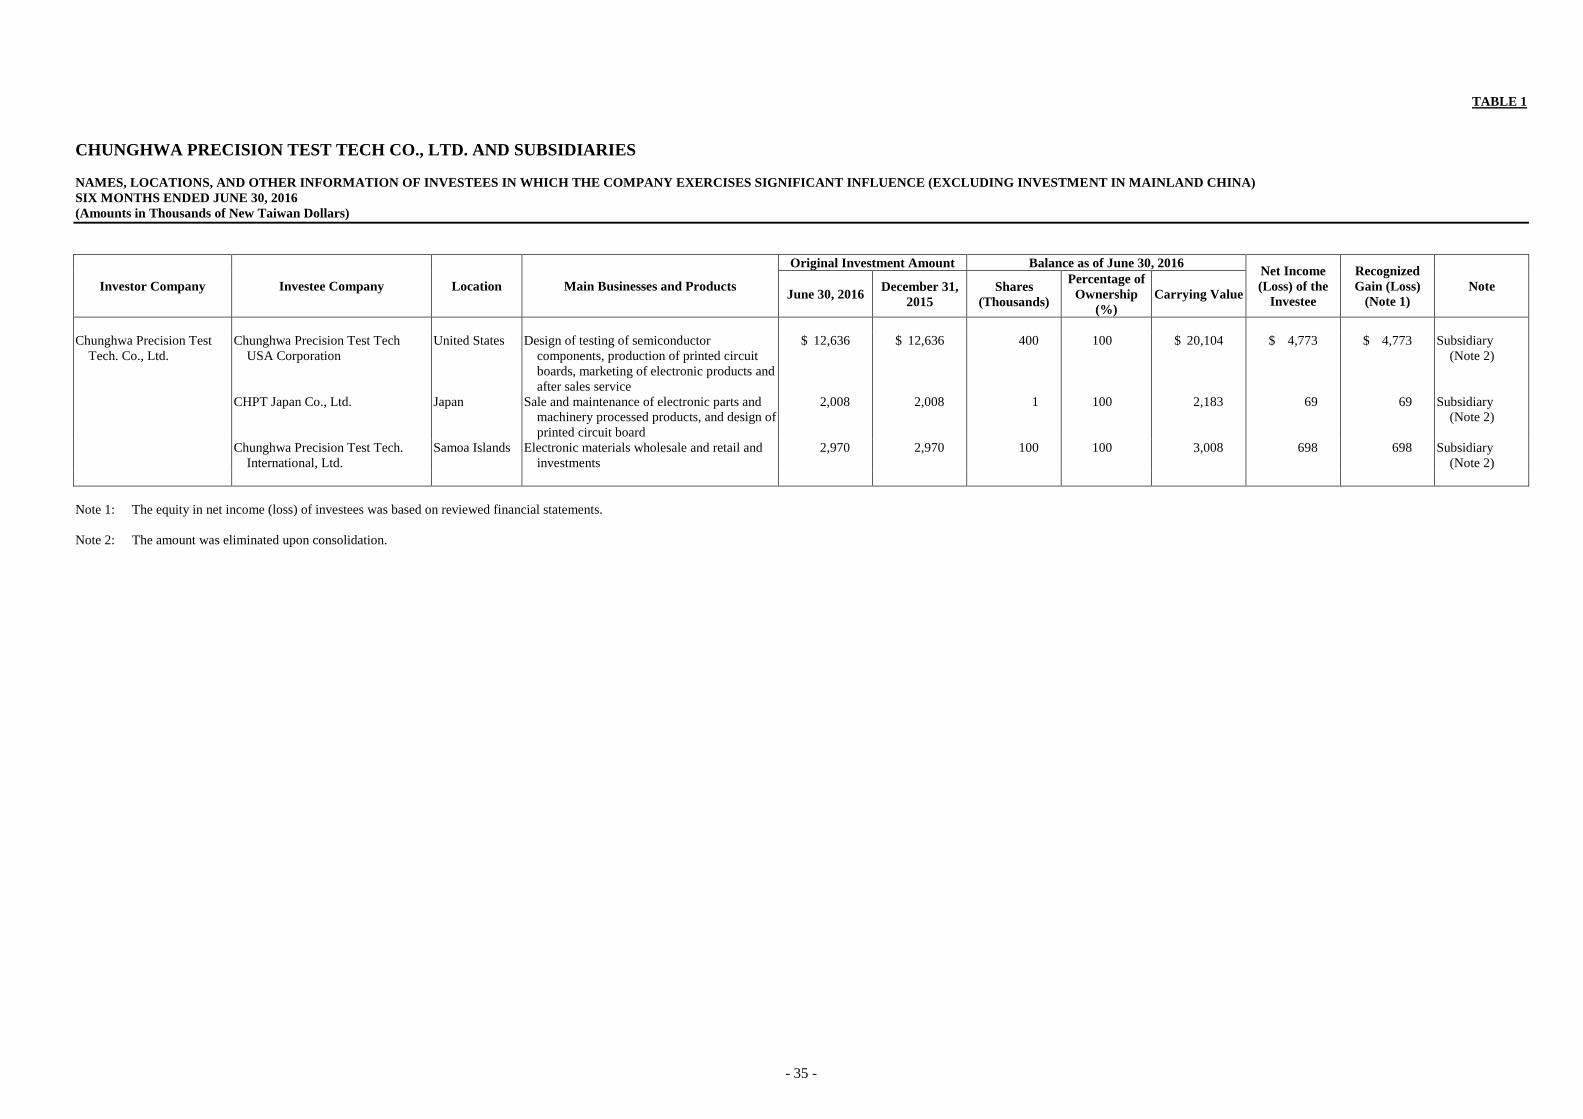
i. Names, locations, and other information of investees on which the Company exercises significant
influence (excluding investment in Mainland China): Please see Table 1.
j. Financial transactions: None.
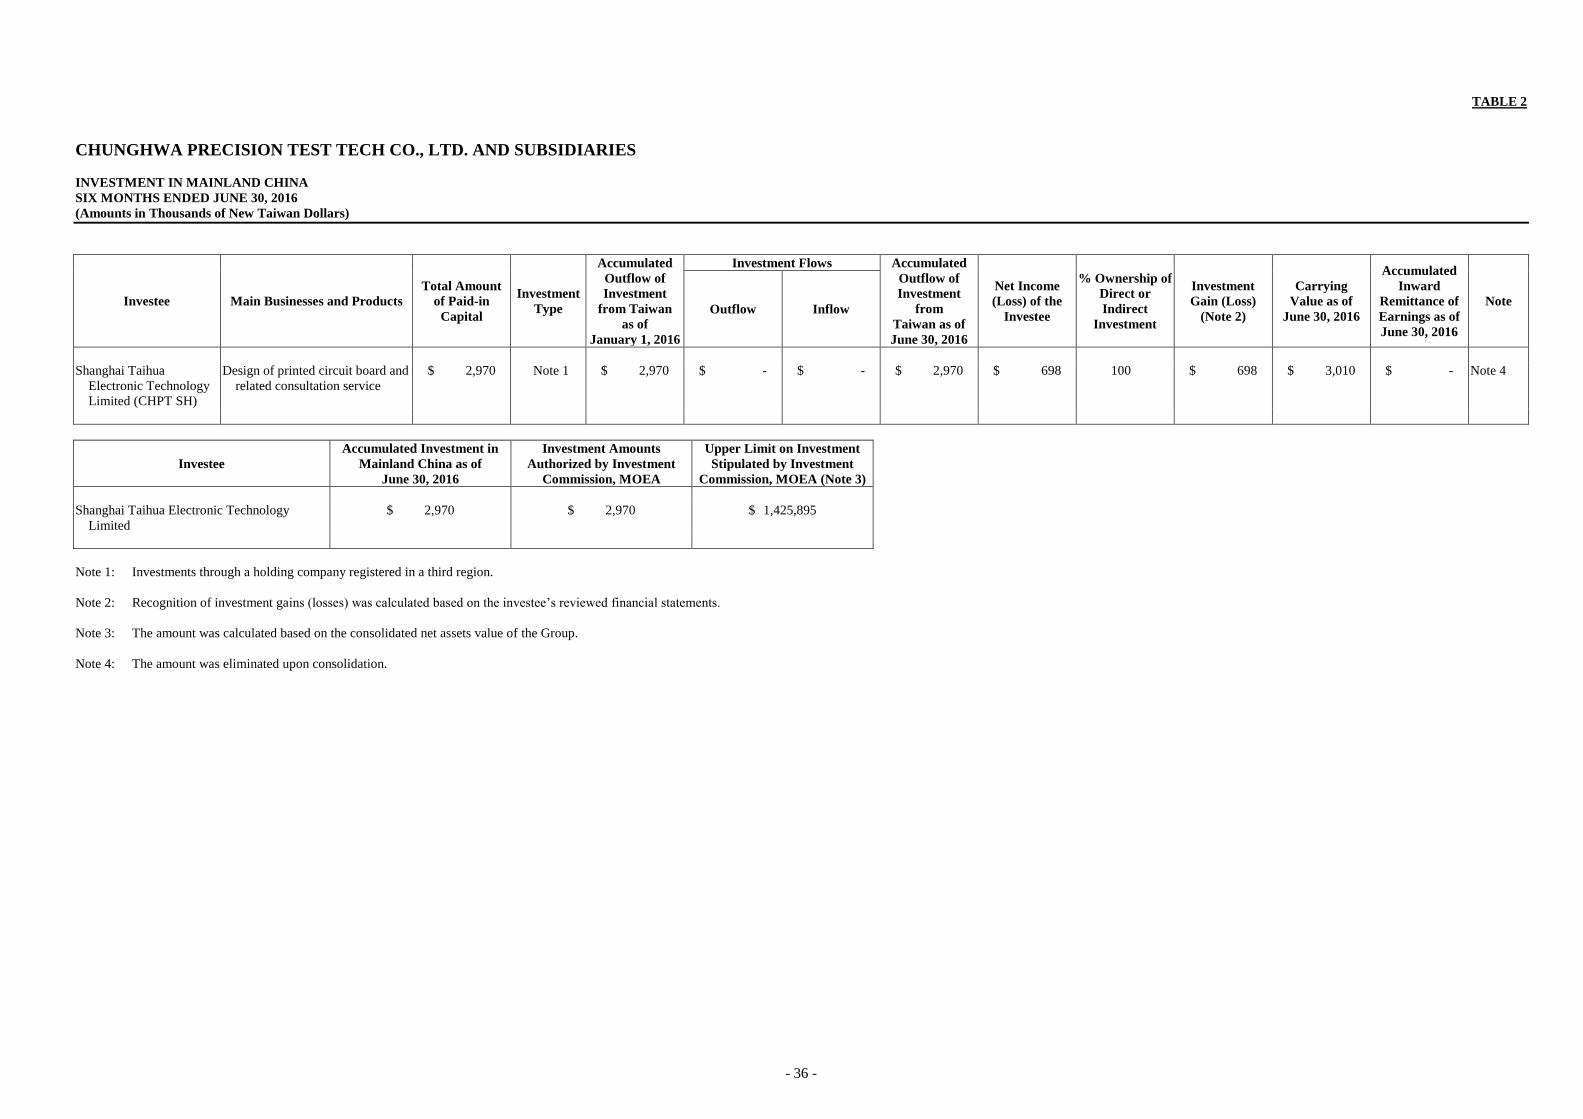
k. Investment in Mainland China: Please see Table 2.
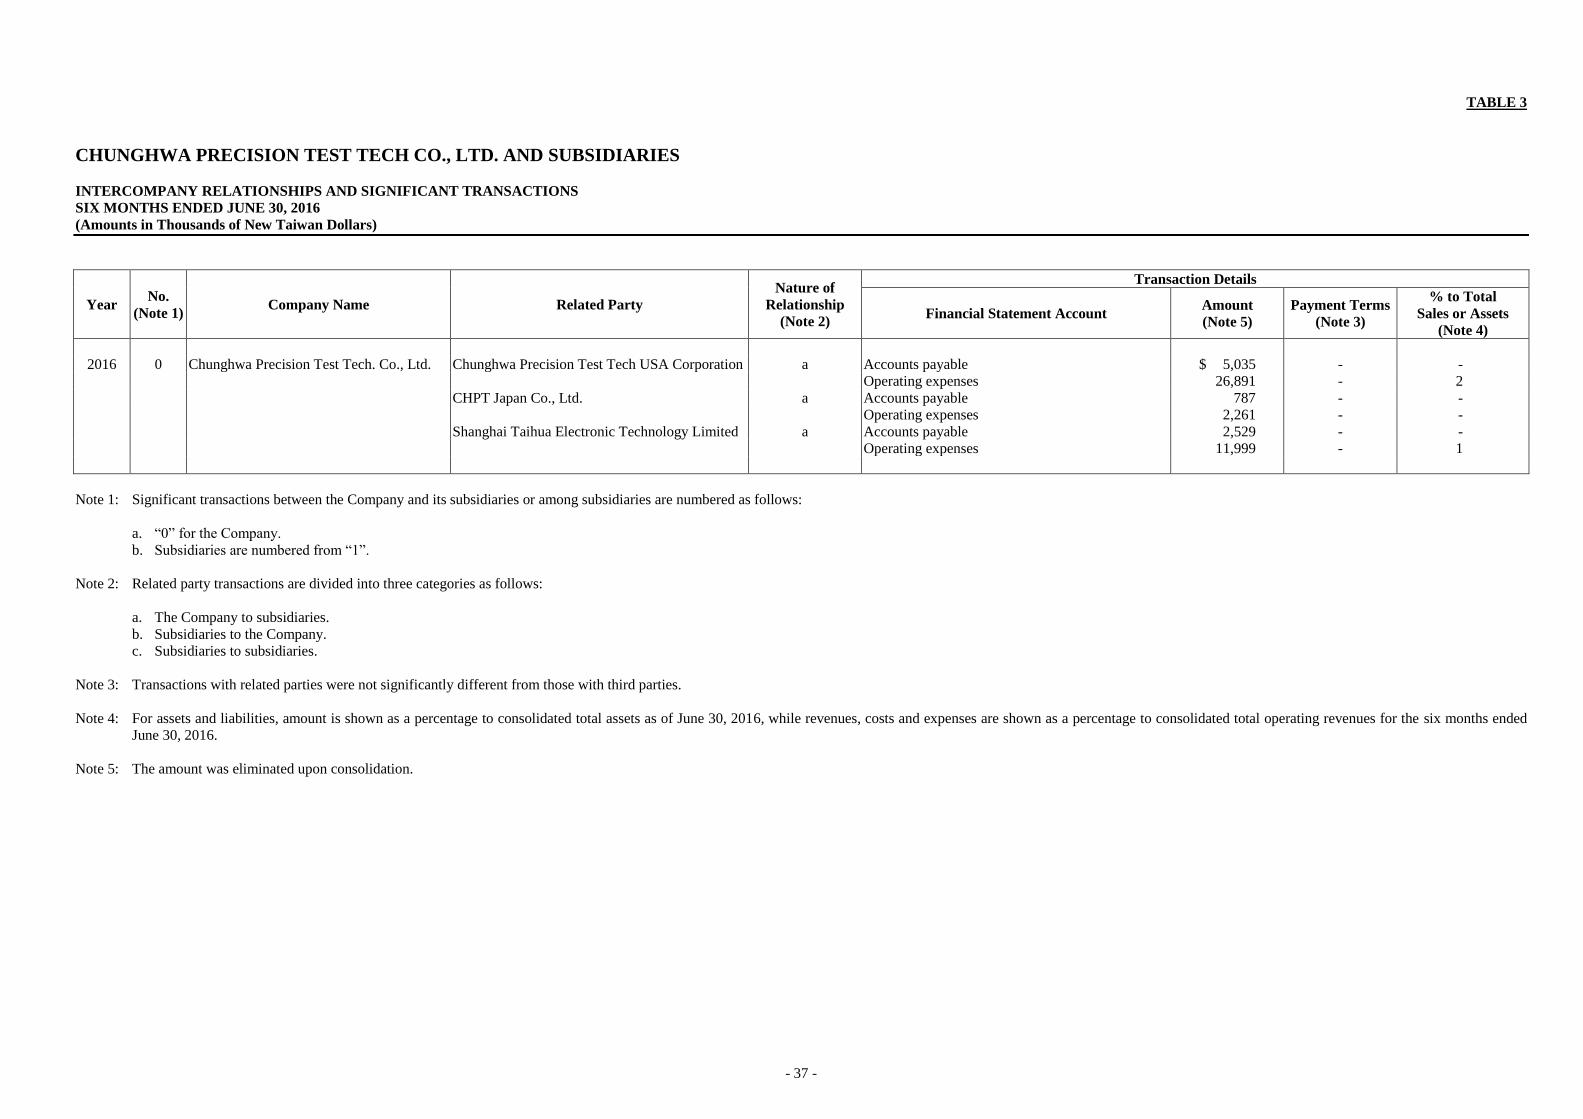
l. Intercompany relationships and significant intercompany transaction: Please see Table 3.

- 34 -
31. SEGMENT INFORMATION
Information reported to the chief operating decision maker for the purpose of resource allocation and
assessment of segment performance focuses on the types of goods or services delivered or provided.
Under the guideline of IFRS 8 “Operating Segments”, the Group’s measurement basis for operating
segment’s assets and liabilities are the same as the measurement basis for the financial statements.
- 35 -
TABLE 1
CHUNGHWA PRECISION TEST TECH CO., LTD. AND SUBSIDIARIES
NAMES, LOCATIONS, AND OTHER INFORMATION OF INVESTEES IN WHICH THE COMPANY EXERCISES SIGNIFICANT INFLUENCE (EXCLUDING INVESTMENT IN MAINLAND CHINA)
SIX MONTHS ENDED JUNE 30, 2016
(Amounts in Thousands of New Taiwan Dollars)
Investor Company Investee Company Location Main Businesses and Products
Original Investment Amount Balance as of June 30, 2016 Net Income
(Loss) of the
Investee
Recognized
Gain (Loss)
(Note 1)
Note June 30, 2016
December 31,
2015
Shares
(Thousands)
Percentage of
Ownership
(%)
Carrying Value
Chunghwa Precision Test
Tech. Co., Ltd.
Chunghwa Precision Test Tech
USA Corporation
United States Design of testing of semiconductor
components, production of printed circuit
boards, marketing of electronic products and
after sales service
$ 12,636 $ 12,636 400 100 $ 20,104 $ 4,773 $ 4,773 Subsidiary
(Note 2)
CHPT Japan Co., Ltd. Japan Sale and maintenance of electronic parts and
machinery processed products, and design of
printed circuit board
2,008 2,008 1 100 2,183 69 69 Subsidiary
(Note 2)
Chunghwa Precision Test Tech.
International, Ltd.
Samoa Islands Electronic materials wholesale and retail and
investments
2,970 2,970 100 100 3,008 698 698 Subsidiary
(Note 2)
Note 1: The equity in net income (loss) of investees was based on reviewed financial statements.
Note 2: The amount was eliminated upon consolidation.
- 36 -
TABLE 2
CHUNGHWA PRECISION TEST TECH CO., LTD. AND SUBSIDIARIES
INVESTMENT IN MAINLAND CHINA
SIX MONTHS ENDED JUNE 30, 2016
(Amounts in Thousands of New Taiwan Dollars)
Investee Main Businesses and Products
Total Amount
of Paid-in
Capital
Investment
Type
Accumulated
Outflow of
Investment
from Taiwan
as of
January 1, 2016
Investment Flows Accumulated
Outflow of
Investment
from
Taiwan as of
June 30, 2016
Net Income
(Loss) of the
Investee
% Ownership of
Direct or
Indirect
Investment
Investment
Gain (Loss)
(Note 2)
Carrying
Value as of
June 30, 2016
Accumulated
Inward
Remittance of
Earnings as of
June 30, 2016
Note Outflow Inflow
Shanghai Taihua
Electronic Technology
Limited (CHPT SH)
Design of printed circuit board and
related consultation service
$ 2,970 Note 1 $ 2,970 $ - $ - $ 2,970 $ 698 100 $ 698 $ 3,010 $ - Note 4
Investee
Accumulated Investment in
Mainland China as of
June 30, 2016
Investment Amounts
Authorized by Investment
Commission, MOEA
Upper Limit on Investment
Stipulated by Investment
Commission, MOEA (Note 3)
Shanghai Taihua Electronic Technology
Limited
$ 2,970 $ 2,970 $ 1,425,895
Note 1: Investments through a holding company registered in a third region.
Note 2: Recognition of investment gains (losses) was calculated based on the investee’s reviewed financial statements.
Note 3: The amount was calculated based on the consolidated net assets value of the Group.
Note 4: The amount was eliminated upon consolidation.
- 37 -
TABLE 3
CHUNGHWA PRECISION TEST TECH CO., LTD. AND SUBSIDIARIES
INTERCOMPANY RELATIONSHIPS AND SIGNIFICANT TRANSACTIONS
SIX MONTHS ENDED JUNE 30, 2016
(Amounts in Thousands of New Taiwan Dollars)
Year No.
(Note 1) Company Name Related Party
Nature of
Relationship
(Note 2)
Transaction Details
Financial Statement Account Amount
(Note 5)
Payment Terms
(Note 3)
% to Total
Sales or Assets
(Note 4)
2016 0 Chunghwa Precision Test Tech. Co., Ltd. Chunghwa Precision Test Tech USA Corporation a Accounts payable $ 5,035 - -
Operating expenses 26,891 - 2
CHPT Japan Co., Ltd. a Accounts payable 787 - -
Operating expenses 2,261 - -
Shanghai Taihua Electronic Technology Limited a Accounts payable 2,529 - -
Operating expenses 11,999 - 1
Note 1: Significant transactions between the Company and its subsidiaries or among subsidiaries are numbered as follows:
a. “0” for the Company.
b. Subsidiaries are numbered from “1”.
Note 2: Related party transactions are divided into three categories as follows:
a. The Company to subsidiaries.
b. Subsidiaries to the Company.
c. Subsidiaries to subsidiaries.
Note 3: Transactions with related parties were not significantly different from those with third parties.
Note 4: For assets and liabilities, amount is shown as a percentage to consolidated total assets as of June 30, 2016, while revenues, costs and expenses are shown as a percentage to consolidated total operating revenues for the six months ended
June 30, 2016.
Note 5: The amount was eliminated upon consolidation.