Characterization of Small DC Brushed and Brushless · PDF fileCharacterization of Small DC...
48
Characterization of Small DC Brushed and Brushless Motors by Aaron M. Harrington and Christopher Kroninger ARL-TR-6389 March 2013 Approved for public release; distribution is unlimited.
-
Upload
doankhuong -
Category
Documents
-
view
223 -
download
1
Transcript of Characterization of Small DC Brushed and Brushless · PDF fileCharacterization of Small DC...

Characterization of Small DC Brushed
and Brushless Motors
by Aaron M. Harrington and Christopher Kroninger
ARL-TR-6389 March 2013
Approved for public release; distribution is unlimited.

NOTICES
Disclaimers
The findings in this report are not to be construed as an official Department of the Army position unless
so designated by other authorized documents.
Citation of manufacturer’s or trade names does not constitute an official endorsement or approval of the
use thereof.
Destroy this report when it is no longer needed. Do not return it to the originator.

Army Research Laboratory Aberdeen Proving Ground, MD 21005-5066
ARL-TR-6389 March 2013
Characterization of Small DC Brushed
and Brushless Motors
Aaron M. Harrington and Christopher Kroninger
Vehicle Technology Directorate, ARL
Approved for public release; distribution is unlimited.

ii
REPORT DOCUMENTATION PAGE Form Approved OMB No. 0704-0188
Public reporting burden for this collection of information is estimated to average 1 hour per response, including the time for reviewing instructions, searching existing data sources, gathering and maintaining the data needed, and completing and reviewing the collection information. Send comments regarding this burden estimate or any other aspect of this collection of information, including suggestions for reducing the burden, to Department of Defense, Washington Headquarters Services, Directorate for Information Operations and Reports (0704-0188), 1215 Jefferson Davis Highway, Suite 1204, Arlington, VA 22202-4302. Respondents should be aware that notwithstanding any other provision of law, no person shall be subject to any penalty for failing to comply with a collection of information if it does not display a currently valid OMB control number.
PLEASE DO NOT RETURN YOUR FORM TO THE ABOVE ADDRESS.
1. REPORT DATE (DD-MM-YYYY)
March 2013
2. REPORT TYPE
Final
3. DATES COVERED (From - To)
October 2011–September 2012 4. TITLE AND SUBTITLE
Characterization of Small DC Brushed and Brushless Motors
5a. CONTRACT NUMBER
5b. GRANT NUMBER
5c. PROGRAM ELEMENT NUMBER
6. AUTHOR(S)
Aaron M. Harrington and Christopher Kroninger
5d. PROJECT NUMBER
5e. TASK NUMBER
5f. WORK UNIT NUMBER
7. PERFORMING ORGANIZATION NAME(S) AND ADDRESS(ES)
U.S. Army Research Laboratory
ATTN: RDRL-VTA
Aberdeen Proving Ground, MD 21005-5066
8. PERFORMING ORGANIZATION REPORT NUMBER
ARL-TR-6389
9. SPONSORING/MONITORING AGENCY NAME(S) AND ADDRESS(ES)
10. SPONSOR/MONITOR’S ACRONYM(S)
11. SPONSOR/MONITOR'S REPORT NUMBER(S)
12. DISTRIBUTION/AVAILABILITY STATEMENT
Approved for public release; distribution is unlimited.
13. SUPPLEMENTARY NOTES
14. ABSTRACT
Micro brushed and brushless motors of the size typically used on micro-ground vehicles and micro-air vehicles have been
found to have very low efficiencies. This lack of efficiency not only stems from low manufacturing tolerances, but is also
because motors at these scales are generally operated over a large range of loading conditions causing them to operate off
design point. This technical report: (1) provides a basis for a simple motor analysis, comparing analysis with actual motor test
data, (2) examines the efficiencies of many of the off-the-shelf brushed and brushless motors used in micro vehicle
applications, and (3) provides a methodology for proper motor selection, emphasizing the importance in ensuring motor loading
conditions are matched to the motor design in order to maximize power efficiency.
15. SUBJECT TERMS
brushless motor, brushed motor, efficiency, small
16. SECURITY CLASSIFICATION OF: 17. LIMITATION OF ABSTRACT
UU
18. NUMBER OF PAGES
46
19a. NAME OF RESPONSIBLE PERSON
Aaron M. Harrington a. REPORT
Unclassified
b. ABSTRACT
Unclassified
c. THIS PAGE
Unclassified
19b. TELEPHONE NUMBER (Include area code)
410-278-6779
Standard Form 298 (Rev. 8/98)
Prescribed by ANSI Std. Z39.18

iii
Contents
List of Figures iv
1. Introduction 1
1.1 Motor Theory ..................................................................................................................2
2. Experimental Setup 6
3. Brushed Motors 7
3.1 Design and Operation ......................................................................................................7
3.2 Performance Characteristics ............................................................................................9
4. Brushless DC Motors 11
4.1 Design and Operation ....................................................................................................11
4.2 Brushless Speed Control ................................................................................................12
4.3 Performance Characteristics ..........................................................................................13
5. Brushless Speed Controller Efficiency 16
6. Motor Applications for Propulsion Systems 19
6.1 Understanding the Power Requirements .......................................................................19
7. Conclusions and Future Work 22
8. References 23
Appendix. Brushed and Brushless Motor Data 25
Bibliography 37
List of Symbols, Abbreviations, and Acronyms 39
Distribution List 40

iv
List of Figures
Figure 1. Maximum efficiency vs. mass for a representative sample of motors. ............................1
Figure 2. (a) Torque vs. RPM and (b) current vs. torque comparing theory and experiment for an AP03-7000 brushless motor. .................................................................................................3
Figure 3. Measured power out vs. torque for an AP03-7000 brushless motor. ...............................4
Figure 4. (a) Efficiency vs. RPM and (b) efficiency vs. power out showing the comparison between theory (red) and experiment (blue) for an AP03-7000 brushless motor. .....................5
Figure 5. Diagram of a DC brushed motor. ....................................................................................8
Figure 6. Torque vs. RPM for a SS7-1.7-1 brushed motor. ............................................................9
Figure 7. Efficiency vs. motor power output for SS7-1.7-1 brushed motor. ................................10
Figure 8. Efficiency vs. RPM for SS7-1.7-1 brushed motor. ........................................................10
Figure 9. Diagram of a DC brushless motor. ................................................................................11
Figure 10. Phased current input and back EMF signals for a brushless motor. ............................13
Figure 11. Torque vs. RPM at various voltages, 100% throttle for an A05-3700 brushless motor. .......................................................................................................................................14
Figure 12. Torque vs. RPM at various throttle settings at 6 V input for an A05-3700 brushless motor. .......................................................................................................................................14
Figure 13. Efficiency vs. power out for A05-3700 at (a) 100% throttle and varying voltage and (b) constant voltage and varying throttle. ..........................................................................15
Figure 14. Maximum achievable efficiency vs. power out for various brushless motors. ............15
Figure 15. Efficiency vs. RPM with lines of constant torque for varying throttle at 6-V input voltage. .....................................................................................................................................16
Figure 16. Comparison of efficiency values for an ADH30S-6100 brushless motor with a Castle Creations Phoenix 6 speed controller. ..........................................................................17
Figure 17. Comparison of efficiency values for an AP03-7000 brushless motor with a Castle Creations Phoenix 6 speed controller. ......................................................................................18
Figure 18. Motor efficiency with size showing effect of speed controller efficiency. ..................18
Figure 19. Torque vs. RPM curves plotted for an example motor with rotor data overlaid. .........19
Figure 20. AP03-7500 KV efficiency vs. RPM chart with lines of constant torque. ....................20
Figure 21. AP03-4000 KV efficiency vs. RPM chart with lines of constant torque. ....................21
Figure 22. A05-2900 KV efficiency vs. RPM chart with lines of constant torque. ......................21
Figure A-1. MK04-10-1 (0.66 g). .................................................................................................26
Figure A-2. MK04S-10-1 (0.46 g). ...............................................................................................26
Figure A-3. MK06-4.5-1 (1.32 g). ................................................................................................27

v
Figure A-4. MK06-10-1 (1.32 g). .................................................................................................27
Figure A-5. MK06-30-1 (1.32 g). .................................................................................................28
Figure A-6. SS7-1.1-1 ...................................................................................................................28
Figure A-7. SS7-1.7-1. ..................................................................................................................29
Figure A-8. SS7-2.3-1. ..................................................................................................................29
Figure A-9. SS7-3.3-1. ..................................................................................................................30
Figure A-10. Stan-1. .....................................................................................................................30
Figure A-11. VAMP-1. .................................................................................................................31
Figure A-12. A05-2900 (4.1 g). ....................................................................................................32
Figure A-13. A05-3700 (4.2 g). ....................................................................................................32
Figure A-14. ADH30S-6100 (3.3 g). ............................................................................................33
Figure A-15. ADH30S-7500 (3 g). ...............................................................................................33
Figure A-16. AP02-7000 (2.4 g). ..................................................................................................34
Figure A-17. AP03-4000 (3.3 g). ..................................................................................................34
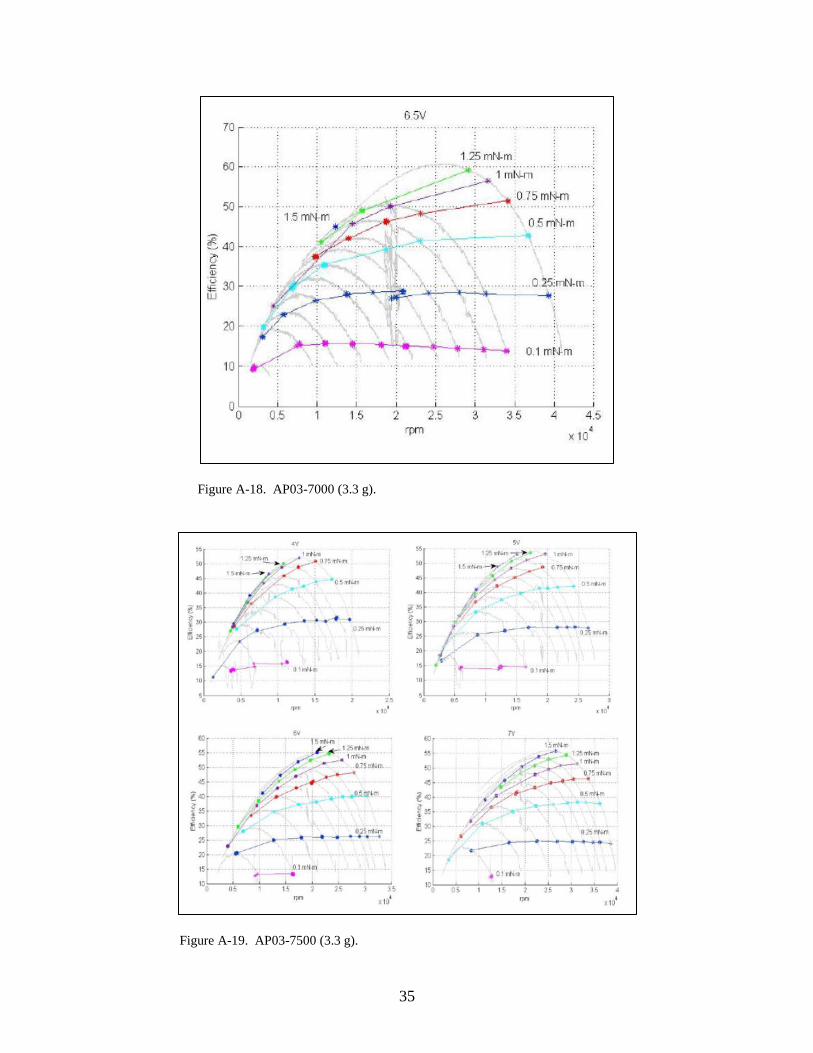
Figure A-18. AP03-7000 (3.3 g). ..................................................................................................35
Figure A-19. AP03-7500 (3.3 g). ..................................................................................................35

vi
INTENTIONALLY LEFT BLANK.

1
1. Introduction
With the ever increasing popularity of mobile robotic platforms in the form of unmanned aerial
vehicles (UAVs) and unmanned ground vehicles (UGVs), there is the desire to decrease their
size, weight, power, and cost. At larger scales (larger than 6 × 6 × 6 in volume), these vehicles
use a wide variety of actuators that include, but are not limited to, servos, linear actuators, and
brushed and brushless motors. As the size of these vehicles decrease, the size and complexity of
servos and linear actuators prohibits their use and most vehicles only use brushed and brushless
motors. Motors applied at the vehicle scale of interest suffer from low efficiency relative to
larger motors. Motors of 100s of grams, for example, can achieve efficiencies greater than 85%
(1). As the size of motors is reduced, so is their maximum operating efficiency. Figure 1 shows
a representative sample of brushed and brushless motors commonly used for robotic
applications, ranging from 0.46 to 151 grams (g). As size decreases, efficiency quickly drops.
As the need for actuation in robotics spans this range of scale, it is important for users to
understand the impact of scale on their system efficiency.
Figure 1. Maximum efficiency vs. mass for a representative sample of motors.
When considering motor selection as a designer, the specifics about efficiency and power output
over the entire envelope of torque and RPM are desired. Many commercial off-the-shelf
(COTS) motors at this scale are manufactured for hobbyists and do not include extensive data
sheets, and many do not have performance information at all. Most motors only come with
information on general characteristics such as their size, weight, operating voltage and current,

2
and “KV” rating. The KV rating is generally the user’s only indication of motor performance
and is an incomplete performance metric that describes the no-load rotation rate per the input
voltage. Experiments described in this report have shown that these values do not correlate to
actual operational performance under load, and thus, it is difficult for the user to properly choose
the best motor for a particular application. Efficiency is a more straight forward metric and is
generally only provided by the manufacturers of motors greater than 4.2 g. These values are
only given at a single operating point, and the revolutions per minute (RPM) and torque for this
operating condition are generally not provided.
This technical report provides an understanding of motor design and operation, and is a guide to
motor selection and implementation for robotics applications. This report includes an
introduction to basic brushed and brushless motor design and their operation. Brushed and
brushless motor operation under load is examined and the relation of efficiency against torque,
RPM, voltage, and throttle setting (for brushless motors) is presented. This technical report also
provides detailed information that is not provided by the manufacturers for a selection of the
most widely used small motors, that include 12 brushed direct current (DC) motors and 8
brushless motors—provided in the appendix. The characteristic size of the motors in this study
have a diameter of 15 millimeters (mm) or less and weigh <5 g.
1.1 Motor Theory
The purpose of motors is to convert electrical power to mechanical power in the form of rotary
motion. This electromechanical system is characterized by a few specific parameters that, if
known, can help one predict the performance of the motor in a system. These parameters include
the no-load and stall speed, torque, current, and voltages, as well as the power factor, and can be
obtained using a power analyzer and a dynamometer. No load describes the free rotor speed of
the motor when there is no torque applied. Similarly, stall describes the motor’s point of
maximum torque where RPM, by definition, is zero. These two extremes are not realized in
practice but are not necessary as the motor would not be operated at these conditions in a
practical application. The following is an example analytic model based on theoretical motor
performance, developed for a DC brushless motor based on the values obtained through
measurement on a micro dynamometer.
These previously mentioned parameters must be measured in order to predict the performance of
a DC motor. However, most of these values cannot be measured directly as they cannot be
achieved and must be extrapolated from attainable experimental data. Each of the three
parameters, RPM, voltage, and current, have a linear relationship with torque and therefore, three
important relationships can be derived—the motor’s torque-RPM slope, the torque-current slope,
as shown in figure 2, and the torque-voltage slope, which is also linear (not shown).

3
Figure 2. (a) Torque vs. RPM and (b) current vs. torque comparing theory and experiment for an AP03-7000
brushless motor.
The final value, known as the power factor, relates the apparent power vs. the active power of
the motor. This active power is the actual power delivered to the motor that it uses to create a
torque at a specific RPM and the apparent power is the mean voltage times mean current. Thus,
the ratio of active power to apparent power is called the power factor (λ). This power factor
accounts for voltage and current signals that are not necessarily in phase with each other, and
therefore, the power input is not simply the product of the mean current and voltage. The current
will either lead or lag the voltage by a phase angle with the relationship ϕ=cos–1
(λ) and
corresponds to the reactive portion of the impedance in the motor. Thus, a positive phase angle
would indicate a strong inductive load on the motor. The output power of the motor is measured
as the product of the torque and RPM. The relationship between output power and torque is
shown in figure 3 with the theoretical curve forming a parabola, the product of the linear
relationship displayed in figure 2. The motor’s inability to achieve stall and no load is evident.
Actual motor performance deviates though not significantly.

4
Figure 3. Measured power out vs. torque for an AP03-7000
brushless motor.
In order to calculate the salient characteristics of the motor, the voltage and current across each
phase of the motor is measured, which is generally given as an RMS value. The voltage is an
RMS value measured at the output of the speed controller and not the applied voltage, which
would be the input to the speed controller. The voltage (V) and current (I) sum of the motor is
then determined as the average of the three voltages and currents measured across each motor’s
winding phase as shown in equations 1 and 2.
. (1)
. (2)
Because the three waveforms are 120° apart from one another, the apparent power of the motor
(S) is given as the relationship of the average of each winding phase’s power with a
multiplication factor to account for when two waveforms overlap, which occurs every 60°.
. (3)
In general, the voltage and current sum of the motor can be measured, but the voltages and
currents across each individual winding phase may not be known. In this case, it can be
assumed that each winding phase will have similar values of voltage and current because of the
inherent symmetry in the motor; therefore, the voltage and current sums, which are just the
average of these three values, are also similar. This simplifies the equation for apparent power.
. (4)
. (5)

5
. (6)
. (7)
From the derivation of the apparent power, the power factor can be applied and the active power
can be determined. In practicality, it might be difficult to measure or obtain a value for the
power factor without a power analyzer or oscilloscope capable of also measuring current.
. (8)
The motor’s output power is then just the product of the torque ( τ) and RPM (ω). It is important
to note that for brushed motors, since there is only one winding phase, the load on a brushed
motor does not fluctuate with rotation, and the power is simply the product of voltage and
current. By dividing the output power by the input power, an estimate of the motor’s efficiency
(η) can be obtained.
. (9)
. (10)
One might expect power factor to change with RPM as the impedance of the motor is changing,
but for the purposes of analysis, power factor can be assumed constant as the actual change in
power factor with RPM is very small. A comparison of the motor theory with experiment for
efficiency vs. RPM and output power are shown in figure 4.
Figure 4. (a) Efficiency vs. RPM and (b) efficiency vs. power out showing the comparison between theory (red)
and experiment (blue) for an AP03-7000 brushless motor.

6
Here it can be seen that the efficiency vs. output power forms a loop. This is due to the same
output power being achieved at two pairs of torque and RPM occurring on either side of the
peak power torque and RPM. These two sides of the loop are the stall side and no-load side.
The stall side of the motor is the high torque and low RPM combination that corresponds to
the lower efficiency, whereas, the low torque and high RPM or no-load side will have a higher
efficiency for the same output power. For example, 2.6 millinewton-meters (mN-m) of torque
at 10,000 RPM would be the same output power as 1 mN-m at 26,000 RPM, but the efficiency
values are different, 39% and 51%, respectively. It is also interesting to note that in the
experiment, the motor does not fully come back to zero power for reasons discussed earlier.
This may be a characteristic of the speed controller not being able to properly regulate the
speed of the motor when it is under a high loading condition and, therefore, the motor stalls.
Although the theory requires measured values as input variables, it shows good agreement
with the experiment. The theory allows extrapolation of performance characteristics near the
stall and no-load boundaries where the actual motors cannot be operated. Despite this limitation,
motors are not typically operated very near to a stall or no-load condition.
2. Experimental Setup
In order to characterize the brushed and brushless motors, precise measurement of the torque,
RPM, voltage, and current must be obtained simultaneously. To measure the torque and RPM, a
Magtrol MicroDyne hysteresis dynamometer was used. The dynamometer is specifically
designed for small motors and uses a magnetic brake to apply a torque load to the motor of up to
4 mN-m and allows rotational speeds up to 100,000 RPM. To obtain a power curve, a motor is
installed into the dynamometer and the shafts connected. The motor is set at a specific input
voltage and, for brushless motors, the input power is regulated by a speed controller. The no-load
speed and torque are then recorded. Although no load is applied, there is a relatively small torque
required to spin the rotor casing and optical encoder needed to measure the speed. Once the RPM
reaches a steady state no-load speed, a magnetic brake is applied and the load on the motor is
progressively increased, thus increasing the torque and decreasing the RPM of the motor. Once
the RPM reaches a preset minimum value (to prevent the motor from stalling), the brake slowly
releases the load on the motor until it had reached its free speed again. This ramp up/down
method then allowed the dynamometer software to average the effects of hysteresis from
dynamic loading during the two loading phases caused by angular acceleration on the motor. The
load due to angular acceleration is seen when applying a load to the motor; the inertia of the rotor
applies a slight resistive force countering the speed decrease. The opposite occurs when the
resistive force is released and the rotor speed appears to “lag” behind as the rotor RPM increases.

7
Thus, a slight hysteresis is seen between the two loading phases. The magnitude of this
hysteresis can be reduced by applying and releasing the braking force more slowly; however, the
tests can become impractically long and running the motors under load for an extended period of
time will cause them to heat up.
Measuring the voltage and current input to the brushed motors is straight forward as there is only
a DC current. However, the brushless motors are driven by a three-phase power circuit from a
motor controller and measuring the voltage and current requires relatively unique equipment. A
Yokogawa WT-3000 precision three-phase power analyzer was used to measure the power from
the speed controller going into the brushless motor. The power analyzer is an in-line pass through
device that independently measures the voltage and current for up to three phases. The product of
the voltage and current is the power for each phase at any instance, and the overall power going
into the motor is the sum of the three phases as previously described. To regulate the power
going into the speed controller a BK Precision programmable power supply was used and the
current was limited to 2-A input in order to prevent the motors from drawing too much current
and burning out.
The dynamometer has the ability to measure rotational speeds as high as 100,000 RPM and
torques up to 4 mN-m with a torque measurement resolution better than 0.04 mN-m and a
rotation rate measurement accuracy of 0.02% of the reading. The power analyzer’s power
measurement accuracy is 0.02% of full scale. Calibration of the power analyzer is performed
internally. Known masses are hung at a prescribed moment arm to calibrate the dynamometer’s
integrated torque cell.
3. Brushed Motors
As already alluded to, there are two main classes of motors—brushed and brushless. Brushed
motors use an internal electrical commutator (brushes) that reverse the polarity of the active wire
coils as they pass magnets of a fixed polarity. Therefore, the electronics are contained in the
rotor. Speed is simply controlled via DC voltage change, which is a great advantage relative to
brushless motors that require a three-phase speed controller. Another advantage to brushed
motors is that they have a low cost of construction. Furthermore, they can easily be made very
small (<1 g).
3.1 Design and Operation
There are three main parts that can be found in any brushed motor—the stator, rotor, and
commutator/brushes. The general construction of a brushed motor is illustrated in figure 5. The
stator portion of the motor contains the permanent magnets. In larger brushed motors, the stator
portion might have shunt, series, or compound coil wound stators. However, in small brushed
motors permanent magnets are used because it is difficult to retain a high-strength magnetic field

8
with coils. This, coupled with the availability of high-field permanent magnets (e.g., neodymium
magnets) has made permanent magnet stators the preferred choice for small motors (2). These
magnets are arranged in polar pairs of alternating north-south configuration. Thus, there must
always be an even number of magnets in any brushed motor with half having their south pole
facing inward and the other half with an inward facing north pole. The rotor contains an armature
wound with copper coils. When energized, one-half of the armature will have an electrically
induced magnetic north pole that will attract to the south poled permanent magnet while the
southern pole of the armature will attract to the north poled permanent magnet. This will cause
the armature and connected axle to rotate toward equilibrium. As the armature approaches its
magnetic equilibrium position, the wire coils’ magnetic polarity is reversed via the electrical
commutator and the rotor’s inertia will carry it through toward a new equilibrium position.
Figure 5. Diagram of a DC brushed motor (3).
There are, however, disadvantages to the brushed motor design that are primarily related to the
use of brushes and commutator within the motor. Brushes will experience wear over time and
eventually either the brushes or entire motor will need to be replaced (4). In addition to heat
generated by the current flowing through the coils, brush arcing augments heat production. Not
only does this brush arcing create heat, but it generates a high amount of electrical noise and
electromagnetic interference (EMI). This can cause major problems for robotic applications that
require radio communications or have sensitive electronic sensors on board as the electrical and
EMI noise can interfere with both. Lastly, the contact friction associated with the brushes
introduces motor torque load. This inefficiency grows with motor RPM, and the maximum
angular velocity of the motor is limited by the increased friction of the brushes and commutator.
Despite their disadvantages, brushed motors continue to be popular for UAV and UGV robotics
applications.

9
3.2 Performance Characteristics
Brushed motors generally have a characteristically linear torque vs. RPM curve ideally with
constant slope across all input voltages. Input voltage is the primary method for throttling the
motor. An example torque and RPM curve for a brushed motor is shown in figure 6. Each line
shows a motor input voltage with the lower right hand side representing the motor’s “no-load”
speed and the upper left hand side representing torque at max current draw. The jagged portion of
the curves near zero RPM occurs as the motor approaches its stall torque. The no-load speed on
these plots represents a non-braked value where the motor is only turning an optical shaft encoder
and its own rotor and shaft, thus, torque is not truly zero. Some of this no-load torque also comes
from the brushes inside the motor as the friction of the brushes and commutator increases with
increasing speed. The limiting factor for these motors in terms of the attainable torque and RPM
relates to the input power because only so much current can be pushed through the coils before
the insulation burns off the wires and the coils short circuit. This is true of brushless motors as
well.
Figure 6. Torque vs. RPM for a SS7-1.7-1 brushed motor.
Figure 7 shows that as voltage increases the resulting output power increases. The overall power
and efficiency of the motor, at a given voltage input, varies with position on the torque/RPM
curve. The maximum efficiency does not occur at maximum power. The maximum power
occurs at a low RPM, higher torque condition than the maximum efficiency.

10
Figure 7. Efficiency vs. motor power output for SS7-1.7-1 brushed motor.
It is interesting to note that for brushed motors, near-peak efficiency occurs only over a very
small range of RPM and then drops rather significantly at lower rotational rates shown in figure 8.
These lower RPM values correspond to increasing values of torque. For direct drive applications,
this suggests that brushed motors would be a good choice for use in high speed, low torque
applications. This also suggests the system efficiency will suffer for operation off the design
point. Of course an appropriate transmission can allow efficient motor operation while achieving
a different desired torque and RPM combination for the required application.
Figure 8. Efficiency vs. RPM for SS7-1.7-1 brushed motor.

11
4. Brushless DC Motors
The other main class of motors that are fast becoming the preferred choice among robotics
designers is the DC brushless motor. These motors eliminate the need for a commutator and
brushes and the electronic portion of the motor is now contained in the stator. This results in
different advantages and disadvantages for brushless motors. Efficiency can be increased
because there is no longer a voltage drop across the brushes and during commutation. Due to no
brushes being present, internal friction is reduced and higher speeds can be attained. Lower
electrical noise and reduced EMI are also added benefits. However, brushless motors are not
without their disadvantages. The main disadvantage is the higher cost of control because a
separate speed controller with much more complex electronics is needed. These speed controllers
can often be as heavy and expensive as the motors themselves, which can be prohibitive for
micro-air vehicle applications where weight is at a premium. They are also a secondary source of
inefficiency that will be discussed later on in this report.
4.1 Design and Operation
Unlike brushed motors, brushless designs cannot simply be controlled via a DC voltage input.
Due to lack of brushes, a circuit must control polarity switching. As with the brushed, there is a
rotor and stator. However, the rotor, in this case, contains the permanent magnets and the stator
the electromagnetic coils.
Figure 9. Diagram of a DC brushless motor (3).
For a three-phase design, the number of stators must always be multiples of three (5). To prevent
achieving magnetic equilibrium, which would result in a motor that would not self-start, there are
an even number of poles (permanent magnets) that cannot be a multiple of the number of stators.
Further increasing the complexity is that there are a variety of winding styles. Two main circuits
exist—the delta and star (wye) winding. The wye style generally provides higher torques and is
easier to manufacture (5). This ease of manufacture is especially important for motors at this
scale because most are hand wound and assembled unlike large motors that are precision wound
by machines.

12
4.2 Brushless Speed Control
Due to their lack of commutator, brushless motors require dedicated speed control electronics.
These speed controllers take a DC power source input as well as a pulse width modulated (PWM)
signal and in turn, electrically phase the voltage and current going to each winding phase of the
motor accordingly to regulate speed. A brushless motor operates through the application of a
voltage over two of the three phases of the motor at any given time. This causes the stators
associated with that phase to create an electric field. The permanent magnets then cause the rotor
to move as the magnets are attracted to the electromagnetic coils just as with a brushed motor.
This electronic phase shifting occurs over and over again with the rotor progressively “chasing”
the magnetic field created by the sequentially active stators. The movement of the magnets over
the coils also creates a back electromotive force (EMF) on the unenergized stator, which is sensed
by the speed controller to monitor rotation rate. The current results, ideally, as sequential square
waves. On top of the square wave, the back EMF creates a trapezoid pattern, shown in figure 10.
The speed controller measures this back EMF and uses it to determine the speed of the motor.
Thus, if the motor slows down due to an applied torque, the speed controller will adjust the
phasing and magnitude of the voltage and provide the motor more power resulting in more
current and power, so the rotor portion of the motor can still “chase” the signal. The back EMF
and the speed are closely related through a value “KV,” a measure commonly provided by
manufacturers that is the back EMF per rotational speed of the motor at no load. This is a
constant for a particular motor and can be used to give an indication of the motor’s no-load RPM
for a given input voltage. Some larger brushless motors have dedicated hall-effect sensors or
shaft encoders for speed feedback. These sensors provide more precise measures of angular
velocity than measuring back EMF; however, they require more hardware and increase the
complexity of the speed controller itself and are, therefore, generally not used for small brushless
motors.

13
Figure 10. Phased current input and back
EMF signals for a brushless
motor (6).
4.3 Performance Characteristics
Unlike brushed motors, brushless motors have an additional control parameter that affects their
performance, the PWM signal which throttles the motor. Therefore, both voltage and throttle
setting have effects on the motor’s power output. As was seen with brushed motors, torque vs.
RPM curves are linear and parallel with applied voltage, which is how brushed motors are
throttled. RPM on a brushless motor is traditionally controlled via PWM, and we can see that the
torque vs. RPM curves are also nearly linear in figure 12. However, these lines are not parallel
with throttle as was seen with variable voltage. This would suggest that operating at one half the
throttle setting for a given voltage is not equivalent to operating at full throttle at one half the
voltage. The impact of this will be discussed later in the report.
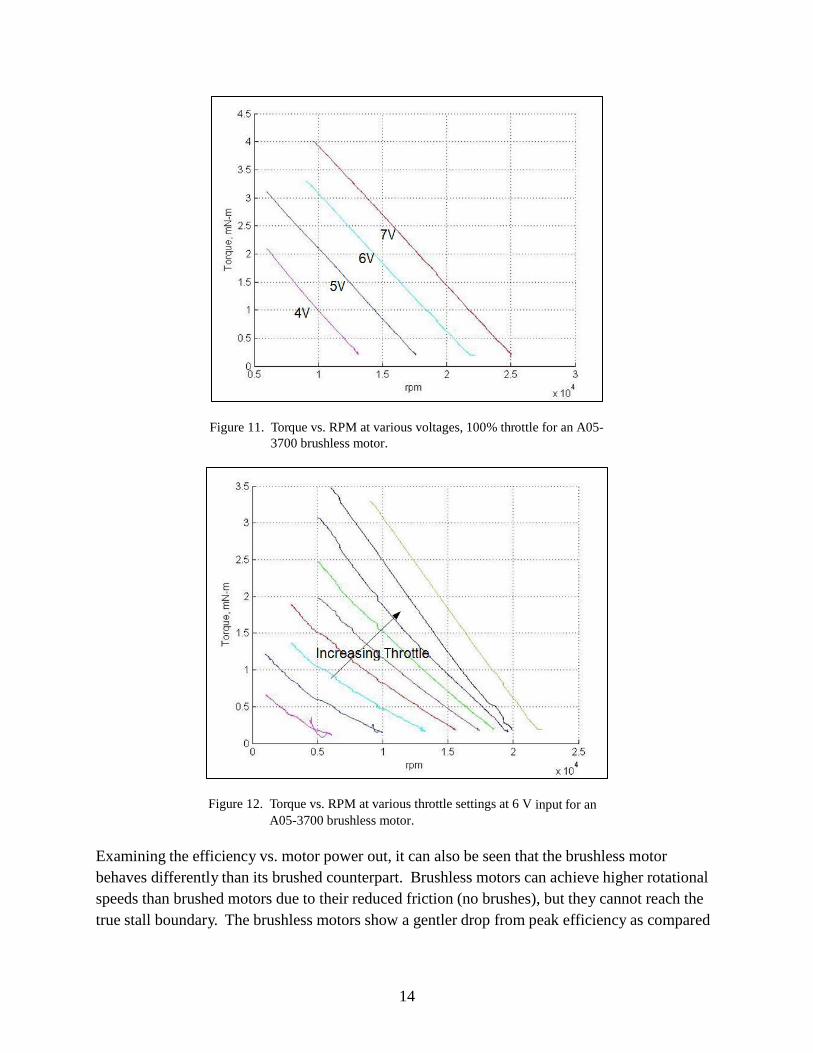
14
Figure 11. Torque vs. RPM at various voltages, 100% throttle for an A05-
3700 brushless motor.
Figure 12. Torque vs. RPM at various throttle settings at 6 V input for an
A05-3700 brushless motor.
Examining the efficiency vs. motor power out, it can also be seen that the brushless motor
behaves differently than its brushed counterpart. Brushless motors can achieve higher rotational
speeds than brushed motors due to their reduced friction (no brushes), but they cannot reach the
true stall boundary. The brushless motors show a gentler drop from peak efficiency as compared

15
to their brushed counterparts. Fundamental behavior between brushed and brushless motors,
however, is the same.
If the points of maximum efficiency for each of the different voltages at a constant throttle in
figure 13a are connected, then the maximum efficiency remains relatively constant as shown in
figure 14 for this and several other motors. In comparison, the points of maximum efficiency for
a constant voltage at varying throttle settings are shown in figure 13b. These results show that in
order to get the best efficiency from a brushless motor is to maintain 100% throttle and vary the
voltage. Nearly all brushless motors show a gentle increase in overall efficiency with an increase
in power output as a result of increasing input voltage; however, the relative changes are small,
indicating that increasing the voltage further would not result in a substantial gain in efficiency.
Figure 13. Efficiency vs. power out for A05-3700 at (a) 100% throttle and varying voltage and (b) constant voltage
and varying throttle.
Figure 14. Maximum achievable efficiency vs. power out for various
brushless motors.

16
By examining how the efficiency changes with RPM at different throttle settings, points of
constant torque can be connected between the throttle setting variable RPM vs. torque curves.
This is shown by the representative example in figure 15. This is particularly useful as a design
tool that will be discussed later.
Figure 15. Efficiency vs. RPM with lines of constant torque for varying
throttle at 6-V input voltage.
It can be seen that for a particular RPM, a higher torque results in increased efficiency. This is
also true for a particular torque, where a higher RPM leads to increased efficiency. The peaks of
the black parabolic curves constitute the maximum torque attainable at that particular RPM. If
torque is increased further, RPM will decrease.
Referring back to figure 1, which shows the peak efficiency vs. power output for the
representative set of brushless motors with their corresponding weights, it shows that there is a
wide range of efficiencies and power outputs for the various brushless motors. Maximum
efficiencies range from 37 to 63% with maximum power output ranging from 2.1 to 3.9 W. This
wide range of efficiencies indicates that there is some sort of variability in the design of the motor
that causes them to be less efficient. The parameters that most greatly affect efficiency still
require extensive study.
5. Brushless Speed Controller Efficiency
Because the brushless motor requires the addition of a speed controller for operation, the speed
controller becomes another source of loss. The speed controller’s main purpose is to convert a

17
DC voltage into three-phase power for the motor. To do this, the speed controller uses a series of
Metal-Oxide-Semiconductor Field-Effect Transistors (MOSFETs) and diodes to commutate the
signal (5). This power switching between phases results in electrical circuit losses in the form of
heat and, thus, the efficiency of the system is decreased. To obtain an estimate for the efficiency
of the speed controller, experiments were performed where the efficiency was analyzed between
the power input to the speed controller and the mechanical output power of the motor. These
results were then compared to the efficiency of the stand alone motor and the remaining
contribution was assumed to be efficiency of the speed controller. In all brushless motor tests, a
Castle Creations Phoenix 6 speed controller was used. Figure 16 shows the comparison between
the efficiency of the brushless motor itself, the combined efficiency of the motor and speed
controller, and the resulting controller efficiency. The black line, which is the quotient of the
combined efficiency (blue) and stand alone motor efficiency (red), represents the speed
controller’s efficiency.
Figure 16. Comparison of efficiency values for an ADH30S-6100
brushless motor with a Castle Creations Phoenix 6 speed
controller.
In order to identify the exact causal relationship resulting in the linear decay in efficiency, an
extensive study on the design and performance of brushless speed controllers would need to be
performed. It should also be noted that a brushed motor does not suffer from this extra loss in
efficiency if a commutating speed controller is not used.
The speed controller exhibits a decrease in efficiency from nearly 90% efficient at the motor’s
no-load RPM, decreasing linearly to around 55% efficient at the maximum applied torque. To
verify that these results were not an artifact of the chosen motor, the tests were repeated for a
different motor made by a different manufacturer. Figure 17 shows similar results for an

18
ADH30S-6100 brushless motor and the same Castle Creations Phoenix 6 speed controller. This
indicates that the linear decay in efficiency is roughly consistent across different motors. For
these two motors, the addition of the speed controller efficiency shows the significant decrease in
overall efficiency as shown in figure 18. Here it can be seen that this drop is significantly below
the trend and that the entire trend would be shifted down for all the motors if their corresponding
speed controller efficiencies were included. Other speed controllers may behave differently and,
therefore, generalization about speed controller performance cannot be made. An independent
study of speed controller efficiency will need to be carried out.
Figure 17. Comparison of efficiency values for an AP03-7000 brushless
motor with a Castle Creations Phoenix 6 speed controller.
Figure 18. Motor efficiency with size showing effect of speed controller efficiency.

19
6. Motor Applications for Propulsion Systems
When designing a vehicle, whether it is a ground vehicle with a transmission system and wheels
or tracks, or an aerial vehicle with a gearbox, rotors or a propeller, it is important to know the
operating conditions of the propulsion system. Knowledge of the power required, power
available, and the required torque and RPM are imperative for proper motor selection. In
practice, most robotics engineers and designers tend to choose the motors that are most readily
available. Often acquiring the highest KV is the adopted selection criteria because manufacturers
will specify a KV. The KV indicates the expected rotational speed for a given input voltage
under no-load conditions. This gives the designer no indication regarding the expected rotational
speed and power expected or efficiency when the motor is under load. In this section, a process
for selecting a motor is presented for a UAV application where thrust from a rotor is varied via
RPM as is the case for a propeller.
6.1 Understanding the Power Requirements
Estimating the power requirements for a rotor is relatively straight forward because much work
has been done to develop various analysis techniques for determining how torque and thrust
change with RPM. Some of the most comprehensive techniques include computational fluid
dynamic (CFD) studies or free wake analysis, but blade element momentum theory (BEMT)
techniques show relatively good correlation with experiments (7, 8). A rotor’s torque varies with
the square of the RPM and the power varies with the cube. Using this information, we can gauge
how the torque and power requirements change if the RPM is changed. An example rotor torque
vs. RPM curve is plotted on an example motor curve in figure 19.
Figure 19. Torque vs. RPM curves plotted for an example motor
with rotor data overlaid.

20
This plot is useful in determining if a particular motor is capable of spinning the rotor at a
particular RPM, and also indicates at which throttle setting an RPM will be reached. However,
this graph does not provide information on the efficiency of the motor at the various torques and
rotational speeds. If the operating conditions are known, for example during hover 0.8 mN-m of
torque at 10,000 RPM is required, then that point is known and can be plotted on the motor
efficiency chart as shown in figure 20. This shows the efficiency of the motor at the rotor’s
operating point as it relates to the overall efficiency of the motor. In this example, the motor is an
AP03-7500 KV motor and is running around 38% efficient. This is very poor relative to the
possible 58% efficiency the motor is capable of reaching. When motor efficiency (38%) is
combined with the efficiencies in the rotor (65%), speed controller (70%), and associated
electronics (90%+), the overall system efficiency may be lower than 20%.
Figure 20. AP03-7500 KV efficiency vs. RPM chart with lines of
constant torque.
Clearly the motor is capable of reaching much higher efficiencies, as high as 58%. However, for
a rotor application, it may not be suitable to design a rotor to operate within that portion of the
motor’s capability as the highest efficiencies only occur at maximum throttle for brushless
motors. Therefore, it may be beneficial to choose a different motor and attempt to move to a
higher efficiency at the current rotor operating conditions. To illustrate this, if the same rotor as
shown in figure 20 was used on an AP03-4000 KV motor, the motor would operate at around
45% efficiency shown in figure 21.

21
Figure 21. AP03-4000 KV efficiency vs. RPM chart with lines of
constant torque.
By switching to a different motor, of the same size and weight of the same manufacturer, there is
an 18% increase in efficiency. To the user, the only distinguishing characteristic is the
manufacturer specified KV value, which in this case, is lower than the motor tested in the
previous example. By testing the other brushless motors available, one can determine if there is
another motor that may be even better suited for this particular application and attempt to
increase efficiency further. In figure 22, it was found that a different model of motor is an even
better choice. By using the A05-2900, a 45% increase in efficiency is predicted over the original.
All of this is without changing any of the associated electronics or the rotor, which suggests that
the efficiency could be increased even further.
Figure 22. A05-2900 KV efficiency vs. RPM chart with lines of
constant torque.

22
7. Conclusions and Future Work
Brushed and brushless motors are currently the preferred option for propulsion systems for
micro-robotics applications. This technical report examined a representative sample of both
brushed and brushless motors weighing <5 g. It was shown that motors at this scale have a wide
range of efficiencies that are relatively low and efficiency decreases significantly with size. It is
therefore important to properly analyze the particular propulsion system of interest by
determining the operating torque and RPM, and correspondingly choosing the proper motor. By
doing this, overall propulsion system efficiency can be increased so that the system’s operating
conditions are ideally matched to that of the motor. However, the electromechanical parameters
that have an effect on efficiency have not been systematically varied and tested to date and should
be an area of future study, nor have theoretical limits on performance been considered. It was
also determined that operation of brushless motors at other than 100% throttle results in
decreased efficiency and that throttling the motor by varying the voltage is a preferred method.
Therefore, development of new types of speed controllers that operate at max PWM and vary the
voltage instead may increase overall system efficiency. Lastly, it was found that brushless motor
speed controllers are a significant source of inefficiency. Their efficiency drops linearly with
increased motor load. Further analysis of other types of speed controllers should be performed in
the future to determine if this is a phenomenon seen in all brushless speed controllers. In
conclusion, by ideally matching motor loading conditions, using variable voltage speed control,
and studying speed controller efficiencies, the endurance of vehicles can be increased, making
them more mission capable and increasing their practicality.

23
8. References
1. AXI Model Motors. MODEL MOTORS s.r.o. 2006. Web, May 2012.
2. Krishnan, R. Permanent Magnet Synchronous and Brushless DC Motor Drives; CRC/Taylor
& Francis: Boca Raton, FL, 2010.
3. Brushed and Brushless Motors. Think RC. http://www.thinkrc.com/faq/brushless-motors.php
(accessed March 4, 2012).
4. Bar-Cohen, Y. Automation, Miniature Robotics, and Sensors for Nondestructive Testing and
Evaluation; American Society for Nondestructive Testing: Columbus, OH, 2000.
5. Colton, S. W. Design and Prototyping Methods for Brushless Motors and Motor Control.
Thesis, Massachusetts Institute of Technology, 2012.
6. Gencer, C.; Gedikpinar, M. Modeling and Simulation of a BLDCM Using MATLAB
/SIMULINK. Journal of Applied Sciences 2006, 6.3, 688–91.
7. Harrington, A. M. Optimal Propulsion System Design for a Micro Quad Rotor. Thesis,
University of Maryland, College Park, 2011.
8. Lakshminarayan, V. K. Computational Investigation of Micro-Scale Coaxial Rotor
Aerodynamics in Hover. Thesis, University of Maryland, College Park, 2009.

24
INTENTIONALLY LEFT BLANK.

25
Appendix. Brushed and Brushless Motor Data

26
A.1 Brushed Motor Data
Figure A-1. MK04-10-1 (0.66 g).
Figure A-2. MK04S-10-1 (0.46 g).

27
Figure A-3. MK06-4.5-1 (1.32 g).
Figure A-4. MK06-10-1 (1.32 g).

28
Figure A-5. MK06-30-1 (1.32 g).
Figure A-6. SS7-1.1-1

29
Figure A-7. SS7-1.7-1.
Figure A-8. SS7-2.3-1.

30
Figure A-9. SS7-3.3-1.
Figure A-10. Stan-1.

31
Figure A-11. VAMP-1.

32
A.2 Brushless Motor Data
Figure A-12. A05-2900 (4.1 g).
Figure A-13. A05-3700 (4.2 g).

33
Figure A-14. ADH30S-6100 (3.3 g).
Figure A-15. ADH30S-7500 (3 g).

34
Figure A-16. AP02-7000 (2.4 g).
Figure A-17. AP03-4000 (3.3 g).
35
Figure A-18. AP03-7000 (3.3 g).
Figure A-19. AP03-7500 (3.3 g).

36
INTENTIONALLY LEFT BLANK.

37
Bibliography
Brushless DC Motors. Report no. NASA CR-2506; Midwest Research Institute: Kansas City,
1975.
Brushless Motors. Grayson Hobby. http://www.graysonhobby.com/catalog/ (accessed May
2012).
Kumar, P.; Bauer. P. Improved Analytical Model of a permanent-Magnet Brushless DC Motor.
IEEE Transactions on Magnetics 2008, 44.10, 2299–309.

38
INTENTIONALLY LEFT BLANK.

39
List of Symbols, Abbreviations, and Acronyms
(η) efficiency
(λ) power factor
(τ) torque
(ω) rotational velocity
BEMT blade element momentum theory
CFD computational fluid dynamic
COTS commercial off-the-shelf
DC direct current
EMF electromotive force
EMI electromagnetic interference
g gram
I current
mm millimeter
mN-m millinewton-meter
MOSFETs Metal-Oxide-Semiconductor Field-Effect Transistors
P power
PWM pulse width modulated
RMP revolutions per minute
S apparent power
UAV unmanned aerial vehicle
UGV unmanned ground vehicle
V voltage

NO. OF
COPIES ORGANIZATION
40
1 DEFENSE TECHNICAL
(PDF) INFORMATION CTR
DTIC OCA
8725 JOHN J KINGMAN RD
STE 0944
FORT BELVOIR VA 22060-6218
1 DIRECTOR
(HC) US ARMY RESEARCH LAB
IMAL HRA
2800 POWDER MILL RD
ADELPHI MD 20783-1197
1 DIRECTOR
(PDF) US ARMY RESEARCH LAB
RDRL CIO LL
2800 POWDER MILL RD
ADELPHI MD 20783-1197
ABERDEEN PROVING GROUND
5 DIR USARL
(PDF) RDRL SED E
B MORGAN
RDRL SER L
W NOTHWANG
RDRL VTA
M BUNDY
A HARRINGTON
C KRONINGER