Characterization of Fast Pyrolysis of Dry Distiller’s Grains (DDGS) and Palm Kernel Cake Using a...
15
Published: March 15, 2011 r2011 American Chemical Society 4286 dx.doi.org/10.1021/ie101618c | Ind. Eng. Chem. Res. 2011, 50, 4286–4300 ARTICLE pubs.acs.org/IECR Characterization of Fast Pyrolysis of Dry Distiller’s Grains (DDGS) and Palm Kernel Cake Using a Heated Foil Reactor: Nitrogen Chemistry and Basic Reactor Modeling Jacopo Giuntoli, Jeroen Gout, Adrian H. M. Verkooijen, and Wiebren de Jong* Process and Energy Department, Energy Technology Section, Delft University of Technology, Leeghwaterstraat 44, 2628 CA, Delft, The Netherlands ABSTRACT: In this paper, two residues of liquid biofuels production were tested: dry distiller’s grains with solubles and palm kernel cake. The fuels were tested in a heated foil reactor inserted in a Fourier Transform Infrared spectrometer under fast pyrolysis conditions: a heating rate of 600 °C/s and final temperatures ranging from 500 to 1300 °C. The fuels were also pretreated by water leaching to remove water-soluble inorganic compounds. A numerical model of the unloaded system was developed to gain better insight into the temperature and velocity profiles in the reactor and on the foil. The model allowed the detection of zones of high temperature and low velocity around the hot foil, indicating that secondary reactions are likely. Moreover, temperature validation with an InfraRed pyrometer indicated that the temperature measured by the control thermocouple is on average about 15% (in °C) lower than the actual foil temperature. The product composition and final yields of volatile species were measured at different final temperatures. The main volatile species was CO 2 for temperatures lower than 1000 °C. At higher temperatures CO became the most abundant volatile species, likely because of tar cracking. HCN resulted to be the main volatile-N compound for all samples at all temperatures, while NH 3 was detected in minor amounts. The mechanism of decomposition of proteins seems to have changed from deamination, at slow heating rates, to dehydration, followed by the formation of cyclic amides. These structures were released as tar-N and subsequently decomposed into HCN and NH 3 . The effect of the leaching was not relevant for weight loss and main species release, but it appeared to enhance tar-N decomposition for the DDGS sample. ’ INTRODUCTION With increasing concerns about global warming and high energy prices, reducing the CO 2 emissions from the power sector and diversifying energy supply is becoming of primary im- portance. 1 Using biomass as a fuel presents a possibility to tackle both these issues. 2 The advantages of using biomass wastes, such as residues of liquid biofuels production, for energy applications are multiple: high heating values compared to relatively wet woody biomass, low prices, and continuous production among some of the reasons. There are, however, still many issues that hinder the use of such materials on a large scale. Unlike coal, which has been studied extensively in the past, 35 the thermal behavior of biomass residues has only been under investigation for a short time. 615 The different origins and composition of such materi- als makes it necessary to obtain a detailed characterization of each fuel to maximize the efficiency of their use. One of the compounds that can largely vary between different types of biomass materials is nitrogen. Nitrogen in biomass can be found in amounts of less than 1%, for clean wood, up to about 10% for some animal wastes. 6,12,14,1618 High amounts of nitro- gen could result in high NO x emissions during combustion or high concentrations of NO x -precursors, such as NH 3 and HCN, in the syngas produced in gasification. Pyrolysis is the first chemical conversion step in every thermal conversion process and plays, therefore, an essential role in the emissions and syngas composition. A detailed knowledge of this process would greatly help efficient reactor design and emission control. 19,20 Besides nitrogen, biomass also contains significant amounts of other elements such as K, Na, Cl, and S. These elements, because of their interaction with bed materials and reactor surfaces, are known to be responsible for loss of fluidization, fouling, slagging, and corrosion of the thermal conversion equipment. 2130 This study has the purpose to characterize the fast pyrolysis behavior of biomass wastes with the focus on nitrogen partition- ing. Two potential fuels with high N content, dry distiller’s grains and solubles (DDGS) and palm kernel cake (PKC), were analyzed under fast pyrolysis conditions in a smallscale, heated foil reactor. In a previous work, 9 we thoroughly studied the devolatilization behavior of DDGS and chicken manure at slow heating rates, and we were able to retrieve kinetic parameters and volatile composition. However, the conditions in real reactors are very different, with heating rates in the order of magnitude of 10 3 10 4 °C/s. The heated foil reactor used in this work, which was introduced in a previous study, 7 allowed the detection and quantification of volatile NO x precursors, such as NH 3 and HCN, released during pyrolysis at high heating rates, in the range of 5001000 °C/s. The reactor allowed the study of the influence of temperature, heating rate, and holding time on volatile composition, yields, and weight loss. Moreover, a water leaching pretreatment, described by Arvelakis et al., 21 was applied to the samples in order to remove the watersoluble Received: July 29, 2010 Accepted: February 23, 2011 Revised: January 17, 2011
Transcript of Characterization of Fast Pyrolysis of Dry Distiller’s Grains (DDGS) and Palm Kernel Cake Using a...

Published: March 15, 2011
r 2011 American Chemical Society 4286 dx.doi.org/10.1021/ie101618c | Ind. Eng. Chem. Res. 2011, 50, 4286–4300
ARTICLE
pubs.acs.org/IECR
Characterization of Fast Pyrolysis of Dry Distiller’s Grains (DDGS) andPalmKernel CakeUsing aHeated Foil Reactor: NitrogenChemistry andBasic Reactor ModelingJacopo Giuntoli, Jeroen Gout, Adrian H. M. Verkooijen, and Wiebren de Jong*
Process and Energy Department, Energy Technology Section, Delft University of Technology, Leeghwaterstraat 44, 2628CA, Delft, TheNetherlands
ABSTRACT: In this paper, two residues of liquid biofuels production were tested: dry distiller’s grains with solubles and palmkernel cake. The fuels were tested in a heated foil reactor inserted in a Fourier Transform Infrared spectrometer under fast pyrolysisconditions: a heating rate of 600 �C/s and final temperatures ranging from 500 to 1300 �C. The fuels were also pretreated by waterleaching to remove water-soluble inorganic compounds. A numerical model of the unloaded system was developed to gain betterinsight into the temperature and velocity profiles in the reactor and on the foil. The model allowed the detection of zones of hightemperature and low velocity around the hot foil, indicating that secondary reactions are likely. Moreover, temperature validationwith an InfraRed pyrometer indicated that the temperature measured by the control thermocouple is on average about 15% (in �C)lower than the actual foil temperature. The product composition and final yields of volatile species were measured at different finaltemperatures. Themain volatile species was CO2 for temperatures lower than 1000 �C. At higher temperatures CObecame themostabundant volatile species, likely because of tar cracking. HCN resulted to be the main volatile-N compound for all samples at alltemperatures, while NH3 was detected in minor amounts. The mechanism of decomposition of proteins seems to have changedfrom deamination, at slow heating rates, to dehydration, followed by the formation of cyclic amides. These structures were releasedas tar-N and subsequently decomposed into HCN and NH3. The effect of the leaching was not relevant for weight loss and mainspecies release, but it appeared to enhance tar-N decomposition for the DDGS sample.
’ INTRODUCTION
With increasing concerns about global warming and highenergy prices, reducing the CO2 emissions from the power sectorand diversifying energy supply is becoming of primary im-portance.1 Using biomass as a fuel presents a possibility to tackleboth these issues.2
The advantages of using biomass wastes, such as residues ofliquid biofuels production, for energy applications are multiple:high heating values compared to relatively wet woody biomass,low prices, and continuous production among some of thereasons.
There are, however, still many issues that hinder the use ofsuch materials on a large scale. Unlike coal, which has beenstudied extensively in the past,3�5 the thermal behavior ofbiomass residues has only been under investigation for a shorttime.6�15 The different origins and composition of such materi-als makes it necessary to obtain a detailed characterization of eachfuel to maximize the efficiency of their use.
One of the compounds that can largely vary between differenttypes of biomass materials is nitrogen. Nitrogen in biomass canbe found in amounts of less than 1%, for clean wood, up to about10% for some animal wastes.6,12,14,16�18 High amounts of nitro-gen could result in high NOx emissions during combustion orhigh concentrations of NOx-precursors, such as NH3 and HCN,in the syngas produced in gasification. Pyrolysis is the firstchemical conversion step in every thermal conversion processand plays, therefore, an essential role in the emissions and syngascomposition. A detailed knowledge of this process would greatlyhelp efficient reactor design and emission control.19,20
Besides nitrogen, biomass also contains significant amounts ofother elements such as K, Na, Cl, and S. These elements, becauseof their interaction with bed materials and reactor surfaces, areknown to be responsible for loss of fluidization, fouling, slagging,and corrosion of the thermal conversion equipment.21�30
This study has the purpose to characterize the fast pyrolysisbehavior of biomass wastes with the focus on nitrogen partition-ing. Two potential fuels with high N content, dry distiller’s grainsand solubles (DDGS) and palm kernel cake (PKC), wereanalyzed under fast pyrolysis conditions in a small�scale, heatedfoil reactor. In a previous work,9 we thoroughly studied thedevolatilization behavior of DDGS and chicken manure at slowheating rates, and we were able to retrieve kinetic parameters andvolatile composition. However, the conditions in real reactors arevery different, with heating rates in the order of magnitude of103�104 �C/s. The heated foil reactor used in this work, whichwas introduced in a previous study,7 allowed the detection andquantification of volatile NOx precursors, such as NH3 andHCN, released during pyrolysis at high heating rates, in therange of 500�1000 �C/s. The reactor allowed the study of theinfluence of temperature, heating rate, and holding time onvolatile composition, yields, and weight loss. Moreover, a waterleaching pretreatment, described by Arvelakis et al.,21 was appliedto the samples in order to remove the water�soluble
Received: July 29, 2010Accepted: February 23, 2011Revised: January 17, 2011

4287 dx.doi.org/10.1021/ie101618c |Ind. Eng. Chem. Res. 2011, 50, 4286–4300
Industrial & Engineering Chemistry Research ARTICLE
troublesome elements. Leached samples were investigated to testthe influence of such pretreatment on their thermal behavior.
Heated grid reactors have been extensively used in the last 40years to study the fast devolatilization of coals7,31,32 and, morerecently, of biomass structures and samples.7,33�39
In addition to the experimental results from fast pyrolysis, thiswork introduces a numerical model of the unloaded reactor itself.Because of the architecture of the setup and the extreme speed ofthe phenomena involved, the possibilities for monitoring theexperimental conditions are limited in the reactor, as opposed toa thermogravimetric analyzer.9,10 A numerical model is a goodway to provide a better insight into the physical conditions withinthe unloaded reactor, such as temperature and velocity profiles.The findings from the model were validated against a noncontacttemperature measurement. The results of these simulationscomplement the experimental results by giving a clearer pictureof the physical conditions in the reactor and provide a basis forthe implementation of a more complete model including thephysics and chemistry of a reacting sample. Previous studies havealso focused on the numerical modeling of the actual thermalhistory within a biomass or cellulose sample undergoing flashpyrolysis. They showed how the inclusion of endothermic heat ofpyrolysis is essential when modeling biomass materials for anaccurate fitting of the experimental results.40,41
The fuels tested in this study are byproducts from theproduction of first generation liquid biofuels. DDGS is a by-product of cereal to ethanol production,42 while PKC is theresidue of oil extraction from the kernels of palm fruits.43 Bothmaterials are currently used as animal feed because of theirconsiderable protein content. Only recently interest has startedto arise on possible energetic use of these residues,9,44�46 butknowledge of their pyrolysis behavior is still very limited.
In a previous study, we investigated the slow pyrolysis ofDDGS, both untreated and leached in water, in a TG�FTIRsetup.9 We reported that the main nitrogen compound to bereleased was NH3 at low temperatures, followed by HCN andHNCO at higher temperatures. The results also showed how the
pyrolysis was complete at about 700 �C and that the final weightloss amounted to about 80 wt %a.r. at 900 �C. Moreover, theleaching pre�treatment appeared to have a limited effect on thereactivity and on the volatiles composition.
In another study from our group, Di Nola et al.7 investigatedthe fast pyrolysis of coal, chicken manure and meat and bonemeal. They found that NH3 was the main N-compound releasedat low temperatures with HCN yield increasing rapidly at highertemperatures.
Moreover, Becidan et al.14,15 investigated the fast pyrolysis ofcoffee waste, fiberboard, and brewer spent grains. They showedhow the amount of light gases released increased with tempera-ture at the expenses of tars and residual char. However, theyobserved that NH3 was the main N-compound at all tempera-tures, even though the ratio HCN/NH3 was linearly increasingfor all the samples. Furthermore, they found an increasing releaseof volatile-N compounds with temperature at the expenses of tar-N and char-N. Zhou47 studied the release of fuel-bound nitrogenduring gasification and pyrolysis of four different biomasssamples in a fluidized bed reactor: he found out that ammoniaand char-retained nitrogen were the most relevant compounds at700 �C, while much lower amounts of HCN and NO weredetected. In another work, Becidan48 underlined contradictoryresults found in literature with the main volatile-N speciesvarying with heating rates, experimental equipments and,obviously, fuels. Tables 1 and 2 illustrate the results obtainedin some previous works on volatile-N composition during slowand fast pyrolysis, respectively. Because of the very differentnature of the materials analyzed and their nitrogen structures, aclear pattern does not appear from previous works. Generally,it seems that ammonia is the main volatile released at slowheating rates, when the route of deamination of the proteinchains is the main mechanism of release.49�51 However, at highheating rates, closer to industrial conditions, HCN becomesmore important, especially at high temperatures, indicating adifferent mechanism of release, including more secondaryreactions in the gas phase.48,51
Table 1. Yields of Volatile-N Compounds in Biomass Slow Pyrolysis
sample
heating rate (�C/min)
temperature
(�C)initial-N (%
wtdaf)
NH3 (%
wtdaf)
HCN (%
wtdaf)
HNCO (%
wtdaf)
N-to-NH3
(%)
N-to-HCN
(%)
N-to-HNCO
(%) ref
oriental tobaccoa 30 900 2.78 0.3 0.4 1.0 8.9 7.5 11.7 12
Burley tobaccoa 30 900 5.22 1.0 0.8 1.2 15.8 7.9 7.5 12
wheat strawa 30 900 0.68 0.16 0.22 0.13 19.4 16.8 6.2 12
wood pelletsa 30 900 0.33 0.02 0.09 0.02 5.0 14.1 2.0 52
miscanthusa 30 900 0.64 0.10 0.14 0.11 12.9 11.3 5.6 52
chicken littera 30 900 5.35 1.04 1.10 1.73 15.7 11.3 11.2 6
meat and bone
meala30 900 11.03 2.2 1.1 0.5 16.0 5.3 1.5 6
DDGSa 10 900 4.84 1.4 1.3 0.45 23.8 15.9 3.0 9
DDGS washeda 10 900 4.83 1.9 1.9 0.5 32.4 20.4 3.4 9
chicken manurea 10 900 8.04 3.7 4.9 7.9 37.9 31.6 32.0 9
coffee wasteb 10 900 3.02 0.25 0.06 n.d. 6.9 1.0 n.d. 14
brewer spent
grainsb10 900 4.15 0.78 0.28 n.d. 15.7 3.5 n.d. 14
fiberboardb 10 900 3.62 0.5 <0.07 n.d. 11.5 <1.0 n.d. 14
pine barkc 10 900 0.4 0.05 <0.004 n.d. 10.2 0.5 n.d. 53
sugar cane bagassed 6.7 1000 0.31 0.005 0.04 n.d. 1.5 7 n.d. 54a Performed on a TG-FTIR setup. b Performed in a quartz tube furnace þ FTIR. c Performed in a tube oven. d Performed in a drop tube reactor.

4288 dx.doi.org/10.1021/ie101618c |Ind. Eng. Chem. Res. 2011, 50, 4286–4300
Industrial & Engineering Chemistry Research ARTICLE
To obtain a definite picture of the behavior of these materials,it is clear that a thorough characterization of each fuel, like theone presented in this paper, is necessary.
’EXPERIMENTAL SECTION
IntegratedHeated Foil�FTIR Setup.The experimental workdescribed in this paper was carried out on the setup illustrated inFigure 1. The apparatus has been slightly modified comparedwith the one described and used in previous work.7
As it is shown in Figure 1, the setup consists of two differentequipments: the actual heated foil reactor (HF) and a Fourier
transform infrared spectrometer (FTIR) in which the reactor isinserted. The main part of the reactor consists of a stainless steelcilindrical chamber of 60 mm diameter and 65 mm of height. Agrid, or foil in this work, is placed between two electrodes in thecenter of this chamber. An S-type (Pt/Pt�Rh) thermocouple(TC) of 0.01 mm diameter is placed underneath the foil, incontact with it. Finally, the sample is placed on the center of thefoil. The reactor walls are heated with heating elements at atemperature of 110 �C, verified by an external K-type thermo-couple, in order to avoid species condensation. When electriccurrent is passed through the electrodes, the foil is heated viaresistive heating at very high rates of the order of 1000 �C/s. Thecontrol of the heating profile is done via the thermocouple and afast acquisition card connected to a PC. The PC uses the TCreading as input for the control and adjusts the electrical currentoutput so that the actual temperature profile follows the pro-grammed one. The control is done via the software Testpoint,and the thermal history can be customarily defined via theparameters of heating rate, final temperature and holding timeat final temperature.The choice in this work was to use a foil of stainless steel AISI
304 (18Cr 9Ni) with a thickness of 0.05 mm and a surface of 8�14 mm2. In previous works,7,57 both stainless steel and platinummeshes were used. However, a foil seems to bemore suitable thana grid because of several reasons: more homogeneous distribu-tion of the electrical current (and thus temperature and heattransfer) on the surface, there are no risks of loss of reactingmaterial through the mesh holes and, finally, modeling andvalidation is easier. The larger surface in contact between thesample and the foil, compared to a grid, however, could increasethe catalytic effect of the grid material on the fuel decomposition.Hajaligol et al.,33 however, did not find any relevant catalyticeffects for a stainless steel mesh.In the present measurement campaign, an amount of 5�7 mg
of sample was weighted and then pressed into thin discs ofapproximately 0.7 mm thickness and 3 mm diameter, as de-scribed by Di Nola et al.7 Once the sample was placed on the foil,the lid was sealed and the system was flushed with helium for asufficient time to flush the chamber from atmospheric gases.Consequently, the inlet and outlet valves were closed to maintainan inert atmosphere in the reactor. After the valves were closed,the heating ramp was started and the sample was heated with aheating rate (HR) of 600 �C/s up to temperatures rangingbetween 500 and 1300 �C. The holding time (HT) at hightemperature was usually kept equal to 10s. Additional measure-ments with a heating rate of 1000 �C/s and holding times of 5 to15s were performed to study the influence of such parameters on
Table 2. Yields of Volatile-N Compounds in Biomass Fast Pyrolysis
sample heating rate (�C/s) temperature (�C) initial-N (%wtdaf) NH3 (%wtdaf) HCN (%wtdaf) N-to-NH3 (%) N-to-HCN (%) ref
cane trasha >17 900 0.31 0.09 0.13 23.9 21.7 55
chicken litterb 1000 900 4.35 0.8 1.7 15.1 20.3 7
meat and bone mealb 1000 900 11.17 3.8 4 28.0 18.6 7
coffee wastec drop 900 3.02 1.39 0.82 37.8 14.1 14
brewer spent grainsc drop 900 4.15 1.57 1.37 31.3 17.1 14
fiberboardc drop 900 3.62 1.58 0.63 36 9.1 14
sewage sludgec drop 900 5.47 3.37 0.91 50.7 8.6 56
sugar cane bagassed drop 800 0.31 0.05 0.32 12.5 53.0 54a Performed on a fixed bed reactor. b Performed in a heated grid reactorþ FTIR. c Performed in a quartz tube furnaceþ FTIR. d Performed in a drop tubereactor.
Figure 1. Heated foil setup.

4289 dx.doi.org/10.1021/ie101618c |Ind. Eng. Chem. Res. 2011, 50, 4286–4300
Industrial & Engineering Chemistry Research ARTICLE
the final yields of volatile-N but will not be shown in thepresent work.Once the gases are released from the sample, a volumetric
pump, with a flow of 2.6 L/min, circulates them from the hotzone into two transfer lines, heated at about 110. The loop isclosed by a final cilindrical tube encased among two ZnSewindows. This consitutes the actual gas cell of the FTIR and ithas an optical path length of 0.2 m. The total volume of thereactor and circulation loop is 200 cm3.A quantitative method was implemented on the FTIR via
calibration of the following species: CO, CO2, CH4, H2O, NH3,HCN and HNCO. The applied resolution for FTIR measure-ments was equal to 0.25 cm�1, and the results of 3 scans wereaveraged for a total measurement time of 9s. To guarantee ahomogeneous distribution of the gases in the reactor volume,after the holding time at high temperature, the pyrolysis gaseswere circulated for about 2 minutes prior to the FTIR measure-ment. Sets of three measurements were performed; the reportedvalues are the average of each series and the upper and lowervalues of the series are also reported as error bars.Pyrometer.To validate the numerical model developed in this
work, an infrared (IR) pyrometer was used. The pyrometerutilized here was a model IGA5MB20 manufactured by Impac.The pyrometer could measure the IR radiation of a spot of 1.1mmdiameter when placed at a distance of 90mm from the target.The pyrometer measured temperatures in the range of250�2000 �C in the wavelength range of 1.45�1.8 μm. Thepyrometer was mounted on two 25 mm travel motion controltranslation stages which could be adjusted on the horizontal xand y plane with a precision up to 25 μm. The schematic of thesetup is illustrated in Figure 2. The recording of the foiltemperature was conducted through the window on the lid ofthe reactor; this did not influence the measurements since thematerial of the window, BK7, is for 99.9% transparent to thewavelengths detected by the pyrometer.58
To minimize the influence of the surface properties of the foilon the actual emissivity of the material, before any series ofmeasurements the “fresh” foil was heated up to 1100 �C for 1minute under helium atmosphere. This was expected to createthe same surface conditions that the foil would encounter during
normal pyrolysis tests. Moreover, eventual oxygen impuritieswould oxidize the steel surface and possibly reduce the catalyticeffects of the foil on the fuel.33 Successively, the pretreated foilwas placed on a ceramic cooking plate and the temperaturereading of the pyrometer was compared with the temperatureindicated by a 0.1 mm K-type thermocouple in contact with thefoil in the close proximity of the measurement spot of thepyrometer. The emissivity found with these experiments wasequal to 0.75 at a temperature of about 300 �C.Materials. The fuels analyzed in this work are two residues
from the production of the first generation biofuels: Drydistiller’s grains and solubles and Palm kernel cake. The prox-imate and ultimate analysis of all the fuels is given in Table 3.Details on fuels origins and composition can be found in a
previous work from our group.59
The two fuels studied here underwent a pretreatment ofleaching in water according to the methodology described byArvelakis and Koukios.21 The conditions of the pretreatment are
Figure 2. Schematic of the pyrometer and heated foil reactor.
Table 3. Proximate and Elemental Analysis of the Fuels
(wt % dry basis) DDGSa DDGS leacheda PKC PKC leached
moistureb 8.9 8.5 7.0 9.2
volatiles 78.2 76.2 75.5 75.1
fixed carbon 14.7 17 18.4 19.5
ashc 7.1 6.8 6.1 5.4
C 49.0 48.8 49.0 47.8
H 6.3 6.3 6.0 6.1
N 4.5 4.5 2.4 2.7
S 0.4 0.4 0.5 0.4
O (by diff.) 32.7 33.2 36.0 37.7
HHV (MJ/kg) 19.8 20.5 17.8 18.8aGiuntoli et al.9 bAs received basis. cAshed at 550 �C.
Table 4. Details of the Pretreatments Applied to the Fuels
sample
particle size
distribution
water-to-mass
ratio time
dry distiller’s grains
solubles leached
4mm>Dp 44.4 g/L 24 h
palm kernel cake leached 4mm>Dp 88.9 g/L 24 h
Table 5. Elemental Analysis of the Ash-Forming Matter
(wt % dry basis) DDGSa DDGS leacheda PKC PKC leached
Al2O3 0.2 0.4 4.4 5.2
SiO2 22.4 24.9 16.2 17.8
CaO 2.9 3.9 9.3 11.3
MgO 7.3 8.2 8.2 8.5
Fe2O3 0.4 0.5 11.5 12.4
K2O 22.7 22.4 14.0 12.3
Na2O 2.7 1.8 0.4 0.1
TiO2 0.01 0.1 0.2
SO3 9.5 2 9.2 2.4
Cl� 2.9 0.9 3.3 0.0
P2O5 29.0 32.4 23.7 25.4aGiuntoli et al.9
4290 dx.doi.org/10.1021/ie101618c |Ind. Eng. Chem. Res. 2011, 50, 4286–4300
Industrial & Engineering Chemistry Research ARTICLE
summarized in Table 4. The elemental analysis of the ash formingmatter in the samples is illustrated in Table 5. Additionalconsiderations on the pretreatments and their effects on fuelproperties and reactor operations can be found in otherworks.9,10,21,22,60�62
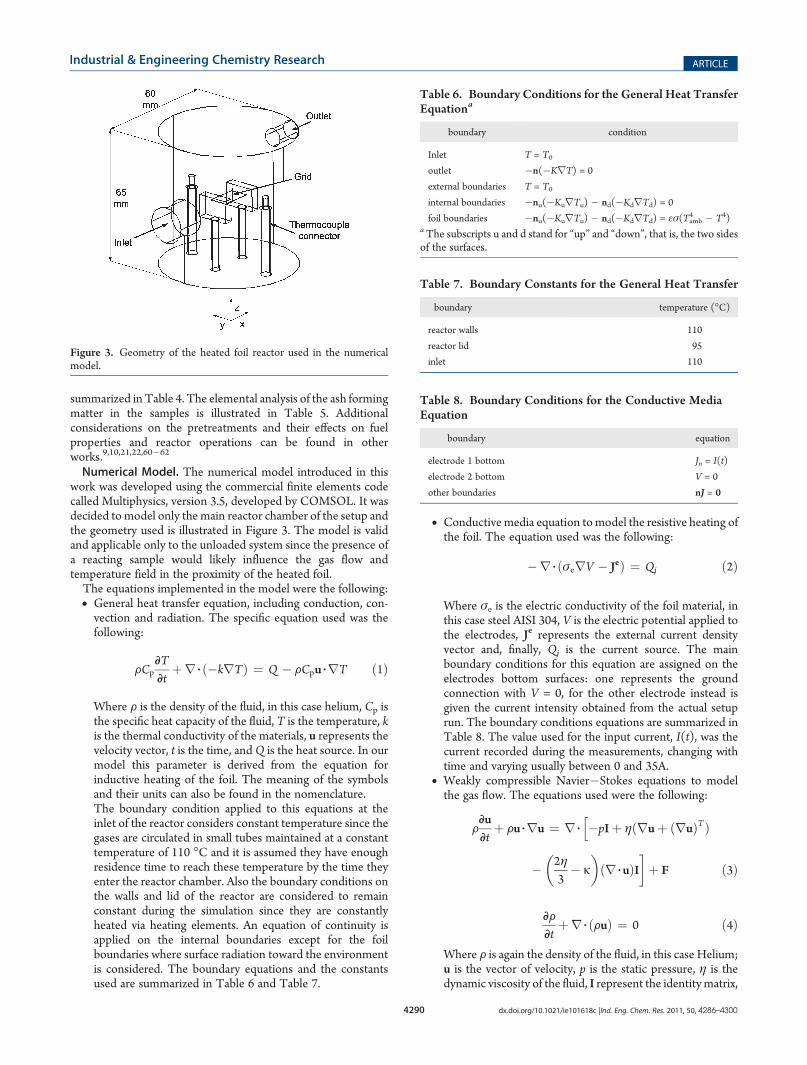
Numerical Model. The numerical model introduced in thiswork was developed using the commercial finite elements codecalled Multiphysics, version 3.5, developed by COMSOL. It wasdecided tomodel only the main reactor chamber of the setup andthe geometry used is illustrated in Figure 3. The model is validand applicable only to the unloaded system since the presence ofa reacting sample would likely influence the gas flow andtemperature field in the proximity of the heated foil.The equations implemented in the model were the following:• General heat transfer equation, including conduction, con-vection and radiation. The specific equation used was thefollowing:
FCpDTDt
þr 3 ð�krTÞ ¼ Q � FCpu 3rT ð1Þ
Where F is the density of the fluid, in this case helium, Cp isthe specific heat capacity of the fluid, T is the temperature, kis the thermal conductivity of the materials, u represents thevelocity vector, t is the time, and Q is the heat source. In ourmodel this parameter is derived from the equation forinductive heating of the foil. The meaning of the symbolsand their units can also be found in the nomenclature.The boundary condition applied to this equations at theinlet of the reactor considers constant temperature since thegases are circulated in small tubes maintained at a constanttemperature of 110 �C and it is assumed they have enoughresidence time to reach these temperature by the time theyenter the reactor chamber. Also the boundary conditions onthe walls and lid of the reactor are considered to remainconstant during the simulation since they are constantlyheated via heating elements. An equation of continuity isapplied on the internal boundaries except for the foilboundaries where surface radiation toward the environmentis considered. The boundary equations and the constantsused are summarized in Table 6 and Table 7.
• Conductive media equation tomodel the resistive heating ofthe foil. The equation used was the following:
�r 3 ðσerV � JeÞ ¼ Qj ð2Þ
Where σe is the electric conductivity of the foil material, inthis case steel AISI 304, V is the electric potential applied tothe electrodes, Je represents the external current densityvector and, finally, Qj is the current source. The mainboundary conditions for this equation are assigned on theelectrodes bottom surfaces: one represents the groundconnection with V = 0, for the other electrode instead isgiven the current intensity obtained from the actual setuprun. The boundary conditions equations are summarized inTable 8. The value used for the input current, I(t), was thecurrent recorded during the measurements, changing withtime and varying usually between 0 and 35A.
• Weakly compressible Navier�Stokes equations to modelthe gas flow. The equations used were the following:
FDuDt
þ Fu 3ru ¼ r 3 �pIþ ηðruþ ðruÞTÞh
� 2η3� k
� �ðr 3 uÞI
�þ F ð3Þ
DFDt
þr 3 ðFuÞ ¼ 0 ð4Þ
Where F is again the density of the fluid, in this case Helium;u is the vector of velocity, p is the static pressure, η is thedynamic viscosity of the fluid, I represent the identitymatrix,
Figure 3. Geometry of the heated foil reactor used in the numericalmodel.
Table 6. Boundary Conditions for the General Heat TransferEquationa
boundary condition
Inlet T = T0
outlet �n(�KrT) = 0
external boundaries T = T0
internal boundaries �nu(�KurTu) � nd(�KdrTd) = 0
foil boundaries �nu(�KurTu) � nd(�KdrTd) = εσ(Tamb4 � T4)
aThe subscripts u and d stand for “up” and “down”, that is, the two sidesof the surfaces.
Table 7. Boundary Constants for the General Heat Transfer
boundary temperature (�C)
reactor walls 110
reactor lid 95
inlet 110
Table 8. Boundary Conditions for the Conductive MediaEquation
boundary equation
electrode 1 bottom Jn = I(t)
electrode 2 bottom V = 0
other boundaries nJ = 0
4291 dx.doi.org/10.1021/ie101618c |Ind. Eng. Chem. Res. 2011, 50, 4286–4300
Industrial & Engineering Chemistry Research ARTICLE
κ is the dilatational viscosity, and finally, F represents thevector of volume forces. The boundary conditions appliedfor the Navier�Stokes equations were the typical no-slipcondition on the walls, the pressure of suction of the pumpat the outlet and the inlet velocity as a fully developed profilewith the average velocity retrieved from the volumetric flowof the pump. The boundary equations applied to the weaklycompressible Navier�Stokes equations are summarized inTable 9.
The following assumptions were applied:• The model is applicable in the present form only to theunloaded system; therefore, no reacting sample is includedin the analysis.
• The temperature of the reactor walls, gas inlet, and lid wasassumed constant over time.
• Heat transfer via radiation was considered significant onlyfor the foil and with effect only on the surrounding gases andnot on the other reactor surfaces.
• The flow of the gases was laminar and incompressible sinceat the outlet of the reactor, where the velocities aremaximum, the value of Reynolds number was equal toapproximately 40 and the Mach number was lower than 0.3.
• Buoyancy effects were accounted for using the Boussinesqapproximation in the form of
F ¼ ðF� F0Þg ð5Þ
This approximation holds when the flow can be consideredincompressible and when the following condition holds:
δFF
¼ RδT , 1
Because of the the high gradients in the zone near the foil,this condition will not hold for the flow close to the foil. Sucheffect does not seem so relevant as to invalidate theresults found.
• The physico�chemical properties of the materials and theirrelation with temperature were taken from the software’sown database.The boundary conditions of the model weretaken from the actual parameters of the real reactor. Themodel used as its main input the current input to the foilrecorded during the measurements on the real reactor.
’RESULTS AND DISCUSSION
Numerical Model: Temperature and Velocity Profiles inthe Unloaded Reactor. As mentioned before, the actual mea-surement of several important process parameters in the heatedfoil reactor is very difficult due to the speed of the phenomenainvolved and the small dimensions of the reactor. Therefore, themain goal of the numerical model presented in this work was toprovide such important data as the temperature and velocityprofiles in the reactor volume and the temperature distributionon the foil. Even if the model does not include the reactingsample and thus the conditions during the actual measurementwill likely differ from the ones reported here, knowing these datais still of primary importance for a correct interpretation of theexperimental results. Additional details about the model setupand the results achieved can be found elsewhere.63
To quantify only the primary products of devolatilization, thegases released from the sample should be swept quickly into acold zone of the reactor, the same way as it is done in otherexperimental equipments such as thermogravimetric analyzers.9
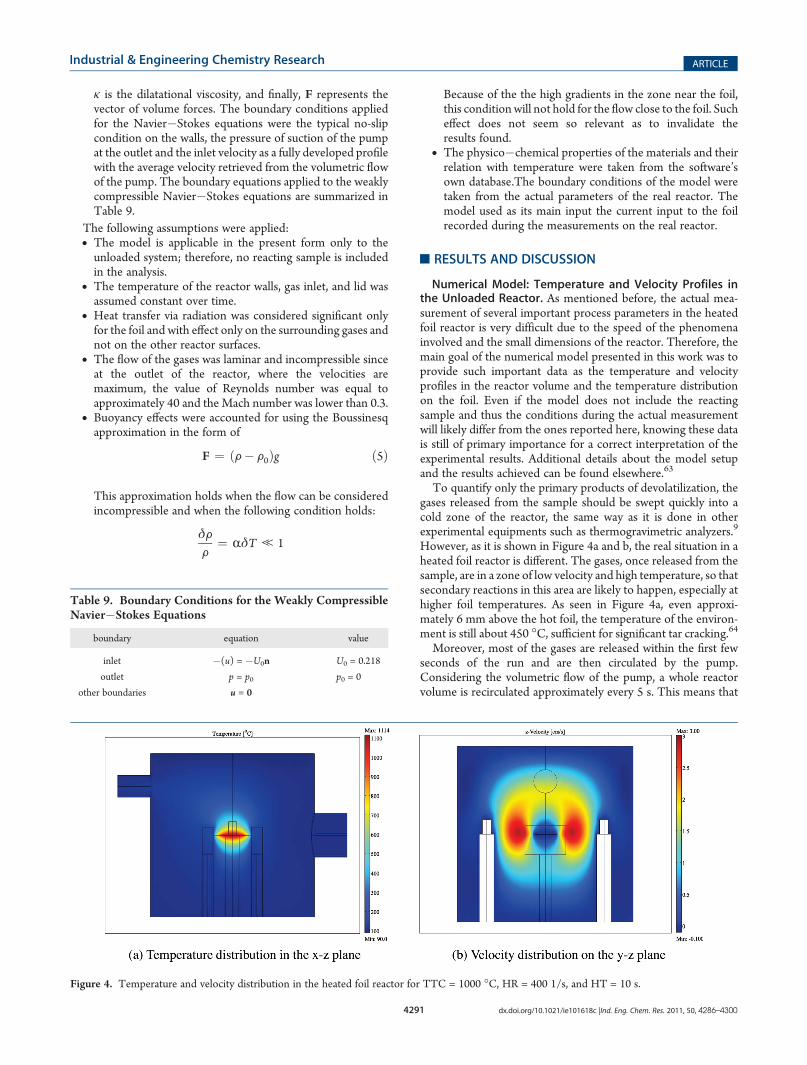
However, as it is shown in Figure 4a and b, the real situation in aheated foil reactor is different. The gases, once released from thesample, are in a zone of low velocity and high temperature, so thatsecondary reactions in this area are likely to happen, especially athigher foil temperatures. As seen in Figure 4a, even approxi-mately 6 mm above the hot foil, the temperature of the environ-ment is still about 450 �C, sufficient for significant tar cracking.64Moreover, most of the gases are released within the first few
seconds of the run and are then circulated by the pump.Considering the volumetric flow of the pump, a whole reactorvolume is recirculated approximately every 5 s. This means that
Table 9. Boundary Conditions for the Weakly CompressibleNavier�Stokes Equations
boundary equation value
inlet �(u) = �U0n U0 = 0.218
outlet p = p0 p0 = 0
other boundaries u = 0
Figure 4. Temperature and velocity distribution in the heated foil reactor for TTC = 1000 �C, HR = 400 1/s, and HT = 10 s.
4292 dx.doi.org/10.1021/ie101618c |Ind. Eng. Chem. Res. 2011, 50, 4286–4300
Industrial & Engineering Chemistry Research ARTICLE
the gases released have the chance to flow once again through thehot zone above the foil. This might cause significant secondarydecomposition of the tar volatiles.64
The simulations show that the flow in the proximity of the foilis mostly driven by forced convection. The velocity in the xdirection is approximately 1 cm/s at 3 mm above the hot surfaceand it quickly increases to 4 cm/s at a position 10 mm above thefoil. The vertical velocity, in the z direction, is instead approxi-mately 0.8 cm/s at a position 5 mm above the foil and it peaks at1.8 cm/s at 10 mm.Numerical Model: Temperature Validation. Another very
important parameter that can be analyzed thanks to the model isthe actual temperature on the foil and its spatial distribution,since this can give an indication of the actual conditions to whichthe sample is exposed. It has been suggested in previous works, infact, that measuring the grid/foil temperature with a thermo-couple could introduce a significant error.57,65 Our model, asshown in Figure 4a, also seems to indicate the actual temperatureto be higher than the one recorded by the TC. This is due toseveral causes: the temperature drain introduced by the TC in thecontact place, the heat loss via the tip and wires of the TC and,mostly, the nonperfect contact between the TC and the foil.Actual Foil Temperature. Guo65 simulated the heat loss via a
thermocouple (TC) welded (thus in perfect contact) to the gridsurface in a heated grid reactor and found out that, for a TCdiameter of 0.1mm already one could expect a difference equal to2�5% between the TC reading and the actual grid temperature.Prins et al.,57 using laser thermometry, found out that thisdifference ranged from 10% up to 25%.As mentioned above, in the present work, it was chosen to
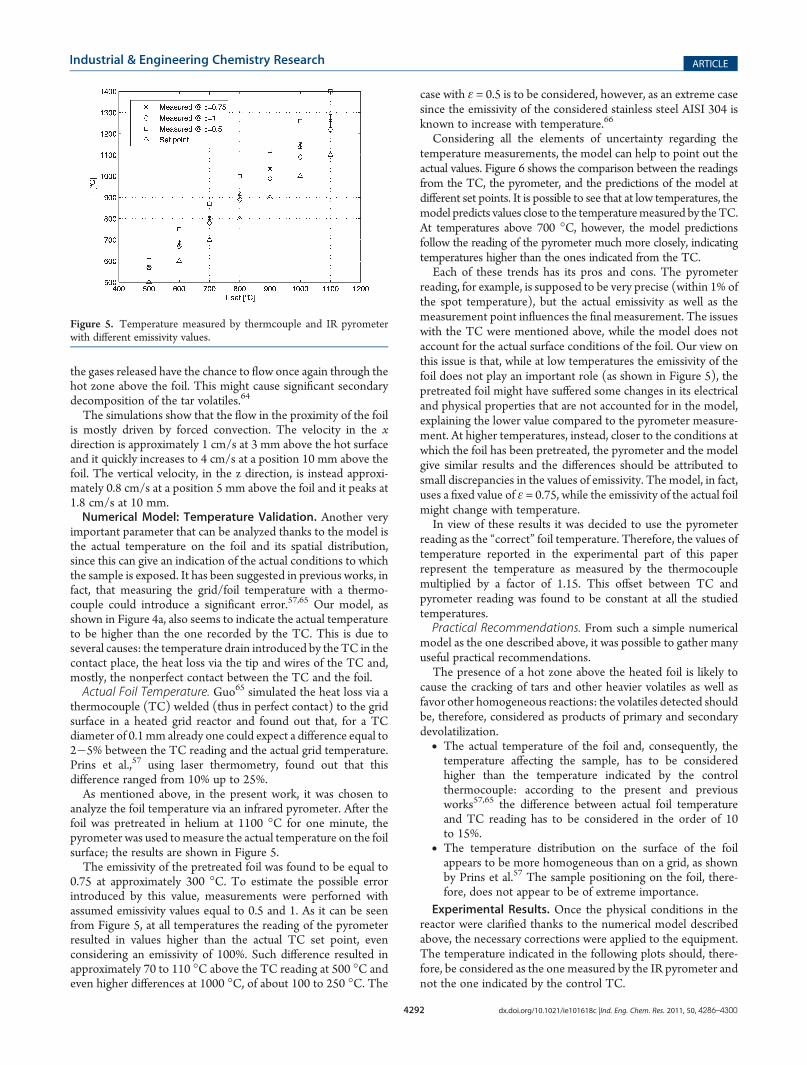
analyze the foil temperature via an infrared pyrometer. After thefoil was pretreated in helium at 1100 �C for one minute, thepyrometer was used tomeasure the actual temperature on the foilsurface; the results are shown in Figure 5.The emissivity of the pretreated foil was found to be equal to
0.75 at approximately 300 �C. To estimate the possible errorintroduced by this value, measurements were perforned withassumed emissivity values equal to 0.5 and 1. As it can be seenfrom Figure 5, at all temperatures the reading of the pyrometerresulted in values higher than the actual TC set point, evenconsidering an emissivity of 100%. Such difference resulted inapproximately 70 to 110 �C above the TC reading at 500 �C andeven higher differences at 1000 �C, of about 100 to 250 �C. The
case with ε = 0.5 is to be considered, however, as an extreme casesince the emissivity of the considered stainless steel AISI 304 isknown to increase with temperature.66
Considering all the elements of uncertainty regarding thetemperature measurements, the model can help to point out theactual values. Figure 6 shows the comparison between the readingsfrom the TC, the pyrometer, and the predictions of the model atdifferent set points. It is possible to see that at low temperatures, themodel predicts values close to the temperaturemeasured by theTC.At temperatures above 700 �C, however, the model predictionsfollow the reading of the pyrometer much more closely, indicatingtemperatures higher than the ones indicated from the TC.Each of these trends has its pros and cons. The pyrometer
reading, for example, is supposed to be very precise (within 1% ofthe spot temperature), but the actual emissivity as well as themeasurement point influences the final measurement. The issueswith the TC were mentioned above, while the model does notaccount for the actual surface conditions of the foil. Our view onthis issue is that, while at low temperatures the emissivity of thefoil does not play an important role (as shown in Figure 5), thepretreated foil might have suffered some changes in its electricaland physical properties that are not accounted for in the model,explaining the lower value compared to the pyrometer measure-ment. At higher temperatures, instead, closer to the conditions atwhich the foil has been pretreated, the pyrometer and the modelgive similar results and the differences should be attributed tosmall discrepancies in the values of emissivity. The model, in fact,uses a fixed value of ε = 0.75, while the emissivity of the actual foilmight change with temperature.In view of these results it was decided to use the pyrometer
reading as the “correct” foil temperature. Therefore, the values oftemperature reported in the experimental part of this paperrepresent the temperature as measured by the thermocouplemultiplied by a factor of 1.15. This offset between TC andpyrometer reading was found to be constant at all the studiedtemperatures.Practical Recommendations. From such a simple numerical
model as the one described above, it was possible to gather manyuseful practical recommendations.The presence of a hot zone above the heated foil is likely to
cause the cracking of tars and other heavier volatiles as well asfavor other homogeneous reactions: the volatiles detected shouldbe, therefore, considered as products of primary and secondarydevolatilization.• The actual temperature of the foil and, consequently, thetemperature affecting the sample, has to be consideredhigher than the temperature indicated by the controlthermocouple: according to the present and previousworks57,65 the difference between actual foil temperatureand TC reading has to be considered in the order of 10to 15%.
• The temperature distribution on the surface of the foilappears to be more homogeneous than on a grid, as shownby Prins et al.57 The sample positioning on the foil, there-fore, does not appear to be of extreme importance.
Experimental Results. Once the physical conditions in thereactor were clarified thanks to the numerical model describedabove, the necessary corrections were applied to the equipment.The temperature indicated in the following plots should, there-fore, be considered as the one measured by the IR pyrometer andnot the one indicated by the control TC.
Figure 5. Temperature measured by thermcouple and IR pyrometerwith different emissivity values.
4293 dx.doi.org/10.1021/ie101618c |Ind. Eng. Chem. Res. 2011, 50, 4286–4300
Industrial & Engineering Chemistry Research ARTICLE
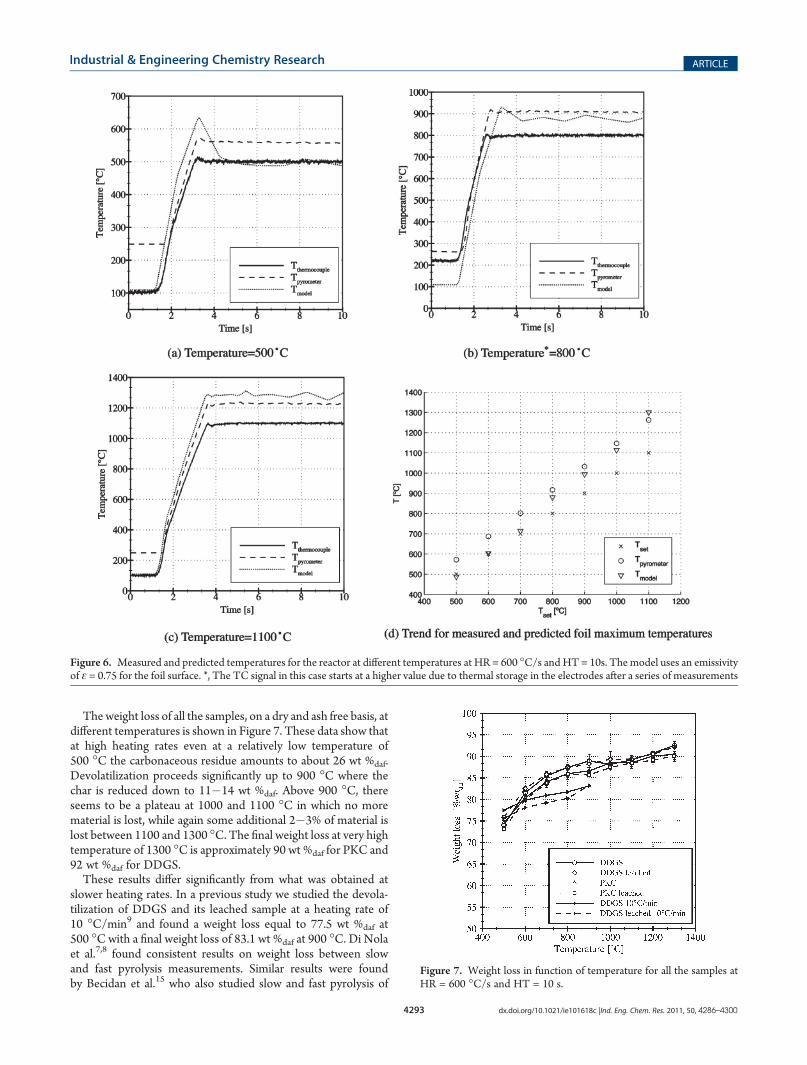
Theweight loss of all the samples, on a dry and ash free basis, atdifferent temperatures is shown in Figure 7. These data show thatat high heating rates even at a relatively low temperature of500 �C the carbonaceous residue amounts to about 26 wt %daf.Devolatilization proceeds significantly up to 900 �C where thechar is reduced down to 11�14 wt %daf. Above 900 �C, thereseems to be a plateau at 1000 and 1100 �C in which no morematerial is lost, while again some additional 2�3% of material islost between 1100 and 1300 �C. The final weight loss at very hightemperature of 1300 �C is approximately 90 wt %daf for PKC and92 wt %daf for DDGS.These results differ significantly from what was obtained at
slower heating rates. In a previous study we studied the devola-tilization of DDGS and its leached sample at a heating rate of10 �C/min9 and found a weight loss equal to 77.5 wt %daf at500 �C with a final weight loss of 83.1 wt %daf at 900 �C. Di Nolaet al.7,8 found consistent results on weight loss between slowand fast pyrolysis measurements. Similar results were foundby Becidan et al.15 who also studied slow and fast pyrolysis of
Figure 6. Measured and predicted temperatures for the reactor at different temperatures at HR = 600 �C/s and HT = 10s. The model uses an emissivityof ε = 0.75 for the foil surface. *, The TC signal in this case starts at a higher value due to thermal storage in the electrodes after a series of measurements
Figure 7. Weight loss in function of temperature for all the samples atHR = 600 �C/s and HT = 10 s.
4294 dx.doi.org/10.1021/ie101618c |Ind. Eng. Chem. Res. 2011, 50, 4286–4300
Industrial & Engineering Chemistry Research ARTICLE
different biomass residues. They reported that the residual charfor measurements with a heating rate of 10 �C/min and finaltemperature equal to 900 �C was much lower compared to theone obtained at high heating rates at the same reactortemperature.It is quite commonly found in pyrolysis of biomass fuels67 that
higher heating rates and high final temperatures maximize gasyield and minimize char residues, coherently with the resultsobtained here.In terms of absolute values, the results obtained in this work
appear to correspond to the ones reported by Di Nola et al.7 whoshowed weight losses of about 87�95 wt %daf at 1000 �C forchicken litter and meat and bone meal samples and almost nocarbonaceous residue for both samples at higher temperatures.Becidan et al.15 found higher char residues of about 20 wt%daf at atemperature of 900 �C but, apart from the differences due to thedifferent materials, the reactor configuration most probably
played a major role: the reactor used by Becidan and co-workers,in fact, was amacro-TGAwith a sample size of 75 g and, as shownin another work,68 actual heating rates of only about 150 �C/min.The combination of higher sample mass and lower heating rates,both conditions which favor char forming reactions, explains thedifference with the present results. Stubington and Aiman35,69 intheir work on sugar cane bagasse found higher differences whencomparing results at slow and fast heating rates: a weight loss ofabout 96 wt %daf at 800 and 1000 �C/s compared to 86 wt %daf at800 and 5 �C/min. Other works on fast pyrolysis of biomasssamples on different reactors are consistent with the resultspresented here.36,70�72
Product Partitioning. Figure 8 shows the product distributionfrom all the samples tested at different final temperatures. At atemperature of 500 �C, for all the samples most of the weight lossis the result of tars and undetected light species, such as H2, withyields of about 60 wt %daf. Light gases make up for only about
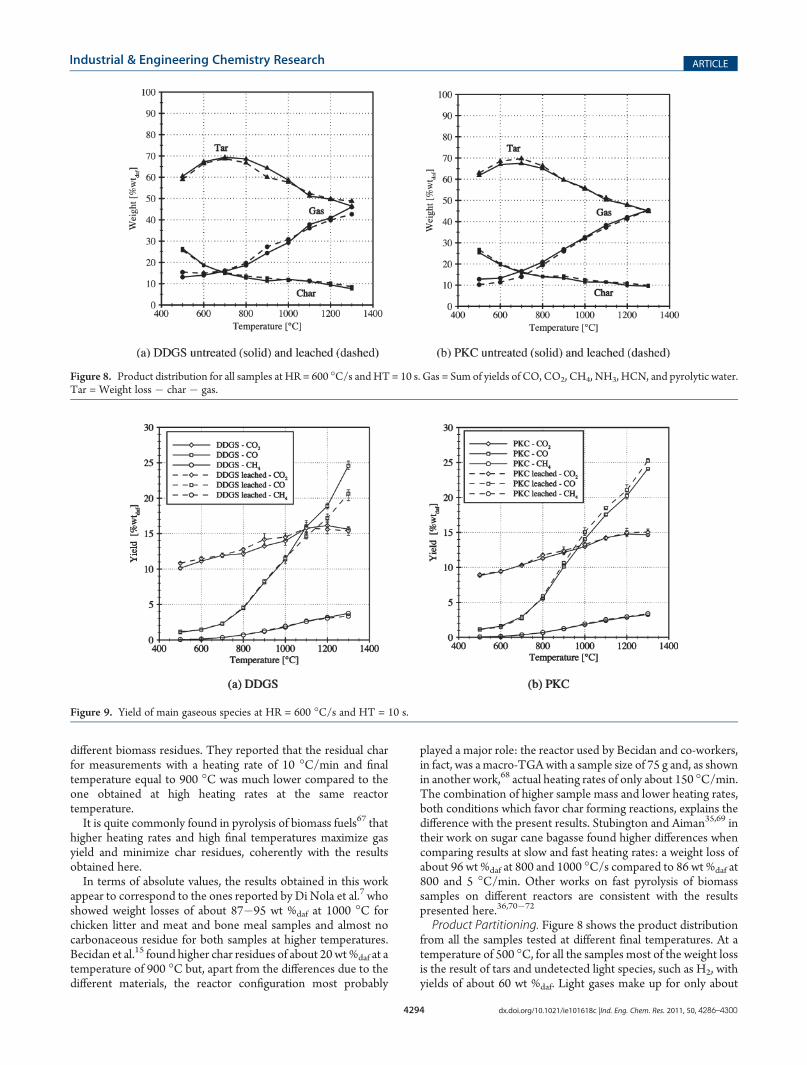
Figure 8. Product distribution for all samples at HR = 600 �C/s andHT = 10 s. Gas = Sum of yields of CO, CO2, CH4, NH3, HCN, and pyrolytic water.Tar = Weight loss � char � gas.
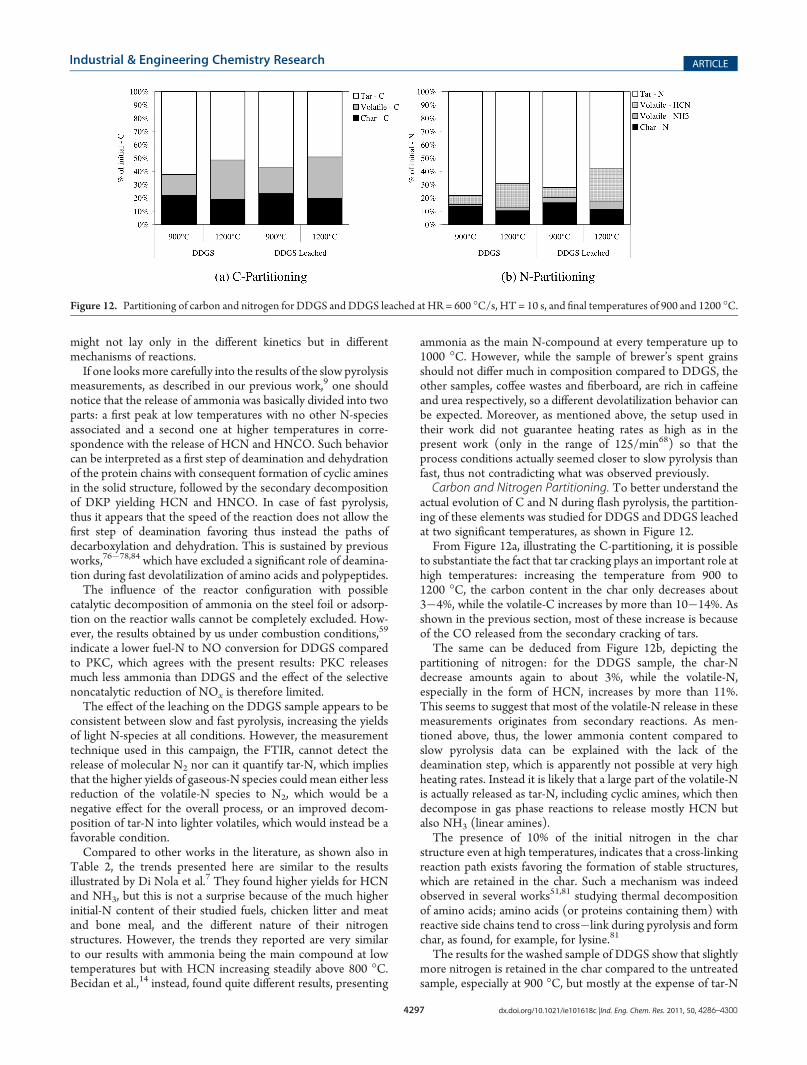
Figure 9. Yield of main gaseous species at HR = 600 �C/s and HT = 10 s.

4295 dx.doi.org/10.1021/ie101618c |Ind. Eng. Chem. Res. 2011, 50, 4286–4300
Industrial & Engineering Chemistry Research ARTICLE
10�15 wt %daf of the initial mass and still approximately 25 wt%daf of char is left. These results are consistent with typicalbiomass pyrolysis applications: for moderate temperatures, highheating rates, and low residence time of the vapors, Bridgwater67
indicates typical oil yields of about 75% wt dry. The maximum oftar content for the fuels studied is obtained at about 700 �Cwith acontent of about 70 wt %daf. At this temperature the slopes of thelight gases and char curves appear to change and while both tarand char decrease at higher temperatures, the yield of gasesincreases because of the final char evolution but also to thesecondary reactions of tar cracking. Similar trends were reportedin previous works,33,35,70 even though in the present work noactual plateau is reached for the species release, indicatingprobably severe secondary reactions at very high temperatures,as it will be shown later on. At a temperature of 900 �C, typical forfluidized bed biomass combustion or gasification, the yield oflight volatiles is around 24�27 wt %daf.The differences among the untreated and leached samples are
minimal as are the differences among DDGS and PKC, whichappear to have an almost identical product distribution.Main Volatile Species Release. Figure 9 shows the release of
the main volatile species from all the studied fuels. Analyzingthese results, it is possible to see that CO2 is the main light gasreleased at low temperatures starting from a yield of 9�11 wt%daf at 500 �C and reaching a steady value of about 15�16 wt%daf at 1100. CO is only a minor compound for temperatureslower than 700�800 �C with yields of about 5 wt %daf, but itincreases greatly at higher temperatures to reach yields of about20�25 wt %daf. This trend corresponds to the observed decreasein tar content, indicating that a partial source for COmight be thecracking of heavier volatiles in the hot zone surrounding the foil,as evidenced in the previous section. However, in a previouswork, we have described how, even at low heating rates, a steeprelease of CO was recorded when the char was heated at 900 �Cfor 30 min.9 This behavior could be explained with an additionalevolution of heavier structures that had recondensed in the solidstructure during the process of devolatilization. In slow pyrolysistar, cracking is not considered relevant since the gases are sweptvery quickly from the hot area via a large flow of a cold, inertcarrier gas.
The yields of CH4 are minor compared to other species. Mostof the release of methane happens at temperatures higher than900 �C. This was found also for experiments at lower heatingrates, in which CH4 is usually released at higher temperaturesthan the other species.9,10
Table 10 summarizes some of the available studies on flashpyrolysis of biomass fuels. It appears evident that, despite thedifferent techniques and materials, the release of main volatilespecies is quite consistent among the measurements, clearlyindicating the common origin of these species. CO2 release frompure cellulose does not appear to make up for the whole yield, asexpected; decomposition of hemicellulose and lignin are alsoexpected to release carbon dioxide when their sugar structuresdecompose. The behavior of CO is also quite consistent amongdifferent materials with yields around 20 wt %daf and mono-tonous increase with increasing temperatures. In Table 10,moreover, results from slow pyrolysis are also reported. Thesedata indicate that the yield of CO for DDGS is similar at 900 �Cfor very different heating rates, approximately 7�8 wt %daf, andthat an isothermal period of 30 min after slow heating appears tohave the same effect as an increase of final temperature at highheating rates. This might indicate indeed that the source of thisyield is not only structural but comes from tar cracking, eitherinside the char structure (in slow pyrolysis) or in the hot zonesurrounding the foil (in fast pyrolysis).Methane yield appears to be constant at around 3 wt %daf for
many biomass fuels, a value which is almost double compared towhat is found at slow heating rates,9,10,12 indicating also a possibleorigin from secondary tar decomposition.Caballero et al.73 showed that the yields of CO, CO2, and H2O
for fast pyrolysis of almond shells could actually be predictedfrom the yields of its main structural components (holocelluloseand lignin). From their experiments, it is possible to concludethat lignin is the main precursor for CO, CH4, and water, whileholocellulose and lignin share their contribution for CO2 release.Methane release was, however, higher than the weighted sum ofthe release from the main components, indicating probablyadditional cracking due to the interaction among the components.Nitrogen Volatile Species Release and Partitioning. While
data on the main gaseous species are available in literature, much
Table 10. Yields of Main Light Volatile Species in Flash Pyrolysis Conditions
sample setup heating rate temperature (�C) CO2 (% wtdaf) CO (% wtdaf) CH4 (% wtdaf) ref
cellulose entrained flow drop 900 6.5 65 7 74
cellulose heated grid 1000 �C/s 1000 3a 23a 3a 33
maple wood entrained flow drop 800 9 35 4.5 74
sweet gum hardwood heated grid 1000 �C/s 1200 6.1b 17b 2.3b 70
wood chips packed bed isothermal 700 13.6 13.6 2.4 75
wheat straw packed bed isothermal 700 18.2 10.4 2.4 75
olive husks packed bed isothermal 700 18 7.7 2.6 75
coffee waste macro-TGA 200 �C/min 900 32 20 6 15
brewer spent grains macro-TGA 200 �C/min 900 18 20 6 15
fiberboard macro-TGA 200 �C/min 900 20 25 6 15
chicken litter heated grid 1000 �C/s 1200 28 25 3 7
meat and bone meal heated grid 1000 �C/s 1200 17 14 4 7
DDGS heated foil 600 �C/s 1200 16 19 3 this work
PKC heated foil 600 �C/s 1200 15 20 3 this work
DDGS TG-FTIR 10 �C/min 900 8�9c 6�17c 1.6�1.6c 9aAs received basis. bDry basis. cHolding time = 0 min; holding time = 30 min.

4296 dx.doi.org/10.1021/ie101618c |Ind. Eng. Chem. Res. 2011, 50, 4286–4300
Industrial & Engineering Chemistry Research ARTICLE
less is known about the release of light nitrogen volatiles which,however, are fundamental for syngas quality and for NOx
prediction in biomass combustion.59
As mentioned above, DDGS and PKC present a high nitrogencontent compared, for example, to woody biomasses18,52 andmost of it is in the form of proteins. Among several devolatiliza-tion mechanisms, which are clearly illustrated in the work ofBecidan,48 the ones who are believed to be the most common inproteins pyrolysis are• primary decarboxylation with the consequent formation ofamines and CO2
76,77
• dehydration with the formation of an intermediary cyclicamine, commonly 2,5-diketopiperazine (also calledDKP)51,76�80
• cross-linking of proteins containing amino acids with reac-tive side chains, for example, lysine81 was found to produceNH3 and char-N
51
• another path relevant in slow pyrolysis of pure amino acidswas found to be deamination or direct thermal loss of thefinal amino groups from free amino acids or polypeptides49,50
Secondary devolatilization of DKP, finally, is known toproduce mainly HCN with minor amounts of HNCO andNH3, depending on the type of fuels and conditions. Hanssonet al.,82 for example, reported more than 80% conversion of DKPto HCN at 1000�1100 �C under fast pyrolysis conditions.This said, however, as shown in Tables 1 and 2, the relative
amounts of HCN and ammonia vary greatly with processconditions and fuels. Figure 10 shows the release of nitrogenspecies from the DDGS and PKC samples at 600 �C/s.The first observation is that HCN is themain compound for all
the fuels, with even no significant detection of NH3 for PKC. Asimilar yield of HCN and ammonia is found at low temperaturesfor DDGS while, with increasing temperature, HCN increaseslargely while NH3 only increases up to a value of 0.2 wt %daf.When compared on the relative basis of initial nitrogen, as shownin Figure 11, the release of HCN for PKC and DDGS and theirwashed samples is very similar up to 900 �C with a fuel-Nconversion of about 7�8%. With increasing temperature, nodifference is basically visible for the PKC and PKC leachedsample, while the leaching appears to facilitate the conversion of
fuel�N to HCN and ammonia for DDGS. At very high tem-peratures, the final conversion of fuel-N to HCN results to bearound 20% for DDGS and 25% for the other samples. Asmentioned above, no ammonia was detected for PKC, whilearound 3% of initial nitrogen in DDGS was converted to NH3
and more than 5% for the leached sample. A possible explanationfor the lower yield of ammonia from the PKC samples couldreside in the much higher Fe content of these samples whichcould catalyze the decomposition of internally formed NH3 tomolecular N2.
83
Compared to the results obtained under slow pyrolysis con-ditions for DDGS and its washed sample,9 as indicated in Table 1,it is possible to see that at an equal temperature of 900 �C boththe yields of ammonia and HCN are greatly lower at high heatingrates. However, at higher temperatures, the final yield of HCN ishigher than what measured at low heating rates with values of 1.9wt %daf and 2.3 wt %daf for DDGS and DDGS leached,respectively. Even the total yield of NH3 results lower than theone measured at low heating rates, indicating that the difference
Figure 10. Yield of nitrogen species at HR = 600 �C/s and HT = 10 s.
Figure 11. Fuel-N conversion toNH3 andHCN for all samples at HR =600 �C/s and HT = 10 s.
4297 dx.doi.org/10.1021/ie101618c |Ind. Eng. Chem. Res. 2011, 50, 4286–4300
Industrial & Engineering Chemistry Research ARTICLE
might not lay only in the different kinetics but in differentmechanisms of reactions.If one looks more carefully into the results of the slow pyrolysis
measurements, as described in our previous work,9 one shouldnotice that the release of ammonia was basically divided into twoparts: a first peak at low temperatures with no other N-speciesassociated and a second one at higher temperatures in corre-spondence with the release of HCN and HNCO. Such behaviorcan be interpreted as a first step of deamination and dehydrationof the protein chains with consequent formation of cyclic aminesin the solid structure, followed by the secondary decompositionof DKP yielding HCN and HNCO. In case of fast pyrolysis,thus it appears that the speed of the reaction does not allow thefirst step of deamination favoring thus instead the paths ofdecarboxylation and dehydration. This is sustained by previousworks,76�78,84 which have excluded a significant role of deamina-tion during fast devolatilization of amino acids and polypeptides.The influence of the reactor configuration with possible
catalytic decomposition of ammonia on the steel foil or adsorp-tion on the reactior walls cannot be completely excluded. How-ever, the results obtained by us under combustion conditions,59
indicate a lower fuel-N to NO conversion for DDGS comparedto PKC, which agrees with the present results: PKC releasesmuch less ammonia than DDGS and the effect of the selectivenoncatalytic reduction of NOx is therefore limited.The effect of the leaching on the DDGS sample appears to be
consistent between slow and fast pyrolysis, increasing the yieldsof light N-species at all conditions. However, the measurementtechnique used in this campaign, the FTIR, cannot detect therelease of molecular N2 nor can it quantify tar-N, which impliesthat the higher yields of gaseous-N species could mean either lessreduction of the volatile-N species to N2, which would be anegative effect for the overall process, or an improved decom-position of tar-N into lighter volatiles, which would instead be afavorable condition.Compared to other works in the literature, as shown also in
Table 2, the trends presented here are similar to the resultsillustrated by Di Nola et al.7 They found higher yields for HCNand NH3, but this is not a surprise because of the much higherinitial-N content of their studied fuels, chicken litter and meatand bone meal, and the different nature of their nitrogenstructures. However, the trends they reported are very similarto our results with ammonia being the main compound at lowtemperatures but with HCN increasing steadily above 800 �C.Becidan et al.,14 instead, found quite different results, presenting
ammonia as the main N-compound at every temperature up to1000 �C. However, while the sample of brewer’s spent grainsshould not differ much in composition compared to DDGS, theother samples, coffee wastes and fiberboard, are rich in caffeineand urea respectively, so a different devolatilization behavior canbe expected. Moreover, as mentioned above, the setup used intheir work did not guarantee heating rates as high as in thepresent work (only in the range of 125/min68) so that theprocess conditions actually seemed closer to slow pyrolysis thanfast, thus not contradicting what was observed previously.Carbon and Nitrogen Partitioning. To better understand the
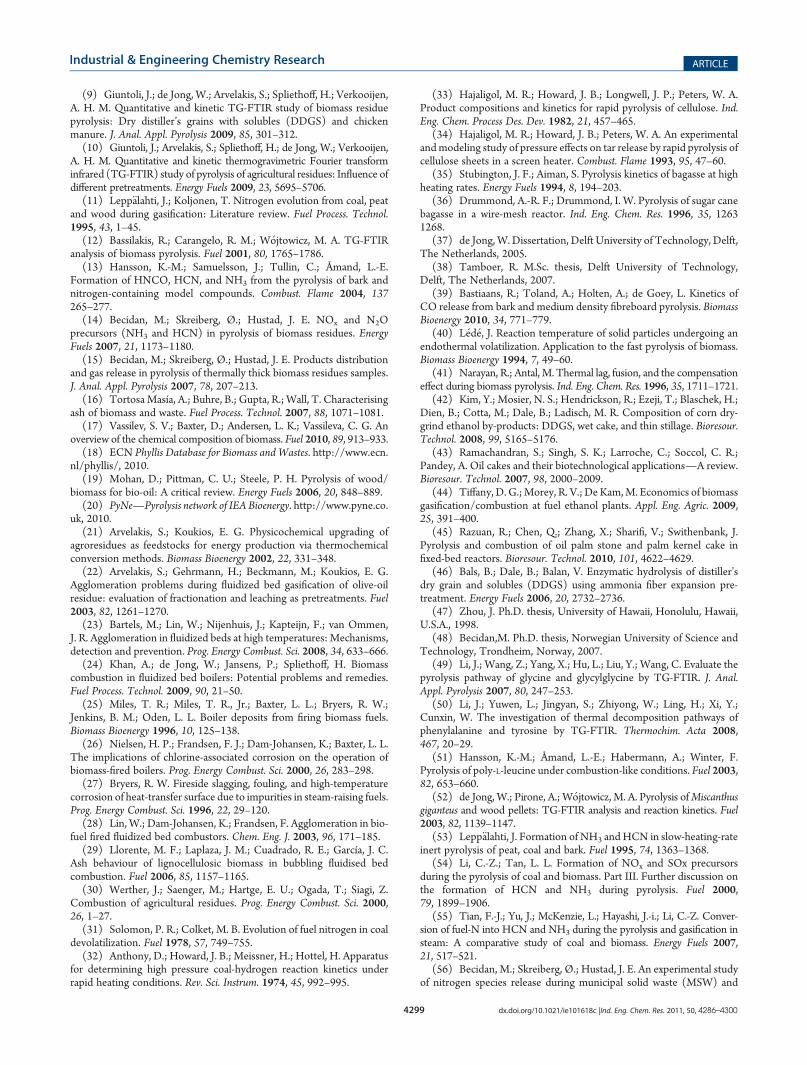
actual evolution of C and N during flash pyrolysis, the partition-ing of these elements was studied for DDGS and DDGS leachedat two significant temperatures, as shown in Figure 12.From Figure 12a, illustrating the C-partitioning, it is possible
to substantiate the fact that tar cracking plays an important role athigh temperatures: increasing the temperature from 900 to1200 �C, the carbon content in the char only decreases about3�4%, while the volatile-C increases by more than 10�14%. Asshown in the previous section, most of these increase is becauseof the CO released from the secondary cracking of tars.The same can be deduced from Figure 12b, depicting the
partitioning of nitrogen: for the DDGS sample, the char-Ndecrease amounts again to about 3%, while the volatile-N,especially in the form of HCN, increases by more than 11%.This seems to suggest that most of the volatile-N release in thesemeasurements originates from secondary reactions. As men-tioned above, thus, the lower ammonia content compared toslow pyrolysis data can be explained with the lack of thedeamination step, which is apparently not possible at very highheating rates. Instead it is likely that a large part of the volatile-Nis actually released as tar-N, including cyclic amines, which thendecompose in gas phase reactions to release mostly HCN butalso NH3 (linear amines).The presence of 10% of the initial nitrogen in the char
structure even at high temperatures, indicates that a cross-linkingreaction path exists favoring the formation of stable structures,which are retained in the char. Such a mechanism was indeedobserved in several works51,81 studying thermal decompositionof amino acids; amino acids (or proteins containing them) withreactive side chains tend to cross�link during pyrolysis and formchar, as found, for example, for lysine.81
The results for the washed sample of DDGS show that slightlymore nitrogen is retained in the char compared to the untreatedsample, especially at 900 �C, but mostly at the expense of tar-N
Figure 12. Partitioning of carbon and nitrogen for DDGS and DDGS leached at HR = 600 �C/s, HT = 10 s, and final temperatures of 900 and 1200 �C.

4298 dx.doi.org/10.1021/ie101618c |Ind. Eng. Chem. Res. 2011, 50, 4286–4300
Industrial & Engineering Chemistry Research ARTICLE
(or molecular N2) since also the volatile-N part is higher than foruntreated DDGS. Asmentioned above, the current methodologydoes not allow to assess whether the leaching favors the decom-position of tar-N into lighter volatiles or if, instead, it inhibits thereduction of light volatiles to N2.
’CONCLUSIONS
A simple numerical model of an unloaded heated foil reactorwas developed in this work. It was shown that a hot zone iscreated around the heating foil, which is most likely to cause tarcracking at foil temperatures above 800 �C when a sample ispyrolyzed. The species detected in the measurements thus needto be considered a simultaneous contribution of primary andsecondary devolatilization. Compared to other reactor types,however, the present configuration prevents serious interactionsbetween the released volatiles and the remaining char.
The temperature of the foil was found to be approximately15% higher than the one measured by the control thermocouple.Whenever using this type of reactor, therefore, a thoroughinvestigation of the temperature field in the reactor and on thefoil was found to be essential to accurately describe the experi-mental conditions.
The main gaseous species resulted to be CO2 for all thesamples at lower temperatures, while CO became important attemperatures higher than 1000 �C. The effect of the leaching inthis respect appeared to be minimal for both DDGS and PKC, asit had been found also in slow pyrolysis conditions.
The main nitrogen compound released appeared to be HCNat every temperature, for both DDGS and PKC. Also NH3 wasdetected from pyrolysis of DDGS but not from PKC. Thisdifference could depend on the larger iron content in the PKCsample.
HCN resulted to be the most abundant nitrogen compoundfor all the samples, in contradiction with what was found at lowheating rates. It appears that at higher heating rates, thermaldeamination is inhibited by the speed of the process, so that mostof the nitrogen is released as cyclic amines that decomposesuccessively in gaseous reactions into mainly HCN. This wouldexplain the constant increase of HCN yield with temperature astar-N decomposition becomes more important. Part of the NH3
yield might also derive from gas phase reactions but cross-linkingof proteins with reactive side groups is another likely source. Thisis supported by the presence of more than 10% of the initialnitrogen in the char of DDGS even at 1200 �C.
The effect of leaching is negligible for PKC, while it appears tohave a marked effect on the DDGS nitrogen partitioning. As itwas shown in slow pyrolysis experiments, the leached DDGSsample appears to yield more light volatiles than untreatedDDGS but also more char-N. The higher content of nitrogenin stable char structures can partly explain the higher yields ofNH3 recorded. However, the limitations in the measurementtechnique used do not allow to distinguish among two possibleeffects of the leaching: on one side it could improve tar�Ndecomposition into lighter volatiles but on the other side it couldinhibit HCN and NH3 reduction to molecular nitrogen. Furthermeasurements allowing the detection of N2 could explain thisresult better.
The data presented in this work are helpful in explaining whatwas found in combustion conditions: PKCwas found to release ahigher percentage of its initial-N as NO compared to DDGS. Inview of the results presented here, this can be explained generally
with the lower amount of volatile-N and specifically with thelower amount of ammonia and therefore the lower amount offree NHi radicals available for thermal DeNOx reactions.
’AUTHOR INFORMATION
Corresponding Author*E-mail: [email protected].
’ACKNOWLEDGMENT
The financial support by EU commission’s INECSE pro-gramme (Contract MEST-CT-2005-021018) is gratefully ac-knowledged. The support of Dr. Mahsa Motegh for the artworkswas precious.
’NOMENCLATURECp = specific heat capacity, kJ/kg 3KF = volume force, N/m3
g = gravity acceleration, m/s2
I = identity matrixJe = external current density vector, A/m2
k = thermal conductivity, W/m 3Kn = unity vector normal to the surfacep = pressure, PaQ = heat source, W/m3
Qj = current source, A/m3
T = temperature, Ku = velocity vector, m/sV = electric potential, VR = coefficient of thermal expansion, kg 3m
33K
ε = surface emissivityη = dynamic viscosity, Pa 3 sκ = dilatational viscosity, Pa 3 sF = density of the fluid, kg/m3
σ = Stefan�Boltzmann constant = 5.6707e�8, W/m23K
4
σe = electric conductivity, S/m
’REFERENCES
(1) An Energy Policy for Europe; European Commission: Brussels,2007.
(2) Biomass Action Plan; European Commission: Brussels, 2005.(3) Pels, J. R.; Kapteijn, F.; Moulijn, J. A.; Zhu, Q.; Thomas, K. M.
Evolution of nitrogen functionalities in carbonaceous materials duringpyrolysis. Carbon 1995, 33, 1641–1653.
(4) Wojtowicz, M.; Pels, J. R.; Moulijn, J. A. The fate of nitrogenfunctionalities in coal during pyrolysis and combustion. Fuel 1995,74, 507–516.
(5) Solomon, P.; Serio, M.; Suuberg, E. Coal Pyrolysis: Experiments,kinetic rates, and mechanisms. Prog. Energy Combust. Sci. 1992,18, 133–220.
(6) de Jong, W.; Di Nola, G.; Venneker, B.; Spliethoff, H.;W�ojtowicz, M. TG-FTIR pyrolysis of coal and secondary biomass fuels:Determination of pyrolysis kinetic parameters for main species and NOx
precursors. Fuel 2007, 86, 2367–2376.(7) Di Nola, G.; de Jong, W.; Spliethoff, H. The fate of main gaseous
and nitrogen species during fast heating rate devolatilization of coal andsecondary fuels using a heated wire mesh reactor. Fuel Process. Technol.2009, 90, 388–395.
(8) Di Nola, G.; de Jong, W.; Spliethoff, H. TG-FTIR characteriza-tion of coal and biomass single fuels and blends under slow heating rateconditions: Partitioning of the fuel-bound nitrogen. Fuel Process. Technol.2010, 91, 103–115.
4299 dx.doi.org/10.1021/ie101618c |Ind. Eng. Chem. Res. 2011, 50, 4286–4300
Industrial & Engineering Chemistry Research ARTICLE
(9) Giuntoli, J.; de Jong, W.; Arvelakis, S.; Spliethoff, H.; Verkooijen,A. H. M. Quantitative and kinetic TG-FTIR study of biomass residuepyrolysis: Dry distiller’s grains with solubles (DDGS) and chickenmanure. J. Anal. Appl. Pyrolysis 2009, 85, 301–312.(10) Giuntoli, J.; Arvelakis, S.; Spliethoff, H.; de Jong, W.; Verkooijen,
A. H. M. Quantitative and kinetic thermogravimetric Fourier transforminfrared (TG-FTIR) study of pyrolysis of agricultural residues: Influence ofdifferent pretreatments. Energy Fuels 2009, 23, 5695–5706.(11) Lepp€alahti, J.; Koljonen, T. Nitrogen evolution from coal, peat
and wood during gasification: Literature review. Fuel Process. Technol.1995, 43, 1–45.(12) Bassilakis, R.; Carangelo, R. M.; W�ojtowicz, M. A. TG-FTIR
analysis of biomass pyrolysis. Fuel 2001, 80, 1765–1786.(13) Hansson, K.-M.; Samuelsson, J.; Tullin, C.; Åmand, L.-E.
Formation of HNCO, HCN, and NH3 from the pyrolysis of bark andnitrogen-containing model compounds. Combust. Flame 2004, 137265–277.(14) Becidan, M.; Skreiberg, Ø.; Hustad, J. E. NOx and N2O
precursors (NH3 and HCN) in pyrolysis of biomass residues. EnergyFuels 2007, 21, 1173–1180.(15) Becidan, M.; Skreiberg, Ø.; Hustad, J. E. Products distribution
and gas release in pyrolysis of thermally thick biomass residues samples.J. Anal. Appl. Pyrolysis 2007, 78, 207–213.(16) Tortosa Masía, A.; Buhre, B.; Gupta, R.; Wall, T. Characterising
ash of biomass and waste. Fuel Process. Technol. 2007, 88, 1071–1081.(17) Vassilev, S. V.; Baxter, D.; Andersen, L. K.; Vassileva, C. G. An
overview of the chemical composition of biomass. Fuel 2010, 89, 913–933.(18) ECN Phyllis Database for Biomass and Wastes. http://www.ecn.
nl/phyllis/, 2010.(19) Mohan, D.; Pittman, C. U.; Steele, P. H. Pyrolysis of wood/
biomass for bio-oil: A critical review. Energy Fuels 2006, 20, 848–889.(20) PyNe—Pyrolysis network of IEA Bioenergy. http://www.pyne.co.
uk, 2010.(21) Arvelakis, S.; Koukios, E. G. Physicochemical upgrading of
agroresidues as feedstocks for energy production via thermochemicalconversion methods. Biomass Bioenergy 2002, 22, 331–348.(22) Arvelakis, S.; Gehrmann, H.; Beckmann, M.; Koukios, E. G.
Agglomeration problems during fluidized bed gasification of olive-oilresidue: evaluation of fractionation and leaching as pretreatments. Fuel2003, 82, 1261–1270.(23) Bartels, M.; Lin, W.; Nijenhuis, J.; Kapteijn, F.; van Ommen,
J. R. Agglomeration in fluidized beds at high temperatures: Mechanisms,detection and prevention. Prog. Energy Combust. Sci. 2008, 34, 633–666.(24) Khan, A.; de Jong, W.; Jansens, P.; Spliethoff, H. Biomass
combustion in fluidized bed boilers: Potential problems and remedies.Fuel Process. Technol. 2009, 90, 21–50.(25) Miles, T. R.; Miles, T. R., Jr.; Baxter, L. L.; Bryers, R. W.;
Jenkins, B. M.; Oden, L. L. Boiler deposits from firing biomass fuels.Biomass Bioenergy 1996, 10, 125–138.(26) Nielsen, H. P.; Frandsen, F. J.; Dam-Johansen, K.; Baxter, L. L.
The implications of chlorine-associated corrosion on the operation ofbiomass-fired boilers. Prog. Energy Combust. Sci. 2000, 26, 283–298.(27) Bryers, R. W. Fireside slagging, fouling, and high-temperature
corrosion of heat-transfer surface due to impurities in steam-raising fuels.Prog. Energy Combust. Sci. 1996, 22, 29–120.(28) Lin, W.; Dam-Johansen, K.; Frandsen, F. Agglomeration in bio-
fuel fired fluidized bed combustors. Chem. Eng. J. 2003, 96, 171–185.(29) Llorente, M. F.; Laplaza, J. M.; Cuadrado, R. E.; García, J. C.
Ash behaviour of lignocellulosic biomass in bubbling fluidised bedcombustion. Fuel 2006, 85, 1157–1165.(30) Werther, J.; Saenger, M.; Hartge, E. U.; Ogada, T.; Siagi, Z.
Combustion of agricultural residues. Prog. Energy Combust. Sci. 2000,26, 1–27.(31) Solomon, P. R.; Colket, M. B. Evolution of fuel nitrogen in coal
devolatilization. Fuel 1978, 57, 749–755.(32) Anthony, D.; Howard, J. B.; Meissner, H.; Hottel, H. Apparatus
for determining high pressure coal-hydrogen reaction kinetics underrapid heating conditions. Rev. Sci. Instrum. 1974, 45, 992–995.
(33) Hajaligol, M. R.; Howard, J. B.; Longwell, J. P.; Peters, W. A.Product compositions and kinetics for rapid pyrolysis of cellulose. Ind.Eng. Chem. Process Des. Dev. 1982, 21, 457–465.
(34) Hajaligol, M. R.; Howard, J. B.; Peters, W. A. An experimentalandmodeling study of pressure effects on tar release by rapid pyrolysis ofcellulose sheets in a screen heater. Combust. Flame 1993, 95, 47–60.
(35) Stubington, J. F.; Aiman, S. Pyrolysis kinetics of bagasse at highheating rates. Energy Fuels 1994, 8, 194–203.
(36) Drummond, A.-R. F.; Drummond, I. W. Pyrolysis of sugar canebagasse in a wire-mesh reactor. Ind. Eng. Chem. Res. 1996, 35, 12631268.
(37) de Jong,W. Dissertation, Delft University of Technology, Delft,The Netherlands, 2005.
(38) Tamboer, R. M.Sc. thesis, Delft University of Technology,Delft, The Netherlands, 2007.
(39) Bastiaans, R.; Toland, A.; Holten, A.; de Goey, L. Kinetics ofCO release from bark and medium density fibreboard pyrolysis. BiomassBioenergy 2010, 34, 771–779.
(40) L�ed�e, J. Reaction temperature of solid particles undergoing anendothermal volatilization. Application to the fast pyrolysis of biomass.Biomass Bioenergy 1994, 7, 49–60.
(41) Narayan, R.; Antal, M. Thermal lag, fusion, and the compensationeffect during biomass pyrolysis. Ind. Eng. Chem. Res. 1996, 35, 1711–1721.
(42) Kim, Y.; Mosier, N. S.; Hendrickson, R.; Ezeji, T.; Blaschek, H.;Dien, B.; Cotta, M.; Dale, B.; Ladisch, M. R. Composition of corn dry-grind ethanol by-products: DDGS, wet cake, and thin stillage. Bioresour.Technol. 2008, 99, 5165–5176.
(43) Ramachandran, S.; Singh, S. K.; Larroche, C.; Soccol, C. R.;Pandey, A. Oil cakes and their biotechnological applications—A review.Bioresour. Technol. 2007, 98, 2000–2009.
(44) Tiffany, D. G.;Morey, R. V.; De Kam,M. Economics of biomassgasification/combustion at fuel ethanol plants. Appl. Eng. Agric. 2009,25, 391–400.
(45) Razuan, R.; Chen, Q.; Zhang, X.; Sharifi, V.; Swithenbank, J.Pyrolysis and combustion of oil palm stone and palm kernel cake infixed-bed reactors. Bioresour. Technol. 2010, 101, 4622–4629.
(46) Bals, B.; Dale, B.; Balan, V. Enzymatic hydrolysis of distiller’sdry grain and solubles (DDGS) using ammonia fiber expansion pre-treatment. Energy Fuels 2006, 20, 2732–2736.
(47) Zhou, J. Ph.D. thesis, University of Hawaii, Honolulu, Hawaii,U.S.A., 1998.
(48) Becidan,M. Ph.D. thesis, Norwegian University of Science andTechnology, Trondheim, Norway, 2007.
(49) Li, J.; Wang, Z.; Yang, X.; Hu, L.; Liu, Y.; Wang, C. Evaluate thepyrolysis pathway of glycine and glycylglycine by TG-FTIR. J. Anal.Appl. Pyrolysis 2007, 80, 247–253.
(50) Li, J.; Yuwen, L.; Jingyan, S.; Zhiyong, W.; Ling, H.; Xi, Y.;Cunxin, W. The investigation of thermal decomposition pathways ofphenylalanine and tyrosine by TG-FTIR. Thermochim. Acta 2008,467, 20–29.
(51) Hansson, K.-M.; Åmand, L.-E.; Habermann, A.; Winter, F.Pyrolysis of poly-L-leucine under combustion-like conditions. Fuel 2003,82, 653–660.
(52) de Jong, W.; Pirone, A.; W�ojtowicz, M. A. Pyrolysis ofMiscanthusgiganteus and wood pellets: TG-FTIR analysis and reaction kinetics. Fuel2003, 82, 1139–1147.
(53) Lepp€alahti, J. Formation of NH3 andHCN in slow-heating-rateinert pyrolysis of peat, coal and bark. Fuel 1995, 74, 1363–1368.
(54) Li, C.-Z.; Tan, L. L. Formation of NOx and SOx precursorsduring the pyrolysis of coal and biomass. Part III. Further discussion onthe formation of HCN and NH3 during pyrolysis. Fuel 2000,79, 1899–1906.
(55) Tian, F.-J.; Yu, J.; McKenzie, L.; Hayashi, J.-i.; Li, C.-Z. Conver-sion of fuel-N into HCN and NH3 during the pyrolysis and gasification insteam: A comparative study of coal and biomass. Energy Fuels 2007,21, 517–521.
(56) Becidan, M.; Skreiberg, Ø.; Hustad, J. E. An experimental studyof nitrogen species release during municipal solid waste (MSW) and

4300 dx.doi.org/10.1021/ie101618c |Ind. Eng. Chem. Res. 2011, 50, 4286–4300
Industrial & Engineering Chemistry Research ARTICLE
biomass pyrolysis and combustion. Proceedings of the Science in Thermaland Chemical Biomass Conversion Conference; Victoria, BC, Canada;CLP Press: U.K. 2004; pp 1443�1455.(57) Prins, M. J.; Lind�en, J.; Li, Z. S.; Bastiaans, R. J. M.; van Oijen,
J. A.; Ald�en, M.; de Goey, L. P. H. Visualization of biomass pyrolysis andtemperature imaging in a heated-grid reactor. Energy Fuels 2009,23, 993–1006.(58) BK 7 schott glass, http://rmico.com/technical-notes/bk7-
quartz-ge-si, 2010.(59) Giuntoli, J.; de Jong, W.; Verkooijen, A. H. M.; Piotrowska, P.;
Zevenhoven, M.; Hupa, M. Combustion characteristics of biomassresidues and bio-wastes: Fate of fuel-N. Energy Fuels 2010, 24, 5309–5319.(60) Arvelakis, S.; Vourliotis, P.; Kakaras, E.; Koukios, E. G. Effect of
leaching on the ash behavior of wheat straw and olive residue duringfluidized bed combustion. Biomass Bioenergy 2001, 20, 459–470.(61) Arvelakis, S.; Gehrmann, H.; Beckmann, M.; Koukios, E. G.
Effect of leaching on the ash behavior of olive residue during fluidizedbed gasification. Biomass Bioenergy 2002, 22, 55–69.(62) Arvelakis, S.; Gehrmann, H.; Beckmann, M.; Koukios, E. G.
Preliminary results on the ash behavior of peach stones during fluidizedbed gasification: Evaluation of fractionation and leaching as pre-treat-ments. Biomass Bioenergy 2005, 28, 331–338.(63) Giuntoli, J. PhD Dissertation, Delft University of Technology,
Delft, The Netherlands, 2010.(64) Milne, T. A.; Evans, R. J.; Abatzoglou, N. Biomass Gasifier
“Tars”: Their Nature, Formation, and Conversion; National RenewableEnergy Laboratory (NREL): Colorado, U.S.A. 1998.(65) Guo, J. Ph.D. thesis, Eindhoven University of Technology,
Eindhoven, The Netherlands, 2004.(66) Roger, C.; Yen, S.; Ramanthan, K. Temperature variation of
total hemispherical emissivity of stainless steel AISI 304. J. Opt. Soc. Am.1979, 69, 1384–1390.(67) Bridgwater, A. V. Renewable fuels and chemicals by thermal
processing of biomass. Chem. Eng. J. 2003, 91, 87–102.(68) Becidan, M.; Skreiberg, Ø.; Hustad, J. E. Experimental study on
pyrolysis of thermally thick biomass residues samples: Intra-sampletemperature distribution and effect of sample weight (“scaling effect”).Fuel 2007, 86, 2754–2760.(69) Aiman, S.; Stubington, J. The pyrolysis kinetics of bagasse at
low heating rates. Biomass Bioenergy 1993, 5, 113–120.(70) Nunn, T. R.; Howard, J. B.; Longwell, J. P.; Peters, W. A.
Product compositions and kinetics in the rapid pyrolysis of sweet gumhardwood. Ind. Eng. Chem. Process Des. Dev. 1985, 24, 836–844.(71) Figueiredo, J.; Valenzuela, C.; Bernalte, A.; Encinar, J. Pyrolysis
of holm-oak wood: Influence of temperature and particle size. Fuel 1989,68, 1012–1016.(72) Wei, L.; Xu, S.; Zhang, L.; Zhang, H.; Liu, C.; Zhu, H.; Liu, S.
Characteristics of fast pyrolysis of biomass in a free fall reactor. FuelProcess. Technol. 2006, 87, 863–871.(73) Caballero, J. A.; Font, R.; Marcilla, A. Comparative study of the
pyrolysis of almond shells and their fractions, holocellulose and lignin.Product yields and kinetics. Thermochim. Acta 1996, 276, 57–77.(74) Scott, D. S.; Piskorz, J.; Bergougnou, M. A.; Graham, R.;
Overend, R. P. The role of temperature in the fast pyrolysis of celluloseand wood. Ind. Eng. Chem. Res. 1988, 27, 8–15.(75) Di Blasi, C.; Signorelli, G.; Di Russo, C.; Rea, G. Product
distribution from pyrolysis of wood and agricultural residues. Ind. Eng.Chem. Res. 1999, 38, 2216–2224.(76) Ratcliff, M. A.; Medley, E. E.; Simmonds, P. G. Pyrolysis of
amino acids. Mechanistic considerations. J. Org. Chem. 1974, 39, 1481–1490.(77) Simmonds, P. G.; Medley, E. E.; Ratcliff, M. A.; Shulman, G. P.
Thermal decomposition of aliphatic monoaminomonocarboxylic acids.Anal. Chem. 1972, 44, 2060–2066.(78) Sharma, R. K.; Chan, W. G.; Hajaligol, M. R. Product composi-
tions from pyrolysis of some aliphatic [alpha]-amino acids. J. Anal. Appl.Pyrolysis 2006, 75, 69–81.
(79) Sharma, R. K.; Chan,W. G.;Wang, J.;Waymack, B. E.;Wooten,J. B.; Seeman, J. I.; Hajaligol, M. R. On the role of peptides in thepyrolysis of amino acids. J. Anal. Appl. Pyrolysis 2004, 72, 153–163.
(80) Voorhees, K. J.; Zhang, W.; Hendricker, A. D.; Murugaverl, B.An investigation of the pyrolysis of oligopeptides by Curie-pointpyrolysis�tandemmass spectrometry. J. Anal. Appl. Pyrolysis 1994,30, 1–16.
(81) Rodante, F.; Marrosu, G.; Catalani, G. Thermal analysis ofsome alpha-amino acids with similar structures. Thermochim. Acta 1992,194, 197–213.
(82) Hansson, K.-M.; Samuelsson, J.; Åmand, L.-E.; Tullin, C. Thetemperature’s influence on the selectivity between HNCO and HCNfrom pyrolysis of 2,5-diketopiperazine and 2-pyridone. Fuel 2003,82, 2163–2172.
(83) Pelka, R.; Moszy�nska, I.; Arabczyk, W. Catalytic ammoniadecomposition over Fe/Fe4N. Catal. Lett. 2009, 128, 72–76.
(84) Johnson, W. R.; Kan, J. C. Mechanisms of hydrogen cyanideformation from the pyrolysis of amino acids and related compounds.J. Org. Chem. 1971, 36, 189–192.