Chapter 14libvolume8.xyz/textile/btech/semester7/financialmanagement/cash... · Chapter 14...
74
© Tata McGraw-Hill Publishing Company Limited, Financial Management 14-1 Chapter 14 Management of Cash And Marketable Securities
Transcript of Chapter 14libvolume8.xyz/textile/btech/semester7/financialmanagement/cash... · Chapter 14...
© Tata McGraw-Hill Publishing Company Limited, Financial Management 14-1
Chapter 14
Management of Cash And
Marketable Securities

© Tata McGraw-Hill Publishing Company Limited, Financial Management 14-2
Management of Cash And Marketable
Securities
Motives for Holding Cash
Objectives of Cash Management
Factors Determining Cash Needs
Determining Cash Needs
Cash Management: Basic Strategies
Cash Management Techniques/Processes
Marketable Securities
Solved Problem
Mini Case

© Tata McGraw-Hill Publishing Company Limited, Financial Management 14-3
Cash
Cash is the ready currency to which all liquid assets
can be reduced.
Near Cash
Near cash implies marketable securities viewed the
same way as cash because of their high liquidity.
Marketable Securities
Marketable securities are short-term interest earning
money market instruments used by firms to obtain a
return on temporarily idle funds.
© Tata McGraw-Hill Publishing Company Limited, Financial Management 14-4
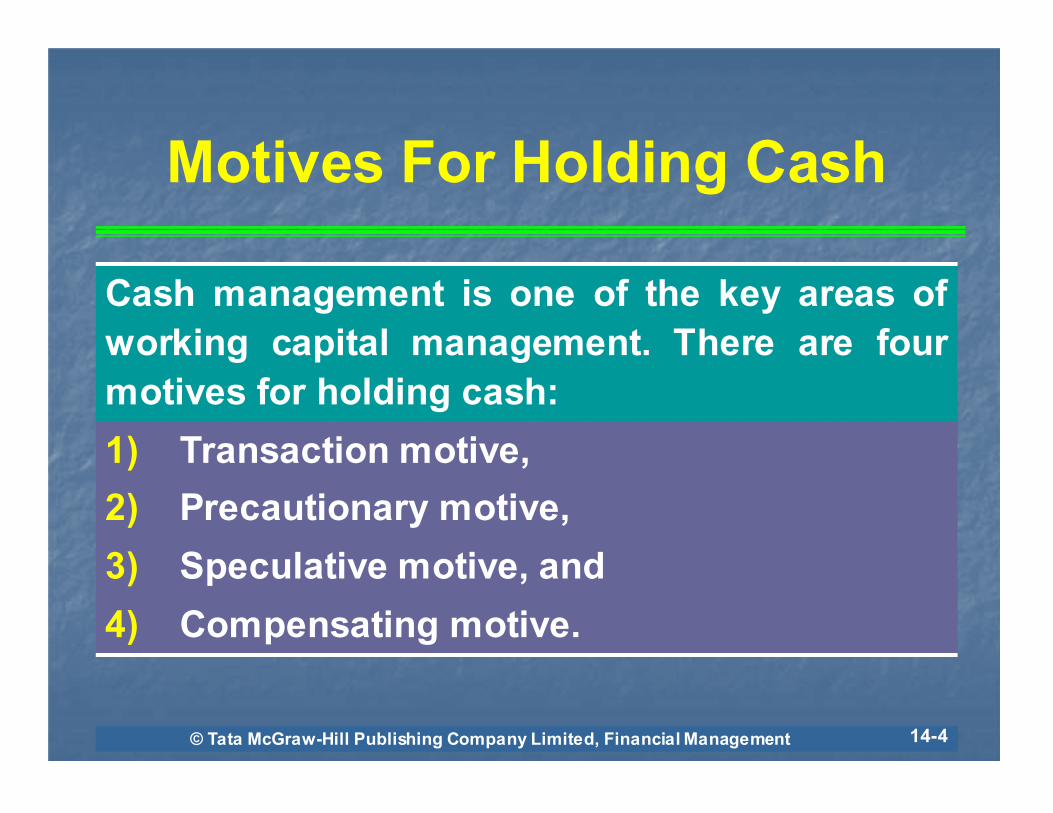
Motives For Holding Cash
Cash management is one of the key areas of
working capital management. There are four
motives for holding cash:
1) Transaction motive,
2) Precautionary motive,
3) Speculative motive, and
4) Compensating motive.
© Tata McGraw-Hill Publishing Company Limited, Financial Management 14-5
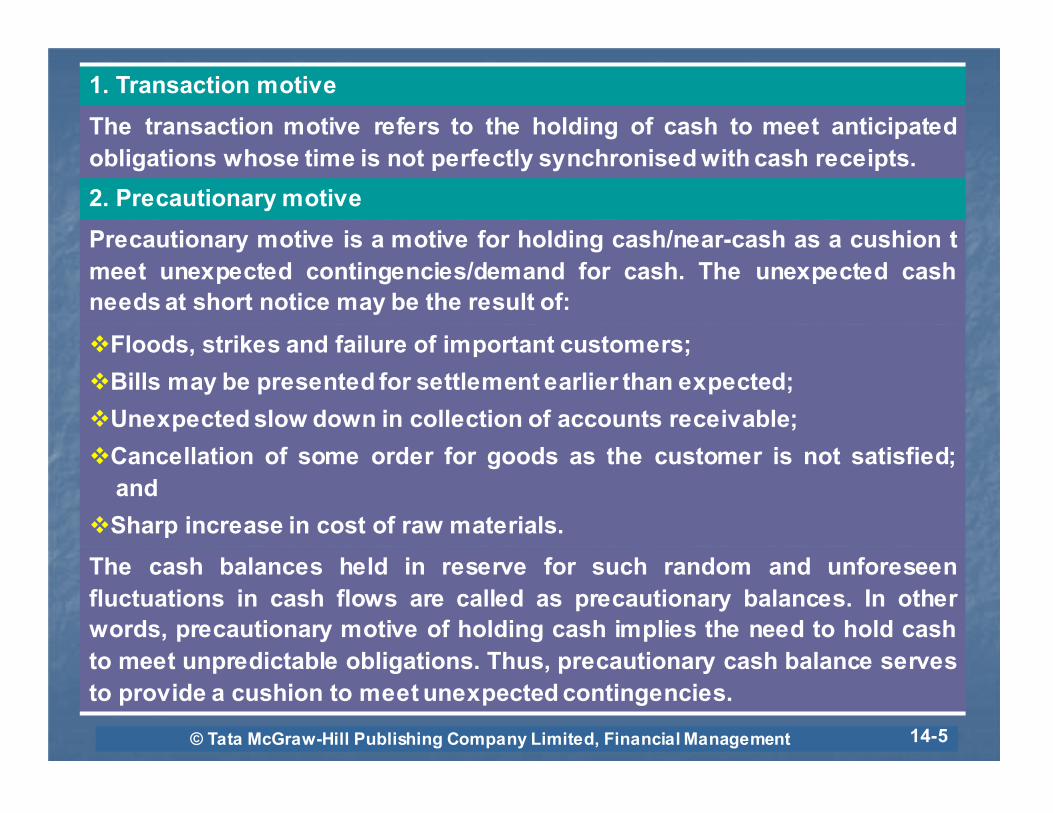
1. Transaction motive
The transaction motive refers to the holding of cash to meet anticipated
obligations whose time is not perfectly synchronised with cash receipts.
2. Precautionary motive
Precautionary motive is a motive for holding cash/near-cash as a cushion t
meet unexpected contingencies/demand for cash. The unexpected cash
needs at short notice may be the result of:
�Floods, strikes and failure of important customers;
�Bills may be presented for settlement earlier than expected;
�Unexpected slow down in collection of accounts receivable;
�Cancellation of some order for goods as the customer is not satisfied;
and
�Sharp increase in cost of raw materials.
The cash balances held in reserve for such random and unforeseen
fluctuations in cash flows are called as precautionary balances. In other
words, precautionary motive of holding cash implies the need to hold cash
to meet unpredictable obligations. Thus, precautionary cash balance serves
to provide a cushion to meet unexpected contingencies.

© Tata McGraw-Hill Publishing Company Limited, Financial Management 14-6
3. Speculative motive
Speculative motive is a motive for holding cash/near-
cash to quickly take advantage of opportunities
typically outside the normal course of business.
4. Compensating motive
Compensating motive is a motive for holding
cash/near-cash to compensate banks for providing
certain services or loans.

© Tata McGraw-Hill Publishing Company Limited, Financial Management 14-7
Objectives of Cash Management
The basic objectives of cash management are
two-fold:
(a) to meet the cash disbursement needs
(payment schedule)
(b) to minimise funds committed to cash
balances.
© Tata McGraw-Hill Publishing Company Limited, Financial Management 14-8
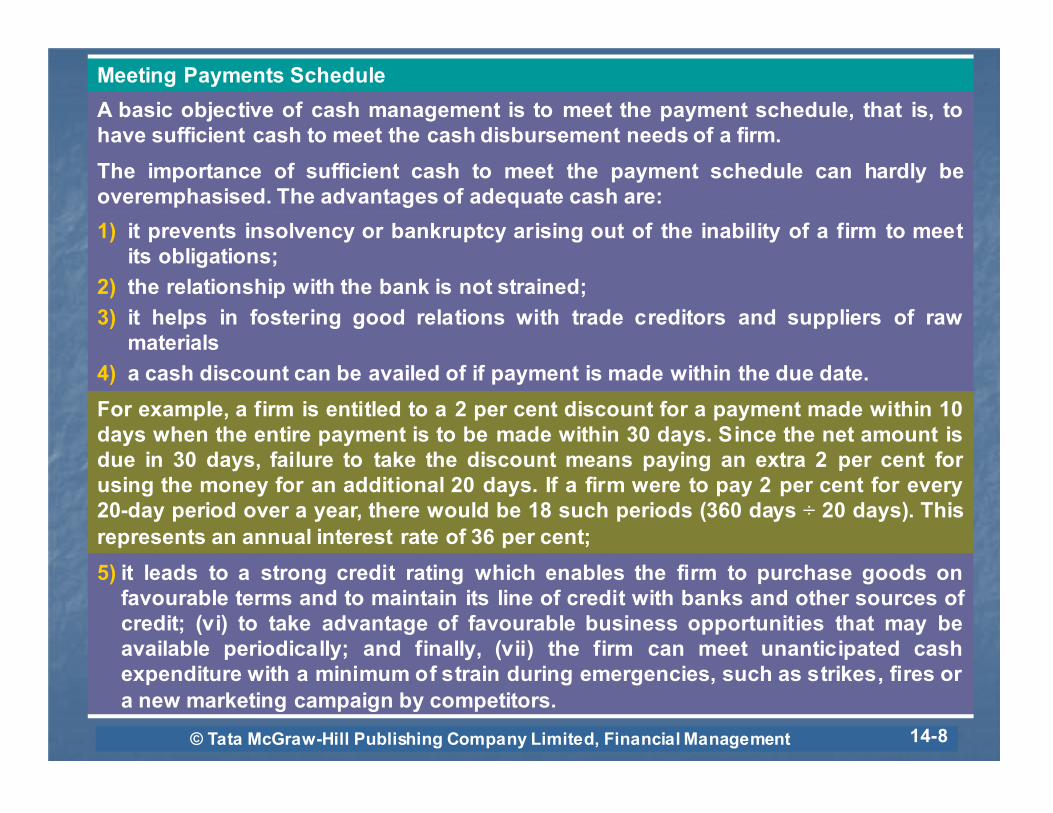
Meeting Payments Schedule
A basic objective of cash management is to meet the payment schedule, that is, to
have sufficient cash to meet the cash disbursement needs of a firm.
The importance of sufficient cash to meet the payment schedule can hardly be
overemphasised. The advantages of adequate cash are:
1) it prevents insolvency or bankruptcy arising out of the inability of a firm to meet
its obligations;
2) the relationship with the bank is not strained;
3) it helps in fostering good relations with trade creditors and suppliers of raw
materials
4) a cash discount can be availed of if payment is made within the due date.
For example, a firm is entitled to a 2 per cent discount for a payment made within 10
days when the entire payment is to be made within 30 days. Since the net amount is
due in 30 days, failure to take the discount means paying an extra 2 per cent for
using the money for an additional 20 days. If a firm were to pay 2 per cent for every
20-day period over a year, there would be 18 such periods (360 days ÷ 20 days). This
represents an annual interest rate of 36 per cent;
5) it leads to a strong credit rating which enables the firm to purchase goods on
favourable terms and to maintain its line of credit with banks and other sources of
credit; (vi) to take advantage of favourable business opportunities that may be
available periodically; and finally, (vii) the firm can meet unanticipated cash
expenditure with a minimum of strain during emergencies, such as strikes, fires or
a new marketing campaign by competitors.

© Tata McGraw-Hill Publishing Company Limited, Financial Management 14-9
Minimising Funds Committed to Cash Balances
The second objective of cash management is to minimise cash
balances. In minimising the cash balances, two conflicting aspects
have to be reconciled. A high level of cash balances will, as shown
above, ensure prompt payment together with all the advantages. But
it also implies that large funds will remain idle, as cash is a non-
earning asset and the firm will have to forego profits. A low level of
cash balances, on the other hand, may mean failure to meet the
payment schedule. The aim of cash management, therefore, should
be to have an optimal amount of cash balances.

© Tata McGraw-Hill Publishing Company Limited, Financial Management 14-10
Factors Determining Cash Needs
The factors that determine the required cash balances are:
(1) Synchronisation of cash flows
The need for maintaining cash balances arises from the non-
synchronisation of the inflows and outflows of cash: if the receipts
and payments of cash perfectly coincide or balance each other, there
would be no need for cash balances. The first consideration in
determining the cash need is, therefore, the extent of non-
synchronisation of cash receipts and disbursements. For this
purpose, the inflows and outflows have to be forecast over a period
of time, depending upon the planning horizon which is typically a
one-year period with each of the 12 months being a subperiod. The
technique adopted is a cash budget.

© Tata McGraw-Hill Publishing Company Limited, Financial Management 14-11
Short Costs
Another general factor to be considered in determining cash needs is the
cost associated with a shortfall in the cash needs. Included in the short
costs are the following:
(1) Transaction costs associated with raising cash to tide over the shortage.
This is usually the brokerage incurred in relation to the sale of some
short-term near-cash assets such as marketable securities.
(2) Borrowing costs associated with borrowing to cover the shortage. These
include items such as interest on loan, commitment charges and other
expenses relating to the loan.
(3) Loss of cash-discount, that is, a substantial loss because of a temporary
shortage of cash.
(4) Cost associated with deterioration of the credit rating which is reflected
in higher bank charges on loans, stoppage of supplies, demands for
cash payment, refusal to sell, loss of image and the attendant decline in
sales and profits.
(5) Penalty rates by banks to meet a shortfall in compensating balances.

© Tata McGraw-Hill Publishing Company Limited, Financial Management 14-12
Excess Cash Balance Costs
The cost of having excessively large cash balances is known as the excess cash balance cost. If large funds are idle, the implication is that the firm has
missed opportunities to invest those funds and has thereby lost interest which it would otherwise have earned. This loss of interest is primarily the
excess cost.
Procurement and Management
These are the costs associated with establishing and operating cash management staff and activities. They are generally fixed and are mainly
accounted for by salary, storage, handling of securi-ties, and so on.
Uncertainty and Cash Management
Finally, the impact of uncertainty on cash management strategy is also relevant as cash flows cannot be predicted with complete accuracy. The
first requirement is a precautionary cushion to cope with irregularities in cash flows, unexpected delays in collections and disbursements, defaults
and unexpected cash needs.
The impact of uncertainty on cash management can, however, be mitigated through (i) improved forecasting of tax payments, capital expenditure,
dividends, and so on; and (ii) increased ability to borrow through overdraft facility.

© Tata McGraw-Hill Publishing Company Limited, Financial Management 14-13
Determining Cash Need
There are two approaches to derive an optimal cash
balance, namely,
a) minimising cost cash models and
b) cash budget.
Cash Management/Conversion Models
1) Baumol Model,
2) Miller-Orr Model and
3) Orgler’s Model.

© Tata McGraw-Hill Publishing Company Limited, Financial Management 14-14
Baumol Model
Baumol Model is a model that provides for cost efficient transactional balances and assumes that the demand for cash can be predicted with
certainly and determines the optimal conversion size/lot.
The focus of Baumol model is to minimise the total cost associated with cash management comprising total conversion costs (that is, costs
incurred each time marketable securities are converted into cash) and the opportunity cost of keeping idle cash balances which otherwise could have
been invested in marketable securities.
The total cost associated with cash management, according to this model, has two elements:
(i) cost of converting marketable securities into cash and
(ii) the lost opportunity cost.
The conversion costs are incurred each time marketable securities are converted into cash. Symbolically,
.conversion each at sold securities marketable of value C
period, the for needs cash ntransactio total T
n,transactio the of size the of tindependen be to assumed conversion per cost b Where
(1)C
Tbperiod per cost conversion Total
====
====
====
====
© Tata McGraw-Hill Publishing Company Limited, Financial Management 14-15
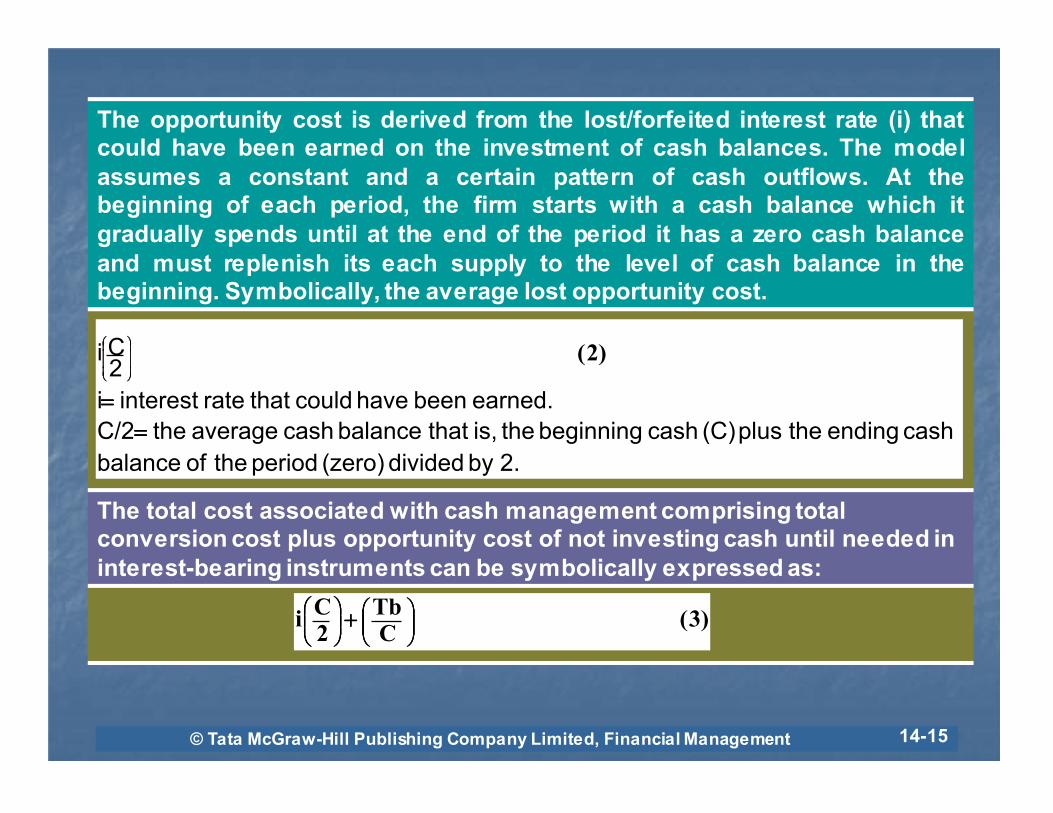
The opportunity cost is derived from the lost/forfeited interest rate (i) that could have been earned on the investment of cash balances. The model
assumes a constant and a certain pattern of cash outflows. At the beginning of each period, the firm starts with a cash balance which it
gradually spends until at the end of the period it has a zero cash balance
and must replenish its each supply to the level of cash balance in the beginning. Symbolically, the average lost opportunity cost.
The total cost associated with cash management comprising total conversion cost plus opportunity cost of not investing cash until needed in
interest-bearing instruments can be symbolically expressed as:
2.by divided (zero) period the of balance
cash ending the plus (C) cash beginning the is, that balance cash average the C/2
earned. been have could that rate interest i
2Ci
========
)2(
)3(CTb
2Ci
++++

© Tata McGraw-Hill Publishing Company Limited, Financial Management 14-16
To minimise the cost, therefore, the model attempts to determine the
optimal conversion amount, that is, the cash withdrawal which costs the
least. The reason is that a firm should not keep the total beginning cash
balance during the entire period as it is not needed at the beginning of the
period. Symbolically, the optimal conversion amount (C),
The model in terms of of Eq. 4 has important implications. First, as the total
cash needs for transaction rises because of expansion/diversification, the
optimal withdrawal increases less than proportionately. This is the result of
economy of scale in cash management. Secondly, as the opportunity
interest rate (i) increases, the optimal cash withdrawal decreases. This is so
because as (i) increases it is more costly to forfeit the investment
opportunity and financial managers want to keep as much cash invested in
securities for as long as possible.
)4(ibt2
C====

© Tata McGraw-Hill Publishing Company Limited, Financial Management 14-17
Example 1
The ABC Ltd requires Rs 30 lakh in cash to meet its transaction needs during the next three-month cash planning period. It holds marketable
securities of an equal amount. The annual yield on these marketable securities is 20 per cent. The conversion of these securities into cash entails
a fixed cost of Rs 3,000 per transaction. Using Baumol model, compute the
amount of marketable securities converted into cash per order. Assuming ABC Ltd can sell its marketable securities in any of the five lot sizes: Rs
1,50,000, 3,00,000, 6,00,000, 7,50,000 and 15,00,000, prepare a table indicating the economic lot size using numerical analysis.
Solution
where C = optimal conversion amount/amount of marketable securities converted into cash per order; b = cost of conversion into cash per
lot/transaction; T = projected cash requirement during the planning period; i = interest rate earned per planning period on investment in marketable
securities
,i
2bTC ====
5%20%/4 yield@Annual6,00,000Rs0.05
30,00,000Rs3,000Rs2@
========××××××××
====

© Tata McGraw-Hill Publishing Company Limited, Financial Management 14-18
TABLE 1 Optimal Cash Conversion Size/Lot
1. Total cash requirement (Rs lakh) 30 30 30 30 30
2. Lot size (Rs lakh) 1.5 3 6 7.5 15
3. Number of lots (1 ÷ 2) 20 10 5 4 2
4. Conversion cost per lot (Rs
thousand)
3 3 3 3 3
5. Total conversion cost (3 × 4) (Rs
thousand)
60 30 15 12 6
6. Average lot size (Rs lakh) 0.75 1.5 3 3.75 7.5
7. Interest cost (6 × 0.05) (Rs) 3,750 7,500 15,000 18,750 37,500
8. Total cost (5 + 7) (Rs) 63,750 37,500 30,000 30,750 42,500
The optimal cash conversion size is Rs 6 lakh.

© Tata McGraw-Hill Publishing Company Limited, Financial Management 14-19
Working Notes
1) Number of conversion during the planning period = (Total cash
requirement (Rs 30 lakh) / Cash conversion lot/size).
2) Average cash balance = Cash conversion size/2.
3) Interest income foregone = Average cash balance × interest rate
for the cash planning period; interest rate = annual yield/4.
4) Cost of cash conversion = Number of conversions × cost per
conversion.
5) Total cost of converting and holding cash = Interest income
foregone + Cost of cash conversion.

© Tata McGraw-Hill Publishing Company Limited, Financial Management 14-20
Example 2
The management of Popular Traders anticipates Rs 15 lakh in cash outlays
(demand) during the next year. The recent experience has been that it costs
Rs 30 to convert marketable securities to cash and vice versa. The
marketable securities currently earns 8 per cent annual return. Find the total
cost of managing cash according to Banmol model.
Solution
Number of conversions = Rs 15,00,000 ÷ Rs 33,541 = 45
Average cash balance = Rs 16,770.50 (Rs 33,541 ÷ 2)
Total cost = (Rs 30 × 45) + (0.08 × Rs 16,770.50) = Rs 2,692
541,33Rs08.0
15,00,000Rs30Rs2size/lot conversion ptimalEconomic/o ====
××××××××====

© Tata McGraw-Hill Publishing Company Limited, Financial Management 14-21
Miller-Orr Model
Miller-Orr Model is a model that provides for cost-efficient transactional balances and assumes uncertain cash flows and determines an upper limit
and return point for cash balances.
The objective of Miller-Orr Model is to determine the optimum cash balance level which minimises the cost of cash management.
where b = the fixed cost per conversion, E (M) = the expected average daily cash balance, E (N) = the expected number of conversions, t = the number of
days in the period, i = the lost opportunity costs, and C = total cash management costs
According to the MO Model, as in Baumol model, the optimal cash balance (z) can be expressed symbolically as
balances. cash in changesdaily the of variance the 2 r where
(6)4i
23brz
====
====
(((( )))) (((( )))) )5(MiEtNbE
C ++++====

© Tata McGraw-Hill Publishing Company Limited, Financial Management 14-22
Thus, as in Baumol Model, there are economies of scale in cash
management and the two basic costs of conversion and lost interest
that have to be minimised.
MO Model also specifies the optimum upper boundary (b) as three
times the optimal cash balance level such that
b = 3z (7)
Further, the financial manager could consider the use of less liquid,
potentially more profitable securities as investments for the cash
balances in excess of h.

© Tata McGraw-Hill Publishing Company Limited, Financial Management 14-23
Example 3
Assuming for Popular Traders in Example 2 that variance of daily net
cash flows is estimated to be Rs 27,000, show the cash balances as
per Miller-Orr model.
Solution
@daily portfolio return = (8% ÷ 360 days)
upper limit = 3 × Rs 1,399 = Rs 4,197
The cash balance of Popular Traders would be allowed to vary
between Re 0 (zero) and Rs 4,197. When the upper limit is reached,
Rs 2,798 (Rs 4,197 – Rs 1,399) is converted from cash to marketable
securities that will earn interest. When the cash balance falls to zero,
Rs 1,399 (Rs 1,399 – Re 0) is converted from marketable securities
into cash.
399,1Rs@
000222.04
27,000Rs30Rs3point Return ====
××××
××××××××====

© Tata McGraw-Hill Publishing Company Limited, Financial Management 14-24
Orgler’s Model
According to this model, an optimal cash management strategy can be determined through the use of a multiple linear programming model. The construction of the model comprises three sections:
1) selection of the appropriate planning horizon,
2) selection of the appropriate decision variables and
3) formulation of the cash management strategy itself.
The advantage of linear programming model is that it enables coordination of the optimal cash management strategy with the other operations of the firm such as production and with less restrictions on working capital balances.
The model basically uses one year planning horizon with twelve monthly periods because of its simplicity. It has four basic sets of decisions variables which influence cash management of a firm and which must be incorporated into the linear programming model of the firm. These are:
1) payment schedule,
2) short-term financing,
3) purchase and sale of marketable securities and
4) cash balance itself.
The formulation of the model requires that the financial managers first specify an objective function and then specify a set of constraints.
Orgler ’s objective function is to ‘minimise the horizon value of the net revenues from the cash budget over the entire planning period’. The constraints of the model could be
1) Institutional or
2) Policy-constraints.

© Tata McGraw-Hill Publishing Company Limited, Financial Management 14-25
An example of the linear programming model is as follows:
Objective function:
Maximise profit = a1x1 + a2x2 (8)
Subject to:
b1x1 ≤ production
b2x2 ≤ constraints (9)
C1x1 + C2x2 ≤ Cash available constraint (10)
81x1 + 82x2 > Current assets requirement constraint (11)
xi ≥ Oi = 1, n non-negativity constraint
A very important feature of the model is that it allows the financial
managers to integrate cash management with production and other
aspects of the firm.

© Tata McGraw-Hill Publishing Company Limited, Financial Management 14-26
Cash Budget: Management Tool
Cash budget is a statement of the inflows and outflows of cash that is
used to estimate its short-tern requirements.
A firm is well advised to hold adequate cash balances but should avoid
excessive balances. The firm has, therefore, to assess its need for cash
properly. The cash budget is probably the most important tool in cash
management. It is a device to help a firm to plan and control the use of
cash. It is a statement showing the estimated cash inflows and cash outflows over the planning horizon. The various purposes of cash
budgets are:
1) to coordinate the timings of cash needs.
2) it pinpoints the period(s) when there is likely to be excess cash;
3) it enables a firm which has sufficient cash to take advantage of cash
discounts on its accounts payable, to pay obligations when due, to
formulate dividend policy, to plan financing of capital expansion and
to help unify the production schedule during the year so that the firm can smooth out costly seasonal fluctuations; finally,
4) it helps to arrange needed funds on the most favourable terms and
prevents the accumulation of excess funds.

© Tata McGraw-Hill Publishing Company Limited, Financial Management 14-27
Elements/Preparation of Cash Budget
The first element of a cash budget is the selection of the period of time to be
covered by the budget. It is referred to as the planning horizon. The planning
horizon means the time span and the sub-periods within that time span over
which the cash flows are to be projected.
The planning horizon of a cash budget should be determined in the light of the
circumstances and requirements of a particular case. For instance, if the flows
are expected to be stable and dependable, such a firm may prepare a cash
budget covering a long period, say, a year and divide it into quarterly intervals. In
the case of a firm whose flows are uncertain, a quarterly budget, divided into
monthly intervals, may be appropriate. Where flows are affected by seasonal
variations, monthly budgets, sub-divided on a weekly or even a daily basis, may
be necessary. If the flows are subject to extreme fluctuations, even a daily budget
may be called for. The idea behind subdividing the budgeting period into smaller
intervals is to highlight the movement of cash from one subperiod to another.
The second element of the cash budget is the selection of the factors that have a
bearing on cash flows. The items included in the cash budget are only cash
items; non-cash items such as depreciation and amortisation are excluded.10
The factors that generate cash flows are generally divided, for purposes of the
construction of cash budget, into two broad categories:
a) Operating, and
b) Financial.

© Tata McGraw-Hill Publishing Company Limited, Financial Management 14-28
Operating Cash Flows
The main operating factors/items which generate cash outflows and
inflows over the time span of a cash budget are tabulated in Exhibit
1.
EXHIBIT 1 Operating Cash Flow Items
Inflows/Cash Receipts Outflows/Disbursements
1. Cash sales 1. Accounts payable/Payable payments
2. Collection of accounts receivable
2. Purchase of raw materials
3. Disposal of fixed assets 3. Wages and salary (payroll)
4. Factory expenses
5. Administrative and selling expenses
6. Maintenance expenses
7. Purchase of fixed assets

© Tata McGraw-Hill Publishing Company Limited, Financial Management 14-29
Example 4
A firm sells goods on credit and allows a cash discount for payments made within
20 days. If the discount is not availed of, the buyer must pay the full amount in 40
days. However, the firm finds that some of its customers delay payments up to 90
days. The experience has been that on 20 per cent of sales, payment is made
during the month in which the sale is made, on 70 per cent of the sales payment is
made during the second month after sale and on 10 per cent of sales payment is
made during the third month.
The raw materials and other supplies required for production amount to 70 per cent
of sales and are bought in the month before the firm expects to sell its finished
products. Its purchase terms allow the firm to delay payment on its purchases for
one month.
The credit sales of the firm are: (Rs lakh)
May 10 August 30 November 20
June 10 September 40 December 10
July 20 October 20 January 10
Prepare a worksheet, showing the anticipated cash inflows on account of
collection of receivables and disbursement of payables.
Solution The expected cash inflows through collection of receivables and the
anticipated outflows on account of accounts payable are presented in Table 2 in
the form of a worksheet.

© Tata McGraw-Hill Publishing Company Limited, Financial Management 14-30
TABLE 2 Work-Sheet (Rs lakh)
May June July Aug. Sept Oct. Nov. Dec Jan.
1 Credit sales
2. Collections:
During month of sale
(20%)
During the first month
after sale (70%)
During second month
after sale (10%)
10
2
—
—
10
2
7
—
20
4
7
1
30
6
14
1
40
8
21
2
20
4
28
3
20
4
14
4
10
2
14
2
10
2
7
2
Total collections 2 9 12 21 31 35 22 18 11
3. Credit purchases (70% of
next month’s sale) 7 14 21 28 14 14 7 7 7
Payment (one month lag) — 7 14 21 28 14 14 7 7
Total payments — 7 14 21 28 14 14 7 7
Financial Cash Flows
The major financial factors/items affecting the generation of cash flows are depicted in
Exhibit 2.

© Tata McGraw-Hill Publishing Company Limited, Financial Management 14-31
EXHIBIT 2 Financial Cash Flow Items
Cash Inflows/Receipts Cash Outflows/Payments
1. Loans/Borrowings 1. Income-tax/Tax payments
2. Sales of securities 2. Redemption of loan
3. Interest received 3. Repurchase of shares
4. Dividend received 4. Interest paid
5. Rent received 5. Dividends paid
6. Refund of tax
7. Issue of new shares and securities
Preparation of Cash Budget
After the time span of the cash budget has been decided and pertinent
operating and financial factors have been identified, the final step is the
construction of the cash budget. The preparation of a cash budget is illustrated
in Examples 5 and 6.

© Tata McGraw-Hill Publishing Company Limited, Financial Management 14-32
Example 5
A firm adopts a six-monthly time span, subdivided into monthly intervals for its
cash budget.
(A) The following information is available in respect of its operations:
(Rs lakh)
Particulars Months
1 2 3 4 5 6
1. Sales 40 50 60 60 60 60
2. Purchases 1 1.50 2 2 2 1
3. Direct labour 6 7 8 8 8 6
4. Manufacturing
overheads
13 13.50 14 14 14 13
5. Administrative expenses 2 2 2 2 2 2
6. Distribution expenses 2 3 4 4 4 2
7. Raw materials (30 days credit) 14 15 16 16 16 15

© Tata McGraw-Hill Publishing Company Limited, Financial Management 14-33
(B) Assume the following financial flows during the period:
(a) Inflows:
1. Interest received in month 1 and month 6, Rs 1 lakh each;
2. Dividend received during months 3 and 6, Rs 2 lakh each;
3. Sales of shares in month 6, Rs 160 lakh.
(b) Outflows:
1. Interest paid during month 1, Rs 0.4 lakh;
2. Dividends paid during months 1 and 4, Rs 2 lakh each;
3. Instalment payment on machine in month 6, Rs 20 lakh;
4. Repayment of loan in month 6, Rs.80 lakhs.
(c) Assume that 10 per cent of each month’s sales are for cash; the balance 90 per cent are on credit. The terms and credit experience of the firm are:
1. No cash discount;
2. 1 per cent of credit sales is returned by the customers;
3. 1 per cent of total accounts receivable is bad debt;
4. 50 per cent of all accounts that are going to pay, do so within 30 days;
5. 100 per cent of all accounts that are going to pay, do so within 60 days.
Using the above information prepare a cash budget.
Solution The cash budget is constructed in Table 3.

© Tata McGraw-Hill Publishing Company Limited, Financial Management 14-34
TABLE 3 Cash Budget for Six Months (Rs lakh)
Particulars Months
1 2 3 4 5 6
(A) Cash inflows:
1.Cash sales (10% of total)
2.Receivables collection
3.Interest received
4.Dividends received
5.Sale of shares
4.00
—
1.00
—
—
5.00
17.64
—
—
—
6.00
39.68
—
2.00
—
6.00
48.50
—
—
—
6.00
52.92
—
—
—
6.00
52.92
1.00
2.00
160.00
Total (A) 5.00 22.64 47.68 54.50 58.92 221.92
(B) Cash outflows:
1.Purchases
2.Labour
3.Manufacturing overheads
4.Administrative expenses
5.Distribution charges
6.Raw materials (30 days credit)
7.Interest paid
8.Dividend paid
9.Instalment of machine
10.Repayment of loan
1.00
6.00
13.00
2.00
2.00
—
0.40
2.00
—
—
1.50
7.00
13.50
2.00
3.00
14.00
—
—
—
—
2.00
8.00
14.00
2.00
4.00
15.00
—
—
—
—
2.00
8.00
14.00
2.00
4.00
16.00
—
2.00
—
—
2.00
8.00
14.00
2.00
4.00
16.00
—
—
—
—
1.00
6.00
13.00
2.00
2.00
16.00
—
—
20.00
80.00
Total (B) 26.40 41.00 45.00 48.00 46.00 140.00
(C) Net Receipt or (Payment) (A – B) (21.40) (18.36) 2.68 6.50 12.92 81.92

© Tata McGraw-Hill Publishing Company Limited, Financial Management 14-35
Example 6 The following information is available in respect of a firm:
(A) Balance Sheet as on March 31
Liabilities Amount Assets Amount
Accrued salaries Rs 500 Cash Rs 3,000
Other liabilities 2,500 Inventory* 8,000
Capital 65,000 Other assets Rs 70,000
______ Less: Depreciation 13,000 57,000
68,000 68,000
*Consists of Rs 2,000 minimum inventory plus Rs 6,000 of inventory scheduled to be sold next
month.
(B) Sales Forecast
April Rs 10,000 July Rs 50,000
May 20,000 August 40,000
June 30,000 September 20,000
October 5,000
(C) Salary Expenses Budget
April Rs 1,500 July Rs 4,000
May 2,000 August 3,000
June 2,500 September 2,000

© Tata McGraw-Hill Publishing Company Limited, Financial Management 14-36
(D) The firm is expected to operate on the following lines:
� Other expenses approximate 12 per cent of sales (paid in the same month).
� Sales will be 80 per cent cash and 20 per cent credit. The all credit sales
will be collected in the following month and no bad debts are expected.
� All inventory purchases will be paid for during the month in which they are made.
� A basic inventory of Rs 2,000 (at cost) will be maintained. The firm will
follow a policy of purchasing additional inventory each month to cover the following month’s sale.
� A minimum cash balance of Rs 3,000 will be maintained.
� New orders for equipment amounting to Rs 20,000 scheduled for May 1
delivery and Rs 10,000 for June 1 delivery have been made. Payment will be made at the time of delivery.
� Accrued salaries and other liabilities will remain unchanged.
� Gross profit margin is 40 per cent of sales.
Prepare a cash budget for 6 months (April to September). Borrowings are made in thousands of rupees. Ignore interest.

© Tata McGraw-Hill Publishing Company Limited, Financial Management 14-37
Solution
TABLE 4 Cash Budget (Amount in ’000 rupees)
Particular April May June July Aug. Sept
.
(A) Cash inflows:
1.Cash sales (0.80) 8 16 24 40 32 16
2.Accounts receivable collections (0.2) — 2 4 6 10 8
Total 8 18 28 46 42 24
(B) Cash outflows:
1.Inventory 12 18 30 24 12 3
2.Salary 1.5 2 2.5 4 3 2
3.Expenses 1.2 2.4 3.6 6 4.8 2.4
4.Equipment — 20 10 — — —
Total 14.7 42.4 46.1 34 19.8 7.4
(C) Net monthly cash gain or loss
by end of month (A – B) (6.7) (24.4) (18.1) 12 22.2 16.6
Cumulative cash gain or loss by end of
month
(6.7) (31.1) (49.2) (37.2
)
(15) 1.6
Cumulative borrowing (month-end) 7 32 50 38 15 —
© Tata McGraw-Hill Publishing Company Limited, Financial Management 14-38
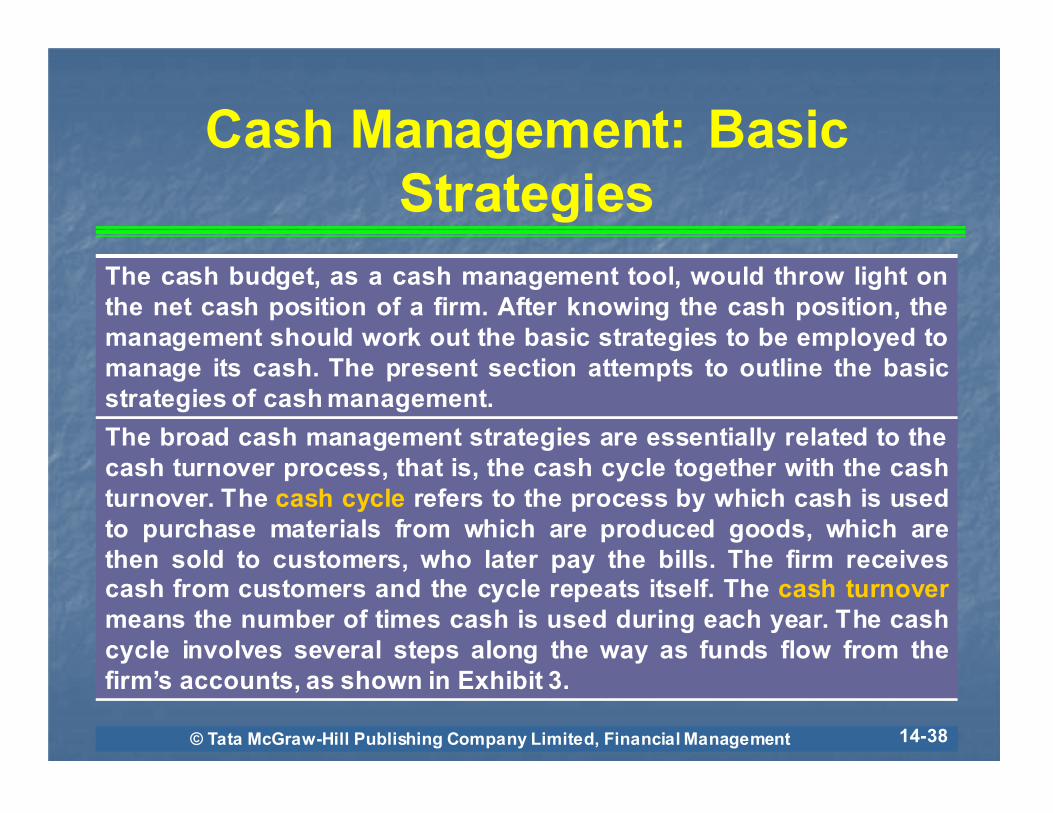
Cash Management: Basic
Strategies
The cash budget, as a cash management tool, would throw light on
the net cash position of a firm. After knowing the cash position, the
management should work out the basic strategies to be employed to
manage its cash. The present section attempts to outline the basic
strategies of cash management.
The broad cash management strategies are essentially related to the
cash turnover process, that is, the cash cycle together with the cash
turnover. The cash cycle refers to the process by which cash is used
to purchase materials from which are produced goods, which are
then sold to customers, who later pay the bills. The firm receives cash from customers and the cycle repeats itself. The cash turnover
means the number of times cash is used during each year. The cash
cycle involves several steps along the way as funds flow from the
firm’s accounts, as shown in Exhibit 3.

© Tata McGraw-Hill Publishing Company Limited, Financial Management 14-39
EXHIBIT 3 Details of Cash Cycle
A B C D E F G H I
A = Materials ordered; B = Materials received;
C = Payments; D = Cheque clearance; E = Goods sold;
F = Customer mails payments; G = Payment received;
H = Cheques deposited; I = Funds collected
In addressing the issue of cash management strategies, we are concerned with
the time periods involved in stages B, C, D, and F, G, H, I. A firm has no control
over the time involved between stages A and B. The lag between D and E is
determined by the production process and inventory policy. The time period
between stages E and F is determined by credit terms and the payments policy
of customers.

© Tata McGraw-Hill Publishing Company Limited, Financial Management 14-40
Example 7
A firm which purchases raw materials on credit is required by the credit terms to make payments within 30 days. On its side, the firm allows its credit
buyers to pay within 60 days. Its experience has been that it takes, on an average, 35 days to pay its accounts payable and 70 days to collect its
accounts receivable. Moreover, 85 days elapse between the purchase of raw
materials and the sale of finished goods, that is to say, the average age of inventory is 85 days. What is the firm’s cash cycle? Also, estimate the cash
turnover.
Solution
The cash cycle of the firm can be calculated by finding the average number of days that elapse between the cash outflows associated with paying
accounts payable and the cash inflows associated with collecting accounts receivable:
(i) Cash cycle = 85 days + 70 days – 35 days = 120 days
(ii) Cash turnover = the assumed number of days in a year divided by the
cash cycle = 365/120 = 3

© Tata McGraw-Hill Publishing Company Limited, Financial Management 14-41
Minimum Operating Cash
Minimum operating cash is the level of opening cash balance at which
a firm would meet all obligations and is computed by dividing total
annual outlays by the cash turnover.
Cash management strategies are intended to minimise the operating
cash balance requirement. The basic strategies that can be employed
to do the needful are as follows:
a) Stretching Accounts Payable,
b) Efficient Inventory-Production Management,
c) Speedy Collection of Accounts Receivable, and
d) Combined Cash Management Strategies.

© Tata McGraw-Hill Publishing Company Limited, Financial Management 14-42
Stretching Accounts Payable
One basic strategy of efficient cash management is to stretch the
accounts payable. In other words, a firm should pay its accounts
payable as late as possible without damaging its credit standing. It
should, however, take advantage of the cash discount available on
prompt payment.
If the firm, in our Example 7, can stretch its accounts payable from the
current level of 35 days to 45 days, its cash cycle will be 110 days (i.e.
reduced by 10 days from the original 120 days). The reduction in the
cash cycle by 10 days as a result of the stretching of the accounts
payable by 10 days will increase the cash turnover from 3 (initially) to
3.27 (360 ÷ 110). This will lead to a decrease in the minimum cash
requirement from Rs 80 lakh to Rs 73.40 lakh (Rs 240 lakh ÷ 3.27). That
is, the requirement has been reduced by Rs 6.60 lakh. Assuming a 10
per cent rate of interest, there will be a saving in cost to the firm to the
extent of Rs 0.66 lakh.

© Tata McGraw-Hill Publishing Company Limited, Financial Management 14-43
Efficient Inventory-Production Management
Another strategy is to increase the inventory turnover, avoiding stock-outs, that is, shortage of stock. This can be done in the following ways:
1. Increasing the raw materials turnover by using more efficient inventory control techniques.
2. Decreasing the production cycle through better production planning,
scheduling and control techniques; it will lead to an increase in the work-in-progress inventory turnover.
3. Increasing the finished goods turnover through better forecasting of
demand and a better planning of production.
Assume that the firm in Example 7 is able to reduce the average age of its inventory from 85 to 70, that is, by 15 days. As a result, the cash cycle will
decline by 15 days from 120 days to 105 days. The cash turnover will increase to 3.43 (360 ÷ 105) from the original level of 3. The effect of an increase in the
cash turnover will be to reduce the minimum cash requirement from Rs 80
lakh to Rs 70 lakh (Rs 240 lakh ÷ 3.43). The saving in cost on Rs 10 lakh will Re 1 lakh (Rs 10 lakh × 0.10). Thus, efficient inventory and production
management causes a decline in the operating cash requirement and, hence, a saving in cash operating cost.
© Tata McGraw-Hill Publishing Company Limited, Financial Management 14-44
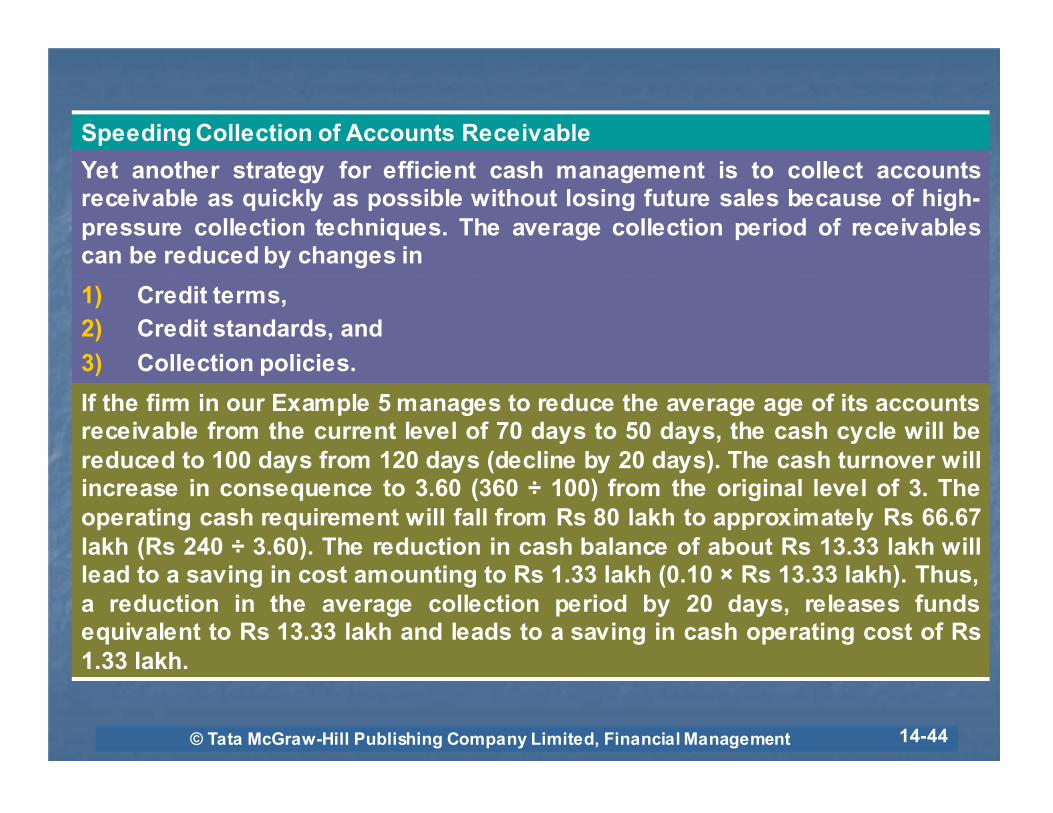
Speeding Collection of Accounts Receivable
Yet another strategy for efficient cash management is to collect accounts receivable as quickly as possible without losing future sales because of high-
pressure collection techniques. The average collection period of receivables can be reduced by changes in
1) Credit terms,
2) Credit standards, and
3) Collection policies.
If the firm in our Example 5 manages to reduce the average age of its accounts receivable from the current level of 70 days to 50 days, the cash cycle will be
reduced to 100 days from 120 days (decline by 20 days). The cash turnover will increase in consequence to 3.60 (360 ÷ 100) from the original level of 3. The
operating cash requirement will fall from Rs 80 lakh to approximately Rs 66.67
lakh (Rs 240 ÷ 3.60). The reduction in cash balance of about Rs 13.33 lakh will lead to a saving in cost amounting to Rs 1.33 lakh (0.10 × Rs 13.33 lakh). Thus,
a reduction in the average collection period by 20 days, releases funds equivalent to Rs 13.33 lakh and leads to a saving in cash operating cost of Rs
1.33 lakh.

© Tata McGraw-Hill Publishing Company Limited, Financial Management 14-45
Combined Cash Management Strategies
Assume the firm in Example 7 simultaneously (i) increases the average accounts payable by 10 days; (ii) reduces the average age of inventory by 15
days; (iii) speeds up the collection of accounts receivable by 20 days. Now, the cash cycle will be 75 days (120 days–10 days–15 days–20 days); the cash
turnover will increase to 4.8 (360 ÷ 75); the minimum operating cash
requirement will go down to Rs 50 lakh, that is, a reduction of Rs 30 lakh; assuming a 10 per cent rate of interest, the saving in cash operating cost will
be Rs 3 lakh.
The foregoing discussion clearly shows that the three basic strategies of cash management, related to (1) accounts payable, (2) inventory, and (3) accounts
receivable, lead to a reduction in the cash balance. But, they imply certain problems for the management. First, if the accounts paya-ble are postponed
too long, the credit standing of the firm may be adversely affected. Secondly, a
low level of inventory may lead to a stoppage of production as sufficient raw materials may not be available for uninterrupted production, or the firm may
be short of enough stock to meet the demand for its product, that is, ‘stock-out’. Finally, restrictive credit standards, credit terms and collection policies
may jeopardise sales. These implications should be constantly kept in view
while working out cash management strategies.

© Tata McGraw-Hill Publishing Company Limited, Financial Management 14-46
Cash Management
Techniques/Processes
The cash management strategies are intended to minimise the operating cash balance requirement. The basic strategies that can be employed are
Speedy Cash Collections
In managing cash efficiently, the cash inflow process can be accelerated through systematic planning and refined techniques. There are two broad
approaches to do this. In the first place, the customers should be encouraged to pay as quickly as possible. Secondly, the payment from
customers should be converted into cash without any delay.
Prompt Payment by Customers
One way to ensure prompt payment by customers is prompt billing. What the customer has to pay and the period of payment should be notified
accurately and in advance. Another, and more important, technique to encourage prompt payment by customers, is the practice of offering cash
discounts.
© Tata McGraw-Hill Publishing Company Limited, Financial Management 14-47
Early Conversion of Payments into Cash
Once the customer makes the payment by writing a cheque in favour of the firm, the collection can be expedited by prompt encashment of the cheque.
There is a lag between the time a cheque is prepared and mailed by the customer and the time the funds are included in the cash reservoir of the
firm. This is represented by stages F to I in Exhibit 3. Within this time
interval three steps are involved:
(a) Transit or mailing time, that is, the time taken by the post offices to
transfer the cheque from the customers to the firm. This delay or lag is
referred to as postal float;
(b) Time taken in processing the cheques within the firm before they are deposited in the banks, termed as lethargy; and
(c) Collection time within the bank, that is, the time taken by the bank in
collecting the payment from the customer’s bank. This is called bank float.
The early conversion of payment into cash, as a technique to speed up collection of accounts receivable, is done to reduce the time lag between
posting of the cheque by the customer and the realisation of money by the firm. The postal float, lethargy and bank float are collectively referred to as
deposit float. The term deposit float is defined as the sum of cheques written
by customers that are not yet usable by the firm.15

© Tata McGraw-Hill Publishing Company Limited, Financial Management 14-48
Concentration Banking
Concentration banking is a collection procedure in which payments
are made to regionally dispersed collection centres, then deposited
in local banks for quick clearing; reduces float by shortening the
postal and bank float. As a system of decentralised billing and
multiple collection points, it is a useful technique to expedite the
collection of accounts receivable. It reduces the time needed in the
collection process by reducing the mailing time.
Lockbox System
Lockbox system is a collection procedure in which payers send their
payments/cheques to a nearby post box that is emptied by the firm’s
bank several times and the bank deposits the cheque in the firm’s
account; reduces float by shortening the lethargy as well as postal
and bank floats.

© Tata McGraw-Hill Publishing Company Limited, Financial Management 14-49
Example 8
A firm uses a continuous billing system that results in an average daily receipt of Rs 40,00,000. It is contemplating the institution of concentration
banking, instead of the current system of centralised billing and collection. It is estimated that such a system would reduce the collection period of
accounts receivable by 2 days.
Concentration banking would cost Rs 75,000 annually and 8 per cent can be earned by the firm on its investments. It is also found that a lock-box system
could reduce its overall collection time by four days and could cost annually Rs 1,20,000.
(i) How much cash would be released with the concentration banking system?
(ii) How much money can be saved due to reduction in the collection period
by 2 days? Should the firm institute the concentration banking system?
(iii) How much cash would be freed by lock-box system?
(iv) Between concentration banking and lock-box system, which is better?

© Tata McGraw-Hill Publishing Company Limited, Financial Management 14-50
Solution
(i) Cash released by the concentration banking system = Rs
40,00,000 × 2 days = Rs 80,00,000
(ii) Saving = 0.08 × Rs 80,00,000 = Rs 6,40,000.
The firm should institute the concentration banking system. It
costs only Rs 75,000 while the savings expected are Rs 6,40,000.
(iii) Cash released by the lock-box system = Rs 40,00,000 × 4 days =
Rs 1,60,00,000
(iv) Saving in lock-box system: 0.08 × Rs 1,60,00,000 = Rs 12,80,000
Lock-box system is better. Its net savings Rs 11,60,000 (Rs 12,80,000
– Rs 1,20,000) are higher than that of concentration banking.

© Tata McGraw-Hill Publishing Company Limited, Financial Management 14-51
Slowing Disbursements
Apart from speedy collection of accounts receivable, the operating
cash requirement can be reduced by slow disbursements of
accounts payable. In fact, slow disbursements represent a source of
funds requiring no interest payments. There are several techniques
to delay payment of accounts payable, namely,
Avoidance of Early Payments
One way to delay payments is to avoid early payments. According to
the terms of credit, a firm is required to make a payment within a
stipulated period. It entitles a firm to cash discounts
Centralised Disbursements
Another method to slow down disbursements is to have centralised
disbursements. All the payments should be made by the head office
from a centralised disbursement account. Such an arrangement
would enable a firm to delay payments and conserve cash for
several reasons.

© Tata McGraw-Hill Publishing Company Limited, Financial Management 14-52
Float
A very important technique of slow disbursements is float. The term float
refers to the amount of money tied up in cheques that have been written, but
have yet to be collected and encashed. Alternatively, float represents the
difference between the bank balance and book balance of cash of a firm. The
difference between the balance as shown by the firm’s record and the actual
bank balance is due to transit and processing delays. Float used in this sense
is called as cheque kiting. There are two ways of doing it:
1) Paying from a distant bank,
2) Scientific cheque-cashing analysis.
(a) Paying From a Distant Bank
The firm may issue a cheque on banks away from the creditor’s bank. This
would involve relatively longer transit time for the creditor’s bank to get
payment and, thus, enable the firm to use its funds longer.

© Tata McGraw-Hill Publishing Company Limited, Financial Management 14-53
(b) Cheque-encashment Analysis .
Another way to make use of float is to analyse, on the basis of past
experience, the time-lag in the issue of cheques and their encashment. For
instance, cheques issued to pay wages and salary may not be encashed
immediately; it may be spread over a few days, say, 25 per cent on one day, 50
per cent on the second day and the balance on the third day. It would mean
that the firm should keep in the bank not the entire amount of a payroll but
only a fraction represented by the actual withdrawal each day. This strategy
would enable the firm to save operating cash
Accruals
Finally, a potential tool for stretching accounts payable is accruals which are
defined as current liabilities that represent a service or goods received by a
firm but not yet paid for. For instance, payroll, that is, remuneration to
employees who render service in advance and receive payment later.

© Tata McGraw-Hill Publishing Company Limited, Financial Management 14-54
Marketable Securities
Marketable securities are an outlet for surplus cash as liquid security/assets. To be liquid a security must have two basic characteristics, that is, a ready
market and safety of principal.
Selection Criterion
A major decision confronting the financial managers involves the determination of the mix of cash and marketable securities.
For example, take the case of a firm paying Rs 350 as brokerage costs to purchase and sell Rs 45,000 worth of marketable securities, yielding an
annual return of 8 per cent and held for one month. The interest earned on the securities works out at Rs 300 (1/12 × .08 × Rs 45,000). Since this amount
is less than the cost of the transaction (Rs 350), it is not advisable for the
firm to make the investments. This trade-off between interest returns and brokerage costs is a key factor in determining what proportion of liquid
assets should be held in the form of marketable securities.

© Tata McGraw-Hill Publishing Company Limited, Financial Management 14-55
There are three motives for maintaining liquidity (cash as well as
marketable securities) and, therefore, for holding marketable
securities: transaction motive, safety/precautionary motive and
speculative motive. An assessment of certain criteria can provide the
financial manager with a useful framework for selecting a proper
marketable securities mix. These considerations include evaluation
of
1)financial risk,
2)interest rate risk,
3)taxability,
4)liquidity, and
5)yield among different financial assets.

© Tata McGraw-Hill Publishing Company Limited, Financial Management 14-56
Financial/Default Risk
It refers to the uncertainty of expected returns from a security
attributable to possible changes in the financial capacity of the
security-issuer to make future payments to the security-owner.
Interest Rate Risk
The uncertainty that is associated with the expected returns from a
financial instrument attributable to changes in interest rate is known
as interest rate risk.
Taxability
Another factor affecting observed difference in market yields is the
differential impact of taxes. Securities, income on which is tax-exempt,
sell in the market at lower yields to maturity than other securities of
the same maturity. A differential impact on yields arises also because
interest income is taxed at the ordinary tax rate while capital gains are
taxed at a lower rate. As a result, fixed-interest securities that sell at a
discount because of low coupon rate in relation to the prevailing yields
are attractive to taxable investors. The reason is that part of the yield
to maturity is a capital gain.

© Tata McGraw-Hill Publishing Company Limited, Financial Management 14-57
Liquidity
With reference to marketable securities portfolio, liquidity refers to the
ability to transform a security into cash.
Yield
The final selection criterion is the yields that are available on the
different financial assets suitable for inclusion in the marketable/near-
cash portfolio. All the four factors listed above, financial risk, interest
rate risk, liquidity and taxability, influence the available yields on
financial instruments. Therefore, the yield criterion involves a
weighing of the risks and benefits inherent in these factors. If a given
risk is assumed, such as lack of liquidity, then a higher yield may be
expected on the instrument lacking the liquidity characteristics.
© Tata McGraw-Hill Publishing Company Limited, Financial Management 14-58
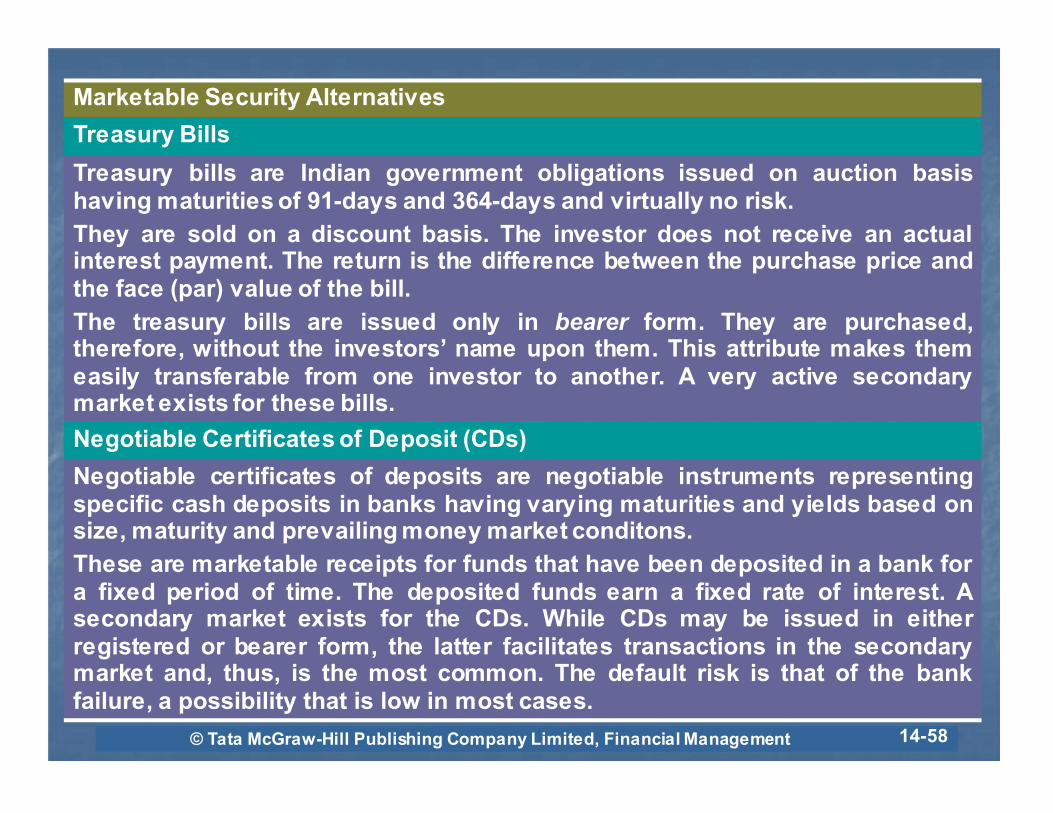
Marketable Security Alternatives
Treasury Bills
Treasury bills are Indian government obligations issued on auction basis having maturities of 91-days and 364-days and virtually no risk.
They are sold on a discount basis. The investor does not receive an actual interest payment. The return is the difference between the purchase price and the face (par) value of the bill.
The treasury bills are issued only in bearer form. They are purchased, therefore, without the investors’ name upon them. This attribute makes them easily transferable from one investor to another. A very active secondary market exists for these bills.
Negotiable Certificates of Deposit (CDs)
Negotiable certificates of deposits are negotiable instruments representing specific cash deposits in banks having varying maturities and yields based on size, maturity and prevailing money market conditons.
These are marketable receipts for funds that have been deposited in a bank for a fixed period of time. The deposited funds earn a fixed rate of interest. A secondary market exists for the CDs. While CDs may be issued in either registered or bearer form, the latter facilitates transactions in the secondary market and, thus, is the most common. The default risk is that of the bank failure, a possibility that is low in most cases.

© Tata McGraw-Hill Publishing Company Limited, Financial Management 14-59
Commercial Paper
It refers to short-term unsecured promissory note sold by large business firms to raise cash. As they are unsecured, the issuing side of the market is dominated by large companies which typically maintain sound credit ratings. Commercial papers (CPs) can be sold either directly or through dealers.
Bankers’ Acceptances
These are drafts (order to pay) drawn on a specific bank by an exporter in order to obtain payment for goods he has shipped to a customer who maintains an account with that specific bank. They can also be used in financing domestic trade. The draft guarantees payment by the accepting bank at a specific point of time. The seller who
holds such acceptance may sell it at a discount to get immediate funds.
Repurchase (Repo) Agreements
These are legal contracts that involve the actual sale of securities by a borrower to the lender with a commitment on the part of the former to repurchase the securities at the current price plus a stated interest charge.
There are two major reasons why a firm with excess cash prefers to buy repurchase agreements rather than a marketable security. First, the original maturities of the
instrument being sold can, in effect, be adjusted to suit the particular needs of the investing firm. Therefore, funds available for a very short period, that is, one/two days can be employed to earn a return. Closely related to the first is the second reason, namely, since the contract price of the securities that make up the arrangement is fixed
for the duration of the transaction, the firm buying the repurchase agreement is protected against market fluctuations throughout the contract period. This makes it a sound alternative investment for funds that are surplus for only short periods.

© Tata McGraw-Hill Publishing Company Limited, Financial Management 14-60
Units
The units of mutual funds offer a reasonably convenient alternative avenue for investing surplus liquidity as
1) there is a very active secondary market for them,
2) the income from units is tax-exempt up to a specified amount and,
3) the units appreciate in a fairly predictable manner.
Intercorporate Deposits
Intercorporate deposits, that is, short-term deposits with other companies is a fairly attractive form of investment of short-term funds in terms of rate of return which currently ranges between 12 and 15 per cent.
Bills Discounting
Surplus funds may be deployed to purchase/discount bills. Bills of exchange are drawn by seller (drawer) on the buyer (drawee) for the value of goods delivered to him. During the pendency of the bill, if the seller is in need of funds, he may get it discounted. On maturity, the bill should be presented to the drawee for payment. A bill of exchange is a self-liquidating instrument.
Money Market Mutual Funds/Liquid Funds
Money Market Mutual Funds/Liquid Funds are professionally managed portfolios of marketable securities. They provide instant liquidity. Due to high liquidity, competitive yields and low transactions, these funds have achieved significant growth in size and popularity in recent years.
© Tata McGraw-Hill Publishing Company Limited, Financial Management 14-61
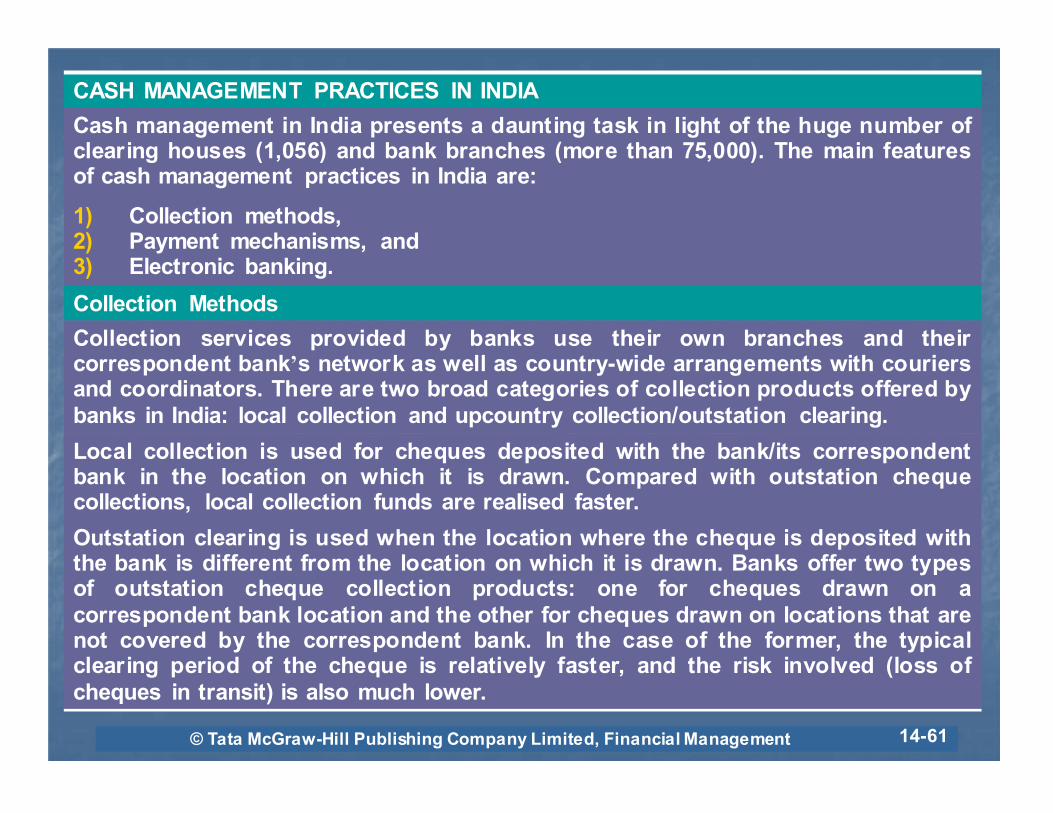
CASH MANAGEMENT PRACTICES IN INDIA
Cash management in India presents a daunting task in light of the huge number of clearing houses (1,056) and bank branches (more than 75,000). The main features of cash management practices in India are:
1) Collection methods, 2) Payment mechanisms, and 3) Electronic banking.
Collection Methods
Collection services provided by banks use their own branches and their correspondent bank’s network as well as country-wide arrangements with couriers and coordinators. There are two broad categories of collection products offered by
banks in India: local collection and upcountry collection/outstation clearing.
Local collection is used for cheques deposited with the bank/its correspondent bank in the location on which it is drawn. Compared with outstation cheque collections, local collection funds are realised faster.
Outstation clearing is used when the location where the cheque is deposited with the bank is different from the location on which it is drawn. Banks offer two types of outstation cheque collection products: one for cheques drawn on a
correspondent bank location and the other for cheques drawn on locations that are not covered by the correspondent bank. In the case of the former, the typical clearing period of the cheque is relatively faster, and the risk involved (loss of
cheques in transit) is also much lower.

© Tata McGraw-Hill Publishing Company Limited, Financial Management 14-62
The collection proceeds can be made available to the customer on either a cleared funds or guaranteed basis (i.e. cheque-discounting) depending on the
corporate’s cashflow requirements. Value-added services such as cheque pick-ups, customised management information reporting, data-entry of deposit-slip
information and so on are also provided.
Bulk Collection is offered by banks for processing high-volume collections
such as cheque collection for initial public offerings (IPOs), utility bill
collections for telephone, electricity, cellular service providers and so on through timely clearing of instruments together with strong reconciliation and
reporting.
Post-dated Cheque (PDC) Management solutions are critical for non-banking
finance companies that collect PDCs from their retail and auto-loan
disbursement customers.
Electronic Clearing Service—Debit Scheme of the RBI enables corporates
typically utility or insurance companies to collect the proceeds of small value
large-volume payments from their customers.
Cheque Truncation removes the need for much of the physical handling and
movement of paper-based payment instruments as only the electronic image of
the instrument is transmitted through the clearing system.
CONTD.

© Tata McGraw-Hill Publishing Company Limited, Financial Management 14-63
Payment Mechanism
Currently payments are significantly paper-based through cash/cheques/demand drafts.
The key mechanism available to customers in India are illustrated below:
Payment
mechanism
Features
Cheque Currently the most prevalent mode of payment. The customer’s
account is debited only when a cheque is presented in clearing by
the beneficiary.
Cheque payable at
par
A cheque that can be redeemed at par at any of the locations where
the bank has a branch. The customer’s account is debited only on
clearing.
Customer’s or pay
order
A pre-funded payment instrument issued by a bank, i.e. the
customer’s account is debited up front, and is typically payable at
all locations where the bank has branches.
Demand draft A pre-funded out-station pay order, which is drawn on a location
where the bank does not have its own branch, but has a tie-up with
a correspondent bank. The customer’s account is debited upfront.
Real-time gross
settlement (RTGS)
A domestic electronic payment mechanism for funds transfer
(credit-push). The beneficiary’s bank is required to credit the
proceeds of an inward RTGS transaction to the beneficiary’s
account, or return the funds, within two hours of receipt of the
payment notification. Participation by banks in RTGS customer
payments is currently voluntary.

© Tata McGraw-Hill Publishing Company Limited, Financial Management 14-64
Electronic Funds
Transfer (EFT)
An electronic payment mode for same-day inter- and intra-city funds transfer (credit-push). It is mandatory for all bank branches,
in 16 large metros in India, directly involved in clearing, to participate in RBI’s EFT System for inward EFT.
Special Electronic
Funds Transfer
(SEFT)
An electronic payment mode for same-day inter- and intra-city funds transfer (credit-push). This is an extension of RBI’s EFT
system, but participation in SEFT is voluntary for banks, and only networked branches are
allowed to participate. Thus, location coverage is wider than EFT,
but not all banks participate in SEFT.
Electronic Clearing
Service (ECS) –
Credit
ECS (credit) is an electronic mode of payment which is designed for large-volume payments. The ECS scheme is operational in
some 46 cities and all banks directly participating in clearing have to process inward ECS. The ECS settlement cycle is four days;
much longer than for RTGS, EFT or SEFT.
Interest/Dividend
warrants
These are paper-based payment instruments that are required to be pre-funded (based on applicable regulations) and are used for
large-volume interest and dividend payments.
CONTD.

© Tata McGraw-Hill Publishing Company Limited, Financial Management 14-65
The migration from paper-based to electronic modes of payment has been
relatively slow and gradual. Corporates are realising the potential of cost-
savings in processing electronic payments as these are conducive to system-
integration with the client’s internal systems.
Payment Outsourcing Corporates and financial institutions are increasingly
outsourcing payment-processing to banks. Payment outsourcing products
eliminate manual processing and the overhead costs associated with preparing,
verifying and signing/despatching individual cheques. Banks facilitate the
interfacing of corporate’s back-office payment system with the bank’s
electronic banking plateforms.
Electronic Banking
Banks offer sophisticated electronic banking delivery channels. They not only
allow customers to access account-balance information in real-time but also
enable them to initiate transactions for payments, inter-account transfers,
deposit placements and so on. Corporates have access to extensive
management information reports. The internet banking offerings also allow
corporates to access their accounts with the banks from different countries.
CONTD.

© Tata McGraw-Hill Publishing Company Limited, Financial Management 14-66
SOLVED PROBLEM

© Tata McGraw-Hill Publishing Company Limited, Financial Management 14-67
The following results are expected by XYZ Ltd by quarters next year, in
thousands of rupees.
Particulars Quarter
1 2 3 4
Sales 7,500 10,500 18,000 10,500
Cash payments:
Production costs 7,000 10,000 8,000 8,500
Selling, administrative and other costs 1,000 2,000 2,900 1,600
Purchases of plant and other fixed assets 100 1,100 2,100 2,100
The debtors at the end of a quarter are one-third of sales for the quarter. The
opening balance of debtors is Rs 30,00,000. Cash on hand at the beginning of
the year is Rs 6,50,000 and the desired minimum balance is Rs 5,00,000.
Borrowings are made at the beginning of quarters in which the need will occur
in multiplies of Rs 10,000 and are repaid at the end of quarters. Interest charges
may be ignored. You are required to prepare:
(a) a cash budget by quarters for the year; and
(b) state the amount of loan outstanding at the end of the year.

© Tata McGraw-Hill Publishing Company Limited, Financial Management 14-68
Solution
(a) Cash budget next year (quarter-wise) (thousands of rupees)
Particulars Quarter
1 2 3 4 Total
(A) Cash inflows:
Collection from debtors
(i) From prior quarter (1/3 of sales) 3,000 2,500 3,500 6,000 15,000
(ii) From current quarter (2/3 of sales) 5,000 7,000 12,000 7,000 31,000
Total 8,000 9,500 15,500 13,000 46,000
(B) Cash outflows:
Production costs 7,000 10,000 8,000 8,500 33,500
Selling, administrative and other costs 1,000 2,000 2,900 1,600 7,500
Plant and other fixed assets purchased 100 1,100 2,100 2,100 5,400
Total 8,100 13,100 13,000 12,200 46,400
(c) Surplus/(deficiency) (100) (3,600) 2,500 800 (400)
Beginning balance 650 550 500 500 650
Ending balance (indicated) 550 (3,050) 3,000 1,300 250
Borrowings required
(deficiency + minimum cash required) 3,550 3,550
(Repayments) made
(balance – minimum cash required) (2,500) (800) (3,300)
Ending balance (actually now estimated) 550 500 500 500 500
(b) Loan outstanding = Rs 35,50,000 – Rs 33,00,000 = Rs 2,50,000.

© Tata McGraw-Hill Publishing Company Limited, Financial Management 14-69
MINI CASE

© Tata McGraw-Hill Publishing Company Limited, Financial Management 14-70
The following is the balance sheet of Amar Industries Limited as on March 31 of
the current year (amount in lakh of rupees)
Liabilities Amount Assets Amount
Capital and reserves 1,650 Fixed assets at cost 1300
12% Debentures 900 Less: Depreciation (400) 900
Creditors for purchases 600 Sundry debtors 700
Creditors for expenses 70 Stocks and stores 1,200
Provision for bonus 30 Loans and advances 500
Provision for tax 100 Cash and bank balances 100
Proposed dividends 50 ____
3,400 3,400

© Tata McGraw-Hill Publishing Company Limited, Financial Management 14-71
Projected P & L A/c for the first 4 months (April-July) of the next year shows the following
(Rs in lakhs)
Particulars April May June July
Sales 800 800 900 900
Excise duty recoveries 80 80 90 90
880 880 990 990
Materials:
Opening stock 1,200 1,200 1,260 1,320
Add: Purchases 600 660 720 720
Less: Closing stock (1,200) (1,260) (1,320) (1,320)
Cost of materials used 600 600 660 720
Expenses 180 180 200 200
Excise duty 80 84 88 92
860 864 948 1,012
Profit (loss) 20 16 42 (22)

© Tata McGraw-Hill Publishing Company Limited, Financial Management 14-72
The following are the other relevant additional information:
(i) 10 per cent of sales are for cash and the balance on 30 days’ credit.
(ii) Creditors for purchases are paid in 30 days.
(iii) Expenses include:
(a) Interest payable at the end of each quarter;
(b) Depreciation of Rs 10 lakh per month.
(c) Provision for bonus to workmen, Rs 5 lakh per month, payable only
in October.
(d) One-half of rest of the expenses payable in the following month.
(iv) Rs 200 lakh of debentures are redeemable on June 30.
(v) Provision for taxation includes Rs 20 lakh of surplus provision carried
forward from earlier year besides the balance for the current year payable
before June 30.
(vi) Annual general meeting is to be held on May 31.
(vii) Overdraft is permissible; however, interest on overdraft may be ignored.
You are required to prepare cash budget for the months of April to July (on a
monthly basis) for the next year.

© Tata McGraw-Hill Publishing Company Limited, Financial Management 14-73
Solution: Cash budget of Amar Industries Ltd from April to July
(Amount in lakh of rupees)
Particulars April May June July
Gross sales (including excise duty) Credit sales (90 per cent) Credit purchases Cash inflows:
Cash sales Collection from debtors: in the month following sales Total
Cash outflows: Payment to creditors (in the month following purchases) Interest (0.12 × Rs 900 lakh × 1/4) Excise duty (assumed to be paid in the same
month) Expenses (working note 1) Redemption of debentures Tax (assumed to be paid in June)
Dividends (assumed to be paid in July) Total Surplus (deficiency) Beginning balance
Closing balance (overdraft)
880 792 600
88
700 788
600 —
80 148
— —
— 828 (40) 100
60
880 792 660
88
792 880
600 —
84 156
— —
— 840
40 60
100
990 891 720
99
792 891
660 27
88 166 200
80
— 1,221 (330)
100
(230)
990 891 720
99
891 990
720 —
92 177
— —
50 1,039
(49) (230)
(279)

© Tata McGraw-Hill Publishing Company Limited, Financial Management 14-74
Working Notes
Payment for expenses (Amount in lakh of rupees)
April May June July
Total expenses 180 180 200 200
Less: Interest on debentures 9 9 9 7
Less: Depreciation 10 10 10 10
Less: Provision for bonus 5 5 5 5
Net expenses (for a month) 156 156 176 178
50 per cent payable in the same month 78 78 88 89
50 per cent of the previous month 70 78 78 88
148 156 166 177