Chapter 7 Pakistan - UN ESCAP 7... · 2018-10-22 · purchasing power parity (PPP) valuation....
70
319 Chapter 7 Pakistan By Woong Lee and Chankwon Bae Introduction and objective This chapter discusses a comprehensive study on the possible strategies of membership expansion under APTA as a potent mechanism for regional cooperation and integration in Asia and the Pacific. In particular, the study analyses the benefits for Pakistan in acceding to APTA as well as the benefits for the Participating States of APTA. Finally, using the results from various empirical analyses, this chapter provides policy recommendations for formulating a strategy for the Participating States of APTA in extending membership to Pakistan. A. Overview of the economy of Pakistan 1. Macroeconomic performance According to the International Monetary Fund (IMF), 1 as of 2014, the Pakistani economy was the forty-third largest in the world at approximately $220 billion in terms of nominal gross domestic product (GDP), and the twenty-sixth largest at $882 billion based on purchasing power parity (PPP) valuation. Pakistan’s population of approximately 186 million makes it the sixth largest in the world. In 2014, the GDP per capita was $1,342, ranking it at 152 in the world, while the ranking for GDP per capita in terms of PPP, at $4,736, was 134. Pakistan is a developing country, but is one of the Next Eleven, 2 comprising 11 countries that have the potential to be one of the largest economies in the world, together with the BRIC country grouping (Brazil, Russian Federation, India and China), in the twenty-first century. Pakistan’s growth was relatively strong in the 1980s, with an annual GDP growth rate of 6.6%. This performance by Pakistan’s economy was due to economic deregulation and inflow of remittances. However, Pakistan experienced slow economic growth during the 1990s and the 2000s, but the rate became vigorous in 2004 and 2005 at 7.84% and 8.96%, respectively (figure 7.1). Then, from 2006 to 2009, the growth rate dropped substantially. Recently, the economy has recovered, but its speed of recovery has been slow, with an average growth rate of 3.58% during the past five years (table 7.1). 1 IMF World Economic Outlook database, April 2015. 2 The terminology “Next Eleven” was introduced by Goldman Sachs and Jim O’Neill.
Transcript of Chapter 7 Pakistan - UN ESCAP 7... · 2018-10-22 · purchasing power parity (PPP) valuation....

319
Chapter 7
Pakistan
By Woong Lee and Chankwon Bae
Introduction and objective
This chapter discusses a comprehensive study on the possible strategies of membership
expansion under APTA as a potent mechanism for regional cooperation and integration in
Asia and the Pacific. In particular, the study analyses the benefits for Pakistan in acceding
to APTA as well as the benefits for the Participating States of APTA. Finally, using the
results from various empirical analyses, this chapter provides policy recommendations for
formulating a strategy for the Participating States of APTA in extending membership to
Pakistan.
A. Overview of the economy of Pakistan
1. Macroeconomic performance
According to the International Monetary Fund (IMF),1 as of 2014, the Pakistani economy
was the forty-third largest in the world at approximately $220 billion in terms of nominal
gross domestic product (GDP), and the twenty-sixth largest at $882 billion based on
purchasing power parity (PPP) valuation. Pakistan’s population of approximately 186 million
makes it the sixth largest in the world. In 2014, the GDP per capita was $1,342, ranking
it at 152 in the world, while the ranking for GDP per capita in terms of PPP, at $4,736,
was 134. Pakistan is a developing country, but is one of the Next Eleven,2 comprising
11 countries that have the potential to be one of the largest economies in the world,
together with the BRIC country grouping (Brazil, Russian Federation, India and China), in
the twenty-first century.
Pakistan’s growth was relatively strong in the 1980s, with an annual GDP growth rate of
6.6%. This performance by Pakistan’s economy was due to economic deregulation and
inflow of remittances. However, Pakistan experienced slow economic growth during the
1990s and the 2000s, but the rate became vigorous in 2004 and 2005 at 7.84% and
8.96%, respectively (figure 7.1). Then, from 2006 to 2009, the growth rate dropped
substantially. Recently, the economy has recovered, but its speed of recovery has been
slow, with an average growth rate of 3.58% during the past five years (table 7.1).
1 IMF World Economic Outlook database, April 2015.2 The terminology “Next Eleven” was introduced by Goldman Sachs and Jim O’Neill.

320
One important point that should be noted regarding Pakistan’s economy is the problem of
electricity. Pakistan has been facing chronic electricity shortages and high electricity prices,
which creates a serious problem for the country’s economy. The worsening power shortage
as well as leakage of electricity and theft has meant hardship both for households and for
businesses. The infrastructure (power generation, transmission and distribution) is inefficient
and electricity prices are not sufficient to compensate for production costs. This severe
electricity crisis is not a result of short-term management but rather due to long-term
Figure 7.1. Trends of real GDP and rate of growth in Pakistan
Source: IMF World Economic Outlook database.
Note: Left axis is the real GDP and right axis is the growth rate. Units of growth rate and real GDP are percentage and
billions of Pakistani rupees (PKR), respectively. The base year for real GDP is the 2005/06 fiscal year of Pakistan.3
0
2 000
4 000
6 000
8 000
10 000
12 000
19
80
19
82
19
84
19
86
19
88
19
90
19
92
19
94
19
96
19
98
20
00
20
02
20
04
20
06
20
08
20
10
20
12
20
14
0
2
4
6
8
10
Growth rate Real GDP Moving average of growth rate
Bill
ion
s o
f P
akis
tan
i ru
pe
es
Pe
rce
nta
ge
3 The fiscal year in Pakistan ends on 30 June.
Table 7.1. Average growth rates of the economy in Pakistan,
1980-2014
PeriodTen-year average
PeriodFive-year average
growth (%) growth (%)
1980-1989 6.59 1980-1984 6.75
1990-1999 4.50 1985-1989 6.43
2000-2009 4.69 1990-1994 4.78
2010-2014 3.58 1995-1999 4.21
2000-2004 4.24
2005-2009 5.13
2010-2014 3.58
Source: IMF World Economic Outlook database.

321
energy policies over the past 30 years, meaning that a turnaround in policy by the energy
policymakers of Pakistan is necessary.
The economy achieved 4.1% real GDP growth rate in 2014, which was the highest in four
years. This upward growth trend has been supported by the settlement of: (a) fiscal
deficits; (b) renewed generation of government revenue; (c) investment in the energy
sector; (d) increase in remittance inflows; and (e) improvement in the large-scale
manufacturing sector (WTO, 2015a). The growth is forecast to reach 4.3% in 2015 and
4.7% in 2016 (IMF, 2015). This upturn is mainly due to the easing of fiscal adjustment and
the improvement of structural constraints in the energy sector, public enterprises and the
investment sector (WTO, 2015a).
On the demand side, an increase in private consumption and investment led to economic
growth in 2014 (table 7.2). According to Asian Development Bank figures (ADB, 2015), an
increase in the inflow of remittances as well as growth in rural and small business income
also boosted consumption in 2014. However, although net exports were negative from
2011 to 2014, a decrease in net exports also supported the growth of the Pakistan economy.
Table 7.2. Demand-side contributions to growth
Share of
2011 2012 2013 2014 GDP in
2014 (%)
GDP 3.62 3.84 3.70 4.14 100
Consumption 4.60 5.00 2.10 5.40 78
Gross capital formation -6.70 2.50 2.80 4.30 15
Government spending 0.00 7.30 10.10 1.50 11
Net exports -9.90 50.20 -28.00 7.40 -3
Source: CEIC database.
A strong revival in the industrial sector led to remarkable economic growth in 2014
(table 7.3; figures 7.2-7.4). In particular, a recovery in construction and steady expansion
in the manufacturing and services sectors spurred a 4.14% growth of real GDP in 2014, up
from 3.70% in 2013. There was a construction boom due to the large development spending
of the Government, which contributed the most in 2014. Energy deficiencies continued to
impede manufacturing output, despite efforts to improve energy supply and management
by the Government (ADB, 2015). Expansion in services, which consists of 58% of GDP,
slowed to 4.37% from 5.13% in 2013. Weaker growth in general government services as
well as finance and insurance services offset growth in wholesale and retail trade, transport,
storage and communication services.

322
Table 7.3. Supply-side contributions to growth
Share of
2011 2012 2013 2014 GDP in
2014 (%)
GDP 3.62 3.84 3.70 4.14 100
Agriculture 1.96 3.62 2.68 2.69 21
Industry 4.51 2.55 0.61 4.45 20
Services 3.94 4.40 5.13 4.37 58
Source: CEIC database.
Figure 7.2. Contribution of the agricultural sector to GDP
Source: CEIC database.
Figure 7.3. Contribution of the industrial sector to GDP
Source: CEIC database.
-40
-20
0
20
40
60
80
2011 2012 2013 2014Pe
rce
nta
ge
of
GD
P
Mining and quarrying
Manufacturing
Construction
Electricity and gas distribution
-20
-15
-10
-5
0
5
10
2011 2012 2013 2014
Pe
rce
nta
ge
of
GD
P
Crops
Livestock
Forestry
Fishing

323
2. Stability of politics4
The first ever successful democratic transfer of political power was achieved in Pakistan in
2013. This smooth transition of political power is expected to provide a foundation for
democratic development in Pakistan. Cross-party political consensus resulted in the
unanimous passing of the eighteenth constitutional amendment in the Parliament, which
shows the new political maturity of Pakistan. The amendment reveals a long-lasting political
claim for achieving more balanced power and responsibilities between the federal and
provincial Governments.
3. Policy reforms
Pakistan’s economic reform agenda can be summarized as the four E’s – economy,
education, energy and (elimination of) extremism. The Government has sustained steady
action in the face of challenges and has achieved some visible results.
Recent key outcomes include the following (WTO, 2015b):
(a) The resumption of active privatization – selling shares of United Bank Limited
(UBL) for approximately $400 million; subscribing to Pakistan Petroleum Limited
(PPL) for PKR 30 billion (the highest-ever record in the history of the Pakistani
stock market) and realizing it at PKR 15.3 billion;
(b) The disinvestment of Oil and Gas Development Corporation Limited (OGDCL)
shares, worth approximately $800 million, together with an increase of
$1 billion in International Sukuk;5
Source: CEIC database.
-10
-5
0
5
10
15
2011 2012 2013 2014
Pe
rce
nta
ge
of
GD
P
Wholesale and retail trade
Finance and insurance
Ownership of dwellings
Other private services
General government services
Transport, storage and communication
Figure 7.4. Contribution of the services sector to GDP
4 WTO, 2015a.5 Islamic financial certificate.

324
(c) Successful re-entry to global capital markets by issuing Euro Bonds worth
$2 billion, after a gap of seven years;
(d) The auctioning of 3G-4G licences, which raised PKR 120 billion. The auctioning
for two more unsold licences valued at PKR 50 billion will be held at an
appropriate time;
(e) The World Bank and the Asian Development Bank resumed financing loans to
Pakistan, which improved cash flow with an influx of $1.5 billion;
(f) The allotment for the National Income Support Programme (NISP) was almost
tripled from PKR 40 billion in fiscal year 2013 to PKR 118 billion in fiscal year
2015 in order to expand the social safety net;
(g) A circular debt of PKR 503 billion in the energy sector was cleared. This
resulted in additional electricity output of 1,700 MW for the national grid,
which reduced power outages and assisted the growth of the industrial sector;
(h) The outlook for Pakistan’s Stock Market appears positive. The KSE is one of
the best performing stock exchanges in Asia. The KSE stood at 28,493.24 on
1 September 2014 and has continuously grown, breaking several records,
and stood at 34,447.47 on 28 August 2015. In addition, market capitalization
has substantially increased by nearly 50%;
(i) The number of new companies incorporated during the 2012/13 fiscal year
totalled 3,953 rising to a further 4,587 during the 2013/14 fiscal year, which
represents an increase of 16%;
(j) The Government decided to establish the Export-Import Bank to improve
export credit and to reduce the cost of borrowing for exporting firms. Regarding
the export finance, the mark-up rate has dropped from 9.4% to 7.5%;
(k) The Ministry of Water and Power has developed a prospective power policy to
support the current and future energy demand of the country. One result was
the formulation of a National Power Policy in 2013 to present a roadmap for
providing affordable energy and improving the energy mix;6
(l) Tight fiscal policy with an increase in tax revenue collection has been
implemented in order to reduce the fiscal deficit and to create fiscal room for
various development projects;
(m) Public sector enterprises account for a large share of Pakistan’s economy,
amounting to approximately 10% of GDP.7 Under the Public Sector Enterprises
Reform Strategy, the Government has initiated a restructuring plan to reduce
the losses of various state-owned enterprises such as Pakistan Steel Mills,
Pakistan Railway and Pakistan International Airways;
6 Ministry of Water and Power, Government of Pakistan.7 Asian Development Bank (November 2014), “Proposed Technical Assistance Loan for the Islamic
Republic of Pakistan: Public Sector Enterprise Reforms Project”.

325
(n) Significant fiscal adjustment was made to increase development spending
from PKR 425 billion, with a target of PKR 441 billion in the 2013/14 fiscal
year. Hence, unlike in the past when adjustment was accomplished by cutting
development spending, the Government has executed the full amount of
development spending. Total development spending was planned as PKR
525 billion for the 2014/15 fiscal year;
(o) Under the Vision 2025 plan, which was formulated by the Ministry for Planning,
Development and Reform, the Government aims to make Pakistan an upper-
middle income country in terms of the United Nations classification by 2025
and a top 10 economy by 2047.8 The objective of the Government’s Strategic
Development Plan is to create a globally competitive economy by targeting
macroeconomic stability through inclusive growth. Pakistan aims to achieve
7% of real GDP growth in 2018, in order to deal with poverty and
unemployment, and to improve health and education. The energy policy is
aimed at improving the energy mix to avoid the need for price increase as
well as to attract foreign investment;
(p) In January 2013, the Ministry of Commerce announced the Strategic Trade
Policy Framework, 2013-2015.9 Under this framework, the Government
envisions total exports of $95 billion during 2013-2015. In order to achieve
this target, the Government has identified seven areas of focus: (a) regional
trade; (b) strengthening of the institutional framework for promotion of exports;
(c) the creation of regulatory efficiencies; (d) export development initiatives:
(e) increasing exports from less-developed regions of Pakistan; (f) the promotion
of domestic commerce; and (g) the strengthening the monitoring and evaluation
network (WTO, 2015a; p. 9).
4. Relations with the Participating States
of APTA
(a) Bangladesh
Pakistan and Bangladesh are regional neighbours in South Asia and are both members of
the South Asian Association of Regional Cooperation (SAARC) and the South Asia Free
Trade Agreement (SAFTA). After independence from Britain in 1947, these two countries
were united until 1971 as West and East Pakistan. The Bangladesh Liberation War in 1971
resulted in East Pakistan becoming Bangladesh. Their official diplomatic relations began in
1976.
Relations between the two countries are generally stable and they have strong trade links.
Apart from SAARC and SAFTA, both of them are members of the Developing-8 Countries
(D-8), the Organization of Islamic Cooperation (OIC) and the Commonwealth of Nations.
8 See www.pakistan2025.org (accessed on 1 July 2015). For additional details, also see http://www.pc.
gov.pk/wp-content/uploads/2015/05/Vision-2025-Executive-Summary.pdf (accessed on 23 May 2016).9 Ministry of Commerce, Government of Pakistan.

326
(b) China
The relationship between Pakistan and China began in 1950 when Pakistan established
official diplomatic relations with China. Both countries have placed great importance on the
relationship and have regularly exchanged high-level visits, resulting in a variety of
agreements. China has provided economic, military and technical assistance to Pakistan
as a close strategic ally.
International trade between the two countries has been rapidly increasing and the China-
Pakistan FTA has been in effect since 2007. The agreement represented Pakistan’s first
FTA with a large economy. In addition to merchandise-related liberalization between the
two countries, the Agreement on Trade in Services between Pakistan and China became
effective on 10 October 2009. As a result, both countries have reciprocally provided access
to more than 10 sectors in services.
The economic ties between Pakistan and China also include China’s investment in Pakistan.
Both countries have agreed to promote cross-border trade, which has led to China’s
investment in Pakistan’s financial and energy sectors.
In this regard, construction of the Pakistan-China Economic Corridor is in progress, which
will connect Pakistan with China and the Central Asian countries with highways. Upon
completion, it is expected bilateral ties between both countries will be strengthened.
(c) India
The relationship between Pakistan and India is complicated due to the fact that there are
a number of historical and political issues. The most significant issue was the partition of
former British India in 1947. In addition, the Kashmir conflict and a number of military
conflicts have made both countries suspicious and hostile towards one another. However,
both countries have economic ties under SAARC and SAFTA.
Since the new Government took office in Pakistan in 2013, relations between the two
countries have made significant steps. In particular, both countries reached a consensus
on allowing Non-Discriminatory Market Access on Reciprocal Basis (NDMARB) status for
each other, which is expected to liberalize bilateral trade.
(d) Republic of Korea
Pakistan and the Republic of Korea established diplomatic relations in 1983. Since then,
relations between the countries have improved. Recently, both countries try to strengthen
their relationship, especially through economic cooperation. In August 2015, both countries
launched a joint feasibility study on a Pakistan-Republic of Korea FTA. Also, the Republic
of Korea is a member of Friends of Democratic Pakistan.

327
(e) Sri Lanka
Official diplomatic relations between Pakistan and Sri Lanka were established in 1949.
Pakistan is the second-largest South Asian trading partner of Sri Lanka. It is meaningful
that Sri Lanka was the first nation to sign a bilateral FTA with Pakistan. Both countries are
members of SAARC and SAFTA. Also, the Pakistan-Sri Lanka FTA has been in effect
since 2005.
(f) Lao People’s Democratic Republic
Diplomatic relations between Pakistan and the Lao People’s Democratic Republic were
established on 15 July 1965.10 Both countries also signed the Bilateral Investment Treaty
in 2004; however, it has yet to enter into force.11
(g) Mongolia
Official diplomatic relations between Pakistan and Mongolia were established on 6 July
1962. Since then, there has been little trade between the two countries.12
B. Trade and trade policy in Pakistan
1. Brief outline of Pakistan’s trade structure
The share of Pakistan in world trade has remained stagnant during the past decade.
The country’s exports to the world amounted to around 0.15% as a percentage of total
world exports. Imports from the rest of the world remained at around 0.25% for 10 years,
except in 2014 when they increased to 0.31% (table 7.4).
Table 7.5 shows the trend of Pakistan’s top 20 export partners during the past 10 years.
Pakistan’s largest export partner in the past decade has been the United States. However,
its importance has tended to shrink, as the United States’ percentage share in Pakistan’s
total exports dropped from 24.9% in 2005 to 14.8% in 2014.
The second-largest export partner was the United Arab Emirates in 2005 and 2010 with
7.6% and 8.4%, respectively. However, that ranking dropped to the fifth in 2014, along with
its percentage, which was at 5.2%.
The rise of China as a major export partner with Pakistan should be noted. It began as
Pakistan’s eighth-largest export partner at 2.7%, but quickly rose to the fourth in 2010 with
6.5%, and reached second place in 2014 with 9.1%.
10 See http://mofa.gov.la/index.php/61-list-of-states-which-the-lao-pdr-has-established-diplomatic-
relations-since-1950/49-1950 (accessed on 1 July 2015).11 See http://investmentpolicyhub.unctad.org/IIA/CountryBits/114#iiaInnerMenu (accessed on 1 July
2015).12 See http://www.mfa.gov.mn/en/index.php?option=com_content&view=article&id=70&Itemid=
170&lang=en (accessed on 1 July 2015).

328
Among the Participating States of APTA, China, Bangladesh, India, the Republic of Korea
and Sri Lanka are in the top 20 list.
India was the fourteenth in 2005 accounting for 2.1% of total exports by Pakistan, but then
dropped to the eighteenth (1.3%) in 2010, followed by a rebound back to the fourteenth
with 1.6%. Although India’s ranking has fluctuated, the country’s importance in terms of
percentage as a total of Pakistan’s exports did not change.
Bangladesh’s proportion increased considerably. Bangladesh was Pakistan’s sixteenth-
largest export partner with 1.5% in 2005 and the ninth with 3% in 2010, and then it was
again at the ninth with 2.8% in 2014.
The Republic of Korea was Pakistan’s nineteenth largest export partner with 1.3% in 2005,
the seventeenth (1.3%) in 2010 and the sixteenth (1.5%) in 2014. Although the volume of
exports from Pakistan to the Republic of Korea has increased, the proportion of the
Republic of Korea has not improved.
Sri Lanka was not among the top 20 largest export partners of Pakistan in 2005. However,
it first entered the list as the sixteenth-largest export partner in 2010 with 1.3% and was
the twentieth with 1.1% in 2014.
Table 7.4. Trade volume of Pakistan
Year
World Pakistan
Exports ImportsExports
WorldImports
World
(US$ million) (US$ million)(US$
(%)(US$
(%)million) million)
2005 9 464 870 10 175 839.5 15 934 0.17 25 043 0.25
2006 11 154 327 11 806 601.7 16 814 0.15 29 817 0.25
2007 12 785 792 13 622 560.4 17 223 0.13 32 589 0.24
2008 14 883 486 15 819 892.2 19 893 0.13 42 298 0.27
2009 11 517 964 12 144 994.0 17 316 0.15 31 583 0.26
2010 14 229 128 14 958 841.9 20 989 0.15 37 513 0.25
2011 16 942 299 17 812 884.9 25 140 0.15 43 542 0.24
2012 16 665 007 17 494 419.3 24 467 0.15 43 813 0.25
2013 17 166 402 17 791 586.4 25 023 0.15 43 775 0.25
2014 14 257 319 15 382 664.9 24 509 0.17 47 414 0.31
Source: United Nations COMTRADE database.
Note: World (%) represents Pakistan’s exports and imports as a percentage of world exports and imports.

329
Table 7.5. Top 20 destinations for exports by Pakistan
Exports in 2005 Exports in 2010 Exports in 2014
Amount Amount Amount
Rank Country (US$ % Country (US$ % Country (US$ %
million) million) million)
1 United States 3 971 24.9 United States 3 638 17.3 United States 3 626 14.8
2 United Arab 1 211 7.6 United Arab 1 769 8.4 China 2 238 9.1
Emirates Emirates
3 Afghanistan 1 064 6.7 Afghanistan 1 670 8.0 Afghanistan 1 879 7.7
4 United Kingdom 905 5.7 China 1 375 6.5 United Kingdom 1 644 6.7
5 Germany 712 4.5 United Kingdom 1 094 5.2 United Arab 1 276 5.2
Emirates
6 Hong Kong, 597 3.7 Germany 972 4.6 Germany 1 204 4.9
China
7 Italy 576 3.6 Turkey 643 3.1 Spain 790 3.2
8 China 432 2.7 Italy 638 3.0 Italy 759 3.1
9 Spain 386 2.4 Bangladesh 636 3.0 Bangladesh 687 2.8
10 Netherlands 378 2.4 Belgium 512 2.4 Netherlands 668 2.7
11 France 362 2.3 Hong Kong, 490 2.3 Belgium 656 2.7
China
12 Saudi Arabia 352 2.2 Spain 474 2.3 Saudi Arabia 509 2.1
13 Belgium 340 2.1 Saudi Arabia 407 1.9 France 419 1.7
14 India 335 2.1 Netherlands 392 1.9 India 391 1.6
15 Turkey 299 1.9 France 350 1.7 Turkey 389 1.6
16 Bangladesh 232 1.5 Sri Lanka 284 1.4 Republic of 376 1.5
Korea
17 South Africa 221 1.4 Republic of 279 1.3 Kenya 333 1.4
Korea
18 Canada 212 1.3 India 269 1.3 Hong Kong, 316 1.3
China
19 Republic of 200 1.3 South Africa 253 1.2 South Africa 290 1.2
Korea
20 Iran, Islamic 178 1.1 Canada 227 1.1 Sri Lanka 266 1.1
Rep. of
Source: United Nations COMTRADE database.
Note: % = percentage of total exports by Pakistan.
Table 7.6 summarizes Pakistan’s top 20 import partners from 2005 to 2014. Saudi Arabia
was the largest import partner of Pakistan, followed by the United Arab Emirates in 2005.
Pakistan’s main imports from those two countries are petroleum-related products. China
was the third-largest import partner of Pakistan, accounting for 9.3% of total imports by
Pakistan in 2005. China’s rank and proportion continued to increase during the next
10 years, to eventually become the largest import partner of Pakistan. The proportion of
China in Pakistan’s total imports was more than 20% in 2014.
As for the Participating States of APTA, the Republic of Korea and India are included in the
list. In 2014, the Republic of Korea’s rank was the eleventh with 2.6%, but its importance
decreased, dropping to fourteenth position (1.4%).

330
In contrast to the Republic of Korea, the importance of India as an import partner was
strengthened. India’s rank was the twelfth with 2.6%, which was lower than the Republic of
Korea’s proportion, in 2005. However, it rose to eighth place (4.2%) in 2010 and sixth
position in 2014.
In terms of the HS 6-digit level, Pakistan’s main export product is HS 100630, followed
by 520512, 630260, 630231 and 630210 (table 7.7). Among the top 20 export products,
12 products are related to the textile industry (HS 520512, 630260, 630210, 610590,
630239, 520942, 620462, 420310, 630710, 610510 and 620342).
Pakistan’s top import products are also fuel-related. The proportion of HS 271019 is the
largest at 16.4%, followed by HS 270900 and 271011. In addition to petroleum-related
products, Pakistan imported considerable amounts of HS 151190, which accounted for
3.7% of total imports, followed by HS 890800 and 490700.
Table 7.6. Top 20 destinations for imports by Pakistan
Imports in 2005 Imports in 2010 Imports in 2014
Amount Amount Amount
Rank Country (US$ % Country (US$ % Country (US$ %
million) million) million)
1 Saudi Arabia 2 651 10.6 United Arab 5 248 14.0 China 9 569 20.2
Emirates
2 United Arab 2 478 9.9 China 5 248 14.0 United Arab 7 071 14.9
Emirates Emirates
3 China 2 338 9.3 Saudi Arabia 3 838 10.2 Saudi Arabia 4 415 9.3
4 Japan 1 631 6.5 Kuwait 2 608 7.0 Kuwait 2 955 6.2
5 United States 1 527 6.1 Malaysia 2 055 5.5 Indonesia 2 099 4.4
6 Kuwait 1 264 5.0 United States 1 628 4.3 India 2 099 4.4
7 Germany 1 143 4.6 Japan 1 595 4.3 United States 1 765 3.7
8 Malaysia 731 2.9 India 1 560 4.2 Japan 1 743 3.7
9 United Kingdom 719 2.9 Germany 961 2.6 Malaysia 1 279 2.7
10 Indonesia 684 2.7 Singapore 914 2.4 Singapore 1 147 2.4
11 Republic of 650 2.6 Iran, Islamic 884 2.4 Oman 1 133 2.4
Korea Rep. of
12 India 576 2.3 Thailand 872 2.3 Germany 1 068 2.3
13 Thailand 538 2.1 Republic of 739 2.0 Thailand 729 1.5
Korea
14 Switzerland 488 1.9 Indonesia 676 1.8 Republic of 655 1.4
Korea
15 Australia 451 1.8 United Kingdom 636 1.7 United Kingdom 597 1.3
16 Singapore 445 1.8 Italy 567 1.5 Italy 466 1.0
17 Italy 436 1.7 Australia 467 1.2 South Africa 440 0.9
18 Sweden 386 1.5 Canada 464 1.2 France 397 0.8
19 Iran, Islamic 363 1.5 France 399 1.1 Afghanistan 392 0.8
Rep. of
20 Russian 356 1.4 South Africa 390 1.0 Ukraine 382 0.8
Federation
Source: United Nations COMTRADE database.
Note: % = percentage of total imports by Pakistan.

331
Table 7.7. Top 20 exports and imports by Pakistan in 2013, HS 6-digit level
Exports
HS 6Amount
% Description(US$ million)
100630 1 790 7.2 Semi-milled or wholly-milled rice, whether or not polished
or glazed: parboiled
520512 1 436 5.7 Cotton yarn (uncombed cotton 85% or more)
630260 760 3.0 Toilet linen, kitchen linen, of terry towelling, of cotton
630231 673 2.7 Other bed linen of cotton
630210 670 2.7 Bed linen, knitted or crocheted
620342 653 2.6 Men’s or boys’ trousers, overalls, breeches, of cotton
630239 598 2.4 Other bed linen, of other textile materials
271019 522 2.1 Petroleum oils and oils obtained from bituminous
minerals, other than crude: distillate and residual fuel oils
(including blended fuel oils),
252329 507 2.0 Other Portland cement
520942 496 2.0 Denim (yarn of different colour; cotton 85% or more;
more than 200 g/m2)
170199 488 1.9 Other cane or beet sugar, chemically pure sucrose
620462 484 1.9 Women’s or girls’ trousers, breeches, of cotton
711319 401 1.6 Articles of jewellery, and parts thereof, of other precious
metal, whether or not plated or clad with precious metal
420310 385 1.5 Articles of apparel, of leather or of composition leather
630710 377 1.5 Floor-cloths, dishcloths, dusters and similar cleaning
cloths
901890 297 1.2 Other medical, surgical or veterinary instruments and
appliances, and parts and accessories
220710 274 1.1 Ethyl alcohol (alcoholic strength 80 degrees or more)
610510 265 1.1 Men’s or boys’ shirts of cotton, knitted or crocheted
100640 254 1.0 Broken rice
610590 226 0.9 Men’s or boys’ shirts of other textile materials, knitted or
crocheted
Imports
HS 6Amount
% Description(US$ million)
271019 7 165 16.4 Petroleum oils and oils obtained from bituminous
minerals, other than crude: distillate and residual fuel oils
(including blended fuel oils)
270900 5 473 12.5 Petroleum oils and oils obtained from bituminous
minerals (crude)
271012 2 092 4.8 Petroleum oils and oils obtained from bituminous
minerals (other than crude) and preparations: light oils
and preparations

332
2. Bilateral trade with Participating States
of APTA
(a) Bangladesh
Pakistan’s exports to Bangladesh amounted to 1.58% of Pakistan’s total merchandise
exports in 2006 and peaked in 2011 at 3.77% (table 7.8). However, the exports dropped to
2.84% in 2012, and have stayed at around the 2012 level.
Pakistan’s imports from Bangladesh are relatively small, compared with its exports to
Bangladesh, reaching 0.19% of Pakistan’s total exports in 2006 (table 7.8) and increasing
to 0.24% in 2010, before dropping to 0.13% in 2014.
151190 1 610 3.7 Palm oil and its fractions (other than crude oil)
890800 963 2.2 Vessels and other floating structures for scrapping
490700 816 1.9 Unused postage, revenue or similar stamps of current or
new issue in the country to which they are destined;
stamp-impressed paper; banknotes; cheques
520100 757 1.7 Cotton (not carded or combed)
851712 634 1.4 Telephones for cellular networks or for other wireless
networks
290243 481 1.1 P-xylene
720449 416 1.0 Other ferrous waste and scrap
710812 389 0.9 Gold in other unwrought forms
390210 374 0.9 Polypropylene, in primary forms
230400 335 0.8 Oil-cake, solid residues resulting from extraction of soya-
bean oil
270119 333 0.8 Coal (other than anthracite, bituminous coal)
120510 323 0.7 Low erucic acid rape or colza seeds
090240 313 0.7 Other black tea (fermented) and other partly fermented
tea
290531 296 0.7 Ethylene glycol (ethanediol)
300220 286 0.7 Vaccines for human medicine
310530 283 0.6 Diammonium hydrogen orthophosphate (diammonium
phosphate)
310210 270 0.6 Urea (whether or not in aqueous solution)
Source: United Nations COMTRADE database.
Table 7.7. (continued)
Imports
HS 6Amount
% Description(US$ million)

333
On the HS 6-digit level, the main product in terms of amount exported from Pakistan to
Bangladesh is HS 520942 (table 7.9), representing almost 30% of total exports to
Bangladesh. All products except HS 390760 are cotton-related.
Table 7.8. Trading by Pakistan with Bangladesh
Exports to Imports from
Year Bangladesh % of total Bangladesh % of total
(US$ million) (US$ million)
2006 265.91 1.58 55.89 0.19
2007 273.63 1.59 62.33 0.19
2008 422.26 2.12 85.93 0.20
2009 365.86 2.11 76.12 0.24
2010 636.27 3.03 73.90 0.20
2011 946.70 3.77 82.73 0.19
2012 695.94 2.84 59.49 0.14
2013 718.32 2.87 57.26 0.13
2014 687.45 2.80 60.24 0.13
Source: United Nations COMTRADE database.
Table 7.9. Trading by Pakistan with Bangladesh, HS 6-digit level
Exports to Bangladesh, 2013 Imports from Bangladesh, 2013
HS 6Amount
% HS 6Amount
%(US$ million) (US$ million)
520942 210 29.2 530310 43 5.9
520932 69 9.6 240120 3 0.4
520100 48 6.7 890110 2 0.3
520512 44 6.1 530710 1 0.2
520532 30 4.1 960200 1 0.1
520919 29 4.0 284700 1 0.1
521142 27 3.8 090220 0 0.1
521223 17 2.4 410622 0 0.1
390760 15 2.1 530720 0 0.0
520911 11 1.5 090240 0 0.0
Source: United Nations COMTRADE database.
Note: % = percentage of each item in total exports and total imports.
(b) China
Pakistan’s exports to China, as a percentage of Pakistan’s total merchandise exports in
2006, reached 3.01% and rapidly increased and peaked in 2012 at 10.69% (table 7.10).
Although the exports to China then declined they still accounted for 9.13% of total exports
by Pakistan in 2014.

334
Pakistan’s imports from China were much higher than its exports, which were more than
double amount of Pakistan’s total imports from 2006 to 2014, accounting for 9.78% and
more than 20%, respectively.
Table 7.10. Trading by Pakistan with China
Exports to Imports from
Year China % of total China % of total
(US$ million) (US$ million)
2006 505.85 3.01 2 914.82 9.78
2007 603.20 3.50 4 163.86 12.78
2008 723.70 3.64 4 737.34 11.20
2009 979.80 5.66 3 779.77 11.97
2010 1 374.71 6.55 5 247.71 13.99
2011 1 668.50 6.64 6 470.65 14.86
2012 2 616.45 10.69 6 687.57 15.26
2013 2 634.78 10.53 6 626.32 15.14
2014 2 237.76 9.13 9 569.05 20.18
Source: United Nations COMTRADE database.
On the HS 6-digit level, exports of HS 520512 in 2013, as a percentage of total exports to
China, amounted to 45.1% (table 7.11), and followed by HS 520912. The proportion of HS
851712 was the highest among Pakistan’s imports in 2013, followed by HS 851762.
Table 7.11. Trading by Pakistan with China, HS 6-digit level
Exports to China, 2013 Imports from China, 2013
HS 6Amount
% HS 6Amount
%(US$ million) (US$ million)
520512 1 188 45.1 851712 622 9.4
520912 124 4.7 851762 148 2.2
520511 122 4.6 540233 145 2.2
261000 109 4.1 310530 138 2.1
100630 102 3.9 851769 135 2.0
520812 72 2.7 401120 121 1.8
520532 72 2.7 854140 110 1.7
520522 71 2.7 550320 101 1.5
251512 46 1.8 853939 90 1.4
520911 45 1.7 890800 83 1.2
Source: United Nations COMTRADE database.
Note: % = percentage of each item in total exports and total imports.

335
(c) India
Pakistan’s exports to India amounted to 1.94% of Pakistan’s total merchandise exports in
2006, decreasing to 1.08% in 2011 before rebounding to 1.60% in 2014 (table 7.12).
Pakistan’s imports from India steadily increased from 3.74% in 2006, with a brief decline to
3.42% in 2009. Since 2013, the imports have remained above 4% (table 7.12).
Table 7.12. Trading by Pakistan with India
Exports to Imports from
Year India % of total India % of total
(US$ million) (US$ million)
2006 326.04 1.94 1 114.99 3.74
2007 290.53 1.69 1 266.23 3.89
2008 352.77 1.77 1 690.77 4.00
2009 232.86 1.34 1 080.40 3.42
2010 269.03 1.28 1 559.92 4.16
2011 272.50 1.08 1 607.33 3.69
2012 347.31 1.42 1 572.59 3.59
2013 401.88 1.61 1 874.06 4.28
2014 391.28 1.60 2 098.68 4.43
Source: United Nations COMTRADE database.
On the HS 6-digit level, the main product in terms of the amount exported from Pakistan to
India was HS 080410 at 18.3% of the total exports to India, followed by HS 740400. The
main product in terms of the amount imported from India was HS 520100 (15.7%), followed
by HS 230400 (table 7.13).
Table 7.13. Trading by Pakistan with India, HS 6-digit level
Exports to India, 2013 Imports from India, 2013
HS 6Amount
% HS 6Amount
%(US$ million) (US$ million)
080410 73 18.3 520100 295 15.7
740400 29 7.2 230400 291 15.6
170199 27 6.7 070200 128 6.8
252329 25 6.1 290243 124 6.6
520100 20 5.0 390210 91 4.8
120740 18 4.6 390120 38 2.0
271019 18 4.6 071310 37 2.0
290321 15 3.7 320416 30 1.6
252010 15 3.7 090240 28 1.5
291736 14 3.6 070310 25 1.4
Source: United Nations COMTRADE database.
Note: % = percentage of each item of total exports and total imports.

336
(d) Republic of Korea
Pakistan’s exports to the Republic of Korea amounted to 1.05% of the country’s total
merchandise exports in 2006 and steadily increased to peak at 1.60% in 2011 (table 7.14).
Although exports by Pakistan to the Republic of Korea declined slightly thereafter, they
remained at around 1.5% in 2013 and 2014.
Pakistan’s imports from the Republic of Korea generally remained close to 2% of the
country’s total imports from 2006 to 2014 (table 7.14), with the exception of 2008 (1.67%),
2012 (1.57%) 2014 (1.38%).
Table 7.14. Trading by Pakistan with the Republic of Korea
Exports to the Imports from the
YearRepublic of
% of totalRepublic of
% of totalKorea Korea
(US$ million) (US$ million)
2006 177.23 1.05 614.09 2.06
2007 181.89 1.06 637.32 1.96
2008 207.60 1.04 707.48 1.67
2009 237.09 1.37 627.25 1.99
2010 278.94 1.33 739.14 1.97
2011 401.70 1.60 837.19 1.92
2012 329.87 1.35 685.71 1.57
2013 397.17 1.59 858.66 1.96
2014 376.01 1.53 655.17 1.38
Source: United Nations COMTRADE database.
On the HS 6-digit level, the main product in terms of the amount exported from Pakistan
to the Republic of Korea was HS 220710 at 28.3% of total exports, followed by HS 220720
(table 7.15).
The main product in terms of the amount imported from the Republic of Korea by Pakistan
was HS 890800 at 23% of total imports, followed by HS 271019.

337
(e) Sri Lanka
Pakistan’s exports to Sri Lanka remained stable with minimal fluctuation from 2006 to 2014
(table 7.16). Of Pakistan’s total exports in 2006 and 2014, exports to Sri Lanka amounted
to 1.04% and 1.09%, respectively.
Pakistan’s imports from Sri Lanka, which were much lower than its exports, declined steadily
from 2006 to 2014 (table 7.16). In 2006, imports to Sri Lanka amounted to 0.24% of
Pakistan’s total imports and in 2014 they had decreased to just 0.13%.
Table 7.15. Trading by Pakistan with the Republic of Korea, HS 6-digit level
Exports to the Republic of Imports from the Republic of
Korea, 2013 Korea, 2013
HS 6Amount
% HS 6Amount
%(US$ million) (US$ million)
220710 112 28.3 890800 197 23.0
220720 44 11.0 271019 31 3.7
520812 34 8.5 840690 24 2.8
520512 22 5.6 840681 22 2.6
740400 19 4.9 292910 20 2.3
411310 15 3.7 320416 18 2.1
520523 15 3.7 390230 18 2.0
520513 7 1.9 390330 14 1.6
410792 7 1.7 550200 13 1.5
520532 7 1.7 630900 12 1.4
Source: United Nations COMTRADE database.
Note: % = percentage of each item in total exports and total imports.
Table 7.16. Trading by Pakistan with Sri Lanka
Exports to Imports from
Year Sri Lanka % of total Sri Lanka % of total
(US$ million) (US$ million)
2006 174.99 1.04 70.97 0.24
2007 208.53 1.21 59.79 0.18
2008 216.58 1.09 66.22 0.16
2009 214.26 1.24 55.79 0.18
2010 283.77 1.35 53.37 0.14
2011 347.71 1.38 61.13 0.14
2012 300.87 1.23 83.41 0.19
2013 316.35 1.26 63.52 0.15
2014 265.96 1.09 61.38 0.13
Source: United Nations COMTRADE database.

338
On the HS 6-digit level, the main product in terms of the amount exported from Pakistan to
Sri Lanka was HS 252329 at 14% of total exports, followed by 170199 (table 7.17). The
largest amount of imports from Sri Lanka was HS 140490, which accounted for more than
27% of total imports, followed by HS 441112 and HS 090411.
Table 7.17. Trading by Pakistan with Sri Lanka, HS 6-digit level
Exports to Sri Lanka, 2013 Imports from Sri Lanka, 2013
HS 6Amount
% HS 6Amount
%(US$ million) (US$ million)
252329 44 14.0 140490 17 27.3
170199 34 10.9 441112 5 7.7
520932 25 8.0 090411 4 6.6
520942 23 7.4 071340 4 6.2
100110 23 7.3 400122 4 6.1
730690 15 4.6 441114 3 5.0
520911 13 4.2 400121 3 4.8
070190 12 3.8 080119 3 4.5
100630 10 3.3 080111 3 4.4
300490 9 3.0 090240 2 3.0
Source: United Nations COMTRADE database.
Note: % = percentage of each item in total exports and total imports.
(f) Lao People’s Democratic Republic and Mongolia
Trading between Pakistan and the Lao People’s Democratic Republic and Mongolia was
miniscule (tables 7.18 and 7.19). The total trade of exports and imports, between Pakistan
and the Lao People’s Democratic Republic and Mongolia did not exceed $1 million from
2006 to 2014.
Table 7.18. Trading by Pakistan with the Lao People’s Democratic
Republic and Mongolia
Lao People’s Democratic Republic Mongolia
Year Exports % of Imports % of Exports % of Imports % of
(US$ total (US$ total Year (US$ total (US$ total
million) million) million) million)
2006 0.18 0.00 0.16 0.00 2006 0.06 0.00 0.12 0.00
2007 0.23 0.00 0.02 0.00 2007 0.00 0.00 0.19 0.00
2008 0.10 0.00 0.16 0.00 2008 0.07 0.00 0.00 0.00
2009 0.17 0.00 0.04 0.00 2009 0.02 0.00 0.02 0.00
2010 0.08 0.00 0.00 0.00 2010 0.08 0.00 0.00 0.00
2011 0.25 0.00 0.00 0.00 2011 0.18 0.00 0.02 0.00
2012 0.47 0.00 0.00 0.00 2012 0.11 0.00 0.01 0.00
2013 0.76 0.00 0.17 0.00 2013 0.28 0.00 0.00 0.00
2014 0.76 0.00 0.01 0.00 2014 0.14 0.00 0.04 0.00
Source: United Nations COMTRADE database.

339
3. Trade policy regime13
Despite liberalization, Pakistan’s overall tariff levels are still high (table 7.20), which weakens
its productivity growth, impedes efficient resource allocation and hinders its integration into
global value chains. Moreover, extempore trade policy instruments under Statutory
Regulatory Orders (SROs) remain common, which naturally leads to rent-seeking behaviour.
Tariffs and tax-related SROs were due to be eliminated by the end of 2015, which will
significantly improve the transparency of Pakistan’s trade policy regime.
Table 7.19. Trading by Pakistan with the Lao People’s Democratic Republic and
Mongolia in 2013, HS 6-digit level
Exports to Imports from Exports to Imports from
the Lao PDR the Lao PDR Mongolia Mongolia
Amount Amount Amount Amount
HS 6 (US$ % HS 6 (US$ % HS 6 (US$ % HS 6 (US$ %
million) million) million) million)
300439 0 62.2 380991 0 57.8 300390 0 35.5 851769 0 50.3
300490 0 12.3 720827 0 42.2 300490 0 22.0 220190 0 32.9
901890 0 8.1 040900 0 15.5 853339 0 16.8
300410 0 7.5 621139 0 10.1
411200 0 3.2 210690 0 6.2
520831 0 3.0 410719 0 3.8
520932 0 2.3 901890 0 2.9
540752 0 0.6 950662 0 1.1
410719 0 0.6 210310 0 0.8
540744 0 0.1 481720 0 0.5
Source: United Nations COMTRADE database.
Note: % = percentage of each item in total exports and total imports.
13 WTO, 2015a and 2015b.
Table 7.20. Tariff profile in Pakistan
Total AgriculturalNon-
Tariffs Year(%) (%)
agricultural
(%)
Simple average final bound 60.0 95.5 54.8
Simple average MFN applied 2013 13.5 15.4 13.2
Trade weighted average 2012 1.0 7.1 10.4
Imports in US$ billion 2012 44.0 5.6 38.4
Binding coverage 2013 98.7 99.0
Maximum duty (binding) 2013 200.0 200.0 100.0
Maximum duty (MFN applied) 2013 100.0 90.0 100.0
Source: WTO, 2014, World Tariff Profiles.

340
Tariffs, input subsidies and price supports are Pakistan’s main agricultural policy measures.
Since the eighteenth Constitutional Amendment was adopted, a large number of
responsibilities in agricultural policy decisions have been shifted to provincial governments.
Many agricultural and food products have been subject to extemporaneous measures
under SROs. A certain number of products have also been subject to export prohibitions;
price supports have been retained for wheat. Since 2008, Pakistan has submitted no
notifications to WTO regarding domestic support.
The level of protection in the manufacturing sector is exceptionally high in the automotive
industry, with the imposition of duties of up to 100%. Coupled with limited domestic
competition among a few assemblers, the high level of protection results in prices for
passenger cars in Pakistan, that are substantially higher than in other countries.
To deal with high tariff levels, the Government of Pakistan has initiated a three-year
process for rationalizing its custom duties. The main objective of the rationalizing process
is to cut the maximum tariff and the total number of tariffs. The reforms of trade policy are
focusing on the simplification of tariff rates, the phasing out of SROs that set special tariff
rates or non-tariff trade barriers in about 4,000 product areas, and the improvement of
trade relations to ensure a more competitive environment.
The Government of Pakistan is in the three-year process of finalizing the arrangement of
the new system for simplifying the tariff structure. A simple and transparent framework is
being established with a minimum number of exceptions. During the 2014/15 fiscal year,
the number of tariff slabs was cut from seven to six. All items at 30% have been adjusted
to a new maximum rate of 25%. In order to support fiscal consolidation by maintaining
budget surpluses for fiscal sustainability, the country’s provinces are preparing to phase in
the new system.
4. Trade Agreements14
(a) WTO
Pakistan is one of the original members of WTO and provides, at minimum, most favoured
nation (MFN) treatment to most WTO members (except India) as well as some non-WTO
members. Pakistan is in the process of providing India with non-discriminatory market
access (NDMA). Under the NDMA scheme, Pakistan is expected to reduce the number of
items on the sensitive list to 100 tariff lines. Trade with Israel is prohibited. Pakistan has
actively participated in the Doha Round of negotiations and has shown strong support for
effective rules based on the international trading system.
(b) South Asian Free Trade Area
The South Asian Free Trade Area (SAFTA), which entered into force on 1 January 2006,
has statutory force for Pakistan. Tariff reductions were initiated in July 2006 and are
scheduled to be completed by December 2016.
14 WTO, 2015b.

341
Under Trade Liberalization Programme of SAFTA, Pakistan’s tariff reduction was to take
place in two phases. Under Phase I, from 2006 to 2008, tariff rates above 20% were
reduced to 20% in two years while tariff rates below 20% were reduced on
a margin of preference (MoP) basis of 10% per year. Under Phase II, from 2008 to 2013,
tariff rates were reduced to between zero and 5% within five years. Goods on the sensitive
list are excluded from tariff cuts. The sensitive list of Pakistan comprises 938 tariff lines at
the HS 6-digit level. Items in the services sector are exempt from concession.
(c) Pakistan-Sri Lanka FTA
The Pakistan-Sri Lanka FTA entered into force on 12 June 2005. Under the provisions of
the FTA, tariffs were removed for approximately 90% of Pakistan’s tariff lines on
an MoP basis. Items in the negative list are excluded for tariff reductions. Pakistan has
607 HS 6-digit tariff items on the list. Its tariffs on 206 HS 6-digit items were immediately
reduced to zero.
Margins of preference of 20% were immediately applied to five HS 6-digit items. Another
26 HS 6-digit tariff items are subject to tariff rate quotas. These include tea. Pakistan has
fulfilled its first- and second-stage commitments and implemented its final stage in June
2008. Both countries agreed to include services and investment.
(d) Pakistan-China FTA
The Pakistan-China FTA came into force on 1 July 2007. During the first five years,
designated tariffs were continuously reduced or eliminated. Pakistan’s tariff reductions
include approximately 5,900 HS 8-digit items, which is around 85% of total tariff items.
Tariff rates for items, in category I, were reduced immediately by 25% and were phased
out in three equal installments by 2010, which represents 35.6% of the HS 8-digit tariff
items. The rates for items in category II were immediately cut by 20% and were lowered to,
or below, 5% in five equal installments by 2012 (19.9% of tariff items). The rates for
category III were immediately reduced by 8% and were phased out to a 50% MoP in five
equal installments by 2012 (2% of tariff items). The rates for category IV were lowered
immediately by 3% and were phased out to a 20% MoP in five equal installments by 2012
(26.1% of tariff items). However, the items in category V and VI are not subject to
concessions or reductions.
The Agreement on Trade in Services between Pakistan and China became effective on
10 October 2009. Under the provisions of the Agreement, Pakistan provides China with
access to 11 sectors and 107 subsectors out of a possible 160 subsectors on a national
treatment basis. China has provided Pakistan with market access to 11 sectors and 133
subsectors on a national treatment basis. The Agreement was being renegotiated.

342
(e) Malaysia-Pakistan Closer Economic Partnership Agreement
The Malaysia-Pakistan Closer Economic Partnership Agreement (MPCEPA) entered into
force on 1 January 2008. The Agreement was Pakistan’s first comprehensive FTA, covering
trade in goods and services, investment and economic cooperation. For merchandise
trade, Pakistan eliminated tariffs on 43.2% of the imports from Malaysia by 2012. Malaysia
eliminated tariffs on 78% of imports from Pakistan. Pakistan lowered the tariff on seven
palm oil tariff lines by 15% margin of preference, 10% in 2008 and an additional 5% in
2010. The Agreement is being reviewed.
Regarding trade in services, both countries have provided WTO-plus market access to
each other. In computer and IT-related services, Islamic banking and Islamic insurance,
Pakistan has secured 100% equity in Malaysia. Mutual recognition arrangements are also
covered in the MPCEPA. These arrangements offer a framework for accreditation of
educational institutions and academic programmes. The agreement also includes
a chapter on investment.
(f) Pakistan-Iran Preferential Trade Agreement
The Pakistan-Iran Preferential Trade Agreement (PTA) came into force on 1 September
2006. Pakistan extended preferential tariff margins of 5, 10, 15, 20 or 30% (mainly 10%
and 30%) on 338 HS 6-digit tariff items from 1 September 2007. According to the authorities,
trade under the Agreement is minimal due to international sanctions on the Islamic Republic
of Iran.
(g) Pakistan-Mauritius Preferential Trade Agreement
The PTA between Pakistan and the Republic of Mauritius was signed on 30 July 2007 and
became effective on 30 November 2007. The Agreement provides for tariffs to be
substantially lowered or phased down within two years of the date of effectuation.
Pakistan agreed to extend its preferential tariffs, initially 50%, and full elimination after one
year to the Republic of Mauritius on a wide range of items including fresh flowers, fruit, tea,
tinned tuna, sugar, soap, certain food preparations and products, receiving a preferential
tariff margin of 40%. However, these are subject to tariff quotas totalling some eight million
pieces annually.
Six memoranda of understanding were also signed to promote bilateral trade and
cooperation, including customs, small and medium-sized enterprises, state trading
corporations, technical standards, sanitary and phytosanitary measures, fisheries and export
promotion.
Both nations stated that trade under the Agreement was concentrated in rice and did not
cover other sectors; as such, they expect to hold negotiations on an FTA.

343
(h) Pakistan-Indonesia Preferential Trade Agreement15
The Pakistan-Indonesia PTA entered into force on 1 September 2013. Under the PTA,
Indonesia provides Pakistan with market access at preferential rates on export products
including fresh fruit, cotton yarn, cotton fabrics, ready-made garments, fans (ceiling, table
and pedestal), sports goods (badminton and tennis rackets), leather goods and other
industrial products. In addition, Indonesia provides Pakistan with market access to kinnow
at 0% tariff. In a similar manner, Pakistan provides Indonesia with market access at
preferential tariff rates.
Customs duties have been reduced on 313 items. Moreover, Pakistan extends a 15% MoP
over the standard tariff rate to palm oil products from Indonesia, similar to that extended to
Malaysian palm oil products under the MPCEPA.
(i) Plurilateral and other arrangements
Negotiations are in progress with the Gulf Cooperation Council (Bahrain, Kuwait, Oman,
Qatar, Saudi Arabia and the United Arab Emirates). Pakistan has also agreed to joint
studies on possible free or preferential trade agreements with Japan, the Republic of
Korea and ASEAN.
(j) Organization of Islamic Conference16
The Organization of Islamic Conference (OIC) is the second-largest intergovernmental
organization after the United Nations. Its membership includes 57 States across four
continents. The OIC seeks to represent the collective voice as well as safeguard and
protect the interests of the Muslim world in promoting world peace and harmony. The
Framework Agreement on the Trade Preferential System among OIC member States
comprises 18 signatories, including Pakistan. The Protocol on Preferential Tariff Scheme
for TPS-OIC (PRETAS) called for specific tariff reductions on an agreed schedule. The
second round of negotiations, initiated in November 2006, declared a road map and target
date of 1 January 2009 to establish PRETAS. Pakistan has signed and ratified the
Agreement, but it has yet to enter into force as it has not been ratified by all its members.
(k) Developing-8 group of countries17
The Developing-8 (D-8) group of countries is an organization for the development and
economic cooperation among the eight member countries, i.e., Pakistan, Bangladesh,
Egypt, Indonesia, the Islamic Republic of Iran, Malaysia, Nigeria and Turkey. The member
States signed the Preferential Trade Agreement (PTA) during the fifth D-8 summit in 2006.
The PTA requests tariffs above 10% to be lowered in four annual instalments, and eight
annual instalments for least developed members, on 8% of the members’ total tariff lines.
15 See http://aric.adb.org/fta/pakistan-indonesia-free-trade-agreement (accessed on 1 September 2015).16 See http://www.oic-oci.org/oicv2/home/?lan=en (accessed on 9 April 2015).17 See http://www.developing8.org/ (accessed on 9 April 2015).

344
Visa, customs and shipping agreements were reached, but the agreement is not yet in
force as it has not been ratified by all parties.
(l) Economic Cooperation Organization18
Under the Economic Cooperation Organization (ECO) Agreement, Pakistan is expected to
offer preferential tariff margins of 10 percentage points on the same imported items as
those eligible under SAFTA. Tariffs are to be reduced to a maximum rate of 15% in eight
years, except for Afghanistan (15 years). Items on the sensitive list are excluded
from tariff reductions. Initially, the number of sensitive goods was limited to 1% of
HS 6-digit items. The coverage of the positive list of tariff reductions is to be expanded
proportionately in eight years in equal annual stages to 80% of the members’ tariff lines.
The Agreement excludes trade in services and it has yet to be implemented as it has not
yet been ratified by all member countries.
(m) Other preferential arrangements
Pakistan has retained preferential tariffs under the GATT Protocol Relating to Trade
Negotiations among Developing Countries and the Global System of Trade Preferences
(GSTP). It has also made commitments regarding the third round of GSTP negotiations
which has been concluded but yet to be implemented.
C. Potential gains from Pakistan’s accession
to APTA
1. Analysis of comparative advantage
This section investigates those items in which Pakistan has a comparative advantage and
which are conceded by the Participating States of APTA. To do this, Pakistan’s revealed
comparative advantage (RCA) for each item at the HS 6-digit level has been calculated.
Second, the items having RCAs greater than one have been selected. Last, each
Participating State of APTA’s MoP list and the items of Pakistan with an RCA greater than
1 have been matched in order to identify the items in which Pakistan has a comparative
advantage. They have then been included with the items that can be conceded by each
Participating State of APTA.
18 The ECO is an intergovernmental regional organization that was established in 1985. Its purpose is
to promote economic, technical and cultural cooperation among the member States. ECO is the
successor organization to the Regional Cooperation for Development (RCD) that existed from 1964 to
1979. Current membership includes Afghanistan, Azerbaijan, the Islamic Republic of Iran, Kazakhstan,
Kyrgyzstan, Pakistan, Tajikistan, Turkey, Turkmenistan and Uzbekistan. See www.ecosecretariat.org/
detail_info/about_eco_d.htm (accessed on 9 April 2015).

345
Revealed Comparative Advantage
RCA is a measure based on the Ricardian theory for calculating the relative advantage or
disadvantage of trade in a specific sector. An RCA between 0 and 1 indicates a comparative
disadvantage, whereas an RCA above 1 reveals comparative advantage. In the context of
this study, the formula is shown in equation (1):
............................................................................................................. (1)
where Xij is Pakistan’s exports to the world in a given product or sector i; Xwj is total exports
by Pakistan to the world; Xi is the world’s exports of a product to the world; and Xw is total
exports by the world. An index that is greater than 1 indicates that a country’s proportion of
exports in that sector exceeds the proportion of world exports in the same sector. In such
a case, it is inferred that the country has a comparative advantage in that sector.
In the context of Pakistan, if the RCA in a certain sector is greater than 1, then Pakistan
has a revealed comparative advantage in that sector, which means that a RCA in a given
sector is an indication of Pakistan’s competitiveness in the said sector on the world
market.
The advantage of using the RCA is that it is consistent with changes in a country’s relative
factor endowment and productivity. However, it is sometimes argued that an RCA is not
appropriate in that it is a better measure of competitiveness rather than of comparative
advantage, due to the fact that a high volume of exports can result from market distortions,
such as governmental subsidies or manipulated exchange rates.
2. Results
(a) Bangladesh
Upon examination of Bangladesh’s APTA concession list and the items of Pakistan’s RCA,
Pakistan has a comparative advantage in 27 items at the HS 6-digit level in Bangladesh’s
concession list. The RCAs of these 27 items range from 1.04 to 67.36. The highest MoP
is 70, given by HS 842099 (calendaring or other rolling machines, other than for metals
or glass, and cylinders, HS 8420), whereas the item that has the highest RCA of 67.36, is
HS 611692 (cotton in gloves, mittens and mitts, knitted or crocheted, HS 6116).
(b) China
In China’s case, Pakistan has a comparative advantage in 240 items, at the HS 6-digit
level in China’s APTA concession list. For the items having an RCA greater than 1, the
range is from 1.01 to 381.33.

346
Among the Participating States of APTA, China’s concession list includes the largest
number of items from Pakistan with an RCA greater than 1. The highest MoP is 50 for
27 items in the list. Pakistan has a comparative advantage greater than 100 for 17 items.
Including these items, there are 95 items from Pakistan with an RCA of 10 or higher. The
item having the highest RCA, 381.33, is HS 520912 (3-thread or 4-thread twill, including
cross twill – plain weave – unbleached, HS 52091).
(c) India
In the case of India, there are 74 items at the HS 6-digit level in which Pakistan has
a comparative advantage in India’s APTA concession list. Among the items with an RCA
greater than 1, the range is from 1.03 to 316.72. There are four items with an MoP of 100,
which means total tariff elimination to the Participating States of APTA. The item having the
highest RCA, 316.72, is HS 252610 (not crushed, not powdered – natural steatite, whether
or not roughly trimmed or merely cut, by sawing or otherwise, into blocks or slabs of
a rectangular – including square – shape; talc, HS 2526). There are six items for which
Pakistan has an RCA greater than 100. Among the items with an RCA of more than 100,
22 items have an RCA greater than 10 in the concession list.
(d) Republic of Korea
Examination of the Republic of Korea’s APTA concession list and Pakistan’s RCAs, at the
HS 6-digit level reveals that there are 156 matches between items in the Republic of
Korea’s concession list and items in which Pakistan has a comparative advantage. These
RCAs ranges from 1.01 to 486.62. The highest RCA recorded by Pakistan was 486.62,
which is HS 521021 (plain weave – bleached – woven fabrics, of cotton, containing less
than 85% by weight of cotton, mixed mainly or solely with man-made fibres, weighing not
more than 200 g/m2, HS 5210). Nine items have an RCA greater than 100. Including those
items, there are 58 items with an RCA greater than 10. The highest MoP given by the
Republic of Korea is 50.
(e) Lao People’s Democratic Republic
In case of the Lao People’s Democratic Republic, it is found that there are 84 items, at the
HS 6-digit level, in which Pakistan has a comparative advantage in the list of the
Lao People’s Democratic Republic’s APTA concession. Among the items having RCA
greater than 1, the range is from 1.07 to 370.11. The item having the highest RCA, 370.11,
is HS 630210 (bed linen, knitted or crocheted). There are five items in which Pakistan has
an RCA greater than 100. Including the items with an RCA greater than 100, there are
26 items with RCA greater than 10 in the concession list.
(f) Mongolia
Upon examination of Mongolia’s APTA concession list and Pakistan’s items with RCA,
there are 36 items at the HS 6-digit level, in which Pakistan has a comparative advantage
in Mongolia’s concession list. The range of these items is between 1.16 and 351.15. The
highest RCA for Pakistan in this list is 351.15, which is HS 520531 (measuring per single

347
yarn, 714.29 decitex or more, not exceeding 14 metric number per single yarn – cotton
yarn (other than sewing thread), containing 85% or more by weight of cotton, not put up for
retail sale, HS 5205). There is only 1 item, HS 520531, having an RCA greater than 100
and there are 20 items including HS 520531, which have RCA greater than 10. The
highest MoP given by Mongolia is 30 and the lowest is 10, excluding zero MoP.
(g) Sri Lanka
Examination of Sri Lanka’s APTA concession list and Pakistan’s RCAs reveals that at the
HS 6-digit level there are 41 matching items, from 1.59 to 139.76, in the concession list, in
which Pakistan has a comparative advantage greater than 1. The highest RCA of Pakistan
in this list is 139.76, which is HS 420321 (specially designed for use in sports – gloves,
mittens and mitts – articles of apparel and clothing accessories, of leather or of composition
leather, HS 4203). Two items have an RCA greater than 100 and there are 12 items which
have RCA greater than 10. The highest MoP given by Sri Lanka is 50 and the lowest is
five, excluding zero MoP.
(h) Pakistan’s potential as a Participating State of APTA
Table 7.21 shows Pakistan’s potential to increase its exports to the APTA Participating
States by acceding to APTA. In table 7.21, “RCA > 1 & MoP applied” indicates the amount
of goods in which Pakistan has comparative advantage in the world market and at the
same time for which the Participating States of APTA provide accession rates based on
MoP.
The right-hand column in table 7.21 provides these amounts as a percentage of total
imports from Pakistan. The findings in the table imply that Pakistan’s exports to China and
India could have greater potential than those to the Republic of Korea, Bangladesh and
Sri Lanka. In China’s case, 88.8% of total imports from Pakistan comprise items that, in
addition to Pakistan’s RCA being greater than 1, are also included in the General Concession
List of China.
Table 7.21. Pakistan’s potential competitiveness in
APTA through RCAs
RCA >1 and MoP Total imports from% of total
Country applied Pakistanimports
(US$ million) (US$ million)
Bangladesh 17.5 963.2 1.8
China 2 143.9 3 196.8 67.1
India 336.6 379.2 88.8
Republic of Korea 52.7 522.1 10.1
Lao PDR
Mongolia
Sri Lanka 1.5 378.7 0.4
Source: Authors’ calculation using the RCA measure.
Note: Bangladesh’s imports are for 2011 while the other countries’ imports are for 2013.

348
3. Partial equilibrium analysis
A partial equilibrium analysis was employed to analyse the effects of Participating States of
APTA tariff concessions on Pakistan’s exports.
While a general equilibrium analysis incorporates all markets’ interactions simultaneously,
the partial equilibrium model only considers the effects of a given policy action – i.e.,
reductions of tariffs – in markets or products that are directly affected. This implies that the
model does not account for the interactions between the markets (or products) in an
economy. However, the partial equilibrium analysis is advantageous in several ways. The
main advantage is that the data requirement is minimal. The only data required are trade
flows, tariffs, policy changes and elasticities of markets or products. Therefore, this can
take advantage of the rich dataset that is publicly available. In addition, another advantage,
thanks to the minimal data requirement, is that the partial equilibrium model can target
markets at a fairly disaggregated level.
However, the partial equilibrium model also has disadvantages. It relies on previous time-
series data (flows of trade), which make results sensitive to pre-determined parameters in
the model; thus, interpretations of the results should be viewed with caution.
(a) SMART model
SMART is a static partial equilibrium model developed by the United Nations Conference
for Trade and Development (UNCTAD) and the World Bank during the 1980s. Its main
objective was to assess the impact of the General Agreement on Trade and Tariffs (GATT)
rounds and it is based on the theory proposed by Laird and Yeats (1986). SMART is based
on the equilibrium demand of a product as a function of relative prices between domestic
and foreign goods.
A trade policy reform leads to tariff reduction on a specific product that is imported from
a country, which results in a decrease in the price of the product imported from that
country. This, in turn, causes a change in the relative price between domestic and the
exporting country’s products. As a result, demand for domestic products decreases while
increasing for the products from the foreign country. The degree of change depends on the
price elasticity of demand for the foreign country’s product in the domestic market. The
increase in import from the foreign country is called the trade creation effect, relying on the
volume of imports and price elasticity. In addition, the relative price between the beneficiary
country and other foreign countries changes due to the tariff reduction, as imports from
other foreign countries decrease at the expense of the increase in imports from the
beneficiary country. This is called the trade diversion effect, depending on elasticity of
substitution between the imported goods.
One of the advantages of using SMART is that it has the ability to analyse the effects of
changes in trade policy in case of imperfect substitutes. It is more appropriate than
a model with homogenous products when tariff preferences are examined as corner solutions
are avoided. SMART can be used to analyse the tariff effects of a single market on
disaggregated product levels up to the HS 6-digit level.

349
This study employed the data and the SMART model that are provided by World Integrated
Trade Solution (WITS) to simulate the impact of tariff concessions offered by the Participating
States of APTA on Pakistan’s products. More specifically, this study analyses the trade
benefits for Pakistan when acceding to APTA, both in terms of trade creation and trade
diversion.
In the SMART model, a linear-quasi utility function is used in equation (2). The assumption
is that the utility is determined as a function of demand for imported goods and a numeraire
good.
........................................................................................................ (2)
In equation (2), n represents a numeraire good, and mj stands for imported good j. There is
no substitution between n and mj, as linear utility function is assumed.
The solutions of utility maximization argument under a budget constraint provide equilibrium
demands for the imported and the numeraire goods, as shown in equations (3) and (4).
................................................................................................ (3)
......................................................................................... (4)
where mj, i
is a good j imported from country i, is the domestic price of good j imported
from country i and are domestic prices of good j imported from the rest of the world
except country i.
The tariff is defined as the difference between the domestic price and world price; thus, the
relationship between the prices and tariff can be derived as equation (5):
............................................................................................................ (5)
where is the world price of good j and is the tariff rate on good j imported from the
country i.
The key interest is the effects of tariff reduction, i.e., the tariff concession in favour of the
Participating States of APTA. The trade concession effects are estimated by adjusting the
MoP in equation (6):
pdj,i
pdj,≠i
jpw pdj,i

350
............................................................................................................ (6)
where θj,i represents the margin of preference on imported good j from country i.
Price elasticity of demand with regard to imported good j can be expressed as equation (7):
............................................................................................................. (7)
There are two main effects stemming from tariff reductions. One is the trade creation effect
and the other is the trade diversion effect.
The trade creation effect can be defined as the increase in demand in the domestic
country for a good imported from the partner country, resulting from a decrease in the
price, associated with price changes due to a tariff cut.
Trade diversion is a tendency of importers to substitute a good from one to another source
in response to a change in price by one exporter, but not others. This implies that if
prices fall in one foreign country and those in the rest of the world do not, then there is
a tendency to import more goods from the foreign country and less from the rest of the
world.
The trade creation effect can be calculated using the definition of the price elasticity as in
equation (8):
.................................................................................................. (8)
Using the variables introduced in this section, equation (8) is written in equation (9) as:
............................................................................................... (9)
It is possible that there is substitution of imports from the rest of the world to country j;
therefore elasticity of substitution is important in calculating the trade diversion effect.
Elasticity of substitution of imported good j between country i and rest of the world is
defined in equation (10):
.................................................................................... (10)

351
where mj,≠ i
is imports of good j from the rest of the world except country i.
Using equation (9), the trade diversion effect is derived in equation (11):
................................................... (11)
For Pakistan’s benefits, TCj,i is the increased imports of good j from Pakistan due to
concession of tariffs in a Participating State of APTA. TDj,i is the amount of imports of good
j that is diverted from the rest of the world to Pakistan. Similarly, each Participating State of
APTA’s benefits are calculated in terms of trade creation and trade diversion effects.
In this study, equations (9) and (11) were utilized to estimate the effects of trade creation
and trade diversion, respectively. In both equations, tariff shock is given by while
tj,i
is the accession rate for good j, derived from equation (6), and is the applied MFN rate
for good j.
(b) Data
For the analysis of Pakistan’s benefits from acceding to APTA, the imports by the
Participating States of APTA from Pakistan or the rest of the world except Pakistan were
used. For the analysis of the benefits gained by the Participating States of APTA from
Pakistan’s accession to APTA, Pakistan’s imports in 2013 from the rest of the world and
from each Participating State of APTA were used.
The import data were drawn from the United Nations Common Format for Transient Data
Exchange (COMTRADE). With the exception of Bangladesh, the year of imports is 2013.
In Bangladesh’s case, 2011 data were used for imports due to the fact that 2013 data were
not available in COMTRADE. Correspondingly, the import data were based on HS 2012
for all Participating States of APTA except Bangladesh. For 2011 data for Bangladesh,
HS 2007 was used.
Pre-determined parameters (elasticities and tariffs) in SMART are drawn from the UNCTAD
Trade Analysis Information System (TRAINS) in WITS. Own price elasticities are drawn
from Kee, Nicita and Olarreaga (2008) in SMART. Elasticity of substitution is assumed to
be 1.5 for all products. Elasticity of export supply is assumed to be 99, which is close to
infinite (Lang, 2006). Tariffs are the MFN tariff rates. The base of MFN tariffs is 2013,
except Bangladesh, to which 2011 MFN tariffs are applied. Tariff policy changes are drawn
from the national list of general tariff concessions concluded in the APTA Fourth Round
negotiations.
tdj,i
(tj,i
– td ),j,i

352
D. Potential impact on exports of Pakistan
to current Participating States
of APTA
This section analyses the results of the total effects of Pakistan’s exports to the Participating
States of APTA, which are the sum of trade creation and trade diversion, from a SMART
simulation. The results from simulations do not present the estimates for the Lao People’s
Democratic Republic and Mongolia due to the fact that the effects are minimal in the case
of Mongolia, while import data are not available in COMTRADE for the Lao People’s
Democratic Republic. From the perspective of Pakistan, the estimate of the export effect,
as a percentage of total imports of the other five Participating States of APTA from Pakistan,
is 1.84% (table 7.22).
Table 7.22. Implications of Pakistan’s concessions offered
by five Participating States of APTA
(US$ thousand)
Participating StateTrade effect
of APTATC TD Total as % of total
imports
Bangladesh 928.207 178.832 1 107.039 0.11
China 47 531.210 7 631.250 55 162.460 1.73
India 6 991.339 1 627.299 8 618.638 2.27
Republic of Korea 31 649.120 1 618.819 33 267.939 6.37
Sri Lanka 1 226.627 777.225 2 003.852 0.53
Total 88 326.503 11 833.425 100 159.928 1.84
Source: Authors’ calculation using SMART model.
Note: TC – trade creation effect; TD – trade diversion effect; and % = total imports is trade effect as
a percentage of total imports in each Participating State of APTA.19
19 The exporting country is Pakistan, and the importing countries are the Participating States of APTA.
Thus, from the perspective of Pakistan, trade effects mean export effects to the current APTA Participating
States.
In terms of the United States dollar, the increase in imports from Pakistan is largest from
China. However, as a percentage of total imports from Pakistan by each Participating
State of APTA, the benefit for Pakistan from acceding to the APTA is the highest with the
Republic of Korea, followed by India, China, Sri Lanka and Bangladesh, respectively.
Again, for Pakistan the impact from APTA accession is the greatest in connection with the
Republic of Korea. Pakistan will be able to obtain a more than 6% increase in its exports to
the Republic of Korea.
As expected, trade creation dominates, and overall trade creation and trade diversion are
1.62% and 0.22%, respectively, as the share of total imports. This tendency does not
change in trade with each Participating State of APTA.

353
Actual benefits for Pakistan from accession to APTA could be higher than the estimates
due to the fact that the general concession list of each Participating State of APTA is used.
Under the assumption that the special concession list of each Participating State of APTA
for LDCs is applied to Pakistan’s products, the trade benefits for Pakistan as a new
Participating State of APTA would be much higher than the estimates in this study.
1. Bangladesh
The trade creation effect from Bangladesh’s tariff concessions is the highest in the case of
HS 611692 (gloves, mittens and mitts, knitted or crocheted; of cotton) followed by
HS 100110 (durum wheat), 121190 (plants and parts of plants; other), 845180 (machinery
for washing, cleaning, wringing, drying, ironing etc.; other machinery) and 611699 (gloves,
mittens and mitts, knitted or crocheted; of other textile materials) (table 7.23).
Table 7.23. Benefits for Pakistan from concessions offered
by Bangladesh
(US$ thousand)
HS 6 TC Tariff MoP
611699 14.279 0.25 0.20
845180 14.725 0.03 0.30
121190 23.327 0.12 0.20
100110 47.710 0.03 0.20
611692 742.082 0.25 0.20
HS 6 TD Tariff MoP
380991 9.989 0.05 0.10
844630 10.646 0.03 0.30
611692 10.646 0.25 0.20
845180 20.467 0.03 0.30
100110 56.549 0.03 0.20
Source: Authors’ calculation using SMART model.
Note: TC – trade creation effect; TD – trade diversion effect; and tariff is the MFN applied tariff rate for each product.
The trade diversion effect from Bangladesh’s tariff concessions is the largest in HS 100110,
followed by HS 845180, 611692, 844630 (weaving machines, i.e., looms; for weaving
fabrics of a width exceeding 30 cm., shuttleless type), 380991 (finishing agents, dye
carriers to accelerate the dyeing or fixing of dyestuffs and other products and preparations
– for example, dressings and mordants; other: of a kind used in the textile or like industries).
The overall trade effect is not effective in Bangladesh’s case. The greatest benefit for
Pakistan from Bangladesh’s concessions may come from HS 611692.

354
2. China
The trade creation effect from China’s tariff concessions is the highest in the case of
HS 520512 (cotton yarn – other than sewing thread – containing 85% or more by weight of
cotton, not put up for retail sale; single yarn, of uncombed fibres: measuring less than
714.29 decitex, but not less than 232.56 decitex exceeding 14 metric number but not
exceeding 43 metric number), followed by HS 410441 (tanned or crust hides and skins of
bovine or equine animals, without hair on, whether or not split, but not further prepared; in
the dry state (crust): full grains, unsplit; grain splits), 520912 (woven fabrics of cotton,
containing 85% or more by weight of cotton, weighing more than 200 g/m2 ; unbleached:
3-thread or 4-thread twill, including cross twill), 520511 (cotton yarn – other than sewing
thread – containing 85% or more by weight of cotton, not put up for retail sale; single yarn,
of uncombed fibres: measuring 714.29 decitex or more, not exceeding 14 metric number),
and 251512 (marble and travertine; merely cut, by sawing or otherwise, into blocks or
slabs of a rectangular – including square – shape) (table 7.24).
Table 7.24. Benefits for Pakistan from concessions offered by China
(US$ thousand)
HS 6 TC Tariff MoP
251512 1 853.349 0.04 0.50
520511 2 619.533 0.05 0.30
520912 5 130.374 0.10 0.35
410441 5 945.619 0.05 0.30
520512 18 248.870 0.05 0.30
HS 6 TD Tariff MoP
520522 1 456.932 0.05 0.30
411310 1 475.202 0.14 0.30
520511 1 578.718 0.05 0.30
251512 1 872.771 0.04 0.50
080290 2 187.381 0.25 0.50
Source: Authors’ calculation using SMART model.
Note: TC – trade creation effect; TD – trade diversion effect; and tariff is the MFN applied tariff rate for each product.
The trade diversion effect from China’s concessions is the highest in HS 080290
(areca nuts; other), followed by HS 251512, 520511, 411310 (leather further prepared after
tanning or crusting, including parchment-dressed leather, of other animals, without wool or
hair on, whether or not split, other than leather of heading 41.14; of goats or kids), and
520522 (cotton yarn – other than sewing thread – containing 85% or more by weight
of cotton, not put up for retail sale; single yarn, of combed fibres: measuring less than
714.29 decitex, but not less than 232.56 decitex exceeding 14 metric number but not
exceeding 43 metric number).
Although the increased imports from Pakistan may not be large for China, it is not insignificant
to Pakistan; thus, Pakistan would benefit as its imports to China increase by acceding to
APTA.
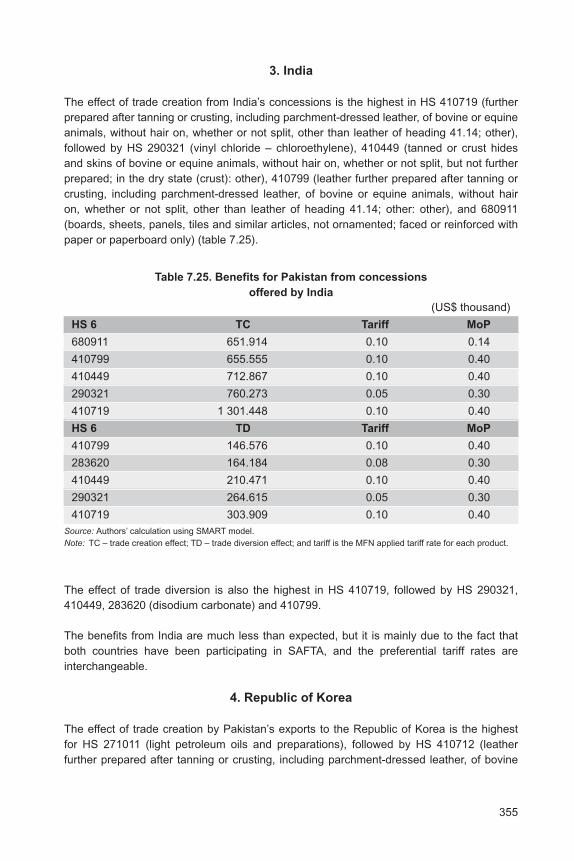
355
3. India
The effect of trade creation from India’s concessions is the highest in HS 410719 (further
prepared after tanning or crusting, including parchment-dressed leather, of bovine or equine
animals, without hair on, whether or not split, other than leather of heading 41.14; other),
followed by HS 290321 (vinyl chloride – chloroethylene), 410449 (tanned or crust hides
and skins of bovine or equine animals, without hair on, whether or not split, but not further
prepared; in the dry state (crust): other), 410799 (leather further prepared after tanning or
crusting, including parchment-dressed leather, of bovine or equine animals, without hair
on, whether or not split, other than leather of heading 41.14; other: other), and 680911
(boards, sheets, panels, tiles and similar articles, not ornamented; faced or reinforced with
paper or paperboard only) (table 7.25).
Table 7.25. Benefits for Pakistan from concessions
offered by India
(US$ thousand)
HS 6 TC Tariff MoP
680911 651.914 0.10 0.14
410799 655.555 0.10 0.40
410449 712.867 0.10 0.40
290321 760.273 0.05 0.30
410719 1 301.448 0.10 0.40
HS 6 TD Tariff MoP
410799 146.576 0.10 0.40
283620 164.184 0.08 0.30
410449 210.471 0.10 0.40
290321 264.615 0.05 0.30
410719 303.909 0.10 0.40
Source: Authors’ calculation using SMART model.
Note: TC – trade creation effect; TD – trade diversion effect; and tariff is the MFN applied tariff rate for each product.
The effect of trade diversion is also the highest in HS 410719, followed by HS 290321,
410449, 283620 (disodium carbonate) and 410799.
The benefits from India are much less than expected, but it is mainly due to the fact that
both countries have been participating in SAFTA, and the preferential tariff rates are
interchangeable.
4. Republic of Korea
The effect of trade creation by Pakistan’s exports to the Republic of Korea is the highest
for HS 271011 (light petroleum oils and preparations), followed by HS 410712 (leather
further prepared after tanning or crusting, including parchment-dressed leather, of bovine

356
Table 7.26. Benefits for Pakistan from concessions offered
by the Republic of Korea
(US$ thousand)
HS 6 TC Tariff MoP
410791 639.729 0.05 0.50
410711 4 758.513 0.05 0.50
410792 4 777.561 0.05 0.50
410712 4 868.006 0.05 0.50
271011 15 507.460 0.02 0.10
HS 6 TD Tariff MoP
410712 96.338 0.05 0.50
620462 104.657 0.13 0.40
950662 117.440 0.08 0.30
411310 172.999 0.05 0.30
271011 436.373 0.02 0.10
Source: Authors’ calculation using SMART model.
Note: TC – trade creation effect; TD – trade diversion effect; and tariff is the MFN applied tariff rate for each product.
or equine animals, without hair on, whether or not split, other than leather of heading
41.14; whole hides and skins: grain splits), 410792 (other; grain splits), 410711 (whole
hides and skins; full grains, unsplit), and 410791 (other; full grains, unsplit) (table 7.26).
The effect of trade diversion is also the highest in HS 271011, followed by HS 411310,
950662 (inflatable balls other than golf balls and table-tennis balls, such as soccer balls
and basketball), 620462 (cotton in trousers, bib and brace overalls, breeches and shorts
for women or girls), and 410712.
As already indicated, the benefits for Pakistan are expected to be the highest from
concessions by the Republic of Korea. Especially in the case of HS 271011 (light petroleum
oils and preparations), the trade effect is estimated to be $20 million, which is not a trivial
amount. The margin of preference is only 10% and the effects of both trade creation and
trade diversion are substantial. Assuming that the Republic of Korea’s concessions for
Pakistan’s products could be even more generous, Pakistan would be able to obtain
greater benefits as a Participating State of APTA.
5. Sri Lanka
The effect of trade creation by Pakistan’s exports to Sri Lanka is the highest in HS 730630
(other tubes, pipes and hollow profiles of iron or steel; other, welded, of circular
cross-section, of iron or non-alloy steel), followed by HS 030559 (dried fish, other than
edible fish offal, whether or not salted but not smoked; other), 410799, 611692, 650700
(head-bands, linings, covers, hat foundations, hat frames, peaks and chinstraps, for
headgear) (table 7.27).

357
The effect of trade diversion for Pakistan is also the highest in HS 730630, followed by
HS 030559, 611692, 410799 and 650700.
The benefits for Pakistan from Sri Lanka would be minimal due to the fact that both
countries have been participating in SAFTA, similar to the case of India.
E. Potential impact on imports to Pakistan
from current Participating States
of APTA
This section shows the results of the total trade effects, sum of trade creation and trade
diversion. It is understood that for the accession to APTA, Pakistan will have to first offer
items on which it intends to give tariff concessions and being a developing country it has to
match with the modality of Fourth Round concessions and then negotiate with APTA
member countries to expand the list or enhance the concessions. However, a prediction on
Pakistan’s offer cannot be done in this study. Rather we take the least obligation position
meaning thereby that its list of concessions is the same as Bangladesh’s list. This would
give the least case scenario and since Pakistan will offer a better concessions gains would
be much higher than the projections in the study. The results imply the effect of Pakistan’s
accession to APTA and impact of concessions on imports of Pakistan from the current
Participating States of APTA.
The results from the simulations do not present the estimates for the Lao People’s
Democratic Republic and Mongolia due to the fact that the effects would be minimal in the
case of both countries.
Table 7.27. Benefits for Pakistan from concessions
offered by Sri Lanka
(US$ thousand)
HS 6 TC Tariff MoP
650700 1.804 0.30 0.10
611692 16.476 0.15 0.10
410799 97.661 0.15 0.50
030559 104.309 0.05 0.50
730630 1 002.920 0.15 0.50
HS 6 TD Tariff MoP
650700 1.746 0.30 0.10
410799 14.411 0.15 0.50
611692 16.280 0.15 0.10
030559 146.610 0.05 0.50
730630 593.328 0.15 0.50
Source: Authors’ calculation using SMART model.
Note: TC – trade creation effect; TD – trade diversion effect; and tariff is the MFN applied tariff rate for each product.

358
From the perspective of Pakistan, the estimates on import effects, sum of trade creation
and trade diversion, as a percentage of the imports from the five APTA Participating States
as a whole is only 0.29% (table 7.28), which is not significant, compared with the estimates
on the increase in exports of Pakistan to the current Participating States of APTA. However,
it is mainly due to the fact that trade between Pakistan and the APTA Participating States
is simply not large enough. This situation would be better off in favour of the existing APTA
Participating States as Pakistan joins the APTA and the volume of trade between Pakistan
and other APTA Participating States increases.
Table 7.28. Implications of Pakistan’s concessions offered
to five Participating States of APTA
(US$ thousand)
Participating StateTrade effect
of APTATC TD Total as % of total
imports
Bangladesh 44.412 7.506 51.918 0.09
China 15 680.690 4 929.820 20 610.510 0.31
India 2 689.303 2 635.364 5 324.667 0.28
Republic of Korea 537.419 408.355 945.773 0.11
Sri Lanka 206.089 128.924 335.013 0.53
Total 19 157.913 8 109.969 27 267.882 0.29
Source: Authors’ calculation using SMART model.
Note: TC – trade creation effect; TD – trade diversion effect; and % = total imports is trade effect as
a percentage of total imports in each Participating State of APTA.20
20 The importing country is Pakistan and the exporting countries are the Participating States of APTA.
Thus, from the perspective of Pakistan, trade effects mean import effects from the current Participating
States of APTA.
In terms of the United States dollar, the trade effects are the largest in China. However, as
a percentage of total imports from each country, the benefit from Pakistan’s accession is
the highest for Sri Lanka, followed by China, India, the Republic of Korea and Bangladesh.
The increase in imports from Pakistan is largest in China. However, the benefits for the five
Participating States of APTA is merely $2.7 million, and, overall, the trade effects are lower
than those for Pakistan in merchandise trade.
1. Bangladesh
The trade creation effect from Pakistan’s tariff concessions for Bangladesh is the largest in
HS 890110 (cruise ships, excursion boats and similar vessels principally designed for the
transport of persons; ferry-boats of all kinds), followed by HS 611610 (gloves, mittens and
mitts, knitted or crocheted; impregnated, coated or covered with plastics or rubber), 121190
(plants and parts of plants; other), 844839 (parts and accessories of machines of heading
84.45 or of their auxiliary machinery; other), and 940510 (chandeliers and other electric
ceiling or wall lighting fittings, excluding those of a kind used for lighting public open
spaces or through-fares) (table 7.29).

359
Table 7.29. Benefits for Bangladesh from concessions
offered by Pakistan
(US$ thousand)
HS 6 TC Tariff MoP
940510 0.087 0.28 0.15
844839 0.088 0.05 0.10
121190 0.459 0.05 0.20
611610 16.998 0.25 0.20
890110 26.765 0.10 0.20
HS 6 TD Tariff MoP
844849 0.015 0.08 0.10
844839 0.052 0.05 0.10
940510 0.105 0.28 0.15
121190 0.180 0.05 0.20
611610 7.151 0.25 0.20
Source: Authors’ calculation using SMART model.
Note: TC – trade creation effect; TD – trade diversion effect; and tariff is the MFN applied tariff rate for each product.
The trade diversion effect for Bangladesh is the largest in HS 611610, followed by
HS 121190, 940510, 844839, and 844849 (parts and accessories of weaving machines,
i.e., looms, or of their auxiliary machinery; other). Overall, as already shown in the previous
section, the trade effect is trivial in the case of Bangladesh.
2. China
The trade creation effect from Pakistan’s tariff concessions for China is the highest in
HS 722530 (flat-rolled products of other alloy steel, of a width of 600 mm or more; other,
not further worked than hot-rolled in coins), followed by HS 720890 (flat rolled products of
iron or non-alloy steel, of a width of 600 mm or more, hot-rolled not clad, plated or coated;
other), 850211 (electric generating sets and rotary converters; generating sets with
compression-ignition internal combustion piston engines (diesel or semi diesel engines): of
an output not exceeding 75 kVA), 854370 (electrical machines and apparatus, having
individual functions, not specified or included elsewhere in the chapter; other machines
and apparatus), and 730423 (drill pipe of stainless steel; other drill pipe) (table 7.30).
The trade diversion effect for China is the largest in HS 730423, followed by HS 840991
(parts suitable for use solely or principally with the engines of heading 84.07 or 84.08;
other: suitable for use solely or principally with spark-ignition internal combustion piston
engines), 850213 (electric generating sets and rotary converters; generating sets with
compression-ignition internal combustion piston engines (diesel or semi diesel engines);
of an output exceeding 375 kVA), 850211, and 540244 (other yarn, single, untwisted or
with a twist not exceeding 50 turns per metre; elastomeric).

360
3. India
The trade creation effect from Pakistan’s tariff concessions for India is the highest in HS
290243 (cyclic hydrocarbons; xylenes: p-xylene), followed by HS 121190, 560749 (twine,
cordage, ropes and cables, whether or not plaited or braided and whether or not
impregnated, coated, covered or sheathed with rubber or plastic; of polyethylene or
polypropylene: other), 120300 (copra) and 290241 (cyclic hydrocarbons; xylenes: o-xylene)
(table 7.31).
Table 7.30. Benefits for China from concessions
offered by Pakistan
(US$ thousand)
HS 6 TC Tariff MoP
730423 1 178.773 0.15 0.20
854370 1 585.746 0.12 0.15
850211 1 669.536 0.15 0.15
720890 2 099.854 0.15 0.20
722530 2 583.977 0.05 0.20
HS 6 TD Tariff MoP
540244 204.569 0.05 0.30
850211 225.375 0.15 0.15
850213 264.129 0.08 0.35
840991 364.547 0.28 0.10
730423 537.180 0.15 0.20
Source: Authors’ calculation using SMART model.
Note: TC – trade creation effect; TD – trade diversion effect; and tariff is the MFN applied tariff rate for each product.
Table 7.31. Benefits for India from concessions
offered by Pakistan
(US$ thousand)
HS 6 TC Tariff MoP
290241 118.553 0.05 0.30
120300 127.361 0.10 0.20
560749 169.981 0.25 0.70
121190 194.709 0.05 0.20
290243 1 474.049 0.05 0.30
HS 6 TD Tariff MoP
845180 44.263 0.05 0.30
844520 64.552 0.05 0.30
401161 96.018 0.20 0.15
290241 125.362 0.05 0.30
290243 1 969.796 0.05 0.30
Source: Authors’ calculation using SMART model.
Note: TC – trade creation effect; TD – trade diversion effect; and tariff is the MFN applied tariff rate for each product.

361
The trade diversion effect for India is the largest in HS 290243, followed by HS 290241,
401161 (new pneumatic tyres, of rubber; other, with a “herring-bone” or similar tread: of
a kind used in agricultural or forestry vehicles and machines), 844520 (textile spinning
machines), and 845180.
4. Republic of Korea
The trade creation effect from Pakistan’s tariff concessions for the Republic of Korea is the
largest in HS 270720 (oils and other products of the distillation of high temperature coal
tar; similar products in which the weight of the aromatic constituents exceeds that of the
non-aromatic constituents; toluol or toluene), followed by HS 540244, 870120 (road tractors
for semi-trailers), 853590 (electrical apparatus for switching or protecting electrical circuits,
or for making connections to or in electrical circuits, for a voltage exceeding 1,000 volts;
other) and 290230 (cyclic hydrocarbons; toluene) (table 7.32).
The trade diversion effect for the Republic of Korea is the largest in HS 870120, followed
by HS 540244, 853590, 290532 (Acyclic alcohols and their halogenated, sulphonated,
nitrated or nitro-sated derivatives; diols: propylene glycol – propane-1, 2-diol) and 320411
(synthetic organic colouring matter and preparations; disperse dyes and preparations).
5. Sri Lanka
The trade creation effect from Pakistan’s tariff concessions for Sri Lanka is the largest in
HS 080119 (coconuts; other), followed by HS 080111 (coconuts; desiccated), 401511
(gloves, mittens and mitts; surgical), 090411 (pepper; neither crushed nor ground), and
611610 (gloves, mittens and mitts, knitted or crocheted; impregnated, coated or covered
with plastics or rubber) (table 7.33).
Table 7.32. Benefits for the Republic of Korea from
concessions offered by Pakistan
(US$ thousand)
HS 6 TC Tariff MoP
290230 30.872 0.05 0.10
853590 38.240 0.10 0.10
870120 39.201 0.20 0.20
540244 59.849 0.05 0.30
270720 100.644 0.05 0.20
HS 6 TD Tariff MoP
320411 23.379 0.10 0.10
290532 27.172 0.05 0.30
853590 32.259 0.10 0.10
540244 48.020 0.05 0.30
870120 65.291 0.20 0.20
Source: Authors’ calculation using SMART model.
Note: TC – trade creation effect; TD – trade diversion effect; and tariff is the MFN applied tariff rate for each product.

362
The trade diversion effect for Sri Lanka is the largest in HS 080111, followed by 401511,
401161, 090411 and 121300 (cereal straw and husks, unprepared, whether or not chopped,
ground, pressed or in the form of pellets).
F. New area of cooperation with Pakistan
under APTA
1. Overview of trade in services and foreign
investment in Pakistan
(a) Services sector
Pakistan’s services sector currently represents a major share of its economy. The
latest data show that Pakistan’s services sector accounted for 58.8% of GDP in the
2014/15 fiscal year (figure 7.5). During the last decade, there was little variation in the
structure of Pakistan’s economy. The share of the agricultural sector decreased from 23%
to 20.9%, whereas the share of the services sector increased from 56% to 58.8%. There
was almost no change in the share of the industrial sector during this period. The importance
of the services sector in relation to activities within Pakistan’s economy has been gradually
increasing.
Table 7.33. Benefits for Sri Lanka from concessions offered
by Pakistan
(US$ thousand)
HS 6 TC Tariff MoP
611610 8.608 0.25 0.20
090411 10.609 0.04 0.10
401511 26.911 0.20 0.10
080111 60.453 0.05 0.60
080119 71.023 0.05 0.70
HS 6 TD Tariff MoP
121300 8.929 0.05 0.20
090411 13.471 0.04 0.10
401161 15.240 0.20 0.15
401511 18.934 0.20 0.10
080111 51.270 0.05 0.60
Source: Authors’ calculation using SMART model.
Note: TC – trade creation effect; TD – trade diversion effect; and tariff is the MFN applied tariff rate for each product.
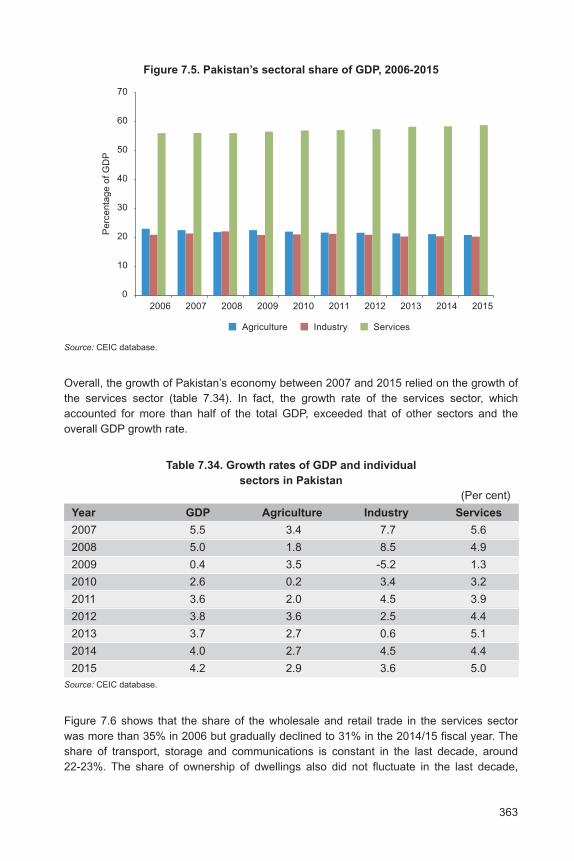
363
Overall, the growth of Pakistan’s economy between 2007 and 2015 relied on the growth of
the services sector (table 7.34). In fact, the growth rate of the services sector, which
accounted for more than half of the total GDP, exceeded that of other sectors and the
overall GDP growth rate.
Source: CEIC database.
Figure 7.5. Pakistan’s sectoral share of GDP, 2006-2015
0
10
20
30
40
50
60
70
2006 2007 2008 2009 2010 2011 2012 2013 2014 2015
Pe
rce
nta
ge
of
GD
P
Agriculture Industry Services
Table 7.34. Growth rates of GDP and individual
sectors in Pakistan
(Per cent)
Year GDP Agriculture Industry Services
2007 5.5 3.4 7.7 5.6
2008 5.0 1.8 8.5 4.9
2009 0.4 3.5 -5.2 1.3
2010 2.6 0.2 3.4 3.2
2011 3.6 2.0 4.5 3.9
2012 3.8 3.6 2.5 4.4
2013 3.7 2.7 0.6 5.1
2014 4.0 2.7 4.5 4.4
2015 4.2 2.9 3.6 5.0
Source: CEIC database.
Figure 7.6 shows that the share of the wholesale and retail trade in the services sector
was more than 35% in 2006 but gradually declined to 31% in the 2014/15 fiscal year. The
share of transport, storage and communications is constant in the last decade, around
22-23%. The share of ownership of dwellings also did not fluctuate in the last decade,
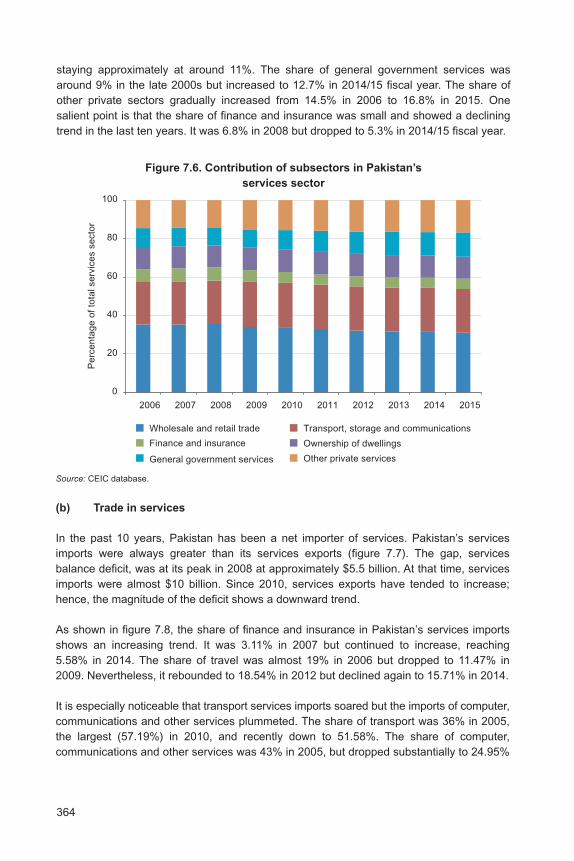
364
staying approximately at around 11%. The share of general government services was
around 9% in the late 2000s but increased to 12.7% in 2014/15 fiscal year. The share of
other private sectors gradually increased from 14.5% in 2006 to 16.8% in 2015. One
salient point is that the share of finance and insurance was small and showed a declining
trend in the last ten years. It was 6.8% in 2008 but dropped to 5.3% in 2014/15 fiscal year.
Figure 7.6. Contribution of subsectors in Pakistan’s
services sector
Source: CEIC database.
0
20
40
60
80
100
2006 2007 2008 2009 2010 2011 2012 2013 2014 2015
Pe
rce
nta
ge
of
tota
l se
rvic
es s
ecto
r
Wholesale and retail trade Transport, storage and communications
Finance and insurance Ownership of dwellings
General government services Other private services
(b) Trade in services
In the past 10 years, Pakistan has been a net importer of services. Pakistan’s services
imports were always greater than its services exports (figure 7.7). The gap, services
balance deficit, was at its peak in 2008 at approximately $5.5 billion. At that time, services
imports were almost $10 billion. Since 2010, services exports have tended to increase;
hence, the magnitude of the deficit shows a downward trend.
As shown in figure 7.8, the share of finance and insurance in Pakistan’s services imports
shows an increasing trend. It was 3.11% in 2007 but continued to increase, reaching
5.58% in 2014. The share of travel was almost 19% in 2006 but dropped to 11.47% in
2009. Nevertheless, it rebounded to 18.54% in 2012 but declined again to 15.71% in 2014.
It is especially noticeable that transport services imports soared but the imports of computer,
communications and other services plummeted. The share of transport was 36% in 2005,
the largest (57.19%) in 2010, and recently down to 51.58%. The share of computer,
communications and other services was 43% in 2005, but dropped substantially to 24.95%

365
0
10
20
30
40
50
60
70
2005 2006 2007 2008 2009 2010 2011 2012 2013 2014
Pe
rce
nta
ge
of
tota
l se
rvic
es im
po
rts
Finance and insurance TransportTravelComputer, communications
and other services
in 2010 and rebounded only slightly to 27.13% in 2014. From 2005 the share of computer,
communications and other services was larger than that of transport services until 2007;
the situation subsequently reversed in favour of transport services. In addition, Pakistan’s
transport services demand from abroad is now much higher than IT-related services.
Figure 7.7. Trade and balance of services
in Pakistan
Source: World Bank database, World Development Indicators.
-10
-5
0
5
10
15
2005 2006 2007 2008 2009 2010 2011 2012 2013 2014
Bill
ion
s o
f U
nite
d S
tate
s d
olla
rs
Exports Imports Services balance deficit
Figure 7.8. Trends of Pakistan’s services imports
by major items
Source: World Bank database.

366
The share of finance and insurance in Pakistan’s services exports shows a gradually
increasing trend from 2005 (3.9%) to a peak in 2009 (5.8%) and a slightly dropping to
4.8% in 2014 (figure 7.9). The share of travel in Pakistan’s services exports was 9% in
2005, increased to 12.7% in 2007 but dropping to 8.1% in 2014.
Figure 7.9. Trends of Pakistan’s services exports
by major items
Source: World Bank database.
and other servicesComputer, communication
0
10
20
30
40
50
60
2005 2006 2007 2008 2009 2010 2011 2012 2013 2014
Pe
rce
nta
ge
of
tota
l se
rvic
es e
xp
ort
s
Finance and insurance TransportTravel
In response to the case of services imports, there was a change in the trend of services
exports. The share of computer, communications and other services substantially increased
and the share of transport dropped sharply. The share of computer, communications and
other services in services exports was 34.1% in 2005, rising to 48.8% in 2014. In contrast,
the share of transport services was 53% in 2005 but thereafter dropped continuously to
38.4% in 2014. As a result, the contribution of transport services and that of computer,
communications and other services reversed from 2012.
The importance of the services sector is identified by its degree of growth and its contribution
to Pakistan’s economy. Overall, the growth rate of the services sector exceeded that of the
economy as a whole and its share of GDP was more than half.
Similar to other developing countries, the role of finance and insurance is not large.
Therefore, finance and insurance are suitable industries should be regarded as a new area
for cooperation between Pakistan and the Participating States of APTA, especially with
relatively developed nations such as China and the Republic of Korea.

367
(c) Foreign investment
Table 7.35 shows the recent trends of foreign direct investment (FDI) in Pakistan from
2010 to 2015. The inflow of FDI was more than $3 billion in 2010 but dropped to nearly
$2 billion in 2012. It then recovered to slightly more than $2.8 billion in 2014 and slightly
decreased to $2.7 billion in 2015. The outflow of FDI was relatively stable at around
$1 billion, except during 2011 and 2015 which were approximately at $0.6 billion and
$1.8 billion, respectively.
Table 7.35. Summary of foreign investment in Pakistan,
2010-2015
(US$ million)
Year
Foreign direct Foreign
investment portfolio
investment Total (net)
Net
2010 3 184.3 1 033.5 2 150.8 587.9 2 738.7
2011 2 269.6 634.8 1 634.8 364.6 1 999.3
2012 2 099.1 1 278.4 820.7 -60.0 760.6
2013 2 665.3 1 208.9 1 456.4 119.6 1 576.0
2014 2 847.4 1 148.8 1 698.6 622.8 2 321.4
2015 2 732.0 1 809.1 922.9 917.3 1 840.2
Source: State Bank of Pakistan.21
Note: Foreign public investment is excluded. Pakistan’s fiscal year runs from 1 July to 30 June.
Inflow Outflow Net
21 Summary of foreign investment in Pakistan by Zarar Askari, available at http://www.sbp.org.pk/
ecodata/NetinflowSummary.pdf.
The trend of net FDI reveals a decline. It dropped sharply from just over $2 billion in 2010
to $0.82 billion in 2012. Although net FDI recovered to almost $1.7 billion in 2014, it again
decreased to $0.9 billion in 2015.
Figure 7.10 shows the inflow of FDI by country of origin in fiscal year 2014/15, using the
latest data available. China, with a 38.8% share of total FDI inflows ($1.06 billion), is the
leading source of FDI inflows to Pakistan, followed by the United Kingdom with 9.7%
($264.1 million), the United Arab Emirates with 9.2% ($252.6 million), and the United
States with 8.3% ($225.5 million). Figure 8.17 also indicates that almost 90% of the FDI to
Pakistan originated from the top 10 countries, among which, China is the only Participating
State of APTA.

368
44.4%
12.9%
8.3%
7.4%
5.2%
3.0%
2.9%
2.9%1.9%
1.9% 9.2%China
France
Switzerland
Saudi Arabia
United Kingdom
Egypt
Sweden
Netherlands
Qatar
United Arab Emirates
Other countries
Figure 7.11 shows the outflow of FDI by destination countries in fiscal year 2014/15. It is
interesting to note that the share of FDI outflows is also the largest in China’s case with
a 44.4% share of total FDI outflows ($802.5 million), followed by France with 12.9%
($233 million), Switzerland with 8.3% ($151 million), Saudi Arabia with 7.4% ($133.2
million) and the United Kingdom with 5.2% ($94.5 million). Among the top 10 shares of FDI
inflows as shown in figure 7.10, China, Switzerland, Saudi Arabia, the United Arab Emirates
and the United Kingdom are included in terms of the top 10 shares of FDI outflows. This
implies that there could be a link, such as the global value chain, between the inflow and
outflow of FDI through Pakistan, among these five countries. Here, China is the only
Participating State of APTA.
Figure 7.10. Pakistan’s FDI inflows: Top investors’ share
(fiscal year 2014/15)
Source: State Bank of Pakistan.
38.8%
9.7%9.2%
8.3%
5.6%
5.0%
4.3%
2.7%
2.5%
1.8% 12.1%China
United Kingdom
United Arab Emirates
United States
Switzerland
Hong Kong, China
Italy
Japan
Saudi Arabia
Turkey
Other countries
Figure 7.11. Pakistan’s FDI outflows: Share of top destination countries
(fiscal year 2014/15)
Source: State Bank of Pakistan.

369
Figure 7.12 indicates that net FDI inflows in Pakistan were relatively diversified in fiscal
year 2014/15. The largest FDI inflow was from China ($256.8 million), followed by the
United Arab Emirates ($218.8 million), the United States ($208.9 million), the United Kingdom
($169.6 million), Hong Kong, China ($136.2 million), Italy ($115.4 million) and Japan
($71.1 million). In terms of net FDI inflows, China is the only Participating State of APTA in
this listing.
In the case of China, the FDI inflows to Pakistan were $1.06 billion whereas the FDI
outflows to China were $802.5 million. Similarly, the amount of FDI inflows exceed by that
of FDI outflows to the United Arab Emirates, the United States, the United Kingdom as well
as other countries shown in figure 7.12.
Figure 7.12. Pakistan’s net FDI inflows (fiscal year 2014/15)
Source: State Bank of Pakistan.
Note: Unlike figures 7.10 and 7.11, shares are not used in figure 7.12 due to the fact that total net FDI inflows are the
sum of positive and negative values of net FDI inflows in millions of United States dollars.
256.8
218.8 208.9
169.6
136.2
115.4
71.1
43.4
24.8 23.4
0
50
100
150
200
250
300
Mill
ion
s o
f U
nite
d S
tate
s d
olla
rs
Chi
na
Uni
ted
Ara
b Em
irate
sU
nite
d Sta
tes
Uni
ted
Kin
gdom
Hon
g H
ong,
Chi
na
Italy
Japa
n
Turk
ey
Aus
tria
Sin
gapo
re
Figure 7.13 shows the share of top 10 investor countries of net foreign portfolio investment
in Pakistan in fiscal year 2014/15, which was mainly dominated by the United States
(65.3%), followed by Luxembourg (27.4%) and the United Kingdom (25%). Among APTA
Participating States, China is the only Participating State investing in financial market of
Pakistan.

370
Figure 7.14 shows the share of top 10 investor countries of Pakistan’s net foreign private
investment, which is the sum of net foreign direct investment and net foreign portfolio
investment. In terms of net inflow of funds from abroad, the United States’ contribution was
the highest at $837.7 million, followed by the United Kingdom ($399.1 million), China
($268.1 million), Luxembourg ($252.6 million) and the United Arab Emirates ($230.4 million).
Figure 7.13. Pakistan’s net foreign portfolio investment:
Top investors’ share (fiscal year 2014/15)
Source: State Bank of Pakistan.
65.3%
27.4%
25.0%
1.2%
1.3%
0.7% 0.5%
0.3%
0.1%2.1%
United States
Luxembourg
United Kingdom
Australia
United Arab Emirates
China
Finland
Canada
Japan
Liberia
Figure 7.14. Net foreign private investment in Pakistan
(fiscal year 2014/15)
Source: State Bank of Pakistan.
808.3
399.1
268.1 252.6 230.4
115.4 74.0 72.7
29.1 24.8
0
100
200
300
400
500
600
700
800
900
Mill
ion
s o
f U
nite
d S
tate
s d
olla
rs
Uni
ted
Sta
tes
Uni
ted
Kin
gdom
Chi
naLu
xem
bour
g
Uni
ted
Ara
b Em
irate
s
Italy
Japa
n
Hon
g Kon
g, C
hina
Turk
ey
Aus
tria

371
Table 7.36 shows the FDI inflows to Pakistan by the top 20 industries in fiscal year
2014/15. The communications industry has the greatest share of 41.6%, followed by oil
and gas exploration (11%), financial business (10.1%) and power (8.4%). It is interesting to
note that more than 70% of FDI inflows to Pakistan are concentratedly in these four
industries. In the communications industry, most FDI inflows are in telecommunications,
amounting to more than $900 million.
Table 7.37 shows Pakistan’s FDI outflows to other countries by the top 20 industries in
fiscal year 2014/15. The leading industry in FDI outflows, communications industry, is the
same as for the inflows, with more than half of the total outflows, followed by cement,
financial business, tobacco and cigarettes in the top four rankings. The large amount of
FDI inflows and outflows in communications industry may be related to privatization
procedures for this industry.
Table 7.36. Inward FDI in Pakistan by industry
(fiscal year 2014/15)
Rank IndustryAmount
Share (%)(US$ million)
1 Communications 948.8 41.6
2 Oil and gas exploration 250.2 11.0
3 Financial business 231.1 10.1
4 Power 191.7 8.4
5 Chemicals 92.2 4.0
6 Tobacco and cigarettes 80.7 3.5
7 Beverages 67.5 3.0
8 Trade 59.1 2.6
9 Transport equipment (automobiles) 56.1 2.5
10 Textiles 47.5 2.1
11 Personal services 47.3 2.1
12 Food 44.0 1.9
13 Electronics 41.4 1.8
14 Construction 37.4 1.6
15 Transport 12.0 0.5
16 Cement 10.0 0.4
17 Pharmaceuticals and OTC products 7.4 0.3
18 Petroleum refining 7.1 0.3
19 Metal products 4.7 0.2
20 Rubber and rubber products 4.4 0.2
Source: State Bank of Pakistan.
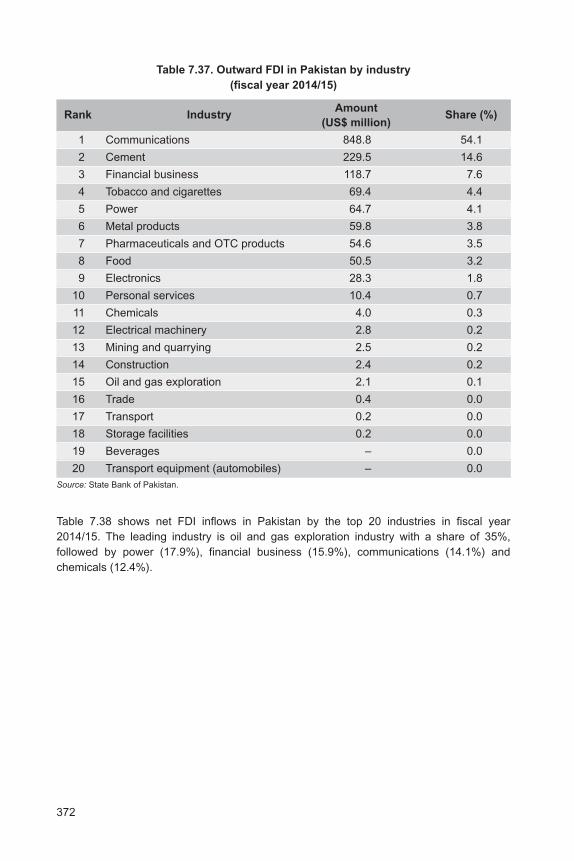
372
Table 7.38 shows net FDI inflows in Pakistan by the top 20 industries in fiscal year
2014/15. The leading industry is oil and gas exploration industry with a share of 35%,
followed by power (17.9%), financial business (15.9%), communications (14.1%) and
chemicals (12.4%).
Table 7.37. Outward FDI in Pakistan by industry
(fiscal year 2014/15)
Rank IndustryAmount
Share (%)(US$ million)
1 Communications 848.8 54.1
2 Cement 229.5 14.6
3 Financial business 118.7 7.6
4 Tobacco and cigarettes 69.4 4.4
5 Power 64.7 4.1
6 Metal products 59.8 3.8
7 Pharmaceuticals and OTC products 54.6 3.5
8 Food 50.5 3.2
9 Electronics 28.3 1.8
10 Personal services 10.4 0.7
11 Chemicals 4.0 0.3
12 Electrical machinery 2.8 0.2
13 Mining and quarrying 2.5 0.2
14 Construction 2.4 0.2
15 Oil and gas exploration 2.1 0.1
16 Trade 0.4 0.0
17 Transport 0.2 0.0
18 Storage facilities 0.2 0.0
19 Beverages – 0.0
20 Transport equipment (automobiles) – 0.0
Source: State Bank of Pakistan.

373
2. Barriers to trade in services and foreign
investment in Pakistan
(a) Trade in services22
Overall, Pakistan permits all types of foreign investment in services, except in certain
sectors such as aviation, banking, agriculture and media.
There is no cap on the share of equity that foreign investors can hold. Foreign investors in
Pakistan are limited in terms of remittance of royalty payments to a maximum of $100,000
for the first payment. There are also limits on the maximum amount of royalty payments –
5% of net sales for the subsequent five years.
The Government of Pakistan forbids the importation, sale, distribution and transmission of
films that are deemed as being inconsistent with religious and cultural standards domestically.
Table 7.38. Net FDI inflows in Pakistan by industry
(fiscal year 2014/15)
Rank IndustryAmount
Share (%)(US$ million)
1 Oil and gas exploration 248.1 35.0
2 Power 127.0 17.9
3 Financial business 112.4 15.9
4 Communications 100.1 14.1
5 Chemicals 88.2 12.4
6 Beverages 67.5 9.5
7 Trade 58.6 8.3
8 Transport equipment (automobiles) 56.1 7.9
9 Textiles 47.5 6.7
10 Personal services 36.9 5.2
11 Construction 35.0 4.9
12 Electronics 13.1 1.8
13 Transport 11.8 1.7
14 Tobacco and cigarettes 11.2 1.6
15 Petroleum refining 7.1 1.0
16 Rubber and rubber products 4.4 0.6
17 Sugar 3.1 0.4
18 Tourism 2.4 0.3
19 Ceramics 1.7 0.2
20 Basic metals 1.5 0.2
Source: State Bank of Pakistan.
22 Office of the United States Trade Representative, 2015.

374
The Government also prohibits websites that are deemed to be immoral or unethical. The
ban on the video-sharing website, YouTube, has been in place in Pakistan since September
2012.
Thus, the creation of the International Clearing House (ICH) was ordered by the Ministry of
Information Technology and Telecommunications in October 2012. The ICH raised charges
by fourfold and reduced competition for international calls to Pakistan. However, serious
concerns were voiced not only by the United States but also the Competition Commission
of Pakistan (CCP) and mobile operators about this change.
Several court cases were held to determine the legality of the ICH and the Supreme Court
of Pakistan sent the matter back to the jurisdiction of the CCP. In April 2013, the CCP
decided against the increase in international call termination rate. Despite this judgement,
the increased rate $0.088 per minute remains unchanged, although the Pakistan
Telecommunication Authority no longer mandates it.
This increase in international call termination rate in Pakistan resulted in a response from
the United States. In March 2013, the United States Federal Communications Commission
(FCC) issued a Memorandum Opinion and Order, the main point of which is: The floor rate
set by the ICH that went against previously negotiated rates with United States long
distance international carriers is anti-competitive and, hence, necessitated actions to protect
United States consumers in accordance with FCC policy and precedents. The continuation
of the high rate would cause a substantial increase in the cost and constrain demand for
calling Pakistan. The FCC ordered all United States carriers not to pay termination rates to
Pakistani carriers in excess of the rates that were effective ahead of the increase in the
rate on 1 October 2012.
In June 2014, the Ministry of Information Technology and Telecommunications announced
that it would abolish the ICH on 1 August 2014, but several long-distance phone service
providers challenged the action in court and obtained a stay of ICH’s abolishment. In
February 2015, the Supreme Court of Pakistan vacated the stay order of a lower court,
which effectually led to the abolishment of the ICH. In response to the finding by the
Supreme Court of Pakistan, the Pakistan Telecommunication Authority issued a notification
informing telecommunications operators of the deregulation of termination rates, with
immediate effect. Once it was implemented, the rates were to revert to competitive levels.
Foreign banks are subject to incorporation with a local company if they do not meet the
following conditions: (a) the absence of global Tier-1 paid up capital (for example, equity
and retained earnings of $5 billion or more); (b) they are not from countries that are part of
regional groups and associations in which Pakistan is a member (for example, SAARC);
and (c) the absence of business operations in Pakistan.
The upper limit for foreign investment in the banking sector in Pakistan is 49%. The
National Insurance Company, a major state-owned enterprise, has the exclusive power to
underwrite and insure public sector firms, assets and properties. However, the Government
of Pakistan has discretionary powers to grant exemptions to this requirement. Private
sector firms may pursue foreign reinsurance facilities to meet the maximum of 65% for
their re-insurance needs.

375
(b) Foreign investment23
Foreign businessmen in Pakistan have voiced concerns over corruption and a weak judicial
system, which could significantly discourage foreign investment in Pakistan.
In 2002, the Government of Pakistan approved the National Anti-Corruption Strategy that
identified areas of pervasive corruption and recommended reforms to eradicate corruption.
The National Anti-Corruption Strategy recognized the National Accountability Bureau as
the sole federal anti-corruption agency. In 2009, the Supreme Court directed the National
Assembly to pass new legislation to update the executive ordinance establishing the
National Accountability Bureau, but the National Assembly has not yet passed such
legislation.
In Pakistan, it is difficult to enforce contracts for American and other foreign investors.
Parties that pursue legal remedies in the Pakistani judicial system may face several years
of delays and unpredictable outcomes as the courts are overloaded.
3. Barriers related to trade facilitation
in Pakistan24
(a) Technical Barriers to Trade
Pakistan normally requires adherence to Codex Alimentarius (Codex) rules, and generally
accepts packaging materials if it is allowed in the exporting country.25 Most foodstuffs are
imported in ready-to-sell form; in consumer-ready packaging. A noticeable exception is
vegetable oil. Pakistan requires refined vegetable oil to be imported in bulk for repackaging,
for purposes of supporting local packaging and saving foreign exchange. This could be
regarded as a Technical Barrier to Trade in food-related products.
Pakistan requires all imported meat to be certified as halal, produced in accordance with
Islamic practices. Pakistan may also require other specific certificates, based on global
alerts or other emergencies.
Pakistan requires all imported packaged medicines or drugs to present the product name
and pharmaceutical raw materials on the labels of the products, in accordance with the
Drugs Labelling and Packaging Rules that were published by the Ministry of National
Health Services, Regulations and Coordination in 1986.
In accordance with the provisions of the Drug (Imports and Exports) Rules 1976, the
exporters must certify that pharmaceutical (allopathic) raw materials meet pharmaceutical
23 Office of the United States Trade Representative, 2015.24 Ibid.25 The Codex is the most widely used international food standards. The guidelines and codes contribute
to the safety, quality and fairness of the international food trade. See www.codexalimentarius.org/
about-codex/en/ (accessed on 1 September 2015).

376
grade and should have at least 75% of the shelf life remaining as calculated from the date
of filing of the Import General Manifest (IGM), except for those pharmaceutical raw materials
specifically allowed by the Director-General, Ministry of National Health Services, Regulations
and Coordination. If indication of shelf life is not provided on the packaging, the customs
authorities may allow clearance on the basis of Form 7, a Batch Certificate issued by the
manufacturer showing the expiration dates.
Quality certification, defined by the Pakistan Standards and Quality Control Authority is
required for certain products such as mineral water, carbonated beverages, edible oils
including cooking oil, Portland cements, construction materials containing asbestos and oil
stoves.
Pakistan’s notifications to the WTO under the Technical Barrier to Trade Agreement were
submitted in June 2007. The 25 notifications cover labelling, packaging, storage, and
transport of a number of food as well as health and safety standards adopted to cover
mainly sampling and testing procedures.
(b) Sanitary and Phytosanitary Barriers
On 4 July 2014, Pakistan’s Economic Coordination Committee issued Order 646, which
allows, in principle, imports of cattle from countries with a negligible risk status for Bovine
Spongiform Encephalopathy under the provisions of the World Animal Health Organization.
The United States’ and Pakistani regulators finalized the terms of the health certificate and
the sample certificate that were posted on the United States Department of Agriculture
(USDA) website on 24 February 2015. Pakistan has not accepted the United States beef
and beef-product exports but the United States continues to engage Pakistan to open the
market to these products.
Also, Pakistan does not allow the import of beef and beef products from the United States
for the same reasons. Initially, Pakistan had banned imports of live cattle from the United
States. However, the Government of the United States argues that the concern over
Bovine Spongiform Encephalopathy in the United States is misplaced.
(c) Policies on imports
The Government of Pakistan pledged to abandon the use of Statutory Regulatory Orders
(SROs) by June 2014 under the conditions of its International Monetary Fund (IMF)
programme that was approved in September 2013. However, it still grants ad hoc sector or
product-specific import duty exemptions, concessions and other protections by means of
proclamation of SROs.
The Federal Board of Revenue (FBR) of Pakistan is in the process of removing SROs by
means of allowing SROs to expire without renewal. However, the FBR’s approximate
calculation is that it will take three years for all SROs to be completely eliminated. A list of
SROs as well as other trade policy and regulatory documents are posted on the FBR
website.

377
Many traders engaged in the food and consumer products sectors have voiced their
concerns about the lack of consistency in customs valuation in Pakistan. Likewise,
a number of traders engaged in the machinery and materials sectors have complained that
customs officials have evaluated goods based on a set of minimum values rather than the
reported transaction price.
An importer for a large United States multinational enterprise has raised concerns over two
new SROs (420 and 575) that have raised the sales tax on imported “finished footwear
and apparel” from 5% to 17%. It is unfair in that the sales tax on domestically produced
products continues to be 5%. The FBR officials have explained that taxes on domestically-
produced goods will increase to 17%, to match goods produced in foreign countries.
However, they do not have a specific timeline for this plan.
The Government of Pakistan imposes a very high tariff rate of 50% on imports of automobile
parts and components that compete with domestically-produced products, compared with
the tariff rates of 35% applied to domestically manufactured products. However, it is
reported that there are no domestically produced parts and components in the automobile
industry.
It is required that commercial invoices and packing lists be included inside each shipping
container. The requirement could be an obstacle to traders due to the fact that invoices
and packing lists are not always issued in the same location as that from which products
are shipped. These documents may be issued after items are shipped. The penalty for
non-compliance is $526 per container.
The Government of Pakistan has announced regulatory duties (temporary tariffs) of 20%
for wheat and sugar to protect farmers against imports. The Government also restricts
imports of second-hand specialized vehicles, ships, trawlers, aircraft and related parts and
equipment unless these items meet specified conditions such as prior approval or clearance,
certain testing arrangements or other procedural requirements. The Government of Pakistan
has explained that these unusual requirements are mainly due to health, safety, security
and environmental reasons.
Designated goods may be imported only by the public sector or industrial demand. Examples
are active ingredients for the formulation or manufacture of pesticides. Imports of waste,
parings, and residual polyethylene and polypropylene must be covered by mandatory
certification in the exporting country or by a specialized pre-shipment inspection company.
(d) Government procurement
The Public Procurement Regulatory Authority is an independent organization that is
responsible for ruling and monitoring on public sector procurement regulations and
procedures. Notices for international tender must be publicly advertised. A private tender
contract that is manipulated for firm-specific qualifications is strictly prohibited.
There are no documented “buy domestic products” policies. However, there are several
improper practices that remain regarding government procurement, such as political influence

378
on procurement awards, charges of official corruption, lack of transparency, judicial
intervention and long delays in bureaucratic decision-making.
Tendering parties have reported cases in which the Government used the lowest bid as
a basis for further negotiation, rather than accepting the lowest bid by regulation. Pakistan
is not a signatory to the WTO Agreement on Government Procurement, but has recently
attained observer status.
(e) Protection for intellectual property rights
Pakistan stayed on the Priority Watch List in the 2014 Special 301 Report. The report cited
some samples in enforcement of intellectual property rights (IPR) through raids, seizures
and arrests; but there was little improvement in overall IPR protection. Several infringements
of IPR remain, such as counterfeiting and piracy (e.g., piracy related to the contents of
books and optical discs).
Pakistan has put substantial efforts into resolving IPR problems. However, it has made
little progress in implementing the provisions of the law regarding IPR. The Intellectual
Property Organization forwarded a proposal to the Cabinet for forming a policy board, but
the Cabinet has not yet approved it and IPR tribunals have not been created.
In addition, Pakistan has not made further progress towards more effective protection
against unfair commercial use of undisclosed tests or other data generated to obtain
marketing approval for pharmaceutical products. Despite negotiating a draft of a data
protection law between the Government of Pakistan and international and local
pharmaceutical firms, the law has not been enacted. With regard to patents, Pakistan
lacks an effective method to prevent the issuance of marketing approvals for unauthorized
copies of pharmaceutical patented products.
With regard to copyright, the Government of Pakistan has not carried out any significant
measures to improve copyright enforcement, especially for dealing with optical disc piracy.
Only a small percentage of arrests regarding IPR have resulted in prosecution, with most
verdicts resulting in minor sentences. Book piracy also continues to weaken legal trade
and investment. With regard to trademarks, counterfeit products (both imported and
domestically produced) tend to increasingly come onto the market with few efforts at
enforcement.
4. Pakistan’s efforts26
(a) Service liberalization
In the services sector, Pakistan has a scheme that has actually been liberalized beyond
GATS commitments. Pakistan wants to seek market access opportunities in all four modes
of supply, especially modes 1 and 4. Pakistan is involved in bilateral and multilateral
negotiations in services for ambitious outcomes in the services sector.
26 WTO, 2015b.

379
Pakistan carries out stakeholder consultations for looking into the possibility of acceding to
multilateral agreements on information technology, government procurement and green
goods.
(b) Trade facilitation
Pakistan is an ardent supporter of the Trade Facilitation Agreement (TFA) and has already
submitted its “List A” to WTO. Pakistan is also exerting efforts regarding other aspects of
the TFA, including coordination of needs assessment at WTO and execution of TFA elements
through bilateral initiatives. For the present, Pakistan continues to invest efforts in the
enhancement initiative of trade facilitation.
In order to improve the scope of automation in customs procedures, the Pakistan Customs
Computerized System has been aborted and replaced by the introduction of a locally-
developed Web-Based One Customs system. The new system is paperless and is available
for 24 hours and seven days; it follows the best international practices for risk management,
and allows online manifest filing and goods declaration. The numbers of manual intervention
on customs examination and clearance have been reduced considerably. It also combines
and integrates multiple steps in import and export processes into a single step.
In order to achieve faster clearance procedures and dwelling times, not only simple but
also effective infrastructure changes have been introduced. They include the following
changes:
(a) The number of trucks, 300 to 500 of which are cleared at the busiest borders
per day, has been increased;
(b) A new form of financial guarantee has been introduced between Pakistan and
Afghan customs in cooperation with insurance agencies in both countries in
order to alleviate prohibitive surety or bond burdens on traders;
(c) Electronic Data Interchange (EDI) has been introduced for the exchange of
critical information;
(d) New and cutting-edge weighbridges have been installed at the Chaman and
Torkham border crossings, which could reduce the waiting times for trucks at
the border;
(e) The drafting of customs rules, which govern the new procedures for traders
who exchange with Afghanistan, has resulted in meaningful results that will
spill over to the rest of the operations.
A new Asian Development Bank (ADB) project was initiated in August 2015, which focuses
on trade facilitation at border posts. With this ADB project, Pakistan is expected to continue
to modernize and implement all complementary efforts for trade facilitation.

380
5. Review of service trade and investment
agreements under APTA
The Fourth Round of negotiations was launched at the second session of the Ministerial
Council of APTA in October 2007. In addition to the tariff concessions, it was the first time
that a round of negotiations was held for the purpose of deepening trade cooperation and
integration in a comprehensive fashion.
The Fourth Round included non-tariff measures, trade facilitation, trade in services and
investment. The negotiations were concluded during the forty-fourth Standing Committee
meeting held in July 2014 in Bangkok.
Three Framework Agreements were signed by the Participating States of APTA: (a) The
Framework Agreement on Trade Facilitation; (b) the Framework Agreement on Promotion,
Protection and Liberalization of Investment; and (c) the Framework Agreement on Trade in
Services. These three framework agreements are based on Article 11 of APTA, which
states that “Participating States shall explore future areas of cooperation with regard to
border and non-border measures to supplement and complement the liberalization of
trade”. Article 26 of APTA on Amendments to APTA provides further reference for these
agreements.
Together with tariff concessions, the three framework agreements will contribute to expanding
economic cooperation and integration among the Participating States of APTA, including
Pakistan once it has acceded to APTA.
6. Potential gains from accession to APTA for
Pakistan and for the Participating
States of APTA
The Ministerial Council of APTA concluded the Fourth Round of negotiations in July 2014.
As a result, the Participating States of APTA signed and ratified not only new tariff accessions
but also the three framework agreements on trade facilitation, investment liberalization and
service liberalization. It is expected that these Framework Agreements will contribute to
diverse areas of cooperation and integration among the Participating States of APTA.
Hence, Pakistan, as an APTA Participating State, could likely benefit from the Framework
Agreements.
(a) Rules of Origin
Establishment of multilateral Rules of Origin (RoO) can offset the “noodle bowl” effect
caused by many different sorts of bilateral FTAs. RoO can also reduce various international
trade-related transaction costs by simplifying across-the-board application.

381
There were difficulties due to a lack of consensus regarding de minimis imports and
product-specific rules in the APTA negotiations.27 However, RoO-related issues, including
the introduction of change in tariff headings, were actively discussed.
Consequently, Annex II, “Rules of Origin for the Asia-Pacific Trade Agreement”, was created
in order to specify the origin of products eligible for preferential concessions in view of
Article 8 of APTA. Annex II defines the issuance and submission of certificate of origin,
verification procedures for the products’ origin and coordination between the countries
directly involved in origin verification.
The resulting changes related to RoO-related issues as well as expansion of tariff
concessions will improve actual utilization of APTA. If Pakistan accedes to APTA, it will be
able to take advantage of the substantial improvement in RoO.
(b) Trade facilitation
The Framework Agreement on Trade Facilitation in APTA will contribute to reducing
transaction costs incurred by international trade, which promotes trade in the Participating
States of APTA.
According to the United Nations International Symposium on Trade Efficiency, held, at
Ministerial level, in Columbus, Ohio, in October 1994, it concluded that “adoption of trade
efficiency measures can significantly lower the costs of trade transactions. Estimates place
the costs of trade transactions at 7% to 10% of the total value of world trade.”28
Firms always try to minimize various transaction costs in order to maintain competitiveness,
but complex trade procedures give rise to hidden costs such as those related to acquisition
of licences and document preparation as well as costs of materials, parts and labour that
are included in the prices of exporting goods.
Implementation of trade facilitation will contribute to the expansion of international trade by
reducing trade-related transaction costs and improving ease of business. Such facilitation
includes:
(i) Simplification and expedition of customs procedures, and expansion of
accessibility to information (opening and renewing related information and
constructing database and so forth);
(ii) Securing international standardization and certification transparency
(accordance to international standards in terms of ISO, mutual recognition
agreement and so forth);
27 ‘De minimis’ in import duties refers to imports of negligible value. When the value of imports is below
the minimum threshold for import duty, de minimis amounts are set by the importing country’s customs
authority. See www.cbp.gov/trade/nafta/guide-customs-procedures/other-instances-confer-origin/
deminimis (accessed on 15 August 2015).28 See https://www.wto.org/english/tratop_e/tradfa_e/intergov_e.htm (accessed on 23 May 2016).

382
(iii) Simplifying movement procedures of businessmen (e.g., a short-term visa
waiver programme and expediting of visa processing);
(iv) Facilitating electronic commerce (e.g., ensuring security of electronic payment
system).
(c) Investment liberalization
Investment liberalization is a crucial part of regional economic integration under APTA.
Investment is crucial in terms of adjusting the structure of an economy and to realizing the
benefits of a multilateral economic agreement such as APTA. In addition, investment will
play an important role, both in facilitating structural adjustment and in compensating losses
from trade liberalization of goods and services.
Utilization of the Framework Agreement on Promotion, Protection and Liberalization of
Investment, implemented on 3 January 2013, will contribute to gaining increased FDI in
the APTA region.
(d) Service liberalization
The services sector, regardless of whether an economy is advanced, developing and
undeveloped economies, plays an important role in economic prosperity. Its importance
has been intensified in production and employment. Therefore, service liberalization generally
has a considerable impact on a nation’s economy by boosting global competitiveness and
creating new jobs.
Liberalization of the services sector is effective in reducing consumer prices, in addition to
the fact that reforming the services sector would enhance competitiveness in the
communications, transportation and finance sectors as well as other service industries. It
would also lead to improved competitiveness of the manufacturing sector, a more expeditious
response to changes in consumer demand, optimal arrangement of production activity and
enhancement of competitiveness in international trade.
According to a study on the ASEAN-Republic of Korea FTA, the impacts of liberalization in
the services sector, with a 60% reduction in its trade barriers to services, are equivalent to
a 0.21% increase in the Republic of Korea’s GDP (Park and Kang, 2005).
Kim and Keum (2013) also showed that the rate of economic growth in a country having
open financial services is 1% higher than that in a country with closed ones. In addition,
the rate of economic growth in a country having liberalized financial and communicative
services is 1.5% higher than in a country with inadequate liberalization in services. However,
they explained that success of service liberalization relied on effective regulations and
suitable reform programmes.

383
With the Framework Agreement on the Promotion and Liberalization of Trade in Services
as a momentum, APTA created a legal framework for concession negotiations in the
services trade, enabled the Participating States of APTA to push forward cooperation in the
services sector, and led to actual elimination of trade barriers together with expansion of
services trade.
The Framework Agreement on the Promotion and Liberalization of Trade in Service was
utilized as a base for cooperation in the services sector even before the settlement of the
Republic of Korea-China FTA, which gave support to maintenance of services trade between
the two countries, including medical tours, cultural contents and oversees construction
(Kim and Keum, 2013).
Therefore, by acceding to APTA, Pakistan will be able to take advantage of these
improvements in services and contribute to enhancing services trade between the
Participating States of APTA.
7. New areas for cooperation between Pakistan and
the Participating States of APTA
Pakistan’s services sector accounts for 60% of its total GDP. The largest contributing
industries in Pakistan’s services sector are the wholesale and retail trade, accounting for
more than 30%, followed by the transportation sector. A point that warrants further attention
is that the role of finance and insurance is minimal in Pakistan, accounting for approximately
5% of total GDP. Moreover, in the services trade, the proportions of both exports and
imports are less than 10%, showing its minor position in international exchange. A number
of scholars have argued that financial development is a key factor among less-developed
and developing countries for achieving economic growth and finally joining the ranks of
advanced nations (e.g., Giuliano and Ruiz-Arranz, 2009).
Pakistan could take advantage of its accession to APTA to improve its finance and insurance
environment. Utilization of the framework agreements in APTA could provide a route to
eliminating barriers to trade facilitation, services sector and services investment in
combination with Pakistan’s continuing efforts.
As it joins the APTA, Pakistan could have more opportunities to reform financial industries.
Pakistan could extend its cooperation with advanced Participating States of APTA in
addressing the chronic problems of electric power shortage with circular debt.
APTA could also be a stepping stone to promoting liberalization of Pakistan’s economy.
Once Pakistan accedes to APTA, it will be much easier to negotiate FTAs, such as
a Pakistan-Republic of Korea FTA.

384
G. Conclusion and recommendations
1. Conclusion
The recent economic performance of Pakistan has demonstrated its great potential to the
rest of the world. The size and growth rate of Pakistan’s economy are not negligible, given
its $220 billion GDP, a population of 186 million, and recent growth rates in the 4% range.
Declining trends in the current and fiscal balance deficits, a stabilizing foreign exchange
rate as well as soaring stock market indices are also positive indicators regarding the
potential and prospects of the country’s economy.
The stability of the political environment in Pakistan was confirmed by the first-ever peaceful
transfer of political power in 2013. The present administration, being well-qualified and
experienced, is expected to maintain the country’s newfound political stability. Also, Pakistan’s
foreign relations with the Participating States of APTA appear to be secure and sound,
although its imports and exports with the Participating States of APTA are not substantial,
with the exception of China.
Although its trade regime has been rigid, Pakistan has invested considerable efforts towards
achieving liberalization. Pakistan seeks not only to reduce tariff rates but also eliminate
almost all types of barriers against international exchanges. Pakistan has concluded
a series of bilateral and multilateral trade agreements with SAARC, China, Indonesia,
Malaysia, the Islamic Republic of Iran, Mauritius and Sri Lanka as well as other countries
through OIC, D-8, ECO etc.
Pakistan’s contribution to world trade is minimal at this point. Its shares of total exports and
imports in the world in 2014 were only 0.17% and 0.31%, respectively. Among the
Participating States of APTA, only Bangladesh, China, the Republic of Korea and Sri
Lanka are included in the top 20 countries for Pakistan’s exports. As for imports, China,
India and the Republic of Korea are the only countries in the list of top 20 countries.
The results from the analysis of comparative advantage show that Pakistan has the potential
to enhance its exports when it accedes to APTA. There are a non-negligible number of
items that give Pakistan a comparative advantage in the global market and, at the same
time, the Participating States of APTA provide concessions for themselves: Bangladesh
(27 items); China (240 items); India (74 items); the Republic of Korea (156 items); the Lao
People’s Democratic Republic (84 items); Sri Lanka (41 items); and Mongolia (36 items).
In the use of SMART model, based on a partial equilibrium analysis, the results show that
if Pakistan accedes to APTA, the increase in imports by the Participating States of APTA
from Pakistan would be 1.84% as a percentage of their total imports. This outcome is
based on the assumption that Pakistan is offered general concessions by each member.
In terms of the amount of United States dollar, the increase in imports from Pakistan is the
largest with China, but in terms of the percentage of total imports from Pakistan by each
Participating State of APTA, the benefits for Pakistan from acceding to APTA is the highest

385
with the Republic of Korea, followed by India, China, Sri Lanka and Bangladesh. For
Pakistan, APTA accession is the most beneficial in the case of the Republic of Korea, with
an increase of more than 6% in exports to the Republic of Korea.
However, it is certain that actual benefits for Pakistan from accession to APTA would be
higher, as this study’s estimates are based on the general concession lists for each
Participating State. Under the assumption that each Participating State’s special concessions
list to LDCs is applied to Pakistan’s products, the trade benefits for Pakistan would be
much higher than the estimates.
In comparison with Pakistan’s gain, it is estimated that the benefits for the Participating
States of APTA will not be significant mainly due to the fact that trade between Pakistan
and the Participating States of APTA is not large enough. This situation would improve
trading volume for the current APTA Participating States after Pakistan’s accession to
APTA.
Pakistan’s services sector accounts for 60% of the country’s total GDP. The share of the
wholesale and retail trade is the largest, accounting for more than 30%, followed by the
transportation sector. In this regard, the fact that the role of finance and insurance is
minimal, at approximately 5% of total GDP, deserves special attention. Moreover, in the
services trade, the proportion of exports as well as imports are less than 10%, showing its
relatively minor position in international exchange. A number of scholars have argued that
financial development is a key factor for less-developed and developing countries in
achieving economic growth and entering the ranks of advanced nations.
Pakistan could possibly take advantage of acceding to APTA to improve the environment
with regard to finance and insurance. Utilization of the APTA framework agreements could
serve as an instrument with which to eliminate barriers to trade facilitation, services sector
and service investment, in combination with Pakistan’s continuing efforts.
With accession to APTA, more opportunities would open up for Pakistan in terms of
cooperation with advanced Participating States of APTA (China and the Republic of Korea)
in reforming financial industries as well as addressing the chronic problems of electric
power shortage with circular debt.
Ultimately, APTA will become a stepping stone to promote liberalization of Pakistan’s
economy. Once Pakistan accedes to APTA, it will be much easier to negotiate FTAs.
In conclusion, this study shows that Pakistan would benefit greatly from acceding to APTA.
However, to maximize its gains from APTA membership, Pakistan should continue to enact
reforms in order to remove all trade and non-trade barriers related not only to merchandise
trade but also to services and foreign investment.

386
2. Recommendations
This study concludes that the accession of Pakistan to APTA is feasible, and that it would
benefit Pakistan as well as the current Participating States of APTA.
On the basis of the main implications in this study, the following approach towards
a successful accession to APTA by Pakistan is recommended by:
(a) Thorough preparation in advance for further liberalization in areas of great
sensitivity from a strategic perspective, including measures to raise their
competitiveness along with strong institutional support;
(b) Increasing the economic cooperation with Participation States of APTA and
ESCAP;
(c) Making attempts to demonstrate clearly the positive economic impact of trade
liberalization for Pakistan under the APTA, including ways to improve its high
levels of trade and non-trade barriers.
Ultimately, Pakistan should pursue comprehensive economic liberalization, in order to
maximize potential benefits from acceding to APTA, in areas of service and foreign
investment as well as merchandise trade. To do this, Pakistan should:
(a) Focus on the finance and insurance sectors by cooperating with advanced
APTA Participating States in order to overcome the weaknesses of these
sectors;
(b) Extend its cooperation with the APTA Participating States to address the
chronic problems of electric power shortage with circular debt.
Last, Pakistan could make APTA accession as a stepping stone to further liberalization. As
a Participating State of APTA, Pakistan can pursue a more broad and liberalized FTA with
the other Participating State of APTA, such as a Pakistan-Republic of Korea FTA.

387
References
ADB (2015). Asian Development Outlook 2015. Manila.
_____ (2014). Proposed Technical Assistance Loan for the Islamic Republic of Pakistan:
Public Sector Enterprise Reforms Project, Project Administration Manual Project
(28 October 2014).
Giuliano, P. and Ruiz-Arranz, M. (2009). “Remittances, financial development and growth”,
Journal of Development Economics, vol. 90, No. 1; pp. 144-152.
IMF (2015). World Economic Outlook: Uneven Growth: Short- and Long-Term Factors.
Washington, D.C.
Kee, H.L., Nicita, A. and Olarreaga, M. (2008). “Import demand elasticities and trade
distortions”, The Review of Economics and Statistics, vol. 90. No. 4; pp. 666-682.
Kim, Y.G. and Keum, H.Y. (2013). Analysis of trade effect in the APTA Fourth Round
negotiation agenda. Korea Institute for International Economic Policy, Seoul.
Laird, S. and Yeats, A. (1986). The UNCTAD trade policy simulation model; discussion
paper. Geneva.
Lang, R. (2006). A partial equilibrium analysis of the impact of the ECOWAS-EU Economic
Partnership Agreement. United Nations Economic Commission for Africa, available
at https://www.gtap.agecon.purdue.edu/resources/download/2728.pdf.
Ministry of Commerce (2013). Strategic Trade Policy Framework 2013-2015. Government
of Pakistan. Islamabad.
Ministry of Planning, Development and Reform (2015). Pakistan 2025: Executive Summary.
Government of Pakistan. Islamabad. Available at http://www.pc.gov.pk/wp-content/
uploads/2015/05/Vision-2025-Executive-Summary.pdf (accessed on 23 May 2016).
Ministry of Water and Power (2013). National Power Policy 2013. Government of Pakistan.
Islamabad.
Park, S.C. and Kang, M.S. (2005). “An Analysis of trade liberalization in services: A Korea-
ASEAN FTA”, Journal of International Economic Studies, vol. 9, No. 1.
United States Trade Representative (USTR) (2015). National Trade Estimate Report on
Foreign Trade Barriers, 2015. Washington, D.C.
WTO (2015a). Trade Policy Review; report by the Secretariat, February 2015. Geneva.
_____ (2015b). Trade Policy Review; report by Pakistan, February 2015. Geneva.
_____ (2014). World Tariff Profiles 2014. Geneva.

388
Online databases
CEIC database. Available at https://www.ceicdata.com/ (accessed on 15 June 2015).
IMF, World Economic Outlook database. Available at www.imf.org/external/pubs/ft/weo/
2015/01/weodata/index.aspx (accessed on 14 June 2015).
State Bank of Pakistan. Available at http://www.sbp.org.pk/ecodata/index2.asp (accessed
on various dates).
United Nations COMTRADE database. Available at http://comtrade.un.org/ (accessed on
various dates).
World Bank database, World Development Indicators. Available at http://databank.
worldbank.org/data/reports.aspx?source=world-development-indicators# (accessed
on various dates).