Minimizing Water Quality Impacts of Road Construction Projects

21-1
Chapter 21: Construction Impacts
A. INTRODUCTION Construction of the proposed project would occur over a 9-year period. The first section of the chapter describes the schedule and sequencing of the construction, and then provides a detailed description of each type of construction activity. The activities discussed include demolition, excavation and foundations, construction of the superstructure of the buildings, installation of the exteriors, and interior finishes, as well as reconstruction of the waterfront platform. General construction practices, including those associated with deliveries and access, hours of work, and sidewalk and lane closures, are presented. Following the discussion of construction techniques, individual sections of this chapter discuss potential impacts with regard to land use, socioeconomic conditions, open space, historic resources, hazardous materials, natural resources, infrastructure, traffic and parking, transit and pedestrians, air quality, noise, vibration, and rodent control. Finally, measures that avoid or reduce the potential for significant adverse construction impacts are identified.
PRINCIPAL CONCLUSIONS
LAND USE
Construction would cause some disruptions to activities in the surrounding area. Although construction would occur over several years, most disruptions would be temporary in nature and would not occur at any one location for the entire construction period. During construction, access to all adjacent businesses, residences, and other uses would be maintained according to established regulations. When work would take place within building shells, effects on the surrounding uses would be substantially reduced as compared with excavation and foundation activities. Management practices would be developed and implemented to minimize the effects of construction-related changes in access to businesses and buildings in the vicinity of the project site. Other changes, such as sidewalk closures, would affect people living and working in the surrounding area, but implementation of the construction management practices would minimize the effects of these closures. There would be no significant adverse impacts on land use due to construction activity.
SOCIOECONOMIC CONDITIONS
Construction activities on the project site would include various land and/or sidewalk closures for different stages of construction. These enclosures would not disrupt adjacent businesses. Most of the businesses adjacent to the project site are industrial and do not rely on foot traffic. During construction, access to industrial and other types of businesses would not be obstructed. There would be no significant adverse impacts on socioeconomic conditions due to construction. Rather, construction would create major direct benefits resulting from expenditures on labor, materials, and services, as well as substantial indirect benefits created by expenditures by
Domino Sugar Rezoning
21-2
material suppliers, construction workers, and other employees involved in the direct activity. Construction would also generate increased tax revenues for the city and state.
OPEN SPACE
Because construction of the northernmost building on the project site would occur immediately adjacent to Grand Ferry Park, special measures would be taken to prevent its intrusion into the park. A solid fence would be erected along the perimeter of the site that borders the park. The fence would have no openings between the construction site and the park and would be high enough to reduce sound from construction activity of the project site and to minimize dust. The hoists, cranes, and other equipment would be located on the side of the building away from the park. As the superstructure is being erected, netting would be installed on the side of the building facing the park to prevent any materials from falling into the park.
Construction activities would be conducted with the care mandated by the close proximity of an open space to the project site. Dust control measures—including watering of exposed areas and dust covers for trucks—would be implemented to ensure compliance with the New York City Air Pollution Control Code, which regulates construction-related dust emissions. As discussed below, there would be no significant adverse air quality impacts on open spaces.
HISTORIC RESOURCES
A Construction Protection Plan (CPP) for the Refinery would be prepared in coordination with a licensed professional engineer. It would describe the measures to be implemented during the rehabilitation of the Refinery itself, as well as measures to be taken to protect the Refinery during construction of adjacent buildings on the project site.
As described in Chapter 8, “Historic Resources,” the project site is located within 90 feet of three historic resources: the Williamsburg Bridge, the former American Sugar Refinery Buildings, and the former Matchett Candy factory. Construction of the project could result in inadvertent physical impacts to these resources if proper precautions are not taken. To avoid any construction-related impacts on the latter two resources, including ground-borne vibration, falling debris, and accidental damage from heavy machinery, a CPP would be developed in consultation with the State Historic Preservation Officer (SHPO) and the New York City Landmarks Preservation Commission (LPC). The CPP would follow the guidelines set forth in section 523 of the CEQR Technical Manual, including conforming to LPC’s New York City Landmarks Preservation Commission Guidelines for Construction Adjacent to a Historic Landmark and Protection Programs for Landmark Buildings. The CPP would also comply with the procedures set forth in the New York City Department of Buildings’ Technical Policy and Procedure Notice (TPPN) #10/88.
The Williamsburg Bridge is separated from the project site by South 5th Street, which is 60 feet wide. Protection measures for this resource would be developed in coordination with SHPO, LPC, and the New York City Department of Transportation (DOT).
With these measures in place, construction of the proposed project would not result in any significant adverse impacts on historic resources.
HAZARDOUS MATERIALS
With the measures in place described in Chapter 12, “Hazardous Materials,” there would be no significant adverse impacts with respect to hazardous materials during the construction process.

Chapter 21: Construction Impacts
21-3
NATURAL RESOURCES
The implementation of erosion and sediment control measures and a Stormwater Pollution Prevention Plan (SWPPP) would minimize potential impacts on littoral zone tidal wetlands from discharge of stormwater runoff during land-disturbing activities. In addition, measures would be taken to prevent any adverse impacts to peregrine falcons during construction. With these measures, the proposed project’s construction would not result in significant adverse impacts on natural resources.
INFRASTRUCTURE
The construction activities that would be required to connect the proposed project to existing energy systems are part of Con Edison’s and National Grid’s normal operations for providing services to new customers, and occur on a regular basis throughout the city. Therefore, these construction activities would not result in a significant adverse impact to infrastructure and energy systems.
TRAFFIC AND PARKING
Since the majority of construction activities would be accommodated on-site, construction trucks would be staged primarily within the project site, or on newly completed streets on the project site adjacent to or south of active construction sites. However, curb lanes and sidewalks on Kent Avenue might be temporarily closed due to construction activities. In November 2008, DOT created bicycle lanes on both the east and west sides of Kent Avenue, replacing what had been curbside parking on both sides of the street. As noted in Chapter 17, “Traffic and Parking,” in the fall of 2009, Kent Avenue was reconfigured as a one-way northbound street with two traffic lanes, a two-way bicycle lane on the west side of the street, and a parking lane between the bicycle lane and the traffic lanes. Construction of the proposed project would require temporarily either narrowing or relocating portions of these bicycle lanes. During the entire construction period, a lane of traffic would be maintained along Kent Avenue. In addition, sidewalk protection or temporary sidewalks would be provided to maintain pedestrian access.
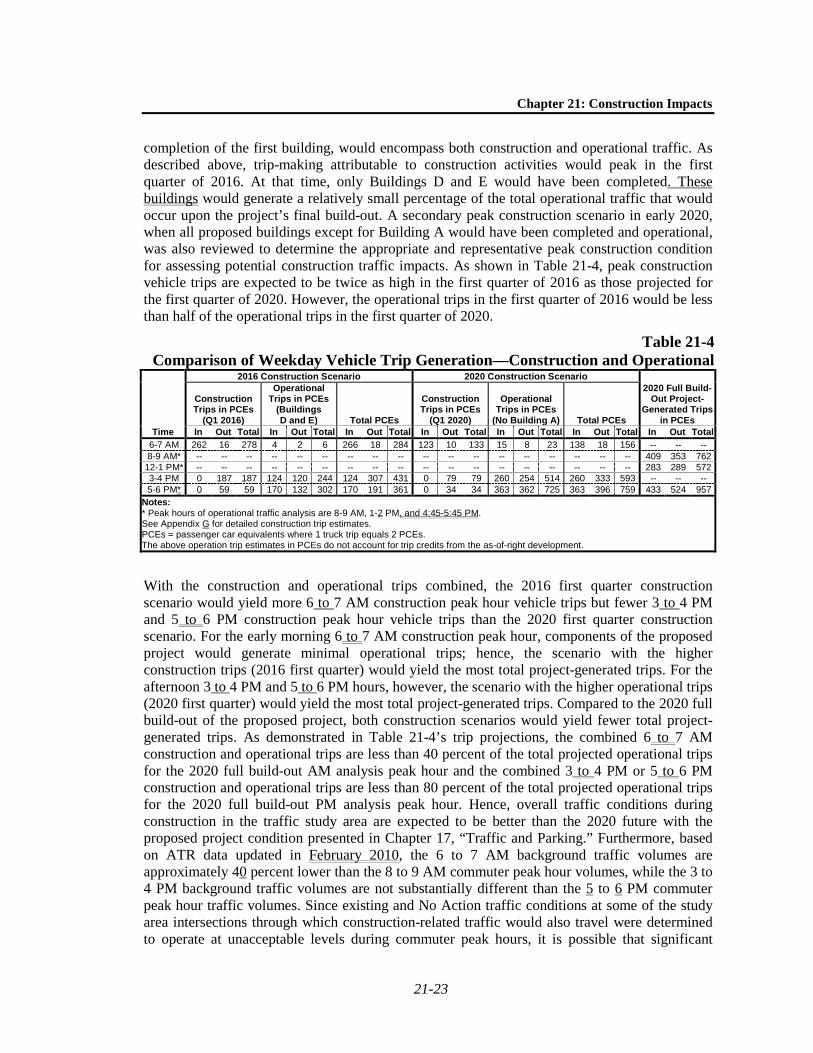
Because the proposed development program would result in buildings completed and occupied at different times, the total project-generated traffic during construction, beginning with the completion of the first building, would encompass both construction and operational traffic. Trip-making attributable to construction activities would peak in the first quarter of 2016. A secondary peak construction scenario in early 2020 was also reviewed to determine the appropriate and representative peak construction condition for assessing potential construction traffic impacts. This review showed that peak construction vehicle trips are expected to be twice as high in the first quarter of 2016 as those projected for the first quarter of 2020. However, the operational trips in the first quarter of 2016 would be less than half of the operational trips in the first quarter of 2020.
With the construction and operational trips combined, the 2016 first quarter construction scenario would yield more 6 to 7 AM construction peak hour vehicle trips but fewer 3 to 4 PM and 5 to 6 PM construction peak hour vehicle trips than the 2020 first quarter construction scenario. For the early morning 6 to 7 AM construction peak hour, components of the proposed project would generate minimal operational trips; hence, the scenario with the higher construction trips (2016 first quarter) would yield the most total project-generated trips. For the afternoon 3 to 4 PM and 5 to 6 PM hours, however, the scenario with the higher operational trips (2020 first quarter) would yield the most total project-generated trips. Compared to the 2020 full

Domino Sugar Rezoning
21-4
build-out of the proposed project, both construction scenarios would yield fewer total project-generated trips. Hence, overall traffic conditions during construction in the traffic study area are expected to be better than the 2020 future with the proposed project condition presented in Chapter 17, “Traffic and Parking.” Furthermore, based on Automatic Traffic Recording (ATR) data updated in February 2010, the 6 to 7 AM background traffic volumes are approximately 40 percent lower than the 8 to 9 AM commuter peak hour volumes, while the 3 to 4 PM background traffic volumes are not substantially different from the 5 to 6 PM commuter peak hour traffic volumes. Since existing and future without the proposed project (No Action) traffic conditions at some of the study area intersections through which construction-related traffic would also travel were determined to operate at unacceptable levels during commuter peak hours, it is possible that significant adverse traffic impacts could occur at some or many of these locations during construction. In order to alleviate construction traffic impacts, measures recommended to mitigate impacts associated with the proposed actions could be implemented during construction before completion of the proposed project.
A quantified traffic analysis was prepared to identify significant adverse traffic impacts during construction that may differ from those identified for the project’s final build-out and which may require different mitigation measures or early implementation of proposed build mitigation measures (i.e., the measures proposed to mitigate operational traffic impacts). As discussed above, the 2020 first quarter construction scenario would result in more total combined project-generated trips during two of the three construction peak hours than the 2016 first quarter construction scenario. However, because the construction trip component during the first quarter of 2020 would make up a very small portion of the total trips (construction and operational) associated with the proposed project, the conditions would be more reflective of those in the final build-out, which is already being addressed in Chapter 17, “Traffic and Parking.” Therefore, it is more appropriate to consider the 2016 first quarter construction scenario as the representative worst-case condition for assessing potential construction traffic impacts and mitigation measures. This analysis evaluates locations where there would be significant adverse impacts under the full build-out of the proposed project.
According to the analysis results presented in Chapter 17, “Traffic and Parking,” there would be 24 and 31 intersections during the 8 to 9 AM and 4:45 to 5:45 PM operational analysis peak hours, respectively, that would incur significant adverse traffic impacts upon the project’s final build-out in 2020. Since background and projected traffic levels during peak construction in 2016 would be lower than those assessed for the 2020 build-out, potentially impacted locations during construction would be the same or part of the set of locations identified to be impacted from the operational analyses. According to the analysis results presented in Chapter 23, “Mitigation,” 11 of the 24 intersections during the 8 to 9 AM peak hour and 11 of the 31 intersections during the 4:45 to 5:45 PM peak hour that would be significantly impacted could be mitigated with minor adjustments to signal timing. The implementation of these signal timing adjustments is typically subject to DOT’s review of actual conditions at the time or, for this project, could be advanced during construction and/or upon completion of the first two buildings (D and E). Therefore, while significant adverse traffic impacts at these intersections could also occur during peak construction in 2016, a detailed analysis of their service levels was not conducted, and it is expected that similar signal timing adjustments identified for mitigating impacts from the project’s full build-out could be implemented early at DOT’s discretion to mitigate potential impacts at these intersections during construction. The assessment discussed below focuses on conditions and mitigation requirements during peak 2016 construction at

Chapter 21: Construction Impacts
21-5
intersections that were projected to be significantly impacted upon the project’s full build-out in 2020 and that would require mitigation measures beyond solely the adjustment of signal timings.
A quantified construction traffic analysis for peak 2016 construction was conducted for 21 intersections. These intersections were identified to be significantly impacted under the full project build-out and would require more substantial mitigation measures (e.g., restriping and/or daylighting to provide more roadway capacity, converting two-way stop controls to four-way stop controls, or converting stop controls to signal controls). The purpose of this analysis is to determine if significant adverse traffic impacts would occur at these intersections after the completion of the first two buildings (D and E) and during peak construction in 2016, and whether the mitigation measures recommended for the project’s full build-out would be warranted at this time or if “lesser” mitigation measures (e.g., signal timing adjustments) could be implemented in the interim. The analyses show that no significant adverse traffic impacts would be expected in the 6 to 7 AM peak hour for any of the 21 analyzed intersections. During the 3 to 4 PM peak hour, 5 signalized intersections and 7 unsignalized intersections were identified to have resulted in significant adverse traffic impacts. Making adjustments to signal timings and applying other proposed build mitigation measures would fully mitigate the significant adverse impacts identified for the 3 to 4 PM peak hour (and similarly for the 5 to 6 PM peak hour) and not adversely affect operations during the 6 to 7 AM peak hour.
Construction vehicle parking would be accommodated on the project site; therefore, construction of the proposed project would not result in significant adverse parking impacts.
TRANSIT AND PEDESTRIANS
Approximately 25 percent of construction workers would travel to and from the project sites via transit. Based on the peak 2016 projections, there would be approximately 122, 93, and 29 construction-related transit trips during the 6 to 7 AM, 3 to 4 PM, and 5 to 6 PM hours, respectively. The transit trip demand during the morning and afternoon peak construction hours would represent only nominal increases in transit demand and would occur along each of those routes and at each of the transit access locations during hours within and outside of the typical commuter peak periods. Hence, no further evaluation of nearby transit services is required, and there would be no significant adverse transit impacts attributable to the projected construction-worker transit trips. Any temporary relocation of bus stops along bus routes that operate adjacent to the project site would be coordinated with and approved by DOT and Metropolitan Transportation Authority-New York City Transit (NYCT) to ensure proper access is maintained.
Approximately 5 percent of construction workers would travel to and from the project sites on foot. Based on the peak 2016 projections, there would be approximately 24, 19, and 6 construction-related walk trips during the 6 to 7 AM, 3 to 4 PM, and 5 to 6 PM hours, respectively. Since these pedestrian trips would be small in number, primarily occur outside of peak hours, and would be distributed among numerous sidewalks and crosswalks in the area, there would be no significant adverse pedestrian impacts attributable to the projected construction-worker pedestrian trips. During construction, where temporary sidewalk closures are required, adequate protection or temporary sidewalks and appropriate signage would be provided in accordance with DOT requirements.
AIR QUALITY
The results of both stationary and mobile source modeling analyses found that the total concentrations of particulate matter with an aerodynamic diameter of less than or equal to 10

Domino Sugar Rezoning
21-6
micrometers (PM10) and carbon monoxide (CO) would not exceed National Ambient Air Quality Standards (NAAQS). Therefore, no significant adverse impacts from construction sources with respect to these pollutants are expected at the closest sensitive receptors during the peak emission periods. Since the predicted concentrations were modeled for periods that represent the highest site-wide air emissions at the closest sensitive receptors, the increments and total predicted concentrations during other periods of construction and at other locations are also not expected to have any significant adverse impacts.
Dispersion modeling determined that the maximum predicted incremental concentrations of particulate matter with an aerodynamic diameter of less than or equal to 2.5 micrometers (PM2.5) (using a worst-case emissions scenario) would exceed the City’s applicable interim guidance criteria at a few receptor locations, where the likelihood of prolonged exposure is very low. The occurrences of elevated 24-hour average concentrations for PM2.5 would be very limited in duration. Therefore, after taking into account the temporary nature of construction, the limited duration and extent of these predicted exceedances, and the limited area-wide extent of the 24-hour impacts, it was concluded that no significant adverse air quality impacts for PM2.5 are expected from the on-site construction sources.
NOISE
Construction of the proposed project would implement measures to control noise sources (i.e., reducing noise levels at the source or during most sensitive time periods) and noise pathways (e.g., placement of equipment, implementation of barriers between equipment and sensitive receptors). Even with these measures, an analysis based on a detailed construction activity and equipment schedule prepared by the applicant determined that the noise levels due to construction activities at a few sensitive receptors, including residential uses, immediately adjacent to the project site are expected to exceed City Environmental Quality Review (CEQR) impact criteria. Noise level increases at these impacted locations would reach up to 9.2 dBA during the worst-case construction period, and absolute noise levels would reach the mid to upper 70s dBA. Almost all of these receptors have double glazed windows and some form of air conditioning (window units, through-wall, or Packaged Terminal Air Conditioners), which would provide substantial attenuation of the incident construction noise and result in acceptable interior noise levels according to CEQR criteria during most times of day. As mitigation, the applicant would be required to make attenuation measures (i.e., upgraded windows and/or an alternate means of ventilation) available to any of the residences that are impacted but do not already have these measures.
PUBLIC SCHOOL OPTION
As described in Chapter 23, “Mitigation,” in order to address the proposed project’s significant adverse impact on public schools, the applicant would enter into an agreement with the New York City School Construction Authority (SCA) to provide an option to locate an approximately 100,000-square-foot public elementary and intermediate school within the community facility space in the Refinery complex. As part of this agreement, and as formalized in the Restrictive Declaration, at different phases of the proposed project the applicant would provide SCA with an opportunity to determine whether a school is needed within the Refinery complex.
Under this agreement, SCA may defer construction of the Refinery until after construction of Site B (the Delayed School Phasing Sequence). As with the proposed development program, the modifications proposed as part of the Delayed School Phasing Sequence would not result in any

Chapter 21: Construction Impacts
21-7
significant adverse impacts due to construction activities in land use, socioeconomic conditions, community facilities, historic resources, hazardous materials, natural resources, and infrastructure. With respect to open space, traffic and parking, air quality, and noise, the potential for impacts from the Delayed School Phasing Sequence were examined in more detail. It was concluded that the Delayed School Phasing Sequence would not generate any significant adverse impacts or require any mitigation measures not identified in the proposed construction sequence.
B. CONSTRUCTION ACTIVITIES
SCHEDULE
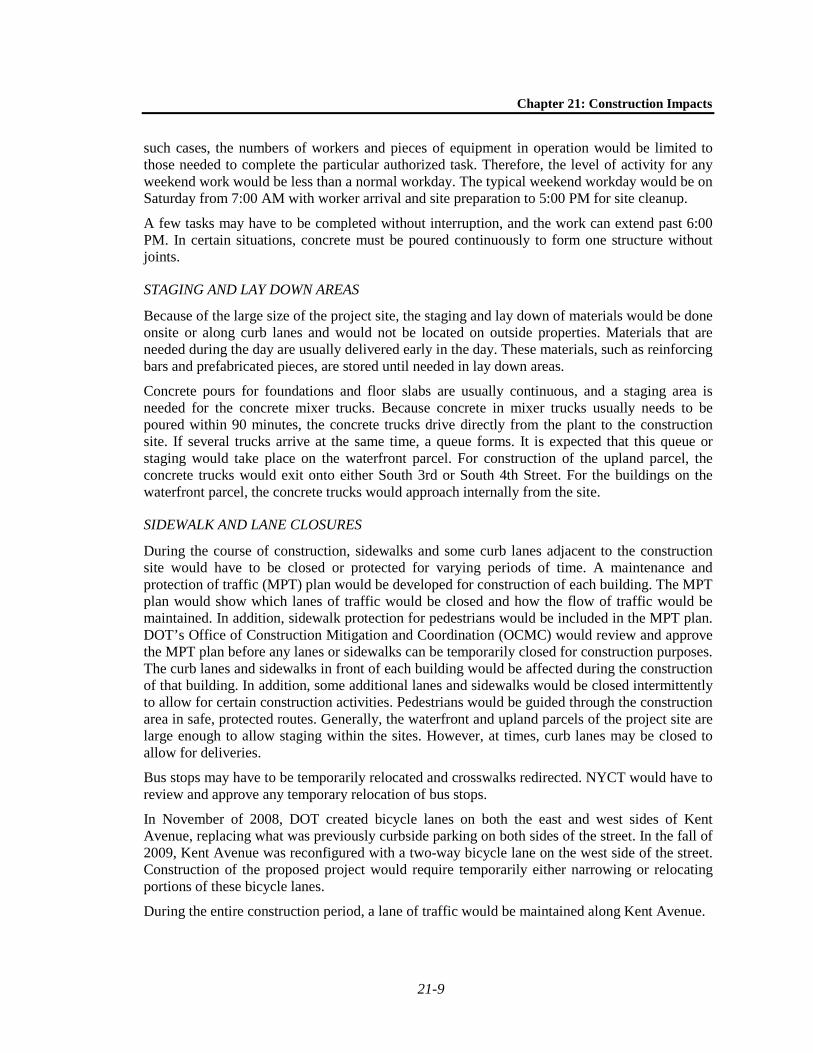
The total anticipated period of construction for the proposed project is approximately nine years, starting in early 2012 and finishing in late 2020. While it is possible that work on the upland portion of the project site could begin before 2012, the analyses in this chapter conservatively assume that construction activity would be compressed into the 9-year period from 2012 to 2020. The locations of principal construction components are shown in Figure 21-1. The duration of construction on individual sites would range from approximately 2 to 3.5 years. As currently contemplated, construction would begin on the upland parcel and proceed along the waterfront parcel from south to north. This construction phasing of site development would be set forth in the Restrictive Declaration.
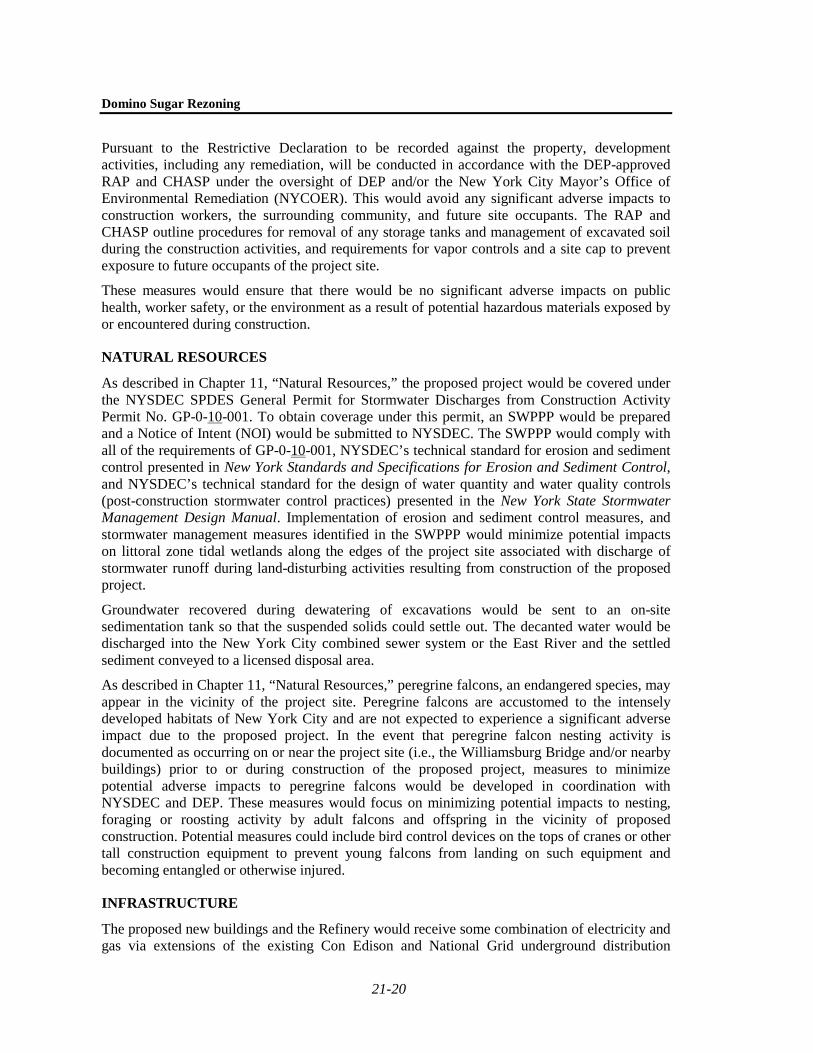
As shown in Table 21-1 and Figure 21-2, the duration and timing of construction would vary from building to building on the various sites. The shortest task would be the construction of the buildings on Site E on the upland parcel of the site, which would take about two years. The longest construction period would be for Site B, the largest of the waterfront sites, which would be constructed over a period of about 40 months. Typically, construction would occur simultaneously on two of the parcels throughout the nine-year construction period.
Table 21-1 Construction Components and Projected Durations
Project Parcel Estimated Duration Start Date Finish Date
Site E 23 months Jan. 2012 Nov. 2013 Site D 36 months Jan. 2012 Dec. 2014 Site C 28 months Dec. 2014 Mar. 2017 The Refinery 35 months Dec. 2013 Oct. 2016 Site B 40 months Jul. 2016 Oct. 2019 Site A 24 months Nov. 2018 Oct. 2020 Waterfront platform 30 months Apr. 2013 Sep. 2015
Source: The Refinery LLC, Gotham Construction, F.J. Sciame Construction, and Mueser Rutledge.
GENERAL CONSTRUCTION PRACTICES
Certain practices would be observed throughout the project. The developer would designate a contact person for the community throughout the construction period. This person would serve as the contact for the community to voice concerns about construction activities, and would be available to meet with the community to resolve concerns or problems.

KENT AVE. KENT AVE. KENT AVE.
S. 4
TH S
T.
S. 5
TH S
T.
S. 3
RD
ST.
S. 2
ND
ST.
S. 1
ST S
T.
GR
AND
ST.
GR
AND
ST.
Construction Phasing PlanFigure 21-1
5.20.10
DOMINO SUGAR REZONING
KENT AVE. KENT AVE. KENT AVE.
S. 4
TH S
T.
S. 5
TH S
T.
S. 3
RD
ST.
S. 2
ND
ST.
S. 1
ST S
T.
GR
AND
ST.
GR
AND
ST.
G R A N DF E R R YPA R K
N
SCALE
0 100 200 FEET
SITE D1/12 - 12/14
SITE C12/14 - 3/17
REFINERY12/13 - 10/16
SITE B7/16 - 10/19
SITE A11/18 - 9/20
SITE E1/12 - 11/13
Project Site Boundary
Start and Finish Dates(Month/Year) of Construction
Landscape
Building
PLATFORM RECONSTRUCTION4/13 - 9/15
PLATFORM RECONSTRUCTION4/13 - 9/15
12/12 - 3/15
NOTE: This figure has been revised for the FEIS

DOMINO SUGAR REZONING
Anticipated Construction ScheduleFigure 21-2
YEAR
2012 2013 2014 2015 2016 2017 2018 2019 2020
Site E
Site D
Site C
The Refinery
Site B
Site A
Waterfront Platform
5.20.10
NOTE: This figure has been revised for the FEIS

Domino Sugar Rezoning
21-8
In addition, the New York City Department of Buildings (DOB) requires that a telephone number be posted conspicuously at the construction site for the public to report concerns anonymously. DOB investigates all complaints and may shut down construction if any violations of City regulations are found. If violations are found, DOB may institute fines and other penalties.
DELIVERIES AND ACCESS
Access to the construction sites would be tightly controlled. The work areas would be fenced off, and limited access points for workers and trucks would be provided. It is anticipated that parking for worker vehicles would be provided on-site. In the early phases of construction, surface parking would be provided on unbuilt portions of the project site. In later phases, workers would be able to park in the garages of the newly constructed buildings. However, as proposed buildings are constructed and occupied, temporary imbalances in terms of parking supply and demand may occur. In such a case, some construction workers may need to seek off-site parking in the study area.
Security guards and flaggers would be posted, and all persons and trucks would have to pass through security points. Workers or trucks without a need to be on the site would be refused entry. After work hours, the gates would be closed and locked. Unauthorized access would be prevented after work hours and over the weekends.
Material deliveries to the site would be highly controlled and scheduled. Unscheduled or haphazard deliveries would not be allowed. To aid in adhering to the delivery schedules, flaggers would be employed at each of the entry and exit gates. The flaggers would control trucks entering and exiting the site so that they would not interfere with one another and so as to minimize disruptions to local on-street traffic.
HOURS OF WORK
Construction activities for the buildings would take place in accordance with New York City laws and regulations which allow construction activities to take place between 7:00 AM and 6:00 PM. Construction work would begin at 7:00 AM on weekdays, with most workers arriving between 6:00 AM and 7:00 AM. Typically, work would end at 3:30 PM, but could be extended as late as 6:00 PM without requiring authorization from DOB for such tasks as completing the drilling of piles or finishing a concrete pour for a floor deck. Extended workday activities may not include all construction workers on site, but only those involved in the specific task. Extended workdays would occur during foundation and superstructure tasks, and limited extended workdays could occur during other tasks over the course of construction.
At limited times over the course of constructing a building, weekend work would be required. Weekend work requires a permit from DOB and, approval of a noise mitigation plan from the New York City Department of Environmental Protection (DEP) under the New York City Noise Control Code. The New York City Noise Control Code, as amended December 2005 and effective July 1, 2007 limits construction (except in special circumstances) to weekdays between the hours of 7:00 AM and 6:00 PM, and sets noise limits for certain specific pieces of construction equipment. Construction activities occurring after hours (weekdays between 6 PM and 7 AM and on weekends) may be permitted only to accommodate: (i) emergency conditions; (ii) public safety; (iii) construction projects by or on behalf of City agencies; (iv) construction activities with minimal noise impacts; and (v) undue hardship resulting from unique site characteristics, unforeseen conditions, scheduling conflicts and/or financial considerations. In
Chapter 21: Construction Impacts
21-9
such cases, the numbers of workers and pieces of equipment in operation would be limited to those needed to complete the particular authorized task. Therefore, the level of activity for any weekend work would be less than a normal workday. The typical weekend workday would be on Saturday from 7:00 AM with worker arrival and site preparation to 5:00 PM for site cleanup.
A few tasks may have to be completed without interruption, and the work can extend past 6:00 PM. In certain situations, concrete must be poured continuously to form one structure without joints.
STAGING AND LAY DOWN AREAS
Because of the large size of the project site, the staging and lay down of materials would be done onsite or along curb lanes and would not be located on outside properties. Materials that are needed during the day are usually delivered early in the day. These materials, such as reinforcing bars and prefabricated pieces, are stored until needed in lay down areas.
Concrete pours for foundations and floor slabs are usually continuous, and a staging area is needed for the concrete mixer trucks. Because concrete in mixer trucks usually needs to be poured within 90 minutes, the concrete trucks drive directly from the plant to the construction site. If several trucks arrive at the same time, a queue forms. It is expected that this queue or staging would take place on the waterfront parcel. For construction of the upland parcel, the concrete trucks would exit onto either South 3rd or South 4th Street. For the buildings on the waterfront parcel, the concrete trucks would approach internally from the site.
SIDEWALK AND LANE CLOSURES
During the course of construction, sidewalks and some curb lanes adjacent to the construction site would have to be closed or protected for varying periods of time. A maintenance and protection of traffic (MPT) plan would be developed for construction of each building. The MPT plan would show which lanes of traffic would be closed and how the flow of traffic would be maintained. In addition, sidewalk protection for pedestrians would be included in the MPT plan. DOT’s Office of Construction Mitigation and Coordination (OCMC) would review and approve the MPT plan before any lanes or sidewalks can be temporarily closed for construction purposes. The curb lanes and sidewalks in front of each building would be affected during the construction of that building. In addition, some additional lanes and sidewalks would be closed intermittently to allow for certain construction activities. Pedestrians would be guided through the construction area in safe, protected routes. Generally, the waterfront and upland parcels of the project site are large enough to allow staging within the sites. However, at times, curb lanes may be closed to allow for deliveries.
Bus stops may have to be temporarily relocated and crosswalks redirected. NYCT would have to review and approve any temporary relocation of bus stops.
In November of 2008, DOT created bicycle lanes on both the east and west sides of Kent Avenue, replacing what was previously curbside parking on both sides of the street. In the fall of 2009, Kent Avenue was reconfigured with a two-way bicycle lane on the west side of the street. Construction of the proposed project would require temporarily either narrowing or relocating portions of these bicycle lanes.
During the entire construction period, a lane of traffic would be maintained along Kent Avenue.

Domino Sugar Rezoning
21-10
STORMWATER POLLUTION PREVENTION PLAN
A construction SWPPP would be developed for the overall project construction activity in accordance with the requirements of the New York State Department of Environmental Conservation’s (NYSDEC) State Pollutant Discharge Elimination System (SPDES) General Permit for Stormwater Discharges from Construction Activity (Permit No. GP-0-10-001), which would be required for construction. The SWPPP would include fully designed and engineered stormwater management practices with all necessary maps, plans, and construction drawings, providing the site-specific erosion and sediment control plan and best management practices. The SWPPP would include designation of responsible parties and personnel who would have a role in management of construction stormwater runoff. The SWPPP would outline a routine site inspection and reporting program for identification and prompt repair of any deficiencies for the erosion and sediment control structures or practices.
Stormwater management during construction activities would be performed through implementation of a site-specific erosion and sedimentation control plan. In accordance with NYSDEC guidance, the SWPPP would include both structural and non-structural components. The structural components are expected to consist of silt fencing, inlet protection, and installation of a stabilized construction entrance or other appropriate means to limit potential off-site transport of sediment. The non-structural best management practices would include routine inspection, dust control, cleaning, and maintenance programs; instruction on the proper management, storage, and handling of potentially hazardous materials; and identification of parties responsible for implementation and ongoing maintenance programs. All temporary control measures would be maintained until disturbed areas of the site are stabilized.
RECONSTRUCTION OF THE WATERFRONT PLATFORM
The waterfront platform would be reconstructed over a period of slightly longer than two-and-a-half years. The schedule would take into account avoiding in-water work during fish spawning seasons, even though the East River is not considered to be prime spawning grounds. Construction activities would include removal of the existing deck and piles; installation of new piles, pile caps, and deck slabs; and installation of a cast-in-place deck topping and fender system.
The southern half of the platform would be reconstructed first, starting at a point approximately 100 feet south of South 2nd Street, and continuing to the southern end of the project site at South 5th Street. While the marine equipment is on site, some work would be done on the northern portion of the platform, but it would be mostly demolition. When the southern portion of the platform is reconstructed, marine construction would start a few months later on the northern portion. The first step would be to remove the existing decking and cribbing using large, barge-mounted cranes. The existing timber piles supporting the existing deck either would be pulled or cut at the mudline as required, so that new precast, prestressed concrete piles could be driven. Precast, prestressed piles are fabricated off-site and transported to the site for installation. Precasting allows greater control in fabricating the piles and minimizes the amount of on-site construction. Adjacent to the southern half of the pile-supported platform, a new sheet pile bulkhead would be installed landward of the Mean High Water (MHW) elevation. New pile caps that connect the piles together would be formed and poured on-site. After the pile caps are constructed, precast, prestressed concrete deck planks would be installed using cranes. The final step would be installation of a timber fender system on the water side of the new platform. The fender system protects the platform from damage.

Chapter 21: Construction Impacts
21-11
Marine construction is generally done from barges, and most of the work does not involve on-land activities. The cranes and pile drivers are located on barges, which are moved into position by tugboats. In addition, it is likely that the precast, prestressed piles and deck planks would be transported to the site via barge. Depending on the situation, the poured in-place concrete could be transported either via water by barges or on land with trucks. The hours of work for the marine construction are generally the same as the hours of work for construction of the buildings. However, during days with long hours of light (i.e., summer), the marine work may begin earlier or end later than normal to take advantage of tidal conditions.
CONSTRUCTION OF BUILDINGS
The proposed project entails the construction of new buildings on Sites A through D on the waterfront parcel and Site E on the upland parcel. Sites A through D have existing structures that would be demolished. Because these sites are located on the waterfront parcel, reconstruction of the platform would take place prior to or concurrent with construction on each of these sites. Sites B and C are the largest of the waterfront sites on which new construction would occur, and buildings on these sites would be the tallest of any on the project sites, rising to a height of up to 400 feet. The Refinery, located on the waterfront between South 2nd and South 3rd Streets, would have its exterior restored, and a three- and four-story addition would be constructed above the existing Refinery structure, all in accordance with LPC-approved plans and with the Certificate of Appropriateness approved by LPC. In addition, its interior would be demolished and replaced with a new structure.
The construction techniques needed for the restoration and adaptive reuse of the Refinery are described in more detail below under “Adaptive Reuse of the Refinery.”
Site E is located on the vacant upland parcel; no demolition or waterfront platform work would be required prior to excavation and foundation work.
The parking facilities beneath each parcel would be developed concurrently with the buildings on each of the parcels. In addition, for the parcels along the waterfront, the publicly accessible open space surrounding each parcel would be completed by the time the buildings are completed.
ABATEMENT AND DEMOLITION
Construction of any of the proposed new buildings would require disconnection of existing utilities and demolition of the existing buildings to clear the sites. Asbestos and lead-based paints abatement would be the first part of demolition. These specialty tasks are strictly regulated in New York City to protect the health and safety of the construction workers and the public, nearby residents, and workers. Depending on the extent of the asbestos, either the whole building or portions of the building would be closed off by containment barriers. The barriers prevent any existing asbestos from leaving the containment area. Specially trained workers in protective clothing use hand tools to remove the asbestos. These asbestos-containing materials are sealed in bags and taken to licensed landfills for disposal. While the asbestos is being abated, air monitoring is performed by a licensed third-party inspector. After abatement is complete, an independent third party inspector would certify that the building is asbestos free, and general demolition would begin. During demolition, lead-based paint is generally not stripped from surfaces. Structures are disassembled or broken apart with most paint still intact. Normal dust control measures (spraying the building with water) will be used during demolition. The lead content of any resulting dust is therefore expected to be low, and normal dust control measures

Domino Sugar Rezoning
21-12
are sufficient to prevent off-site impacts. Depending on the amount of asbestos to be removed, 10 to 20 workers could be employed for this task, and about one or two closed or tarped truckloads of bagged materials could be removed per day. This phase can typically last about one month per building.
EXCAVATION AND FOUNDATION
Excavations Soil excavation and foundation construction for a building would take approximately six to eight months to complete, depending on the size of the development component. Trucks would remove excavated material for off-site disposal in a licensed landfill or recycling facility. Depending on the size of the excavation, the peak number of workers would range from about 40 per day on the smaller buildings to about 50 per day on a large building. Typical mobile equipment would include excavators, backhoes, bulldozers, loaders, and compactors. Because bedrock is relatively deep, it is not expected that blasting and rock excavation will be necessary.
Foundation Activities Foundation work would include pile driving and pouring concrete footings and foundations. Ready-mix concrete trucks would deliver concrete to the site. As discussed in “Traffic and Transportation,” the number of trucks that would visit the site in a given day would vary for each of the parcels. Like excavation, the number of workers on site each day would depend on the size of the foundation and would range from about 40 to 50.
Dewatering The excavation would have to be dewatered during the excavation and foundation activities because of rainfall and inflow from the nearby East River, and the water would be sent to an on-site sedimentation tank so that the suspended solids could settle out. The decanted water would be discharged either into the New York City sewer system or the East River; the settled sediment would be conveyed to a licensed disposal area. Water discharged into the New York City sewerage is regulated by DEP. DEP regulations specify the following maximum concentration of pollutants:
• Petroleum hydrocarbons : 50 parts per million • Cadmium: 2 parts per million • Hexavalent chromium: 5 parts per million • Copper: 5 parts per million • Amenable cyanide: 0.2 part per million • Lead: 2 parts per million • Mercury: 0.05 part per million • Nickel: 3 parts per million • Zinc: 5 parts per million
In addition, DEP limits other pollutants, such as total suspended particles, in the discharge water. DEP also imposes project-specific limits, depending on the location of the project and contamination that has been found in nearby areas. For large-volume discharges into the sewer system, which are not expected, DEP samples and tests the discharge water.

Chapter 21: Construction Impacts
21-13
If the dewatering is discharged into the East River, a NYSDEC SPDES permit must be obtained prior to discharge. Because the discharge is sent directly into the receiving waterbody without treatment except for settling, NYSDEC imposes more restrictions than the DEP regulations.
SUPERSTRUCTURE
Superstructure construction would take between 10 and 16 months to complete, depending on the size of the development component. Construction of the structure would create the framework (beams and columns) and floor decks. The structure would likely consist of reinforced concrete. Construction of the interior structure, or core, of the proposed buildings would create elevator shafts; vertical risers for mechanical, electrical, and plumbing systems; electrical and mechanical equipment rooms; core stairs; and restroom facilities. Core construction would begin when the foundation is ready and would continue through the interior construction and finishing stage.
Superstructure activities would require the use of cranes, derricks, delivery trucks, forklifts or loaders, and other heavy equipment such as tower cranes, concrete pumps, welding machines, rebar benders and cutters, and compressors. Temporary construction elevators (hoists) would also be constructed for the delivery of materials and vertical movement of workers during this stage. Cranes would be used to lift structural components, façade elements, large construction equipment, and other large materials. Smaller construction materials and debris generated during this stage of construction would generally be moved with hoists. During peak construction, the number of workers would be up to 120 per day. About 10 to 15 trucks per day would deliver materials to the building.
EXTERIOR CONSTRUCTION
Exterior construction involves the installation of the façade (exterior walls, windows, and cladding) and the roof. Exterior construction would take about 5 months for Site E on the upland parcel and 10 to 15 months for each site on the waterfront parcel, and would overlap with the completion of the superstructure and the interior finishing. Cranes would be used to lift the façade into place, and welding machines and impact wrenches would secure the exterior to the superstructure. Anywhere from 25 to 50 workers per day would be needed for the exterior construction.
INTERIOR CONSTRUCTION AND FINISHING
Installation of mechanical, electrical, and plumbing systems begun in the superstructure stage would continue during the interior construction and finishing stage. Other activities in this stage would include the installation of heating, ventilation, and air conditioning (HVAC) equipment and ductwork; installation of elevator, escalator, and life safety systems; construction of interior walls; installation of lighting fixtures; and interior finishing work (e.g., flooring, painting).
Interior construction and finishing would take between 10 and 18 months to complete, depending on the size of the development component. Up to 150 workers per day would be used for the interior finishing. As stated above, some superstructure and exterior construction would overlap with the interior construction and finishing stage.

Domino Sugar Rezoning
21-14
ADAPTIVE REUSE OF THE REFINERY
The Refinery, located on the waterfront between South 2nd and South 3rd Streets, would have its exterior restored, and a three- and four-story addition would be constructed above the existing Refinery structure, all in accordance with LPC-approved plans and with the Certificate of Appropriateness approved by LPC. In addition, its interior would be demolished and replaced with a new structure. Because the Refinery’s physical constraints pose unique construction challenges and because of its status as a New York City Landmark, construction methods would differ in some ways from those used in the new construction buildings on the project site.
ABATEMENT AND DEMOLITION
For the Refinery, demolition work would include complete removal of the interior of the buildings and the equipment within. It is anticipated that the Refinery walls would have to be braced to prevent the walls from collapsing. Because of the size of the refining machinery, the equipment would be removed piecemeal through the tops of the buildings. Abatement of any hazardous materials within this structure would occur during this time.
The sugar processing equipment within the existing buildings and the uneven floor levels among the three buildings that comprise the Refinery pose a challenge for the demolition work. Given the lack of continuous floors from building to building, and the fact that some of the equipment extends between multiple floors, maintaining the existing floor structure is not feasible. Rather, the processing equipment and the interior floor structures would have to be removed. The roof of the existing buildings would be removed and the equipment currently inside the buildings would be lifted out through the top.
The demolition and abatement is expected to be sequenced as follows:
• Pre-abatement demolition for general preparation and staging area clearing; • Abatement; • Opening of centers of all three buildings that together comprise the Refinery and removing
interior column runs (structure and slab removals would be coordinated around equipment removals);
• Removing the roof structure on all three buildings in order to facilitate equipment removal via tower crane. The perimeter column bay would remain intact to act as bracing for the façade and would be demolished concurrent with structural steel installation.
• Phased demolition of perimeter bays along with steel installation (concrete and floor removal only).
It is expected that abatement and demolition would occur over a period of approximately four and nine months, respectively.
The entire existing façade of the Refinery would require shoring during the demolition and construction process. The bracing would keep the perimeter column bay intact to act as temporary shoring of the existing façade. Additional steel would be required at each floor to brace the existing brick during demolition activities. Shoring steel would be added as the building is demolished, from the top down.
It is also assumed that timber shoring for new/enlarged window openings would be installed along with repair and replacement of window sills and lintels.

Chapter 21: Construction Impacts
21-15
EXCAVATION AND FOUNDATION
A foundation for what would essentially be a new building within the existing Refinery walls would be constructed by retrofitting the existing foundation. Under this scheme, new piles would be added at each existing wet column location where a column is required. It is expected that construction would include new pile caps, concrete footings at soil-bearing conditions, and underpinning at the perimeter load-bearing masonry wall. A new slab would also be constructed.
This work would take approximately 6 months.
SUPERSTRUCTURE
A new steel structure would be erected within the existing exterior walls and the elevator system would be put into place. The façade shoring would remain in place during steel erection. This work would take approximately 18 months to complete.
EXTERIOR CONSTRUCTION
Exterior construction would include the restoration of masonry on the façade and stack, installation of LPC-approved windows on the existing structure, and construction of the new rooftop addition. All exterior construction would be done in accordance with the Certificate of Appropriateness approved by LPC.
INTERIOR CONSTRUCTION AND FINISHING
Interior construction work on the Refinery would involve essentially the same activities as the construction of the new buildings on the project site. It is anticipated that this work would occur over approximately 19 months.
PUBLIC OPEN SPACE
As required under the New York City Zoning Resolution, the proposed project’s public open space would be constructed in tandem with the buildings along the waterfront. Work on the underlying waterfront platform would occur over a period of about two-and-a-half years, as described above under “Reconstruction of the Waterfront Platform.” The landscaping of the platform to create the waterfront esplanade and other public open space would occur sequentially as each site is built out. As each waterfront site in the proposed project is constructed, public access would be maintained to previously built public open space and the new components would be connected to the previously built sections.
A connection between the project site’s public open space and Grand Ferry Park would be constructed concurrent with the development of the public open space on Site A at the northern end of the project site.
C. METHODOLOGY FOR CONSTRUCTION IMPACTS ANALYSIS In general, the analyses presented in this chapter are qualitative. However, the traffic, noise, and air quality analyses are quantitative. The transit and pedestrian analysis is semi-quantitative.
Buildings could be built as-of-right by private developers who would not have to follow New York City Local Law 77, which only applies to City-sponsored projects. The project applicant has committed through the Restrictive Declaration to follow Local Law 77 and other stringent

Domino Sugar Rezoning
21-16
construction practices (discussed below) to reduce air emissions and noise from construction equipment and trucks. None of these commitments to prevent impacts on air quality and noise would have an enforcement mechanism for private developers under the as-of-right conditions. This chapter compares potential construction impacts with existing conditions and not with conditions that would occur with private developers constructing as-of-right buildings.
For the traffic analysis, the total number of worker vehicle trips and truck deliveries were estimated for each calendar quarter during construction using a conservative transportation modal split specifically applicable to construction workers in the area. As detailed below, two construction peak scenarios were reviewed, and the quarter with the greatest number of construction-generated trips was selected for analysis. For the analysis quarter, the vehicle trips were distributed according to construction work hours, with allowances for expected extended work shifts. Trips were assigned to routes coming to and leaving the project site, based on direction of travel for the workers and on designated truck routes for the trucks. Potential significant adverse impacts during construction are identified and mitigation measures recommended.
For the air quality analysis, the number, type, and size of all construction equipment expected to be on site was developed by the construction consultants. The emissions from each of the pieces of construction equipment were determined either from manufacture’s data or from existing published sources. An emissions profile was developed for each quarter of construction. The emissions during the highest quarter were used in an air quality model to determine the resulting concentrations of criteria pollutants in the surrounding areas. The analysis included both stationary sources of construction equipment and mobile sources from construction worker vehicles, construction trucks, and background traffic in the area. For noise, a three-dimensional model was used to determine potential impacts from the construction equipment on the project site and from traffic, both construction and background.
NUMBER OF CONSTRUCTION WORKERS AND MATERIAL DELIVERIES
Table 21-2 shows the estimated number of workers and deliveries to the project site by calendar quarter. The estimates were derived from information supplied by the proposed project’s construction consultant. The construction consultant prepared construction sequencing for each building. The work tasks were broken into the activities discussed above. The number of workers required for each task as well as the number of truck deliveries was estimated. When work on two buildings overlapped, the total number of workers and truck deliveries were summed for each quarter. These represent an average for days of work and deliveries within each quarter; the numbers of construction workers and delivery trucks would vary from day to day within the quarter. The average daily number of workers would be about 259 during the construction of the project, and would peak during the first quarter of 2016 at 610 workers. The number of truck trips would peak in the 3rd quarter of 2013, with 44 trucks arriving per day on average. Detailed workforce projections can be found in Appendix G.
Absent the proposed project, the project site would be developed with commercial and light-industrial uses permitted under the existing M3-1 zoning. Because this construction would occur as of right, there would be less oversight and regulation with respect to hazardous materials, noise, and air quality than the construction means and methods described in this chapter.

Chapter 21: Construction Impacts
21-17
Table 21-2 Number of Construction Workers and Delivery Trucks per Day
Year 2012 2013 2014 2015 Quarter 1st 2nd 3rd 4th 1st 2nd 3rd 4th 1st 2nd 3rd 4th 1st 2nd 3rd 4th Workers 43 68 162 167 182 187 203 273 323 308 267 237 235 345 512 582 Trucks 23 31 22 26 29 37 30 31 31 38 39 38 35 37 44 35 Year 2016 2017 2018 2019
Quarter 1st 2nd 3rd 4th 1st 2nd 3rd 4th 1st 2nd 3rd 4th 1st 2nd 3rd 4th Workers 610 563 480 137 73 30 37 47 103 243 267 347 353 387 347 258 Trucks 30 29 28 18 18 11 13 16 9 9 17 31 27 24 18 20 Year 2020 Project
Quarter 1st 2nd 3rd 4th Peak Average Workers 280 260 173 160 610 259 Trucks 18 13 9 6 44 25
Note: This table represents average conditions within each quarter. Source: Gotham Construction and F.J. Sciame Construction.
D. CONSTRUCTION IMPACTS OF THE PROPOSED PROJECT Construction may at times be disruptive to nearby residential buildings and open spaces during the construction period. The following analysis describes the overall temporary effects of construction on the relevant areas of concern: land use, socioeconomic conditions, open space, historic resources, hazardous materials, natural resources, infrastructure, traffic and parking, transit and pedestrians, air quality, noise, and rodent control.
LAND USE
Construction would cause some disruptions to activities in the surrounding area. Although construction would occur over several years, most disruptions would be temporary in nature and would not occur at any one location for the entire construction period. In addition, the location of construction activity would move over the course of the construction period. Construction activities would be similar to construction activities at other large sites in the city, and the hours of the construction would be regulated by DOB and DEP.
As described in Chapter 3, “Land Use, Zoning, and Public Policy,” land uses in the area immediately adjacent to the project site include commercial and light-industrial uses along Kent Avenue and Grand Street and residential uses along Kent Avenue between South 4th and South 5th Streets. There are also residential uses opposite the upland parcel of the project site on South 3rd and South 4th Streets, and on Wythe Avenue. As discussed in more detail below under “Open Space,” Grand Ferry Park is immediately adjacent to the northern edge of the project site.
During the construction, access to all adjacent businesses, residences, and other uses would be maintained according to the regulations established by DOB. When work takes place within building shells, effects on the surrounding uses would be substantially reduced, as compared with excavation and foundation activities. Management practices would be developed and implemented to minimize the effects of construction on access to businesses and buildings in the vicinity of the project site. Other changes, such as sidewalk closures, would also affect people living and working in the surrounding area, but implementation of the construction management practices would minimize the effects of these closures. Potential affects on Grand Ferry Park are discussed below under “Open Space.”
There would be no significant adverse impacts on land use due to construction.

Domino Sugar Rezoning
21-18
SOCIOECONOMIC CONDITIONS
Construction activities on the project site would include various lane and/or sidewalk closures for different stages of construction. However, access to industrial and other types of businesses would not be obstructed, and these closures would not disrupt adjacent businesses. In addition, most of the businesses adjacent to the project site are industrial and do not rely on foot traffic.
Construction would create major direct benefits resulting from expenditures on labor, materials, and services, as well as substantial indirect benefits created by expenditures by material suppliers, construction workers, and other employees involved in the direct activity. Construction would also contribute to increased tax revenues for the City and state, including those from personal income taxes.
There would be no significant adverse impacts on socioeconomic conditions due to construction.
OPEN SPACE
Because construction of the building on Site A would occur immediately adjacent to Grand Ferry Park, special measures would be taken to prevent construction activities from intruding into the park. A solid fence would be erected along the perimeter of the site that borders the park. The fence would have no openings between the construction site and the park and would be high enough to reduce sound from construction activity on the project site and to minimize dust. The hoists, cranes, and other equipment would be located on the side of the building away from the park. As the superstructure is being erected, netting would be installed on the side of the building facing the park to prevent any materials from falling into the park.
As described above under Section B, “Construction Activities,” a connection would be constructed between the proposed project’s public open space and Grand Ferry Park. Creating this connection would require construction activity within the southern portion of the park. The design of the connection and the necessary construction work within Grand Ferry Park are being coordinated with the New York City Department of Parks and Recreation (DPR). This connection would enhance the use of Grand Ferry Park by providing access to the larger waterfront esplanade running the length of the project site. Measures would be taken to minimize the temporary disruption to this open space during construction. Therefore, construction of the proposed project would not result in significant adverse impacts on open space.
Construction activities would be conducted with the care mandated by the close proximity of an open space to the project site. Dust control measures—including watering of exposed areas and dust covers for trucks—would be implemented to ensure compliance with Section 1402.2-9.11 of the New York City Air Pollution Control Code, which regulates construction-related dust emissions. There would be no significant adverse air quality impacts on open spaces due to construction.
HISTORIC RESOURCES
A CPP for the Refinery would be prepared in coordination with a licensed professional engineer. It would describe the measures to be implemented during the rehabilitation of the Refinery itself, as well as measures to be taken to protect the Refinery during construction of adjacent buildings on the project site.

Chapter 21: Construction Impacts
21-19
As described in Chapter 8, “Historic Resources,” the project site is located within 90 feet of three historic resources: the Williamsburg Bridge, the former American Sugar Refinery Buildings, and the former Matchett Candy factory. Construction of the project could result in inadvertent physical impacts to these resources if proper precautions are not taken. To avoid any construction-related impacts on the latter two resources, including ground-borne vibration, falling debris, and accidental damage from heavy machinery, a CPP would be developed in consultation with SHPO and LPC. The CPP would follow the guidelines set forth in section 523 of the CEQR Technical Manual, including conforming to LPC’s New York City Landmarks Preservation Commission Guidelines for Construction Adjacent to a Historic Landmark and Protection Programs for Landmark Buildings. The CPP would also comply with the procedures set forth in DOB’s Technical Policy and Procedure Notice (TPPN) #10/88.
The Williamsburg Bridge is separated from the project site by South 5th Street, which is 60 feet wide. Protection measures for this resource would be developed in coordination with SHPO, LPC, and DOT.
With these measures in place, construction of the proposed project would not result in any significant adverse impacts on historic resources.
HAZARDOUS MATERIALS
As discussed in Chapter 12, “Hazardous Materials,” soil and groundwater from the proposed project site has been tested for hazardous materials. Site investigation activities did reveal the presence of semi-volatile organic compounds and metals associated with historic fill material in the site subsurface, but the presence of these compounds alone does not pose a significant adverse impact to human health or the environment. While uncontrolled excavation activities could increase pathways by exposing sub-surface contaminated materials, potential impacts would be avoided by performing construction activities in accordance with federal, state, and local regulations.
A Remedial Action Plan (RAP) has been prepared to outline general guidelines and measures for remediation and proper handling of soil during the redevelopment of the project site. Specifically, the RAP includes requirements for confirmatory sampling to document post-development subsurface conditions, soil disposal, pre-characterization soil sampling, tank removal procedures, measures to address petroleum spills, dust and vapor controls, air monitoring, contingency planning, installation of a site cap consisting of building cover, paving or two feet of clean fill, and installation of a vapor barrier below each building to prevent potential vapor intrusion. The RAP was approved by DEP on September 24, 2009. The RAP was designed to facilitate the remediation of different phases of the proposed project in any potential order while still protecting current and future neighbors and site occupants.
A Construction Phase Environmental Health and Safety Plan (CHASP) has been prepared to assign responsibilities, establish personnel protection standards and mandatory safety practices and procedures, and provide for contingencies that may arise during construction at the project site. The CHASP is intended to minimize health and safety risks resulting from the known and potential presence of hazardous materials on the site and outlines potential hazards, personal protective equipment, air monitoring, and health and safety plan soil sampling. The CHASP was approved by DEP on September 24, 2009. The CHASP was also designed to facilitate the remediation and construction of different phases of the proposed project in any potential order while still protecting current and future neighbors and site occupants.
Domino Sugar Rezoning
21-20
Pursuant to the Restrictive Declaration to be recorded against the property, development activities, including any remediation, will be conducted in accordance with the DEP-approved RAP and CHASP under the oversight of DEP and/or the New York City Mayor’s Office of Environmental Remediation (NYCOER). This would avoid any significant adverse impacts to construction workers, the surrounding community, and future site occupants. The RAP and CHASP outline procedures for removal of any storage tanks and management of excavated soil during the construction activities, and requirements for vapor controls and a site cap to prevent exposure to future occupants of the project site.
These measures would ensure that there would be no significant adverse impacts on public health, worker safety, or the environment as a result of potential hazardous materials exposed by or encountered during construction.
NATURAL RESOURCES
As described in Chapter 11, “Natural Resources,” the proposed project would be covered under the NYSDEC SPDES General Permit for Stormwater Discharges from Construction Activity Permit No. GP-0-10-001. To obtain coverage under this permit, an SWPPP would be prepared and a Notice of Intent (NOI) would be submitted to NYSDEC. The SWPPP would comply with all of the requirements of GP-0-10-001, NYSDEC’s technical standard for erosion and sediment control presented in New York Standards and Specifications for Erosion and Sediment Control, and NYSDEC’s technical standard for the design of water quantity and water quality controls (post-construction stormwater control practices) presented in the New York State Stormwater Management Design Manual. Implementation of erosion and sediment control measures, and stormwater management measures identified in the SWPPP would minimize potential impacts on littoral zone tidal wetlands along the edges of the project site associated with discharge of stormwater runoff during land-disturbing activities resulting from construction of the proposed project.
Groundwater recovered during dewatering of excavations would be sent to an on-site sedimentation tank so that the suspended solids could settle out. The decanted water would be discharged into the New York City combined sewer system or the East River and the settled sediment conveyed to a licensed disposal area.
As described in Chapter 11, “Natural Resources,” peregrine falcons, an endangered species, may appear in the vicinity of the project site. Peregrine falcons are accustomed to the intensely developed habitats of New York City and are not expected to experience a significant adverse impact due to the proposed project. In the event that peregrine falcon nesting activity is documented as occurring on or near the project site (i.e., the Williamsburg Bridge and/or nearby buildings) prior to or during construction of the proposed project, measures to minimize potential adverse impacts to peregrine falcons would be developed in coordination with NYSDEC and DEP. These measures would focus on minimizing potential impacts to nesting, foraging or roosting activity by adult falcons and offspring in the vicinity of proposed construction. Potential measures could include bird control devices on the tops of cranes or other tall construction equipment to prevent young falcons from landing on such equipment and becoming entangled or otherwise injured.
INFRASTRUCTURE
The proposed new buildings and the Refinery would receive some combination of electricity and gas via extensions of the existing Con Edison and National Grid underground distribution

Chapter 21: Construction Impacts
21-21
systems. During the erection of the superstructure, some sidewalk and on-street construction activities would be required to connect the proposed buildings to existing utility networks. For electrical connections, short-term sidewalk excavations ranging from approximately 50 to 150 feet in length would be required. In addition, electric lines would be extended from existing manholes to the new transformer vaults, requiring roadway excavation.
The construction activities that would be required to connect the proposed project to existing energy systems are part of Con Edison’s and National Grid’s normal operations for providing services to new customers, and occur on a regular basis throughout the city. Therefore, these construction activities would not result in a significant adverse impact to infrastructure and energy systems. To the extent logistically feasible, Con Edison electricity would be used to power construction equipment.
TRAFFIC AND PARKING
Construction activity would occur from 2012 to 2020 and would generate construction worker and truck traffic. Because of the lengthy duration of these activities, an evaluation of construction sequencing and worker/truck projections was undertaken to assess potential traffic-related impacts. As described below, the projected peak conditions during construction would yield less total traffic than the full build-out of the proposed project. Nonetheless, a quantified construction traffic analysis reflective of the newly configured Kent Avenue condition was prepared to identify significant adverse impacts during construction that may differ from those identified for the project’s full build-out and which may require different mitigation measures or early implementation of proposed future with the proposed project mitigation measures.
CONSTRUCTION TRAFFIC PROJECTIONS
Average daily construction worker and truck activities by quarter were projected for the full nine years of construction. These projections were further refined to account for worker modal splits and vehicle occupancy, and arrival and departure distribution.
Daily Workforce and Truck Deliveries For a reasonable worst-case analysis of potential transportation-related impacts during construction, the daily workforce and truck trip projections in the peak quarters were used as the basis for estimating peak hour construction trips. With construction beginning in 2012, the combined construction worker and truck traffic peak would occur in the first quarter of 2016, when construction activities at Site C and the Refinery would be underway. The daily average numbers of construction workers and truck deliveries during the construction peak quarter were estimated at 610 workers and 30 truck deliveries per day. These estimates of construction activities are further discussed below.
Construction Worker Modal Splits According to the U.S. Census reverse journey-to-work (RJTW) data, commuting to work via auto for construction and excavation occupations in the study area is approximately 67 percent, with an average auto occupancy rate of 1.39. Commuting to work by public transit is approximately 25 percent, and the remaining 8 percent of commuting trips are made by walk only. However, for a more conservative analysis, a 70 percent auto usage was used to project the numbers of vehicle trips generated by future construction workers. It was assumed that 5 percent of the commuting trips for the construction activities would be made by walk only.

Domino Sugar Rezoning
21-22
Peak Hour Construction Worker Vehicle and Truck Trips Site activities would mostly take place during the typical construction shift of 7:00 AM to 3:30 PM. However, some construction tasks would extend to 5:00 to 6:00 PM, requiring a portion of the construction workforce to remain for this extended shift.
While construction truck trips would be made throughout the day (with more trips made during the early morning), and most trucks would remain in the area for short durations, construction worker travel would typically take place during the hours before and after the work shift. For analysis purposes, each worker vehicle was assumed to arrive in the morning and depart in the afternoon or early evening, whereas each truck delivery was assumed to result in two truck trips during the same hour (one “in” and one “out”).
The estimated daily vehicle trips were distributed throughout the workday based on projected work shift allocations and conventional arrival/departure patterns of construction workers and trucks. For construction workers, the majority (80 percent) of the arrival and departure trips would take place during the hour before and after each shift (6 to 7 AM for arrival and 3 to 4 PM for departure on a normal day shift, or 5 to 6 PM for days with extended shifts). For construction trucks, deliveries would occur throughout the day when the construction site is active. Construction truck deliveries typically peak during the hour before the regular day shift (25 percent of regular shift and 20 percent of extended shift), overlapping with construction worker arrival traffic. Based on these assumptions, peak hour construction traffic was estimated for the entire nine-year construction period, as detailed in Appendix G. The peak construction hourly trip projections averaged for the first quarter of 2016 are summarized in Table 21-3.
Table 21-3 Peak Construction Trip Projections 2016 (First Quarter)
Hour
Construction Workers Construction Truck Trips
Total Vehicle-Trips Total
PCEs Worker-Trips Auto-Trips
In Out In Out In Out In Out Total 6 AM to 7 AM 488 0 246 0 8 8 254 8 262 278 7 AM to 8 AM 122 0 61 0 3 3 64 3 67 73 8 AM to 9 AM 0 0 0 0 3 3 3 3 6 12 9 AM to 10 AM 0 0 0 0 3 3 3 3 6 12 10 AM to 11 AM 0 0 0 0 3 3 3 3 6 12 11 AM to12 PM 0 0 0 0 3 3 3 3 6 12 12 PM to 1 PM 0 0 0 0 3 3 3 3 6 12 1 PM to 2 PM 0 0 0 0 2 2 2 2 4 8 2 PM to 3 PM 0 47 0 24 2 2 2 26 28 32 3 PM to 4 PM 0 371 0 187 0 0 0 187 187 187 4 PM to 5 PM 0 60 0 30 0 0 0 30 30 30 5 PM to 6 PM 0 117 0 59 0 0 0 59 59 59 6 PM to 7 PM 0 15 0 7 0 0 0 7 7 7
Day Total 610 610 307 307 30 30 337 337 674 734 Notes: Hourly construction worker and truck trips were derived from projected estimates of 610 workers and 30 trucks making two daily trips each (arrival and departure) in the first quarter of 2016. Numbers of construction worker vehicles were calculated with a 70 percent auto split and vehicle occupancy of 1.39. PCEs = passenger car equivalents where 1 truck trip equals 2 PCEs.
TRAFFIC
Because the proposed development program would result in buildings completed and occupied at different times, the total project-generated traffic during construction, beginning with the
Chapter 21: Construction Impacts
21-23
completion of the first building, would encompass both construction and operational traffic. As described above, trip-making attributable to construction activities would peak in the first quarter of 2016. At that time, only Buildings D and E would have been completed. These buildings would generate a relatively small percentage of the total operational traffic that would occur upon the project’s final build-out. A secondary peak construction scenario in early 2020, when all proposed buildings except for Building A would have been completed and operational, was also reviewed to determine the appropriate and representative peak construction condition for assessing potential construction traffic impacts. As shown in Table 21-4, peak construction vehicle trips are expected to be twice as high in the first quarter of 2016 as those projected for the first quarter of 2020. However, the operational trips in the first quarter of 2016 would be less than half of the operational trips in the first quarter of 2020.
Table 21-4 Comparison of Weekday Vehicle Trip Generation––Construction and Operational
Time
2016 Construction Scenario 2020 Construction Scenario 2020 Full Build-
Out Project-Generated Trips
in PCEs
Construction Trips in PCEs
(Q1 2016)
Operational Trips in PCEs
(Buildings D and E) Total PCEs
Construction Trips in PCEs
(Q1 2020)
Operational Trips in PCEs
(No Building A) Total PCEs In Out Total In Out Total In Out Total In Out Total In Out Total In Out Total In Out Total
6-7 AM 262 16 278 4 2 6 266 18 284 123 10 133 15 8 23 138 18 156 -- -- -- 8-9 AM* -- -- -- -- -- -- -- -- -- -- -- -- -- -- -- -- -- -- 409 353 762 12-1 PM* -- -- -- -- -- -- -- -- -- -- -- -- -- -- -- -- -- -- 283 289 572 3-4 PM 0 187 187 124 120 244 124 307 431 0 79 79 260 254 514 260 333 593 -- -- -- 5-6 PM* 0 59 59 170 132 302 170 191 361 0 34 34 363 362 725 363 396 759 433 524 957
Notes: * Peak hours of operational traffic analysis are 8-9 AM, 1-2 PM, and 4:45-5:45 PM. See Appendix G for detailed construction trip estimates. PCEs = passenger car equivalents where 1 truck trip equals 2 PCEs. The above operation trip estimates in PCEs do not account for trip credits from the as-of-right development.
With the construction and operational trips combined, the 2016 first quarter construction scenario would yield more 6 to 7 AM construction peak hour vehicle trips but fewer 3 to 4 PM and 5 to 6 PM construction peak hour vehicle trips than the 2020 first quarter construction scenario. For the early morning 6 to 7 AM construction peak hour, components of the proposed project would generate minimal operational trips; hence, the scenario with the higher construction trips (2016 first quarter) would yield the most total project-generated trips. For the afternoon 3 to 4 PM and 5 to 6 PM hours, however, the scenario with the higher operational trips (2020 first quarter) would yield the most total project-generated trips. Compared to the 2020 full build-out of the proposed project, both construction scenarios would yield fewer total project-generated trips. As demonstrated in Table 21-4’s trip projections, the combined 6 to 7 AM construction and operational trips are less than 40 percent of the total projected operational trips for the 2020 full build-out AM analysis peak hour and the combined 3 to 4 PM or 5 to 6 PM construction and operational trips are less than 80 percent of the total projected operational trips for the 2020 full build-out PM analysis peak hour. Hence, overall traffic conditions during construction in the traffic study area are expected to be better than the 2020 future with the proposed project condition presented in Chapter 17, “Traffic and Parking.” Furthermore, based on ATR data updated in February 2010, the 6 to 7 AM background traffic volumes are approximately 40 percent lower than the 8 to 9 AM commuter peak hour volumes, while the 3 to 4 PM background traffic volumes are not substantially different than the 5 to 6 PM commuter peak hour traffic volumes. Since existing and No Action traffic conditions at some of the study area intersections through which construction-related traffic would also travel were determined to operate at unacceptable levels during commuter peak hours, it is possible that significant

Domino Sugar Rezoning
21-24
adverse traffic impacts could occur at some or many of these locations during construction. In order to alleviate construction traffic impacts, measures recommended to mitigate impacts associated with the proposed actions could be implemented during construction before completion of the proposed project.
A quantified traffic analysis was prepared to identify significant adverse traffic impacts during construction that may differ from those identified for the project’s final build-out and which may require different mitigation measures or early implementation of proposed build mitigation measures. As discussed above, the 2020 first quarter construction scenario would result in more total combined project-generated trips during two of the three construction peak hours than the 2016 first quarter construction scenario. However, because the construction trip component during the first quarter of 2020 would make up a very small portion of the total trips (construction and operational) associated with the proposed project, the conditions would be more reflective of those in the final build-out, which is already being addressed in Chapter 17, “Traffic and Parking.” Therefore, it is more appropriate to consider the 2016 first quarter construction scenario as the representative worst-case condition for assessing potential construction traffic impacts and mitigation measures. This analysis evaluates locations where there would be significant adverse impacts under the full build-out of the proposed project.
DELIVERIES
Construction trucks would be required to use DOT-designated truck routes, including the Brooklyn Queens Expressway (BQE), Kent Avenue, Broadway, Metropolitan Avenue, North 10th/11th Streets, the Williamsburg Bridge, and the Queens-Midtown Tunnel. Trucks would then use local streets to access the construction sites, and would avoid local streets with narrow widths that require difficult turning maneuvers.
CONSTRUCTION TRAFFIC ANALYSIS VOLUMES
Baseline traffic volumes in 2016 for the 6 to 7 AM, 3 to 4 PM, and 5 to 6 PM construction peak hours (“2016 Construction No Action Traffic Volumes”), as shown in Appendix G, were developed by adjusting for temporal differences based on recent ATR data, growing existing 2010 traffic volumes to 2016, and incorporating all area No Build projects identified in Chapter 17, “Traffic and Parking.” Auto trips made by construction workers were assigned to the traffic network with the majority of trips (55 percent) assumed to access the project site from the BQE, 15 percent of the trips via the Williamsburg Bridge from Manhattan and New Jersey, and 30 percent of the trips from other available local streets. As discussed above, delivery trips made by construction trucks were assigned to DOT-designated truck routes, with the majority of the trips accessing the project site from the BQE. Traffic assignments for the 2016 first quarter combined construction and operational-generated vehicle trips (in PCEs) during the 6 to 7 AM, 3 to 4 PM, and 5 to 6 PM peak hours (“2016 Construction-Related and Project-Generated Incremental Traffic Volumes”), respectively, are shown in Appendix G. The “2016 Construction Total (or Construction Build) Traffic Volumes,” incorporating the 2016 No Action and incremental traffic volumes, are shown in Appendix G, for the 6 to 7 AM, 3 to 4 PM, and 5 to 6 PM peak hours, respectively.
2016 CONSTRUCTION TRAFFIC IMPACT ANALYSIS
The construction traffic volumes described above showed that the 3 to 4 PM and 5 to 6 PM increments are very similar in total. However, the trip compositions between the two hours are

Chapter 21: Construction Impacts
21-25
somewhat different. The 3 to 4 PM hour would have more construction worker and delivery trips and fewer operational trips from buildings D and E, while the 5 to 6 PM hour would have primarily operational trips from buildings D and E. Because background traffic volumes for the 3 to 4 PM and 5 to 6 PM hours are comparable, an analysis of the 5 to 6 PM hour for assessing construction traffic conditions is not expected to yield perceptibly different results from a 3 to 4 PM construction traffic analysis. Since the 6 to 7 AM and 3 to 4 PM hours are the representative construction peak hours, these hours were selected for the detailed construction traffic analyses described below. It should be noted, however, that findings made for the 3 to 4 PM construction traffic peak hour would also be applicable for the 5 to 6 PM peak hour.
According to the analysis results presented in Chapter 17, “Traffic and Parking,” there would be 24 and 31 intersections during the 8 to 9 AM and 4:45 to 5:45 PM operational analysis peak hours, respectively, that would incur significant adverse traffic impacts upon the project’s final build-out in 2020. Since background traffic levels during peak construction in 2016 would be lower than those assessed for the 2020 analysis year, No Build service levels at study area intersections would be better in 2016 than in 2020. Additionally, because the 2016 peak construction incremental traffic would be lower than the projected traffic for the project’s build-out in 2020, incremental impacts are also expected to be lower during peak construction in 2016 than they would upon the project’s completion in 2020. Therefore, locations where potential impacts could occur during peak construction in 2016 would be the same as or part of the set of locations identified in Chapter 17, “Traffic and Parking,” to be impacted in 2020. According to the analysis results presented in Chapter 23, “Mitigation,” 11 of the 24 intersections during the 8 to 9 AM peak hour and 11 of the 31 intersections during the 4:45 to 5:45 PM peak hour that would be significantly impacted could be mitigated with minor adjustments to signal timing. The implementation of these signal timing adjustments is typically subject to DOT’s review of actual conditions at the time or, for this project, could be advanced during construction and/or upon completion of the first two buildings (D and E). Therefore, while significant adverse traffic impacts at these intersections could also occur during peak construction in 2016, a detailed analysis of their service levels was not conducted, and it is expected that similar signal timing adjustments identified for mitigating impacts from the project’s full build-out could be implemented early at DOT’s discretion to mitigate potential impacts at these intersections during construction. The assessment discussed below focuses on conditions and mitigation requirements during peak 2016 construction at intersections that were projected to be significantly impacted upon the project’s full build-out in 2020 and that would require mitigation measures beyond solely the adjustment of signal timings.
A quantified construction traffic analysis for peak 2016 construction was conducted for 21 intersections. These intersections were identified to be significantly impacted under the full project build-out and would require more substantial mitigation measures (e.g., restriping and/or daylighting to provide more roadway capacity, converting two-way stop controls to four-way stop controls, or converting stop controls to signal controls). The purpose of this analysis is to determine if significant adverse traffic impacts would occur at these intersections after the completion of the first two buildings (D and E) and during peak construction in 2016, and whether the mitigation measures recommended for the project’s full build-out would be warranted at this time or if “lesser” mitigation measures (i.e., signal timing adjustments) could be implemented in the interim. Table 21-5 provides a summary of the impacted locations. Summaries of the analysis results comparing the 2016 No Action and construction traffic conditions and required mitigation measures are presented in Tables 21-6 and 21-7 for signalized and unsignalized intersections, respectively. The analyses show that no significant adverse

Domino Sugar Rezoning
21-26
traffic impacts would be expected in the 6 to 7 AM peak hour for any of the 21 analyzed intersections. During the 3 to 4 PM peak hour, 5 signalized intersections and 7 unsignalized intersections were identified to have resulted in significant adverse traffic impacts. These impacts and the measures required to mitigate them are discussed below. The implementation of these measures would fully mitigate the significant adverse impacts identified for the 3 to 4 PM peak hour (and similarly for the 5 to 6 PM peak hour) and not adversely affect the operations during the 6 to 7 AM peak hour.
Table 21-5 Summary of Significantly Impacted Intersections:
2016 Construction Conditions
Intersections Approach Lane
Group 6 – 7 AM
Construction Hour 3 – 4 PM
Construction Hour
Kent Avenue & Metropolitan Avenue
EB LT WB TR NB L
TR
Wythe Avenue & Metropolitan Avenue EB TR WB LT SB LTR
Wythe Avenue & Broadway
EB TR WB L
T SB LTR
Broadway & Driggs Avenue EB TR WB LT SB LTR
Broadway & Marcy Avenue EB TR WB LT SB LTR
Kent Avenue & South 4th Street EB L WB TR NB L
Kent Avenue & South 6th Street EB L WB TR NB L
Wythe Avenue & Grand Street EB TR WB LT SB LTR
Wythe Avenue & South 3rd Street EB TR SB LT
Wythe Avenue & South 4th Street WB LT SB TR
Wythe Avenue & South 6th Street WB LT SB TR
Wythe Avenue & South 8th Street WB LT
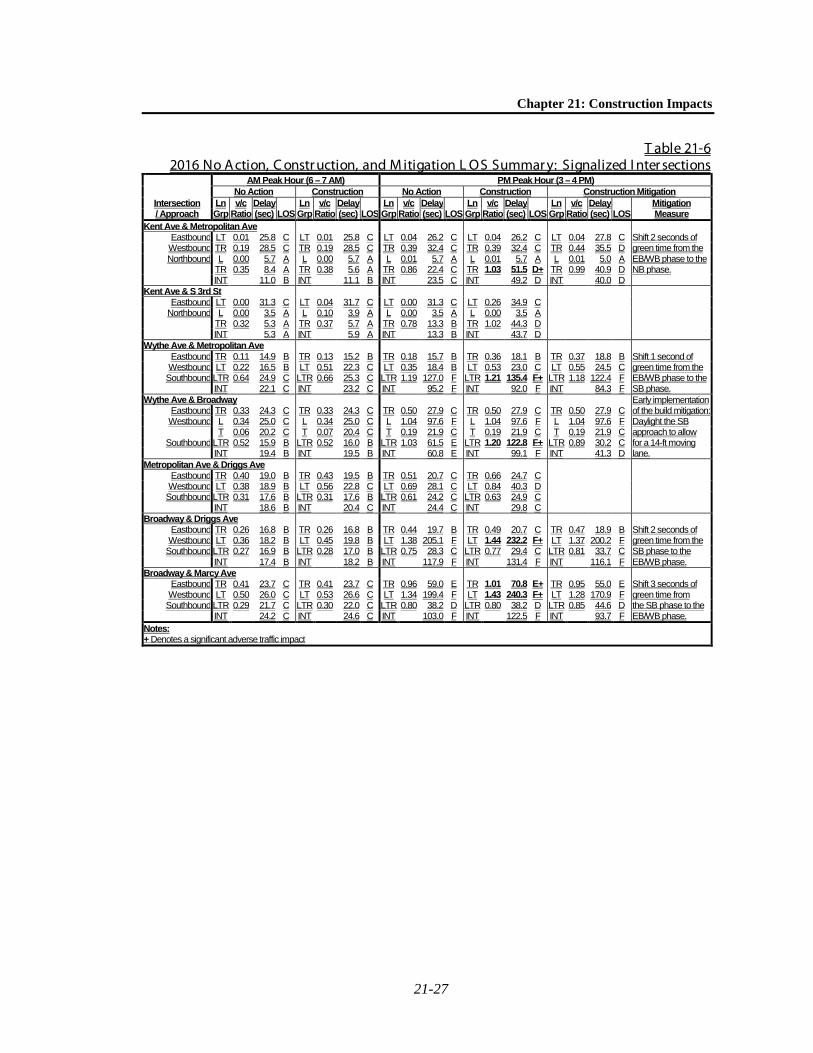
Chapter 21: Construction Impacts
21-27
T able 21-6 2016 No Action, C onstr uction, and M itigation L OS Summar y: Signalized I nter sections
AM Peak Hour (6 – 7 AM) PM Peak Hour (3 – 4 PM) No Action Construction No Action Construction Construction Mitigation
Intersection Ln v/c Delay Ln v/c Delay Ln v/c Delay Ln v/c Delay Ln v/c Delay Mitigation / Approach Grp Ratio (sec) LOS Grp Ratio (sec) LOS Grp Ratio (sec) LOS Grp Ratio (sec) LOS Grp Ratio (sec) LOS Measure
Kent Ave & Metropolitan Ave Eastbound LT 0.01 25.8 C LT 0.01 25.8 C LT 0.04 26.2 C LT 0.04 26.2 C LT 0.04 27.8 C Shift 2 seconds of Westbound TR 0.19 28.5 C TR 0.19 28.5 C TR 0.39 32.4 C TR 0.39 32.4 C TR 0.44 35.5 D green time from the Northbound L 0.00 5.7 A L 0.00 5.7 A L 0.01 5.7 A L 0.01 5.7 A L 0.01 5.0 A EB/WB phase to the
TR 0.35 8.4 A TR 0.38 5.6 A TR 0.86 22.4 C TR 1.03 51.5 D+ TR 0.99 40.9 D NB phase. INT 11.0 B INT 11.1 B INT 23.5 C INT 49.2 D INT 40.0 D Kent Ave & S 3rd St
Eastbound LT 0.00 31.3 C LT 0.04 31.7 C LT 0.00 31.3 C LT 0.26 34.9 C Northbound L 0.00 3.5 A L 0.10 3.9 A L 0.00 3.5 A L 0.00 3.5 A
TR 0.32 5.3 A TR 0.37 5.7 A TR 0.78 13.3 B TR 1.02 44.3 D INT 5.3 A INT 5.9 A INT 13.3 B INT 43.7 D Wythe Ave & Metropolitan Ave
Eastbound TR 0.11 14.9 B TR 0.13 15.2 B TR 0.18 15.7 B TR 0.36 18.1 B TR 0.37 18.8 B Shift 1 second of Westbound LT 0.22 16.5 B LT 0.51 22.3 C LT 0.35 18.4 B LT 0.53 23.0 C LT 0.55 24.5 C green time from the Southbound LTR 0.64 24.9 C LTR 0.66 25.3 C LTR 1.19 127.0 F LTR 1.21 135.4 F+ LTR 1.18 122.4 F EB/WB phase to the
INT 22.1 C INT 23.2 C INT 95.2 F INT 92.0 F INT 84.3 F SB phase. Wythe Ave & Broadway Early implementation
Eastbound TR 0.33 24.3 C TR 0.33 24.3 C TR 0.50 27.9 C TR 0.50 27.9 C TR 0.50 27.9 C of the build mitigation: Westbound L 0.34 25.0 C L 0.34 25.0 C L 1.04 97.6 F L 1.04 97.6 F L 1.04 97.6 F Daylight the SB
T 0.06 20.2 C T 0.07 20.4 C T 0.19 21.9 C T 0.19 21.9 C T 0.19 21.9 C approach to allow Southbound LTR 0.52 15.9 B LTR 0.52 16.0 B LTR 1.03 61.5 E LTR 1.20 122.8 F+ LTR 0.89 30.2 C for a 14-ft moving
INT 19.4 B INT 19.5 B INT 60.8 E INT 99.1 F INT 41.3 D lane. Metropolitan Ave & Driggs Ave
Eastbound TR 0.40 19.0 B TR 0.43 19.5 B TR 0.51 20.7 C TR 0.66 24.7 C Westbound LT 0.38 18.9 B LT 0.56 22.8 C LT 0.69 28.1 C LT 0.84 40.3 D Southbound LTR 0.31 17.6 B LTR 0.31 17.6 B LTR 0.61 24.2 C LTR 0.63 24.9 C
INT 18.6 B INT 20.4 C INT 24.4 C INT 29.8 C Broadway & Driggs Ave
Eastbound TR 0.26 16.8 B TR 0.26 16.8 B TR 0.44 19.7 B TR 0.49 20.7 C TR 0.47 18.9 B Shift 2 seconds of Westbound LT 0.36 18.2 B LT 0.45 19.8 B LT 1.38 205.1 F LT 1.44 232.2 F+ LT 1.37 200.2 F green time from the Southbound LTR 0.27 16.9 B LTR 0.28 17.0 B LTR 0.75 28.3 C LTR 0.77 29.4 C LTR 0.81 33.7 C SB phase to the
INT 17.4 B INT 18.2 B INT 117.9 F INT 131.4 F INT 116.1 F EB/WB phase. Broadway & Marcy Ave
Eastbound TR 0.41 23.7 C TR 0.41 23.7 C TR 0.96 59.0 E TR 1.01 70.8 E+ TR 0.95 55.0 E Shift 3 seconds of Westbound LT 0.50 26.0 C LT 0.53 26.6 C LT 1.34 199.4 F LT 1.43 240.3 F+ LT 1.28 170.9 F green time from Southbound LTR 0.29 21.7 C LTR 0.30 22.0 C LTR 0.80 38.2 D LTR 0.80 38.2 D LTR 0.85 44.6 D the SB phase to the
INT 24.2 C INT 24.6 C INT 103.0 F INT 122.5 F INT 93.7 F EB/WB phase. Notes: + Denotes a significant adverse traffic impact
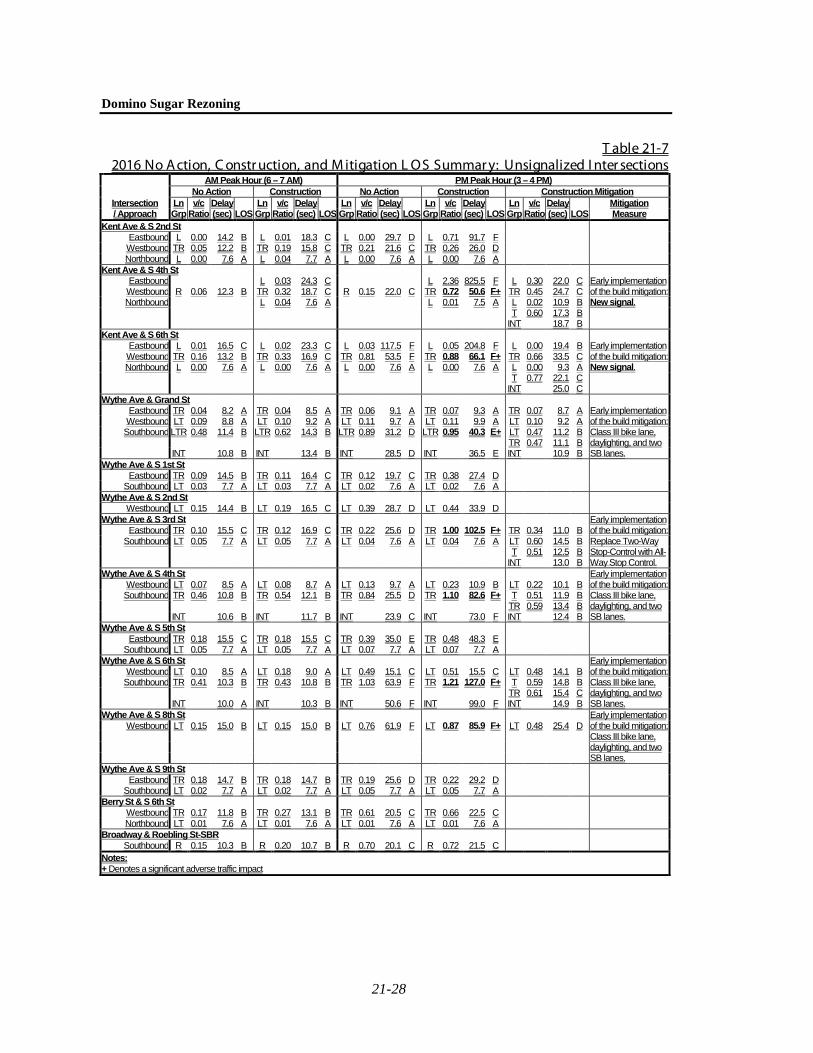
Domino Sugar Rezoning
21-28
T able 21-7 2016 No Action, C onstr uction, and M itigation L OS Summar y: Unsignalized I nter sections
AM Peak Hour (6 – 7 AM) PM Peak Hour (3 – 4 PM) No Action Construction No Action Construction Construction Mitigation
Intersection Ln v/c Delay Ln v/c Delay Ln v/c Delay Ln v/c Delay Ln v/c Delay Mitigation / Approach Grp Ratio (sec) LOS Grp Ratio (sec) LOS Grp Ratio (sec) LOS Grp Ratio (sec) LOS Grp Ratio (sec) LOS Measure
Kent Ave & S 2nd St Eastbound L 0.00 14.2 B L 0.01 18.3 C L 0.00 29.7 D L 0.71 91.7 F Westbound TR 0.05 12.2 B TR 0.19 15.8 C TR 0.21 21.6 C TR 0.26 26.0 D Northbound L 0.00 7.6 A L 0.04 7.7 A L 0.00 7.6 A L 0.00 7.6 A
Kent Ave & S 4th St Eastbound L 0.03 24.3 C L 2.36 825.5 F L 0.30 22.0 C Early implementation Westbound R 0.06 12.3 B TR 0.32 18.7 C R 0.15 22.0 C TR 0.72 50.6 F+ TR 0.45 24.7 C of the build mitigation: Northbound L 0.04 7.6 A L 0.01 7.5 A L 0.02 10.9 B New signal.
T 0.60 17.3 B INT 18.7 B
Kent Ave & S 6th St Eastbound L 0.01 16.5 C L 0.02 23.3 C L 0.03 117.5 F L 0.05 204.8 F L 0.00 19.4 B Early implementation Westbound TR 0.16 13.2 B TR 0.33 16.9 C TR 0.81 53.5 F TR 0.88 66.1 F+ TR 0.66 33.5 C of the build mitigation: Northbound L 0.00 7.6 A L 0.00 7.6 A L 0.00 7.6 A L 0.00 7.6 A L 0.00 9.3 A New signal.
T 0.77 22.1 C INT 25.0 C
Wythe Ave & Grand St Eastbound TR 0.04 8.2 A TR 0.04 8.5 A TR 0.06 9.1 A TR 0.07 9.3 A TR 0.07 8.7 A Early implementation Westbound LT 0.09 8.8 A LT 0.10 9.2 A LT 0.11 9.7 A LT 0.11 9.9 A LT 0.10 9.2 A of the build mitigation: Southbound LTR 0.48 11.4 B LTR 0.62 14.3 B LTR 0.89 31.2 D LTR 0.95 40.3 E+ LT 0.47 11.2 B Class III bike lane,
TR 0.47 11.1 B daylighting, and two INT 10.8 B INT 13.4 B INT 28.5 D INT 36.5 E INT 10.9 B SB lanes.
Wythe Ave & S 1st St Eastbound TR 0.09 14.5 B TR 0.11 16.4 C TR 0.12 19.7 C TR 0.38 27.4 D
Southbound LT 0.03 7.7 A LT 0.03 7.7 A LT 0.02 7.6 A LT 0.02 7.6 A Wythe Ave & S 2nd St
Westbound LT 0.15 14.4 B LT 0.19 16.5 C LT 0.39 28.7 D LT 0.44 33.9 D Wythe Ave & S 3rd St Early implementation
Eastbound TR 0.10 15.5 C TR 0.12 16.9 C TR 0.22 25.6 D TR 1.00 102.5 F+ TR 0.34 11.0 B of the build mitigation: Southbound LT 0.05 7.7 A LT 0.05 7.7 A LT 0.04 7.6 A LT 0.04 7.6 A LT 0.60 14.5 B Replace Two-Way
T 0.51 12.5 B Stop-Control with All- INT 13.0 B Way Stop Control.
Wythe Ave & S 4th St Early implementation Westbound LT 0.07 8.5 A LT 0.08 8.7 A LT 0.13 9.7 A LT 0.23 10.9 B LT 0.22 10.1 B of the build mitigation: Southbound TR 0.46 10.8 B TR 0.54 12.1 B TR 0.84 25.5 D TR 1.10 82.6 F+ T 0.51 11.9 B Class III bike lane,
TR 0.59 13.4 B daylighting, and two INT 10.6 B INT 11.7 B INT 23.9 C INT 73.0 F INT 12.4 B SB lanes.
Wythe Ave & S 5th St Eastbound TR 0.18 15.5 C TR 0.18 15.5 C TR 0.39 35.0 E TR 0.48 48.3 E
Southbound LT 0.05 7.7 A LT 0.05 7.7 A LT 0.07 7.7 A LT 0.07 7.7 A Wythe Ave & S 6th St Early implementation
Westbound LT 0.10 8.5 A LT 0.18 9.0 A LT 0.49 15.1 C LT 0.51 15.5 C LT 0.48 14.1 B of the build mitigation: Southbound TR 0.41 10.3 B TR 0.43 10.8 B TR 1.03 63.9 F TR 1.21 127.0 F+ T 0.59 14.8 B Class III bike lane,
TR 0.61 15.4 C daylighting, and two INT 10.0 A INT 10.3 B INT 50.6 F INT 99.0 F INT 14.9 B SB lanes.
Wythe Ave & S 8th St Early implementation Westbound LT 0.15 15.0 B LT 0.15 15.0 B LT 0.76 61.9 F LT 0.87 85.9 F+ LT 0.48 25.4 D of the build mitigation:
Class III bike lane, daylighting, and two SB lanes.
Wythe Ave & S 9th St Eastbound TR 0.18 14.7 B TR 0.18 14.7 B TR 0.19 25.6 D TR 0.22 29.2 D
Southbound LT 0.02 7.7 A LT 0.02 7.7 A LT 0.05 7.7 A LT 0.05 7.7 A Berry St & S 6th St
Westbound TR 0.17 11.8 B TR 0.27 13.1 B TR 0.61 20.5 C TR 0.66 22.5 C Northbound LT 0.01 7.6 A LT 0.01 7.6 A LT 0.01 7.6 A LT 0.01 7.6 A
Broadway & Roebling St-SBR Southbound R 0.15 10.3 B R 0.20 10.7 B R 0.70 20.1 C R 0.72 21.5 C
Notes: + Denotes a significant adverse traffic impact
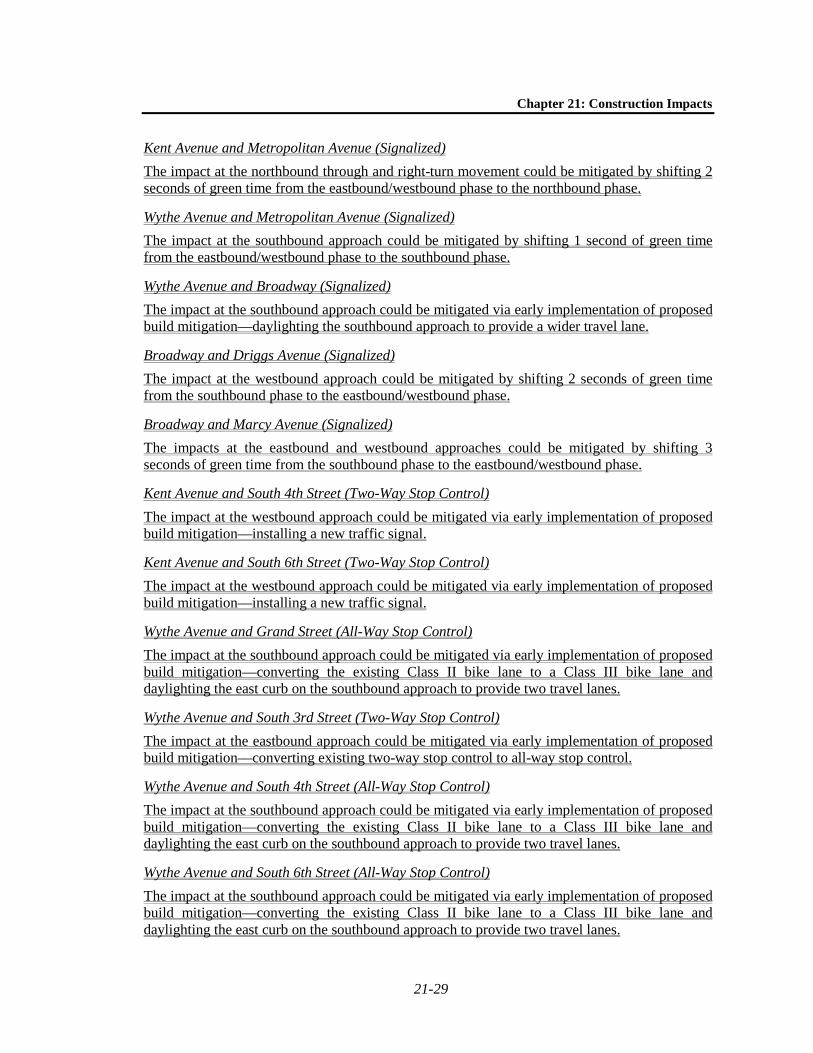
Chapter 21: Construction Impacts
21-29
Kent Avenue and Metropolitan Avenue (Signalized) The impact at the northbound through and right-turn movement could be mitigated by shifting 2 seconds of green time from the eastbound/westbound phase to the northbound phase.
Wythe Avenue and Metropolitan Avenue (Signalized) The impact at the southbound approach could be mitigated by shifting 1 second of green time from the eastbound/westbound phase to the southbound phase.
Wythe Avenue and Broadway (Signalized) The impact at the southbound approach could be mitigated via early implementation of proposed build mitigation––daylighting the southbound approach to provide a wider travel lane.
Broadway and Driggs Avenue (Signalized) The impact at the westbound approach could be mitigated by shifting 2 seconds of green time from the southbound phase to the eastbound/westbound phase.
Broadway and Marcy Avenue (Signalized) The impacts at the eastbound and westbound approaches could be mitigated by shifting 3 seconds of green time from the southbound phase to the eastbound/westbound phase.
Kent Avenue and South 4th Street (Two-Way Stop Control) The impact at the westbound approach could be mitigated via early implementation of proposed build mitigation––installing a new traffic signal.
Kent Avenue and South 6th Street (Two-Way Stop Control) The impact at the westbound approach could be mitigated via early implementation of proposed build mitigation––installing a new traffic signal.
Wythe Avenue and Grand Street (All-Way Stop Control) The impact at the southbound approach could be mitigated via early implementation of proposed build mitigation––converting the existing Class II bike lane to a Class III bike lane and daylighting the east curb on the southbound approach to provide two travel lanes.
Wythe Avenue and South 3rd Street (Two-Way Stop Control) The impact at the eastbound approach could be mitigated via early implementation of proposed build mitigation––converting existing two-way stop control to all-way stop control.
Wythe Avenue and South 4th Street (All-Way Stop Control) The impact at the southbound approach could be mitigated via early implementation of proposed build mitigation––converting the existing Class II bike lane to a Class III bike lane and daylighting the east curb on the southbound approach to provide two travel lanes.
Wythe Avenue and South 6th Street (All-Way Stop Control) The impact at the southbound approach could be mitigated via early implementation of proposed build mitigation––converting the existing Class II bike lane to a Class III bike lane and daylighting the east curb on the southbound approach to provide two travel lanes.
Domino Sugar Rezoning
21-30
Wythe Avenue and South 8th Street (Two-Way Stop Control) The impact at the westbound approach could be mitigated via early implementation of proposed build mitigation––converting the existing Class II bike lane to a Class III bike lane and daylighting the east curb on the southbound approach to provide two travel lanes.
CURB LANE CLOSURES AND STAGING
Because the majority of construction activities would be accommodated on-site, construction trucks would be staged primarily within the project site, or on newly completed streets adjacent to or south of active construction sites. DOT created bicycle lanes on both the east and west sides of Kent Avenue in November of 2008, replacing what had been curbside parking on both sides of the street. In the fall of 2009, Kent Avenue was reconfigured as a one-way northbound street with two traffic lanes, a two-way bicycle lane on the west side of the street, and a parking lane between the bicycle lane and the traffic lanes. However, bicycle lanes and sidewalks on Kent Avenue might be temporarily closed due to construction activities. Construction of the proposed project would require temporarily narrowing or relocating portions of these bicycle lanes. During the entire construction period, a lane of traffic would be maintained along Kent Avenue. In addition, sidewalk protection or temporary sidewalks would be provided to maintain pedestrian access.
Maintenance and protection of traffic plans would be developed for any curb lane and sidewalk closures. Approval of these plans and implementation of all temporary sidewalk and curb lane closures during construction would be coordinated with OCMC.
PARKING
The construction activities would generate a maximum daily parking demand of up to 307 spaces for the first quarter of 2016. The parking demand would be accommodated within the project site. However, as proposed buildings are constructed and occupied, temporary imbalances in terms of parking supply and demand may occur. In such a case, some construction workers may need to seek off-site parking in the study area.
TRANSIT AND PEDESTRIANS
Construction activities are not expected to result in significant adverse transit and pedestrian impacts.
TRANSIT
According to the U.S. Census RJTW data, approximately 25 percent of construction workers would travel to and from the project sites via public transit. Based on the peak 2016 projections discussed above, there would be approximately 122, 93, and 29 construction-related transit trips during the 6 to7 AM, 3 to 4 PM, and 5 to 6 PM hours, respectively. The transit trip demand during the morning and afternoon construction shoulder peak hours would range from 12 to 31 trips. Distributed among the J/M/Z and L subway lines and the B62 and Q59 bus routes near the project site, only nominal increases in transit demand would be experienced along each of those routes and at each of the transit access locations during hours within and outside of the typical commuter peak periods. Hence, no further evaluation of nearby transit services is required, and there would not be a potential for significant adverse transit impacts attributable to the projected construction worker transit trips. Any temporary relocation of bus stops along bus routes that

Chapter 21: Construction Impacts
21-31
operate adjacent to the project site would be coordinated with and approved by DOT and NYCT to ensure proper access is maintained.
PEDESTRIANS
As discussed above, with a 70 percent of auto usage assumed and 25 percent of public transit usage based on the U.S. Census, the remaining 5 percent of construction workers would travel to and from the project sites on foot. Based on the peak 2016 projections discussed above, there would be approximately 24, 19, and 6 construction-related walk trips during the 6 to 7 AM, 3 to 4 PM, and 5 to 6 PM hours, respectively. For the same reasons discussed above, with respect to transit operations, a detailed pedestrian analysis to address the projected demand from the travel of construction workers to and from the sites is also not warranted. Considering that these pedestrian trips would primarily occur outside of peak hours and be distributed among numerous sidewalks and crosswalks in the area, there would not be a potential for significant adverse pedestrian impacts attributable to the projected construction worker pedestrian trips. During construction, where temporary sidewalk closures are required, adequate protection or temporary sidewalks and appropriate signage would be provided in accordance with DOT requirements.
AIR QUALITY
Although they are temporary, construction projects can have a noticeable effect on surrounding communities. During construction, emissions from on-site construction equipment and on-road construction-related vehicles, and any congestion caused by construction traffic, have the potential to impact air quality. The analysis of potential impacts on air quality from the construction of the proposed project includes a quantitative analysis of both on-site and on-road sources of air emissions, and the overall combined impact of both sources where applicable.
In general, most construction engines are diesel-powered and produce relatively high levels of particulate matter (PM) and nitrogen oxides (NOX). Construction activities also emit fugitive dust. Although diesel engines emit much lower levels of carbon monoxide (CO) than gasoline engines, the stationary nature of construction emissions and the large quantity of engines could lead to elevated CO concentrations, and changes in traffic levels and patterns could increase mobile source-related emissions of CO as well. Therefore, the pollutants of concern for the construction period are NO2, CO, particles with an aerodynamic diameter of less than or equal to 10 micrometers (PM10), and particles with an aerodynamic diameter of less than or equal to 2.5 micrometers (PM2.5). Since ultra-low-sulfur diesel (ULSD) would be used for all engines in the construction of the proposed project, sulfur oxides (SOx) emitted from those construction activities would be negligible. For more details on air pollutants, see Chapter 19, “Air Quality and Greenhouse Gas Emissions.”
Construction activity in general has the potential to adversely affect air quality as a result of diesel emissions. The main component of diesel exhaust that has been identified as having an adverse effect on human health is fine PM. To ensure that the construction of the proposed project results in the lowest practicable diesel particulate matter (DPM) emissions and fugitive dust emissions, the applicant would implement an emissions reduction program for all construction activities, consisting of the following:
1. Diesel Equipment Reduction. The construction of the proposed project would minimize the use of diesel and gasoline engines, and use electric engines operating on grid power instead, as logistics allow. To that end, the applicant would contact Con Edison to seek temporary connection of grid power to the sites by the start of the superstructure construction for each

Domino Sugar Rezoning
21-32
project parcel, approximately six months from the start of the excavation task for each building. Construction contracts would specify the use of electric engines where practicable and ensure the distribution of power connections throughout the project site as needed. Equipment that would use grid power instead of diesel/gasoline engine power would include, but may not be limited to, cut-off saws, masonry bench saws, material hoists, table saws, welders, and water pumps. This would also eliminate some generators that would normally be needed for construction equipment.
2. Clean Fuel. ULSD would be used exclusively for all diesel engines throughout the project site. This would enable the use of tailpipe reduction technologies.
3. Best Available Tailpipe Reduction Technologies. Non-road diesel engines with a power rating of 50 horsepower (hp) or greater and controlled truck fleets (i.e., truck fleets under long-term contract with the applicant, such as concrete mixing and pumping trucks) would utilize the best available tailpipe technology for reducing DPM emissions. Diesel particle filters (DPFs) have been identified as the tailpipe technology currently proven to have the highest reduction capability. Construction contracts would specify that all diesel non-road engines rated at 50 hp or greater and all controlled-fleet trucks would utilize DPFs or other tailpipe reduction technology, either original equipment manufacturer (OEM) or retrofit technology with add-on controls, verified to reduce DPM emissions by at least 90 percent (when compared with the uncontrolled exhaust of an equivalent engine). Controls may include active DPFs,1
4. Utilization of Tier 2 or Newer Equipment. In addition to the tailpipe controls commitments, the construction program would mandate the use of Tier 2
if necessary.
2
1 There are two types of DPFs currently in use: passive and active. Most DPFs currently in use are the
“passive” type, which means that the heat from the exhaust is used to regenerate (burn off the PM) in order to eliminate the buildup of PM in the filter. Some engines do not maintain temperatures high enough for passive regeneration. In such cases, “active” DPFs can be used, i.e., DPFs that are heated either by an electrical connection from the engine, by plugging in during periods of inactivity, or by removal of the filter for external regeneration.
or later construction equipment for non-road diesel engines greater than 50 hp. The use of “newer” engines, especially Tier 2, is expected to reduce the likelihood of DPF plugging due to soot loading (i.e., clogging of DPF filters by accumulating particulate matter); the more recent the “Tier”—the higher the number—the cleaner the engine for all criteria pollutants, including PM. Additionally, while all engines undergo some deterioration over time, “newer” as well as better maintained engines emit less particulate matter (PM) than their older Tier or unregulated counterparts. Therefore, restricting site access to equipment with lower engine-out PM emission values would enhance this emissions reduction program and implementation of DPF systems as well as reduce maintenance frequency due to soot loading (i.e., less downtime for construction equipment to replace clogged DPF filters). In addition, to minimize hourly
2 The first federal regulations for new nonroad diesel engines were adopted in 1994, and signed by EPA into regulation in a 1998 Final Rulemaking. The 1998 regulation introduces Tier 1 emissions standards for all equipment 50 hp and greater and phases in the increasingly stringent Tier 2 and Tier 3 standards for equipment manufactured in 2000 through 2008. In 2004, The EPA introduced Tier 4 emissions standards with a phased-in period of 2008 to 2015. The Tier 1 through 3 4 standards regulate the EPA criteria pollutants, including particulate matter (PM), hydrocarbons (HC), oxides of nitrogen (NOx) and CO. Prior to 1998, emissions from nonroad diesel engines were unregulated. These engines are typically referred to as Tier 0.

Chapter 21: Construction Impacts
21-33
emissions of NO2 to the maximum extent practicable, non-road diesel-powered vehicles and construction equipment meeting or achieving the equivalent the EPA Tier 3 Non-road Diesel Engine Emission Standard would be used in construction, and construction equipment meeting Tier 4 would be used where conforming equipment is widely available in New York City, and the use of such equipment is practicable.
5. Source Location. In order to reduce the resulting concentration increments at sensitive receptors, large emissions sources and activities, such as concrete trucks and pumps, would be located within site limits and away from residential buildings, schools, playgrounds, and parks, as logistics allow, with special attention given to areas immediately adjacent to sensitive receptors. This measure would reduce potential concentration increments from on-site sources at such locations by increasing the distance between the emission sources and the sensitive locations, resulting in enhanced dispersion of pollutants.
6. Dust Control. Strict fugitive dust control plans would be required as part of contract specifications. For example, stabilized truck exit areas would be established for washing off the wheels of all trucks that exit the large construction sites. Truck routes within the sites would be either watered as needed or, in cases where such routes would remain in the same place for an extended duration, the routes would be stabilized, covered with gravel, or temporarily paved to avoid the resuspension of dust. All trucks hauling loose material would be equipped with tight-fitting tailgates and covered prior to leaving the sites. In addition to regular cleaning by the City, area roads adjacent to the sites would be cleaned as frequently as needed. Hoists, cranes, or chutes would be used for material drops during demolition; when chutes are required, the lower end of the chute will be inserted in the collection bin with a tight fitting cover surrounding the chute and covering the collection bin. An on-site vehicular speed limit of 5 mph would be imposed. Water sprays would be used for all excavation, demolition, and transfer of spoils to ensure that materials are dampened as necessary to avoid the suspension of dust into the air. Loose materials would be watered, stabilized with a biodegradable suppressing agent, or covered.
All of the above measures would be implemented by the applicant in detailed specifications to be included in the construction contracts. Additional measures would be taken to reduce pollutant emissions during construction in accordance with all applicable laws, regulations, and building codes, and included explicitly in the contract specifications. These include the restriction of on-site vehicle idle time to three minutes for all vehicles that are not using the engine to operate a loading, unloading, or processing device (e.g., concrete-mixing trucks).
AIR QUALITY ANALYSIS METHODOLOGIES
The following sections delineate additional details relevant only to the construction air quality analysis methodology. For a review of the applicable regulations, standards and criteria, and benchmarks for stationary and mobile source air quality analyses, refer to Chapter 19, “Air Quality.”
Stationary Sources A stationary source air quality analysis was conducted to evaluate potential construction impacts at the project site. Construction at the site would include a number of activities, such as excavating, materials handling, concrete pouring, and erecting of the proposed buildings. Air emission sources include exhausts on fuel burning equipment, fugitive dust from excavation/transfer activities, and road dust. The analysis was performed following U.S.
Domino Sugar Rezoning
21-34
Environmental Protection Agency (EPA) and CEQR Technical Manual suggested procedures and analytical tools, as further discussed below, to determine source emission rates. The estimated emission rates were then used as input to an air quality dispersion model to determine the potential impacts.
Construction Activity Assessment Overall, construction of the proposed project is expected to occur over a period of nine years. To determine which construction periods constitute the worst-case periods for the pollutants of concern, construction-related emissions were calculated throughout the duration of construction on an annual and peak-day basis for PM2.5. PM2.5 was selected as the worst-case pollutant because, as compared to other pollutants, PM2.5 has the highest ratio of emissions to impact criteria. Therefore, PM2.5 was used for determining the worst-case periods for analysis of all pollutants. Generally, emission patterns of other pollutants would follow PM2.5 emissions, since most pollutant emissions are proportional to diesel engines by horsepower. CO emissions may have a somewhat different pattern, but generally would also be highest during periods when the most activity would occur. Based on the resulting multi-year profiles of annual average and peak day average emissions of PM2.5, a worst-case year and a worst-case short-term period were identified for the modeling of annual and short-term (i.e., 24-hour and 8-hour) averaging periods. Dispersion of the relevant air pollutants from the site during the worst-case periods was quantified using computer models, and the highest resulting concentrations are presented in the sections discussing air quality impacts. Broader conclusions regarding potential concentrations during other construction periods, which were not modeled explicitly, are discussed as well, based on the multi-year emissions profiles and the worst-case period results.
Construction Data The construction analyses used an emission estimation method and a modeling approach that has been previously used for evaluating air quality impacts of construction projects in New York City. Because the level of construction activities would vary from month to month, the approach includes a determination of worst-case emission periods based on an estimated monthly construction work schedule, the number of each equipment type, and rated horsepower of each unit. In addition, the concentrating of emission sources and the distances between sources and receptors were considered in selecting a worst-case scenario because of the shifting locations of construction activities throughout the site and over time. As such, the worst-case short-term emissions (e.g., maximum daily emissions) were found to occur in May 2015, and the maximum annual (based on a 12-month rolling average) emissions were found to occur from April 2014 through March 2015. During the short-term peak, Site C, the Wharf, and the Refinery would be under construction. During the annual peak, Sites C and D, the Wharf, and the Refinery would be under construction. A typical operating schedule of 7:00 AM to 3:30 PM, with some construction tasks extending to 6:00 PM, was used for the analysis.
In addition to the short-term peak emissions period discussed above, two additional short-term periods were also examined during peak construction periods associated with Site A (June 2019) and Site E (May 2012). These periods included a detailed analysis of PM2.5. This was done in consideration of the close proximity of construction activities to nearby sensitive receptors. The analysis of Site A included an assessment for Grand Ferry Park (model input included an array of eight receptor points within the park) and a “project on project” assessment for occupied buildings and open space associated with the future with the proposed project condition. The analysis of Site E included nearby residential receptors.

Chapter 21: Construction Impacts
21-35
The specific construction information used to calculate emissions generated from the construction process includes, but is not limited to, the following:
• The number of units and fuel-type of construction equipment to be used; • Rated horsepower for each piece of equipment; • Hours of operation on-site; • Excavation and processing rates; • Average speed of dump trucks; and • Average distance traveled on-site by dump trucks.
Engine Exhaust Emissions. The sizes, types, and number of construction equipment were based on the construction activities schedule. Emission factors for NOX, PM10, PM2.5, and CO from the combustion of ULSD for on-site construction equipment were developed using the latest (EPA) NONROAD emission model (Version 2008a). The model is based on source inventory data accumulated for specific categories of off-road equipment. The emission factors for each type of equipment were calculated from the output files for the NONROAD model (i.e., calculated from regional emissions estimates). However, these emission factors were not applied to trucks. Emission rates from combustion of fuel for on-site dump trucks, concrete trucks, and other heavy trucks were developed using the EPA MOBILE6.2 Emission Model. New York City restrictions placed on idling times were employed for the dump trucks and other heavy trucks. For analysis purposes, it was assumed that the concrete trucks would operate continuously. Short-term and annual emission rates were adjusted from the peak hour emissions by applying usage factors for each equipment unit. Usage factors were determined using the construction equipment schedule.
The air quality analysis also took into account the application of available pollutant control technologies. DEP undertook an evaluation of diesel-fueled equipment utilized for construction projects, and has made a determination that all equipment greater than 50 hp would likely be able to implement DPFs. Estimated PM emission rates for non-road equipment were therefore reduced to account for this add-on control technology for the proposed project. The control efficiency assumed for the DPFs is 90 percent.
Fugitive Emission Sources. Road dust emissions from vehicle travel were calculated using equations from EPA’s AP-42, Section 13.2.2 for unpaved roads. PM10 emissions were estimated for dump trucks traveling in and out of the excavation area. Average vehicle weights (i.e., unloaded going in and loaded going out) were used in the analysis and a reasonably conservative round trip distance was estimated for on-site travel. In addition, the contractor would be required to implement a dust control plan. For example, stabilized truck exit areas would be established for washing off the wheels of all trucks that exit the large construction sites. Trucks entering and leaving the site with excavated or other materials would be covered. Truck routes within the sites would be either watered as needed or, in cases where such routes would remain in the same place for an extended duration, the routes would be stabilized, covered with gravel, or temporarily paved to avoid the resuspension of dust. In addition to regular cleaning by the City, area roads would be cleaned as frequently as needed. These control measures would provide at least a 50 percent reduction in PM10 emission. Also, since on-site travel speeds would be restricted to 5 miles per hour, on-site travel for trucks would not be a significant contributor to PM2.5 fugitive emissions.
Domino Sugar Rezoning
21-36
Particulate matter emissions could also be generated by material handling activities (i.e., loading/drop operations for excavated soil and rock). Estimates of PM10 and PM2.5 emissions from these activities were developed using EPA’s AP-42 Sections 13.2.4. Excavation rates used for the analysis were based on information provided by the construction manager.
Dispersion Modeling Potential impacts from on-site construction equipment were evaluated using the EPA/AMS AERMOD dispersion model (version 092902). The AERMOD model was designed as a replacement to the EPA Industrial Source Complex (ISC3) model and is applicable to rural and urban areas, flat and complex terrain, surface and elevated releases, and multiple sources (including point, area, and volume sources). AERMOD is a steady-state plume model that incorporates current concepts about flow and dispersion in complex terrain, including updated treatments of the boundary layer theory, understanding of turbulence and dispersion, and includes handling of terrain interactions. The AERMOD model calculates pollutant concentrations based on hourly meteorological data.
Source Simulation. During construction, various types of construction equipment would be used at different locations throughout the site. Some of the equipment is mobile and would operate throughout the site, while some would remain stationary on-site at distinct locations during short-term periods (i.e., daily and hourly). Stationary emission sources include (but are not limited to) air compressors, generators, cranes, pile rigs, and reinforcing bar benders. These sources were considered to be point sources and were placed at fixed locations in the modeling analysis. The input data for point sources included stack heights that were equivalent to the height of engine exhaust points or tailpipes and an exhaust temperature of 250° Celsius (a temperature within the normal operating range of most diesel engines). Based on estimated fuel consumption rates per 100 hp and potential pressure drops with diesel particulate filters on the exhaust, a stack velocity of 17.2 feet per second (or 5.24 meters per second) per 100 hp was used for each exhaust point, along with a diameter of six inches (or 0.1524 meters).
Equipment such as excavators, backhoes, and dump trucks would operate throughout the site. In the short-term periods, these sources were simulated as area sources for the purpose of the modeling analysis, and their emissions were distributed evenly across the construction site. In the modeled annual period all sources were simulated as area source emissions.
Receptor Locations. AERMOD was used to predict maximum pollutant concentrations at nearby locations of likely public exposure (“receptors”). Receptor “groups” included residential locations, the Grand Ferry Park, and sidewalks surrounding the construction sites. Residential receptors were placed at the nearest windows facing the construction site. These residential receptors were located at ground level and elevated portions of the building façade. Receptors at the Grand Ferry Park included an array of locations that were spaced 25 feet apart with a height of 1.8 meters. Sidewalk receptors were placed at the middle of the sidewalk on both sides of the street, where applicable, and spaced 25 feet apart with a height of 1.8 meters.
Meteorological Data. The meteorological data set consisted of the latest five years of data that are available: surface data collected at LaGuardia Airport (2003-2007) and concurrent upper air data collected at Brookhaven, New York.
Background Concentrations. Where needed to determine potential air quality impacts from the construction of the project, background ambient air quality data for criteria pollutants were added to the predicted off-site concentrations. The background data represent the latest available five years of data and were obtained from a nearby NYSDEC monitoring station that best

Chapter 21: Construction Impacts
21-37
represents the area surrounding the site. These background concentrations are provided below in Table 21-8. Short-term concentrations (i.e., 24- and 8-hour averages) represent the second highest concentration of the five-year data set and annual concentrations represent the maximum value of the five-year data set. For PM2.5, background concentrations are not considered, since impacts are determined on an incremental basis only.
Table 21-8 Background Pollutant Concentrations
Pollutant Monitoring
Station Averaging
Period Background
Concentration Ambient Standard
NO2 PS 59 Annual 71.5 µg/m3 100 µg/m3
CO PS 59 1-hr 2.6 ppm 35 ppm 8-hr 2.0 ppm 9 ppm
PM10 PS 59 24-hr 60 µg/m3 150 µg/m3 Source: NYSDEC Annual New York State Air Quality Reports.
Mobile Sources The prediction of vehicle-generated CO and PM emissions and their dispersion in an urban environment incorporates meteorological phenomena, traffic conditions, and physical configurations (e.g., street widths, sidewalk locations). Air pollutant dispersion models mathematically simulate how traffic, meteorology, and source-receptor geometry combine to affect pollutant concentrations. The mathematical expressions and formulations contained in the various models attempt to describe an extremely complex physical phenomenon as closely as possible. However, because all models contain simplifications and approximations of actual conditions and interactions and it is necessary to predict the reasonable worst-case condition, most of these dispersion models predict conservatively high concentrations of pollutants, particularly under adverse meteorological conditions.
The mobile source analyses for the project employ models approved by EPA that have been widely used for evaluating the air quality impacts of projects in New York City, other parts of New York State, and throughout the country. The modeling approach includes a series of conservative assumptions relating to meteorology, traffic, and background concentration levels resulting in a conservatively high estimate of anticipated pollutant concentrations that could ensue from mobile sources associated with the proposed project. The assumptions used in the PM analysis were based on the latest PM2.5 draft interim guidance developed by DEP.
The following sections provide an overview of the analytical tools used to determine mobile source impacts.
Dispersion Model for Microscale Analyses Maximum CO concentrations adjacent to streets near the project site, resulting from vehicle emissions, were predicted using the CAL3QHC model Version 2.0. The CAL3QHC model employs a Gaussian (normal distribution) dispersion assumption and includes an algorithm for estimating vehicular queue lengths at signalized intersections. CAL3QHC predicts emissions and dispersion of CO from idling and moving vehicles. The queuing algorithm includes site–specific traffic parameters, such as signal timing and delay calculations, saturation flow rate, vehicle arrival type, and signal actuation (i.e., pre-timed or actuated signal) characteristics to accurately predict the number of idling vehicles. The CAL3QHC model has been updated with an extended module, CAL3QHCR, which allows for the incorporation of hourly meteorological data into the modeling, instead of worst-case assumptions regarding meteorological parameters.

Domino Sugar Rezoning
21-38
This refined version of the model, CAL3QHCR, is employed if maximum predicted future CO concentrations are greater than the applicable ambient air quality standards or when de minimis thresholds are exceeded using the first level of CAL3QHC modeling.
To determine motor vehicle generated PM concentrations adjacent to streets near the proposed action area, the CAL3QHCR model was applied. This refined version of the model can utilize hourly traffic and meteorology data, and is therefore more appropriate for calculating 24-hour and annual average concentrations.
Meteorology. In general, the transport and concentration of pollutants from vehicular sources are influenced by three principal meteorological factors: wind direction, wind speed, and atmospheric stability. Wind direction influences the accumulation of pollutants at a particular location (receptor), and atmospheric stability accounts for the effects of vertical mixing in the atmosphere.
CO calculations were performed using the CAL3QHC model. In applying the CAL3QHC model, the wind angle was varied to determine the wind direction resulting in the maximum concentrations at each receptor.
Following EPA guidelines, CO computations were performed using a wind speed of 1 meter per second and the neutral stability class D. The 8-hour average CO concentrations were estimated by multiplying the predicted 1-hour average CO concentrations by a factor of 0.70 to account for persistence of meteorological conditions and fluctuations in traffic volumes. A surface roughness of 3.21 meters was chosen. At each receptor location, concentrations were calculated for all wind directions, and the highest predicted concentration was reported, regardless of frequency of occurrence. These assumptions ensured that worst-case meteorology was used to estimate impacts.
PM calculations were performed using the CAL3QHCR model. In applying the CAL3QHCR model, the meteorological data set consisted of the latest five years of data that are available: surface data collected at LaGuardia Airport (2003-2007) and upper air data collected at Brookhaven, New York (2003-2007).
Analysis Year. An air quality analysis was performed for the year 2016, the worst-case analysis year for traffic (i.e., project increments). The future analysis was performed for both the No Action and future with the proposed project conditions.
Vehicle Emissions Data Engine Emissions. Vehicular CO and PM engine emission factors were computed using MOBILE6.2. This emissions model is capable of calculating engine emission factors for various vehicle types, based on the fuel type (gasoline, diesel, or natural gas), meteorological conditions, vehicle speeds, vehicle age, roadway types, number of starts per day, engine soak time, and various other factors that influence emissions, such as inspection maintenance programs. Idle emission factors were used when vehicles were queuing, and free flow emission factors were based on vehicle travel speeds when traffic was moving. The inputs and use of MOBILE6.2 for this project were consistent with the most current guidance available from NYSDEC and DEP.
Vehicle classification data were based on field studies outlined in the traffic section (including project-generated traffic). Appropriate credits were used to accurately reflect the inspection and maintenance program. The inspection and maintenance programs require inspections of automobiles and light trucks to determine if pollutant emissions from the vehicles’ exhaust systems are below emission standards. Vehicles failing the emissions test must undergo

Chapter 21: Construction Impacts
21-39
maintenance and pass a repeat test to be registered in New York State. All construction-worker-generated vehicles were simulated as hot stabilized for arrivals and cold starts for departures. An ambient temperature of 50.0° Fahrenheit (F) was used for the analysis.
Traffic Data Traffic data for the air quality analysis were derived from existing traffic counts, projected future growth in traffic, and other information developed as part of the traffic analysis for the proposed project (see “Traffic and Parking,” above) for the peak traffic year of 2016. Traffic data for the No Action and future with the proposed project conditions were employed in the respective air quality modeling scenarios. Weekday AM (6 to 7 AM) and PM (3 to 4 PM) peak hour periods were used for microscale CO analysis. These time periods were selected because they produce the maximum anticipated project-generated traffic and therefore have the greatest potential for significant air quality impacts.
Background Concentrations Background concentrations for mobile sources are those pollutant concentrations not accounted for through the modeling analysis, which directly accounts for vehicle-generated emissions on the streets within 1,000 feet and line-of-sight of the receptor location. Background concentrations must be added to mobile source modeling results to obtain total pollutant concentrations at a study location.
The 8-hour average background CO concentration used in this analysis was 2.5 parts per million (ppm) for the 2016 predictions. This value is representative for the mobile source receptor locations in the future year. The 24-hour average background concentration for PM10 was 60 micrograms per cubic meter (µg/m3). For PM2.5, background concentrations are not considered, since impacts are determined on an incremental basis only.
Mobile Source Analysis Sites The intersection of Kent Avenue and South 4th Street was used in the analysis for the assessment of CO and PM impacts (see Table 21-9). This intersection was selected because it is where the largest levels of project-generated (incremental) traffic in the project study area are expected and, therefore, where the greatest air quality impacts and maximum changes in concentrations would be anticipated.
Table 21-9 Mobile Source Analysis Intersection Location
Analysis Site Location 1 Kent Avenue and South 4th Street
Receptor Locations. Receptors were placed along the approach and departure links at spaced intervals. Local model receptors were placed at sidewalk or roadside locations near the analyzed intersection with continuous public access. Receptors in the annual PM2.5 neighborhood scale models were placed at a distance of 15 meters from the nearest moving lane, based on the DEP procedure for neighborhood scale corridor PM2.5 modeling.
EXISTING CONDITIONS
A review of the existing monitored air quality conditions can be found in Chapter 19, “Air Quality”.

Domino Sugar Rezoning
21-40
THE FUTURE WITHOUT THE PROPOSED PROJECT
Stationary Construction Source Impacts In the No Action condition, air quality is anticipated to be similar to that described for existing conditions. Land uses are expected to remain generally the same in this neighborhood. Since air quality regulations mandated by the Clean Air Act are anticipated to maintain or improve air quality in the region, it can be expected that air quality conditions in the No Action condition would be no worse than those that presently exist.
Mobile Source Impacts CO
CO concentrations without the proposed project were determined for the 2016 analysis year using the methodology previously described. Table 21-10 shows the future maximum predicted 8-hour average CO concentration without the proposed project (i.e., 2016 No Action values) at the analysis intersection in the project study area. The values shown are the highest predicted concentrations for the receptor locations at the intersection. As indicated in Table 21-10, the predicted 8-hour concentrations of CO, including background, are below the corresponding ambient air quality standard.
Table 21-10 No Action (2016) Maximum Predicted 8-Hour
Carbon Monoxide Concentrations (parts per million)
Site Location Time Period
No Action 8-Hour Concentration
(ppm) 1 Kent Avenue and South 4th Street Weekday AM 2.2
Weekday PM 2.4 Notes: 8-hour CO standard is 9 ppm. An adjusted ambient background concentration of 2.0 ppm is included in the No Action values presented above.
PM Concentrations of PM10 and PM2.5 from mobile sources without the proposed project were also determined for the 2016 analysis year at the intersection of Kent Avenue and South 4th Street. Concentrations of PM10 included a 24-hour averaging period and PM2.5 included the 24-hour and annual averaging periods. Including a background concentration of 60 µg/m3, the maximum PM10 24-hour No Build concentration is predicted to be approximately 63.7 µg/m3, and is below the applicable NAAQS of 150 µg/m3. Note that PM2.5 concentrations for No Action condition are not presented, since impacts are assessed on an incremental basis.
PROBABLE IMPACTS OF THE PROPOSED PROJECT
This section provides a summary of the projected air quality impacts from the construction activities of the proposed project. The most likely effects on local air quality during construction activities would result from:
• Engine emissions generated by on-site construction equipment and trucks entering/leaving the site during construction;

Chapter 21: Construction Impacts
21-41
• Fugitive dust emissions generated by soil excavation and other construction activities; and • Mobile source emissions generated by project-related construction trucks and worker
vehicles traveling to and from the site on local roads. An analysis of the potential for air quality impacts from on-site construction sources was performed using the methodology described above under “Stationary Sources.” As discussed in the methodology, the peak periods (by stage of construction) from the PM2.5 emissions profile were used to determine what time periods would be used for the short-term and annual impacts in the modeling analysis. These periods corresponded to May 2015 for short-term analyses and April 2014 through March 2015 for the annual analyses. As stated previously, two additional short-term periods were also modeled for PM2.5 impacts.
An analysis of the potential for air quality impacts from project-induced traffic was also performed using the methodology described above under “Mobile Sources.” The peak period used in this modeling analysis was the 2016 construction year.
The results of both stationary and mobile source modeling analyses are summarized below. As indicated, the modeling analyses demonstrated that no significant adverse impacts from construction sources are expected during the peak emission periods. Since the predicted concentrations were modeled for periods that represent the highest site-wide air emissions, the increments and total predicted concentrations during other stages of construction and at other locations are also not expected to have any significant adverse impacts.
Stationary Source Impacts A dispersion modeling analysis was performed to estimate the maximum off-site pollutant concentrations associated with emissions produced by on-site construction activities at the project site. As stated in the Methodologies, emissions sources included diesel and gasoline powered engines, and fugitive dusts generated by certain on-site activities. Diesel engines were the main source for PM2.5 impacts and a high number of gasoline engines on-site (e.g. chain saws, generators, water pumps) contributed to the modeled concentrations of CO.
For the modeling analysis, a reasonable worst-case scenario was used to generate the site-wide emissions (see Methodologies). The modeling analysis was conducted using the AERMOD dispersion model and was performed in accordance with EPA and DEP guidance regarding the use of dispersion models for regulatory purposes. The predicted ambient concentrations of criteria pollutants have been used to demonstrate compliance with applicable air quality standards and DEP interim guidance values.
Table 21-11 presents the maximum predicted total concentration (including background) for several criteria pollutants due to the proposed construction activities. The maximum concentrations from on-site construction sources were predicted at receptors near the project site. As indicated in Table 21-11 the maximum predicted total concentrations of NO2, PM10 and CO would not result in any concentrations that exceed the NAAQS. This was true for all averaging periods, both short-term and annual, and for each pollutant modeled in the analysis using worst-case emissions. Therefore, no significant adverse air quality impacts are predicted from the on-site construction sources due to these pollutants.

Domino Sugar Rezoning
21-42
Table 21-11 Maximum Predicted Total Concentrations for Construction Activities
Pollutant Averaging
Period Background
Concentration Predicted Increment
Total Maximum Predicted
Concentration Ambient Standard
NO2 Annual 71.5 µg/m3 15 µg/m3 86.5 µg/m3 100 µg/m3 PM10 24-hour 60 µg/m3 11 µg/m3 71 µg/m3 150 µg/m3
CO 1-hour 2.6 ppm 20.0 ppm 22.6 ppm 35 ppm 8-hour 2.0 ppm 5.9 ppm 7.9 ppm 9 ppm
PM2.5 Impacts Introduction. An air quality analysis was also performed to predict the concentrations of PM2.5 from construction activities. Concentrations of PM2.5 were modeled for the 24-hour averaging period (a measure of daily exposure) and the annual averaging period (a measure of long-term exposure). The 24-hour concentrations were modeled for the peak analysis period (i.e., May 2015) and for two additional time periods due to concerns regarding sensitive receptors near Sites A and E. For the annual analysis, the 12-month period of April 2014 through March 2015 had the highest overall emissions and was used to determine impacts. Annual concentrations were modeled at both discrete locations and on a neighborhood scale. Because the analysis periods for both short-term and annual studies included the greatest potential for impacts, the analysis is considered to be conservative.
Short-term Analysis. The maximum predicted 24-hour average (i.e., short term) PM2.5 incremental concentration from the proposed construction activities was modeled for comparison with the DEP 24-hour average interim guidance criteria for a discrete receptor location. The 24-hour PM2.5 construction impact assessment considered the potential frequency and extent of the predicted off-site PM2.5 incremental concentration, especially at locations where 24-hour exposure could occur (a discussion of the DEP interim guidance criteria is presented in Chapter 19, “Air Quality”).
Peak Period Analysis. A modeling analysis was conducted for the worst-case short-term period in May 2015 when construction activities take place at Site C, the Refinery, and the Wharf simultaneously. The maximum predicted 24-hour average PM2.5 incremental concentration occurred at a near-side sidewalk receptor, as shown in Figure G-10 in Appendix G. This value was equal to 2.6 µg/m3 and is above the DEP interim guidance value of 2 µg/m3 but below the DEP interim guidance value of 5 µg/m3. At nearby residential receptor locations, the maximum predicted incremental concentration was 1.8 µg/m3. At the Grand Ferry Park, the maximum predicted PM2.5 incremental concentration was 1.8 µg/m3. As indicated, all residential receptors would be below the current 24-hour interim guidance criteria of both 2 and 5 µg/m3 for the maximum predicted value.
The maximum frequency of predicted concentrations above 2.0 µg/m3 on any single receptor would only be three occurrences in a single year (using five years of meteorological data). The maximum predicted concentrations are probably overstated because the model did not include the effects of the noise reduction wall along the site perimeter that would be between sensitive receptors and the source of the emissions. The location of the maximum 24-hour average increments would vary based on the location of the sources, which would move throughout the site over time. Therefore, continuous daily exposures would not be likely to occur at any one location.
Chapter 21: Construction Impacts
21-43
Site A Analysis. A modeling analysis was conducted for the time period (i.e., June 2019) when construction activities take place at Site A. The maximum predicted 24-hour average PM2.5 incremental concentration occurred at a near-side sidewalk receptor, as shown in Figure G-11 in Appendix G. This value was equal to 2.6 µg/m3 and is above the DEP interim guidance value of 2 µg/m3 but below the DEP interim guidance value of 5 µg/m3. At nearby residential receptor locations (including project build developments), the maximum predicted incremental concentration was 0.8 µg/m3. The maximum predicted incremental concentration at specific receptors placed within Grand Ferry Park was 1.8 µg/m3. As indicated, all receptors placed within Grand Ferry Park and nearby residential receptors would be below the current 24-hour interim guidance criteria of both 2 and 5 µg/m3 for the maximum predicted value.
The maximum frequency of predicted concentrations above 2.0 µg/m3 on any single receptor would only be three occurrences in a single year (using five years of meteorological data). The maximum predicted concentrations are probably overstated because the model did not include the effects of the noise reduction wall along the site perimeter that would be between sensitive receptors and the source of the emissions. The location of the maximum 24-hour average increments would vary based on the location of the sources, which would move throughout the site over time. Therefore, continuous daily exposures would not be likely to occur at any one location.
Site E Analysis. A modeling analysis was conducted for the time period (i.e., May 2012) when construction activities take place at Site E. The maximum predicted 24-hour average PM2.5 incremental concentration occurred at a near-side sidewalk receptor, as shown in the isopleths in Appendix G. This value was equal to 3.1 µg/m3 and is above the DEP interim guidance value of 2 µg/m3 but below the DEP interim guidance value of 5 µg/m3. At nearby residential receptors, the maximum predicted PM2.5 incremental concentration was 2.2 µg/m3. At the Grand Ferry Park, the maximum predicted PM2.5 incremental concentration was 0.1 µg/m3.
The maximum frequency of predicted concentrations above 2.0 µg/m3 on any single near-side sidewalk receptor would only be six occurrences in a single year (using five years of meteorological data). This includes a maximum of one occurrence above 3.0 µg/m3 and a maximum of two occurrences above 2.5 µg/m3. The maximum frequency of predicted impacts (between 2.0 and 2.2 µg/m3) on any single residential receptor would only be, at most, one occurrence for a single year (two of the five years in the meteorological data set had no occurrences above 2.0 µg/m3). The maximum predicted concentrations are probably overstated because the model did not include the effects of the noise reduction wall along the site perimeter that would be between sensitive receptors and the source of the emissions. The location of the maximum 24-hour average increments would vary based on the location of the sources, which would move throughout the site over time. Therefore, continuous daily exposures would not be likely to occur at any one location.
Other Periods. The concentrations of PM2.5 discussed above are the result of specific meteorological conditions, and the predicted maximum concentrations would only occur during those metrological conditions and not at other times. However, as these maximum incremental impacts were computed based on periods with the highest emissions, for other construction time periods with lesser emissions, the potential 24-hour incremental exposures would be less.
Annual Analysis Period. In addition to the 24-hour average short-term concentrations discussed above, an analysis was also performed to predict annually averaged PM2.5 concentrations. The analysis period was April 2014 to March 2015. These concentrations were modeled for

Domino Sugar Rezoning
21-44
comparison to the DEP annual average interim guidance values for discrete and neighborhood-scale receptors (see Chapter 19, “Air Quality”).
The maximum predicted annual average PM2.5 incremental concentration (for a discrete receptor location) occurred at a near-side sidewalk receptor and was equal to 0.15 µg/m3. At nearby residential receptor locations, the maximum predicted incremental concentration was 0.04 µg/m3. At the Grand Ferry Park, the maximum predicted PM2.5 incremental concentration was equal to 0.01 µg/m3. As indicated, the maximum predicted concentrations are less than the interim guidance threshold of 0.3 µg/m3. The maximum predicted annual PM2.5 incremental concentration from the proposed construction activities was also modeled for comparison with the DEP annual average neighborhood-scale interim guidance criterion of 0.1 μg/m3. The annual average neighborhood-scale concentration increment from the construction activities was predicted to be 0.01 μg/m3, which is less than the 0.1 μg/m3 criterion. Therefore, no significant adverse annual PM2.5 air quality impacts are predicted from the on-site construction sources.
PM2.5 Conclusions As stated in Chapter 19, “Air Quality,” actions under CEQR that would increase PM2.5 concentrations more than the DEP interim guidance criteria would be considered to have potential significant adverse impacts, depending upon the probability of occurrence, the projected duration of such impacts, the extent of the area and the potential number of people affected. While the dispersion model determined that the maximum predicted 24-hour incremental concentrations of PM2.5 (using a worst-case emissions scenario) exceed the applicable DEP interim guidance criteria at just a few receptor locations, it should be noted that the likelihood of exposure is very low. The occurrences of elevated 24-hour average concentrations for PM2.5 are very limited in duration. Also, the worst-case emission levels exist only during a limited time period. Therefore, after taking into account the temporary nature of construction and the limited timeframe of each site excavation, the limited frequency of 24-hour impacts, and the limited area-wide extent of the 24-hour impacts, it can be concluded that no significant adverse air quality impacts for PM2.5 are expected from the on-site construction sources.
Mobile Source Impacts CO
A mobile source air quality analysis was conducted for the project during construction activities at the site for the peak construction traffic year, 2016. Localized pollutant impacts from the vehicles queuing at the selected intersection were analyzed for CO and were determined for the 8-hour averaging period.
CO concentrations for the future with the proposed project condition were determined for the 2016 analysis year using the methodology previously described. Table 21-12 shows the future maximum predicted 8-hour average CO concentration with the proposed project at the analysis intersection in the project study area.
The values shown are the highest predicted concentrations for the time period analyzed. Also shown in the table is a Not-to-Exceed value based on the de minimis criteria used to determine the significance of the incremental increase in CO concentrations that would result from the proposed project. The de minimis criteria are derived using procedures outlined in the CEQR Technical Manual that set a minimum allowable change in 8-hour average CO concentrations due to a proposed project (i.e., the No Action concentration plus half the difference between No Action concentration and the 9.0 ppm standard).

Chapter 21: Construction Impacts
21-45
Table 21-12 Future with the Proposed Project (2016) Maximum
Predicted 8-Hour Carbon Monoxide Concentrations (parts per million)
Site Location Time Period Future with the Proposed Project
8-Hour Concentration (ppm) Not-To-Exceed
De minimis Criteria (ppm) 1 Kent Avenue and
South 4th Street Weekday AM 2.3 5.6 Weekday PM 2.5 5.7
Notes: 8-hour CO standard is 9 ppm. Adjusted ambient background concentration of 2.0 ppm is included in the future with the proposed project values presented above.
The results in Table 21-12 indicate that in the future with the proposed project, there would be no significant adverse mobile source air quality impacts (i.e., de minimis criteria were not exceeded). In addition, with or without the proposed project in 2016, maximum predicted CO concentrations in the study area of the proposed project would be less than the corresponding ambient air quality standards.
PM The maximum predicted concentration of PM10 for the 24-hour averaging period at the intersection of Kent Avenue and South 4th Street is approximately 63.9 µg/m3. This concentration is below the applicable standard of 150 µg/m3.
The maximum predicted incremental concentrations of PM2.5 were modeled for the 24-hour and annual averaging periods, also at the intersection of Kent Avenue and South 4th Street. The predicted incremental concentrations are 0.03 µg/m3 for the 24-hour averaging period, and 0.004 µg/m3 for the annual averaging period. Both of these values are below the applicable City interim guidance criteria for PM2.5.
COMBINED STATIONARY AND MOBILE SOURCE IMPACTS
A mobile source analysis of CO and PM impacts for the intersection of Kent Avenue and South 4th Street indicated that a maximum predicted concentration would occur at receptors placed along the sidewalks adjacent to this intersection. Total cumulative concentrations of CO from both mobile and stationary sources (conservatively combining two different peak analysis periods) is estimated to be 8.4 ppm, This value includes a maximum predicted concentration of 5.9 ppm from stationary source construction activities, a maximum predicted concentration of 0.5 ppm from mobile sources, and includes a background level of 2.0 ppm. This concentration of 8.4 ppm is below the NAAQS air quality standard of 9 ppm. Therefore, no significant adverse air quality impacts for CO would occur due to the combined impacts of mobile and construction sources.
Total cumulative PM10 concentrations from both mobile and stationary sources (conservatively combining two different peak analysis periods) is estimated to be 74.9 µg/m3, This value includes a maximum predicted concentration of 11.0 µg/m3 from stationary source construction activities, a maximum predicted concentration of 3.9 µg/m3 from mobile sources, and includes a background level of 60 µg/m3. This concentration of 74.9 µg/m3 is below the NAAQS air quality standard of 150 µg/m3.
For PM2.5, the mobile source concentrations were an order of magnitude or more lower than the stationary source concentrations, and would therefore have no significant effect when combined with the stationary source concentration contribution. Therefore, no significant adverse air quality impacts for either PM10 or PM2.5 would occur due to the combined impacts of mobile and stationary sources.
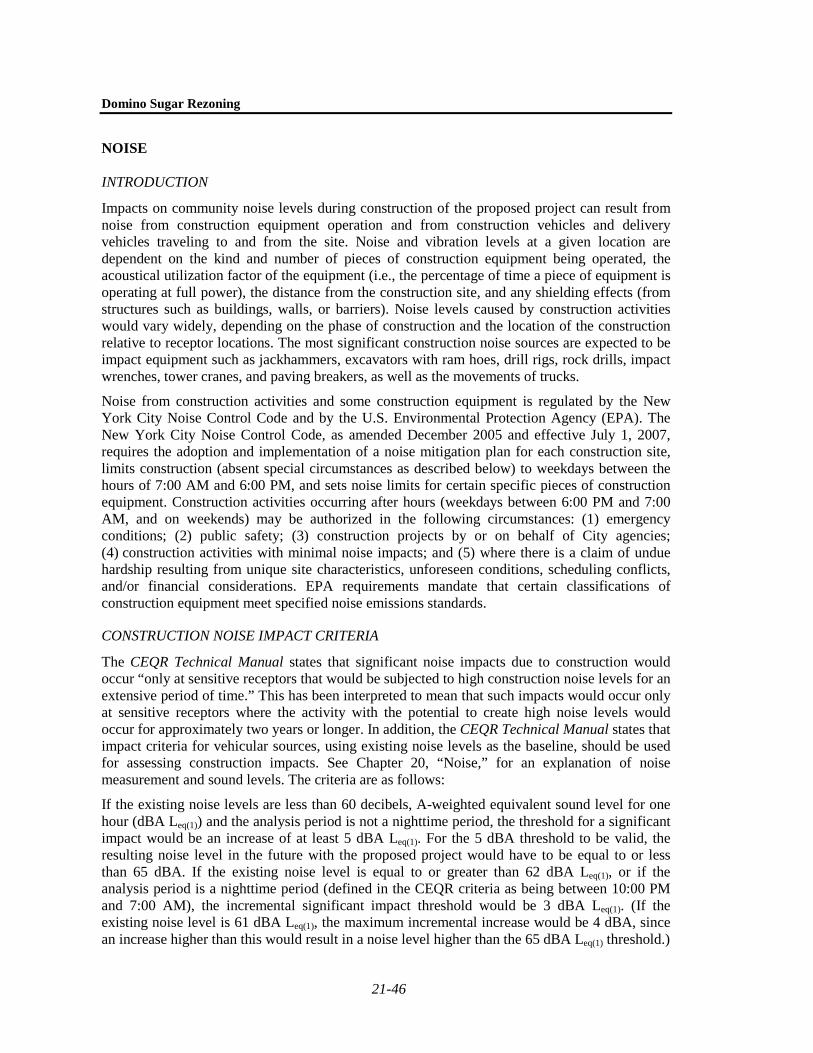
Domino Sugar Rezoning
21-46
NOISE
INTRODUCTION
Impacts on community noise levels during construction of the proposed project can result from noise from construction equipment operation and from construction vehicles and delivery vehicles traveling to and from the site. Noise and vibration levels at a given location are dependent on the kind and number of pieces of construction equipment being operated, the acoustical utilization factor of the equipment (i.e., the percentage of time a piece of equipment is operating at full power), the distance from the construction site, and any shielding effects (from structures such as buildings, walls, or barriers). Noise levels caused by construction activities would vary widely, depending on the phase of construction and the location of the construction relative to receptor locations. The most significant construction noise sources are expected to be impact equipment such as jackhammers, excavators with ram hoes, drill rigs, rock drills, impact wrenches, tower cranes, and paving breakers, as well as the movements of trucks.
Noise from construction activities and some construction equipment is regulated by the New York City Noise Control Code and by the U.S. Environmental Protection Agency (EPA). The New York City Noise Control Code, as amended December 2005 and effective July 1, 2007, requires the adoption and implementation of a noise mitigation plan for each construction site, limits construction (absent special circumstances as described below) to weekdays between the hours of 7:00 AM and 6:00 PM, and sets noise limits for certain specific pieces of construction equipment. Construction activities occurring after hours (weekdays between 6:00 PM and 7:00 AM, and on weekends) may be authorized in the following circumstances: (1) emergency conditions; (2) public safety; (3) construction projects by or on behalf of City agencies; (4) construction activities with minimal noise impacts; and (5) where there is a claim of undue hardship resulting from unique site characteristics, unforeseen conditions, scheduling conflicts, and/or financial considerations. EPA requirements mandate that certain classifications of construction equipment meet specified noise emissions standards.
CONSTRUCTION NOISE IMPACT CRITERIA
The CEQR Technical Manual states that significant noise impacts due to construction would occur “only at sensitive receptors that would be subjected to high construction noise levels for an extensive period of time.” This has been interpreted to mean that such impacts would occur only at sensitive receptors where the activity with the potential to create high noise levels would occur for approximately two years or longer. In addition, the CEQR Technical Manual states that impact criteria for vehicular sources, using existing noise levels as the baseline, should be used for assessing construction impacts. See Chapter 20, “Noise,” for an explanation of noise measurement and sound levels. The criteria are as follows:
If the existing noise levels are less than 60 decibels, A-weighted equivalent sound level for one hour (dBA Leq(1)) and the analysis period is not a nighttime period, the threshold for a significant impact would be an increase of at least 5 dBA Leq(1). For the 5 dBA threshold to be valid, the resulting noise level in the future with the proposed project would have to be equal to or less than 65 dBA. If the existing noise level is equal to or greater than 62 dBA Leq(1), or if the analysis period is a nighttime period (defined in the CEQR criteria as being between 10:00 PM and 7:00 AM), the incremental significant impact threshold would be 3 dBA Leq(1). (If the existing noise level is 61 dBA Leq(1), the maximum incremental increase would be 4 dBA, since an increase higher than this would result in a noise level higher than the 65 dBA Leq(1) threshold.)

Chapter 21: Construction Impacts
21-47
The impact criteria contained in the CEQR Technical Manual were used for assessing impacts from mobile and on-site construction activities.
NOISE ANALYSIS FUNDAMENTALS
Construction activities for the proposed project would be expected to result in increased noise levels as a result of: (1) the operation of construction equipment on-site; and (2) the movement of construction-related vehicles (i.e., worker trips, and material and equipment trips) on the surrounding roadways. The effect of each of these noise sources was evaluated. The results presented below show the effects of construction activities (i.e., noise due to both on-site construction equipment and construction-related vehicle operation) and the total cumulative impacts due to operational effects (caused by project-generated vehicular trips) and construction effects (as construction proceeds on uncompleted components of the project).
Noise from the operation of construction equipment on-site at a specific receptor location near a construction site is calculated by computing the sum of the noise produced by all pieces of equipment operating at the construction site. For each piece of equipment, the noise level at a receptor site is a function of:
• The noise emission level of the equipment; • A usage factor, which accounts for the percentage of time the equipment is operating at full power; • The distance between the piece of equipment and the receptor; • Topography and ground effects; and • Shielding.
Similarly, noise levels due to construction-related traffic are a function of:
• The noise emission levels of the type of vehicle (e.g., auto, light-duty truck, heavy-duty truck, bus, etc.);
• Vehicular speed; • The distance between the roadway and the receptor; • Topography and ground effects; and • Shielding.
CONSTRUCTION NOISE MODELING
Noise effects from construction activities were evaluated using the Cadna A model, a computerized model developed by DataKustik for noise prediction and assessment. The model can be used for the analysis of a wide variety of noise sources, including stationary sources (e.g., construction equipment, industrial equipment, power generation equipment), transportation sources (e.g., roads, highways, railroad lines, busways, airports), and other specialized sources (e.g., sporting facilities). The model takes into account the reference sound pressure levels of the noise sources at 50 feet, attenuation with distance, ground contours, reflections from barriers and structures, attenuation due to shielding, etc. The Cadna A model is based on the acoustic propagation standards promulgated in International Standard ISO 9613-2. This standard is currently under review for adoption by the American National Standards Institute (ANSI) as an American Standard. The Cadna A model is a state-of-the-art tool for noise analysis and is approved for construction noise level prediction by the CEQR Technical Manual.

Domino Sugar Rezoning
21-48
Geographic input data used with the Cadna A model included CAD drawings that defined site work areas, adjacent building footprints and heights, locations of streets, and locations of sensitive receptors. For each analysis period, the geographic location and operational characteristics—including equipment usage rates (percentage of time equipment with full-horse power is used) for each piece of construction equipment operating at the project site, as well as noise control measures—were input to the model. In addition, reflections and shielding by barriers erected on the construction site, and shielding from both adjacent buildings and project buildings as they are constructed, were accounted for in the model. In addition, construction-related vehicles were assigned to the adjacent roadways. The model produced A-weighted Leq(1) noise levels at each receptor location for each analysis period, as well as the contribution from each noise source.
DETERMINATION OF EXISTING AND NON-CONSTRUCTION NOISE LEVELS
Noise generated by construction activities is added to noise generated by traffic on adjacent roadways in order to determine the total noise levels at each receptor location. Existing and non-construction (i.e., operational) noise levels were calculated using the methodology discussed in Chapter 20. As discussed in that chapter, proportional modeling and the Traffic Noise Model (TNM) were used to calculate noise from traffic on adjacent and nearby streets and roadways.
ANALYSIS PERIODS
A screening analysis was performed to determine the quarter during each year of the construction period (2012-2020) when the maximum potential for significant noise impacts would occur. A construction schedule was prepared by Gotham Construction, the construction management firm for the project. This schedule showed the number of workers, types and number of pieces of equipment, and number of construction vehicles anticipated to be operating during each month of the construction period. This analysis conservatively assumed that the worst-case quarter would represent the entire years, and each of those years was modeled. To be conservative, the noise analysis assumed that both peak on-site construction activities and peak construction-related traffic conditions occurred simultaneously.
NOISE REDUCTION MEASURES
The applicant has committed to taking a proactive approach during construction, which employs a wide variety of measures that exceed standard construction practices, but the implementation of which is deemed logistically feasible and practicable, to minimize construction noise and reduce potential noise impacts. These measures will be described in the noise mitigation plan required as part of the New York City Noise Control Code. These measures include a variety of source and path controls.
In terms of source controls (i.e., reducing noise levels at the source or during the most sensitive time periods), the following measures for construction, which go beyond typical construction techniques, would be implemented:
• Equipment that meets the sound level standards specified in Subchapter 5 of the New York City Noise Control Code would be utilized from the start of construction activities, along with a wide range of equipment, including construction trucks, which produce lower noise levels than typical construction equipment. Table 21-13 shows the noise levels for typical construction equipment and the mandated noise levels for the equipment that would be used for construction of the proposed project.

Chapter 21: Construction Impacts
21-49
• Where feasible and practicable, construction procedures that reduce noise levels and equipment (such as concrete trucks, delivery trucks, and trailers) that are quieter than that required by the New York City Noise Control Code would be used. Column B of Table 21-13 shows the level not to be exceeded for various pieces of construction equipment used for the proposed project as based on manufacturer’s specifications adjusted to a reference distance of 50 feet.
• As early in the construction period as logistics will allow, diesel- or gas-powered equipment would be replaced with electrical-powered equipment such as welders, water pumps, bench saws, and table saws (i.e., early electrification).
• Where practicable and feasible, construction sites would be configured to minimize back-up alarm noise. In addition, all trucks would not be allowed to idle more than three minutes at the construction site based upon New York City Local Law.
• Limit equipment on-site (only necessary equipment on-site). • Contractors and subcontractors would be required to properly maintain their equipment and
have quality mufflers installed. • In terms of path controls (e.g., placement of equipment, implementation of barriers or enclosures
between equipment and sensitive receptors), the following measures for construction, which go beyond typical construction techniques, will be implemented to the extent feasible: - Where logistics allow, noisy equipment, such as cranes, concrete pumps, concrete trucks,
and delivery trucks, would be located away from and shielded from sensitive receptor locations. For example, during some of the early phases of work, delivery and dump trucks, as well as many construction equipment operations would be located and take place below grade to take advantage of shielding benefits. Once building foundations are completed, delivery trucks would operate behind noise barriers, where possible;
- Noise barriers would be utilized to provide shielding (e.g., the construction sites would have a minimum 16-foot barrier and, where logistics allow, truck deliveries would take place behind these barriers once building foundations are completed); and
- Path noise control measures (i.e., portable noise barriers, panels, enclosures, and acoustical tents, where feasible) would be used for certain dominant noise equipment, i.e., asphalt pavers, drill rigs, excavators with ram hoe, hoists, impact wrenches, jackhammers, power trowels, powder actuated devices, rivet busters, rock drills, concrete saws, and sledge hammers. These barriers were conservatively assumed to offer only a 10 dBA reduction in noise levels for each piece of equipment to which they are applied, as shown in column C of Table 21-13. The details to construct portable noise barriers, enclosures, tents, etc. are based upon the instructions of DEP Citywide Construction Noise Mitigation.
RECEPTOR SITES
151 receptor locations close to the project site were selected as discrete noise receptor sites for the construction noise analysis. These receptors are either located directly adjacent to the project site or streets where construction trucks would be passing by. Each receptor site is the location of a residence or other noise-sensitive use. At high-rise buildings, noise receptors were selected at multiple elevations. At open space locations, receptors were selected at street level. Figure 21-3 shows the locations of the 151 noise receptor sites, and Table 21-14 lists the noise receptor sites and the associated land use at the receptor sites. The receptor sites selected for detailed analysis are representative of other noise receptors in the immediate project area, and are the locations where maximum project impacts due to construction noise would be expected.
WILLIAMSBURG BRIDGE
KENT A
VE.
S. 3RD ST.
S. 5TH ST.
S. 2ND ST.
WH
YTE
AVE.
S. 4TH ST.
N. 1ST ST.
S. 6TH ST.
S. 1ST ST.
BERR
Y ST
.
RIVER
ST.
METROPOLITAN AVE.
DU
NH
AM P
L.
GRAND ST.
EA
ST
R
IV
ER
5.24
.10
Construction Noise Receptor LocationsFigure 21-3
SCALE
0 400 FEET
N
1
7
8
2
3
4
9
5
6
12
A
B
M
E
NO
F
G
JH
K
I
L
P1
C1
C2D1
D1
QU
RS
V
W
X
Y
Z
T1
T2
T3
P2
AA1
AA2BB1BB2
CC1CC2
DD1DD2
BB3
CC3 AA3
DD3
D O M I N OS U G A R
Project Site Boundary
Noise Receptor Location1
NOTE: This figure is new for the FEIS

Domino Sugar Rezoning
21-50
Table 21-13 Typical Construction Equipment Noise Emission Levels (dBA)
Equipment List [A] DEP & FTA Typical Noise Level at 50 feet1
[B] Project-Committed Noise Level at 50 feet2
[C] Noise Level with Path Controls at 50 feet3
Asphalt Paver 85 85 75 Asphalt Roller 85 74 Backhoe/Loader 80 77 Compressors 80 67 Concrete Pump 82 79 Concrete Trucks 85 79 Cranes 85 77 Cranes (Tower Cranes) 85 85 75 Delivery Trucks 84 79 Drill Rigs 84 84 74 Dump Trucks 84 79 Excavator 85 77 Excavator with Ram Hoe 90 90 80 Fuel Truck 84 79 Generators 82 68 Hoist 85 80 70 Impact Wrenches 85 85 75 Jackhammer 85 82 72 Mortar Mixer 80 63 Power Trowel 85 85 75 Powder Actuated Device 85 85 75 Pump (Spray On Fire Proof) 82 76 Pump (Water) 77 76 Rebar Bender 80 80 Rivet Buster 85 85 75 Rock Drill 85 85 75 Saw (Chain Saw) 85 75 Saw (Concrete Saw) 90 85 75 Saw (Masonry Bench) 85 76 Saw (Circular & Cut off) 76 76 Saw (Table Saw) 76 76 Sledge Hammers 85 85 75 Street Cleaner 80 80 Tractor Trailer 84 79 Vibratory Plate Compactor 80 80 Welding Machines 73 73 Notes: 1 Sources: Citywide Construction Noise Mitigation, Chapter 28, Department of Environmental Protection of New York City,
2007. Transit Noise and Vibration Impact Assessment, FTA, May 2006. 2 Mandated noise levels are achieved by using quieter equipment, better engine mufflers, and refinements in fan design
and improved hydraulic systems. 3 Path controls include portable noise barriers, enclosures, acoustical panels, and curtains, whichever feasible and
practical.
Table 21-14 Construction Noise Receptor Locations
Receptor Location Associated Land Use 1 Grand Street between Kent and Wythe Avenues Residential 2 South 1st Street between Kent and Wythe Avenues Residential 3 South 2nd Street between Kent and Wythe Avenues Residential 4 South 3rd Street between Kent and Wythe Avenues Residential 5 South 4th Street between Kent and Wythe Avenues Residential 6 Kent Avenue between South 3rd and South 4th Streets Residential 7 Northeast Corner of Grand Street and Kent Avenue Residential 8 Southwest Corner of Wythe Avenue and South 1st Street Residential 9 Southwest corner of South 3rd Street and Wythe Avenue Residential

Chapter 21: Construction Impacts
21-51
Table 21-14 (cont’d) Construction Noise Receptor Locations
Receptor Location Associated Land Use 12 Grand Ferry Park Park A Northeast Corner of Grand Street and Kent Avenue Residential B Southeast Corner of Grand Street and Kent Avenue Residential
C1, C2 Southwest Corner of Wythe Avenue and South 1st Street Residential D1, D2 Southeast Corner of Wythe Avenue and South 1st Street Residential
E South 1st Street between Wythe Avenue and Berry Street Residential F Northwest Corner of South 2nd Street and Wythe Avenue Residential G Southwest Corner of South 2nd Street and Wythe Avenue Residential
H, J, K South 2nd Street between Wythe Avenue and Berry Street Residential I Southeast corner of South 2nd Street and Wythe Avenue Residential L Southwest corner of South 3rd street and Wythe Avenue Residential M Northeast corner of South 3rd Street and Wythe Avenue Residential
N, O South 3rd Street between Wythe Avenue and Berry Street Residential P1, P2 Southeast corner of South 4th Street and Kent Avenue Residential
Q Wythe Avenue between South 4th and South 5th Streets Residential R Southeast corner of South 4th Street and Wythe Avenue Residential S South 4th Street between Wythe Avenue and Berry Street Residential
T1, T2, T3 Berry Street between South 4th and South 5th Streets Residential U South 5th Street between Kent Avenue and Wythe Avenue Residential V Grand Ferry Park Park W Rear of Buildings on Wythe Avenue between South 3rd and South 4th Streets Residential X South 3rd Street between Kent and Wythe Avenues Residential Y South 2nd Street between Kent and Wythe Avenues Residential Z Rear of building on South 2nd Street between Kent and Wythe Avenues Residential
AA Project Site E Residential BB Project Site D Residential CC Project Site C Residential DD The Refinery Residential
CONSTRUCTION NOISE ANALYSIS RESULTS
Using the methodology described above, and considering the noise abatement measures for source and path controls specified above, noise analyses were performed to determine maximum one-hour equivalent (Leq(1)) noise levels that would be expected to occur during each year of construction. Table 21-15 shows the following for the each year of the construction period:
• Existing noise levels; • Maximum predicted total noise levels (i.e., cumulative noise levels), which are the sum of
noise due to construction activities1
• Maximum predicted increases in noise levels based upon comparing the total noise levels with existing noise levels.
and noise due to traffic on the adjacent street as calculated by the methodology described in Chapter 20, “Noise;” and
1 The maximum predicted noise level due to construction activities alone includes the noise generated by
on-site construction activities, assuming maximum construction activity during the analysis time period, and noise generated by construction vehicles traveling to and from the project site during the hour which generated the maximum number of construction vehicles.

Domino Sugar Rezoning
21-52
Table 21-15 Construction Noise Analysis Results Values in dBA
Noise Receptor
Receptor Height
(in stories) Existing
Leq(1)
2012 2013 2014 2015 2016 2017 2018 2019 2020 Total Leq(1) Change
Total Leq(1) Change
Total Leq(1) Change
Total Leq(1) Change
Total Leq(1) Change
Total Leq(1) Change
Total Leq(1) Change
Total Leq(1) Change
Total Leq(1) Change
1 at-grade 65.2 65.3 0.1 65.4 0.2 65.7 0.5 66.7 1.5 65.7 0.5 66.0 0.8 67.0 1.8 67.5 2.3 66.5 1.3 2 at-grade 69.8 69.9 0.1 70.0 0.2 70.2 0.4 70.6 0.8 70.4 0.6 70.7 0.9 72.6 2.8 72.8 3.0 71.1 1.3 3 at-grade 62.7 63.2 0.5 63.4 0.7 69.0 6.3 68.9 6.2 67.9 5.2 66.5 3.8 67.6 4.9 66.3 3.6 66.1 3.4 4 at-grade 64.1 66.9 2.8 65.6 1.5 67.3 3.2 68.3 4.2 69.6 5.5 65.7 1.6 66.1 2.0 66.2 2.1 66.4 2.3 5 at-grade 64.1 67.8 3.7 69.4 5.3 66.3 2.2 65.9 1.8 65.8 1.7 65.1 1.0 65.3 1.2 65.5 1.4 65.6 1.5 6 at-grade 72.1 72.5 0.4 72.7 0.6 73.6 1.5 74.5 2.4 76.6 4.5 73.4 1.3 73.6 1.5 73.8 1.7 74.0 1.9 12 at-grade 57.3 57.7 0.4 58.0 0.7 61.6 4.3 65.8 8.5 60.3 3.0 60.3 3.0 64.8 7.5 66.5 9.2 59.9 2.6 7 at-grade 68.1 68.5 0.4 68.7 0.6 69.3 1.2 69.5 1.4 69.7 1.6 69.6 1.5 70.6 2.5 70.9 2.8 70.0 1.9 8 at-grade 69.8 70.0 0.2 70.2 0.4 70.4 0.6 70.6 0.8 70.8 1.0 71.0 1.2 71.2 1.4 71.4 1.6 71.6 1.8 9 at-grade 66.5 66.8 0.3 67.0 0.5 68.7 2.2 68.5 2.0 68.2 1.7 67.8 1.3 68.2 1.7 68.2 1.7 68.3 1.8 A at-grade 68.1 68.5 0.4 68.7 0.6 69.3 1.2 69.5 1.4 69.7 1.6 69.6 1.5 70.6 2.5 70.9 2.8 70.0 1.9 B at-grade 68.1 68.3 0.2 68.5 0.4 69.4 1.3 69.3 1.2 69.4 1.3 69.9 1.8 70.4 2.3 70.6 2.5 70.0 1.9 B 3 68.1 68.3 0.2 68.5 0.4 69.4 1.3 70.7 2.6 69.3 1.2 69.4 1.3 72.6 4.5 73.4 5.3 70.0 1.9
C1 at-grade 69.8 70.0 0.2 70.1 0.3 70.9 1.1 71.0 1.2 70.7 0.9 70.5 0.7 70.9 1.1 70.9 1.1 71.2 1.4 C1 3 69.8 70.0 0.2 70.1 0.3 70.8 1.0 71.1 1.3 70.6 0.8 70.7 0.9 71.0 1.2 71.1 1.3 71.4 1.6 C1 5 69.8 70.1 0.3 70.2 0.4 70.3 0.5 71.0 1.2 70.5 0.7 70.7 0.9 71.5 1.7 71.6 1.8 71.9 2.1 C1 10 69.8 70.1 0.3 70.3 0.5 71.0 1.2 71.5 1.7 71.2 1.4 71.6 1.8 72.3 2.5 72.3 2.5 72.4 2.6 C1 Top 69.8 70.1 0.3 70.3 0.5 71.1 1.3 71.8 2.0 71.5 1.7 71.7 1.9 72.4 2.6 72.8 3.0 72.5 2.7 C2 at-grade 69.8 70.0 0.2 70.2 0.4 70.4 0.6 70.6 0.8 70.8 1.0 71.0 1.2 71.2 1.4 71.4 1.6 71.6 1.8 C2 3 69.8 70.0 0.2 70.2 0.4 70.4 0.6 70.6 0.8 70.8 1.0 71.0 1.2 71.2 1.4 71.4 1.6 71.6 1.8 C2 5 69.8 70.0 0.2 70.2 0.4 70.4 0.6 70.6 0.8 70.8 1.0 71.0 1.2 71.2 1.4 71.4 1.6 71.6 1.8 C2 10 69.8 70.1 0.3 70.3 0.5 70.4 0.6 70.6 0.8 70.8 1.0 71.0 1.2 71.2 1.4 71.4 1.6 71.6 1.8 C2 Top 69.8 70.0 0.2 70.2 0.4 70.4 0.6 70.6 0.8 70.8 1.0 71.0 1.2 71.2 1.4 71.4 1.6 71.6 1.8 D1 at-grade 69.8 70.0 0.2 70.3 0.5 70.4 0.6 70.7 0.9 70.8 1.0 71.0 1.2 71.3 1.5 71.5 1.7 71.6 1.8 D1 3 69.8 70.0 0.2 70.4 0.6 70.4 0.6 70.6 0.8 70.8 1.0 71.0 1.2 71.2 1.4 71.4 1.6 71.6 1.8 D2 at-grade 69.8 70.0 0.2 70.2 0.4 70.4 0.6 70.8 1.0 70.8 1.0 71.2 1.4 71.6 1.8 71.7 1.9 72.1 2.3 D2 3 69.8 70.0 0.2 70.2 0.4 70.4 0.6 70.8 1.0 70.8 1.0 71.1 1.3 71.5 1.7 71.7 1.9 71.9 2.1 E at-grade 69.8 69.9 0.1 70.0 0.2 70.2 0.4 70.4 0.6 70.3 0.5 70.6 0.8 70.8 1.0 70.8 1.0 70.7 0.9 E 3 69.8 69.9 0.1 70.0 0.2 70.1 0.3 70.4 0.6 70.3 0.5 70.5 0.7 70.8 1.0 70.8 1.0 70.7 0.9 E Top 69.8 69.9 0.1 70.0 0.2 70.1 0.3 70.3 0.5 70.3 0.5 70.5 0.7 70.7 0.9 70.8 1.0 71.0 1.2 F at-grade 69.8 70.1 0.3 70.4 0.6 70.6 0.8 70.8 1.0 71.2 1.4 71.1 1.3 71.6 1.8 71.5 1.7 71.6 1.8 F 3 69.8 70.2 0.4 70.4 0.6 70.7 0.9 70.9 1.1 71.2 1.4 71.1 1.3 71.5 1.7 71.5 1.7 71.6 1.8 G at-grade 69.8 70.0 0.2 70.2 0.4 71.2 1.4 71.2 1.4 71.1 1.3 71.1 1.3 71.4 1.6 71.4 1.6 71.6 1.8 G 3 69.8 70.0 0.2 70.2 0.4 70.9 1.1 71.1 1.3 71.1 1.3 71.1 1.3 71.5 1.7 71.7 1.9 71.6 1.8 H at-grade 62.7 63.0 0.3 63.5 0.8 63.9 1.2 64.5 1.8 64.5 1.8 64.7 2.0 65.7 3.0 65.6 2.9 65.4 2.7 H 3 62.7 63.4 0.7 63.6 0.9 64.0 1.3 64.6 1.9 64.7 2.0 64.8 2.1 65.6 2.9 65.4 2.7 65.4 2.7 I at-grade 69.8 70.0 0.2 70.3 0.5 70.6 0.8 71.1 1.3 71.1 1.3 71.1 1.3 71.4 1.6 71.5 1.7 71.6 1.8 I 3 69.8 70.0 0.2 70.3 0.5 70.6 0.8 70.8 1.0 71.2 1.4 71.0 1.2 71.4 1.6 71.5 1.7 71.6 1.8 J at-grade 62.7 63.1 0.4 63.5 0.8 65.1 2.4 65.1 2.4 64.8 2.1 64.5 1.8 65.4 2.7 65.2 2.5 65.4 2.7 J 3 62.7 63.0 0.3 63.3 0.6 65.0 2.3 65.1 2.4 64.9 2.2 64.7 2.0 65.4 2.7 65.2 2.5 65.4 2.7 K at-grade 62.7 63.1 0.4 63.3 0.6 64.4 1.7 64.7 2.0 64.5 1.8 64.5 1.8 65.2 2.5 65.3 2.6 65.4 2.7

Chapter 21: Construction Impacts
21-53
Table 21-15 (cont’d) Construction Noise Analysis Results Values in dBA
Noise Receptor
Receptor Height
(in stories) Existing
Leq(1)
2012 2013 2014 2015 2016 2017 2018 2019 2020 Total Leq(1) Change
Total Leq(1) Change
Total Leq(1) Change
Total Leq(1) Change
Total Leq(1) Change
Total Leq(1) Change
Total Leq(1) Change
Total Leq(1) Change
Total Leq(1) Change
K 3 62.7 63.1 0.4 63.4 0.7 64.4 1.7 64.8 2.1 64.7 2.0 64.7 2.0 65.3 2.6 65.5 2.8 65.4 2.7 L at-grade 66.5 66.8 0.3 67.0 0.5 67.6 1.1 68.0 1.5 68.0 1.5 67.8 1.3 68.0 1.5 68.2 1.7 68.3 1.8 L 3 66.5 66.8 0.3 67.1 0.6 67.6 1.1 68.2 1.7 68.1 1.6 67.7 1.2 68.1 1.6 68.2 1.7 68.3 1.8 M at-grade 66.5 66.8 0.3 67.2 0.7 68.8 2.3 69.0 2.5 68.6 2.1 67.9 1.4 68.5 2.0 68.5 2.0 68.5 2.0 M 3 66.5 67.6 1.1 67.4 0.9 69.0 2.5 69.3 2.8 69.0 2.5 68.0 1.5 68.4 1.9 68.4 1.9 68.4 1.9 N at-grade 64.1 64.7 0.6 64.9 0.8 65.6 1.5 66.5 2.4 66.3 2.2 65.7 1.6 66.0 1.9 66.2 2.1 66.4 2.3 N 3 64.1 64.6 0.5 64.8 0.7 65.6 1.5 66.4 2.3 66.3 2.2 65.8 1.7 66.3 2.2 66.4 2.3 66.5 2.4 O at-grade 64.1 64.6 0.5 65.2 1.1 65.4 1.3 65.8 1.7 65.9 1.8 65.6 1.5 65.9 1.8 66.1 2.0 66.3 2.2 O 3 64.1 64.7 0.6 65.3 1.2 65.6 1.5 65.8 1.7 66.0 1.9 65.6 1.5 65.9 1.8 66.1 2.0 66.3 2.2 P1 at-grade 72.1 72.6 0.5 73.2 1.1 73.0 0.9 73.3 1.2 73.7 1.6 73.3 1.2 73.5 1.4 73.7 1.6 73.8 1.7 P1 3 72.1 73.6 1.5 76.3 4.2 73.5 1.4 74.3 2.2 74.5 2.4 73.3 1.2 73.5 1.4 73.7 1.6 73.8 1.7 P2 at-grade 64.1 66.3 2.2 66.2 2.1 66.4 2.3 68.2 4.1 68.1 4.0 65.2 1.1 65.6 1.5 65.7 1.6 65.7 1.6 P2 3 64.1 71.1 7.0 70.2 6.1 69.3 5.2 71.7 7.6 70.7 6.6 65.3 1.2 65.5 1.4 65.6 1.5 65.7 1.6 Q at-grade 66.5 66.8 0.3 67.0 0.5 67.1 0.6 67.3 0.8 67.6 1.1 67.7 1.2 67.9 1.4 68.1 1.6 68.3 1.8 Q 3 66.5 66.8 0.3 67.0 0.5 67.2 0.7 67.4 0.9 67.6 1.1 67.7 1.2 67.9 1.4 68.1 1.6 68.3 1.8 R at-grade 66.5 67.7 1.2 67.8 1.3 67.4 0.9 67.7 1.2 68.3 1.8 67.7 1.2 68.0 1.5 68.2 1.7 68.3 1.8 R 3 66.5 68.0 1.5 68.5 2.0 67.5 1.0 67.7 1.2 68.2 1.7 67.7 1.2 68.0 1.5 68.2 1.7 68.3 1.8 S at-grade 64.1 64.9 0.8 66.1 2.0 66.3 2.2 65.8 1.7 65.9 1.8 65.1 1.0 65.4 1.3 65.5 1.4 65.6 1.5 S 3 64.1 65.1 1.0 65.9 1.8 65.9 1.8 65.6 1.5 65.8 1.7 65.1 1.0 65.4 1.3 65.5 1.4 65.6 1.5 T1 at-grade 64.1 64.6 0.5 65.4 1.3 65.0 0.9 65.2 1.1 65.3 1.2 65.2 1.1 65.6 1.5 65.6 1.5 65.7 1.6 T1 3 64.1 64.6 0.5 65.4 1.3 65.0 0.9 65.2 1.1 65.3 1.2 65.2 1.1 65.6 1.5 65.6 1.5 65.7 1.6 T2 at-grade 64.1 64.3 0.2 64.5 0.4 64.6 0.5 64.8 0.7 65.0 0.9 65.1 1.0 65.3 1.2 65.4 1.3 65.6 1.5 T2 3 64.1 64.3 0.2 64.5 0.4 64.6 0.5 64.8 0.7 65.0 0.9 65.1 1.0 65.3 1.2 65.4 1.3 65.6 1.5 T2 5 64.1 64.3 0.2 64.5 0.4 64.7 0.6 64.8 0.7 65.0 0.9 65.1 1.0 65.3 1.2 65.5 1.4 65.6 1.5 T2 Top 64.1 64.3 0.2 64.5 0.4 64.6 0.5 64.8 0.7 65.0 0.9 65.1 1.0 65.3 1.2 65.5 1.4 65.6 1.5 T3 at-grade 64.1 64.4 0.3 64.8 0.7 64.9 0.8 64.8 0.7 65.0 0.9 65.1 1.0 65.3 1.2 65.4 1.3 65.6 1.5 T3 3 64.1 64.4 0.3 64.7 0.6 65.0 0.9 65.0 0.9 65.1 1.0 65.1 1.0 65.3 1.2 65.5 1.4 65.6 1.5 T3 5 64.1 64.4 0.3 64.7 0.6 64.8 0.7 65.0 0.9 65.1 1.0 65.1 1.0 65.3 1.2 65.5 1.4 65.6 1.5 T3 Top 64.1 64.4 0.3 64.6 0.5 64.8 0.7 64.8 0.7 65.0 0.9 65.1 1.0 65.3 1.2 65.4 1.3 65.6 1.5 U at-grade 64.1 64.5 0.4 64.8 0.7 64.9 0.8 64.8 0.7 65.0 0.9 65.1 1.0 65.3 1.2 65.5 1.4 65.6 1.5 U 3 64.1 64.4 0.3 65.0 0.9 65.1 1.0 64.9 0.8 65.1 1.0 65.1 1.0 65.3 1.2 65.5 1.4 65.6 1.5 V at-grade 57.3 57.7 0.4 58.0 0.7 61.6 4.3 65.8 8.5 60.3 3.0 60.3 3.0 64.8 7.5 66.5 9.2 59.9 2.6 W at-grade 72.1 72.5 0.4 73.0 0.9 72.7 0.6 72.9 0.8 73.1 1.0 73.2 1.1 73.4 1.3 73.6 1.5 73.8 1.7 W 3 72.1 73.3 1.2 73.7 1.6 72.7 0.6 72.9 0.8 73.1 1.0 73.2 1.1 73.4 1.3 73.6 1.5 73.8 1.7 X at-grade 64.1 65.9 1.8 65.1 1.0 67.0 2.9 68.0 3.9 68.5 4.4 65.6 1.5 66.0 1.9 66.1 2.0 66.4 2.3 X 3 64.1 71.4 7.3 65.3 1.2 68.0 3.9 69.7 5.6 69.2 5.1 65.7 1.6 66.1 2.0 66.1 2.0 66.4 2.3 Y at-grade 62.7 63.1 0.4 63.4 0.7 66.3 3.6 66.5 3.8 65.9 3.2 65.1 2.4 66.4 3.7 65.9 3.2 65.6 2.9 Y 3 62.7 63.1 0.4 63.4 0.7 67.1 4.4 68.1 5.4 66.6 3.9 66.4 3.7 66.8 4.1 66.1 3.4 65.8 3.1 Z at-grade 62.7 63.1 0.4 63.7 1.0 64.0 1.3 64.4 1.7 65.0 2.3 64.6 1.9 65.0 2.3 65.2 2.5 65.4 2.7 Z 3 62.7 63.1 0.4 64.2 1.5 64.3 1.6 65.3 2.6 65.2 2.5 64.9 2.2 65.2 2.5 65.3 2.6 65.5 2.8
Notes: Locations where predicted noise levels exceed the CEQR impact criteria are shown in bold.

Domino Sugar Rezoning
21-54
Representative elevated receptor information is provided in Table 21-15 for specified buildings. The noise levels shown include the highest noise levels that would occur as a result of construction activities in the area. Locations where noise levels exceed the CEQR impact criteria (i.e., increase by more than 3 dBA comparing the total noise level with existing noise level) are shown in bold. The noise analysis results show that maximum predicted noise levels would exceed the 3 dBA CEQR impact criteria during two or more consecutive years at receptor sites 3, 4, 5, 12, B, P2, V, X, and Y. The exceedance of the 3 dBA CEQR impact criteria would be due principally to noise generated by on-site construction activities.
Where exceedances of the 3 dBA CEQR impact criterion are predicted to occur on a building’s upper locations, exceedances would also be expected to occur at other locations on the building that have a direct line-of-sight to one or more construction sites.
For impact determination purposes, the significance of adverse noise impacts is determined based on whether maximum predicted incremental noise levels at sensitive receptor locations would be greater than the impact criteria suggested in the CEQR Technical Manual for two consecutive years or more. While increases exceeding the CEQR impact criteria for one year or less may be noisy and intrusive, they are not considered to be significant adverse noise impacts. An assessment was made of the duration of exceedances of the CEQR impact criteria.
Construction activities would be expected to result in significant adverse noise impacts at the following locations:
• Receptor Sites 3, 4, X, and Y, which represent the residential building with façades on South 2nd and South 3rd Streets between Kent and Wythe Avenues, at all floors, from 2014 through 2020. The maximum predicted increase in noise levels at these receptors was 7.3 dBA and would be expected to occur at the 3rd floor of site X in 2012.
• Receptor Sites 5 and P2, which represent the residential building on the corner of South 4th Street and Kent Avenue, at all floors, from 2012 through 2016. The maximum predicted increase in noise levels was 7.6 dBA and would be expected to occur at the 3rd floor of site P2 in 2015.
• Receptor Site B, which represents the residential buildings with a façade along Grand Street between Kent and Wythe Avenues, at floors above the first floor, from 2018 through 2019. The maximum predicted increase in noise levels was 5.3 dBA and would be expected to occur at the 3rd floor in 2019.
• Sites 12 and V, which represent Grand Ferry Park, between 2018 and 2019. The maximum predicted increase in noise levels was 9.2 dBA and would be expected to occur in 2019.
Construction activities at the other receptor sites in the study area would at times produce noise levels which would be noisy and intrusive, but due to their limited duration, they would not produce significant noise impacts.
Most residential buildings within this area have double-glazed windows and alternative ventilation (i.e., air conditioners). For those that do, this would result in interior noise levels approximately 20 to 25 dBA less than exterior noise levels with window air conditioners, and interior noise levels approximately 25 to 30 dBA less than exterior noise levels with through-the-wall or sleeve air conditioners. The double-glazed windows and alternative ventilation at these structures would provide a significant amount of sound attenuation, and would result in interior noise levels during most of the time that are below 45 dBA L10(1) (the CEQR acceptable interior noise level criteria). However, even though these structures have double-glazed windows and alternative ventilation (i.e.,
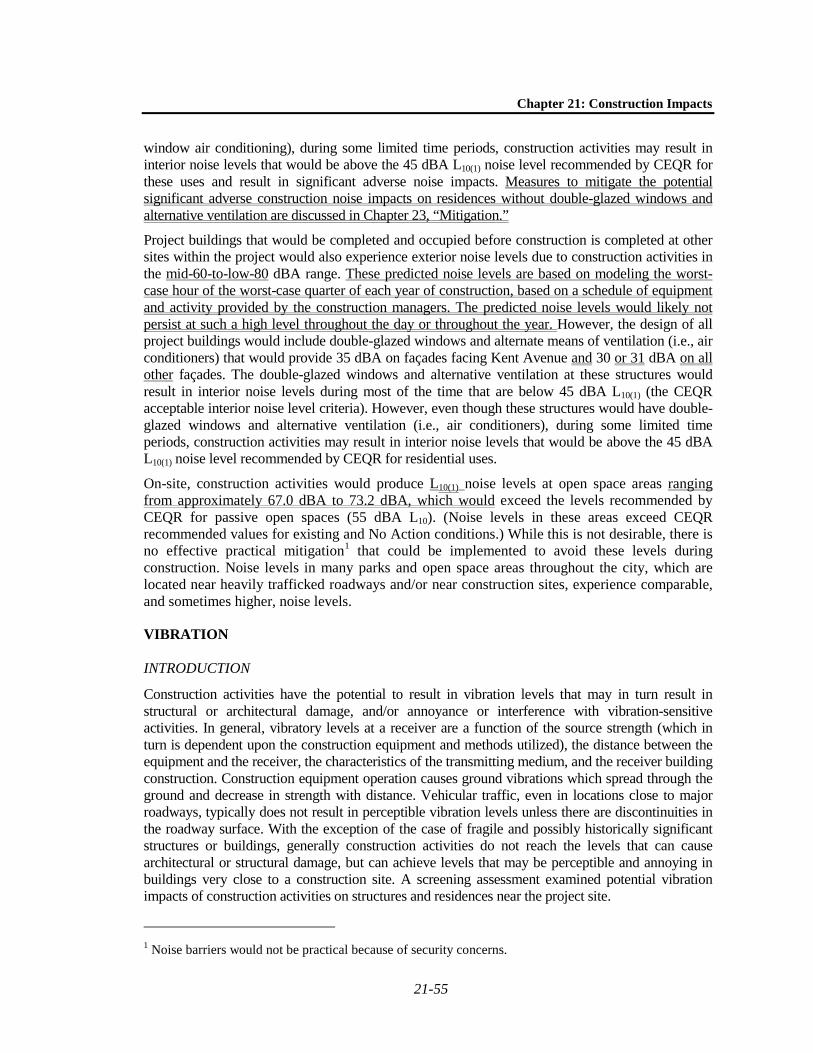
Chapter 21: Construction Impacts
21-55
window air conditioning), during some limited time periods, construction activities may result in interior noise levels that would be above the 45 dBA L10(1) noise level recommended by CEQR for these uses and result in significant adverse noise impacts. Measures to mitigate the potential significant adverse construction noise impacts on residences without double-glazed windows and alternative ventilation are discussed in Chapter 23, “Mitigation.”
Project buildings that would be completed and occupied before construction is completed at other sites within the project would also experience exterior noise levels due to construction activities in the mid-60-to-low-80 dBA range. These predicted noise levels are based on modeling the worst-case hour of the worst-case quarter of each year of construction, based on a schedule of equipment and activity provided by the construction managers. The predicted noise levels would likely not persist at such a high level throughout the day or throughout the year. However, the design of all project buildings would include double-glazed windows and alternate means of ventilation (i.e., air conditioners) that would provide 35 dBA on façades facing Kent Avenue and 30 or 31 dBA on all other façades. The double-glazed windows and alternative ventilation at these structures would result in interior noise levels during most of the time that are below 45 dBA L10(1) (the CEQR acceptable interior noise level criteria). However, even though these structures would have double-glazed windows and alternative ventilation (i.e., air conditioners), during some limited time periods, construction activities may result in interior noise levels that would be above the 45 dBA L10(1) noise level recommended by CEQR for residential uses.
On-site, construction activities would produce L10(1) noise levels at open space areas ranging from approximately 67.0 dBA to 73.2 dBA, which would exceed the levels recommended by CEQR for passive open spaces (55 dBA L10). (Noise levels in these areas exceed CEQR recommended values for existing and No Action conditions.) While this is not desirable, there is no effective practical mitigation1
VIBRATION
that could be implemented to avoid these levels during construction. Noise levels in many parks and open space areas throughout the city, which are located near heavily trafficked roadways and/or near construction sites, experience comparable, and sometimes higher, noise levels.
INTRODUCTION
Construction activities have the potential to result in vibration levels that may in turn result in structural or architectural damage, and/or annoyance or interference with vibration-sensitive activities. In general, vibratory levels at a receiver are a function of the source strength (which in turn is dependent upon the construction equipment and methods utilized), the distance between the equipment and the receiver, the characteristics of the transmitting medium, and the receiver building construction. Construction equipment operation causes ground vibrations which spread through the ground and decrease in strength with distance. Vehicular traffic, even in locations close to major roadways, typically does not result in perceptible vibration levels unless there are discontinuities in the roadway surface. With the exception of the case of fragile and possibly historically significant structures or buildings, generally construction activities do not reach the levels that can cause architectural or structural damage, but can achieve levels that may be perceptible and annoying in buildings very close to a construction site. A screening assessment examined potential vibration impacts of construction activities on structures and residences near the project site.
1 Noise barriers would not be practical because of security concerns.
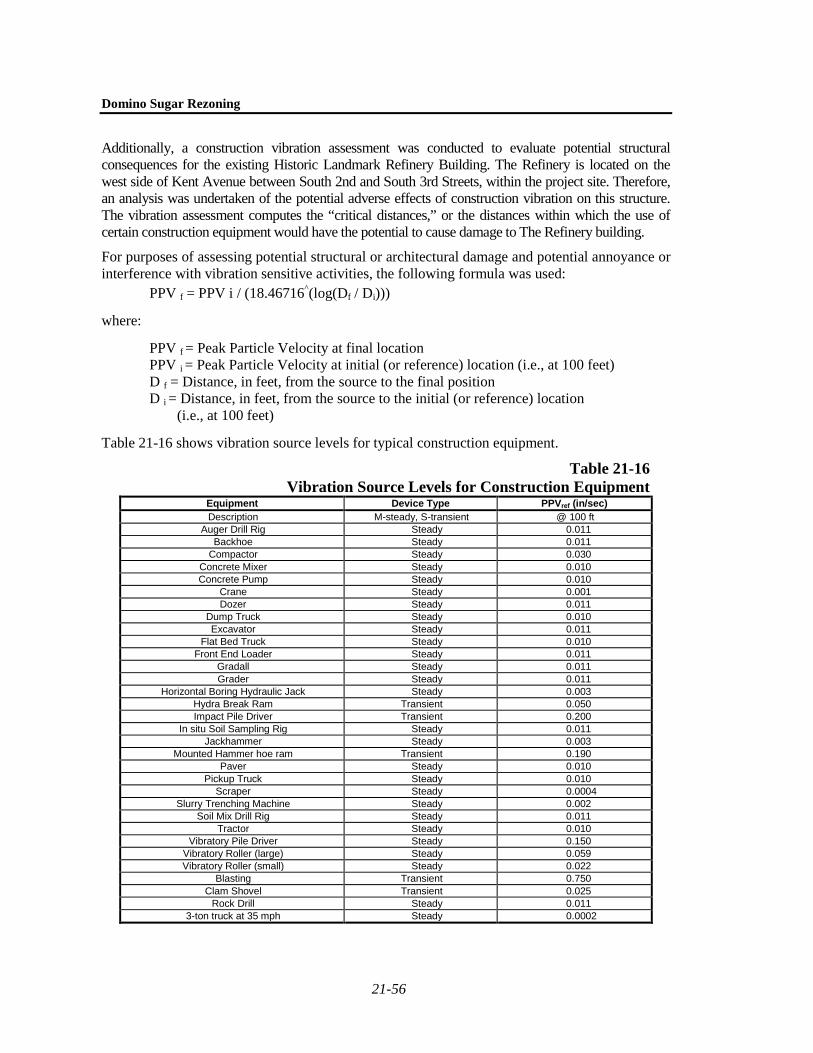
Domino Sugar Rezoning
21-56
Additionally, a construction vibration assessment was conducted to evaluate potential structural consequences for the existing Historic Landmark Refinery Building. The Refinery is located on the west side of Kent Avenue between South 2nd and South 3rd Streets, within the project site. Therefore, an analysis was undertaken of the potential adverse effects of construction vibration on this structure. The vibration assessment computes the “critical distances,” or the distances within which the use of certain construction equipment would have the potential to cause damage to The Refinery building.
For purposes of assessing potential structural or architectural damage and potential annoyance or interference with vibration sensitive activities, the following formula was used:
PPV f = PPV i / (18.46716^(log(Df / Di)))
where:
PPV f = Peak Particle Velocity at final location PPV i = Peak Particle Velocity at initial (or reference) location (i.e., at 100 feet) D f = Distance, in feet, from the source to the final position D i = Distance, in feet, from the source to the initial (or reference) location (i.e., at 100 feet)
Table 21-16 shows vibration source levels for typical construction equipment.
Table 21-16 Vibration Source Levels for Construction Equipment
Equipment Device Type PPVref (in/sec) Description M-steady, S-transient @ 100 ft
Auger Drill Rig Steady 0.011 Backhoe Steady 0.011
Compactor Steady 0.030 Concrete Mixer Steady 0.010 Concrete Pump Steady 0.010
Crane Steady 0.001 Dozer Steady 0.011
Dump Truck Steady 0.010 Excavator Steady 0.011
Flat Bed Truck Steady 0.010 Front End Loader Steady 0.011
Gradall Steady 0.011 Grader Steady 0.011
Horizontal Boring Hydraulic Jack Steady 0.003 Hydra Break Ram Transient 0.050 Impact Pile Driver Transient 0.200
In situ Soil Sampling Rig Steady 0.011 Jackhammer Steady 0.003
Mounted Hammer hoe ram Transient 0.190 Paver Steady 0.010
Pickup Truck Steady 0.010 Scraper Steady 0.0004
Slurry Trenching Machine Steady 0.002 Soil Mix Drill Rig Steady 0.011
Tractor Steady 0.010 Vibratory Pile Driver Steady 0.150
Vibratory Roller (large) Steady 0.059 Vibratory Roller (small) Steady 0.022
Blasting Transient 0.750 Clam Shovel Transient 0.025
Rock Drill Steady 0.011 3-ton truck at 35 mph Steady 0.0002

Chapter 21: Construction Impacts
21-57
CONSTRUCTION VIBRATION CRITERIA
Several vibration criteria guidelines were considered in this case, all of which were applied as conservatively as possible in order to yield cautious results. The criteria include those published by the FTA for minor cosmetic damage of fragile structures, the Central Artery/Tunnel Project’s Vibration Design Policy for potential damages to extremely susceptible buildings, and the Swiss Standard 640-312, which also addresses extremely susceptible buildings. More tolerant damage criteria were also considered, such as those from the U.S. Bureau of Mines and NYCDOB under their TPPN #10/88.
Vibration levels may be quantified using several different metrics depending on the issue being evaluated. Vibration is mechanical energy in oscillatory motion and can, therefore, be evaluated in terms of instantaneous or average acceleration, velocity or displacement. For structures, it is most common to evaluate the vibration velocity component. The results can be expressed in units of velocity such as inches per second. The peak particle velocity (PPV) is the preferred metric for evaluating potential damages to structures, and its results are also expressed in units of inches per second. Alternatively, vibration velocity levels can be expressed in decibel units (VdB) where the PPV level is logarithmically compared to a reference velocity level of 1 micro-inch per second after having been adjusted to account for the root-mean-square quantity. The PPV represents the highest (or worst-case) instantaneous vibration level, and vibration levels expressed in VdB represent a time and energy-averaged vibration level. Therefore, potential damages to structures are usually evaluated in terms of PPV whereas the annoyance of vibration as perceived by human beings is usually evaluated in terms of VdB.
As mentioned above, there are vibration criteria intended to prevent major structural damage to buildings. These vibration limits are much higher than those used to evaluate minor cosmetic damage or human annoyance. For reference, major structural damage criteria limits of about 1.9 to 2.0 PPV inch/sec are intended to avoid significant damage that could weaken a structure’s integrity. Minor structural damage criteria limits are set much lower and are intended to avoid cosmetic damages such as hairline cracking of plaster or concrete. Minor structural damage vibration criteria for fragile historic structures ranges from about 0.12 PPV inch/sec for continuous or steady vibration sources to 0.30 PPV inch/sec for transient or impulsive vibration sources.
CONSTRUCTION VIBRATION ANALYSIS RESULTS
Based on the vibration emission levels produced by certain equipment, the critical distance, or distance (in feet) within which vibration levels might exceed relevant criteria, can be computed. Table 21-17 summarizes six typical high-vibration-producing-equipment found on construction sites and provides the computed critical distances for each piece of equipment with respect to major and minor structural damage criteria.
Table 21-17 Construction Equipment Vibration Critical Distances
Construction Equipment
Reference Vibration Emission Level PPV at 100 feet
Vibration Critical Distance
Major Structural Damages
Minor Damages From Impulsive
Sources
Minor Damages From Steady
Sources Clam Shovel Drop 0.025 PPV inch/sec 4 feet 15 feet N/A
Auger Drill Rig 0.011 PPV inch/sec 2 feet N/A 16 feet Jackhammer 0.003 PPV inch/sec 1 foot N/A 6 feet
Mounted Hoe Ram 0.190 PPV inch/sec 17 feet 70 feet N/A Vibratory Pile Driver 0.150 PPV inch/sec 14 feet N/A 120 feet Impact Pile Driver 0.200 PPV inch/sec 17 feet 73 feet N/A
Domino Sugar Rezoning
21-58
Based on the results shown in Table 21-17 it can be concluded that vibration impacts to the existing Refinery building can be avoided provided certain high-vibration-producing equipment are not used within the critical distances stated in the table, as feasible for project construction. Thus, jackhammers, drills, and clam shell buckets should not be used within 1 to 4 feet of the Refinery building, and hoe rams and pile drivers should not be used within 14 to 17 feet. Jackhammers, drills and clam shell buckets should not be used within 6 to 16 feet of the refinery building, and hoe rams and pile drivers should not be used within 70 to 120 feet of the refinery building, in order to avoid potential minor structural damages.
VIBRATION MITIGATION MEASURES
However, it may be likely that project construction can not feasibly follow the recommended critical distances described above. Therefore, in the event that high-vibration-producing equipment would be used in close proximity to the Refinery structure, vibration mitigation options would be considered. Potential vibration mitigation measures for hoe rams might include the use of rock drills combined with hydraulic jack or chemical splitters, or the use of carefully controlled blasting, to demolish large rock or concrete obstacles. Pile driving mitigation options would include the use of a hydraulic pile pushing system, the use of slurry walls dug out by a hydromill, or pre-trenching the piles with a backhoe or water jet. Further, a program would be established to monitor vibration levels and any construction effects on the Refinery from vibration. As described above, under “Historic Resources,” a CPP would be established for the project. The CPP would meet the guidelines set forth in TPPN #10/88, concerning procedures for the avoidance of damage to adjacent historic structures from nearby construction, the Protection Programs for Landmarked Buildings guidance document of the LPC, and the National Park Service’s Preservation Tech Notes, Temporary Protection #3: Protecting a Historic Structure during Adjacent Construction. The CPP would specify measures and construction procedures, such as vibration limits and monitoring, that would be implemented during construction of the Proposed Actions. According to TPPN 10/88, PPV due to construction-related vibration must not exceed 0.5 inch/sec. The program would monitor PPV and activities that create vibration at historic structures in excess of established limits would be terminated. Alternative construction methods that produce vibration within established limits would be used. It would also empower the structural and foundation engineers to issue “stop work” orders to prevent damage to the Refinery building. With these measures, there would not be a significant adverse impact on the High Line due to construction of the Proposed Actions.
RODENT CONTROL
Construction contracts would include provisions for a rodent (mouse and rat) control program. Before the start of construction, the contractor would survey and bait the appropriate areas and provide for proper site sanitation. During the construction phase, as necessary, the contractor would carry out a maintenance program. Coordination would be maintained with appropriate public agencies. Only EPA- and NYSDEC-registered rodenticides would be permitted, and the contractor would be required to perform rodent control programs in a manner that avoids hazards to humans, domestic animals, and non-target wildlife. Therefore, construction of the proposed project would not result in any significant adverse impacts on rodent control.

Chapter 21: Construction Impacts
21-59
E. PUBLIC SCHOOL OPTION As described in Chapter 23, “Mitigation,” in order to address the proposed project’s significant adverse impact on public schools, the applicant would enter into an agreement with the School Construction Authority (SCA) to provide an option to locate an approximately 100,000-square-foot public elementary and intermediate school within the community facility space in the Refinery complex. As part of this agreement, and as formalized in the Restrictive Declaration, at different phases of the proposed project the applicant would provide the SCA with an opportunity to determine whether a school is needed within the Refinery complex.
As a result of this agreement, the phasing of construction could vary from that depicted in Table 21-1 and Figure 21-1 and analyzed in Section D, above. Under this agreement, the SCA may defer construction of the Refinery until after construction of Site B (the Delayed School Phasing Sequence), as shown in Table 21-18 and Figure 21-4. The total anticipated period of construction for the proposed project would remain at approximately nine years, starting in early 2012 and finishing in late 2020.
Table 21-18 Construction Components and Projected Durations
(Delayed School Phasing Sequence) Project Parcel Estimated
Duration Start Date Finish Date
Site E 23 months Jan. 2012 Nov. 2013 Site D 36 months Jan. 2012 Dec. 2014 Site C 28 months Dec. 2014 Mar. 2017 Site B 40 months Jun. 2014 Sep. 2017 The Refinery 35 months Nov. 2016 Sep. 2019 Site A 24 months Nov. 2018 Oct. 2020 Waterfront platform 30 months Apr. 2013 Sep. 2015
Source: The Refinery LLC, Gotham Construction, F.J. Sciame Construction, and Mueser Rutledge.
The Delayed School Phasing Sequence is assessed in this section to determine whether it would result in any significant adverse impacts different from those identified in Section D, above.
As with the proposed development program, the modifications proposed as part of the Delayed School Phasing Sequence would not result in any significant adverse impacts due to construction activities in Land Use, Socioeconomic Conditions, Community Facilities, Historic Resources, Hazardous Materials, Natural Resources, and Infrastructure. With respect to Open Space, Traffic and Parking, Air Quality, and Noise, the potential for impacts from the Delayed School Phasing Sequence is described below.
OPEN SPACE
Under the Delayed School Phasing Sequence, an interim open space connection between Site B and Site C would be established in front of the Refinery. The full open space program—including the balance of the large central lawn—would then be completed along with the build-out of the Refinery. Therefore, construction of the proposed project under the Delayed School Phasing Sequence would not result in significant adverse impacts on open space.
Construction activities would be conducted with the care mandated by the close proximity of an open space to the project site. Dust control measures—including watering of exposed areas and
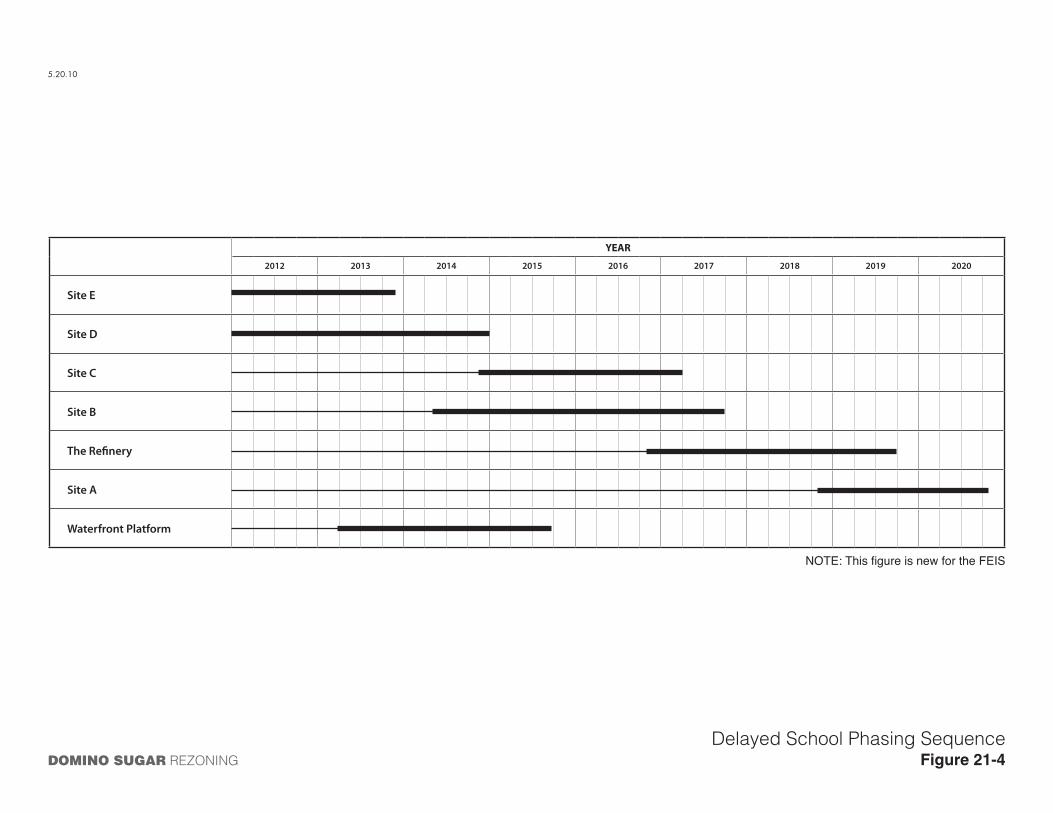
DOMINO SUGAR REZONING
Delayed School Phasing SequenceFigure 21-4
YEAR
2012 2013 2014 2015 2016 2017 2018 2019 2020
Site E
Site D
Site C
Site B
The Refinery
Site A
Waterfront Platform
5.20.10
NOTE: This figure is new for the FEIS
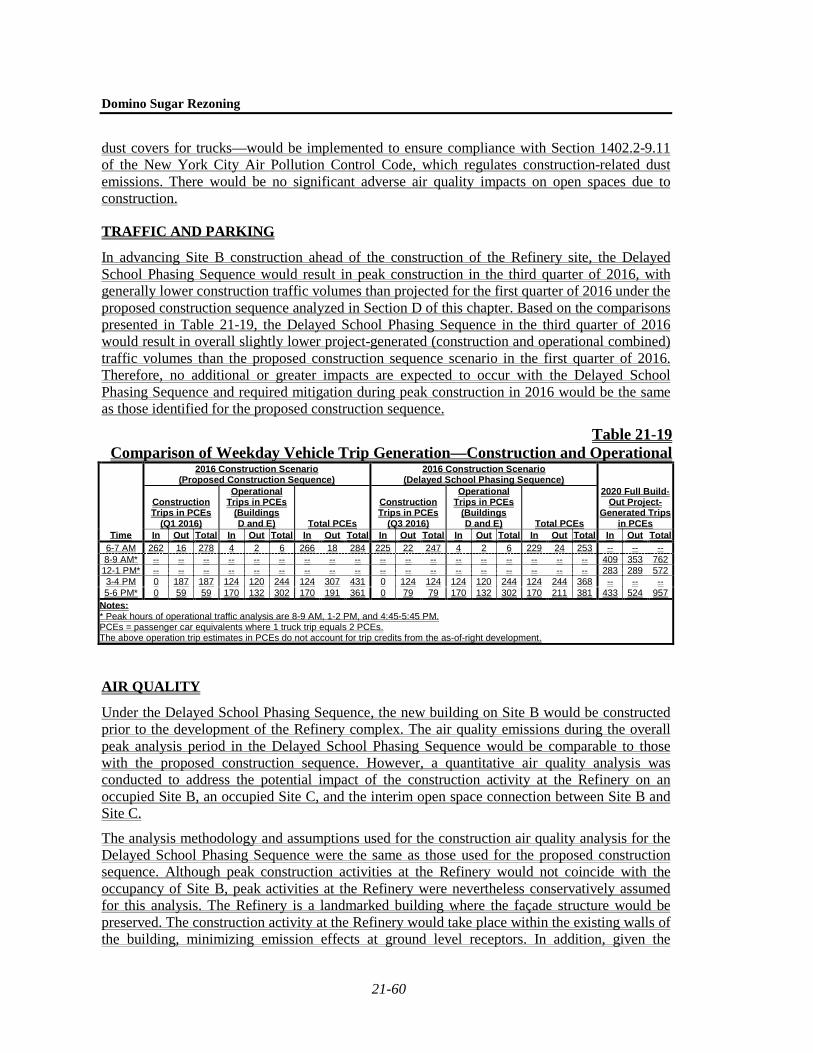
Domino Sugar Rezoning
21-60
dust covers for trucks—would be implemented to ensure compliance with Section 1402.2-9.11 of the New York City Air Pollution Control Code, which regulates construction-related dust emissions. There would be no significant adverse air quality impacts on open spaces due to construction.
TRAFFIC AND PARKING
In advancing Site B construction ahead of the construction of the Refinery site, the Delayed School Phasing Sequence would result in peak construction in the third quarter of 2016, with generally lower construction traffic volumes than projected for the first quarter of 2016 under the proposed construction sequence analyzed in Section D of this chapter. Based on the comparisons presented in Table 21-19, the Delayed School Phasing Sequence in the third quarter of 2016 would result in overall slightly lower project-generated (construction and operational combined) traffic volumes than the proposed construction sequence scenario in the first quarter of 2016. Therefore, no additional or greater impacts are expected to occur with the Delayed School Phasing Sequence and required mitigation during peak construction in 2016 would be the same as those identified for the proposed construction sequence.
Table 21-19 Comparison of Weekday Vehicle Trip Generation––Construction and Operational
Time
2016 Construction Scenario (Proposed Construction Sequence)
2016 Construction Scenario (Delayed School Phasing Sequence)
2020 Full Build-Out Project-
Generated Trips in PCEs
Construction Trips in PCEs
(Q1 2016)
Operational Trips in PCEs
(Buildings D and E) Total PCEs
Construction Trips in PCEs
(Q3 2016)
Operational Trips in PCEs
(Buildings D and E) Total PCEs
In Out Total In Out Total In Out Total In Out Total In Out Total In Out Total In Out Total 6-7 AM 262 16 278 4 2 6 266 18 284 225 22 247 4 2 6 229 24 253 -- -- -- 8-9 AM* -- -- -- -- -- -- -- -- -- -- -- -- -- -- -- -- -- -- 409 353 762 12-1 PM* -- -- -- -- -- -- -- -- -- -- -- -- -- -- -- -- -- -- 283 289 572 3-4 PM 0 187 187 124 120 244 124 307 431 0 124 124 124 120 244 124 244 368 -- -- -- 5-6 PM* 0 59 59 170 132 302 170 191 361 0 79 79 170 132 302 170 211 381 433 524 957
Notes: * Peak hours of operational traffic analysis are 8-9 AM, 1-2 PM, and 4:45-5:45 PM. PCEs = passenger car equivalents where 1 truck trip equals 2 PCEs. The above operation trip estimates in PCEs do not account for trip credits from the as-of-right development.
AIR QUALITY
Under the Delayed School Phasing Sequence, the new building on Site B would be constructed prior to the development of the Refinery complex. The air quality emissions during the overall peak analysis period in the Delayed School Phasing Sequence would be comparable to those with the proposed construction sequence. However, a quantitative air quality analysis was conducted to address the potential impact of the construction activity at the Refinery on an occupied Site B, an occupied Site C, and the interim open space connection between Site B and Site C.
The analysis methodology and assumptions used for the construction air quality analysis for the Delayed School Phasing Sequence were the same as those used for the proposed construction sequence. Although peak construction activities at the Refinery would not coincide with the occupancy of Site B, peak activities at the Refinery were nevertheless conservatively assumed for this analysis. The Refinery is a landmarked building where the façade structure would be preserved. The construction activity at the Refinery would take place within the existing walls of the building, minimizing emission effects at ground level receptors. In addition, given the

Chapter 21: Construction Impacts
21-61
delicate nature and complexity of the work, the construction activity of the Refinery would occur over a lengthy period but at a reduced intensity. The maximum predicted 24-hour average PM2.5 incremental concentration at a ground level receptor was equal to 0.1 µg/m3, and the maximum predicted 24-hour average PM2.5 incremental concentration at an elevated receptor was equal to 1.9 µg/m3. The maximum predicted incremental concentrations of PM2.5 would not exceed applicable DEP interim guidance criteria. Therefore, no significant adverse air quality impacts are expected from the construction activities at the Refinery on an occupied Site B.
There would also be a minimal cumulative effect on an occupied Site B from concurrent construction activities at the Refinery and Site A because emissions from construction activities at the Refinery and Site A would affect different façades of Site B. This is especially true for the short-term periods (24 hours and less) because directly opposing wind directions in the same period would be required for both the Refinery and Site A to affect Site B in the same 24-hour time frame. Therefore, no significant adverse air quality impacts are expected from the concurrent construction activities at the Refinery and Site A on an occupied Site B.
NOISE
Noise levels generated by construction of the proposed project at nearby sensitive receptors with the Delayed School Phasing Sequence would be comparable to those with the proposed construction sequence. With Site B being constructed before the Refinery, the construction schedule would change, and the peak construction activity and equipment usage may occur at different times from the proposed construction sequence, which would result in the peak noise levels and noise level increases occurring in a slightly different sequence. However, the magnitude of the noise levels and noise level increases at the nearby receptors would be similar to those with the proposed construction sequence.
Under the Delayed School Phasing Sequence, Site B would be occupied during construction of Site A and during the latter stages of construction at the Refinery, whereas it would not have been occupied during construction of the Refinery under the proposed construction sequence. The construction noise to be experienced on Site B is expected to be comparable to what was predicted for other project buildings under the proposed construction sequence. The heaviest and noisiest construction at the Refinery (i.e., interior demolition, excavation, façade bracing, and foundation work) would be complete by the time Site B is occupied and, in addition, the Refinery’s existing walls, which will remain throughout construction, would act as a barrier to shield Site B from construction noise. Construction at Site A would not begin until construction at the Refinery is in the finishing stages and, as a result, there would be no time during which heavy construction would occur at both sites. With exposure to only a single site at which heavy construction occurs at a time, noise levels at Site B during construction are not expected to be any higher under the Delayed School Phasing Sequence than what was predicted at other project buildings under the proposed construction sequence.
As with other project buildings that would be completed and occupied during the construction period, Site B would experience exterior noise levels due to construction activities in the mid-60-to-low-80 dBA range. These predicted noise levels are based on modeling the worst-case hour of the worst-case quarter of each year of construction, based on a schedule of equipment and activity provided by the construction managers. In actuality, the modeled noise levels would likely not persist at such a high level throughout the day or throughout the year. The design of all project buildings would include double-glazed windows and alternate means of ventilation (i.e., air conditioners) that would provide at least 30 dBA on all façades, and 35 dBA on façades
Domino Sugar Rezoning
21-62
facing Kent Avenue. The double-glazed windows and alternative ventilation at the project buildings would result in interior noise levels during most of the time that are below 45 dBA L10(1) (the CEQR acceptable interior noise level criteria). However, even though these structures would have double-glazed windows and alternative ventilation (i.e., air conditioners), during some limited time hours of the day during the worst-case quarters of the construction period, construction activities may result in interior noise levels that would be above the 45 dBA L10(1) noise level recommended by CEQR for residential uses.
As with the proposed construction sequence, the Delayed School Phasing sequence would result in L10(1) noise levels at open space areas that exceed the levels recommended by CEQR for passive open spaces (55 dBA L10). (Noise levels in these areas exceed CEQR recommended values for existing and No Action conditions.) There is no effective practical mitigation1
It is expected that the Delayed School Phasing Sequence would result in construction noise levels that are comparable to those generated by the proposed construction sequence, which was analyzed in great detail. As in the case of the proposed construction sequence, it can be concluded that the window/wall attenuation provided by the project buildings would result in acceptable interior noise levels at most times during construction at those locations. As with the proposed construction sequence, the Delayed School Phasing Sequence could result in potential significant adverse construction noise impacts on nearby residences that do not have double-glazed windows and alternative ventilation. Measures to mitigate these potential significant adverse construction noise impacts would be the same as under the proposed construction sequence.
that could be implemented to avoid these levels during construction. Noise levels in many parks and open space areas throughout the city, which are located near heavily trafficked roadways and/or near construction sites, experience comparable, and sometimes higher, noise levels.
CONCLUSIONS
Under the Public School Option, SCA may defer construction of the Refinery until after construction of Site B (the Delayed School Phasing Sequence). As with the proposed development program, the modifications proposed as part of the Delayed School Phasing Sequence would not result in any significant adverse impacts due to construction activities in Land Use, Socioeconomic Conditions, Community Facilities, Historic Resources, Hazardous Materials, Natural Resources, and Infrastructure. With respect to Open Space, Traffic and Parking, Air Quality, and Noise, the potential for impacts from the Delayed School Phasing Sequence were examined in detail above. It was concluded that the Delayed School Phasing Sequence would not generate any significant adverse impacts or require any mitigation measures not identified in the proposed construction sequence.
1 Noise barriers would not be practical because of security concerns.