ENVIRONMENTAL IMPACTS OF PREFABRICATED CONSTRUCTION
80
ENVIRONMENTAL IMPACTS OF PREFABRICATED CONSTRUCTION: CO2 EMISSIONS COMPARISON OF PRECAST AND CAST-IN-PLACE CONCRETE CASE STUDY Miran Seo A Thesis submitted in partial fulfillment of the requirements for the degree of Master of Science in Construction Management University of Washington 2020 Committee: Yong-Woo Kim Ken-Yu Lin Program Authorized to Offer Degree: College of Built Environment
Transcript of ENVIRONMENTAL IMPACTS OF PREFABRICATED CONSTRUCTION

ENVIRONMENTAL IMPACTS OF PREFABRICATED CONSTRUCTION:
CO2 EMISSIONS COMPARISON OF PRECAST AND CAST-IN-PLACE CONCRETE
CASE STUDY
Miran Seo
A Thesis
submitted in partial fulfillment of the
requirements for the degree of
Master of Science in Construction Management
University of Washington
2020
Committee:
Yong-Woo Kim
Ken-Yu Lin
Program Authorized to Offer Degree:
College of Built Environment

2
©Copyright 2020
Miran Seo

3
University of Washington
Abstract
Environmental Impacts of Prefabricated Construction:
CO2 Emissions Comparison of Precast and Cast-In-Place Concrete Case Study
Miran Seo
Chair of the Supervisory Committee:
Yong-Woo Kim
Department Construction Management
Construction activities are one of the major contributors to climate change by greenhouse gas
emissions. While the use of prefabrication has certain advantages in terms of environmental
impacts through material and time efficiency, it is not clear nor has enough data for the quantities
and factors comparing the conventional methods. This study aims to review the characteristics of
prefabricated construction and to find environmental impacts through the case study. The
methodology is the analysis by comparing the carbon emissions of precast concrete which is one
of the major prefabricated structures and cast-in-place concrete which is conventional methods.
The case study data is based on residential buildings which were built by prefabricated structures
in South Korea. The comparison is conducted focused on several scenarios according to the
criteria for precast concrete construction such as loss rate of materials, delivery distance, vehicle
capacity, equipment types and installation hours. The outcomes are found that the amount of
4
carbon emissions of precast and cast-in-place concrete for the studied residential buildings.
Based on the research findings, it is recommended to adopt precast concrete in building
construction in terms of environmental impacts during the product stage and construction stage.
However, these averages can be a significant variation among individual projects. The far
distance, small vehicle capacity and low efficiency of equipment with a loss of material can
adversely affect the environment. The building industry should consider the carbon reduction as
a benefit of implementing prefabricated construction after considering the characteristics of the
location, distance, transportation method, and installation efficiency.

5
Acknowledgement
I would like to express my sincere gratitude to several individuals for supporting me through my
graduate study. First, I wish to my sincere gratitude to my supervisor, Professor Yong-Woo Kim,
for his enthusiasm, patience, insightful comments, and practical advice that have tremendously
helped me at all times in my research and writing of this thesis.
I also wish to express my sincere thanks to Professor Ken-Yu Lin for advising not only in her
Research Method class but also as a thesis committee advisor. Her careful feedback and wise
advice were very helpful for my better writing.
I also greatly appreciate the company of precast who provided the case study data. I could develop
my research due to their data and they allow me to get responses on numerous inquiries.
I am also grateful to the faculties and classmates of the Construction Management department who
have encouraged me and helped me to step one more forward to the academic process.
Finally, I would like to express my infinite thanks and love to my family and husband, Hyunbea,
who always loves and supports me under any conditions.

6
TABLE OF CONTENTS
CHAPTER 1. INTRODUCTION ......................................................................................... 12
1.1 Background .................................................................................................................... 12
1.2 Research Purpose and Organization ............................................................................... 13
CHAPTER 2. DEFINITION ................................................................................................. 15
2.1 Prefabricated Construction and Modular Construction .................................................. 15
2.2 Typical Characteristics of Prefabricated Construction................................................... 16
CHAPTER 3. TYPES OF PREFABRICATION ................................................................ 19
3.1 Structural Type of Prefabrication ................................................................................... 19
3.1.1 Steel Frame ............................................................................................................. 19
3.1.2 Wood Frame............................................................................................................ 21
3.1.3 Concrete Frame ....................................................................................................... 22
3.2 Fabrication Type and Logistics ...................................................................................... 24
3.2.1 Panelized Type ........................................................................................................ 24
3.2.2 Volumetric Type ..................................................................................................... 25
3.2.3 Logistics .................................................................................................................. 25
CHAPTER 4. PREFABRICATED CONSTRUCTION CONSIDERATION .................. 28
4.1 Schedule ......................................................................................................................... 28
4.2 Cost................................................................................................................................. 30
4.3 Quality and Safety Control ............................................................................................. 31
4.4 Opportunities and Limitations ........................................................................................ 32

7
CHAPTER 5. SUSTAINABILITY CONSIDERATION .................................................... 35
5.1 Needs for Sustainable Construction ............................................................................... 35
5.2 Three Elements of Construction Sustainability .............................................................. 36
5.3 Life Cycle Assessment ................................................................................................... 38
CHAPTER 6. CASE STUDY OF ENVIRONMENTAL IMPACTS ................................ 40
6.1 Case Study Objective ..................................................................................................... 40
6.2 Methodology .................................................................................................................. 40
6.2.1 Process of Case Study ............................................................................................. 40
6.2.2 Scenario Analysis Methodology ............................................................................. 42
6.3 Case Study Project Information ..................................................................................... 42
6.4 Case Study Boundary ..................................................................................................... 44
6.5 Case Study Scenarios Overview .................................................................................... 45
6.6 Data Collection for Preconditions .................................................................................. 46
6.6.1 CO2 Emissions of Concrete and Steel ..................................................................... 47
6.6.2 CO2 Emissions of Transportation ........................................................................... 48
6.6.3 CO2 Emissions of Equipment and Utilities ............................................................. 49
6.7 Data Analysis ................................................................................................................. 52
6.7.1 Material Loss and CO2 Emissions .......................................................................... 52
6.7.2 Transportation (Distance) ....................................................................................... 53
6.7.3 Transportation (Vehicle Capacity) .......................................................................... 58
6.7.4 Fabrication and Installation..................................................................................... 62
6.7.5 Total Amount and Ratio Comparison ..................................................................... 65
CHAPTER 7. DISCUSSION ................................................................................................. 69
7.1 Findings and Recommendations .................................................................................... 69

8
7.2 Limitations ..................................................................................................................... 72
CHAPTER 8. CONCLUSTION ........................................................................................... 74
References ………. ...................................................................................................................... 75
Appendix. Supplementary Data ................................................................................................ 78

9
LIST OF FIGURES
Figure 1. Complexity and Scale of Modular Construction Comparison of Approaches .............. 16
Figure 2. Steel Frame Modular Building ...................................................................................... 20
Figure 3. Wood Frame Modular Building .................................................................................... 22
Figure 4. Concrete Frame Modular Building ................................................................................ 23
Figure 5. Transport Method of Panelized type and Volumetric type ........................................... 27
Figure 6. Streamlined Construction Process ................................................................................. 29
Figure 7. The Three Elements of Sustainable ............................................................................... 37
Figure 8. System Boundary of Concrete Life Cycle Assessment (LCA) ..................................... 39
Figure 9. Case Study Methodology Process ................................................................................. 41
Figure 10. Typical Type Images of Case Study Residential Building .......................................... 43
Figure 11. Case Study Block A (153 units) Layout Image ........................................................... 43
Figure 12. Boundary System for CO2 Emissions Comparison ..................................................... 45
Figure 13. 2017 U.S. GHG Emissions by Sector .......................................................................... 48
Figure 14. 2017 U.S. Transportation Sector GHG Emissions by Source ..................................... 48
Figure 15. Comparison of CO2 Emissions of Concrete and Steel bar .......................................... 53
Figure 16. CO2 Emissions of Transportation Distance ................................................................. 57
Figure 17. CO2 Emissions Sensitivity for Distance ..................................................................... 57
Figure 18. Transportation Type for Panelized Module of Case Study ......................................... 58
Figure 19. Comparison of CO2 Emissions of Transport Vehicle between Precast and CIP ......... 60
Figure 20. CO2 Emissions Sensitivity for Vehicle Capacity ........................................................ 61
Figure 21. Precast Concrete Assembly Simulation....................................................................... 64

10
Figure 22. Comparison of CO2 Emissions for Fabrication and Installation Energy ..................... 65
Figure 23. Comparison of Total CO2 Emissions of Precast and CIP............................................ 66
Figure 24. Ratio Comparison of CO2 Emissions of Precast and CIP ........................................... 67
Figure 25. Sensitivity of Precast Concrete for Distance-Vehicle Capacity .................................. 71
Figure 26. Sensitivity of CIP Concrete for Distance-Vehicle Capacity ....................................... 71

11
LIST OF TABLES
Table 1. Case Study Residential Housing Units ........................................................................... 43
Table 2. Scenario for CO2 Emissions Comparison ....................................................................... 46
Table 3. Preconditions of CO2 Emissions for Scenario Criteria ................................................... 51
Table 4. Concrete and Steel Bar Quantities and CO2 Emissions Calculation .............................. 52
Table 5. CO2 Emissions for Transport (Scenario A-Distance) of Precast .................................... 55
Table 6. CO2 Emissions for Transport (Scenario A-Distance) of CIP ......................................... 55
Table 7. CO2 Emissions for Transport (Scenario B-Vehicle) of Precast ...................................... 59
Table 8. CO2 Emissions for Transport (Scenario B-Vehicle) of CIP ........................................... 59
Table 9. CO2 Emissions for Fabrication and Installation of Precast ............................................. 63
Table 10. CO2 Emissions for Fabrication and Installation of CIP ................................................ 63

12
CHAPTER 1. INTRODUCTION
1.1 Background
Nowadays, there is no question that public health and environmental system are endangered by
climate change. It’s impacts have become more apparent, now more than ever.
The earth’s climate is changing, due largely to greenhouse gas emissions from human industry.
These human-generated gases derive in part from aspects of the built environment such as
transportation systems and infrastructure, building construction and operation, and land-use
planning (Yonger et al., 2008). However, not many construction management research studies
have focused on sustainability and climate change in order to determine the impact and
correlation of the environment and construction industry, therefore they require both broad and
specialized studies with various perspectives.
Climate change, the most serious threat to human society, is ironically, a threat that human
society has created itself. Global atmospheric concentrations of greenhouse gases (GHGs) have
increased since 1750, notably carbon dioxide (CO2) the most predominant greenhouse gas by
volume. Emissions of CO2 from fossil fuel combustion, in conjunction with that emitted from
cement manufacture, are responsible for more than 75% of the increase in atmospheric CO2 since
the pre-industrial 18th century (Monahan and Powell, 2011). The CO2 is generated during
construction, that is, during the manufacturing, transportation, production, and installation of the
building members, which are used to construct new buildings (Ramesh et al., 2010).
There are many factors to be considered and made decisions for a construction project.
Traditionally, construction activities were designed and developed without considering their

13
adverse impacts on the environment. However, recently many countries and cities are requiring
eco-friendly built environments as the economies develop. One of the environmentally friendly
construction methods is prefabricated construction. Prefabricated or modular construction has
gradually been replacing the traditional on-site construction due to the benefits provided, a
notably faster time, reduced costs, better work quality, and fewer environmental impacts. Also,
prefabricated construction guarantees more control over the quality of components and safety of
the construction process (Molavi and Barral, 2016).
Modular building is one promising technique to lower the impacts of construction and is utilized
for various building types, including single-family homes, multifamily housing, hotels,
dormitories, and various commercial and retail structures. Modular construction is a form of
prefabrication that involves the creation of discrete volumetric sections of buildings that are
transported to a site and assembled into a complete building (Quale et al., 2012).
1.2 Research Purpose and Organization
Although prefabricated construction is generally known as environmentally friendly, there are
still various factors affecting the environment which require further study. Especially, the
environmental trade-off effects between off-site and on-site construction as they are not
investigated thoroughly enough. Therefore, it is part of the effort to find the environmental
impacts of building construction to guide decision making. The researcher reviewed the
characteristics of prefabricated construction through literature, articles, and cases to find the
environmental impacts of prefabricated construction.
This paper has organized a total of 9 Chapters. The definition of terms and typical characteristics

14
of prefabricated construction are described in Chapter 2, and then the significant characteristics
and example cases of prefabricated construction were reviewed and explained from Chapter 3 to
Chapter 6. In Chapter 7, in order to analyze the environmental impacts, CO2 emissions had
compared to precast concrete which is presented as the prefabrication process and cast-in-place
(CIP) concrete which is presented as the conventional process. The case study was focused on
the amounts of CO2 emissions conducted based on the reviewed existing knowledge and
collected data. The research findings and discussions were covered in Chapter 8, and the
conclusion was described in Chapter 9.

15
CHAPTER 2. DEFINITION
2.1 Prefabricated Construction and Modular Construction
Prefabrication construction can be defined as different words in through situation and approach.
There are several definitions used and depend on each construction industry and perspectives on
the complexities or characteristics. For instance, prefabrication is defined as a manufacturing
process that generally happens at a specialized factory where various materials are combined to
form a component in the final installation downstream (Pen et al., 2019; Taum et al., 1987).
Figure 1 shows the complexity and scale degrees of prefabrication according to the components
and units. Additional examples of definitions are that Off-Site Construction (OSC), Permanent
Modular Construction (PMC), Off-site Prefabrication, and Prefabricated Prefinished Volumetric
Construction (PPVC) are some terms used interchangeably in literature to describe prefabricated
construction.
In broad terms, modular construction involves producing standardized components of a structure
in an offsite factory, then assembling them onsite. Terms such as offsite construction,
prefabrication, and modular construction are used interchangeably and cover a range of different
approaches and systems. These systems vary depending on the complexity of the elements being
brought together. The simplest are single elements that are clipped together using standard
connections and interfaces. (Bertram et al., 2019)
In this paper, it is referred to as Prefabricated Construction in general which is in terms of the
case including prefabricated structures. Modular Construction also has used the term for the
cases including the volumetric modular characteristic especially.

16
(Source: McKinsey Capital Projects & Infrastructure)
Figure 1. Complexity and Scale of Modular Construction Comparison of Approaches
2.2 Typical Characteristics of Prefabricated Construction
It is well known that prefabricated or modular or construction has gradually replaced the
traditional on-site construction due to the benefits provided, a notably faster time, reduced costs,
better work quality, and fewer environmental impacts. Prefabricated construction guarantees
more control over the quality of components and safety of the construction process. In a precast
concrete construction, for instance, precast members require highly skilled workers, more
complex techniques, and more complex design. Because the design professionals need to

17
concentrate on perfecting the modular design, the intensive administrative work may be
neglected (Molavi and Barral, 2016). Such complexity and quality control can be likely more
efficient through the prefabricated process in the factory than on-site.
In general, the modules or prefabricated components are produced off-site in a factory
environment without exposure to weather. Panelized systems are associated with the off-site
construction technique, where individual wall sections are manufactured without factory
assembly. Unlike in panelized or component-based methods of prefabrication, in modular
construction, most of the interior and exterior finishes are put into place by the factory. The
modules are transported to the building site 80% to 90% complete, where they are assembled and
finished. Because the modules can be constructed while the site and foundation are being
prepared, instead of after, modular construction is thought to reduce construction times by 30%
to 50% (Quale et al., 2012; Smith, 2010).
In terms of the delivery methods, modular construction is an innovative, sustainable construction
delivery method utilizing offsite, lean manufacturing techniques to prefabricate whole building
solutions in deliverable module sections. This process permits constructing a building under
controlled conditions in a factory, using the same materials and designed to the same building
codes and standards as conventionally constructed buildings, but in about half the time. (The
Ultimate Guide to Modular Construction, 2019)
Another significant characteristic of prefabricated construction is on the design repeatability.
Due to the benefit of the same design and codes, prefabrication or modular buildings are
adopting a wide project. In particular, it has further opportunities on healthcare facilities, college
buildings and dormitories and manufacturing buildings types that included data centers, prison,
power plants, and oil refineries. This characteristic has associated with the scheduling and

18
productivity of the whole project. According to the article from Smart Market Report by
McGraw Hill construction, when deciding whether or not to use prefabrication or
modularization, the most important factor is the job site accessibility followed closely by the
number of building stories and the type of building exterior (Bernstein, 2011).

19
CHAPTER 3. TYPES OF PREFABRICATION
3.1 Structural Type of Prefabrication
3.1.1 Steel Frame
Steel frame modular construction is efficient for a high-rise building. The cost-
effectiveness can be enhanced due to the number of repeated modular structures. In terms
of the cost and time saving, the steel frame modular can be the appropriate decision by
building high-rise. However, the connection and joint methods are complex and remain to
solve the on-site process. There are not many buildings built yet a high-rise building, the
construction industry is not familiar and confident for high-rise buildings so far. Figure 2
is one of the highest modular buildings in the U.S.
The steel frame can reuse or recycle with a higher ratio than any other materials. With
steel frames, the walls and roof frames typically joined by using fasteners, bolts, and
rivets. Therefore, at the end of life, steel can be easily disassembled and be highly
recyclable.
Generally, the weight of a steel modular unit is about 15t to 20t, which is 20 to 35%
lighter than a concrete modular unit with a weight of about 20t to 35t. Moreover, the
concrete module has generally more constraints for the open space at the structural design
than steel structures. Whereas steel modular systems have more flexibility in architectural
design owing to the open space framing system and larger modular sizes with beam span
ranging from 6m to 12m (Liew et al., 2019).

20
B2 Pacific Park, Brooklyn (http://www.fulcro.co.uk/)
The B2 Pacific Park project in Brooklyn is the world’s tallest volumetric modular building, with 32
stories, 363 apartments, and 930 modules. The tower was built by Forest City Ratner Companies, with
modules constructed in the Brooklyn Navy Yard, before being shipped to site to be erected.
Figure 2. Steel Frame Modular Building

21
3.1.2 Wood Frame
Until the late 1980s, wood-framed buildings with more than two stories were prohibited
by building regulations in most European countries, due to the negative perceptions
arising from historic city fires. However, driven by the construction Products Directive
adopted towards functional criteria, as opposed to prescriptive criteria, thus allowing a
larger number of stories with a wooden frame throughout Europe. (Nord et al., 2010;
Östman and Källsner, 2011; E. Hurmekoski et al., 2015)
In general, wood is recognized for its sustainability, overall low environmental impact,
natural beauty, and speed of construction than concrete and steel frame. For instance,
cross-laminated timber (CLT) which is a new option for construction mass timber
building offers advantages including renewability of the raw material and low carbon
footprint.
In the prefabricated process, the wood-frame is automated to the max compared to
concrete or steel frame and can be reduced the cost and time for prefabrication and
installation because of the lightweight and high machinability.
22
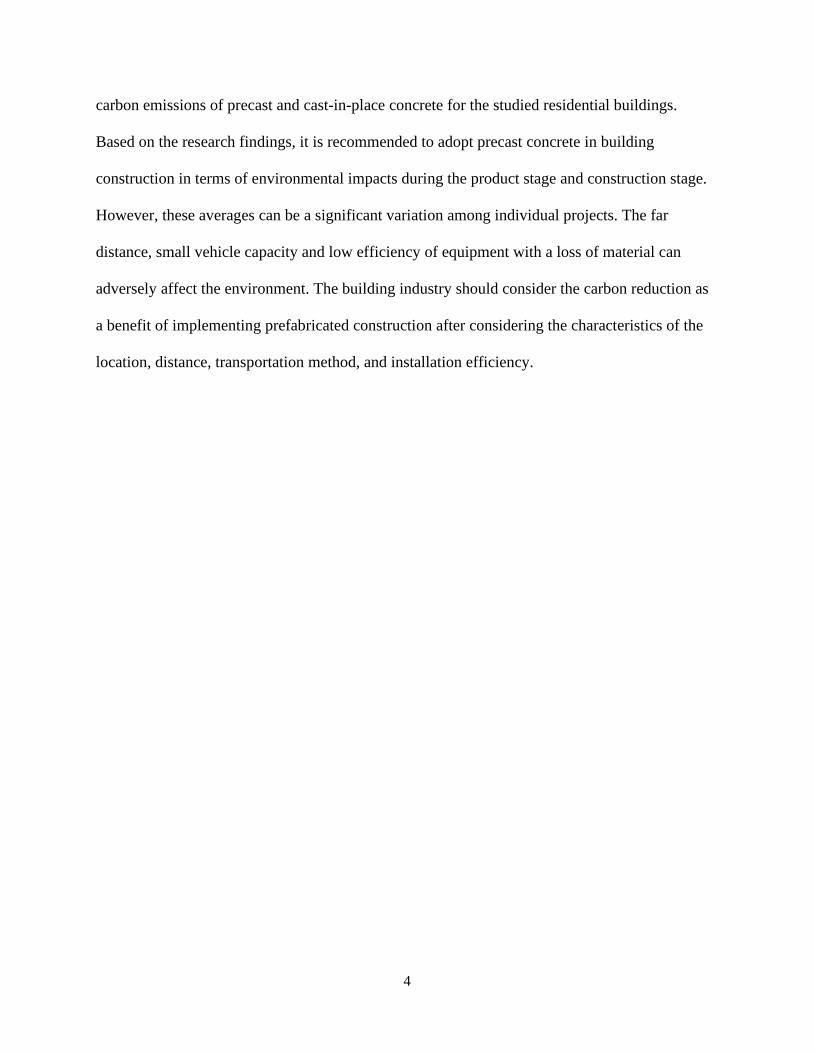
Student housing with wooden modules in Hamburg, (https://www.detail-online.com/)
Prefabricated apartment modules out of cross-laminated timber have found use for student
housing in Hamburg's Wilhelmsburg district thanks to intense collaboration between the client,
the architects at Sauerbruch Hutton, and Kaufmann Bausysteme, the manufacturer of the modules.
A limited number of structural details and restriction to only two module types have brought about
a building that is as efficient as it is inexpensive.
Figure 3. Wood Frame Modular Building
3.1.3 Concrete Frame
Major precast concrete components in building construction are precast facades,
staircases, parapets, partitions walls, semi-precast slabs. In the precast concrete
construction, precast structural members require more complex design and skilled
members for assembly the prefabricated components on the site.
Concrete modular construction is well known for better fire performance and better

23
water-tightness, durable, sound-proof and fire-resistance than other material frames. On
the other hand, they are required heavy equipment and vehicles to control the modules
due to the weight of concrete modular and heavy volume.
Concrete modular systems are preferable in residential buildings because they are
perceived to have better sound and thermal insulation and ease of maintenance. Concrete
modules are less stringent in terms of manufacturing and construction tolerances as their
joints are made by grouting the gaps between the modules and hence on-site correction
can be done during module placement (Liew et al., 2019).
Habitat 67 (Montreal, Quebec), http://www.metromont.com/
Designed by architect Moshe Safdie as part of his McGill University master’s thesis, Habitat 67 was
intended as model housing complex and community building and was constructed to serve as a pavilion
during 1967’s World’s Fair held in Montreal. Habitat 67 utilizes over 350 uniform prefabricated
concrete forms put together in a variety of combinations to form the overall 12-story structure. The
complex was designed to bring together the benefits of urban and suburban living in one building.
Today, Habitat 67 is regarded as an important architectural landmark, and it has become one of
Canada’s most significant and recognizable buildings.
Figure 4. Concrete Frame Modular Building

24
3.2 Fabrication Type and Logistics
3.2.1 Panelized Type
Panelized prefabrication is a construction method where the structural components of a
building, such as walls, roofs, and floor systems are constructed off-site in a factory. And
then it is delivered to the job site to be incorporated into the building and finished
conventionally on-site. Generally, the panels are structural elements and have the very
little infrastructure or other components built into them.
The panels are generally “bare” meaning that they will include the structural members
pre-built so that a wall or floor can come off a truck and be placed into the building. Once
in place, these panels need to be connected or fastened to other structural components in
the field, and generally finished in a conventional way. Wall finishes, plumbing fixtures,
electric and other infrastructure are usually not pre-installed, and need to be installed,
connected and finished in the field. Panelized buildings, therefore, require a considerable
amount of on-site work, but less work than if it were all stick-built in the field. This
system works best for buildings that require wide open spaces and high ceilings. (Deluxe
Modular, 2019)
Using panelized exterior walls are more efficient because construction is possible in
weather unfavorable to site cast concrete, and because the danger of scaffold work is
eliminated. The main disadvantage to these wall panels is the difficulty transporting,
connecting, and erecting panels that may be numerous due to structural limitations
(Building construction: principles, materials, and systems, 2013; Molavi and Barral,
2016).
The assembly work onsite of panelized components is much simpler than a conventional

25
construction, but it is more complex than building together and requires more finishing or
assembling activities on the site. On the other hand, it is much easier to transport a
panelized type than volumetric. Also, the panelized type can offer greater flexibility than
volumetric modules.
3.2.2 Volumetric Type
Modularization is a construction method where an entire unit of a building is constructed
off-site, rather than smaller, structural components as with panelization. Volumetric
Modular units require the least amount of on-site construction time, because all
plumbing, electrical, and even design finishes have typically already been installed in the
facility. This leaves only the task of assembling the modular units together to form a
completed building.
Modular buildings are very versatile and can be designed and built to serve virtually any
function. They are particularly well suited, though, for buildings such as hotels,
apartments, student housing, and any other types that typically consist of many repetitive
units serving similar functions (Deluxe Modular, 2019).
Volumetric construction encourages high prefabrication rate as the modules are
completed with finishes and mechanical, electrical, and plumbing (MEP) in the
controlled environment in the factory.
3.2.3 Logistics
The transport method is closely related to the geographical characteristic of project site and the
type of structure. The benefit of fabricated construction is greater when the distance between off-

26
site construction and job site is closer. The owner can save the delivery time and cost from
factory to on-site. Depends on the selection of the transport method, the schedule and cost can be
affected even though project sites are the same locations.
Geographical Characteristic: The both of distance and location are significant issues
for delivering the prefabricated structure. Because many big cities exist and developed
near the coast, this geographical characteristic can be the advantage to deliver the
volumetric type structure at once. Therefore, in the case the modular manufacturer is
located near the coast, the shipping by sea will the reasonable method to deliver the
volumetric modular structures.
Prefabrication Size: According to the panelized and volumetric type and size,
transportation efficiency is decided. The panelized type can be reduced the total delivery
distance and times, while the volumetric type requires the limited size and weight for
delivery efficiency.
Storage Capacity: Delivery method and scheduling should be considered with the
storage capacity on-site conditions. If there is not enough storage area when the modules
have arrived on site, the advantages of the delivery efficiency of modular construction are
invalid.
Traffic Rules: According to the local regulation, the traffic rules on the road and
required permits should be reviewed before the planning of modular construction. The
road conditions and limitations such as overhead bridges, the narrow width of the road, or
road surface can affect the project schedule and cost.

27
Keetwonen Container Housing project in Holland
(https://www.keetwonenforsale.com/)
Panelized module transportation
(https://www.geo-metrix.ca/)
Volumetric module transportation and stacking on construction site using a tower crane
(McGraw-Hill Construction, 2011)
Figure 5. Transport Method of Panelized type and Volumetric type

28
CHAPTER 4. PREFABRICATED CONSTRUCTION
CONSIDERATION
Construction management can be demonstrated as construction productivity - how well, how
quickly, and at what cost buildings and infrastructure can be constructed - directly affects prices
for homes and consumer goods and the robustness of the national economy. Construction
productivity will also affect the outcomes of national efforts to renew existing infrastructure
systems; to build new infrastructure for power from renewable resources; to develop high-
performance “green” buildings; and to remain competitive in the global market. Changes in
building design, construction, and renovation, and in building materials and materials recycling,
will be essential to the success of national efforts to minimize environmental impacts, reduce
overall energy use, and reduce greenhouse gas emissions (NSTC, 2008; MBI, 2010).
4.1 Schedule
The greatest benefit of modularization is in time saved during construction. Modular
construction reduces construction time by as much as 50%, which translates to an average of a 9-
month construction period as compared to an 18-month construction period, according to the
Modular Building Institute (MBI). This is because the modular units can be constructed in the
factory all while on-site preparation and construction of the foundation occur. For example, the
Hilton Palacio del Rio Hotel in San Antonio, Texas, was built in 1968 for the Texas World’s
Exposition of 1968; it is a 500-room deluxe hotel designed, completed, and occupied in 202

29
working days (Boafo et al., 2016). Quite recently, a Chinese company has built a 57 story, 800
apartment building (called Mini Sky City) in just 19 working days in the Human provincial
capital of Changsha. It was roofed in February 2015 (Boafo et al., 2016). Modular construction is
less affected by the changeable weather environments, the process can be completed as planned
than on-site construction.
(Source: Modular Building Institute)
Figure 6. Streamlined Construction Process
Modular Building Institute describes that there are four stages that make up factory-built
construction. First, design approval by the end-user and any regulating authorities; second,
assembly of module components in a controlled environment; third, transportation of modules to
an ultimate destination; and fourth, erection of modular units to form a finished building (MBI,
2010). The modular construction schedule has benefits for the fast track process. While modules
are being assembled in a factory, site work can be accruing at the same time. This permits earlier
building occupancy and contributes to a much shorter construction period, reducing financing
and supervision costs. In order to reduce the construction schedule, the coordination with
subcontractors is required to thoroughly be reviewed and planned in the early stage.

30
4.2 Cost
The cost of prefabrication can be both an advantage and disadvantage depending on the project
conditions and applied components. Cost advantages related to the factory nature of
prefabrication include avoidance of construction site hindrances and cheaper labor rates for
factory workers as opposed to site workers. Less onsite work contributes to cost savings from
project delivery typically provided by modular building systems decrease construction overhead
costs and financial liability. Another potential cost advantage is an increase in competition for
fabrication and assembly contracts. There are also cost drawbacks to modular construction,
which include increases in design engineering, contract administration, and procurement costs.
(Molavi and Barral, 2016)
Larger modular manufacturers are able to negotiate lower pricing due to volume and
standardization. Many modular manufacturers handle all of their own design work giving them
the ability of standardizing systems, components and assemblies, and specifying their standards
for fabrication – always using the same systems, components, screws, bolts, fastening modalities
and the like. In this way they are able to negotiate better pricing and have the ability to drive
down the cost of the building. (Deluxe Modular, 2019)
In terms of financial income, if construction is completed faster than through conventional
construction methods, the owner can earn the extra rental income. If it is a commercial building,
the financial cost can be increased depends on the use purpose of users. In order to evaluate the
cost of prefabricated construction, life cycle costs can be considered important than the initial
costs per unit.

31
4.3 Quality and Safety Control
Quality of the prefabricated structure frames can be identical control due to the manufacturing
environments. Because the labor skills and occupational environments are less changeable than
the on-site. Panelized and Modular construction is tighter and stronger than conventional
construction methods because of the high level of quality control possible in a controlled indoor
environment with an experienced labor force. Furthermore, workers familiar with their product
can easily integrate materials and techniques into the process when working side-by-side with
individuals of other trades backgrounds (Mohamed et al., 2009). Because modular construction
occurs in a factory, there is improved supervision, access to tools, and on-time material
deliveries. Moreover, most modular manufacturers conduct quality control check and inspection
in the factory before the modules are transported to the construction site.
Safety on the site is an important factor for construction activities. Site conditions such as
inclement weather or poor natural environment lead to higher accident rates. By using of
prefabrication and modularization, the risk from worker accidents and lost time is reduced when
construction work is transferred away from the job site and into a controlled manufacturing
environment. Especially when the project site is including heavy weather conditions, heights,
hazardous operation, congested construction activities, the safety will be more secure and easily
controlled in the factory. For example, the risk of workers' mortality and injuries in the factory
can be decreased by minimizing fall hazards for installing work needing access to roof areas and
controlling the risk of falls from heights during construction activities. Also, the workers in the
factory can be more reliable and familiar in the work environments at the factory than on-site
environments. New workplaces are even more challenging because they required the anticipation

32
of hazards, theoretical calculation of the risks, and the determination of acceptable risks in order
to specify design interventions. (Dennenberg, 2011)
4.4 Opportunities and Limitations
Numerous opportunities are available for architectures, developers, constructor and
manufacturers in prefabricated construction. The latest software and technologies allow greater
automation systems for prefabricated construction. When the advanced technology is applied to
the construction factories, the construction industry can be changed much faster than
conventional construction market. For instance, health care is a sector that is well-suited for
prefabrication techniques. The interior layout of hospital rooms allows for efficient use of
modulization, and it is a sector highly responsive to strategies that shorten schedule (Bernstein,
H. M., 2011). Emerging technologies can offer significant opportunities to improve construction
productivity and sustainability. MBI identified five interrelated activities to improve the
prefabricated construction from among many suggestions (MBI, 2010). (1) Widespread
deployment and use of interoperable technology applications such as BIM (Building Information
Modeling). Use of interoperable technologies can help the speed of project related decision
making; integrated processes; manage supply chains; reduce time; reduce rework; improve the
life-cycle management of buildings. (2) Improved job-site efficiency through more effective
interfacing of people, processes, materials, equipment, and information. (3) Greater use of
prefabrication, preassembly, modularization, and off-site fabrication techniques and processes.
(4) Innovative, widespread use of demonstration installations. (5) Effective performance
measurement to drive efficiency and support innovation.

33
On the other hands, there are some challenges and limitations for conducting the prefabrication
construction, even though lots of technical issues are solved and economic benefits are certain in
specific conditions. The limitations and risks of modular construction should be defined in the
early phase of project management.
Early-stage Decisions: Prefabricated construction required the cost in the early stage
comparing to the conventional construction. Because the assembly and coordination with
MEP design are completed earlier than on-site construction, the owners have burdens and
risks for the overall cost management from the early phase of construction.
In terms of the design, modular construction is based on the concept of repetition of
design and the design should be confirmed in advance compared to the conventional
method. When the architecture’s design does not have a repeated module or component,
the advantages of prefabricated construction can be reduced. This limitation should be
considered and adjusted the scope and assembly of components in advance for
overcoming the drawbacks.
Manufacturer Capacity Limitation: The modular construction market is not yet fully
developed and it is still a growing industry. Therefore, the manufacture’s lacking capacity
can be the obstruction of the productivity, in the case of that a mega project required a
large volume of modules in the limited time than feasible capacity.
Quality Problems: The productivity and efficiency of modular construction are not yet
fully maximized because there is still much labor work involved in the factory as well as
at construction site. This is because the initial investment cost in automation technologies
is high and there is a lack of skilled labor in construction. The manufacturing of modular

34
units sometimes still involves conventional panelized casting, followed by assembly of
panels into modular unit. This causes error in verticality and horizontality of the modular
that might lead to the uneven surface at the gap between two modules and subsequently
lead to water tightness problems (Liew et al., 2019).

35
CHAPTER 5. SUSTAINABILITY CONSIDERATION
Recently, sustainability in the construction sector has become increasingly important, more than
ever before. Prefabricated construction easily incorporates sustainability through the use of
recycled materials, high-efficiency mechanical systems, sustainable wood, and low-flow fixtures.
Also, it can be easily applied to more energy-efficient designed buildings such as ventilation
systems, tight envelopes, and smart lighting to achieve energy savings.
5.1 Needs for Sustainable Construction
Construction of commercial buildings has an environmental impact because of emissions from
nonroad equipment. Construction produces 7% of the U.S. greenhouse gas emissions, of which
76% originates from engines. (Marshall et al, 2012). It means that if we reduce the use of
equipment and reduce the CO2 emissions from the equipment or vehicles, there is a lot of
potential for reduction of environmental impact by construction activities.
In addition, there are many potential sources in the construction phase with impacts that are
discussed. Gangolells and colleagues (2009) found that transportation and construction
equipment, waste production, and water consumption all had significant environmental
consequences, implying that any improvements in these areas could be priority targets for
reducing the overall life cycle impact of the building (Quale et al., 2012). Sustainability is not
just about environmental issues, it also encompasses social progress and this is key to the
governmental, institutional and executive agencies’ strategic responses to the sustainability
36
agenda. Sustainable development means meeting needs in ways which deliver social progress,
protection of the environment, better resource use, economic growth and employment. It requires
a stable and competitive economy. Greater resource efficiency lies at the heart of the sustainable
development challenge for construction. (DETR, 2000)
In prefabricated construction, consolidating work at a factory can reduce the CO2 emissions
resulting from the transport of materials and laborers as well as from construction operations.
Moreover, at the level of site environments, the prefabricated building is able to minimize the
environmental impacts of neighboring residents or the surrounding natural environment by
reducing the various type of pollutions such as construction noise, dust, and water contamination.
5.2 Three Elements of Construction Sustainability
The strategy for more sustainable construction is a significant milestone on the road to a more
socially and environmentally responsible, better-regarded construction industry. It creates a
framework within which the industry can make a strong contribution to the better quality of life
signaled by our sustainable development strategy (DETR, 2000). Besides, the activities of
construction industries are major factors affecting climate change and environmental pollutions
in the world. Therefore, the awareness and strategies for sustainable construction are important
for all of us. In general, the below three are considered as major elements for sustainability with
balance.
Environmental Efficiency: Sustainability in construction needs to minimize
environmental damage, pollution, and exhaustion of resources. For example, off site

37
manufacturing such as precast concrete and increase use of self-compacting concrete on
site (no need for vibration compacting) help reduce noise pollution on construction sites.
Social Acceptance: In order to implement sustainability, there are required the social
acceptance and awareness of climate change and its impact. Advanced knowledge and
scientific data can be helpful for a change of awareness and decision making for
sustainable construction.
Economic Feasibility: In the Cambridge dictionary, it means the degree to which the
economic advantages of something to be made, done, or achieved are greater than the
economic costs. In order to promote sustainable construction, the economic environment
should be effectively maintained in business.
Figure 7. The Three Elements of Sustainable
Prefabricated construction is well known a smaller impact on social and environmental impact
because project proceed a limited time than conventional construction. Jaillon (2008) conducted
research that the sustainable construction aspects of adopting prefabrication in high-rise
buildings are examined, and the economic, environmental and social aspects of using
Sustainability
Environmental
efficiency
Social acceptance
Economic
feasibility

38
prefabrication are assessed. And the findings revealed that environmental, economic and social
benefits of using prefabrication were significant when compared to conventional construction
methods. (Jaillon and Poon, 2008)
5.3 Life Cycle Assessment
When looking at the environmental impact of a building, it is important to assess every stage of
the environmental life cycle, from material extraction, manufacturing, and construction. The
LCA (Life Cycle Assessment) includes building operations and the end-of-life stage where the
building is demolished and reused or discarded. However, the process of conducting an LCA is
complicated. Applied factors should have information such as site specifications, all the related
components or material types, and construction methods, as well as it is difficult to track down
the required data and finds meaningful results. Despite the several restrictions, LCA is the most
comprehensive approach to determining the environmental life cycle impacts of a building and
can be used as a tool to make design decisions that would result in the lower environmental
impacts. Therefore, many researchers have used LCAs to examine the potential environmental
impacts of building and construction. Considering GHG emissions, which is one of the impact
measurements for estimating the LCA results, as well in a study of residential buildings is one of
the analyzing methods. In many cases, however, researchers have only conducted partial LCAs
and choose to limit the scope of an LCA by excluding certain life cycle stages because of the
lack of data or scope of research. Because LCA is still a relatively new science and can be
extremely time consuming and expensive to conduct.

39
In the building, LCA is applied from raw materials extraction to final disposal phase with several
stages. There are several types of cycles that can be applied to research such as ‘cradle to grave’,
‘cradle to site’, and ‘cradle to cradle’ of the closed-loop life cycle. Figure 8 shows an example of
the LCA boundary system. This case study is adopted the partial LCA concept of ‘cradle to gate’
among the whole concept of ‘cradle to grave’ for boundaries. The prefabricated building of the
case study has been conducted the partial LCA focused on the main structural materials such as
steel and concrete. The detailed description has been explained in Chapter 7.
Source: An optimization system for concrete life cycle cost and related CO2 emissions [sustainability 2006]
Figure 8. System Boundary of Concrete Life Cycle Assessment (LCA)

40
CHAPTER 6. CASE STUDY OF ENVIRONMENTAL
IMPACTS
6.1 Case Study Objective
The researcher determined that conducting a case study was crucial for identifying and
understanding the areas in which environmental decision-making would be useful. In this
research, the objectives of the study to find the environmental impacts of prefabricated
construction included the following.
to identify and quantify the amount of carbon dioxide emissions in precast and the CIP
concrete method by collecting data
to quantify and assess the carbon dioxide emissions in precast and CIP concrete which
factors may be affected and how they may be affected
to find a way to promote positive or mitigate adverse environmental impacts through
comparison of the case study with a CIP concrete method
6.2 Methodology
6.2.1 Process of Case Study
The research for the calculation of CO2 emissions was conducted in two ways. Firstly, the
primary method was through a survey on literature and data inventories for CO2 emissions of
construction. In addition, equipment use hours or material quantities for analysis were estimated
based on professional’s interviews, collected data, and drawings provided by the precast concrete

41
manufacturer. Secondly, the analysis of CO2 emissions was comparing between precast and CIP
concrete as variable criteria of scenarios. In order to demonstrate how the prefabricated module
differs from the conventional method as an environmental perspective, that methodology had
been set up. Figure 9 shows the methodology process for this case study.
Figure 9. Case Study Methodology Process

42
6.2.2 Scenario Analysis Methodology
The scenario basis of various criteria such as distance, material, delivery vehicle size, and
equipment type had used for the case study project’s evaluation conditions in order to quantify
the amount of CO2 emissions. In this case study, the purpose of scenarios was not to make
accurate predictions or confirm expectations. The primary aim is that the scenarios and criteria
are to find determinants for future consideration of environmental impacts on prefabricated
construction. The scenario overview and conditions are described in section 7.5.
6.3 Case Study Project Information
Location and Layout: The project of the case study has located in the urban area of
South Korea where is 80km away from the precast concrete factory. The project consists
of separated two blocks. Figure 11 shows the layout of Block A (153 units). One building
has been attached and comprised of two to eleven units of residential housing. The
information on the building is indicated in Table 1.
Housing Units: A total of 203 housing units which are assembled by Precast panelized
modules are residential buildings of 84 m2 (904 ft2) area. All units are three floors having
six types of plans. The structures of prefabricated concrete had designed modules of a
type of wall, column, girder, stairs, HCS (hollow core slab), reinforced concrete slab and
solid slab. Figure 10 shows the typical type of housing unit.
Construction Schedule: The schedule from production to installation on-site was
completed within eleven (11) months. The installation on-site schedule has been
considered six (6) months in this case study.

43
Unit Type Unit Area
(m2)
Unit Area
(ft2)
A Block
(17 buildings)
B Block
(11 buildings)
Total
Unit
A ~ F type 84m2 904 ft2 153 50 203
Table 1. Case Study Residential Housing Units
Figure 10. Typical Type Images of Case Study Residential Building
Figure 11. Case Study Block A (153 units) Layout Image
http://patio.switzen.com/web/planning.htm
http://patio.switzen.com/web/vr.htm

44
6.4 Case Study Boundary
Regarding the quantification of CO2 emissions, the basic groups of case studies are confined as
the precast and CIP concrete construction methods. The boundary of CO2 emissions of each
method can be divided as two-stage of ‘Product Stage’ and ‘Construction Stage’. The estimation
of CO2 emissions on a case study is including components, fabrication, transportation, and
installation process of precast and CIP concrete. The evaluated values of the product stage have
used the concept of LCA (cradle to gate). The CO2 emissions values as precondition data are
based on the existing data inventories or related literature. CO2 evaluations of precast concrete
including prefabrication, transportation, and on-site installation process are determined by the
provided actual data of this project by the manufacturer, while all CO2 emissions of CIP concrete
are estimated by the scenarios.
The general LCA process includes four stages as described in Chapter 6. However, the
researcher has only selected the product stage and construction stage for this case study because
of the following reasons. Firstly, after the construction stage, the utility usage and operation
method can be various due to numerous additional factors. Also, it is difficult to track data in a
limited time to compare the difference. The comparison results after the construction stage may
be affected not only by the characteristic of precast and CIP concrete but also by the other
materials, design, location, and construction methods. Secondly, in the event that the comparison
scope is narrow and specific, the comparison data accuracy can be greater than in the wide scope.
If there are combine all related data, the analysis outcomes of comparison and correlations of
precast and CIP may be devalued. The researcher has determined and designed the case study
boundary in order to enhance the accuracy and convince the outcomes as focused on the product
stage and installation of precast and CIP concrete.
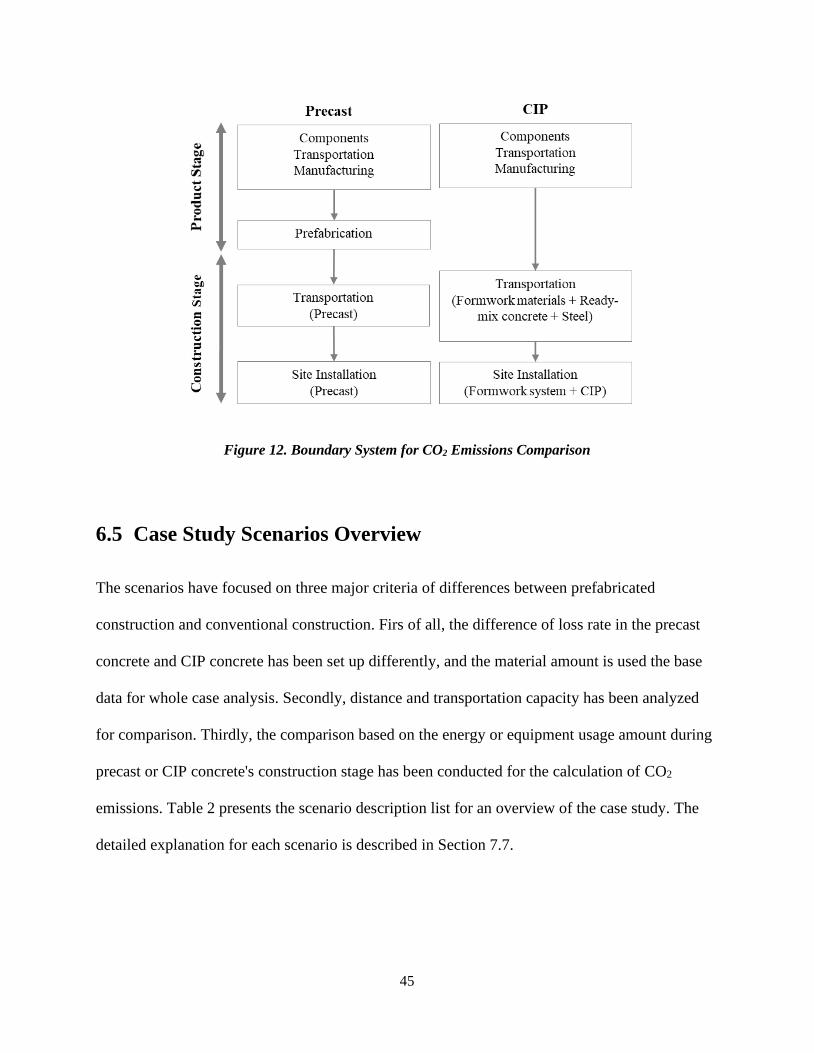
45
Figure 12. Boundary System for CO2 Emissions Comparison
6.5 Case Study Scenarios Overview
The scenarios have focused on three major criteria of differences between prefabricated
construction and conventional construction. Firs of all, the difference of loss rate in the precast
concrete and CIP concrete has been set up differently, and the material amount is used the base
data for whole case analysis. Secondly, distance and transportation capacity has been analyzed
for comparison. Thirdly, the comparison based on the energy or equipment usage amount during
precast or CIP concrete's construction stage has been conducted for the calculation of CO2
emissions. Table 2 presents the scenario description list for an overview of the case study. The
detailed explanation for each scenario is described in Section 7.7.

46
Process Variation Scenario
Classification Description of Scenario
Material Loss Precast Precast concrete 3% material loss
CIP Concrete 5%, Steel bar 10% material loss
Transport
Distance
A1 Precast Precast factory to Site 80km
CIP Manufacturer to Site 80km, temporary materials 160km
A2 Precast Precast factory to Site 50km
CIP Manufacturer to Site 50km, temporary materials 100km
A3 Precast Precast factory to Site 20km
CIP Manufacturer to Site 20km, temporary materials 40km
Vehicle
Capacity
B1 Precast Vehicle capacity 25ton
CIP Vehicle capacity 25ton, Ready Mix Concrete truck 14ton
B2 Precast Vehicle capacity 10ton
CIP Vehicle capacity 10ton, Ready Mix Concrete truck 14ton
Fabrication
&
Installation
Equipment Precast Equipment energy use for Precast concrete in Factory
Equipment
Use hour
Precast Equipment energy use for Installation of Precast concrete on-site
for 6 months
CIP Equipment energy use for CIP on-site installation for 9 months
Table 2. Scenario for CO2 Emissions Comparison
6.6 Data Collection for Preconditions
The first step of the case study assessment was data collection for CO2 emissions of the product
stage and construction stage on precast and CIP concrete. A wide and varied range of factors and
data were required in order to calculate the CO2 emissions of the case project. Even though there
are some LCA data inventories and software tools that are directly applicable, the researcher has
selected the CO2 emissions values in several databases. The researcher has considered that this
method can find and apply more accurate figures for estimation.
Especially, through a wide range of published information sources such as research papers and
institution's data inventories had been reviewed to assess CO2 emissions of concrete, steel, and

47
vehicles’ fuels. The following (Table 3) is showing the preconditions for calculation of the CO2
emission which is applied to this research. In the case of CO2 emissions of the equipment has
been converted from data of the amount of diesel or electricity usage.
6.6.1 CO2 Emissions of Concrete and Steel
Concrete: The amount of CO2 emission from the concrete production stage has
calculated by the sum of the quantity of each ingredient used for producing per 1 m3 of
concrete. The base units of the CO2 emission for cement, aggregate, and water had been
based on the Korea LCI (Life Cycle Inventory) database (DB). In addition, blast furnace
slag, fly ash, and chemical admixtures which are not database units in Korea, were
applied to the overseas LCI database (Kim, 2016). Kim focused on developing an
optimization system, dubbed the concrete life cycle assessment system, to recommend
options to help minimize CO2 emissions and the cost incurred at every stage of the
concrete production process. In Kim’s research, applying the optimized design, the
concrete CO2 emissions could be reduced by 34%, 225.7 kg- CO2/ m3 from 340.9 kg-
CO2/ m3. In this case study, 340.9 kg- CO2/ m
3 has been applied to concrete CO2
emission calculations as a common condition of construction.
Steel (Rebar): The basic unit of CO2 emissions of steel was used as the type of rebar for
residential construction. The residential rebar is used for the girder, column, slab, and
wall from 10mm to 22mm size. Lee (2012) use 4,002.04 kg- CO2/ton for his research for
a comparison of the CO2 emissions of the enhanced GF (Green Frame) and existing GF
design for an apartment building in South Korea (Lee et al., 2012).

48
6.6.2 CO2 Emissions of Transportation
The transportation sector is one of the largest contributors to anthropogenic U.S.
greenhouse gas (GHG) emissions. According to the Inventory of U.S. Greenhouse Gas
Emissions and Sinks 1990-2017 (the national inventory that the U.S. prepares annually
under the United Nations Framework Convention on Climate Change), transportation
accounted for the largest portion (29%) of total U.S. GHG emissions in 2017. Cars,
trucks, commercial aircraft, and railroads, among other sources, all contribute to
transportation end-use sector emissions (EPA, 2019). Reduction in carbon emissions in
transportation can play an important role in energy conservation and environmental
impact reduction.
Figure 13. 2017 U.S. GHG Emissions by Sector
(https://www.epa.gov/greenvehicles)
Figure 14. 2017 U.S. Transportation Sector GHG Emissions by Source
(https://www.epa.gov/greenvehicles)

49
Heavy Duty Truck: According to the EPA’s data source, heavy duty trucks had
contributed the second portion (23%) of transportation GHG emissions in 2017 (See
Figure 14). For this case study, CO2 emissions of heavy-duty trucks (rigid type) data has
based on the TRACCS database (https://traccs.emisia.com/index.php) of vehicle model
year 2010 in UK. The database of road transport has fuel consumption, fuel consumption
factors and CO2 emissions according to vehicle capacity.
Ready Mix Concrete Truck: The RMC trucks weigh 20,000 to 30,000 pounds (9,070 to
13,600 kg) and can carry roughly 40,000 pounds (18,100 kg) of concrete although many
varying sizes of mixer trucks are currently in use. The most common truck capacity is 8
cubic yards (6.1 m3) (https://en.wikipedia.org/wiki/Concrete_mixer). In this study, ready
mix concrete vehicle capacity has considered as 8 cubic yards (6.1 m3). Therefore, the
CO2 emissions of the RMC truck have considered as the scope of heavy-duty trucks
(Rigid 12-14t) and calculated to 0.465 kg CO2 per km.
6.6.3 CO2 Emissions of Equipment and Utilities
On-site placement activities (fuel, pumping, vibration): Due to the limitation of the
case study, the activities for onsite placement used to existing data from the literature. It
has including the power and energy consumptions for pumping and vibration for concrete
placement. The on-site placement activity has contributed to the CO2 emissions 9.0 kg-
CO2 per m3. The equipment for erecting, temporary materials installation, materials
moving on-site has not been considered here.
Equipment on-site installation: CO2 emissions for installation have considered tower

50
crane and forklifts as major energy consumption of installation on-site. Other activities or
factors have not added for the calculation due to the wide range of uncertainty and
limitation for measurement.
Fuel and Electricity: The basic precondition units for diesel (2.68 kg CO2/liter) and
electricity (1.35kg CO2/kWh) have been used from the database of U.S. Energy
Information Administration Estimates. These units are also applied to equipment
calculation after transformed computation.

51
Phase Description CO2 emission Author/s or
References
CO2 emission
used in this study
Applied
Method
Material
Production of
Ready-mix
Concrete
340.9 kg-CO2/m3
330 kg-CO2/m3
(Kim et al., 2016)
(Flower and Sanjayan,
2007)
340.9 kg-CO2/m3 Precast, CIP
Production of steel
bar
4002.04
kgCO2/ton (Lee et al., 2012)
4002.04
kgCO2/ton Precast, CIP
Transportation
(Vehicle)
Heavy Duty Trucks
(Rigid 7.5-12t) 0.440 kg CO2/km
TRACCS (Model year
2010) Fuel
consumption factors
140 (g/km)
0.465 kg CO2/km Precast,
CIP
Heavy Duty Trucks
(Rigid 12-14t) 0.465 kg CO2/km
TRACCS (Model year
2010) Fuel
consumption factors
148 (g/km)
0.465 kg CO2/km Precast,
CIP
Heavy Duty Trucks
(Rigid 14-20t) 0.543 kg CO2/km
TRACCS (Model year
2010) Fuel
consumption factors
173 (g/km)
0.543 kg CO2/km Precast,
CIP
Heavy Duty Trucks
(Rigid 20-26t) 0.656 kg CO2/km
TRACCS (Model year
2010) Fuel
consumption factors
209 (g/km)
0.656 kg CO2/km Precast,
CIP
Concrete and
Rebar
Prefabrication
Activities for
concrete and
rebar
(factory use)
Fuel (Diesel)
10.16 kg
CO2/gallon
(2.68 kg
CO2/liter)
3.0 kg CO2/liter
U.S. Energy
Information
Administration
estimates
(Flower and Sanjayan,
2007)
2.68 kg CO2/liter Precast
Electricity factor
(0.52114-
0.74884) kg
CO2/kwh
1.35 kgCO2/kWh
(Brander et al., 2011)
U.S. Energy
Information
Administration
Estimates
1.35kgCO2/kWh Precast
On-site
placement
activities
Onsite placement
activities
(fuel, pumping,
vibration)
9.0 kg-CO2/m3
(Ghayeb et al., 2020;
Flower and Sanjayan,
2007 )
9.0 kg-CO2/m3 CIP
Equipment
on-site
installation
Folk lift
(75<HP≤100,
Diesel)
29.8 kgCO2/Hour (Marshall et al.,2012) 29.8 kgCO2/Hour CIP
Crane 25t
(9.6 L/h, Diesel) 25.7 kgCO2/ Hour (Lim et al., 2015) 25.7 kgCO2/ Hour CIP
Crane 50t
(15.5 L/h, Diesel) 41.5 kgCO2/ Hour (Lim et al., 2015) 41.5 kgCO2/ Hour Precast
Table 3. Preconditions of CO2 Emissions for Scenario Criteria

52
6.7 Data Analysis
6.7.1 Material Loss and CO2 Emissions
The total materials (concrete and steel bar) weight of the project which is design-based
quantities was obtained by the precast manufacturer. For comparing the weight of precast
and CIP, it was assumed that the designed quantities are identical, but the loss rate is
different. The loss rate for precast concrete including steel is 3%, whereas the loss rate
for CIP concrete is 5% and the steel bar is 10%. Because the prefabricated component is
easier to control the waste materials by fabrication and less damaged compared to on-site
materials. In addition, the loss rate of the CIP concrete has estimated including not only
for fabrication but also for the waste from the job site. Because the extra materials of
concrete and collected leftovers of steel bars from job sites are eventually discarded.
There may be other possibilities that depend on the detailed design and construction
method, the materials can use more for modular construction due to the overlapped slab
or wall design. Therefore, the quantities of materials should be compared and considered
to construct a green building in advance. Table 4 shows the amounts of materials
quantities and CO2 emissions.
Material Designed
Quantity
CO2 Emissions
Unit
CO2 Emissions
kg-CO2
Precast concrete based
on case study
(loss 3%)
CIP concrete
(loss 5% for concrete,
loss 10% for steel bar)
Concrete 17,925 m3 340.9 kg-CO2/m3 6,293,951 6,416,164
Steel bar 2,410 ton 4002.04 kg-CO2/ton 9,934,264 10,609,408
Total CO2
Emissions - 16,228,215 17,025,572
Table 4. Concrete and Steel Bar Quantities and CO2 Emissions Calculation

53
As a result of the calculation of the CO2 emissions of materials in this case study, steel
materials consist of 61% of the total CO2 emissions of precast and concrete components
consist of 39%. Therefore, it can be found that the steel materials' impact of CO2
emissions had been larger than the concrete materials (See Figure 15). Moreover, since
the impact of the material loss rate of steel (10%) has higher than precast (3%) when the
materials are fabricated on-site, CIP may be more affected by the steel materials than
precast.
Figure 15. Comparison of CO2 Emissions of Concrete and Steel bar
6.7.2 Transportation (Distance)
In the prefabricated construction, transportation distance which is the distance of the
factory to the site may be one of the most significant determinants to select the
prefabrication method. In the case of the distance or location is not suitable for the deliver
the prefabricated modules, the project productivity can be reduced. Also, the
0
2,000
4,000
6,000
8,000
10,000
12,000
Precast CIP
CO2 Emissions of Concrete and Steel (ton-CO2)
Concrete Steel bar

54
transportation distance should be considered not only for the impact on time or cost but
also for CO2 emissions as a significant impact. The heavy-duty trucks are causing the
most CO2 emissions as the second of the transport sector.
Scenario A1, A2, and A3 have performed to compare the impact of materials
transportation distance between the panelized precast and CIP concrete method. In the
precast concrete, 80km is the actual distance from the factory to on-site. When the
distance between the prefabrication factory and the construction site is getting closer, the
environmental impact can decrease and the productivity may increase. Scenario A1 has
been estimated with the amount of CO2 emissions based on distance 80 km, Scenario A2
was based on 50 km, and Scenario A3 was based on 30 km. Through scenario A1, A2,
and A3, the researcher has compared how much difference and degree of the
environmental impact through estimating CO2 emissions of both precast and CIP
concrete.
Regarding the materials to be delivered, scenarios about transportation have added the
temporary materials for CIP such as Euro-form panels, scaffoldings, and pipes. In order
to estimate the weight of temporary materials, there are several preconditions.
(a) Building Layout: The amounts of temporary materials have been calculated based on
one building that is attached in a row with seven housings. It means that the overlapped
wall has not been calculated for the temporary materials. (b) Form use cycle: It has
assumed that Euro-form panels which may be used on-site, the recycle times of wood
panels of Euro-form are limited as five reuse-cycle times. Also, it has been considered
that a total of four sets may be used on-site at the same time. The detail calculation data
table of the temporary materials is attached to the Appendix.

55
Precast
Concrete
Case
study
Material
Amount
(ton)
loss 3%
Vehicle
Capacity
(ton)
CO2
Emissions
kg
CO2/km
Vehicle
Q’ty
Scenario A1 Scenario A2 Scenario A3
Distance
to site
(km)
CO2
Emission
kg CO2/km
Distance
to site
(km)
CO2
Emission
kg
CO2/km
Distance
to site
(km)
CO2
Emission
kg
CO2/km
Heavy
Duty
Truck
(Precast)
44,947 25 0.656 1,798 80 94,535 50 58,970 20 23,588
Table 5. CO2 Emissions for Transport (Scenario A-Distance) of Precast
CIP Material
Amount
Vehicle
Unit
CO2
Emissions
/vehicle
Vehicle
Q’ty
Scenario A1 Scenario A2 Scenario A3
Distance
to site
(km)
CO2
Emission
(kg CO2)
Distance
to site
(km)
CO2
Emission
(kg CO2)
Distance
to site
(km)
CO2
Emission
(kg CO2)
Ready-Mix
concrete
(5% loss)
18,822 m3 6m3 per
Vehicle
0.543 kg
CO2/km 3,137 80 136,271 50 85,170 20 34,068
Steel Bar
(10% loss) 2,651 ton 25 ton
0.656 kg
CO2/km 107 80 5,615 50 3,510 20 1,404
Placement
Formwork
materials
132 ton 25 ton 0.656 kg
CO2/km 6 160 630 100 394 40 157
Scaffolding
Materials 334 ton 25 ton
0.656 kg
CO2/km 14 160 1,469 100 918 40 367
Total (CIP Transport Scenario) - 143,986 - 89,991 - 35,996
Table 6. CO2 Emissions for Transport (Scenario A-Distance) of CIP
As a result of this scenario study, the interval of the difference in CO2 emission of precast
and CIP is getting smaller when the distance is getting closer. Figure 16 presents the
result of the CO2 emissions for transportation distance of 20km, 50km, and 80km. There
are two different slopes in the graph and the CIP's slope has more slant than precast. For
instance, in the case of the distance is far more than 80km, which is the actual distance
from the factory to site, the difference of both CO2 emissions will be getting larger than
close distance.

56
The difference between precast and CIP in the graph is the sensitivity for environmental
impacts level about the distance. Therefore, we can determine that CIP has more
environmental impact sensitivity than precast according to distance from factory to site.
Regarding the sensitivity of the CO2 emission by distance, Figure 17 shows the CO2
emissions of precast and CIP based on the CO2 emissions baseline of 80km.

57
Figure 16. CO2 Emissions of Transportation Distance
Figure 17. CO2 Emissions Sensitivity for Distance
0
20,000
40,000
60,000
80,000
100,000
120,000
140,000
160,000
A1 (80km) A2 (50km) A3 (20km)
CO2 Emissions of Transportatiion Distance (kg CO2)
Precast CIP
0 50,000 100,000 150,000 200,000 250,000 300,000
20 km
50 km
80 km
110 km
140 km
Sensitivity for Distance (kg CO2)
Precast CIP

58
6.7.3 Transportation (Vehicle Capacity)
Scenario B1 and B2 are for comparison of the correlation and impact between vehicle
capacity and CO2 emissions amount of precast and CIP respectively. In order to compare
the CO2 emissions of precast and CIP concrete, the two types of truck capacity have been
considered. Scenario B1 has evaluated for 25t vehicle capacity and Scenario B2 is
evaluated for 10t vehicle capacity.
In this project, most of the precast concrete is panelized type structures for wall, column,
girder, and slab. Therefore, in order to select a type of heavy-duty truck, weight is the
primary factor rather than the volume of precast. In the case study, trailers and cargo
trucks of 25t capacity have been mainly used for panelized precast concrete delivery
(Figure 18).
Transport Type: Cargo Truck (25t)
Materials: Column, beam, slab, stairs, (low) wall
Transport Type: Trailer (25t)
Materials: Wall
Figure 18. Transportation Type for Panelized Module of Case Study

59
Precast
Concrete
Case study
Material
Amount
(ton) loss
3%
Distance
to site
(km)
Scenario B1 Scenario B2
Vehicle
Capacity
(ton)
Vehicle
Q’ty
CO2
Emissions
/vehicle
CO2
Emission
(kg CO2)
Vehicle
Capacity
(ton)
Vehicle
Q’ty
CO2
Emissions
/vehicle
CO2
Emission
(kg CO2)
Heavy Duty
Truck
(Panelized
Precast)
44,947 80 25 ton 1,798 0.656 kg
CO2/km 94,353 10 ton
0.440 kg
CO2/km 4,495 158,213
Table 7. CO2 Emissions for Transport (Scenario B-Vehicle) of Precast
CIP Material
Amount
Distanc
e to site
(km)
Scenario B1 Scenario B2
Vehicle
Unit
Vehicle
Q’ty
CO2 Emissions
/vehicle
CO2Em
ission
(kg
CO2)
Vehicle
Unit
Vehicl
e Q’ty
CO2 Emissions
/vehicle
CO2
Emission
(kg CO2)
Ready-Mix
concrete
(5% loss)
18,822
m3 80
6m3 per
Vehicle 3,137 0.543 kg CO2/km 136,271
6m3 per
Vehicle 3,137 0.543 kg CO2/km 136,271
Steel Bar
(10% loss)
2,651
ton 80 25 ton 107 0.656 kg CO2/km 5,615 10 ton 266 0.440 kg CO2/km 9,363
Placement
Formwork
materials
132 ton 160 25 ton 6 0.656 kg CO2/km 630 10 ton 14 0.440 kg CO2/km 986
Scaffolding
Materials 334 ton 160 25 ton 14 0.656 kg CO2/km 1,469 10 ton 34 0.440 kg CO2/km 2,394
Total 143,986 149,014
Table 8. CO2 Emissions for Transport (Scenario B-Vehicle) of CIP
As a result of the scenario about vehicle capacity, in the event of the required materials
has delivered by trucks of 10t capacity, there was no benefit for the precast than CIP in
terms of transportation. However, when the vehicle capacity has 25t for material delivery,
CO2 emissions can be reduced by 45% compared to the CIP concrete process. In this case
study, the manufacturer has actually used 25t capacity trucks for the delivery of precast
concrete from the factory to the construction site. But, the weight of the temporary
materials such as pipes, euro-forms, and scaffolding materials can be increased or
decreased depends on the on-site scheduling and construction method, the impacts of
CO2 emissions may be varying based on the conditions.

60
The weight of precast concrete is a decisive factor for delivery rather than the volume
since the shape of most of the precast was by panelized type. In Figure 19, the reason
why the graph has a gentle slope for CIP than precast is that the vehicle capacity of RMC
(ready-mix concrete) is the fixed figure as the weight for 6 m3 volume of concrete. That
volume is a concrete batching capacity installed in the vehicle, and then the capacity of
the vehicle has been considered as the type of heavy-duty trucks (Rigid 12t-14t).
Therefore, when the CIP concrete method has a fixed delivery capacity for RMC, only
the weight of the steel bar has been evaluated to the variable factors in the scenarios. As a
result, there is a finding that precast has more sensitive for vehicle capacity.
Figure 19. Comparison of CO2 Emissions of Transport Vehicle between Precast and CIP
0
20,000
40,000
60,000
80,000
100,000
120,000
140,000
160,000
180,000
B1 (25ton) B2 (10ton)
CO2 Emissions of Transfortation Capacity (kg CO2)
Precast CIP

61
Figure 20. CO2 Emissions Sensitivity for Vehicle Capacity
Figure 20 shows more obvious figures related to the sensitivity of the CO2 emission for
the vehicle capacity of precast concrete. The graph bars illustrating as CO2 emissions
show the difference between precast and CIP results. The baseline has based on the 25t
vehicle capacity in the event of the distance 80km. This is equal to the actual condition of
the precast delivery condition of the case study.
CIP method has almost similar CO2 emissions from 15t to 30t, while CO2 emissions of
precast have a sharp drop compared to CIP when the vehicle capacity has changed from
10t to 25t. Also, when they use 25t vehicle capacity for precast delivery, it is expected
that the CO2 emissions may the lowest degree.
90,000 100,000 110,000 120,000 130,000 140,000 150,000 160,000 170,000
10t
15t
20t
25t
30t
Sensitivity for Vehicle Capacity (kg CO2)
Precast CIP

62
6.7.4 Fabrication and Installation
Comparison of CO2 emissions by fabrication and installation activities of precast and CIP
concrete has been evaluated based on several assumptions which include equipment use-
hour and major equipment types. In regards to the prefabrication process of precast,
however, the data such as usage of the fuel, electricity, and equipment of precast has
based on the actual data provided by the manufacturer.
The reflected utility usage is the data from the bills presented during June of 2019. In
June, the operation of the factory capacity was approximately 99% of the productivity of
the factory, and it produced a total of 35,983 tons of precast concrete. As a result of the
calculation (see Table 9). CO2 emissions for prefabrication activity in the factory have
evaluated as 11.3 kg CO2 per ton.
In order to compare CO2 emissions of installation activity, preconditions and baseline for
calculation are under the distance 80km from the factory to site, crane capacity of 50t
(8ea) for precast, crane capacity of 25t (4ea) for CIP, and 1.5 times longer schedule of
CIP than precast concrete.
For on-site installation of CIP concrete, the construction schedule has 9 months which is
considered as 3 months longer than the precast concrete on-site installation schedule.
Additionally, temporary structures (formwork, supporters, scaffolding) are estimated
retrospectively with varying degrees of assumptions for CIP concrete. The detail
assumptions and calculation are described in Table 9 and Table 10.

63
Activity Evaluation CO2
CO2
Emission
(kg CO2)
Reference/ Assumption
Off-Site Prefabrication
(energy use for concrete and
rebar)
44,947 ton
(3% loss for
precast)
[b]11.3 kg-CO2/ton 507,901
Based on total utility usage
at factory equipment and
operation (June 2019, 99%
operation)
On-Site Installation
(Crane) [a] 7,680 hours 41.5 kg CO2/hour (50t) 318,720
6 months for precast
installation
Total 826,621
[a] (8 hour/day * 20 day * 6 month) * 8 Crane =7,680 hours [b] (1) + (2) =11.3 kg-CO2/ton
(1) Diesel: (12,197 Liter) x (2.68 kg CO2/liter) / (35,983 ton) =0.908 kg CO2/ton
(2) Electricity: (279,049 kwh) x (1.35kgCO2 per kWh) / (35,983 ton) = 10.469 kg CO2/ton
Table 9. CO2 Emissions for Fabrication and Installation of Precast
Activity Evaluation CO2 CO2
Emission
(kg CO2)
Reference/
Assumption
On-Site Fabrication
(Energy use for concrete and
rebar)
45,940 ton
(5% loss for concrete,
10% loss for steel)
9.0 kg-CO2/m3
(20.7 kg-CO2/ton) 950,958
Including pump,
vibration and fuel
On-Site Installation
(Crane) [c] 5,760 hours
25.7 kg CO2/hour
(25t) 148,032
Concrete placement
9 months
On-Site Installation
(Forklift) [d] 2,880 hours
29.7 kg CO2/hour
(75<HP<100) 85,536
Concrete placement
9 months
Total 1,184,526
[c] (8 hour/day * 20 day * 9 month) * 4 Crane = 5,760 hours [d] (4 hour/day * 20 day * 9 month) * 4 Forklift = 2,880 hours
Table 10. CO2 Emissions for Fabrication and Installation of CIP

64
Figure 21. Precast Concrete Assembly Simulation
As a result of the calculation under the assumed data scenarios, the fabrication and
installation of the CIP method have 43% more CO2 emissions than precast. There can be
estimated several reasons.
Firstly, the reason is that the quantities of materials to be fabricated are different. The CIP
has larger material loss than precast in the scenario's baseline.
Secondly, the usage of energy including equipment operation for the fabrication has
calculated as a different condition that one is off-site (factory) and the other is on-site.
The CO2 emissions data for calculation of the off-site (factory) is based on the actual bill
from the factory which was 11.3 kg- CO2 /ton. Whereas, the data for CO2 emission for
concrete placement on-site was based on the data collected from other literature which
was 20.7 kg- CO2 /ton which are included uncertainty according to the design and
characteristic of the researched on-site.
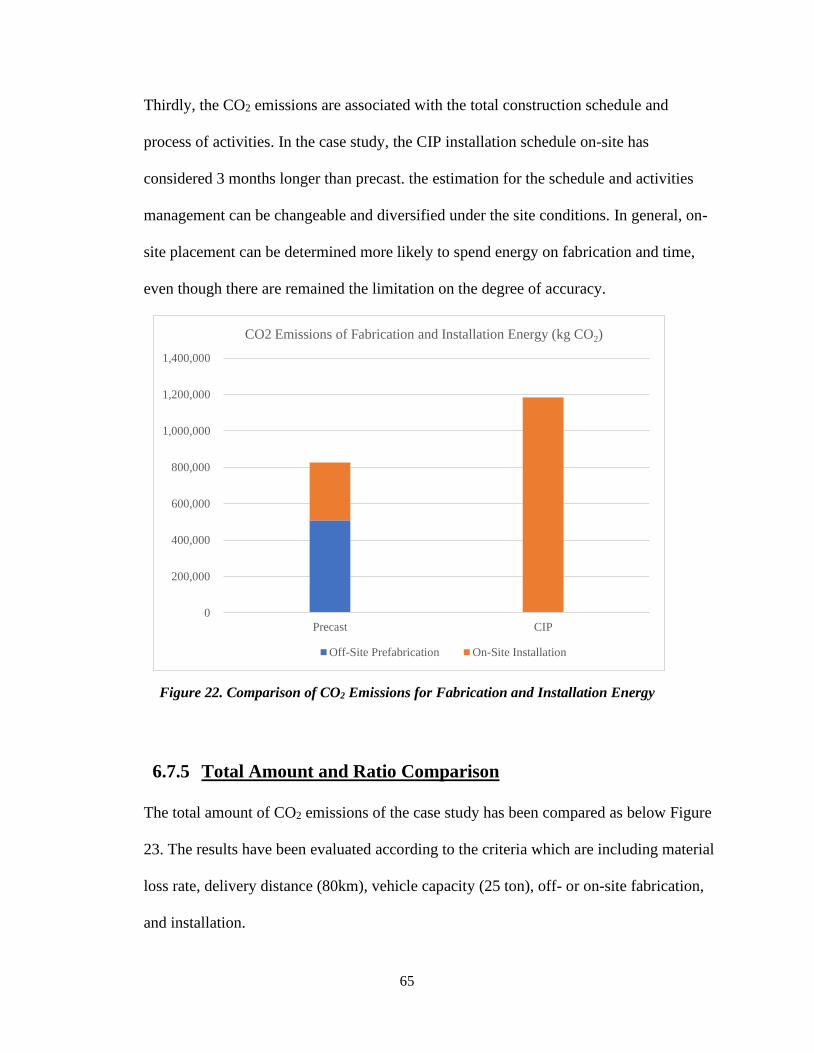
65
Thirdly, the CO2 emissions are associated with the total construction schedule and
process of activities. In the case study, the CIP installation schedule on-site has
considered 3 months longer than precast. the estimation for the schedule and activities
management can be changeable and diversified under the site conditions. In general, on-
site placement can be determined more likely to spend energy on fabrication and time,
even though there are remained the limitation on the degree of accuracy.
Figure 22. Comparison of CO2 Emissions for Fabrication and Installation Energy
6.7.5 Total Amount and Ratio Comparison
The total amount of CO2 emissions of the case study has been compared as below Figure
23. The results have been evaluated according to the criteria which are including material
loss rate, delivery distance (80km), vehicle capacity (25 ton), off- or on-site fabrication,
and installation.
0
200,000
400,000
600,000
800,000
1,000,000
1,200,000
1,400,000
Precast CIP
CO2 Emissions of Fabrication and Installation Energy (kg CO2)
Off-Site Prefabrication On-Site Installation

66
Figure 23. Comparison of Total CO2 Emissions of Precast and CIP
As a result of the case study based on scenarios, the total CO2 emissions of the difference
figures between precast and CIP concrete is almost twice. Figure 23 shows the
comparison number and graph.
The largest determinants of the different figures have a material loss and on-site
installation activities. Since the CIP method does not have off-site prefabrication
activities, all the related fabrication activities are done on-site. This reason brings the
difference in CO2 emissions to the on-site installation. In transportation, there is a lower
difference in terms of total CO2 emissions. However, this does not mean the
transportation and installation impacts are less important. Because all processes still have
Material Loss TransportationOff-Site
Prefabrication
On-Site
InstallationTotal
Precast 472,666 94,353 507,901 318,720 1,393,641
CIP 1,270,023 146,740 0 1,184,526 2,601,289
0
500,000
1,000,000
1,500,000
2,000,000
2,500,000
3,000,000
Total Comparison of CO2 Emissions (kg CO2)

67
numerous possibilities to increase the negative impact and positive potential to eliminate
or reduce CO2 emissions. The point to be focused on is that we should find solutions to
reduce the environmental impacts at each factor based on a scientific basis.
Figure 24. Ratio Comparison of CO2 Emissions of Precast and CIP
The comparison results of the CO2 emissions' ratio for the precast and CIP based on the
scenarios, CO2 emissions of the off-site prefabrication process affect the precast method
as the largest portion as 36%. The portion of CO2 emissions of the material loss which is
34% has almost similar to the first one. Whereas, CO2 emissions of material loss in CIP
concrete have affected the largest portion at 49%. This is because the material loss rate of
on-site construction had been higher than factory fabrication. (See Figure 24)
The transportation from the factory to the site was respectively 7% and 6% of precast and
CIP concrete which is the smallest portion and impacts of CO2 emissions of the process
ratio. One of the major reasons may be that the transportation of materials is only a one-
time event and contributes the shortest time for energy use compared to the other
processes for calculation.
34%
7%36%
23%
Precast
Material Loss
Transportation
Off-Site
Prefabrication
On-Site
Installation
49%
6%
45%CIP

68
During the construction stage of CIP, CO2 emissions of on-site installation have in charge
of 45% ratio of the whole process. This is because CIP concrete has required more
intensive work on-site all related activities including the fabrication, assembly, and
placement. On the other hand, the precast method has only the erection and arrangement
work on-site with prefabricated concrete.
Therefore, during the on-site installation phase, in the case of increasing the number of
tower cranes or delaying the schedule may be increased energy consumption and CO2
emissions. However, there are various possible ways in order to reduce CO2 emissions
during installation. For instance, by building up a reliable schedule for delivery and
installation can lead to lower environmental impacts. When material loss and waste are
managed effectively or when the manufacturers use their energy sources from renewable
or green energy, the difference in CO2 emissions can be a lot.

69
CHAPTER 7. DISCUSSION
7.1 Findings and Recommendations
The most important aspect of sustainable construction and a healthy built environment is to not
create pollution. However, since this is difficult by modern technology, sustainable construction
can be normally defined as to minimize or eliminate emissions of impacts on the environment.
Based on this perspective, the analysis of the case study shows several findings that we can
positively consider the prefabricated construction method in the decision-making process for a
sustainable environment.
First of all, the best way is to reduce the loss of materials during the production and construction
stages. Since the loss of the materials has in charge of the largest portion of CO2 emissions in the
CIP and the second-largest portion in the precast. Generally, prefabrication techniques can have
more efficient and less wasteful than conventional construction methods by controlling the
process at the off-site factory. Another way to reduce environmental impacts from materials in
prefabrication is that we adopt eco-friendly materials instead of traditional materials. If the
prefabricated components made with alternative materials such as green concrete or recycled
steel, the environmental impacts may be significantly reduced and it can be the more sustainable
construction method.
Secondly, the outcome of transportation analysis shows the different sensitivity about materials
delivery distance and vehicle capacity between precast and CIP. For instance, the CIP concrete

70
method is more sensitive to transportation distance than precast concrete's when it is far away
from 80km distance. The common result is that it can reduce considerable CO2 emissions
amounts in both precast and CIP when the distance between the prefabrication factory and on-
site is close.
In terms of the vehicle capacity, the CIP method has less sensitivity to change of the vehicle
capacity for material delivery than precast. This is because the number of RMC trucks required
in the CIP method cannot be changed to the other vehicle capacity, also, it has a fixed number. In
addition, about 40% of the material weight is concrete components required to be delivered from
RMC trucks. In the precast method, it has the lowest emissions when the vehicle capacity is 25t.
But, in the case that the vehicle capacity is 10t, the environmental impact may be greater rather
than CIP and be the worst adverse decision for the constructors in terms of cost, schedule, and
environment.
Figure 25 and Figure 26 can illustrate the difference and sensitivity of CO2 emissions according
to the distance and vehicle capacity by applying the expanded scope from the case study.
Thirdly, it is one of the determinants of environmental impacts that the heavy-duty cranes and
use hours of equipment when considering 'on-site installation'. The outcomes of the precast
concrete method bring to increased energy consumption and CO2 emissions compared to CIP on-
site installation process. Therefore, it requires the constructor's efforts to reduce the CO2
emissions from the installation process by improving the equipment efficiency, work schedule,
and productive time of the prefabricated building.

71
Figure 25. Sensitivity of Precast Concrete for Distance-Vehicle Capacity
Figure 26. Sensitivity of CIP Concrete for Distance-Vehicle Capacity
0 50,000 100,000 150,000 200,000 250,000 300,000
20km
50km
80km
110km
140km
Precast 25t Precast 30t Precast 20t Precast 15t Precast 10t (kg CO2)
0 50,000 100,000 150,000 200,000 250,000 300,000
20km
50km
80km
110km
140km
CIP 30t CIP 25t CIP 20t CIP 15t CIP 10t (kg CO2)
72
Lastly, during the fabrication and installation process, CO2 emissions of the precast method have
been more affected than CIP. In the case study scenario, the fabrication and installation of
precast have a portion of 59% of its total, while the CIP method has 45% of its total. Therefore, it
can be considered that the efficiency of equipment and assembly productivity of precast at the
factory can be significant factors not only to save the schedule but also to reduce the
environmental impacts. The decision-makers can use the technology of prefabricated
construction as one of the alternatives. And, it can be efficiently improved for mitigating
environmental impacts based on the case study outcomes and further research on the correlation
to productivity and environmental impacts.
7.2 Limitations
This study has limitations in several ways. There has been only one project's case study for
precast concrete and comparing the conventional construction method. In addition, the
conditions of every construction project have their own unique characteristics and complexities
in the real world. Therefore, even though the building's structural design and construction
methods are equal, they cannot have identical conditions such as the project site condition, the
schedule, the location, and labor skills. The outcomes of this analysis could be changed
depending on the different conditions and complexities of the project.
Moreover, the scenarios have included a few assumed conditions such as material loss rate,
schedule, energy use hours, temporary materials' quantities, and so on to estimate the CO2
emissions of the conventional construction methods. Even though the assumptions may be in the
scope of general project characteristics, the outcomes can be changed depending on how to set

73
the baseline conditions of assumption. The accurate assumption is often difficult because most
environmental impacts have multiple factors over the scenario criteria.
To validate the results presented in this case study, which were based on a single residential
project, it is important to perform the analysis on other various projects. Because the projects are
varied by the type and size and more advanced methodology and data collections are required to
be studied to provide the information and data accurately. Also, in order to draw a meaningful
and widespread outcome and framework of prefabrication construction and environmental
impact, researchers will need further numerous experimental data and evaluations.

74
CHAPTER 8. CONCLUSTION
Decision making based on a single issue, such as carbon dioxide emissions, may not be the
answer for construction methods in real life as overall and numerous impacts can be dependent
upon the project characteristics. However, the analysis of the assessment of the environmental
impact should be one of the major considerations in order to make environmentally friendly
buildings. Prefabricated construction can be utilized as one of the options for mitigating
environmental problems in the construction industry. The adoption of prefabrication offers
significant advantages through the development of technology and changing the management.
However, appropriate criteria for applicable assessments widely are still deficient. In most cases,
the decision to use prefabricated construction has been based on cost evaluation.
In this research paper, the collected data and scenarios have constraints and limitations of
applying it in general. However, we could find and discuss a feasible solution through the review
of one specific case in detail. Also, this discussion can provide improvements to the methods of
thinking and decision-making for the next project. As described in advance, the primary purpose
of this case study and scenarios was not to calculate accurate figures but to find the meaning and
direction for decision making in terms of environmental impacts. In order to contribute to
reducing environmental impacts by construction activities, further studies are required with
multiple perspectives by researchers.

75
References
Al-Husssein, M., Manrique, J. D., & Mah, D. (2009). North Ridge CO2 Analysis Report:
Comparison between Modular and On-Site Construction. Integrated Management &
Realty Ltd.
Bernstein, H. M. (2011). Prefabrication and Modularization: Increasing Productivity in the
Construction Industry. McGraw-Hill Construction.
Bertram, N., Fuchs, S., Mischke, J., Patter, R., Strube, G., & Woetzel, J. (2019). Modular
construction: From projects to products. McKinsey & Company.
Boafo, E.B., Kim, J.H., & Kim, J.T. (2016). Performance of Modular Prefabricated Architecture:
Case Study-Based Revie and Future Pathways. Sustainability.
Building construction: principles, materials, and systems. 2nd edition. (2013). Pearson
Education Inc.
Chen, Y., Okudan, G.E., & Riley D.R. (2010). Sustainable performance criteria for construction
method selection in concrete buildings. Automation Construction, pp. 235-244.
Deluxe Modular. (2019). Retrieved from Modular Construction: www.deluxemodular.com
Dennenberg, A. L., Frumkin H., & Jackson R. J. (2011). Making Health Places: Designing and
Building for Health, Well-being, and Sustainablility. Washington, Covelo, London:
ISLAND PRESS.
DETR. (2000). Building a Better Quality of Life: A Strategy for more Sustainable Conctruction.
London: Department of the Environment, Transport and the Regions.
Fast Facts on Transportation Greenhouse Gas Emissions. (2019). Retrieved from EPA
(Environmental Protection Agency): https://www.epa.gov/greenvehicles/fast-facts-
transportation-greenhouse-gas-emissions
Flower, D. J. M., & Sanjayan, J. G. (2007). Green House Gas Emissions due to Concrete
Manurfacture. Int J LCA 12 (5), pp. 282-288.
Ghayeb, H. H., Razak, H.A., & Sulong, N.H.R. (2020). Evaluation of the CO2 emissions of an

76
innovative composite precast concrete sturucture building frame. Journal of Cleaner
Production 242.
Hurmekoski, E., Jonsson, R., & Nord, T. (2015). Context, drivers, and future potential for wood-
frame multi-story construction in Europe. Technological Forecasting & Social Change,
pp. 181-196.
Jaillon, L and Poon, C.S. (2008). Sustainable construction aspects of using prefabrication in
dense urban environment: a Hong Kong case study. Construction Management and
Economics 26, pp. 953-966.
Kim, T.H., Sung, H.T., Sung, J.S., George, F., & Keun, H.Y. (2016). An Optimisation System
for Concrete Life Cycle Cost and Related CO2 Emissions. Sustainability.
Lee S., Joo J., Kim, J.T., & Kim S. (2012). An Analysis of the CO2 Reduction Effect of a
Column-Beam Structure Using Composite Precast Concrete Members. Indoor and Built
Environment, pp. 150-162.
Liew, J.Y.R., Chua, Y.S., & Dai, Z. (2019). Steel concrete composite systems for modular
construction of high-rise buildings. Structures, pp. 135-149.
Lim T.K., Gwak, H. S., Kim, B. S, & Lee, D.E. (2015). Integrated Carbon Emission Estimation
Method for Construction Operation and Project Scheduleing. KSCE Journal of Civil
Engineering, pp. 1211-1220.
Marshall, S. K., Rasdorf, W., Lewis, P., & Frey, H. C. (2012). Methodology for Estimating
Emissions Inventories for Commercial Building Projects. Journal of Architectural
Engineering, pp. 251-260.
MBI. (2010). Improving Construction Efficiency & Productivity with Modular Construction.
Retrieved from Modular Building Institute: www.modular.org
Molavi, J. & Barral, D.L. (2016). A Construction Procurement Method To Achieve Sustainabley
In Modular Construction. Procedia Engineering, pp. 1362-1369.
Monahan, J., & Powell, J.C. (2011). An embodied carbon and energy analysis of modern
methods of construction in housing: A case study using a lifecycle assessment
framework. Energy and Buildings, pp. 179-188.

77
Pen, W., Li, K., & Teng, Y. (2019). Briefing: Life-cycle carbon assessment fo prefabricated
buildings: challenges and solutions. Engineering Sustainability 172(1), pp. 3-8.
Quale, J. E. (2012). Comparing Environmental Impacts of Building Modular and Conventional
Homes in the United States. Journal of Industrial Ecology, pp. 243-253.
Ramesh, T., Prakash, R., & Shukla, K. (2010). Life cycle energy analysis of buildings: An
overview. Energy and Buildings, pp. 1592-1600.
Reducing your Transportation Footprint. (2019). Retrieved from C2ES:
https://www.c2es.org/content/reducing-your-transportation-footprint/
Smith, R. (2010). Prefab architecture: A guide to modular design and construction. New York:
Wiley.
Taum, C., Venegas, J. A., & Willians J. (1987). Constructability Improvement Using
Prefabrication, Preassembly, and Modularization. Austin, TX, USA: Bureau of
Engineering Research, University of Texas at Austin.
The Ultimate Guide to Modular Construction. (2019). Retrieved from Deluxe Modular:
www.deluxemodular.com
TRACCS. (2019). Retrieved from TRACCS: http://traccs.emisia.com/download.php
Yonger, M., Morrow-Almeida, H. R., Vindigni, S. M., & Dannenberg, A. L. (2008). The Built
Environment, Climate Change, and Health Opportunities for Co-Beneftis. American
Journal of Preventive Medicine, pp. 517-526.

78
Appendix. Supplementary Data
(1) Heavy Duty Trucks (TRACCS, 2019)
Vehicle Type
Fuel Consumption Factors
(g/km),
Model year 2010
From Fuel Consumption
to CO2
Heavy Duty Trucks Rigid 12-14t 148 3.140 g CO2 per g of fuel
Heavy Duty Trucks Rigid 14-20t 173 3.140 g CO2 per g of fuel
Heavy Duty Trucks Rigid 20-26t 209 3.140 g CO2 per g of fuel
Heavy Duty Trucks Rigid 26-28t 221 3.140 g CO2 per g of fuel
Heavy Duty Trucks Rigid 28-32t 255 3.140 g CO2 per g of fuel
(2) Utility Usage Data from Precast Concrete Factory and CO2 Emission Units
Type Unit Usage
(June 2019) Usage/ton CO2 Emissions Criteria
Diesel Liter 12,197 0.339 10.16 kg CO2/gallon
2.68 kg CO2/liter
Electricity kwh 279,049 7.755 1.35kgCO2 per kWh
Ground Water Ton 5,271 0.146
Groundwater depletion and CO2
emission
due to bicarbonate extraction
and pumping
*Not compared
(Factory Bill of June 2019, based on Precast Product Amount 53,983 ton)

79
(3) Precast concrete amount of case study
Structure Type Precast Concrete (m3) Steel Bar (kg)
Wall 10,177 1,483,037
Column 236 14,987
Girder 367 39,879
Stairs 776 126,836
HCS (Hollow core slab) 1,737 0
Reinforced Concrete Slab 2,677 745,758
Solid Slab 1,955 0
Total 17,925 2,410,497
(4) A Type Unit Form Work Area Estimation
Floor Area Area (m2)
1floor
Matt footing 11.5
Wall 127.4
Interior wall 74.1
Stairs 4.5
2nd floor
Slab 78
Wall (exterior) 237.7
wall (interior) 65.1
Stairs 4.5
3rd floor
Slab 78
Wall (exterior) 237.7
wall (interior) 65.1
Stairs 4.5
Top floor
Slab 27.3
Wall 60
Roof 30
Total 1,105.4

80
(5) Calculation for A type Unit Scaffolding System Weight
Type Size (mm) Weight (ton) EA Sum (ton)
A Vertical 3,450 16 156 2,496
B Horizontal (standard) 3,450 16 288 4,608
Horizontal (for plank) 1,291 6.2 38 236
C Bracing 3,450 16 168 2,688
D Steel plank 500 x 1829 17 248 4,216
E Accessories and Stairs (A+B+C) x 10% - - - 1,003
Total Amount 15,246
[1] Seven (7) Units combined for one building (11.4 *6) + 15.2 = 83.6 ton
[2] Four (4) Buildings (7 unit/building) Scaffolding Weight = 83.6 ton * 4 building =333.4 ton
(6) Units
a) One square foot (ft2) ≈ 0.093 square meter (m2, SI).
b) One pound per square foot (lb/ft2) ≈ 4.88 kilograms per square meter (kg/m2).
c) One mile (mi) ≈ 1.609 kilometers (km, SI).
d) One metric ton (t) = 103 kilograms (kg, SI) ≈1.102 short tons.
e) CO2-eq: Carbon dioxide equivalent (CO2-eq) is a measure for describing the climate-
forcing strength of a quantity of greenhouse gases using the functionally equivalent amount
to of carbon dioxide as the reference.