
Certifying Application Performance on Exadata – A Real ... · Java Application with 7.8 million...
117
1 Certifying Application Performance on Exadata – A Real World Case Study Gaja Krishna Vaidyanatha CEO & Founder, DBPerfMan LLC [email protected] http://www.dbperfman.com http://www.dbcloudman.com LinkedIn - gvaidyanatha Twitter – @dbperfman Facebook - dbperfman Copyright © 2004 – 2013 DBPerfMan LLC, All rights reserved
Transcript of Certifying Application Performance on Exadata – A Real ... · Java Application with 7.8 million...
1
Certifying Application Performance on Exadata – A
Real World Case Study
Gaja Krishna Vaidyanatha CEO & Founder, DBPerfMan LLC [email protected] http://www.dbperfman.com http://www.dbcloudman.com
LinkedIn - gvaidyanatha Twitter – @dbperfman Facebook - dbperfman
Copyright © 2004 – 2013 DBPerfMan LLC, All rights reserved
2
Due to certain unavoidable circumstances, the white
paper will not be available for this presentation. The
inconvenience is regretted!
Copyright © 2004 – 2013 DBPerfMan LLC, All rights reserved

3
Welcome!
Visit us at http://www.dbperfman.com and http://www.dbcloudman.com

4 Do not believe anything simply because…
1. You have heard it
2. It is spoken and rumored by many
3. It is found written in books
4. Of the forced authority of your teachers and elders
5. They have been handed down for many generations
Copyright © 2004 – 2013 DBPerfMan LLC, All rights reserved
5 Believe in something simply because…
1. The experiment/test you conducted is true
2. Your observation and analysis provided you mathematical data
3. Your data agrees with normal reasoning and rationale
Copyright © 2004 – 2013 DBPerfMan LLC, All rights reserved
6 Who am I and what have I done in life?
1992 - First database - Oracle 6.0.31… 2000 - Compulsive Tuning Disorder (CTD) 2000 - Product Management at Quest Software 2002 – Product Management of OEM 10g at Oracle Corp. 2004 - DBPerfMan LLC
Copyright © 2004 – 2013 DBPerfMan LLC, All rights reserved
7
Two Hour Execution Plan Exadata – What & Why? Oracle Instance & Database Setup Web Logic Configuration Oracle Net Optimizations Partitioning Decisions Parallelism – Application vs. Database Analysis of low-level traces Hybrid Columnar Compression Findings Issues faced, battles fought and workarounds Performance Numbers Conclusion
Copyright © 2004 – 2013 DBPerfMan LLC, All rights reserved
Note: All settings, findings and information presented in this talk are relevant to the application that was certified. No generalizations of any nature should be assumed or made. The reader is expected to perform the required testing in his/her environment and engage in data-driven decisions.

8
Exadata – What & Why?
Copyright © 2004 – 2013 DBPerfMan LLC, All rights reserved
9
What is Exadata?
Exadata = Hardware + software from Oracle Primary focus = Solving the I/O problem regardless of size
Copyright © 2004 – 2013 DBPerfMan LLC, All rights reserved
10 Exadata – Picture Tour
Copyright © 2004 – 2013 DBPerfMan LLC, All rights reserved
11 Exadata – Picture Tour
Copyright © 2004 – 2013 DBPerfMan LLC, All rights reserved
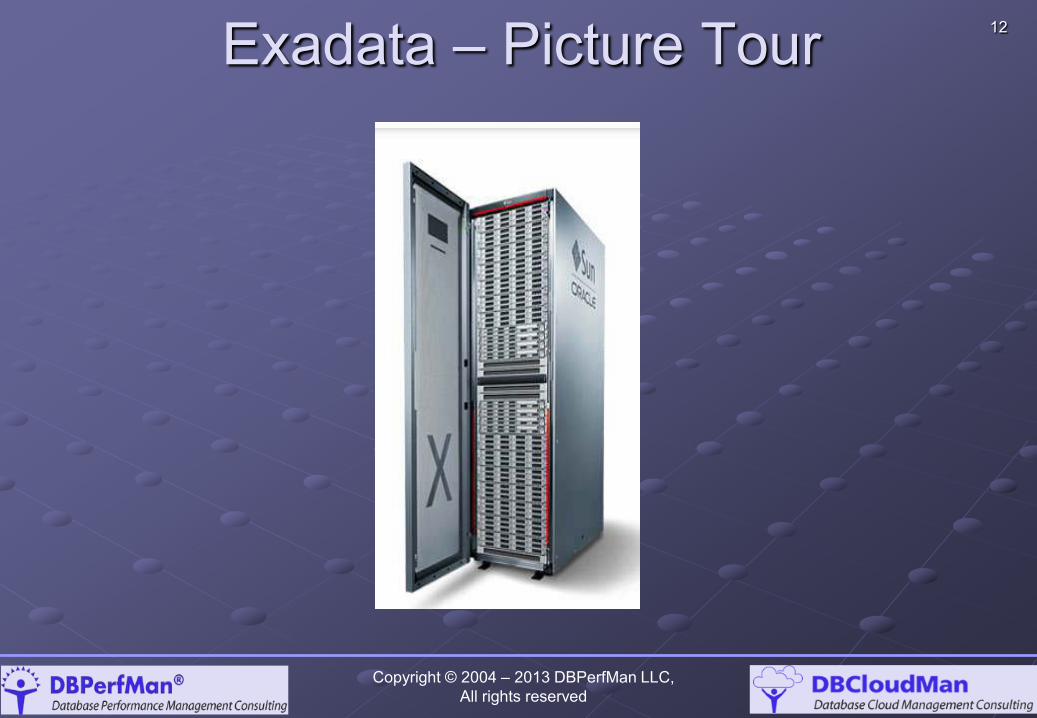
12 Exadata – Picture Tour
Copyright © 2004 – 2013 DBPerfMan LLC, All rights reserved
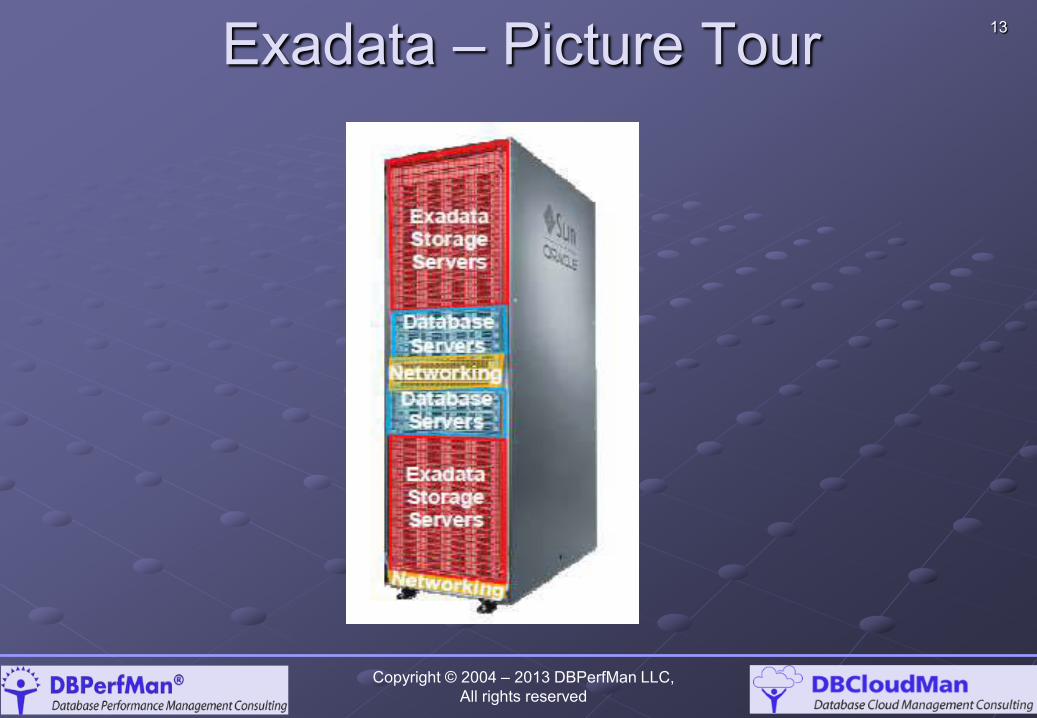
13 Exadata – Picture Tour
Copyright © 2004 – 2013 DBPerfMan LLC, All rights reserved
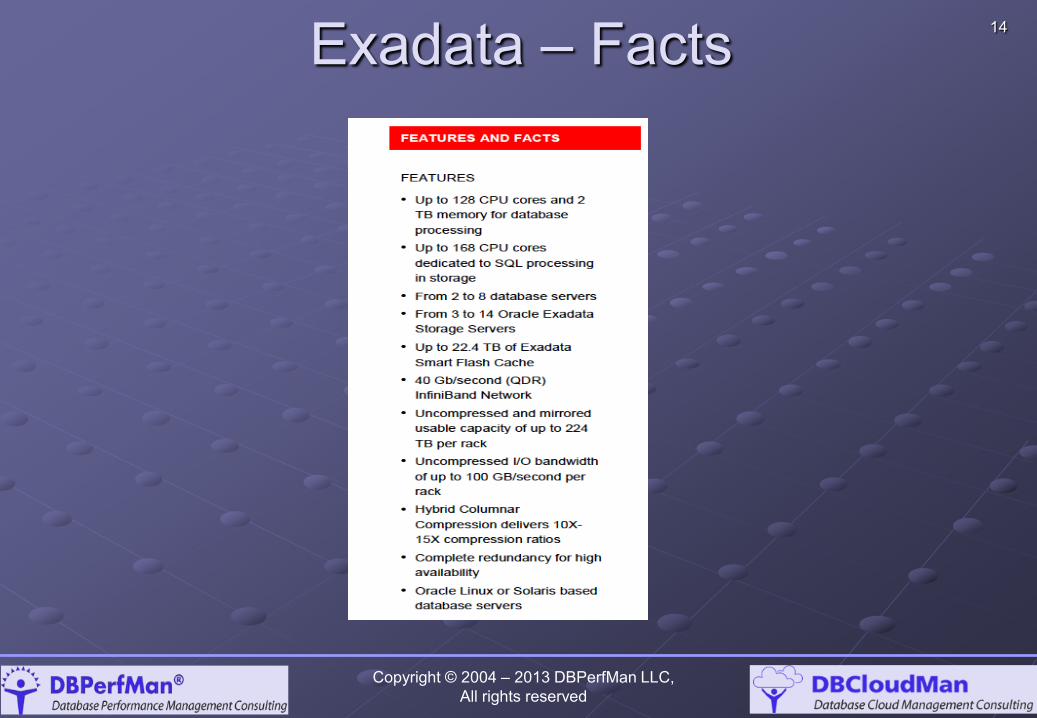
14 Exadata – Facts
Copyright © 2004 – 2013 DBPerfMan LLC, All rights reserved
15
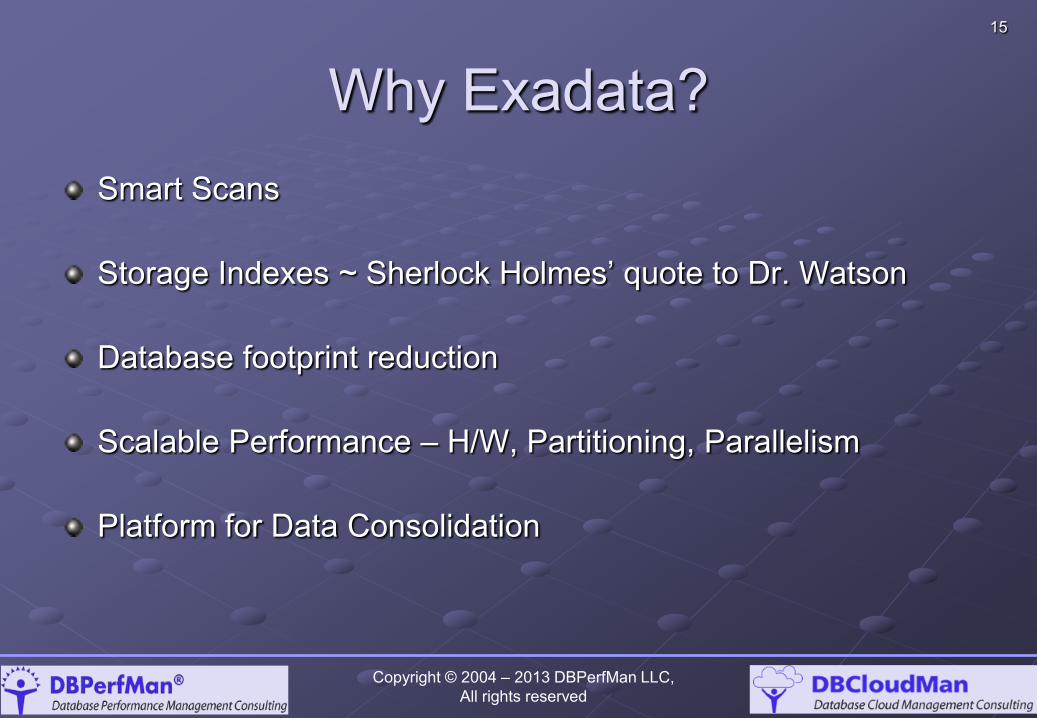
Why Exadata? Smart Scans Storage Indexes ~ Sherlock Holmes’ quote to Dr. Watson Database footprint reduction Scalable Performance – H/W, Partitioning, Parallelism Platform for Data Consolidation
Copyright © 2004 – 2013 DBPerfMan LLC, All rights reserved
16
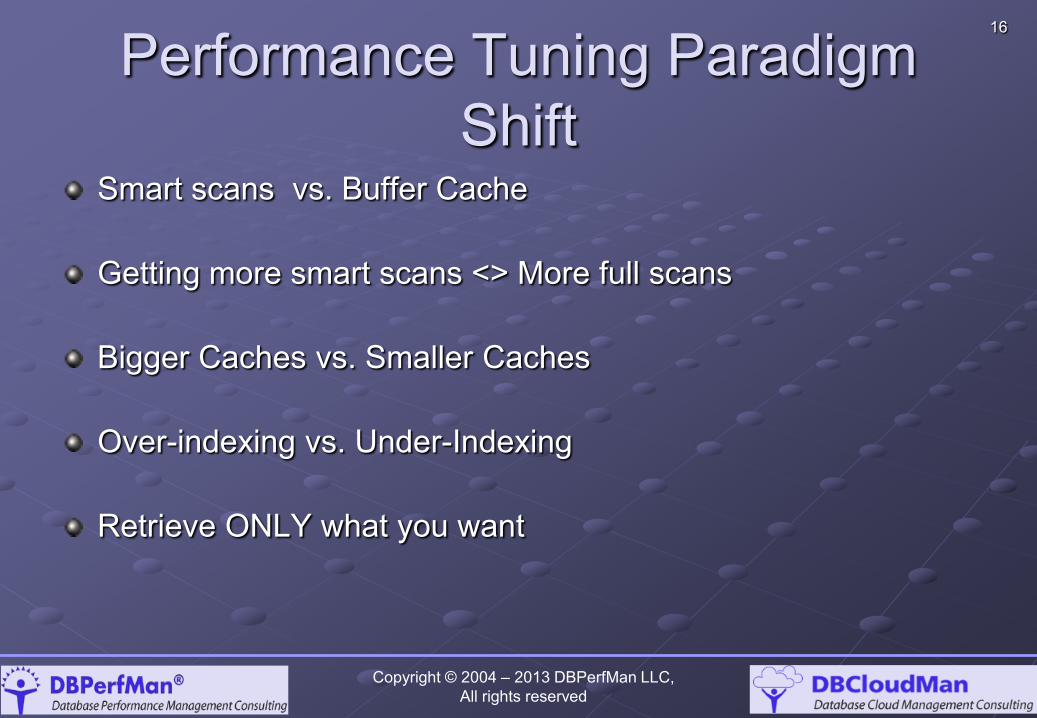
Performance Tuning Paradigm Shift
Smart scans vs. Buffer Cache Getting more smart scans <> More full scans Bigger Caches vs. Smaller Caches Over-indexing vs. Under-Indexing Retrieve ONLY what you want
Copyright © 2004 – 2013 DBPerfMan LLC, All rights reserved
17
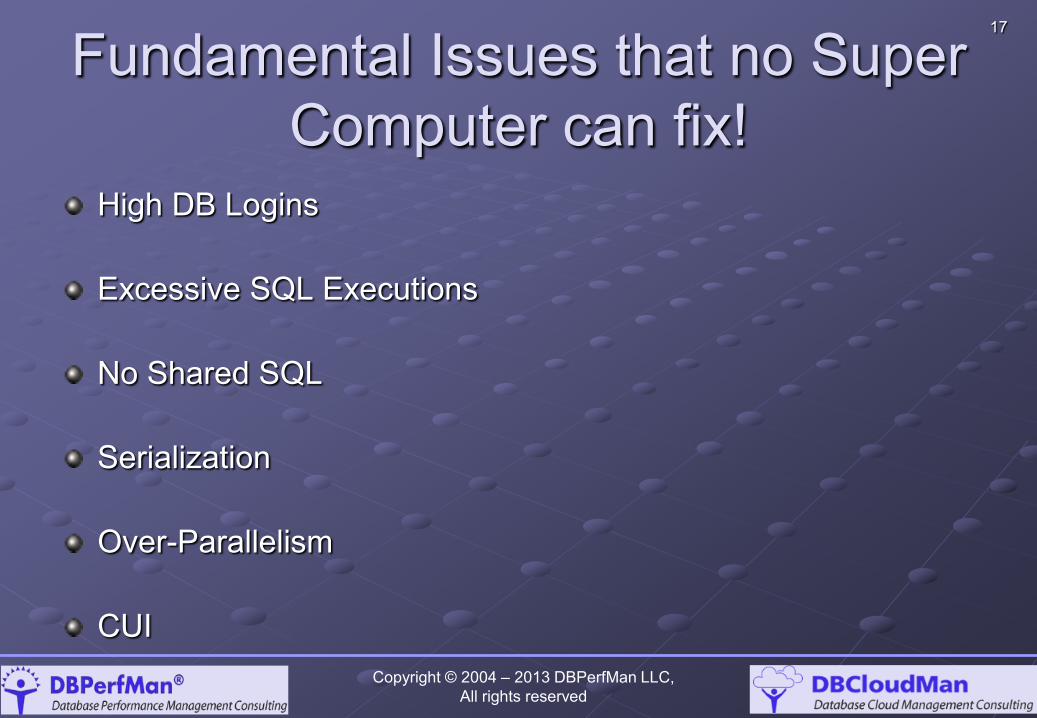
Fundamental Issues that no Super Computer can fix!
High DB Logins
Excessive SQL Executions No Shared SQL Serialization Over-Parallelism CUI
Copyright © 2004 – 2013 DBPerfMan LLC, All rights reserved
18
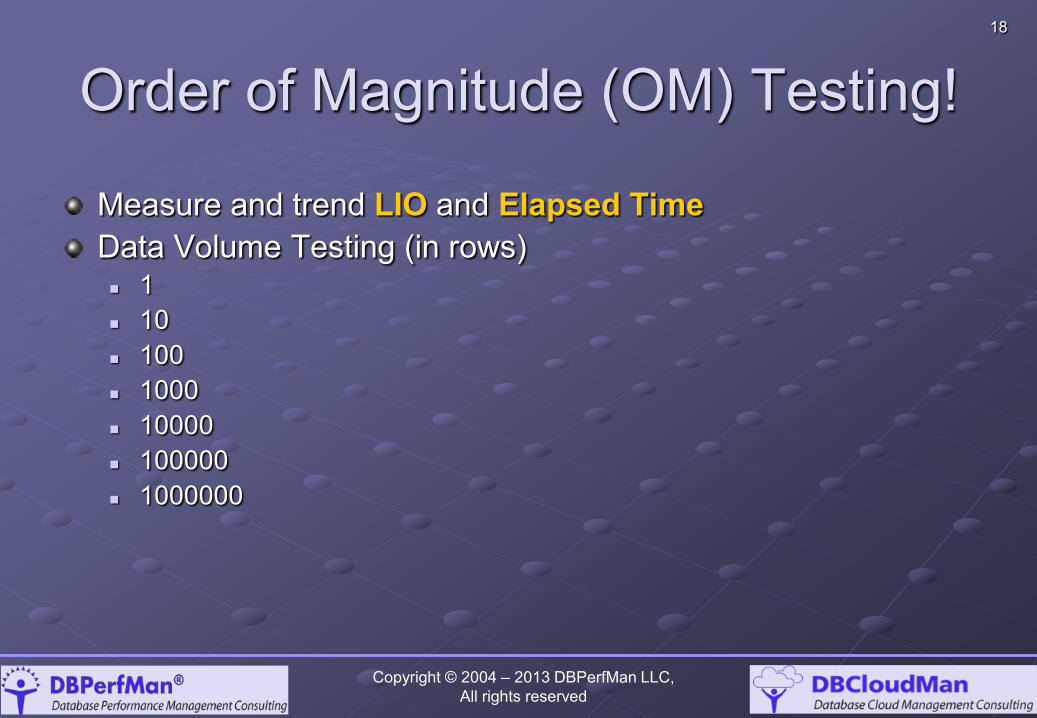
Order of Magnitude (OM) Testing!
Measure and trend LIO and Elapsed Time Data Volume Testing (in rows) 1 10 100 1000 10000 100000 1000000
Copyright © 2004 – 2013 DBPerfMan LLC, All rights reserved
19
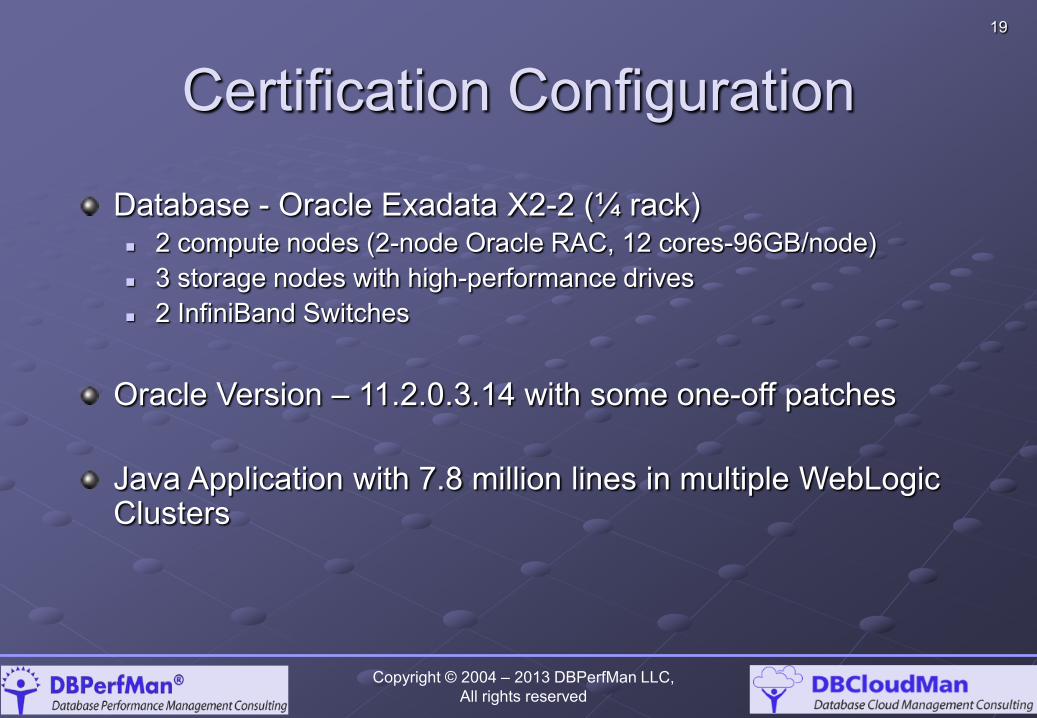
Certification Configuration
Copyright © 2004 – 2013 DBPerfMan LLC, All rights reserved
Database - Oracle Exadata X2-2 (¼ rack) 2 compute nodes (2-node Oracle RAC, 12 cores-96GB/node) 3 storage nodes with high-performance drives 2 InfiniBand Switches
Oracle Version – 11.2.0.3.14 with some one-off patches Java Application with 7.8 million lines in multiple WebLogic Clusters
20
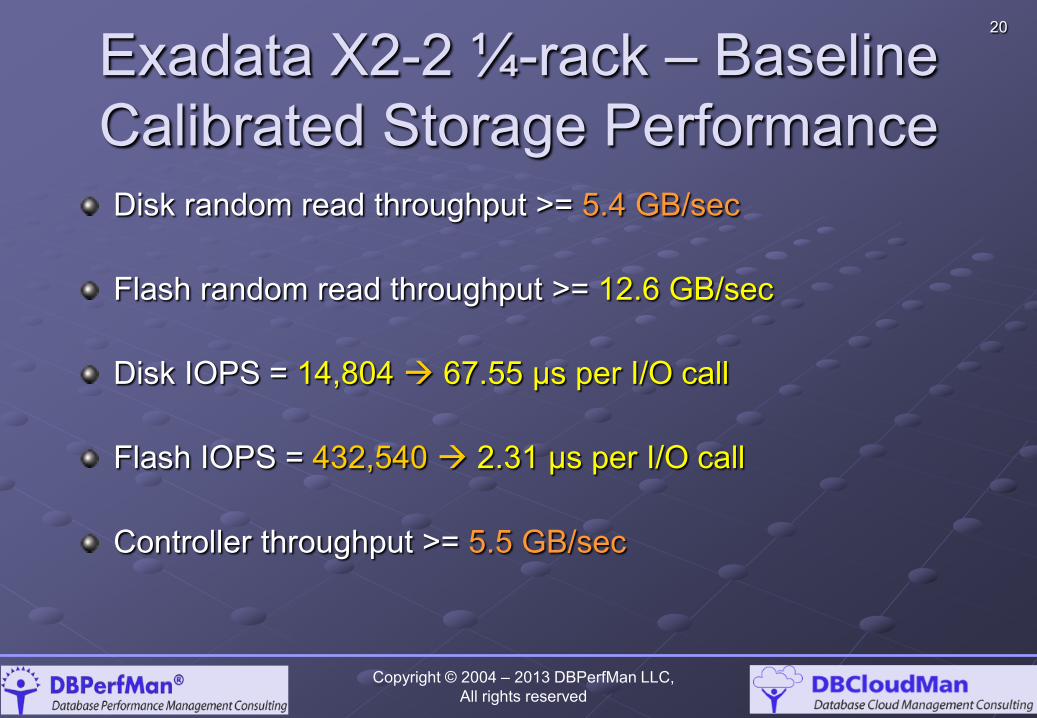
Exadata X2-2 ¼-rack – Baseline Calibrated Storage Performance
Copyright © 2004 – 2013 DBPerfMan LLC, All rights reserved
Disk random read throughput >= 5.4 GB/sec Flash random read throughput >= 12.6 GB/sec Disk IOPS = 14,804 67.55 μs per I/O call Flash IOPS = 432,540 2.31 μs per I/O call Controller throughput >= 5.5 GB/sec
21
Oracle Instance & Database Setup
Copyright © 2004 – 2013 DBPerfMan LLC, All rights reserved
22
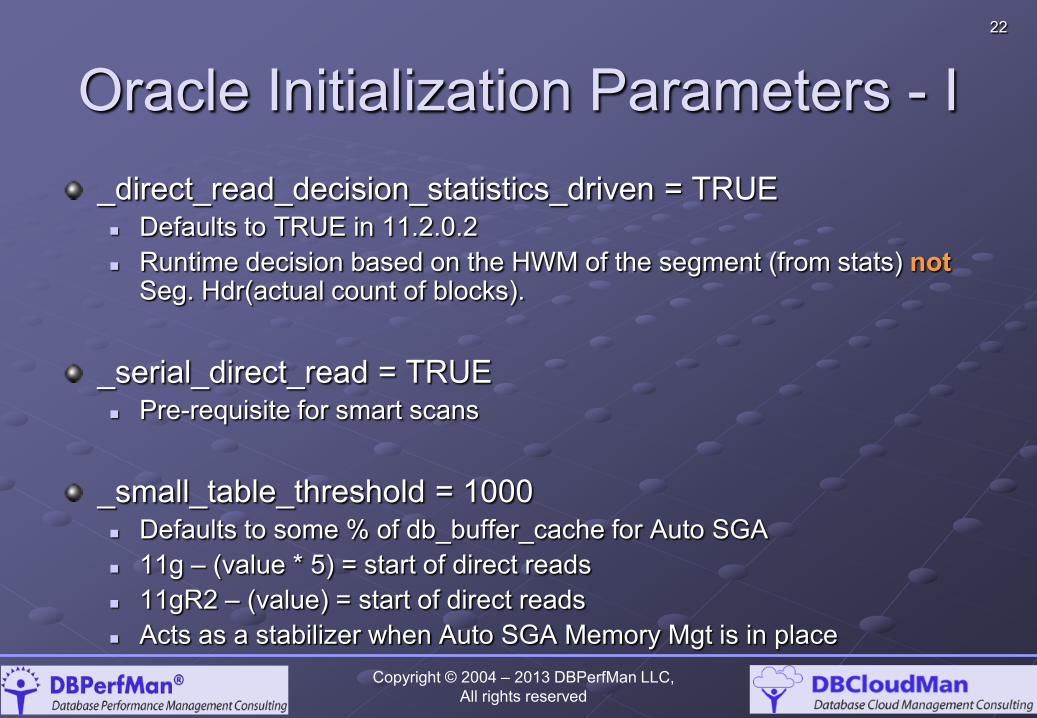
Oracle Initialization Parameters - I _direct_read_decision_statistics_driven = TRUE Defaults to TRUE in 11.2.0.2 Runtime decision based on the HWM of the segment (from stats) not
Seg. Hdr(actual count of blocks). _serial_direct_read = TRUE Pre-requisite for smart scans
_small_table_threshold = 1000 Defaults to some % of db_buffer_cache for Auto SGA 11g – (value * 5) = start of direct reads 11gR2 – (value) = start of direct reads Acts as a stabilizer when Auto SGA Memory Mgt is in place
Copyright © 2004 – 2013 DBPerfMan LLC, All rights reserved
23
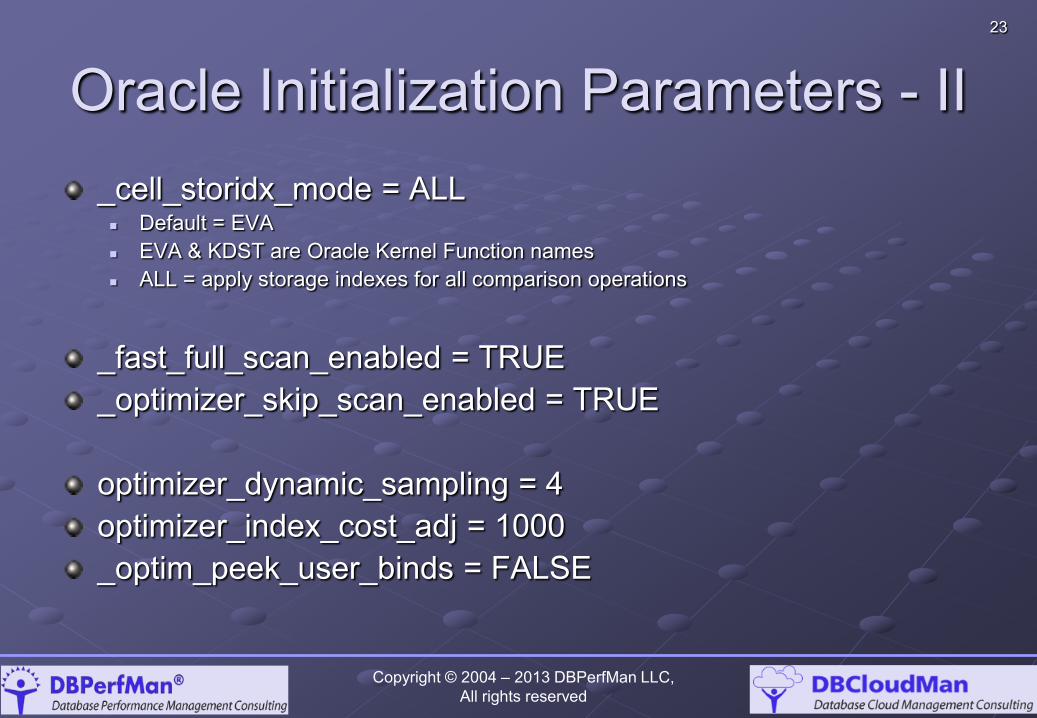
Oracle Initialization Parameters - II _cell_storidx_mode = ALL Default = EVA EVA & KDST are Oracle Kernel Function names ALL = apply storage indexes for all comparison operations
_fast_full_scan_enabled = TRUE _optimizer_skip_scan_enabled = TRUE optimizer_dynamic_sampling = 4 optimizer_index_cost_adj = 1000 _optim_peek_user_binds = FALSE
Copyright © 2004 – 2013 DBPerfMan LLC, All rights reserved
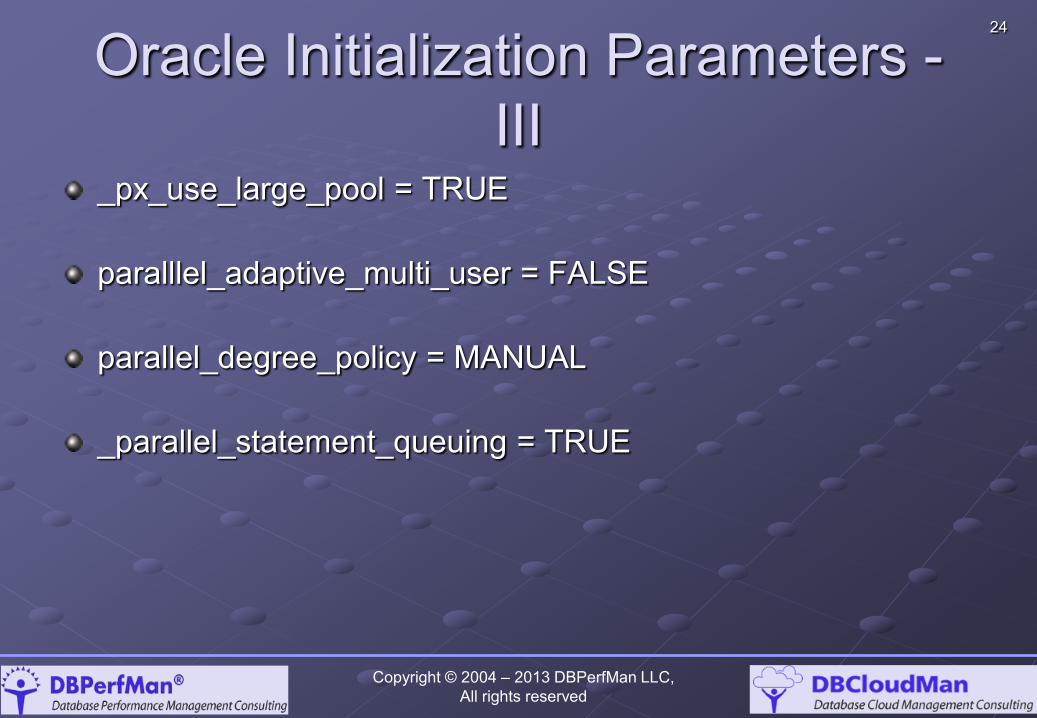
24
Oracle Initialization Parameters - III
_px_use_large_pool = TRUE
paralllel_adaptive_multi_user = FALSE parallel_degree_policy = MANUAL _parallel_statement_queuing = TRUE
Copyright © 2004 – 2013 DBPerfMan LLC, All rights reserved
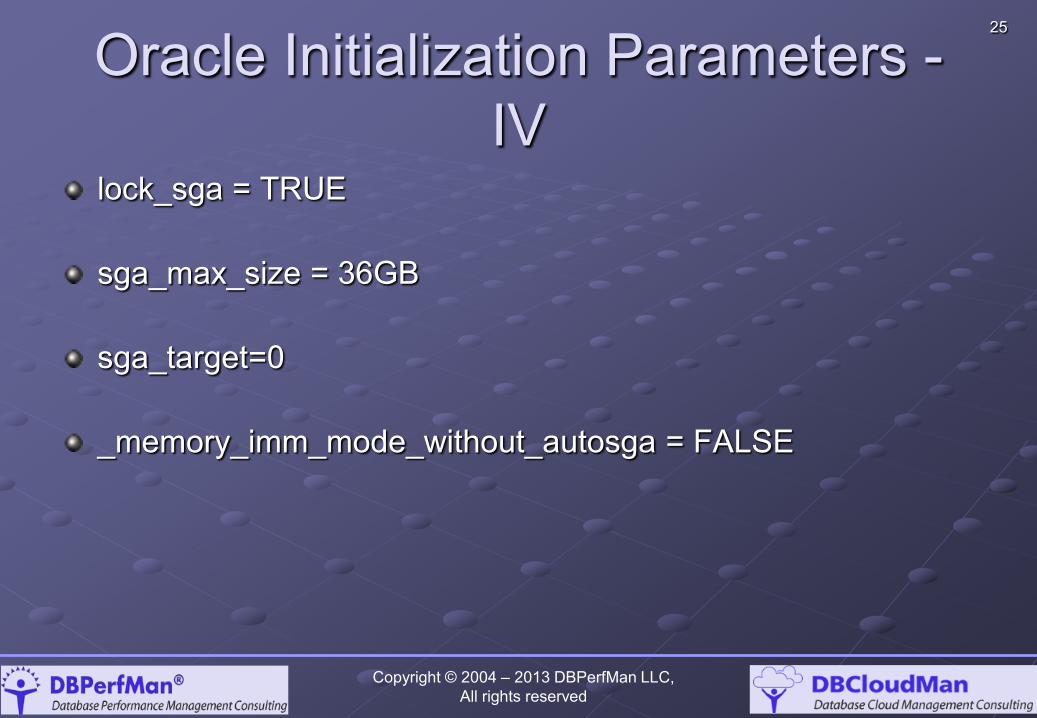
25
Oracle Initialization Parameters - IV
lock_sga = TRUE sga_max_size = 36GB sga_target=0 _memory_imm_mode_without_autosga = FALSE
Copyright © 2004 – 2013 DBPerfMan LLC, All rights reserved
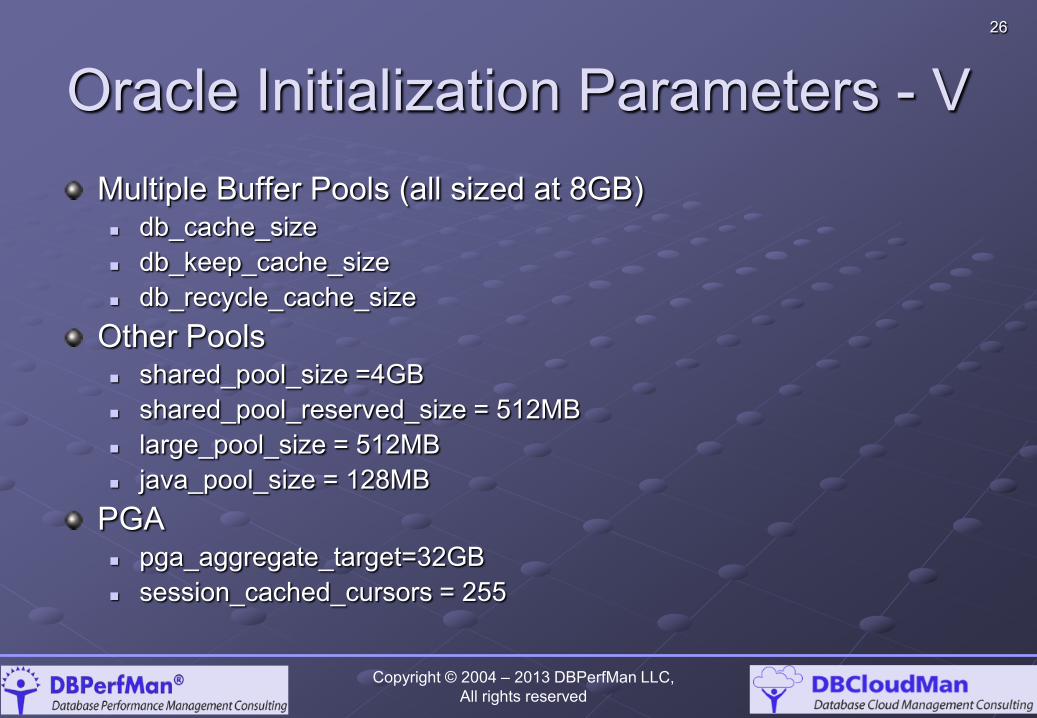
26
Oracle Initialization Parameters - V Multiple Buffer Pools (all sized at 8GB) db_cache_size db_keep_cache_size db_recycle_cache_size
Other Pools shared_pool_size =4GB shared_pool_reserved_size = 512MB large_pool_size = 512MB java_pool_size = 128MB
PGA pga_aggregate_target=32GB session_cached_cursors = 255
Copyright © 2004 – 2013 DBPerfMan LLC, All rights reserved
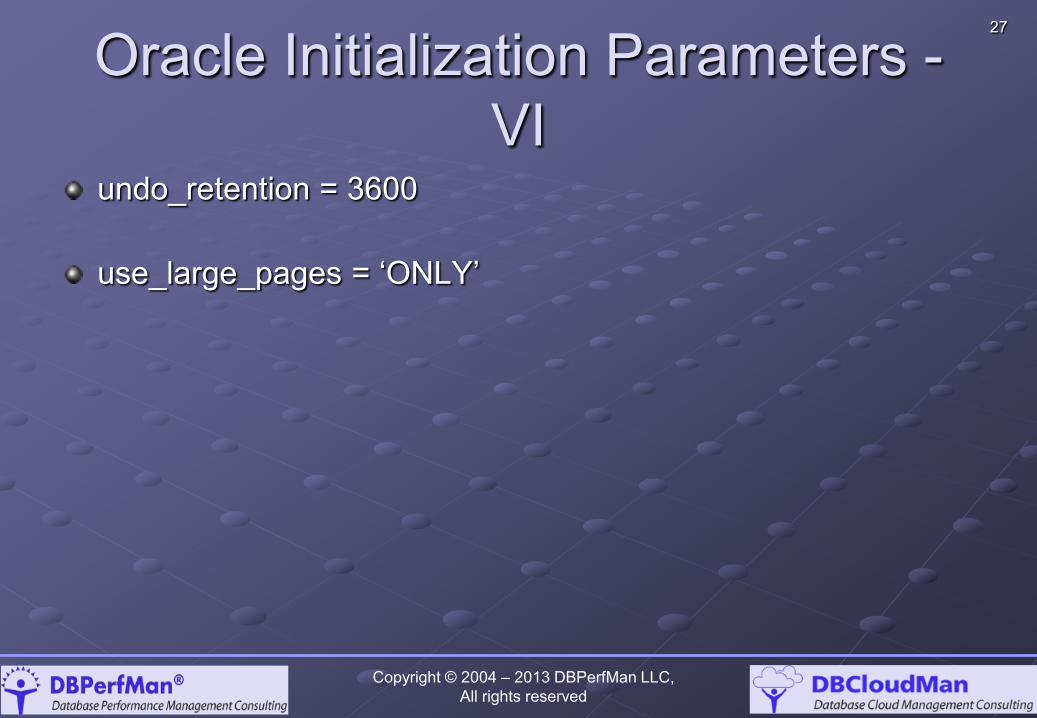
27
Oracle Initialization Parameters - VI
undo_retention = 3600 use_large_pages = ‘ONLY’
Copyright © 2004 – 2013 DBPerfMan LLC, All rights reserved

28
Tablespace Configuration Configured regular files each 31GB in size Did not use BIGFILE tablespaces Undo Corruption DFS lock handle
Configured 2 * (# of nodes) worth tempfiles for TEMP
Copyright © 2004 – 2013 DBPerfMan LLC, All rights reserved
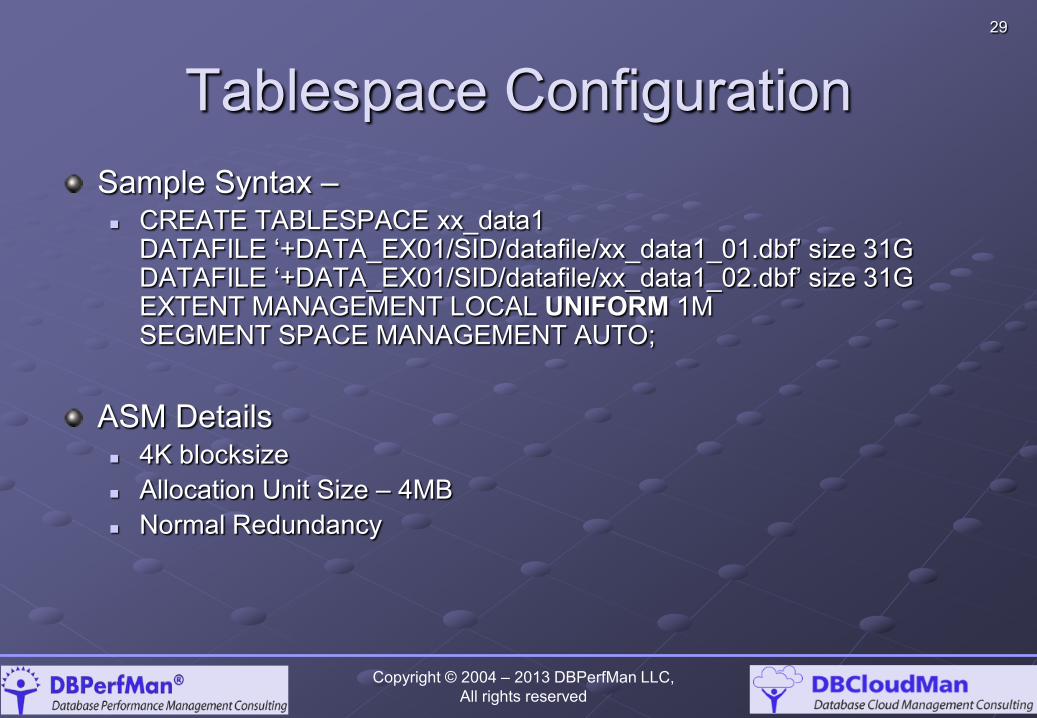
29
Tablespace Configuration Sample Syntax – CREATE TABLESPACE xx_data1
DATAFILE ‘+DATA_EX01/SID/datafile/xx_data1_01.dbf’ size 31G DATAFILE ‘+DATA_EX01/SID/datafile/xx_data1_02.dbf’ size 31G EXTENT MANAGEMENT LOCAL UNIFORM 1M SEGMENT SPACE MANAGEMENT AUTO;
ASM Details 4K blocksize Allocation Unit Size – 4MB Normal Redundancy
Copyright © 2004 – 2013 DBPerfMan LLC, All rights reserved
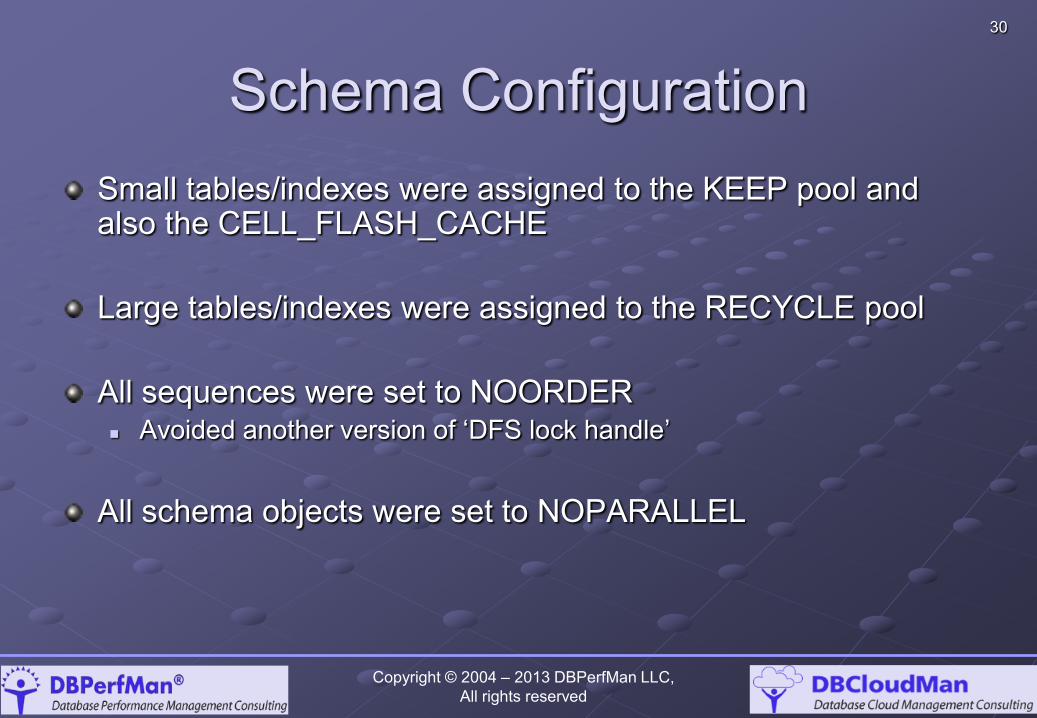
30
Schema Configuration Small tables/indexes were assigned to the KEEP pool and also the CELL_FLASH_CACHE
Large tables/indexes were assigned to the RECYCLE pool
All sequences were set to NOORDER Avoided another version of ‘DFS lock handle’
All schema objects were set to NOPARALLEL
Copyright © 2004 – 2013 DBPerfMan LLC, All rights reserved
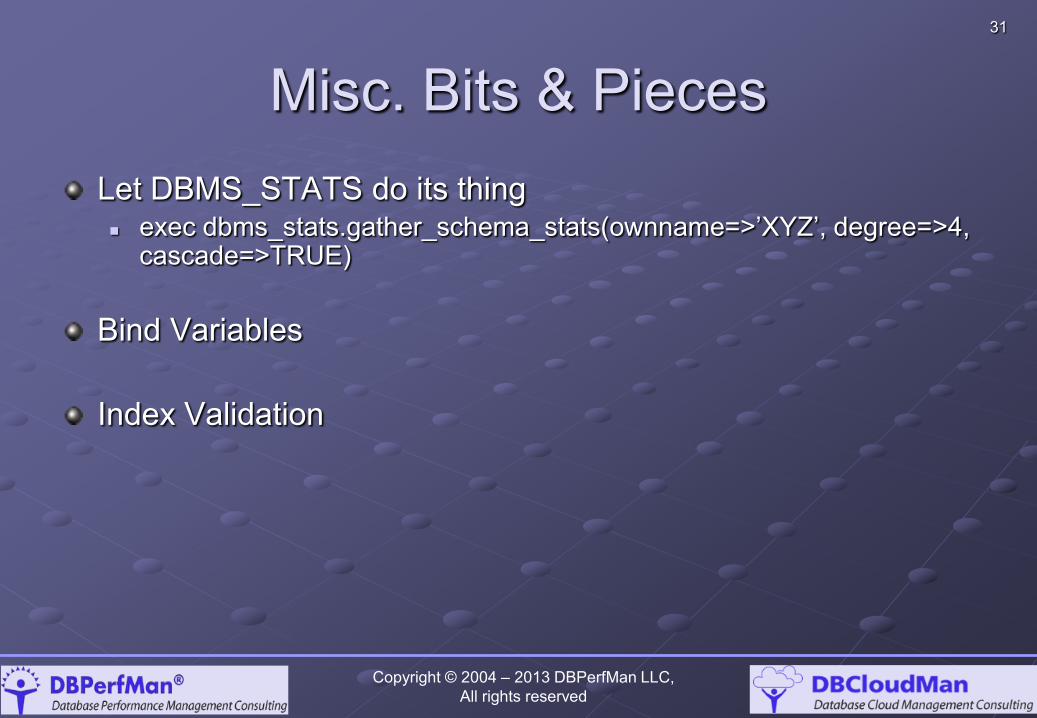
31
Misc. Bits & Pieces Let DBMS_STATS do its thing exec dbms_stats.gather_schema_stats(ownname=>’XYZ’, degree=>4,
cascade=>TRUE)
Bind Variables Index Validation
Copyright © 2004 – 2013 DBPerfMan LLC, All rights reserved
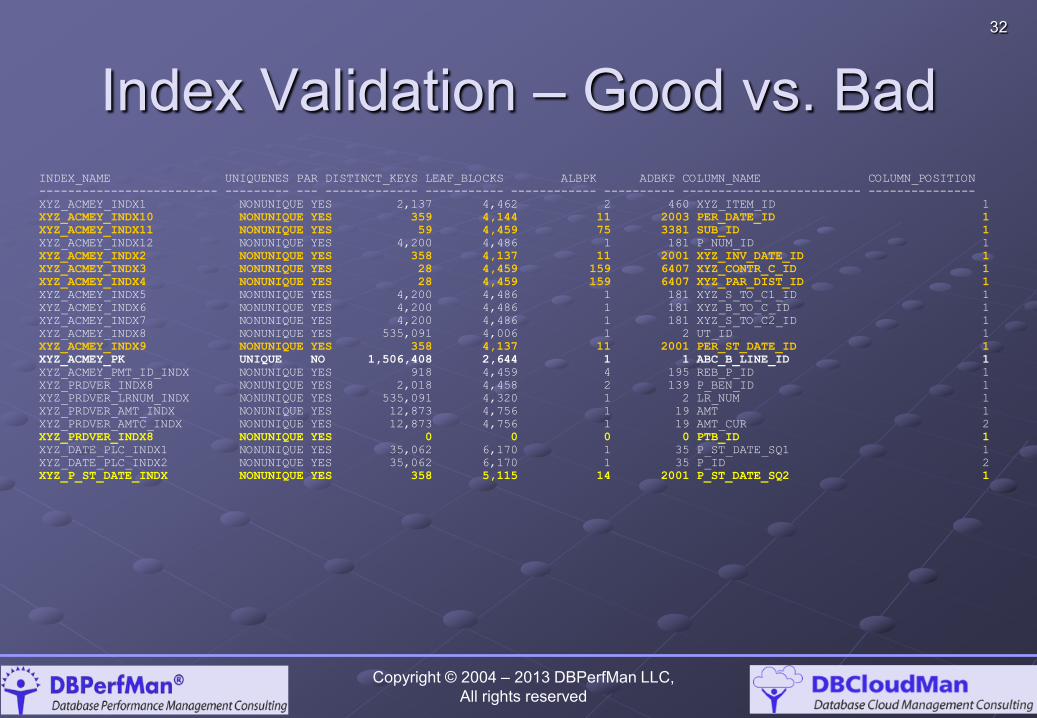
32
Index Validation – Good vs. Bad INDEX_NAME UNIQUENES PAR DISTINCT_KEYS LEAF_BLOCKS ALBPK ADBKP COLUMN_NAME COLUMN_POSITION
------------------------- --------- --- ------------- ----------- ------------ ---------- ------------------------- ---------------
XYZ_ACMEY_INDX1 NONUNIQUE YES 2,137 4,462 2 460 XYZ_ITEM_ID 1
XYZ_ACMEY_INDX10 NONUNIQUE YES 359 4,144 11 2003 PER_DATE_ID 1
XYZ_ACMEY_INDX11 NONUNIQUE YES 59 4,459 75 3381 SUB_ID 1
XYZ_ACMEY_INDX12 NONUNIQUE YES 4,200 4,486 1 181 P_NUM_ID 1
XYZ_ACMEY_INDX2 NONUNIQUE YES 358 4,137 11 2001 XYZ_INV_DATE_ID 1
XYZ_ACMEY_INDX3 NONUNIQUE YES 28 4,459 159 6407 XYZ_CONTR_C_ID 1
XYZ_ACMEY_INDX4 NONUNIQUE YES 28 4,459 159 6407 XYZ_PAR_DIST_ID 1
XYZ_ACMEY_INDX5 NONUNIQUE YES 4,200 4,486 1 181 XYZ_S_TO_C1_ID 1
XYZ_ACMEY_INDX6 NONUNIQUE YES 4,200 4,486 1 181 XYZ_B_TO_C_ID 1
XYZ_ACMEY_INDX7 NONUNIQUE YES 4,200 4,486 1 181 XYZ_S_TO_C2_ID 1
XYZ_ACMEY_INDX8 NONUNIQUE YES 535,091 4,006 1 2 UT_ID 1
XYZ_ACMEY_INDX9 NONUNIQUE YES 358 4,137 11 2001 PER_ST_DATE_ID 1
XYZ_ACMEY_PK UNIQUE NO 1,506,408 2,644 1 1 ABC_B_LINE_ID 1
XYZ_ACMEY_PMT_ID_INDX NONUNIQUE YES 918 4,459 4 195 REB_P_ID 1
XYZ_PRDVER_INDX8 NONUNIQUE YES 2,018 4,458 2 139 P_BEN_ID 1
XYZ_PRDVER_LRNUM_INDX NONUNIQUE YES 535,091 4,320 1 2 LR_NUM 1
XYZ_PRDVER_AMT_INDX NONUNIQUE YES 12,873 4,756 1 19 AMT 1
XYZ_PRDVER_AMTC_INDX NONUNIQUE YES 12,873 4,756 1 19 AMT_CUR 2
XYZ_PRDVER_INDX8 NONUNIQUE YES 0 0 0 0 PTB_ID 1
XYZ_DATE_PLC_INDX1 NONUNIQUE YES 35,062 6,170 1 35 P_ST_DATE_SQ1 1
XYZ_DATE_PLC_INDX2 NONUNIQUE YES 35,062 6,170 1 35 P_ID 2
XYZ_P_ST_DATE_INDX NONUNIQUE YES 358 5,115 14 2001 P_ST_DATE_SQ2 1
Copyright © 2004 – 2013 DBPerfMan LLC, All rights reserved
33
Web Logic Configuration
Copyright © 2004 – 2013 DBPerfMan LLC, All rights reserved
34
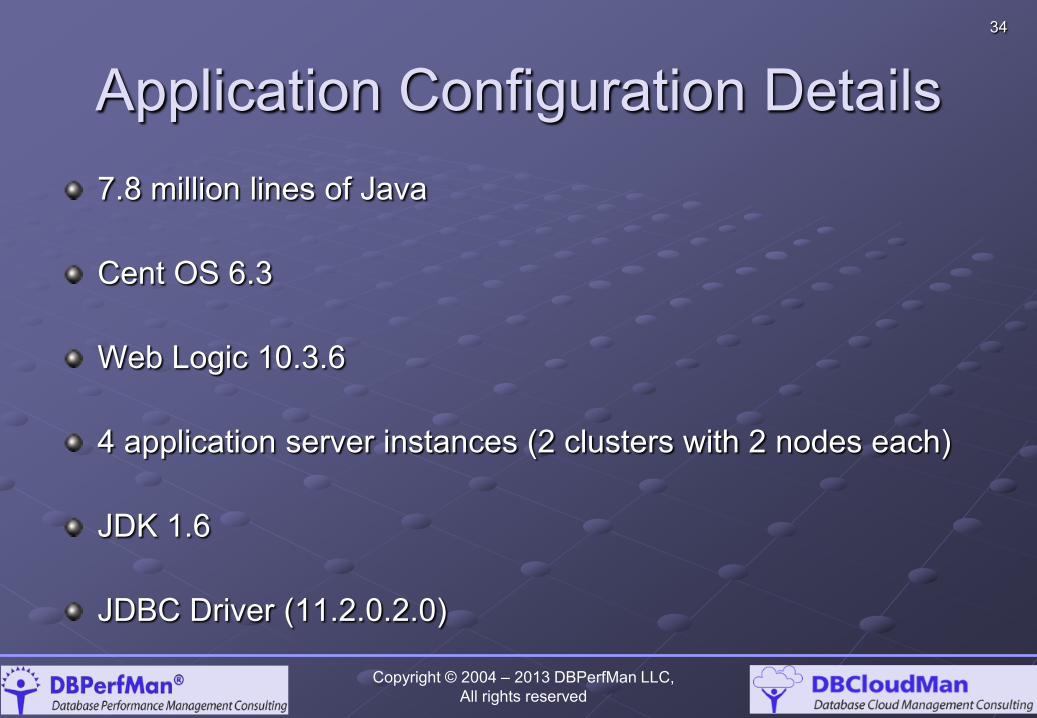
Application Configuration Details 7.8 million lines of Java Cent OS 6.3 Web Logic 10.3.6 4 application server instances (2 clusters with 2 nodes each) JDK 1.6 JDBC Driver (11.2.0.2.0)
Copyright © 2004 – 2013 DBPerfMan LLC, All rights reserved
35
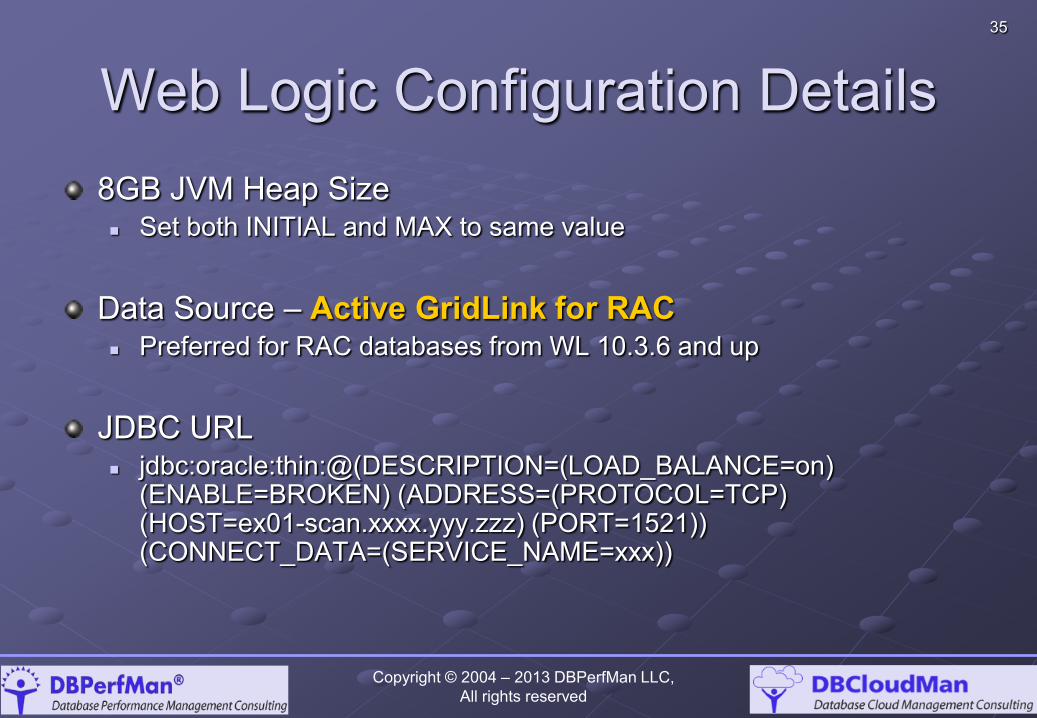
Web Logic Configuration Details 8GB JVM Heap Size Set both INITIAL and MAX to same value
Data Source – Active GridLink for RAC Preferred for RAC databases from WL 10.3.6 and up
JDBC URL jdbc:oracle:thin:@(DESCRIPTION=(LOAD_BALANCE=on)
(ENABLE=BROKEN) (ADDRESS=(PROTOCOL=TCP) (HOST=ex01-scan.xxxx.yyy.zzz) (PORT=1521)) (CONNECT_DATA=(SERVICE_NAME=xxx))
Copyright © 2004 – 2013 DBPerfMan LLC, All rights reserved

36
Web Logic Configuration – Connection Pool & Transactions Test Connections on Reserve = ENABLED
Remove Infected Connections = DISABLED
Supports Global Transactions = ENABLED
Copyright © 2004 – 2013 DBPerfMan LLC, All rights reserved
37
The Magic of Active Grid Link for RAC
Copyright © 2004 – 2013 DBPerfMan LLC, All rights reserved
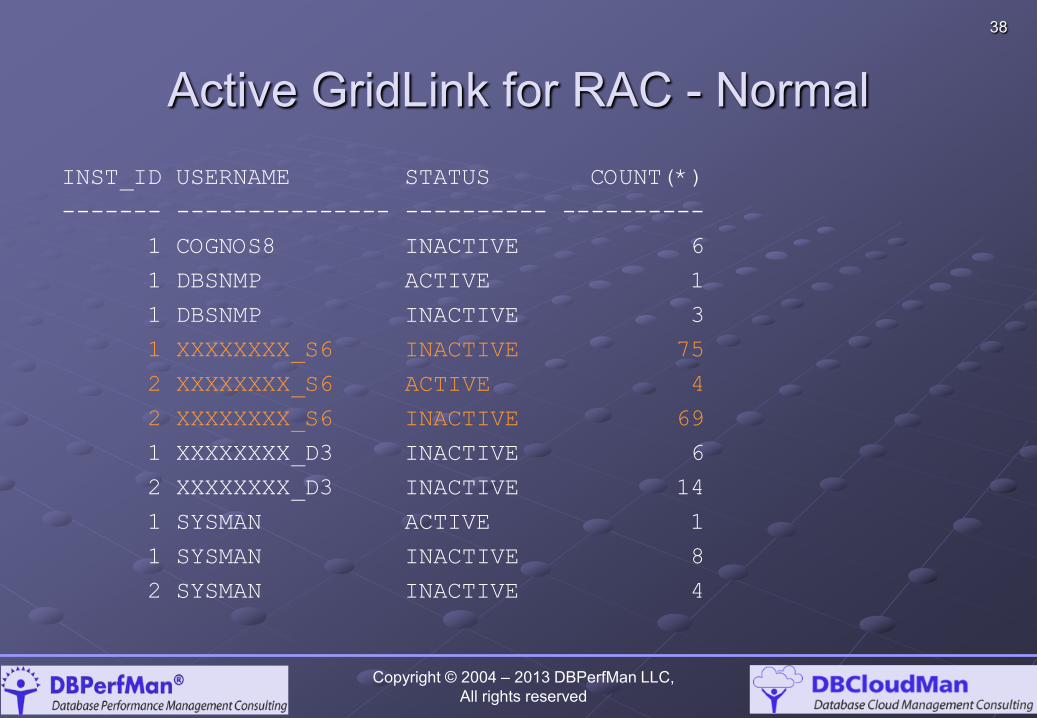
38
Active GridLink for RAC - Normal INST_ID USERNAME STATUS COUNT(*)
------- --------------- ---------- ----------
1 COGNOS8 INACTIVE 6
1 DBSNMP ACTIVE 1
1 DBSNMP INACTIVE 3
1 XXXXXXXX_S6 INACTIVE 75
2 XXXXXXXX_S6 ACTIVE 4
2 XXXXXXXX_S6 INACTIVE 69
1 XXXXXXXX_D3 INACTIVE 6
2 XXXXXXXX_D3 INACTIVE 14
1 SYSMAN ACTIVE 1
1 SYSMAN INACTIVE 8
2 SYSMAN INACTIVE 4
Copyright © 2004 – 2013 DBPerfMan LLC, All rights reserved
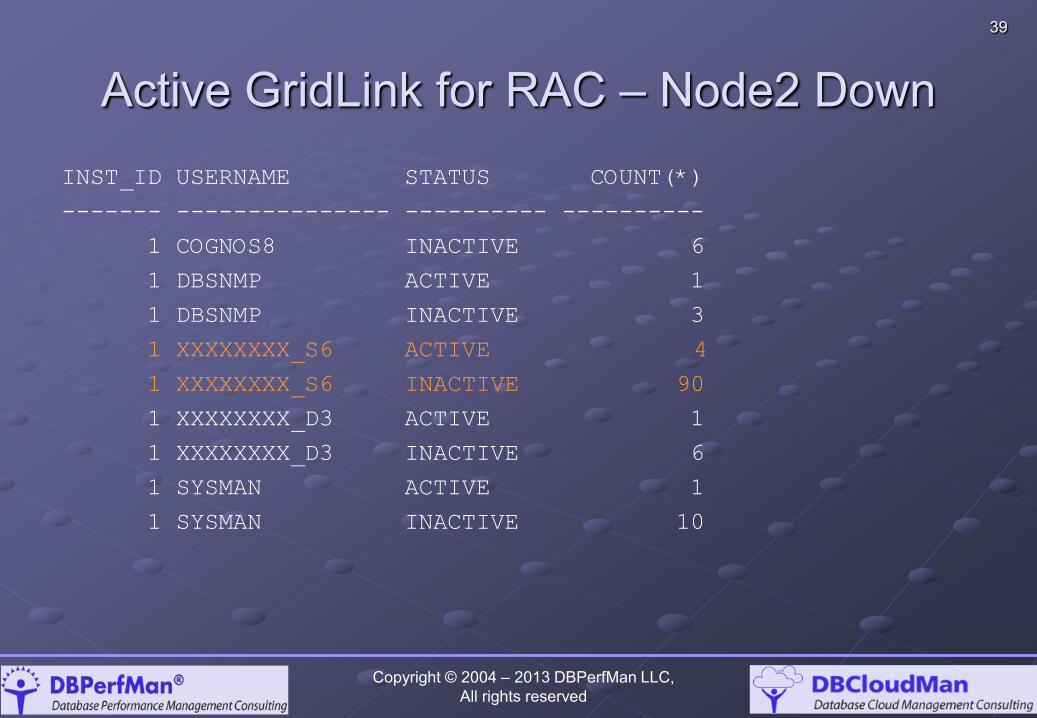
39
Active GridLink for RAC – Node2 Down INST_ID USERNAME STATUS COUNT(*)
------- --------------- ---------- ----------
1 COGNOS8 INACTIVE 6
1 DBSNMP ACTIVE 1
1 DBSNMP INACTIVE 3
1 XXXXXXXX_S6 ACTIVE 4
1 XXXXXXXX_S6 INACTIVE 90
1 XXXXXXXX_D3 ACTIVE 1
1 XXXXXXXX_D3 INACTIVE 6
1 SYSMAN ACTIVE 1
1 SYSMAN INACTIVE 10
Copyright © 2004 – 2013 DBPerfMan LLC, All rights reserved
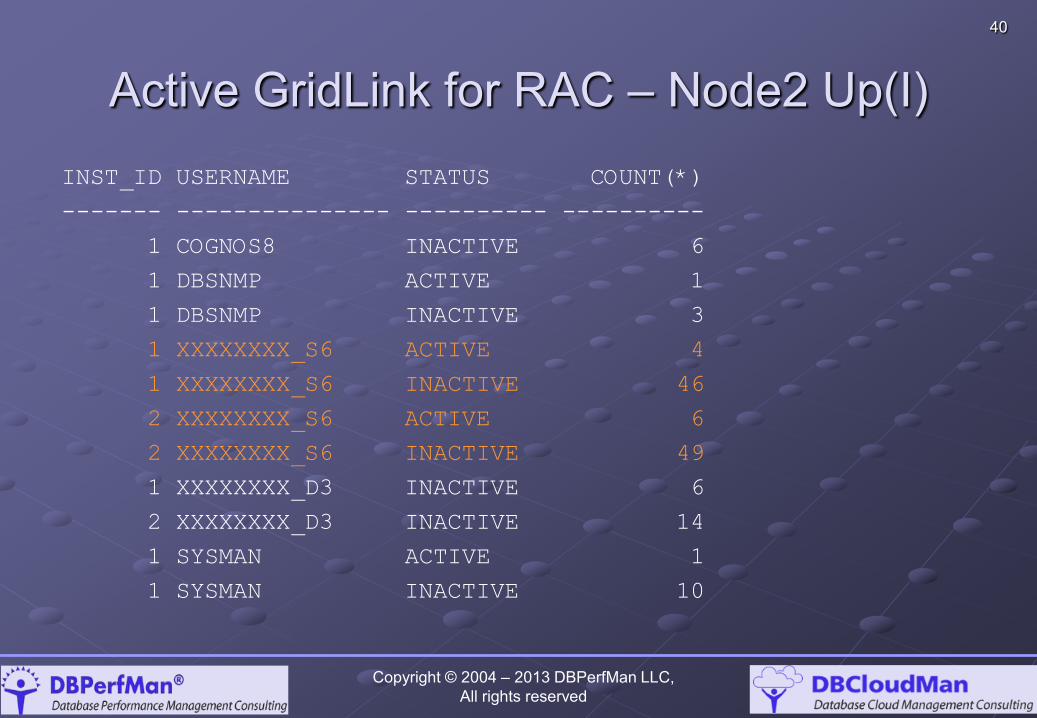
40
Active GridLink for RAC – Node2 Up(I) INST_ID USERNAME STATUS COUNT(*)
------- --------------- ---------- ----------
1 COGNOS8 INACTIVE 6
1 DBSNMP ACTIVE 1
1 DBSNMP INACTIVE 3
1 XXXXXXXX_S6 ACTIVE 4
1 XXXXXXXX_S6 INACTIVE 46
2 XXXXXXXX_S6 ACTIVE 6
2 XXXXXXXX_S6 INACTIVE 49
1 XXXXXXXX_D3 INACTIVE 6
2 XXXXXXXX_D3 INACTIVE 14
1 SYSMAN ACTIVE 1
1 SYSMAN INACTIVE 10
Copyright © 2004 – 2013 DBPerfMan LLC, All rights reserved

41
Active GridLink for RAC – Node2 Up(II) INST_ID USERNAME STATUS COUNT(*)
------- --------------- ---------- ----------
1 COGNOS8 INACTIVE 6
1 DBSNMP ACTIVE 1
1 DBSNMP INACTIVE 3
1 XXXXXXXX_S6 INACTIVE 52
2 XXXXXXXX_S6 INACTIVE 57
1 XXXXXXXX_D3 INACTIVE 6
2 XXXXXXXX_D3 INACTIVE 14
1 SYSMAN ACTIVE 1
1 SYSMAN INACTIVE 10
Copyright © 2004 – 2013 DBPerfMan LLC, All rights reserved

42
Active GridLink for RAC – Node2 Up(III) INST_ID USERNAME STATUS COUNT(*)
------- --------------- ---------- ----------
1 COGNOS8 INACTIVE 6
1 DBSNMP ACTIVE 1
1 DBSNMP INACTIVE 3
1 XXXXXXXX_S6 ACTIVE 7
1 XXXXXXXX_S6 INACTIVE 64
2 XXXXXXXX_S6 ACTIVE 8
2 XXXXXXXX_S6 INACTIVE 66
1 XXXXXXXX_D3 INACTIVE 6
2 XXXXXXXX_D3 INACTIVE 14
1 SYSMAN ACTIVE 1
1 SYSMAN INACTIVE 9
Copyright © 2004 – 2013 DBPerfMan LLC, All rights reserved
43
Oracle Net Optimizations
Copyright © 2004 – 2013 DBPerfMan LLC, All rights reserved
44
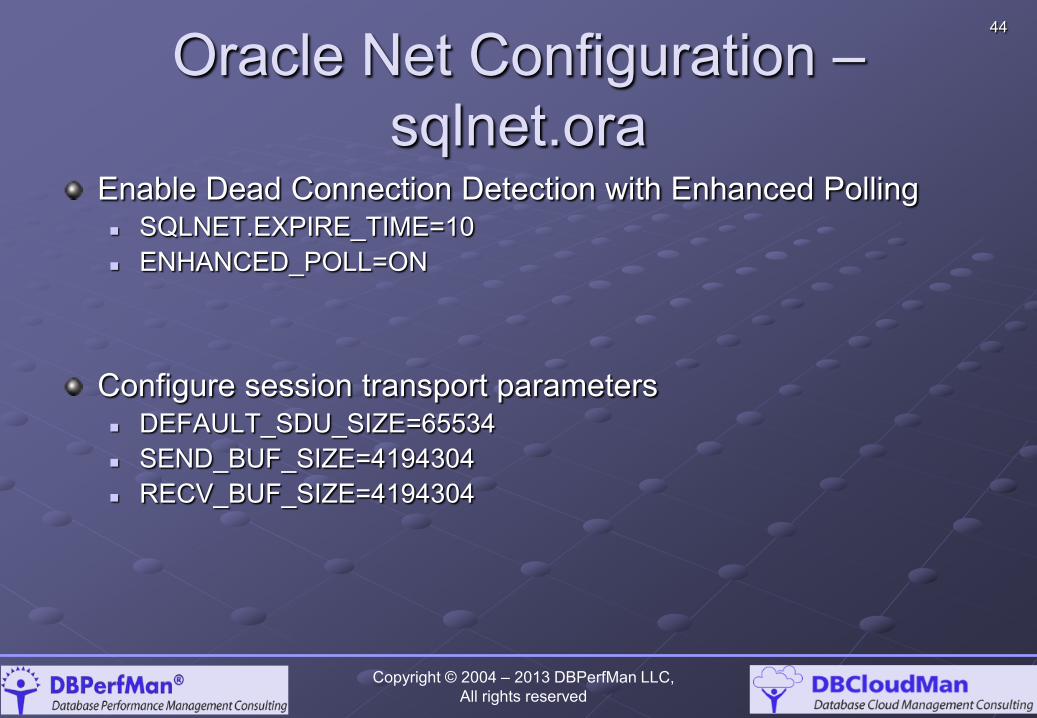
Oracle Net Configuration – sqlnet.ora
Enable Dead Connection Detection with Enhanced Polling SQLNET.EXPIRE_TIME=10 ENHANCED_POLL=ON
Configure session transport parameters DEFAULT_SDU_SIZE=65534 SEND_BUF_SIZE=4194304 RECV_BUF_SIZE=4194304
Copyright © 2004 – 2013 DBPerfMan LLC, All rights reserved

45
Partitioning Decisions
Copyright © 2004 – 2013 DBPerfMan LLC, All rights reserved
46
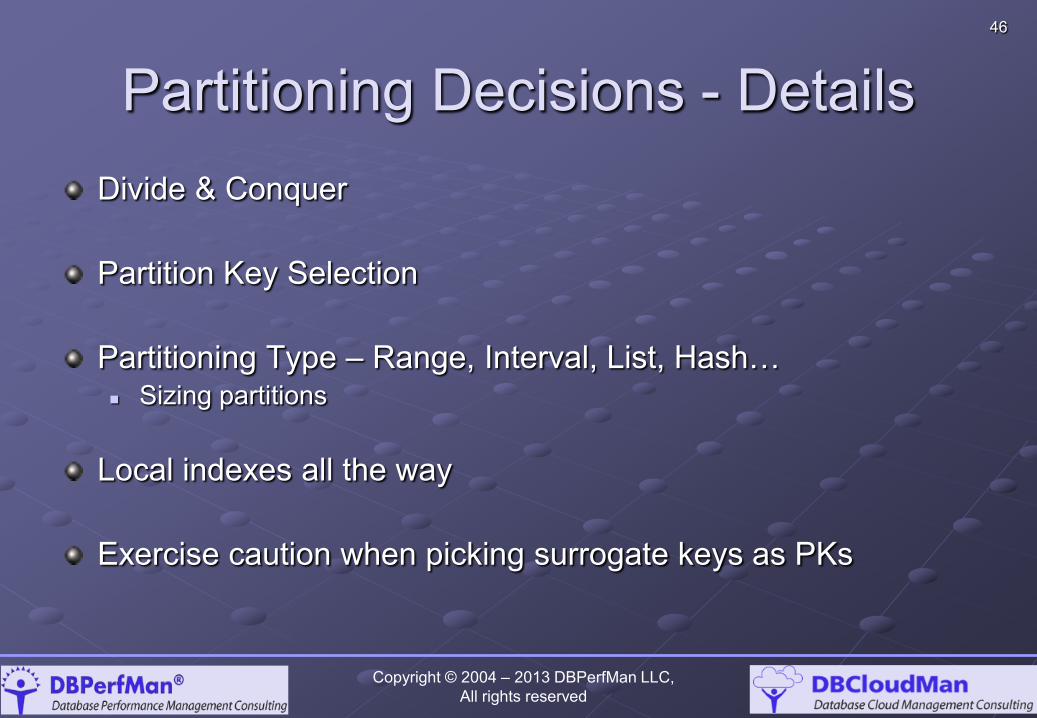
Partitioning Decisions - Details Divide & Conquer Partition Key Selection Partitioning Type – Range, Interval, List, Hash… Sizing partitions
Local indexes all the way Exercise caution when picking surrogate keys as PKs
Copyright © 2004 – 2013 DBPerfMan LLC, All rights reserved
47
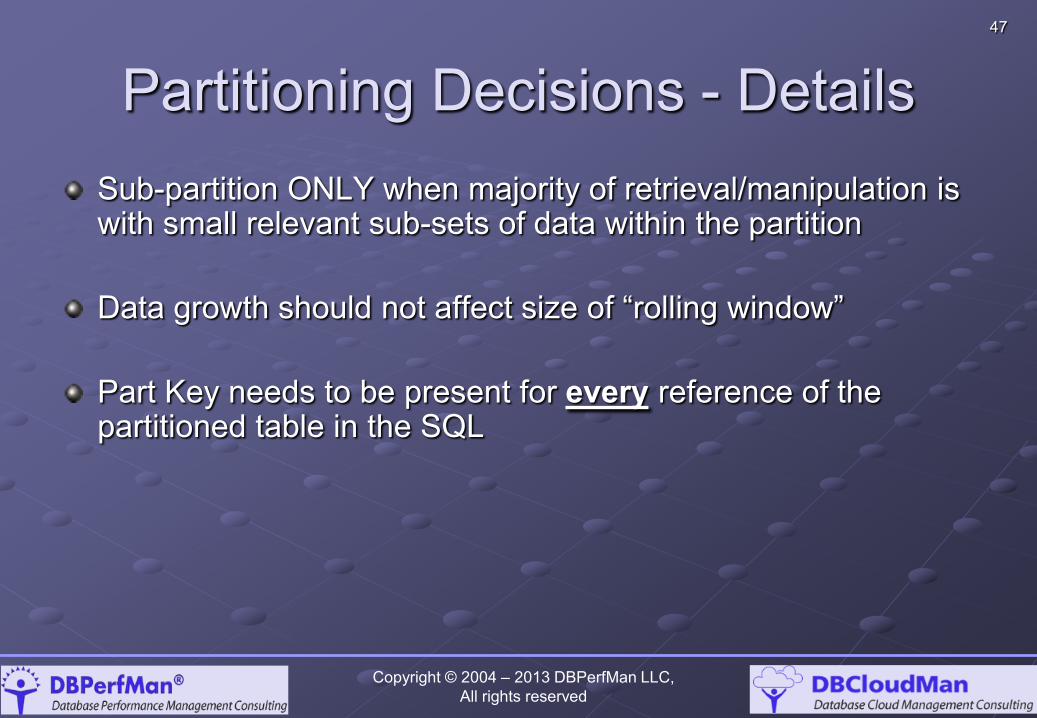
Partitioning Decisions - Details Sub-partition ONLY when majority of retrieval/manipulation is with small relevant sub-sets of data within the partition Data growth should not affect size of “rolling window” Part Key needs to be present for every reference of the partitioned table in the SQL
Copyright © 2004 – 2013 DBPerfMan LLC, All rights reserved
48
Parallelism – Application vs. Database
Copyright © 2004 – 2013 DBPerfMan LLC, All rights reserved
49
Parallelism – Guiding Principles Performance Spectrum (Parallelism-- -- --Concurrency) All schema objects were set to NOPARALLEL Disabled Auto Degree of Parallelism (DOP) Selectively parallelized only when required and relevant
Extensively used application-driven parallelism
Copyright © 2004 – 2013 DBPerfMan LLC, All rights reserved
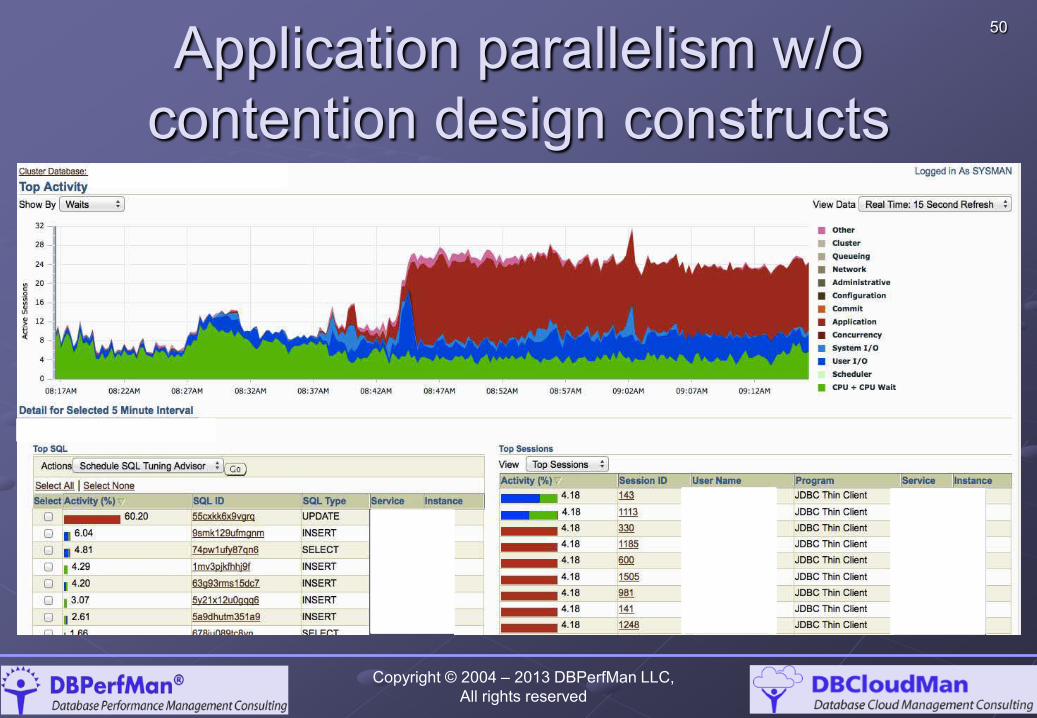
50 Application parallelism w/o contention design constructs
Copyright © 2004 – 2013 DBPerfMan LLC, All rights reserved
51
Application Parallelism Constructs Thread-based Affect of DDLs Base table can be interval partitioned to support dynamism Each app thread manipulates its own partition Dynamic modification of parallelism using “thread-pool configuration” Requires additional code
Copyright © 2004 – 2013 DBPerfMan LLC, All rights reserved
52
DB Parallelism Constructs Hinting - /*+ PARALLEL(t,8) */ on table alias t PDML DDLs ffects the “state of an application transaction” Difficult to incorporate into a standard connection pool setup No dynamism for parallelism when job is “in flight” No additional code required
Copyright © 2004 – 2013 DBPerfMan LLC, All rights reserved

53
Analysis of low-level traces
Copyright © 2004 – 2013 DBPerfMan LLC, All rights reserved
54
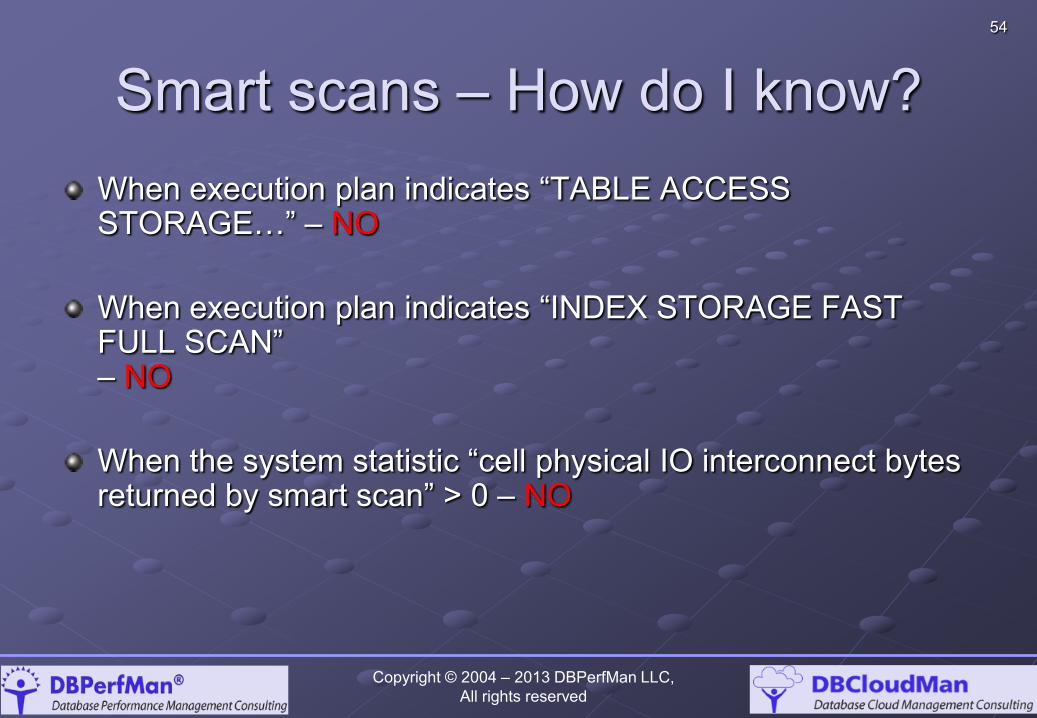
Smart scans – How do I know? When execution plan indicates “TABLE ACCESS STORAGE…” – NO When execution plan indicates “INDEX STORAGE FAST FULL SCAN” – NO When the system statistic “cell physical IO interconnect bytes returned by smart scan” > 0 – NO
Copyright © 2004 – 2013 DBPerfMan LLC, All rights reserved
55
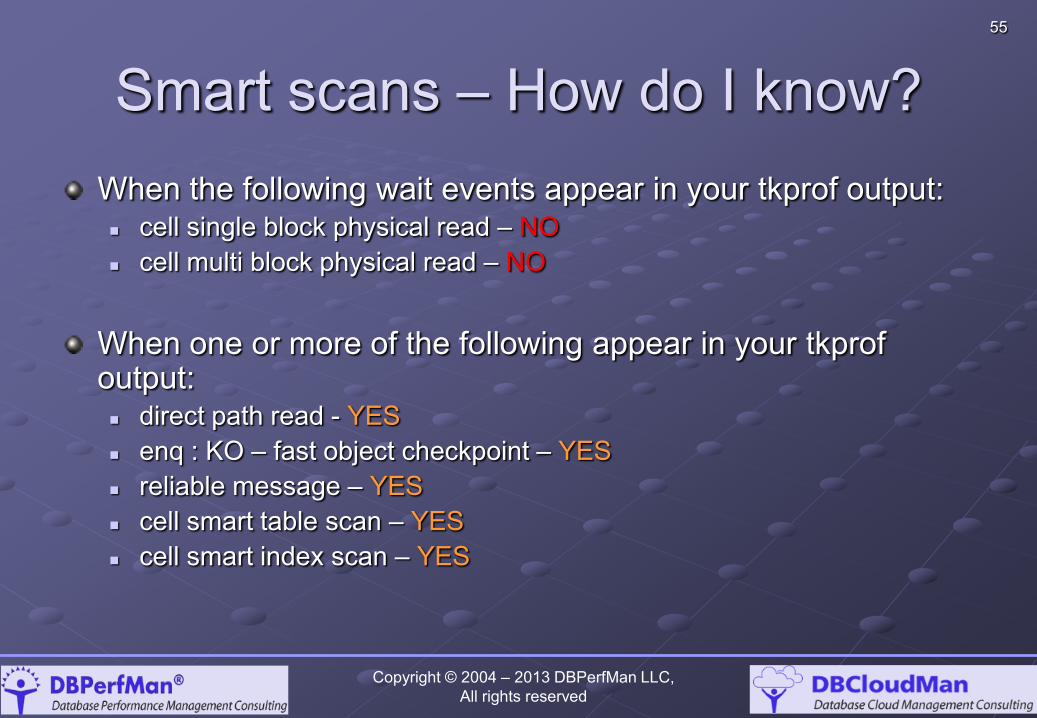
Smart scans – How do I know? When the following wait events appear in your tkprof output: cell single block physical read – NO cell multi block physical read – NO
When one or more of the following appear in your tkprof output: direct path read - YES enq : KO – fast object checkpoint – YES reliable message – YES cell smart table scan – YES cell smart index scan – YES
Copyright © 2004 – 2013 DBPerfMan LLC, All rights reserved
56
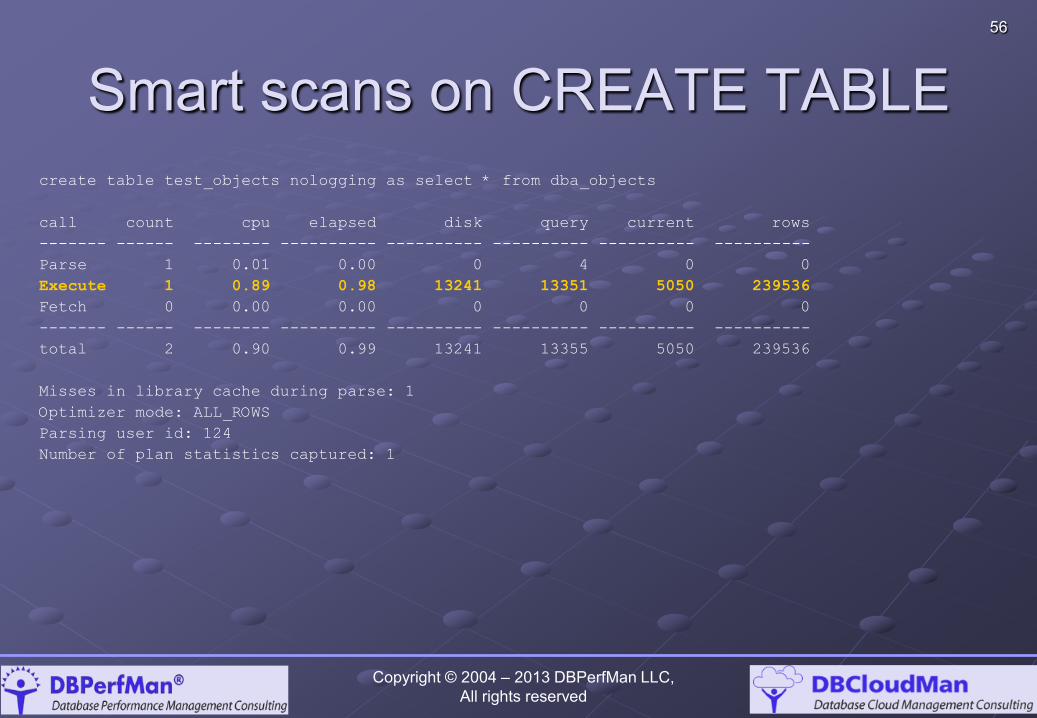
Smart scans on CREATE TABLE create table test_objects nologging as select * from dba_objects
call count cpu elapsed disk query current rows
------- ------ -------- ---------- ---------- ---------- ---------- ----------
Parse 1 0.01 0.00 0 4 0 0
Execute 1 0.89 0.98 13241 13351 5050 239536
Fetch 0 0.00 0.00 0 0 0 0
------- ------ -------- ---------- ---------- ---------- ---------- ----------
total 2 0.90 0.99 13241 13355 5050 239536
Misses in library cache during parse: 1
Optimizer mode: ALL_ROWS
Parsing user id: 124
Number of plan statistics captured: 1
Copyright © 2004 – 2013 DBPerfMan LLC, All rights reserved
57
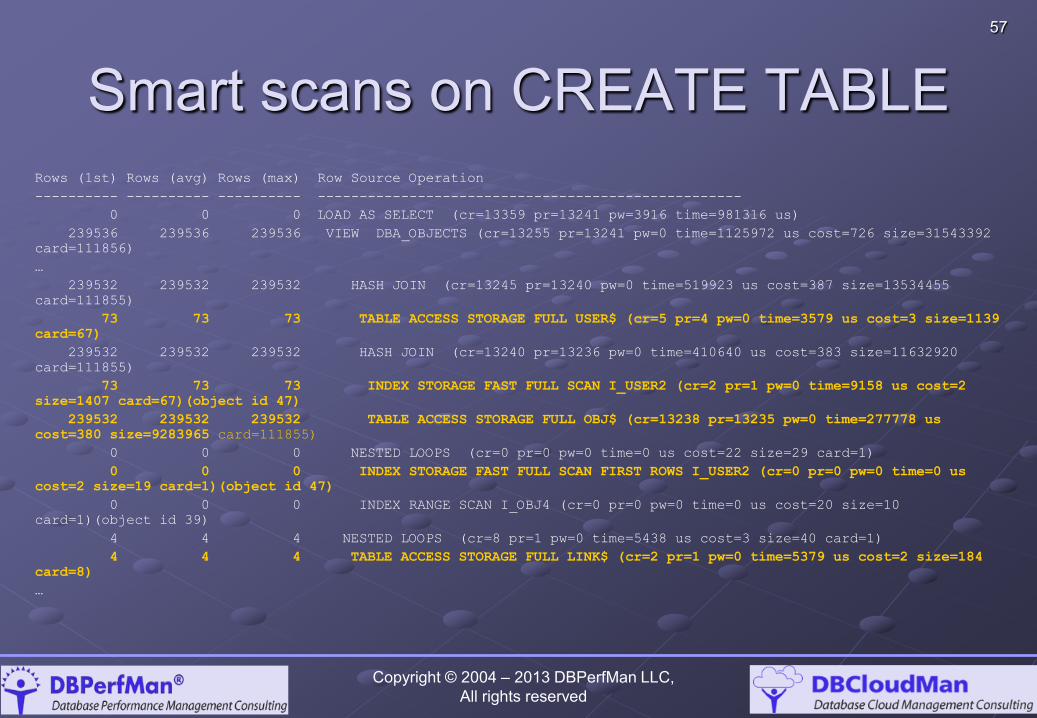
Smart scans on CREATE TABLE Rows (1st) Rows (avg) Rows (max) Row Source Operation
---------- ---------- ---------- ---------------------------------------------------
0 0 0 LOAD AS SELECT (cr=13359 pr=13241 pw=3916 time=981316 us)
239536 239536 239536 VIEW DBA_OBJECTS (cr=13255 pr=13241 pw=0 time=1125972 us cost=726 size=31543392
card=111856)
…
239532 239532 239532 HASH JOIN (cr=13245 pr=13240 pw=0 time=519923 us cost=387 size=13534455
card=111855)
73 73 73 TABLE ACCESS STORAGE FULL USER$ (cr=5 pr=4 pw=0 time=3579 us cost=3 size=1139
card=67)
239532 239532 239532 HASH JOIN (cr=13240 pr=13236 pw=0 time=410640 us cost=383 size=11632920
card=111855)
73 73 73 INDEX STORAGE FAST FULL SCAN I_USER2 (cr=2 pr=1 pw=0 time=9158 us cost=2
size=1407 card=67)(object id 47)
239532 239532 239532 TABLE ACCESS STORAGE FULL OBJ$ (cr=13238 pr=13235 pw=0 time=277778 us
cost=380 size=9283965 card=111855)
0 0 0 NESTED LOOPS (cr=0 pr=0 pw=0 time=0 us cost=22 size=29 card=1)
0 0 0 INDEX STORAGE FAST FULL SCAN FIRST ROWS I_USER2 (cr=0 pr=0 pw=0 time=0 us
cost=2 size=19 card=1)(object id 47)
0 0 0 INDEX RANGE SCAN I_OBJ4 (cr=0 pr=0 pw=0 time=0 us cost=20 size=10
card=1)(object id 39)
4 4 4 NESTED LOOPS (cr=8 pr=1 pw=0 time=5438 us cost=3 size=40 card=1)
4 4 4 TABLE ACCESS STORAGE FULL LINK$ (cr=2 pr=1 pw=0 time=5379 us cost=2 size=184
card=8)
…
Copyright © 2004 – 2013 DBPerfMan LLC, All rights reserved
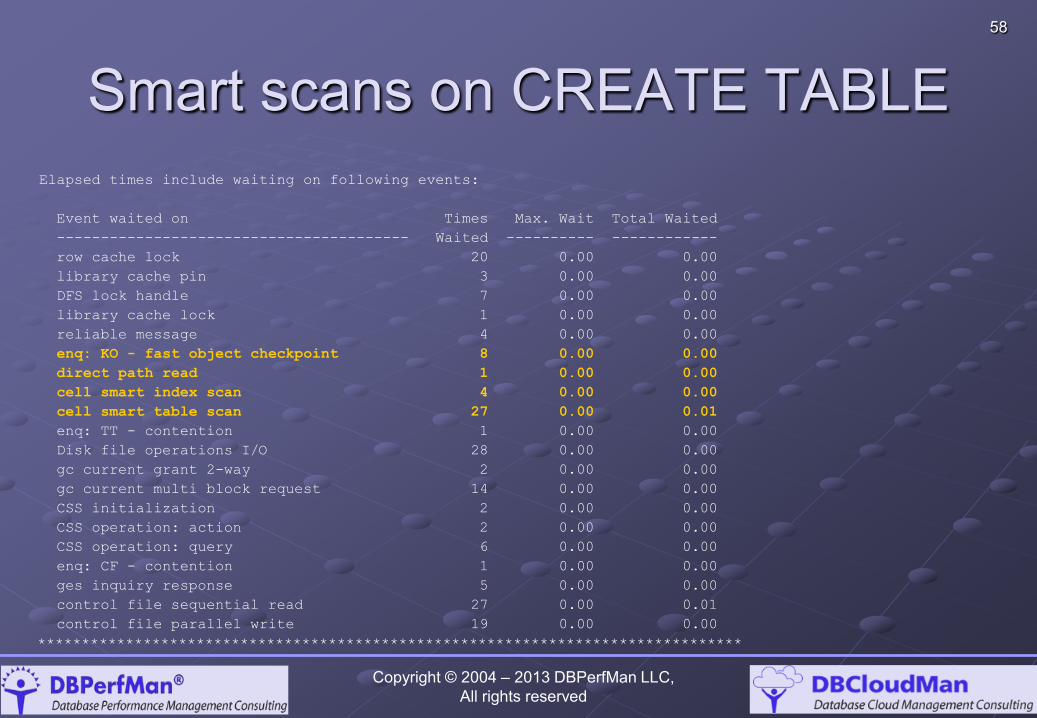
58
Smart scans on CREATE TABLE Elapsed times include waiting on following events:
Event waited on Times Max. Wait Total Waited
---------------------------------------- Waited ---------- ------------
row cache lock 20 0.00 0.00
library cache pin 3 0.00 0.00
DFS lock handle 7 0.00 0.00
library cache lock 1 0.00 0.00
reliable message 4 0.00 0.00
enq: KO - fast object checkpoint 8 0.00 0.00
direct path read 1 0.00 0.00
cell smart index scan 4 0.00 0.00
cell smart table scan 27 0.00 0.01
enq: TT - contention 1 0.00 0.00
Disk file operations I/O 28 0.00 0.00
gc current grant 2-way 2 0.00 0.00
gc current multi block request 14 0.00 0.00
CSS initialization 2 0.00 0.00
CSS operation: action 2 0.00 0.00
CSS operation: query 6 0.00 0.00
enq: CF - contention 1 0.00 0.00
ges inquiry response 5 0.00 0.00
control file sequential read 27 0.00 0.01
control file parallel write 19 0.00 0.00
********************************************************************************
Copyright © 2004 – 2013 DBPerfMan LLC, All rights reserved
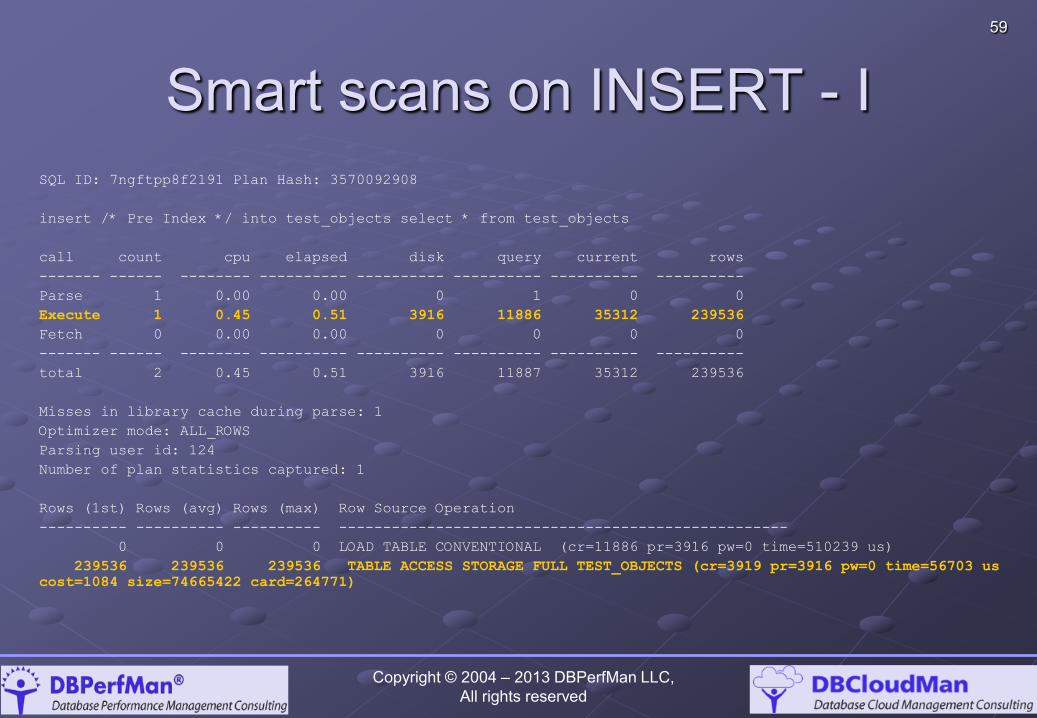
59
Smart scans on INSERT - I SQL ID: 7ngftpp8f2191 Plan Hash: 3570092908
insert /* Pre Index */ into test_objects select * from test_objects
call count cpu elapsed disk query current rows
------- ------ -------- ---------- ---------- ---------- ---------- ----------
Parse 1 0.00 0.00 0 1 0 0
Execute 1 0.45 0.51 3916 11886 35312 239536
Fetch 0 0.00 0.00 0 0 0 0
------- ------ -------- ---------- ---------- ---------- ---------- ----------
total 2 0.45 0.51 3916 11887 35312 239536
Misses in library cache during parse: 1
Optimizer mode: ALL_ROWS
Parsing user id: 124
Number of plan statistics captured: 1
Rows (1st) Rows (avg) Rows (max) Row Source Operation
---------- ---------- ---------- ---------------------------------------------------
0 0 0 LOAD TABLE CONVENTIONAL (cr=11886 pr=3916 pw=0 time=510239 us)
239536 239536 239536 TABLE ACCESS STORAGE FULL TEST_OBJECTS (cr=3919 pr=3916 pw=0 time=56703 us
cost=1084 size=74665422 card=264771)
Copyright © 2004 – 2013 DBPerfMan LLC, All rights reserved
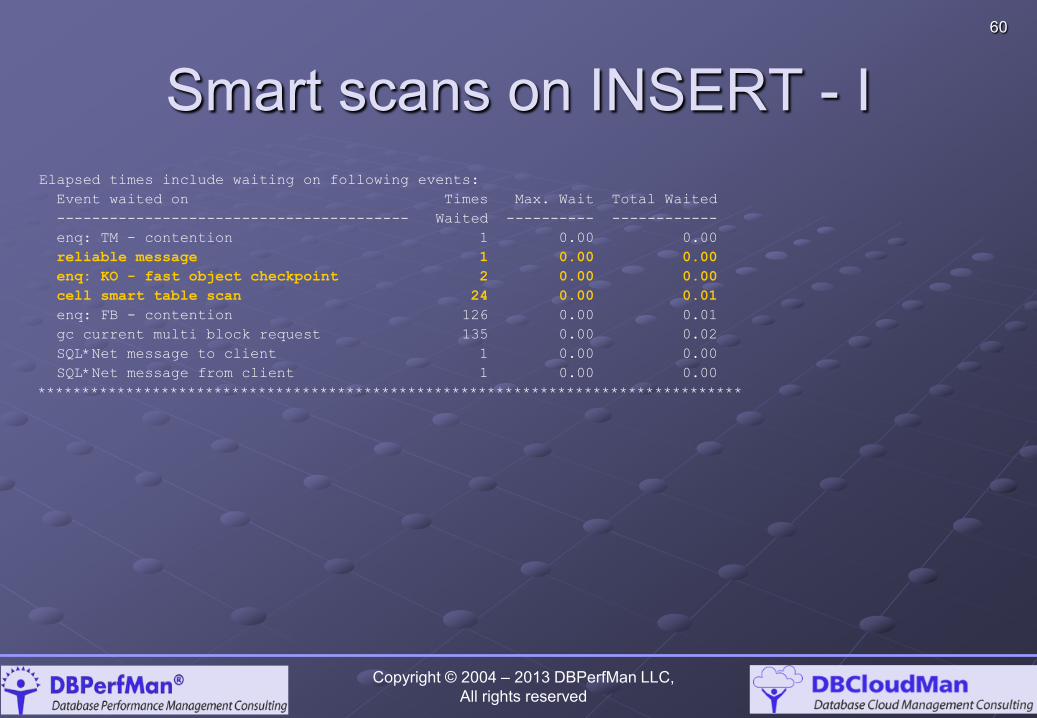
60
Smart scans on INSERT - I Elapsed times include waiting on following events:
Event waited on Times Max. Wait Total Waited
---------------------------------------- Waited ---------- ------------
enq: TM - contention 1 0.00 0.00
reliable message 1 0.00 0.00
enq: KO - fast object checkpoint 2 0.00 0.00
cell smart table scan 24 0.00 0.01
enq: FB - contention 126 0.00 0.01
gc current multi block request 135 0.00 0.02
SQL*Net message to client 1 0.00 0.00
SQL*Net message from client 1 0.00 0.00
********************************************************************************
Copyright © 2004 – 2013 DBPerfMan LLC, All rights reserved

61
Smart scans on INSERT - II SQL ID: 16srq9pbhtv2f Plan Hash: 3570092908
insert into /* Post Index */ test_objects select * from test_objects
call count cpu elapsed disk query current rows
------- ------ -------- ---------- ---------- ---------- ---------- ----------
Parse 1 0.00 0.00 0 3 1 0
Execute 1 27.10 30.74 63270 327255 4959980 3832576
Fetch 0 0.00 0.00 0 0 0 0
------- ------ -------- ---------- ---------- ---------- ---------- ----------
total 2 27.11 30.75 63270 327258 4959981 3832576
Misses in library cache during parse: 1
Optimizer mode: ALL_ROWS
Parsing user id: 124
Number of plan statistics captured: 1
Rows (1st) Rows (avg) Rows (max) Row Source Operation
---------- ---------- ---------- ---------------------------------------------------
0 0 0 LOAD TABLE CONVENTIONAL (cr=327267 pr=63270 pw=0 time=30750328 us)
3832576 3832576 3832576 TABLE ACCESS STORAGE FULL TEST_OBJECTS (cr=63270 pr=63257 pw=0 time=1666524
us cost=17392 size=1002093768 card=3553524)
Copyright © 2004 – 2013 DBPerfMan LLC, All rights reserved
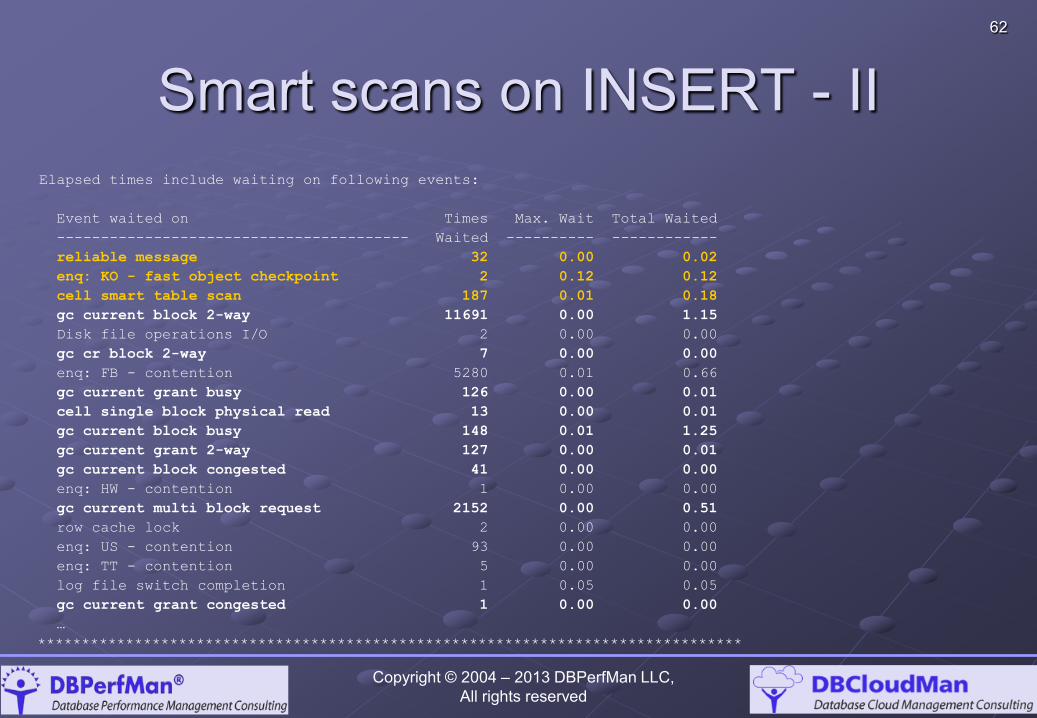
62
Smart scans on INSERT - II Elapsed times include waiting on following events:
Event waited on Times Max. Wait Total Waited
---------------------------------------- Waited ---------- ------------
reliable message 32 0.00 0.02
enq: KO - fast object checkpoint 2 0.12 0.12
cell smart table scan 187 0.01 0.18
gc current block 2-way 11691 0.00 1.15
Disk file operations I/O 2 0.00 0.00
gc cr block 2-way 7 0.00 0.00
enq: FB - contention 5280 0.01 0.66
gc current grant busy 126 0.00 0.01
cell single block physical read 13 0.00 0.01
gc current block busy 148 0.01 1.25
gc current grant 2-way 127 0.00 0.01
gc current block congested 41 0.00 0.00
enq: HW - contention 1 0.00 0.00
gc current multi block request 2152 0.00 0.51
row cache lock 2 0.00 0.00
enq: US - contention 93 0.00 0.00
enq: TT - contention 5 0.00 0.00
log file switch completion 1 0.05 0.05
gc current grant congested 1 0.00 0.00
…
********************************************************************************
Copyright © 2004 – 2013 DBPerfMan LLC, All rights reserved
63
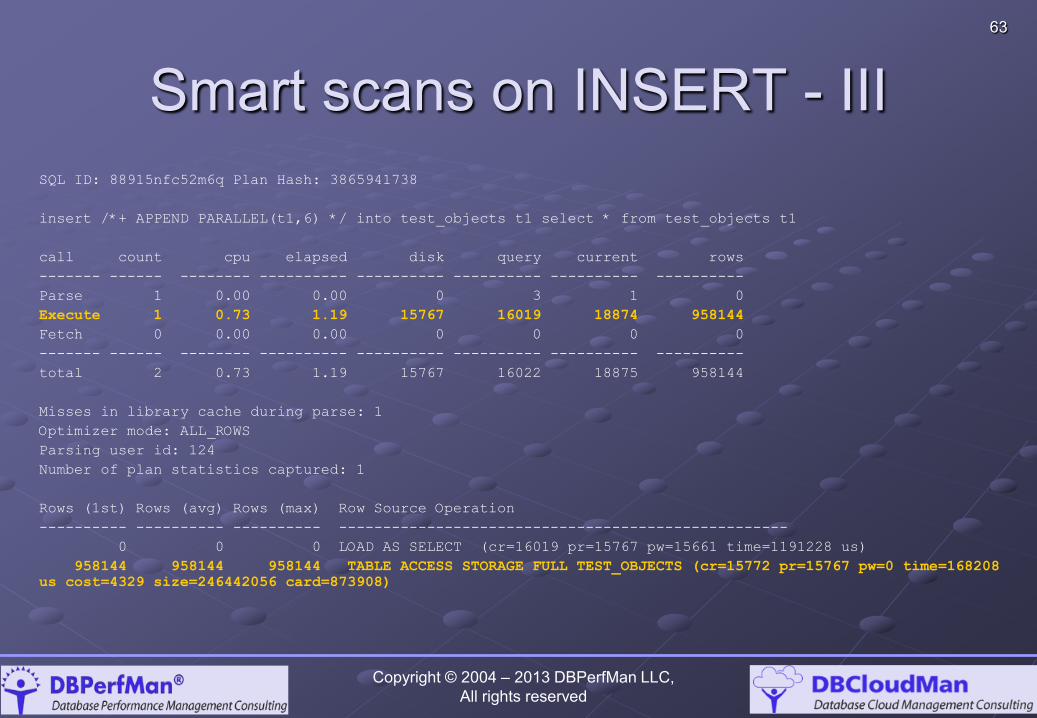
Smart scans on INSERT - III SQL ID: 88915nfc52m6q Plan Hash: 3865941738
insert /*+ APPEND PARALLEL(t1,6) */ into test_objects t1 select * from test_objects t1
call count cpu elapsed disk query current rows
------- ------ -------- ---------- ---------- ---------- ---------- ----------
Parse 1 0.00 0.00 0 3 1 0
Execute 1 0.73 1.19 15767 16019 18874 958144
Fetch 0 0.00 0.00 0 0 0 0
------- ------ -------- ---------- ---------- ---------- ---------- ----------
total 2 0.73 1.19 15767 16022 18875 958144
Misses in library cache during parse: 1
Optimizer mode: ALL_ROWS
Parsing user id: 124
Number of plan statistics captured: 1
Rows (1st) Rows (avg) Rows (max) Row Source Operation
---------- ---------- ---------- ---------------------------------------------------
0 0 0 LOAD AS SELECT (cr=16019 pr=15767 pw=15661 time=1191228 us)
958144 958144 958144 TABLE ACCESS STORAGE FULL TEST_OBJECTS (cr=15772 pr=15767 pw=0 time=168208
us cost=4329 size=246442056 card=873908)
Copyright © 2004 – 2013 DBPerfMan LLC, All rights reserved
64
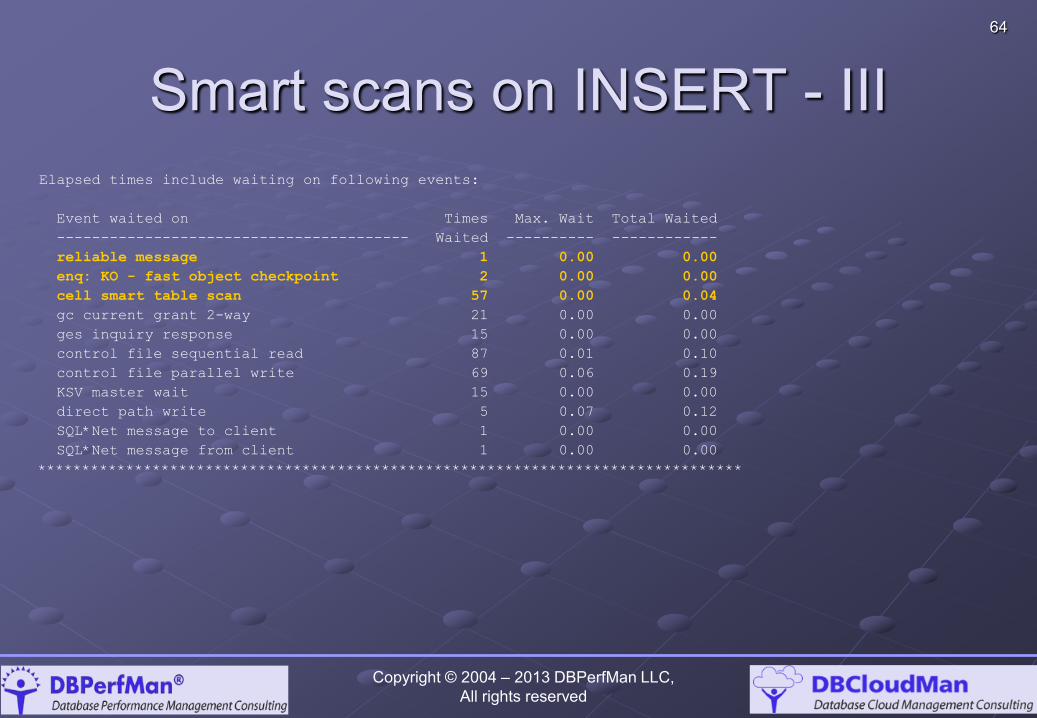
Smart scans on INSERT - III Elapsed times include waiting on following events:
Event waited on Times Max. Wait Total Waited
---------------------------------------- Waited ---------- ------------
reliable message 1 0.00 0.00
enq: KO - fast object checkpoint 2 0.00 0.00
cell smart table scan 57 0.00 0.04
gc current grant 2-way 21 0.00 0.00
ges inquiry response 15 0.00 0.00
control file sequential read 87 0.01 0.10
control file parallel write 69 0.06 0.19
KSV master wait 15 0.00 0.00
direct path write 5 0.07 0.12
SQL*Net message to client 1 0.00 0.00
SQL*Net message from client 1 0.00 0.00
********************************************************************************
Copyright © 2004 – 2013 DBPerfMan LLC, All rights reserved
65
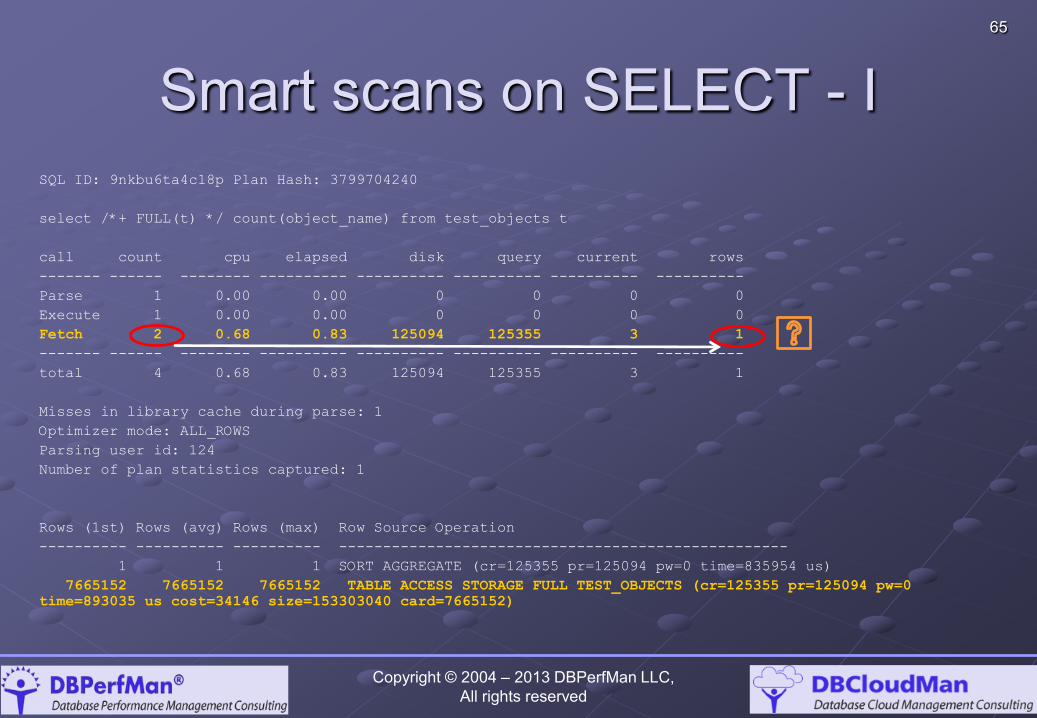
Smart scans on SELECT - I SQL ID: 9nkbu6ta4c18p Plan Hash: 3799704240
select /*+ FULL(t) */ count(object_name) from test_objects t
call count cpu elapsed disk query current rows
------- ------ -------- ---------- ---------- ---------- ---------- ----------
Parse 1 0.00 0.00 0 0 0 0
Execute 1 0.00 0.00 0 0 0 0
Fetch 2 0.68 0.83 125094 125355 3 1
------- ------ -------- ---------- ---------- ---------- ---------- ----------
total 4 0.68 0.83 125094 125355 3 1
Misses in library cache during parse: 1
Optimizer mode: ALL_ROWS
Parsing user id: 124
Number of plan statistics captured: 1
Rows (1st) Rows (avg) Rows (max) Row Source Operation
---------- ---------- ---------- ---------------------------------------------------
1 1 1 SORT AGGREGATE (cr=125355 pr=125094 pw=0 time=835954 us)
7665152 7665152 7665152 TABLE ACCESS STORAGE FULL TEST_OBJECTS (cr=125355 pr=125094 pw=0
time=893035 us cost=34146 size=153303040 card=7665152)
Copyright © 2004 – 2013 DBPerfMan LLC, All rights reserved
66
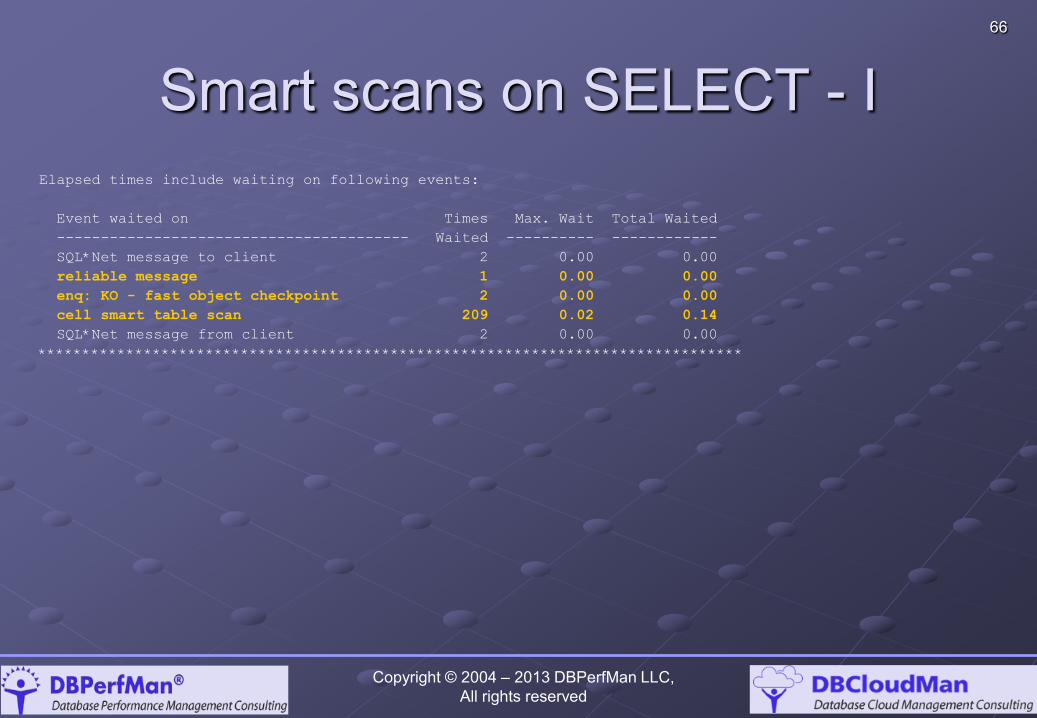
Smart scans on SELECT - I Elapsed times include waiting on following events:
Event waited on Times Max. Wait Total Waited
---------------------------------------- Waited ---------- ------------
SQL*Net message to client 2 0.00 0.00
reliable message 1 0.00 0.00
enq: KO - fast object checkpoint 2 0.00 0.00
cell smart table scan 209 0.02 0.14
SQL*Net message from client 2 0.00 0.00
********************************************************************************
Copyright © 2004 – 2013 DBPerfMan LLC, All rights reserved
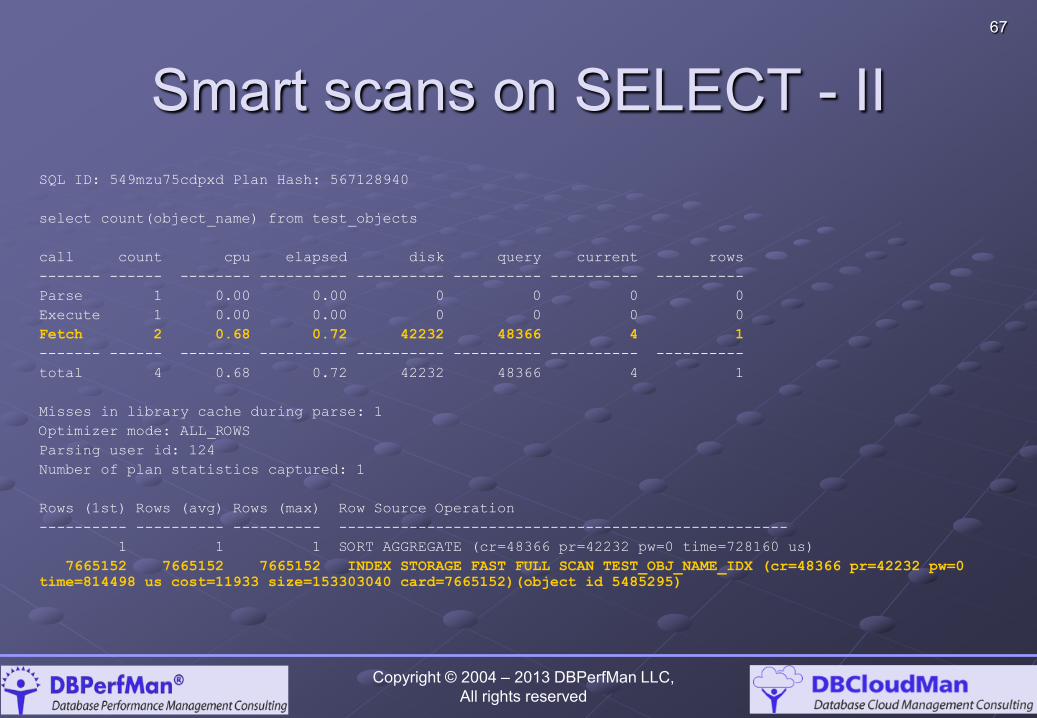
67
Smart scans on SELECT - II SQL ID: 549mzu75cdpxd Plan Hash: 567128940
select count(object_name) from test_objects
call count cpu elapsed disk query current rows
------- ------ -------- ---------- ---------- ---------- ---------- ----------
Parse 1 0.00 0.00 0 0 0 0
Execute 1 0.00 0.00 0 0 0 0
Fetch 2 0.68 0.72 42232 48366 4 1
------- ------ -------- ---------- ---------- ---------- ---------- ----------
total 4 0.68 0.72 42232 48366 4 1
Misses in library cache during parse: 1
Optimizer mode: ALL_ROWS
Parsing user id: 124
Number of plan statistics captured: 1
Rows (1st) Rows (avg) Rows (max) Row Source Operation
---------- ---------- ---------- ---------------------------------------------------
1 1 1 SORT AGGREGATE (cr=48366 pr=42232 pw=0 time=728160 us)
7665152 7665152 7665152 INDEX STORAGE FAST FULL SCAN TEST_OBJ_NAME_IDX (cr=48366 pr=42232 pw=0
time=814498 us cost=11933 size=153303040 card=7665152)(object id 5485295)
Copyright © 2004 – 2013 DBPerfMan LLC, All rights reserved

68
Smart scans on SELECT - II Elapsed times include waiting on following events:
Event waited on Times Max. Wait Total Waited
---------------------------------------- Waited ---------- ------------
SQL*Net message to client 2 0.00 0.00
reliable message 1 0.00 0.00
enq: KO - fast object checkpoint 2 0.00 0.00
cell smart index scan 153 0.00 0.05
SQL*Net message from client 2 0.00 0.00
********************************************************************************
Copyright © 2004 – 2013 DBPerfMan LLC, All rights reserved
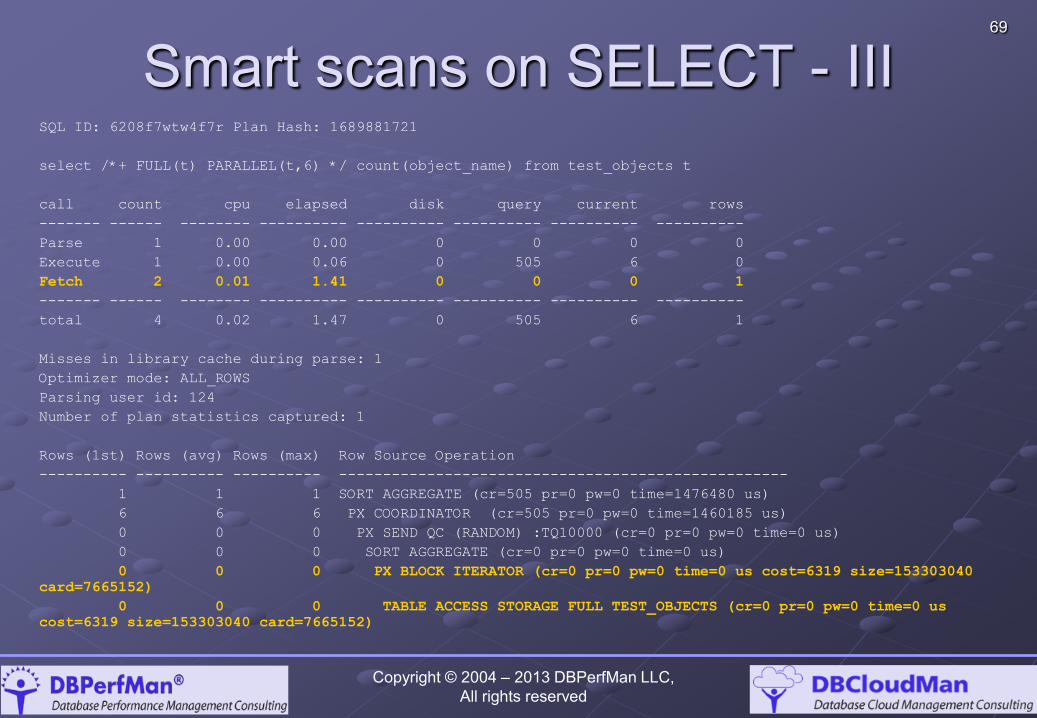
69
Smart scans on SELECT - III SQL ID: 6208f7wtw4f7r Plan Hash: 1689881721
select /*+ FULL(t) PARALLEL(t,6) */ count(object_name) from test_objects t
call count cpu elapsed disk query current rows
------- ------ -------- ---------- ---------- ---------- ---------- ----------
Parse 1 0.00 0.00 0 0 0 0
Execute 1 0.00 0.06 0 505 6 0
Fetch 2 0.01 1.41 0 0 0 1
------- ------ -------- ---------- ---------- ---------- ---------- ----------
total 4 0.02 1.47 0 505 6 1
Misses in library cache during parse: 1
Optimizer mode: ALL_ROWS
Parsing user id: 124
Number of plan statistics captured: 1
Rows (1st) Rows (avg) Rows (max) Row Source Operation
---------- ---------- ---------- ---------------------------------------------------
1 1 1 SORT AGGREGATE (cr=505 pr=0 pw=0 time=1476480 us)
6 6 6 PX COORDINATOR (cr=505 pr=0 pw=0 time=1460185 us)
0 0 0 PX SEND QC (RANDOM) :TQ10000 (cr=0 pr=0 pw=0 time=0 us)
0 0 0 SORT AGGREGATE (cr=0 pr=0 pw=0 time=0 us)
0 0 0 PX BLOCK ITERATOR (cr=0 pr=0 pw=0 time=0 us cost=6319 size=153303040
card=7665152)
0 0 0 TABLE ACCESS STORAGE FULL TEST_OBJECTS (cr=0 pr=0 pw=0 time=0 us
cost=6319 size=153303040 card=7665152)
Copyright © 2004 – 2013 DBPerfMan LLC, All rights reserved
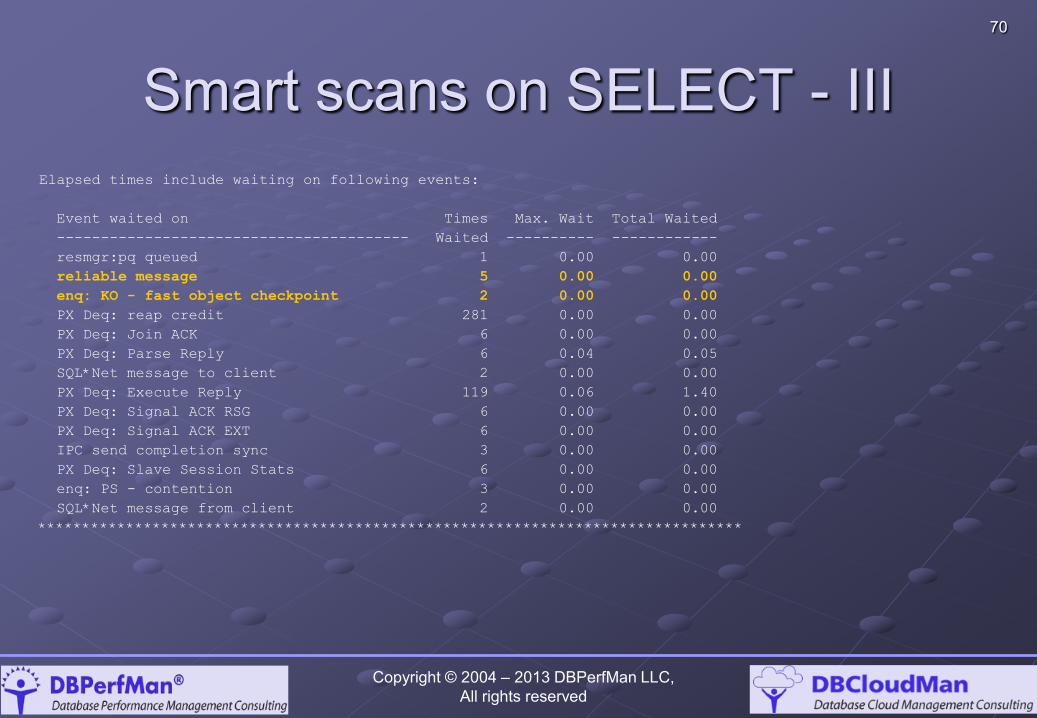
70
Smart scans on SELECT - III Elapsed times include waiting on following events:
Event waited on Times Max. Wait Total Waited
---------------------------------------- Waited ---------- ------------
resmgr:pq queued 1 0.00 0.00
reliable message 5 0.00 0.00
enq: KO - fast object checkpoint 2 0.00 0.00
PX Deq: reap credit 281 0.00 0.00
PX Deq: Join ACK 6 0.00 0.00
PX Deq: Parse Reply 6 0.04 0.05
SQL*Net message to client 2 0.00 0.00
PX Deq: Execute Reply 119 0.06 1.40
PX Deq: Signal ACK RSG 6 0.00 0.00
PX Deq: Signal ACK EXT 6 0.00 0.00
IPC send completion sync 3 0.00 0.00
PX Deq: Slave Session Stats 6 0.00 0.00
enq: PS - contention 3 0.00 0.00
SQL*Net message from client 2 0.00 0.00
********************************************************************************
Copyright © 2004 – 2013 DBPerfMan LLC, All rights reserved
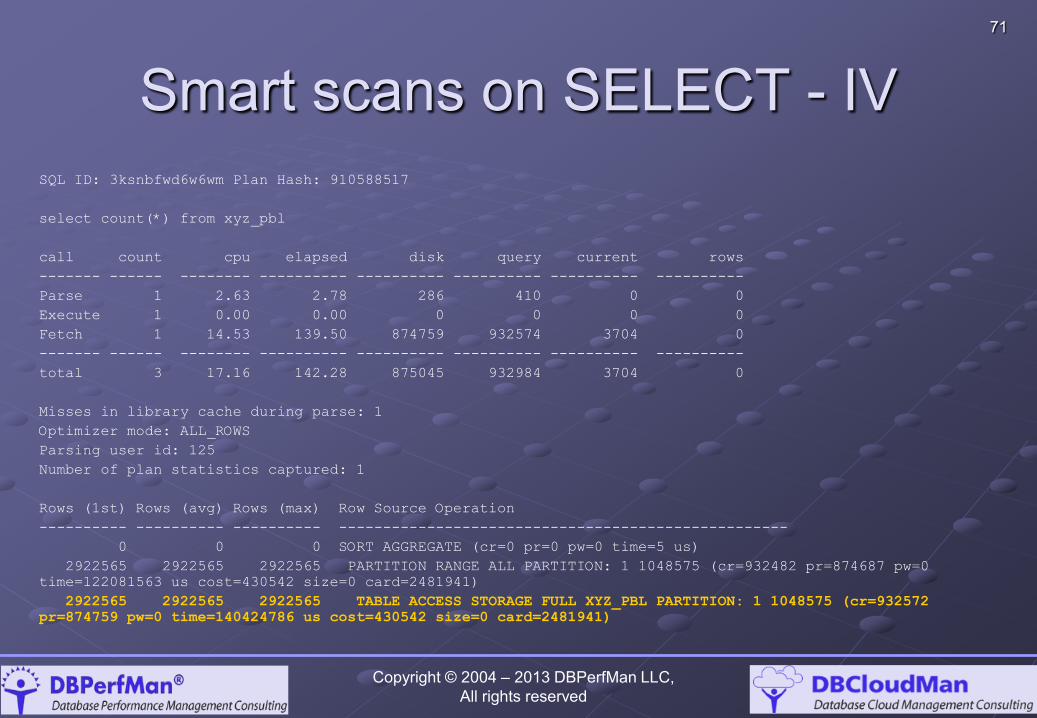
71
Smart scans on SELECT - IV SQL ID: 3ksnbfwd6w6wm Plan Hash: 910588517
select count(*) from xyz_pbl
call count cpu elapsed disk query current rows
------- ------ -------- ---------- ---------- ---------- ---------- ----------
Parse 1 2.63 2.78 286 410 0 0
Execute 1 0.00 0.00 0 0 0 0
Fetch 1 14.53 139.50 874759 932574 3704 0
------- ------ -------- ---------- ---------- ---------- ---------- ----------
total 3 17.16 142.28 875045 932984 3704 0
Misses in library cache during parse: 1
Optimizer mode: ALL_ROWS
Parsing user id: 125
Number of plan statistics captured: 1
Rows (1st) Rows (avg) Rows (max) Row Source Operation
---------- ---------- ---------- ---------------------------------------------------
0 0 0 SORT AGGREGATE (cr=0 pr=0 pw=0 time=5 us)
2922565 2922565 2922565 PARTITION RANGE ALL PARTITION: 1 1048575 (cr=932482 pr=874687 pw=0
time=122081563 us cost=430542 size=0 card=2481941)
2922565 2922565 2922565 TABLE ACCESS STORAGE FULL XYZ_PBL PARTITION: 1 1048575 (cr=932572
pr=874759 pw=0 time=140424786 us cost=430542 size=0 card=2481941)
Copyright © 2004 – 2013 DBPerfMan LLC, All rights reserved
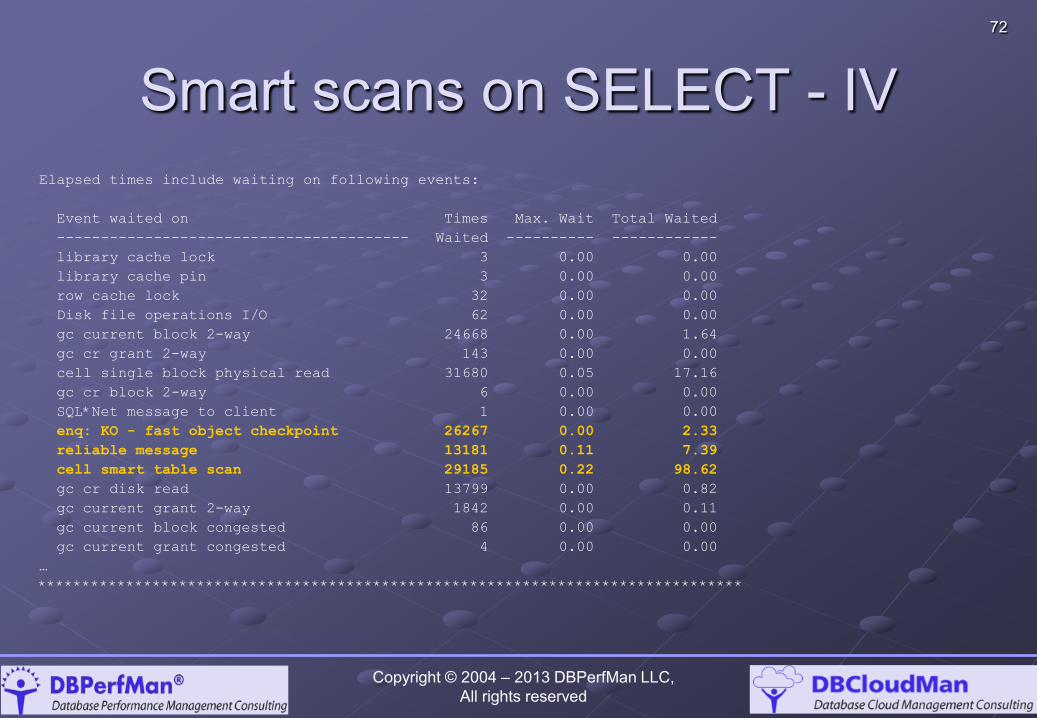
72
Smart scans on SELECT - IV Elapsed times include waiting on following events:
Event waited on Times Max. Wait Total Waited
---------------------------------------- Waited ---------- ------------
library cache lock 3 0.00 0.00
library cache pin 3 0.00 0.00
row cache lock 32 0.00 0.00
Disk file operations I/O 62 0.00 0.00
gc current block 2-way 24668 0.00 1.64
gc cr grant 2-way 143 0.00 0.00
cell single block physical read 31680 0.05 17.16
gc cr block 2-way 6 0.00 0.00
SQL*Net message to client 1 0.00 0.00
enq: KO - fast object checkpoint 26267 0.00 2.33
reliable message 13181 0.11 7.39
cell smart table scan 29185 0.22 98.62
gc cr disk read 13799 0.00 0.82
gc current grant 2-way 1842 0.00 0.11
gc current block congested 86 0.00 0.00
gc current grant congested 4 0.00 0.00
…
********************************************************************************
Copyright © 2004 – 2013 DBPerfMan LLC, All rights reserved
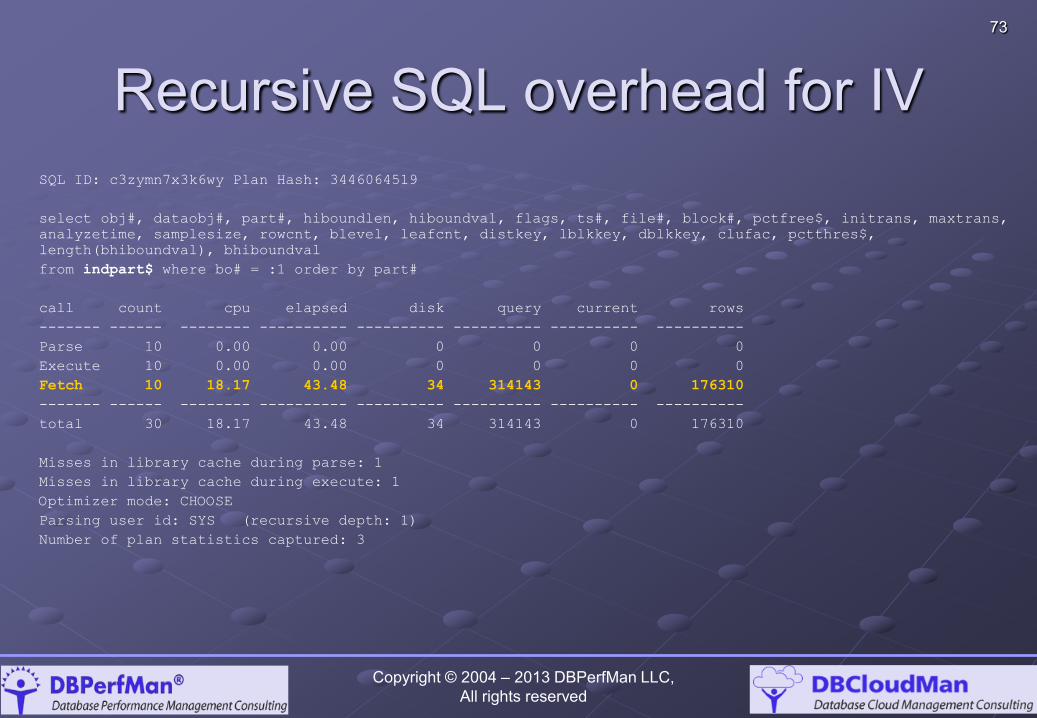
73
Recursive SQL overhead for IV SQL ID: c3zymn7x3k6wy Plan Hash: 3446064519
select obj#, dataobj#, part#, hiboundlen, hiboundval, flags, ts#, file#, block#, pctfree$, initrans, maxtrans,
analyzetime, samplesize, rowcnt, blevel, leafcnt, distkey, lblkkey, dblkkey, clufac, pctthres$,
length(bhiboundval), bhiboundval
from indpart$ where bo# = :1 order by part#
call count cpu elapsed disk query current rows
------- ------ -------- ---------- ---------- ---------- ---------- ----------
Parse 10 0.00 0.00 0 0 0 0
Execute 10 0.00 0.00 0 0 0 0
Fetch 10 18.17 43.48 34 314143 0 176310
------- ------ -------- ---------- ---------- ---------- ---------- ----------
total 30 18.17 43.48 34 314143 0 176310
Misses in library cache during parse: 1
Misses in library cache during execute: 1
Optimizer mode: CHOOSE
Parsing user id: SYS (recursive depth: 1)
Number of plan statistics captured: 3
Copyright © 2004 – 2013 DBPerfMan LLC, All rights reserved
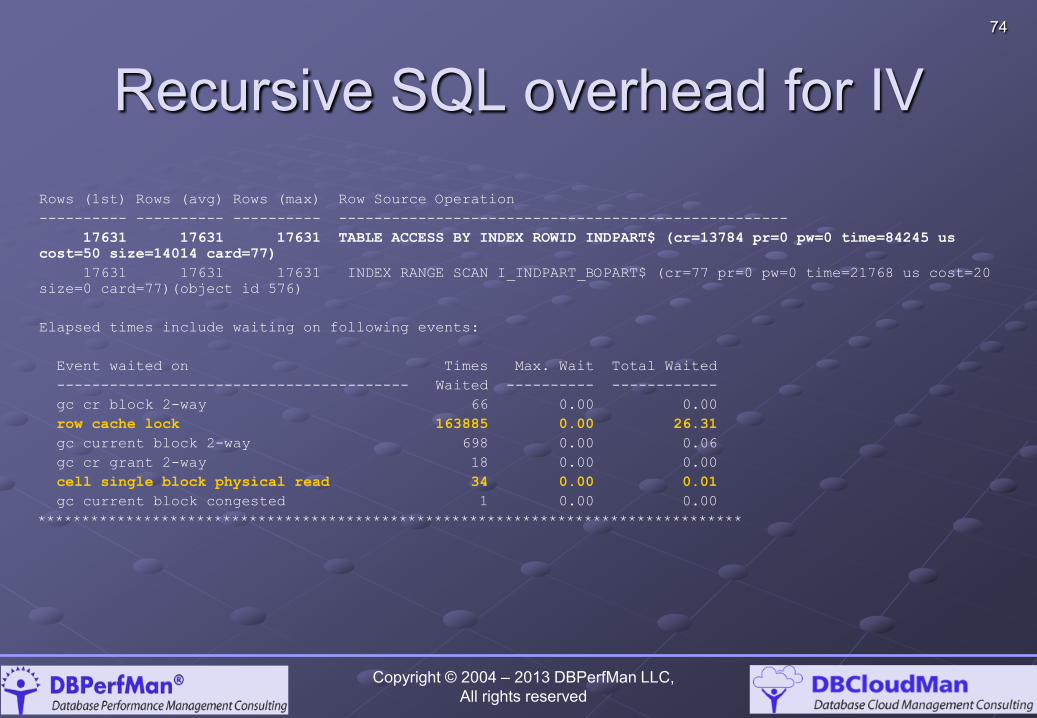
74
Recursive SQL overhead for IV
Rows (1st) Rows (avg) Rows (max) Row Source Operation
---------- ---------- ---------- ---------------------------------------------------
17631 17631 17631 TABLE ACCESS BY INDEX ROWID INDPART$ (cr=13784 pr=0 pw=0 time=84245 us
cost=50 size=14014 card=77)
17631 17631 17631 INDEX RANGE SCAN I_INDPART_BOPART$ (cr=77 pr=0 pw=0 time=21768 us cost=20
size=0 card=77)(object id 576)
Elapsed times include waiting on following events:
Event waited on Times Max. Wait Total Waited
---------------------------------------- Waited ---------- ------------
gc cr block 2-way 66 0.00 0.00
row cache lock 163885 0.00 26.31
gc current block 2-way 698 0.00 0.06
gc cr grant 2-way 18 0.00 0.00
cell single block physical read 34 0.00 0.01
gc current block congested 1 0.00 0.00
********************************************************************************
Copyright © 2004 – 2013 DBPerfMan LLC, All rights reserved
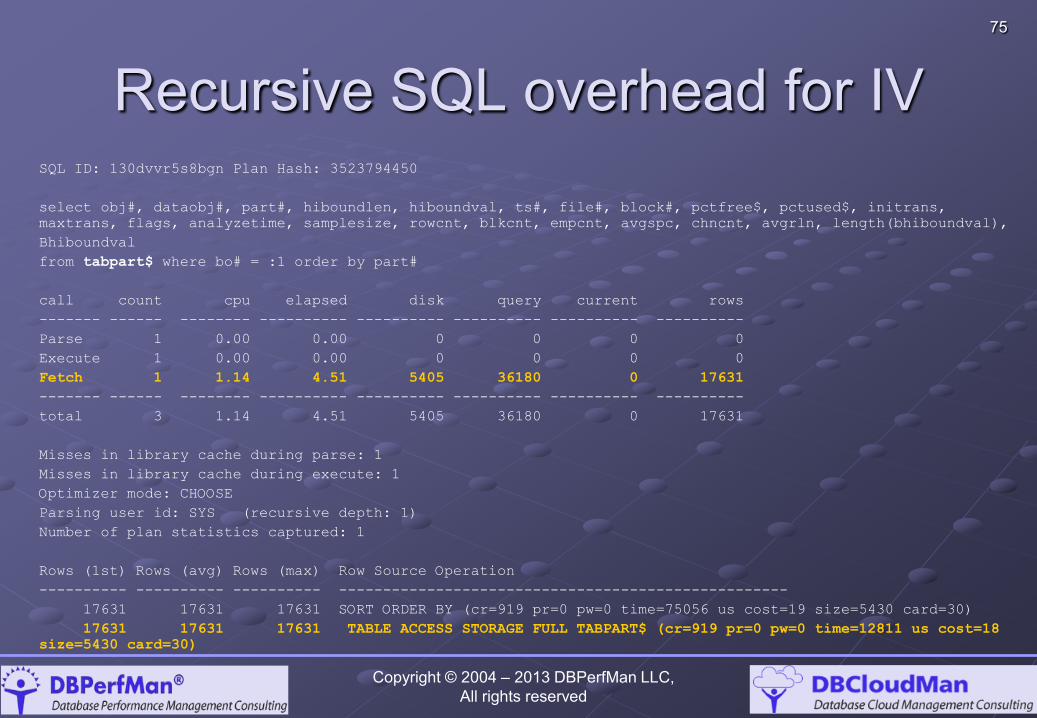
75
Recursive SQL overhead for IV SQL ID: 130dvvr5s8bgn Plan Hash: 3523794450
select obj#, dataobj#, part#, hiboundlen, hiboundval, ts#, file#, block#, pctfree$, pctused$, initrans,
maxtrans, flags, analyzetime, samplesize, rowcnt, blkcnt, empcnt, avgspc, chncnt, avgrln, length(bhiboundval),
Bhiboundval
from tabpart$ where bo# = :1 order by part#
call count cpu elapsed disk query current rows
------- ------ -------- ---------- ---------- ---------- ---------- ----------
Parse 1 0.00 0.00 0 0 0 0
Execute 1 0.00 0.00 0 0 0 0
Fetch 1 1.14 4.51 5405 36180 0 17631
------- ------ -------- ---------- ---------- ---------- ---------- ----------
total 3 1.14 4.51 5405 36180 0 17631
Misses in library cache during parse: 1
Misses in library cache during execute: 1
Optimizer mode: CHOOSE
Parsing user id: SYS (recursive depth: 1)
Number of plan statistics captured: 1
Rows (1st) Rows (avg) Rows (max) Row Source Operation
---------- ---------- ---------- ---------------------------------------------------
17631 17631 17631 SORT ORDER BY (cr=919 pr=0 pw=0 time=75056 us cost=19 size=5430 card=30)
17631 17631 17631 TABLE ACCESS STORAGE FULL TABPART$ (cr=919 pr=0 pw=0 time=12811 us cost=18
size=5430 card=30)
Copyright © 2004 – 2013 DBPerfMan LLC, All rights reserved
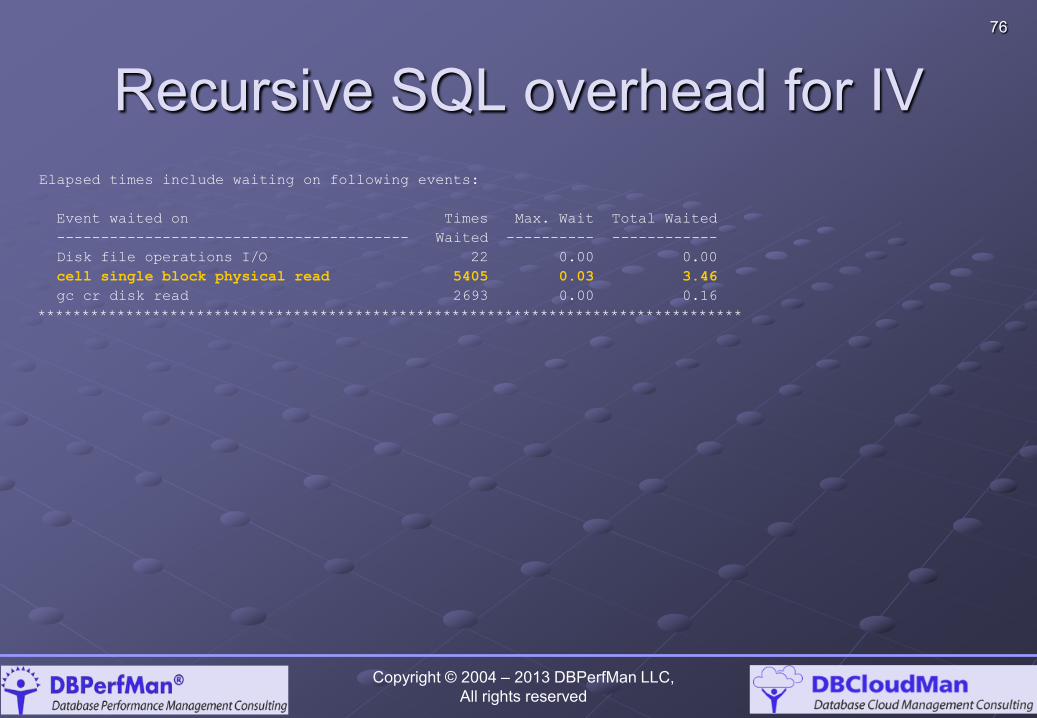
76
Recursive SQL overhead for IV Elapsed times include waiting on following events:
Event waited on Times Max. Wait Total Waited
---------------------------------------- Waited ---------- ------------
Disk file operations I/O 22 0.00 0.00
cell single block physical read 5405 0.03 3.46
gc cr disk read 2693 0.00 0.16
********************************************************************************
Copyright © 2004 – 2013 DBPerfMan LLC, All rights reserved
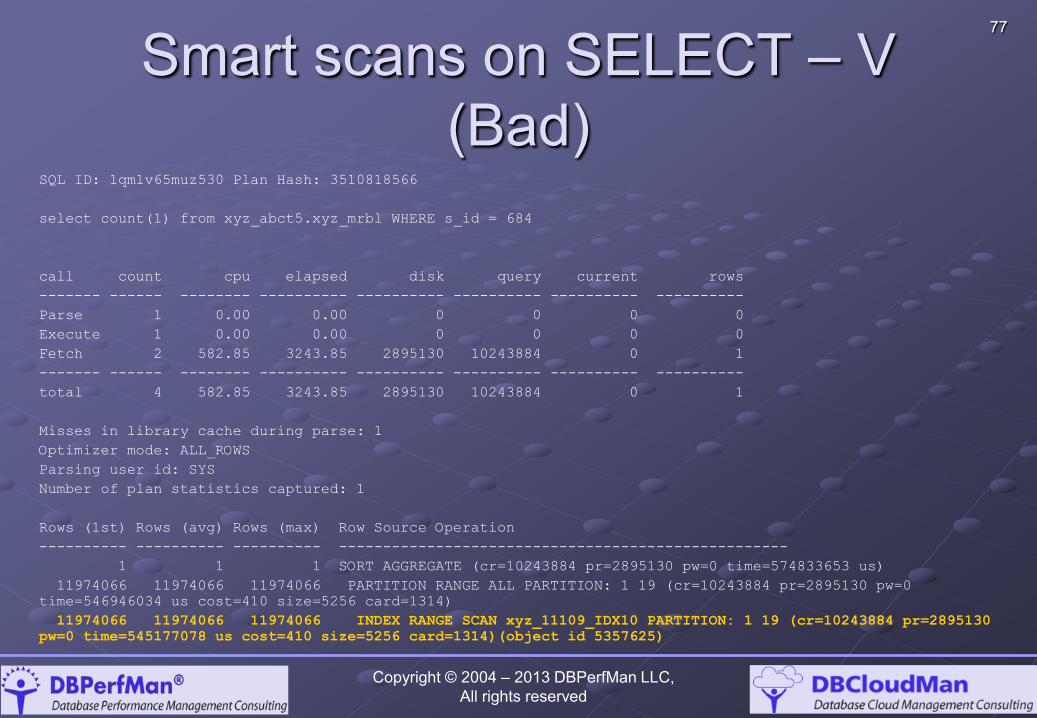
77
Smart scans on SELECT – V (Bad)
SQL ID: 1qm1v65muz530 Plan Hash: 3510818566
select count(1) from xyz_abct5.xyz_mrbl WHERE s_id = 684
call count cpu elapsed disk query current rows
------- ------ -------- ---------- ---------- ---------- ---------- ----------
Parse 1 0.00 0.00 0 0 0 0
Execute 1 0.00 0.00 0 0 0 0
Fetch 2 582.85 3243.85 2895130 10243884 0 1
------- ------ -------- ---------- ---------- ---------- ---------- ----------
total 4 582.85 3243.85 2895130 10243884 0 1
Misses in library cache during parse: 1
Optimizer mode: ALL_ROWS
Parsing user id: SYS
Number of plan statistics captured: 1
Rows (1st) Rows (avg) Rows (max) Row Source Operation
---------- ---------- ---------- ---------------------------------------------------
1 1 1 SORT AGGREGATE (cr=10243884 pr=2895130 pw=0 time=574833653 us)
11974066 11974066 11974066 PARTITION RANGE ALL PARTITION: 1 19 (cr=10243884 pr=2895130 pw=0
time=546946034 us cost=410 size=5256 card=1314)
11974066 11974066 11974066 INDEX RANGE SCAN xyz_11109_IDX10 PARTITION: 1 19 (cr=10243884 pr=2895130
pw=0 time=545177078 us cost=410 size=5256 card=1314)(object id 5357625)
Copyright © 2004 – 2013 DBPerfMan LLC, All rights reserved
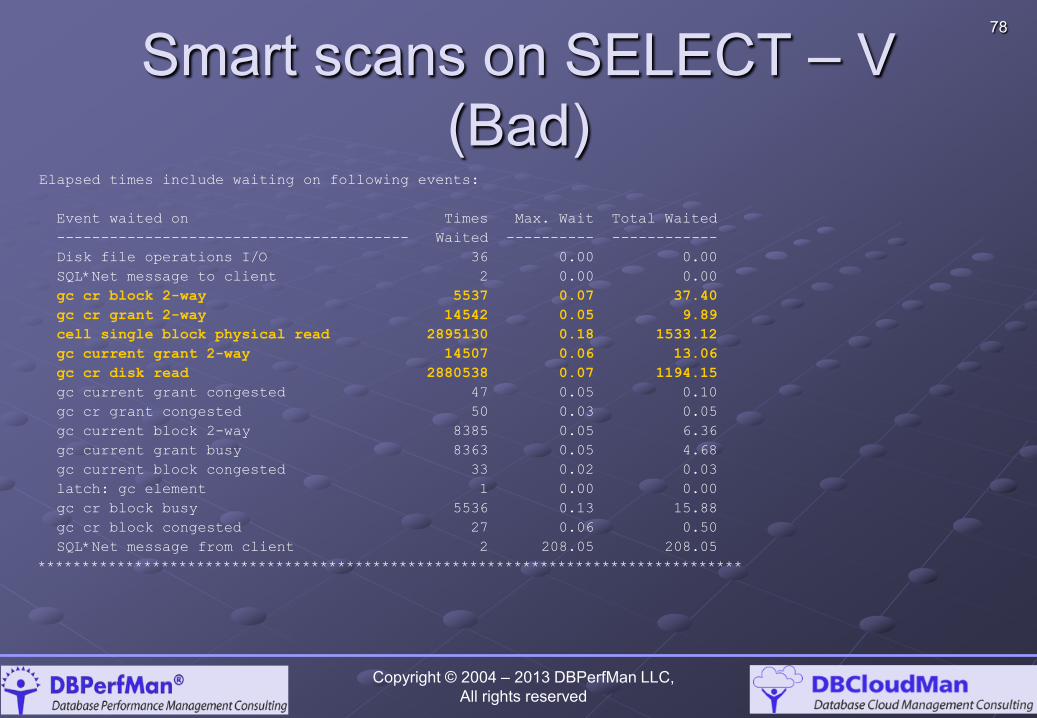
78
Smart scans on SELECT – V (Bad)
Elapsed times include waiting on following events:
Event waited on Times Max. Wait Total Waited
---------------------------------------- Waited ---------- ------------
Disk file operations I/O 36 0.00 0.00
SQL*Net message to client 2 0.00 0.00
gc cr block 2-way 5537 0.07 37.40
gc cr grant 2-way 14542 0.05 9.89
cell single block physical read 2895130 0.18 1533.12
gc current grant 2-way 14507 0.06 13.06
gc cr disk read 2880538 0.07 1194.15
gc current grant congested 47 0.05 0.10
gc cr grant congested 50 0.03 0.05
gc current block 2-way 8385 0.05 6.36
gc current grant busy 8363 0.05 4.68
gc current block congested 33 0.02 0.03
latch: gc element 1 0.00 0.00
gc cr block busy 5536 0.13 15.88
gc cr block congested 27 0.06 0.50
SQL*Net message from client 2 208.05 208.05
********************************************************************************
Copyright © 2004 – 2013 DBPerfMan LLC, All rights reserved
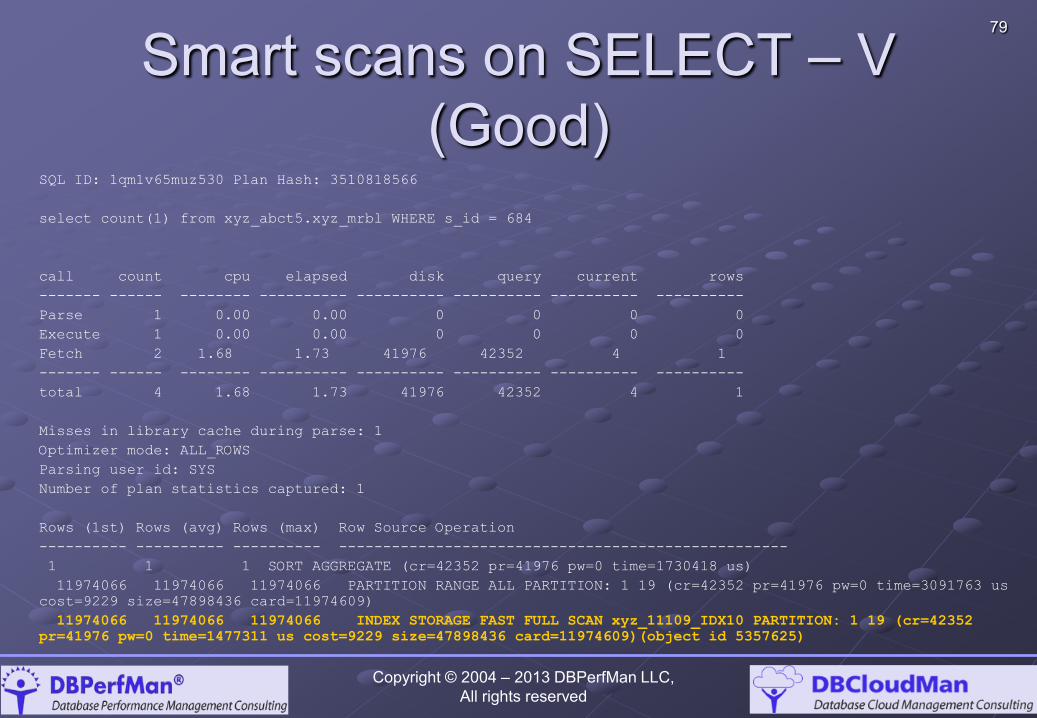
79
Smart scans on SELECT – V (Good)
SQL ID: 1qm1v65muz530 Plan Hash: 3510818566
select count(1) from xyz_abct5.xyz_mrbl WHERE s_id = 684
call count cpu elapsed disk query current rows
------- ------ -------- ---------- ---------- ---------- ---------- ----------
Parse 1 0.00 0.00 0 0 0 0
Execute 1 0.00 0.00 0 0 0 0
Fetch 2 1.68 1.73 41976 42352 4 1
------- ------ -------- ---------- ---------- ---------- ---------- ----------
total 4 1.68 1.73 41976 42352 4 1
Misses in library cache during parse: 1
Optimizer mode: ALL_ROWS
Parsing user id: SYS
Number of plan statistics captured: 1
Rows (1st) Rows (avg) Rows (max) Row Source Operation
---------- ---------- ---------- ---------------------------------------------------
1 1 1 SORT AGGREGATE (cr=42352 pr=41976 pw=0 time=1730418 us)
11974066 11974066 11974066 PARTITION RANGE ALL PARTITION: 1 19 (cr=42352 pr=41976 pw=0 time=3091763 us
cost=9229 size=47898436 card=11974609)
11974066 11974066 11974066 INDEX STORAGE FAST FULL SCAN xyz_11109_IDX10 PARTITION: 1 19 (cr=42352
pr=41976 pw=0 time=1477311 us cost=9229 size=47898436 card=11974609)(object id 5357625)
Copyright © 2004 – 2013 DBPerfMan LLC, All rights reserved
80
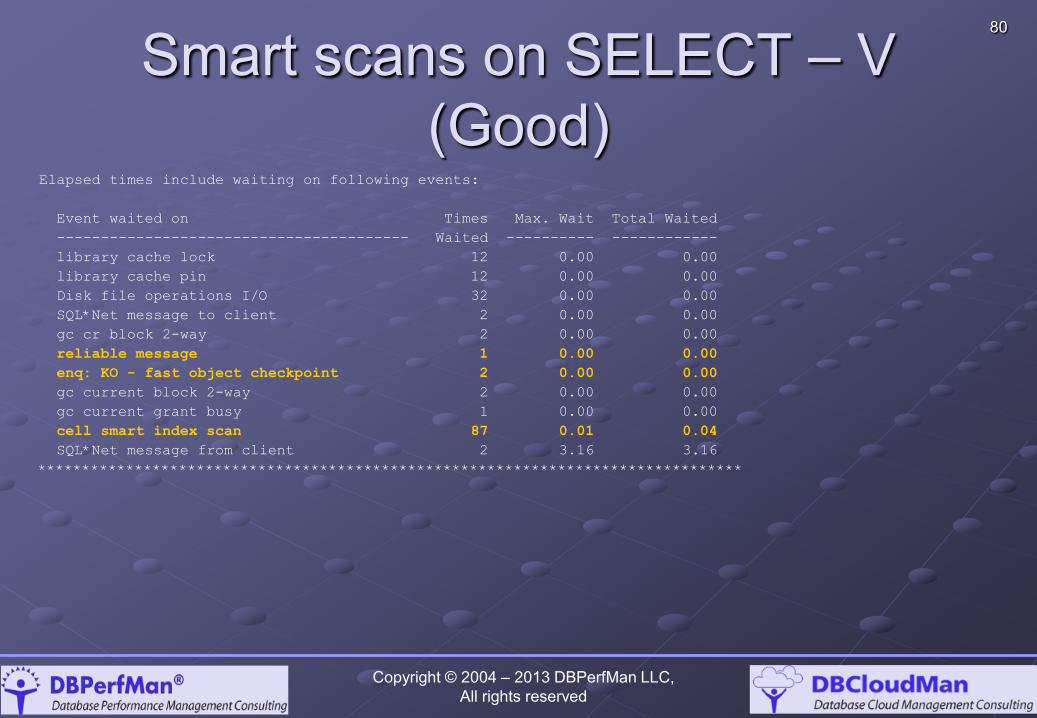
Smart scans on SELECT – V (Good)
Elapsed times include waiting on following events:
Event waited on Times Max. Wait Total Waited
---------------------------------------- Waited ---------- ------------
library cache lock 12 0.00 0.00
library cache pin 12 0.00 0.00
Disk file operations I/O 32 0.00 0.00
SQL*Net message to client 2 0.00 0.00
gc cr block 2-way 2 0.00 0.00
reliable message 1 0.00 0.00
enq: KO - fast object checkpoint 2 0.00 0.00
gc current block 2-way 2 0.00 0.00
gc current grant busy 1 0.00 0.00
cell smart index scan 87 0.01 0.04
SQL*Net message from client 2 3.16 3.16
********************************************************************************
Copyright © 2004 – 2013 DBPerfMan LLC, All rights reserved
81
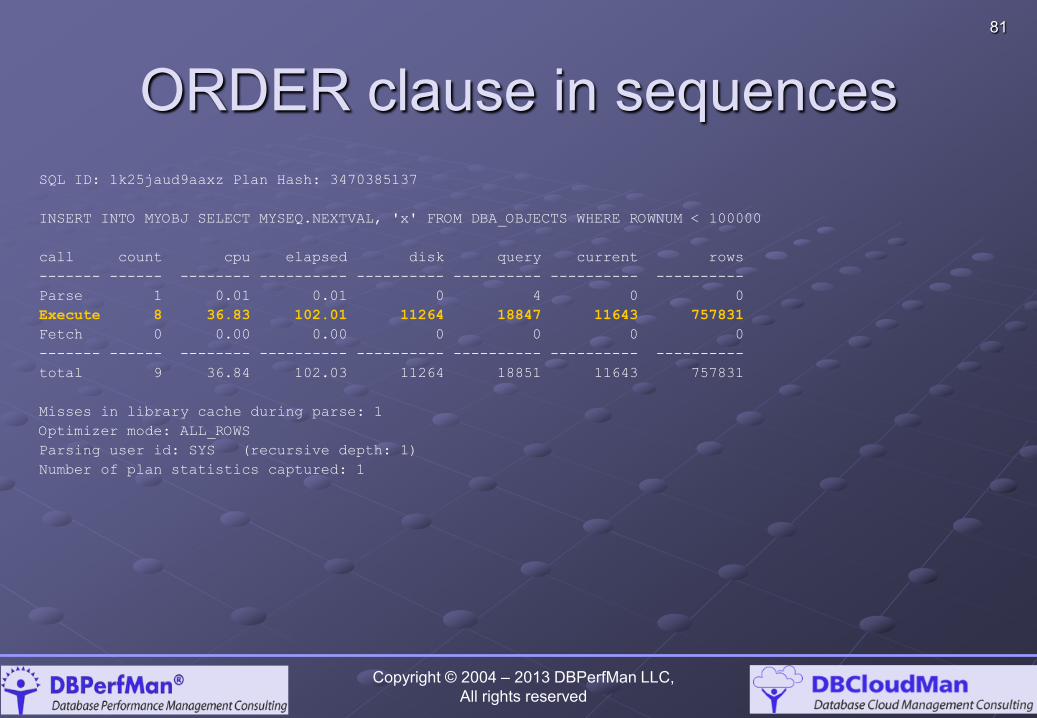
ORDER clause in sequences SQL ID: 1k25jaud9aaxz Plan Hash: 3470385137
INSERT INTO MYOBJ SELECT MYSEQ.NEXTVAL, 'x' FROM DBA_OBJECTS WHERE ROWNUM < 100000
call count cpu elapsed disk query current rows
------- ------ -------- ---------- ---------- ---------- ---------- ----------
Parse 1 0.01 0.01 0 4 0 0
Execute 8 36.83 102.01 11264 18847 11643 757831
Fetch 0 0.00 0.00 0 0 0 0
------- ------ -------- ---------- ---------- ---------- ---------- ----------
total 9 36.84 102.03 11264 18851 11643 757831
Misses in library cache during parse: 1
Optimizer mode: ALL_ROWS
Parsing user id: SYS (recursive depth: 1)
Number of plan statistics captured: 1
Copyright © 2004 – 2013 DBPerfMan LLC, All rights reserved
82
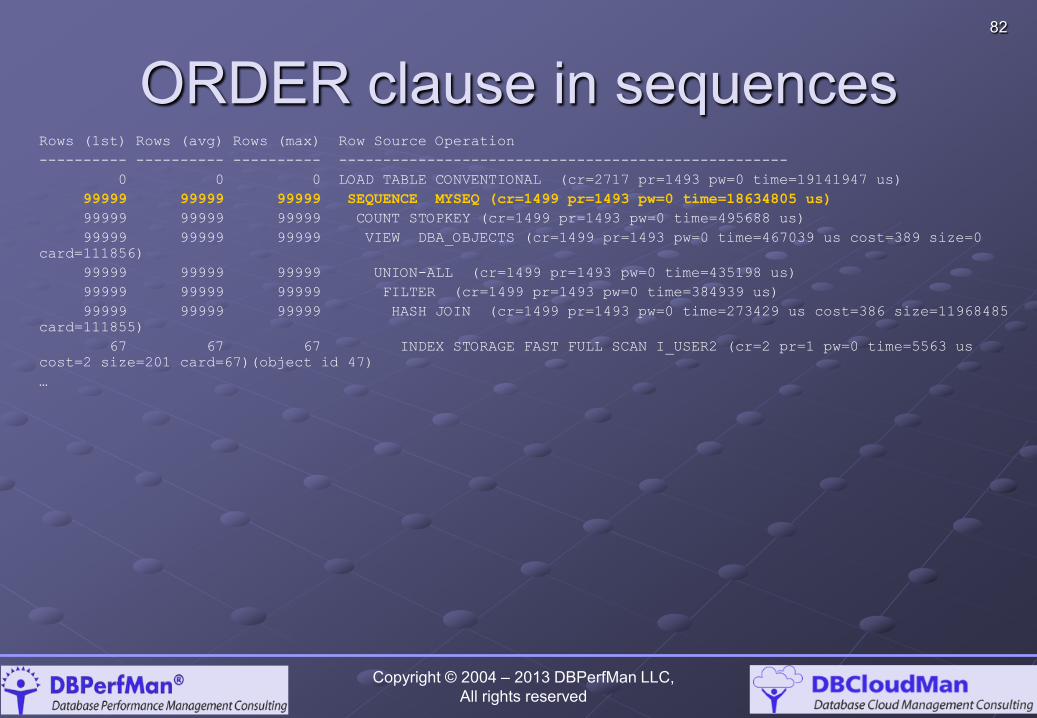
ORDER clause in sequences Rows (1st) Rows (avg) Rows (max) Row Source Operation
---------- ---------- ---------- ---------------------------------------------------
0 0 0 LOAD TABLE CONVENTIONAL (cr=2717 pr=1493 pw=0 time=19141947 us)
99999 99999 99999 SEQUENCE MYSEQ (cr=1499 pr=1493 pw=0 time=18634805 us)
99999 99999 99999 COUNT STOPKEY (cr=1499 pr=1493 pw=0 time=495688 us)
99999 99999 99999 VIEW DBA_OBJECTS (cr=1499 pr=1493 pw=0 time=467039 us cost=389 size=0
card=111856)
99999 99999 99999 UNION-ALL (cr=1499 pr=1493 pw=0 time=435198 us)
99999 99999 99999 FILTER (cr=1499 pr=1493 pw=0 time=384939 us)
99999 99999 99999 HASH JOIN (cr=1499 pr=1493 pw=0 time=273429 us cost=386 size=11968485
card=111855)
67 67 67 INDEX STORAGE FAST FULL SCAN I_USER2 (cr=2 pr=1 pw=0 time=5563 us
cost=2 size=201 card=67)(object id 47)
…
Copyright © 2004 – 2013 DBPerfMan LLC, All rights reserved
83
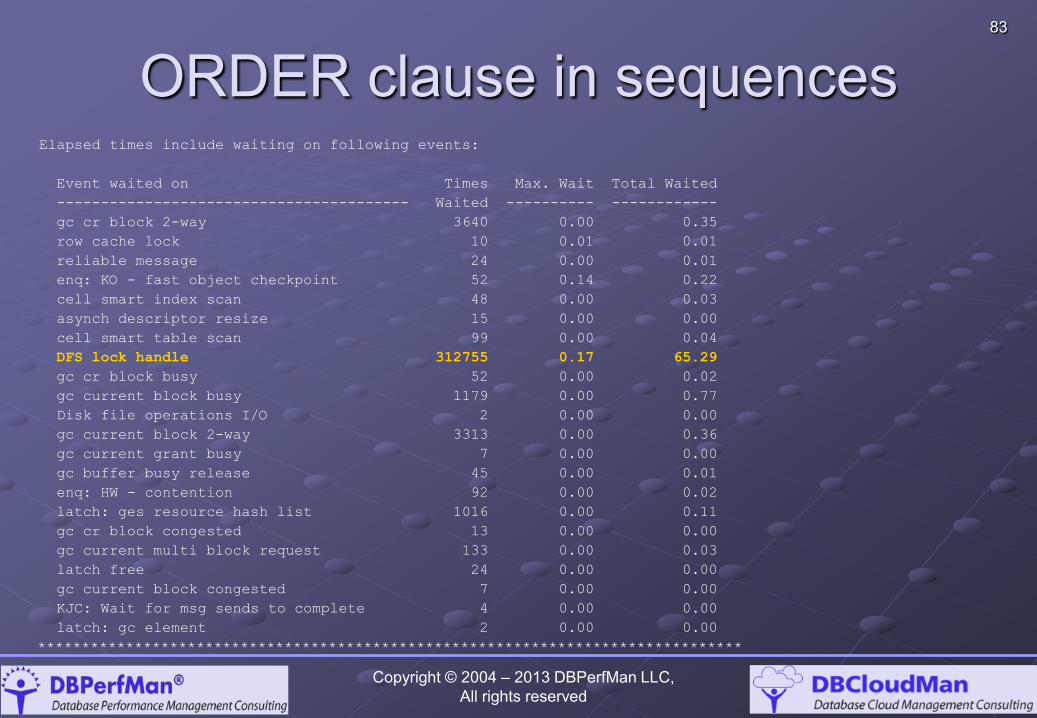
ORDER clause in sequences Elapsed times include waiting on following events:
Event waited on Times Max. Wait Total Waited
---------------------------------------- Waited ---------- ------------
gc cr block 2-way 3640 0.00 0.35
row cache lock 10 0.01 0.01
reliable message 24 0.00 0.01
enq: KO - fast object checkpoint 52 0.14 0.22
cell smart index scan 48 0.00 0.03
asynch descriptor resize 15 0.00 0.00
cell smart table scan 99 0.00 0.04
DFS lock handle 312755 0.17 65.29
gc cr block busy 52 0.00 0.02
gc current block busy 1179 0.00 0.77
Disk file operations I/O 2 0.00 0.00
gc current block 2-way 3313 0.00 0.36
gc current grant busy 7 0.00 0.00
gc buffer busy release 45 0.00 0.01
enq: HW - contention 92 0.00 0.02
latch: ges resource hash list 1016 0.00 0.11
gc cr block congested 13 0.00 0.00
gc current multi block request 133 0.00 0.03
latch free 24 0.00 0.00
gc current block congested 7 0.00 0.00
KJC: Wait for msg sends to complete 4 0.00 0.00
latch: gc element 2 0.00 0.00
********************************************************************************
Copyright © 2004 – 2013 DBPerfMan LLC, All rights reserved
84
Hybrid Columnar Compression (HCC) Findings
Copyright © 2004 – 2013 DBPerfMan LLC, All rights reserved
85
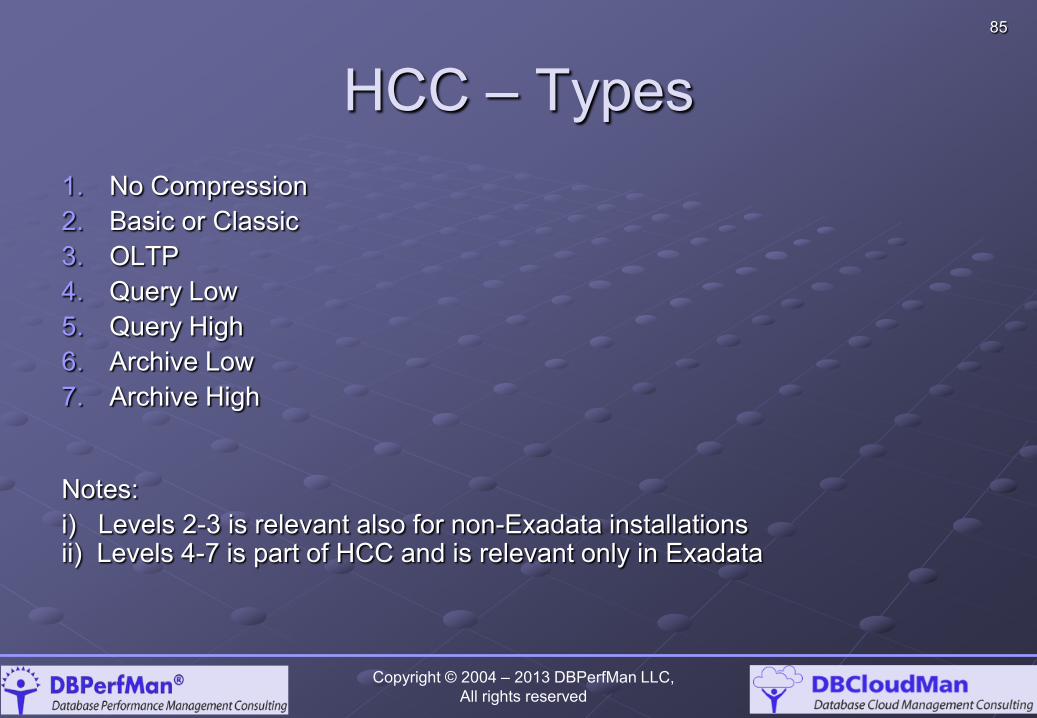
HCC – Types 1. No Compression 2. Basic or Classic 3. OLTP 4. Query Low 5. Query High 6. Archive Low 7. Archive High
Notes: i) Levels 2-3 is relevant also for non-Exadata installations ii) Levels 4-7 is part of HCC and is relevant only in Exadata
Copyright © 2004 – 2013 DBPerfMan LLC, All rights reserved
86
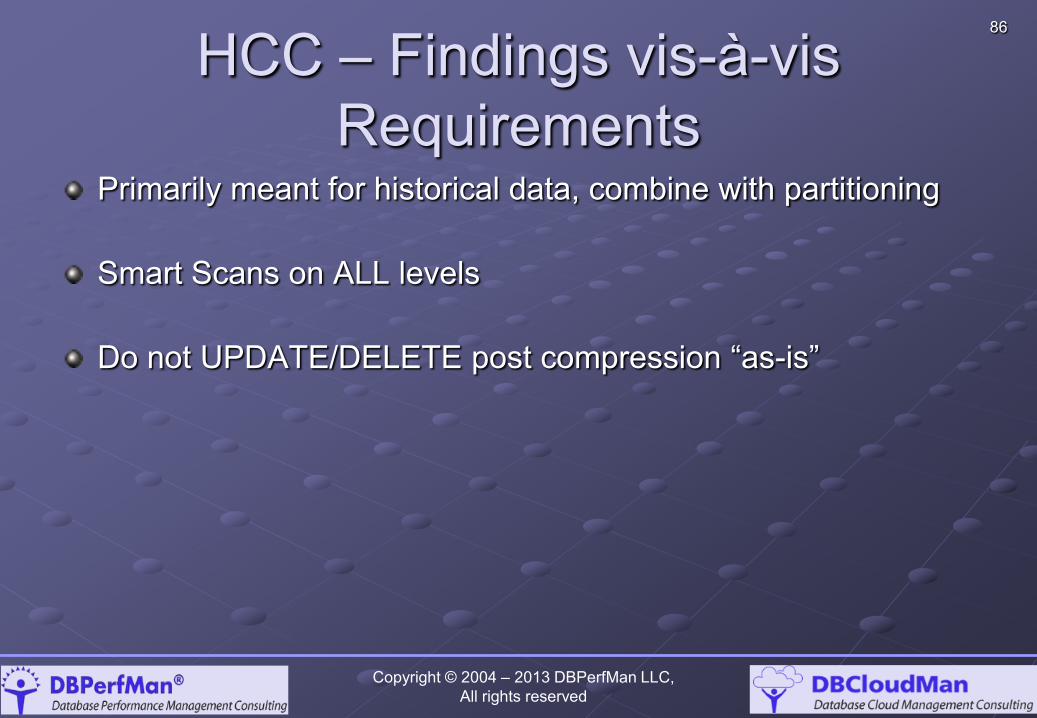
HCC – Findings vis-à-vis Requirements
Primarily meant for historical data, combine with partitioning Smart Scans on ALL levels
Do not UPDATE/DELETE post compression “as-is”
Copyright © 2004 – 2013 DBPerfMan LLC, All rights reserved
87
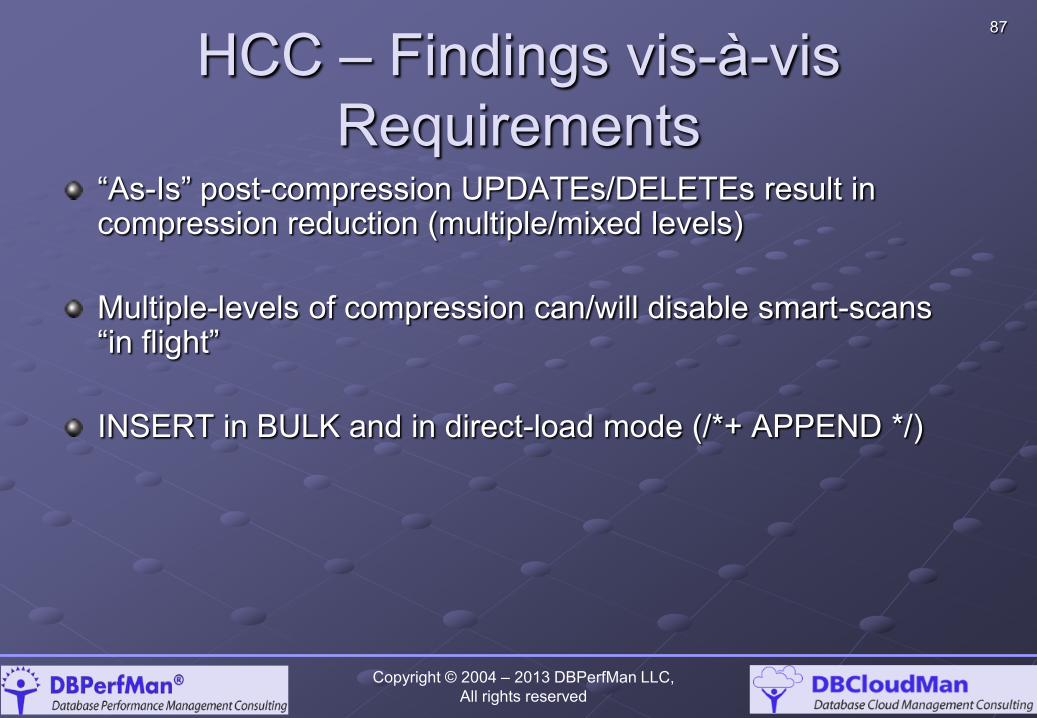
HCC – Findings vis-à-vis Requirements
“As-Is” post-compression UPDATEs/DELETEs result in compression reduction (multiple/mixed levels) Multiple-levels of compression can/will disable smart-scans “in flight” INSERT in BULK and in direct-load mode (/*+ APPEND */)
Copyright © 2004 – 2013 DBPerfMan LLC, All rights reserved
88
HCC – The Tests Table was created with the relevant compression option Data was inserted into it using APPEND hint (except for OLTP) Data was queried from the table (select count(*) from table_name)
Copyright © 2004 – 2013 DBPerfMan LLC, All rights reserved
89
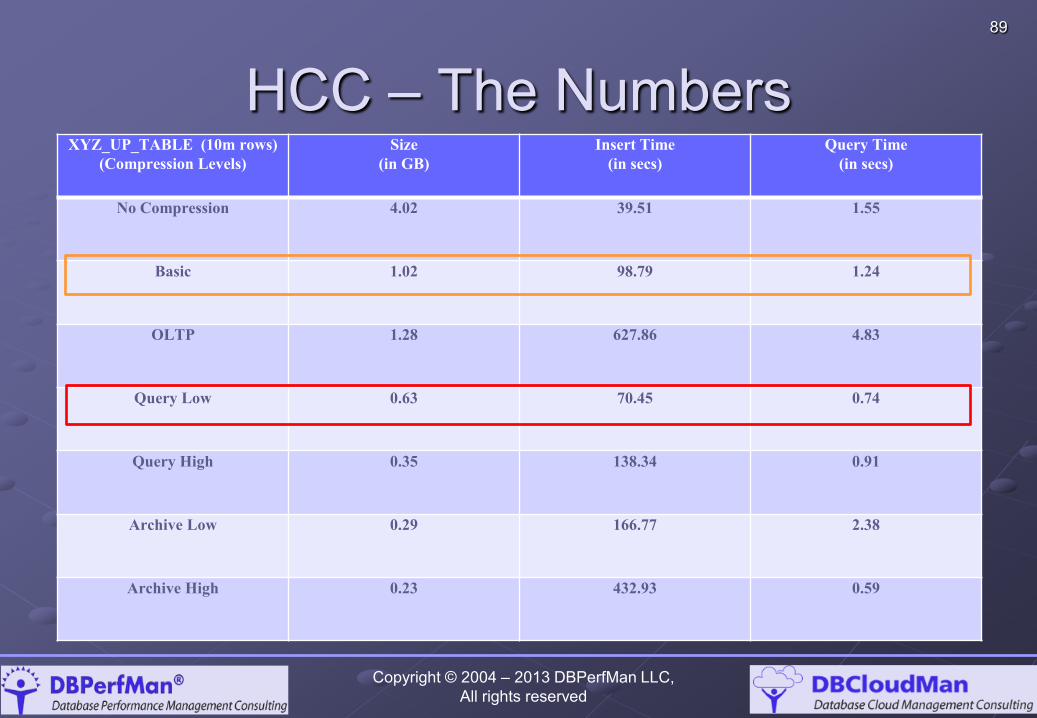
HCC – The Numbers
Copyright © 2004 – 2013 DBPerfMan LLC, All rights reserved
XYZ_UP_TABLE (10m rows) (Compression Levels)
Size (in GB)
Insert Time (in secs)
Query Time (in secs)
No Compression 4.02 39.51 1.55
Basic 1.02 98.79 1.24
OLTP 1.28 627.86 4.83
Query Low 0.63 70.45 0.74
Query High 0.35 138.34 0.91
Archive Low 0.29 166.77 2.38
Archive High 0.23 432.93 0.59
90
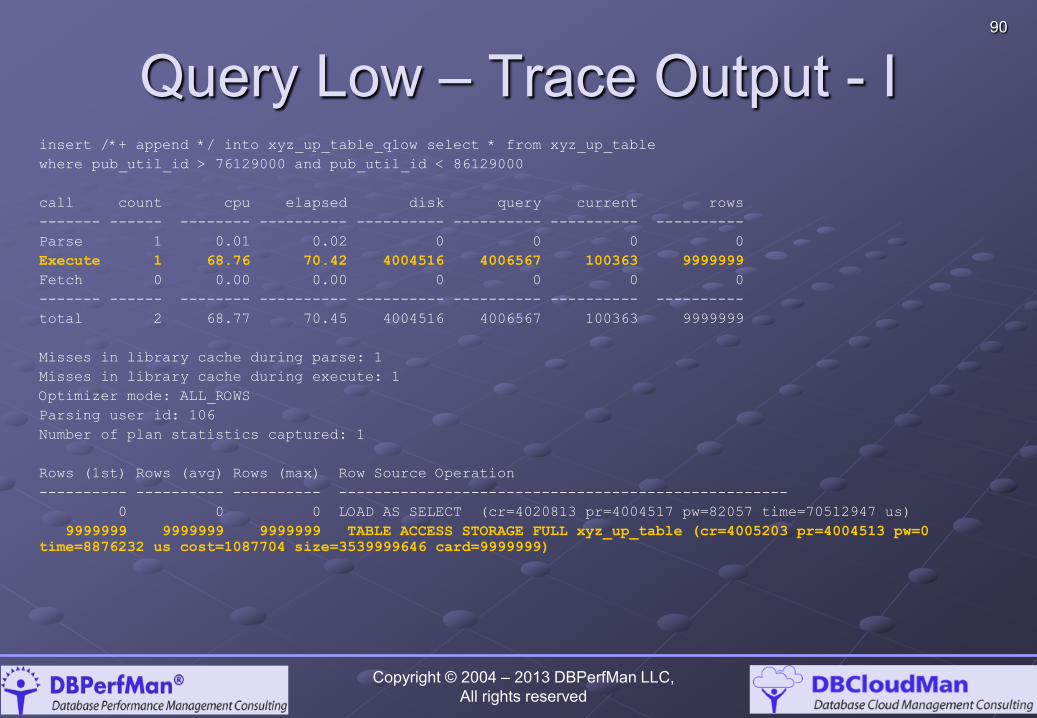
Query Low – Trace Output - I insert /*+ append */ into xyz_up_table_qlow select * from xyz_up_table
where pub_util_id > 76129000 and pub_util_id < 86129000
call count cpu elapsed disk query current rows
------- ------ -------- ---------- ---------- ---------- ---------- ----------
Parse 1 0.01 0.02 0 0 0 0
Execute 1 68.76 70.42 4004516 4006567 100363 9999999
Fetch 0 0.00 0.00 0 0 0 0
------- ------ -------- ---------- ---------- ---------- ---------- ----------
total 2 68.77 70.45 4004516 4006567 100363 9999999
Misses in library cache during parse: 1
Misses in library cache during execute: 1
Optimizer mode: ALL_ROWS
Parsing user id: 106
Number of plan statistics captured: 1
Rows (1st) Rows (avg) Rows (max) Row Source Operation
---------- ---------- ---------- ---------------------------------------------------
0 0 0 LOAD AS SELECT (cr=4020813 pr=4004517 pw=82057 time=70512947 us)
9999999 9999999 9999999 TABLE ACCESS STORAGE FULL xyz_up_table (cr=4005203 pr=4004513 pw=0
time=8876232 us cost=1087704 size=3539999646 card=9999999)
Copyright © 2004 – 2013 DBPerfMan LLC, All rights reserved
91
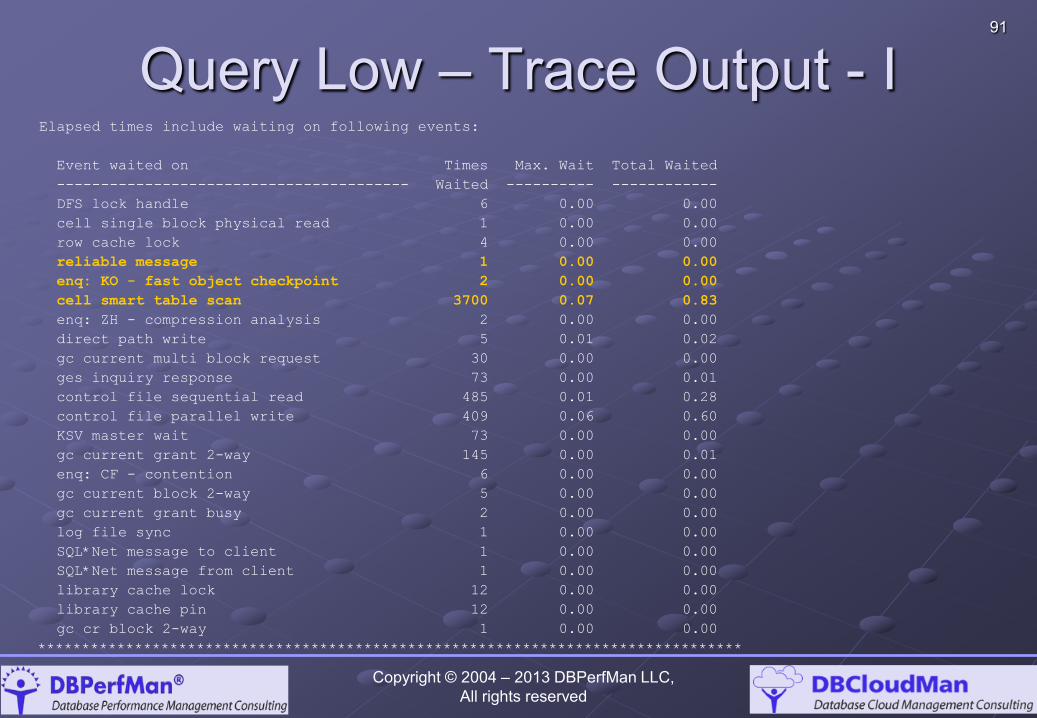
Query Low – Trace Output - I Elapsed times include waiting on following events:
Event waited on Times Max. Wait Total Waited
---------------------------------------- Waited ---------- ------------
DFS lock handle 6 0.00 0.00
cell single block physical read 1 0.00 0.00
row cache lock 4 0.00 0.00
reliable message 1 0.00 0.00
enq: KO - fast object checkpoint 2 0.00 0.00
cell smart table scan 3700 0.07 0.83
enq: ZH - compression analysis 2 0.00 0.00
direct path write 5 0.01 0.02
gc current multi block request 30 0.00 0.00
ges inquiry response 73 0.00 0.01
control file sequential read 485 0.01 0.28
control file parallel write 409 0.06 0.60
KSV master wait 73 0.00 0.00
gc current grant 2-way 145 0.00 0.01
enq: CF - contention 6 0.00 0.00
gc current block 2-way 5 0.00 0.00
gc current grant busy 2 0.00 0.00
log file sync 1 0.00 0.00
SQL*Net message to client 1 0.00 0.00
SQL*Net message from client 1 0.00 0.00
library cache lock 12 0.00 0.00
library cache pin 12 0.00 0.00
gc cr block 2-way 1 0.00 0.00
********************************************************************************
Copyright © 2004 – 2013 DBPerfMan LLC,
All rights reserved
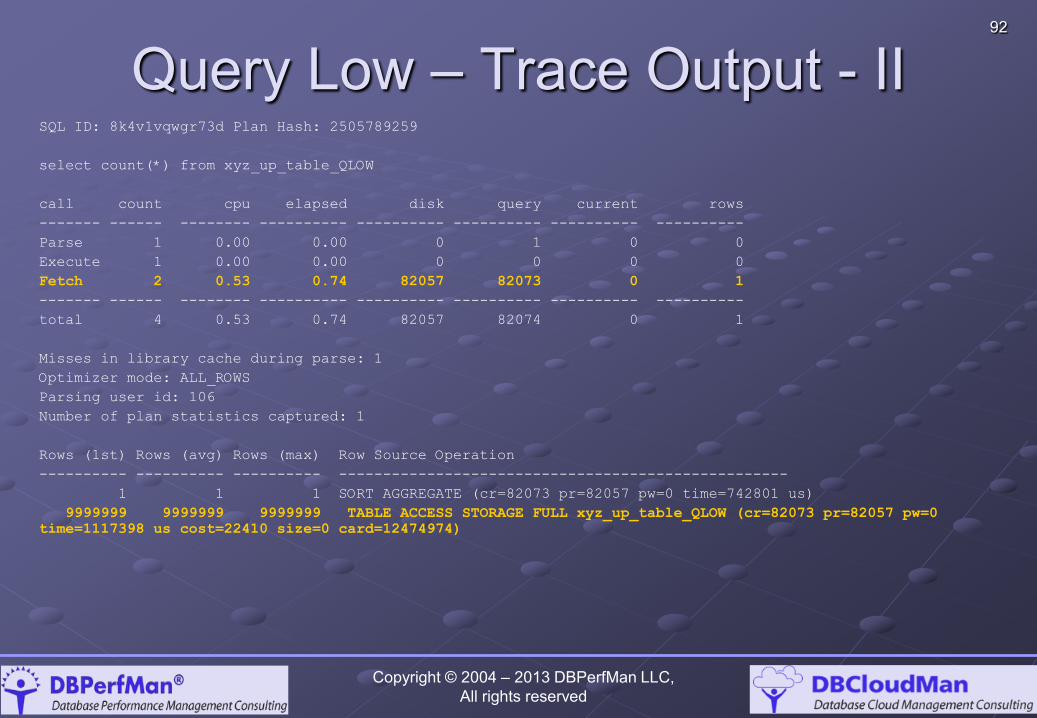
92
Query Low – Trace Output - II SQL ID: 8k4v1vqwgr73d Plan Hash: 2505789259
select count(*) from xyz_up_table_QLOW
call count cpu elapsed disk query current rows
------- ------ -------- ---------- ---------- ---------- ---------- ----------
Parse 1 0.00 0.00 0 1 0 0
Execute 1 0.00 0.00 0 0 0 0
Fetch 2 0.53 0.74 82057 82073 0 1
------- ------ -------- ---------- ---------- ---------- ---------- ----------
total 4 0.53 0.74 82057 82074 0 1
Misses in library cache during parse: 1
Optimizer mode: ALL_ROWS
Parsing user id: 106
Number of plan statistics captured: 1
Rows (1st) Rows (avg) Rows (max) Row Source Operation
---------- ---------- ---------- ---------------------------------------------------
1 1 1 SORT AGGREGATE (cr=82073 pr=82057 pw=0 time=742801 us)
9999999 9999999 9999999 TABLE ACCESS STORAGE FULL xyz_up_table_QLOW (cr=82073 pr=82057 pw=0
time=1117398 us cost=22410 size=0 card=12474974)
Copyright © 2004 – 2013 DBPerfMan LLC, All rights reserved
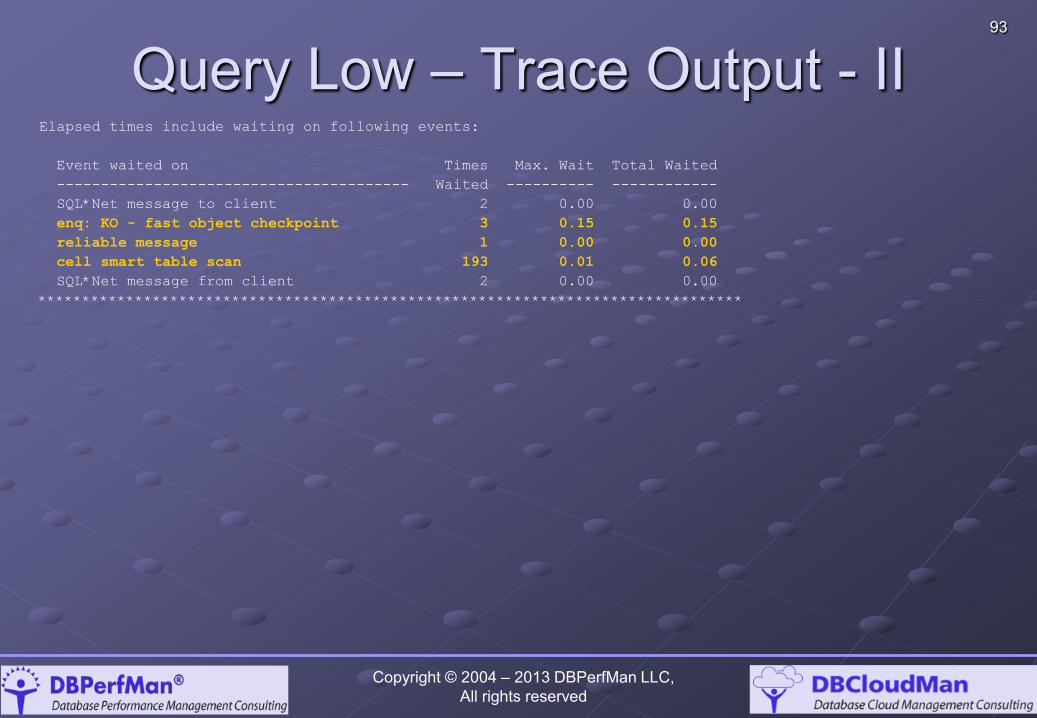
93
Query Low – Trace Output - II Elapsed times include waiting on following events:
Event waited on Times Max. Wait Total Waited
---------------------------------------- Waited ---------- ------------
SQL*Net message to client 2 0.00 0.00
enq: KO - fast object checkpoint 3 0.15 0.15
reliable message 1 0.00 0.00
cell smart table scan 193 0.01 0.06
SQL*Net message from client 2 0.00 0.00
********************************************************************************
Copyright © 2004 – 2013 DBPerfMan LLC, All rights reserved
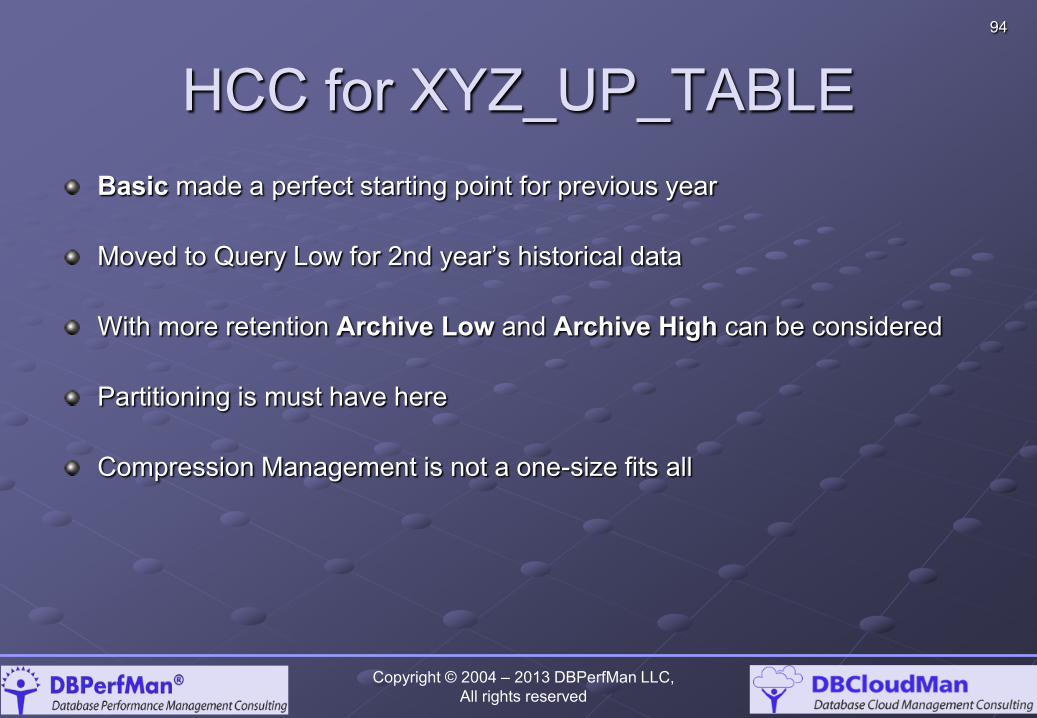
94
HCC for XYZ_UP_TABLE Basic made a perfect starting point for previous year Moved to Query Low for 2nd year’s historical data With more retention Archive Low and Archive High can be considered Partitioning is must have here Compression Management is not a one-size fits all
Copyright © 2004 – 2013 DBPerfMan LLC, All rights reserved
95
Issues Faced, Battles Fought and Workarounds
Copyright © 2004 – 2013 DBPerfMan LLC, All rights reserved
96
Unstable Execution Plans with GTTs
GTTs have no permanent statistics Dynamic Sampling at level 4 will do the trick right? SQL with multiple GTTs in the FROM clause can be volatile Example – t1, t3, t5, t2, t4 Can cause the driving set of tables to be different based on the data
volume Make Oracle to do the right thing – i.e. /*+ LEADING(t1, t2) */
Copyright © 2004 – 2013 DBPerfMan LLC, All rights reserved
97 Interval Partitioning – Recursive Overhead
Copyright © 2004 – 2013 DBPerfMan LLC, All rights reserved
Interval Partitioned table with 18,000 partitions INSERT 100K rows with a complex sub query took over an hour. SYS=YES in tkprof output allows us to see recursive SQL
The recursive layer was in a tailspin
98 Interval Partitioning – Recursive Overhead
Copyright © 2004 – 2013 DBPerfMan LLC, All rights reserved
SQL Monitoring showed 100s of executions of the INSERT, when the actual INSERT was still “in flight” Two step fix – completed in 2 minutes INSERT into a GTT INSERT into Interval Partitioned table (sub query from GTT)
99
Interval Partitioning – DDL Issues
Copyright © 2004 – 2013 DBPerfMan LLC, All rights reserved
Watch out INTERVAL partitions changing to RANGE MERGE commands on 2 INTERVALs DROPs in the middle of range of INTERVALS may also convert all
partitions lower than its HIGH_VALUE to RANGE Validate the “true INTERVAL” in code before TRUNCATEs alter table xxx truncate partition for (value); Make sure you are not truncating multiple values
100
DML causes row-chaining
Copyright © 2004 – 2013 DBPerfMan LLC, All rights reserved
Tables > 255 columns DML causes row piece#2 to be migrated Cell Smart Table/Index Scan Cell Single Block Physical Read Check out Bug# 9373758
101
ORA-4031!!!!
Copyright © 2004 – 2013 DBPerfMan LLC, All rights reserved
Fundamental issue – Abnormal Consumption (SPA, LPA, JPA, STPA) SQL with literals RAC Overhead Bugs (Mostly memory leaks, SQL aging issues)
Determine what is consuming your SPA ;) Take necessary measures based on the data Do not add more memory without analyzing the issue
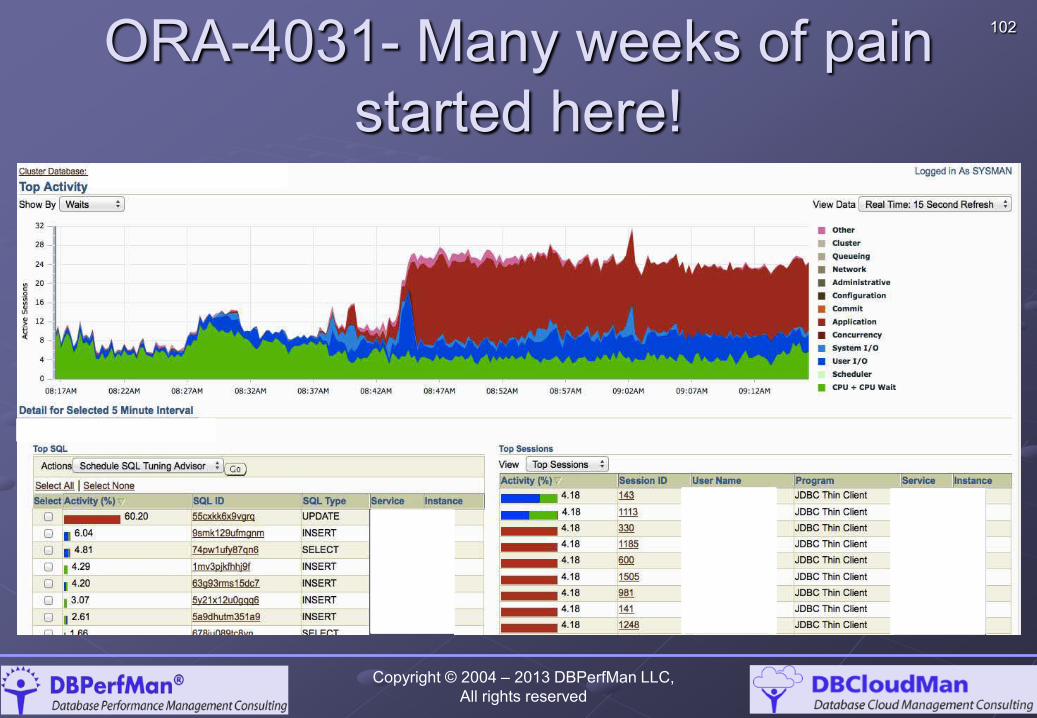
102 ORA-4031- Many weeks of pain started here!
Copyright © 2004 – 2013 DBPerfMan LLC, All rights reserved
103
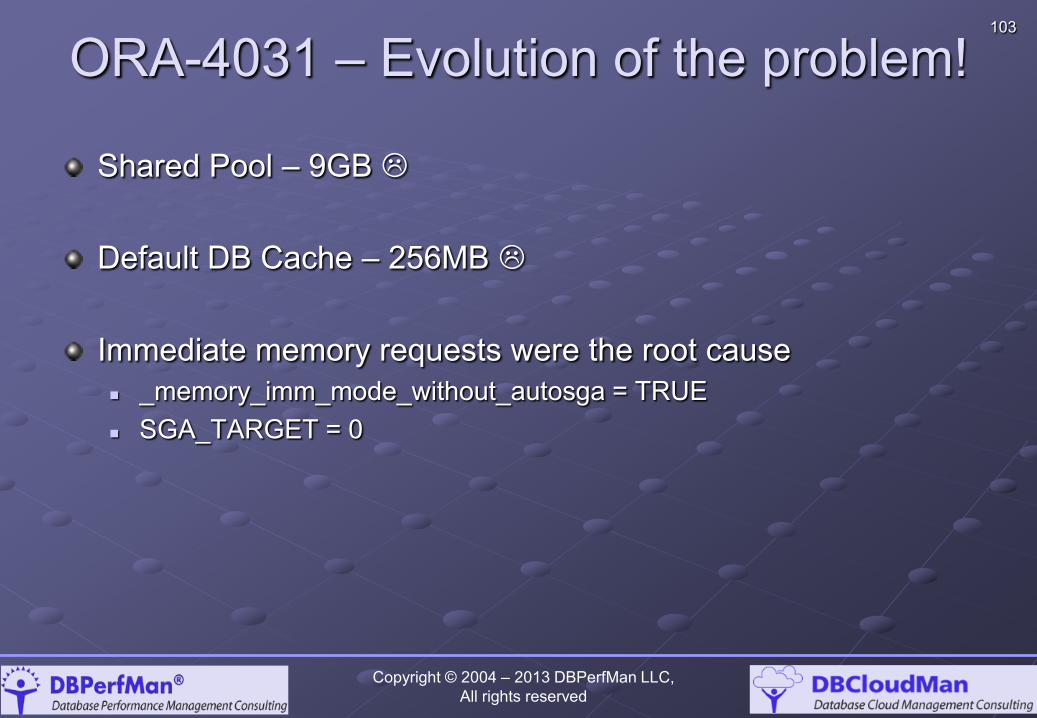
ORA-4031 – Evolution of the problem!
Copyright © 2004 – 2013 DBPerfMan LLC, All rights reserved
Shared Pool – 9GB Default DB Cache – 256MB Immediate memory requests were the root cause _memory_imm_mode_without_autosga = TRUE SGA_TARGET = 0
104
ORA-4031 – Evolution of the problem!
Copyright © 2004 – 2013 DBPerfMan LLC, All rights reserved
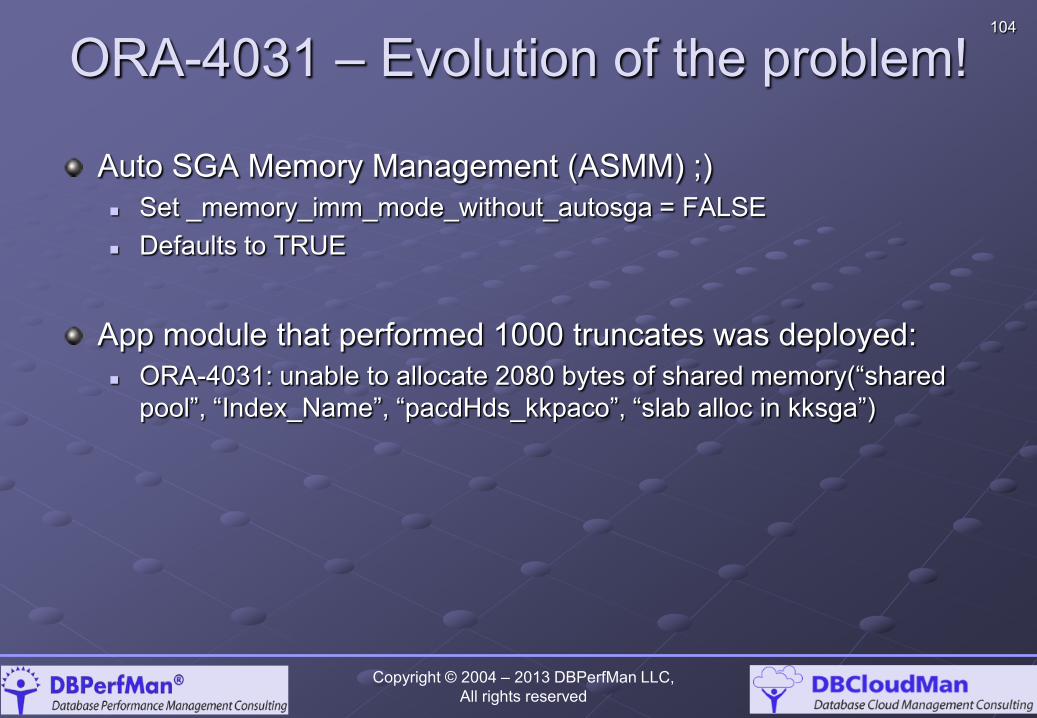
Auto SGA Memory Management (ASMM) ;) Set _memory_imm_mode_without_autosga = FALSE Defaults to TRUE
App module that performed 1000 truncates was deployed: ORA-4031: unable to allocate 2080 bytes of shared memory(“shared
pool”, “Index_Name”, “pacdHds_kkpaco”, “slab alloc in kksga”)
105
ORA-4031 – Evolution of the problem!
Copyright © 2004 – 2013 DBPerfMan LLC, All rights reserved
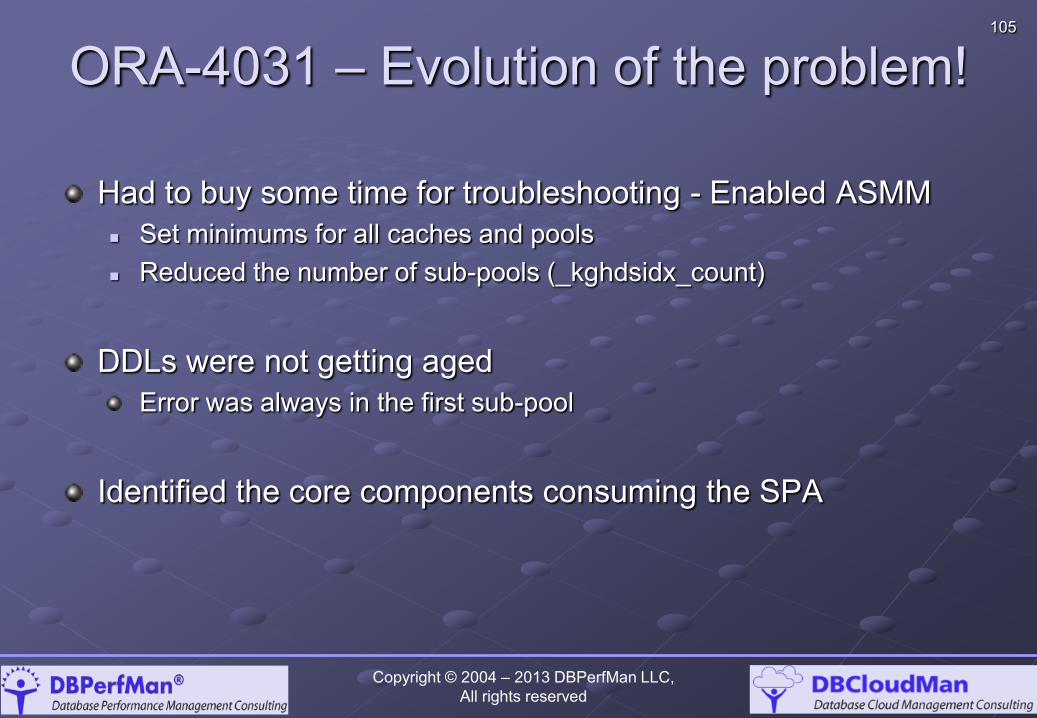
Had to buy some time for troubleshooting - Enabled ASMM Set minimums for all caches and pools Reduced the number of sub-pools (_kghdsidx_count)
DDLs were not getting aged
Error was always in the first sub-pool Identified the core components consuming the SPA
106
ORA-4031 – Evolution of the problem!
Copyright © 2004 – 2013 DBPerfMan LLC, All rights reserved
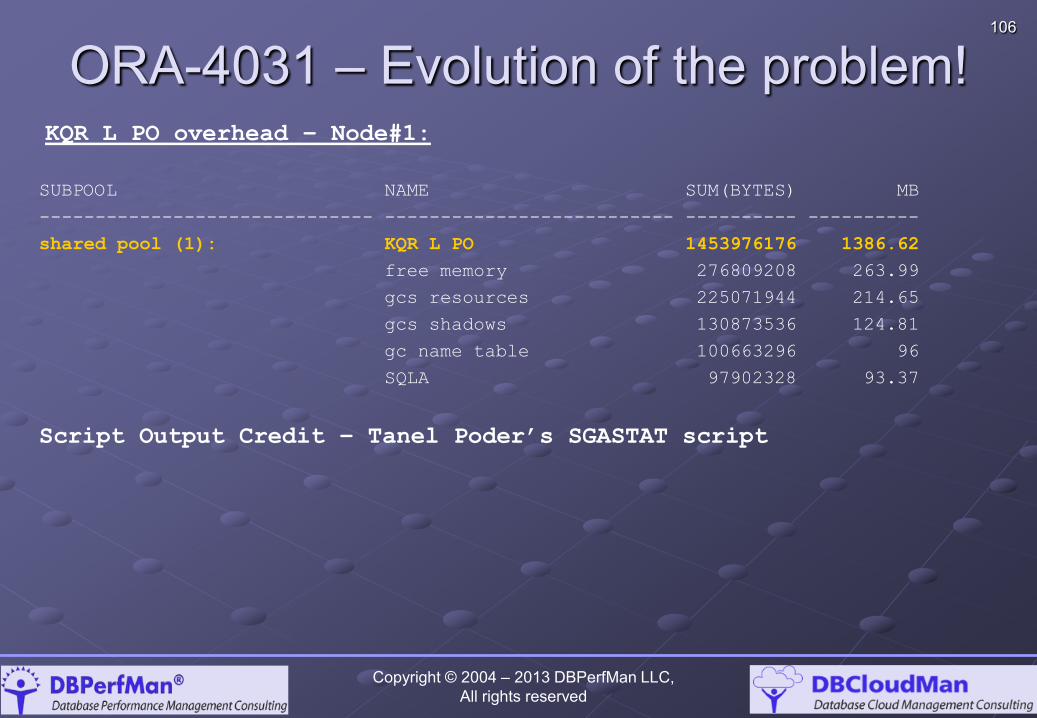
KQR L PO overhead – Node#1:
SUBPOOL NAME SUM(BYTES) MB
------------------------------ -------------------------- ---------- ----------
shared pool (1): KQR L PO 1453976176 1386.62
free memory 276809208 263.99
gcs resources 225071944 214.65
gcs shadows 130873536 124.81
gc name table 100663296 96
SQLA 97902328 93.37
Script Output Credit – Tanel Poder’s SGASTAT script
107
ORA-4031 – Evolution of the problem!
Copyright © 2004 – 2013 DBPerfMan LLC, All rights reserved
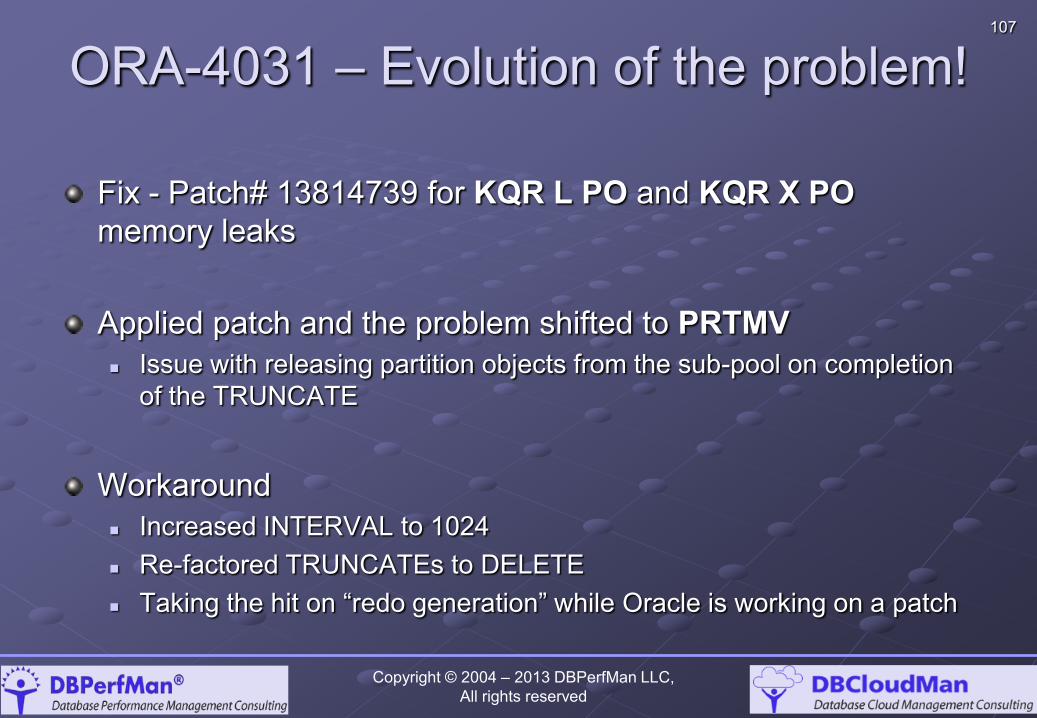
Fix - Patch# 13814739 for KQR L PO and KQR X PO memory leaks Applied patch and the problem shifted to PRTMV Issue with releasing partition objects from the sub-pool on completion
of the TRUNCATE Workaround Increased INTERVAL to 1024 Re-factored TRUNCATEs to DELETE Taking the hit on “redo generation” while Oracle is working on a patch

108
How we felt after 5 weeks!
Source – A Friend Copyright © 2004 – 2013 DBPerfMan LLC,
All rights reserved
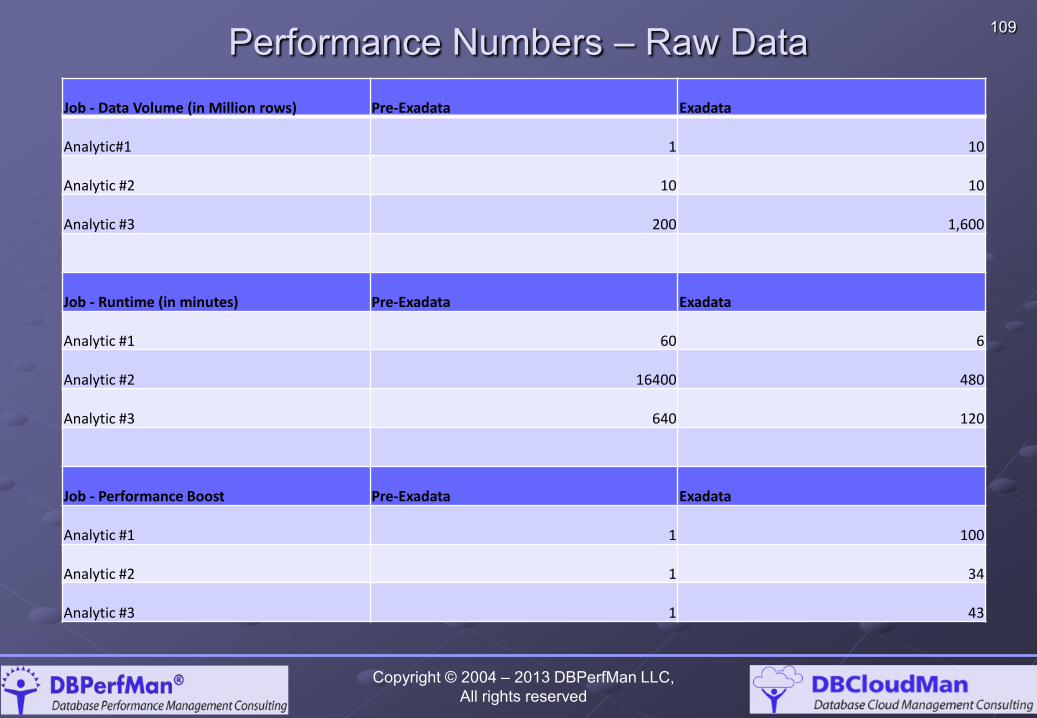
109 Performance Numbers – Raw Data
Copyright © 2004 – 2013 DBPerfMan LLC, All rights reserved
Job - Data Volume (in Million rows) Pre-Exadata Exadata
Analytic#1 1 10
Analytic #2 10 10
Analytic #3 200 1,600
Job - Runtime (in minutes) Pre-Exadata Exadata
Analytic #1 60 6
Analytic #2 16400 480
Analytic #3 640 120
Job - Performance Boost Pre-Exadata Exadata
Analytic #1 1 100
Analytic #2 1 34
Analytic #3 1 43
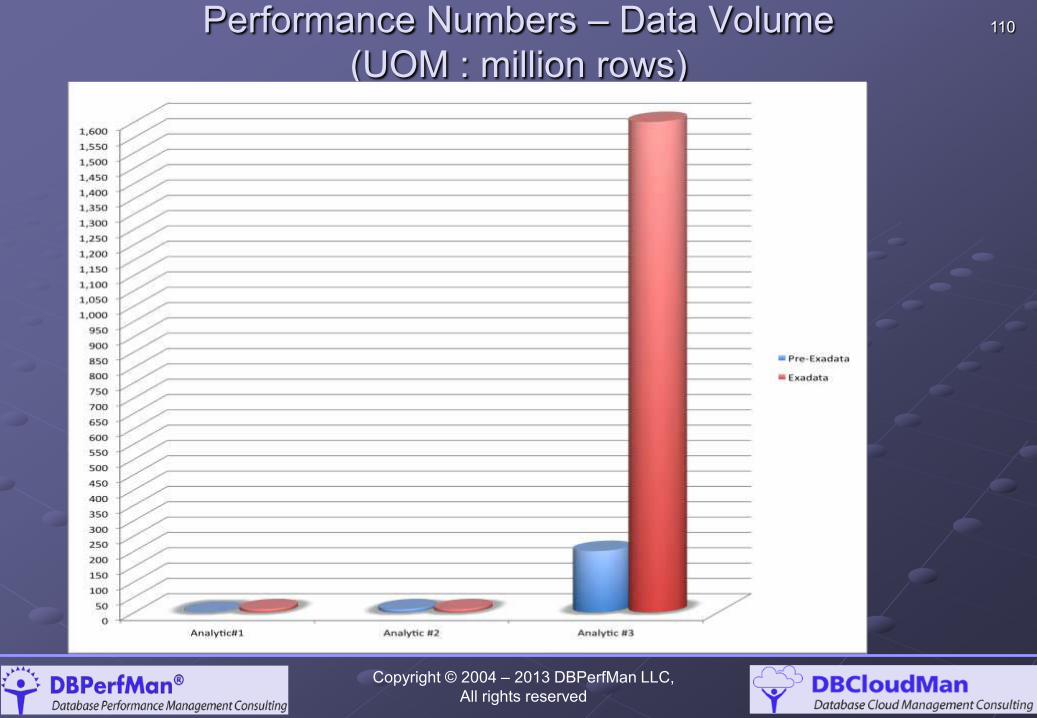
110 Performance Numbers – Data Volume (UOM : million rows)
Copyright © 2004 – 2013 DBPerfMan LLC, All rights reserved
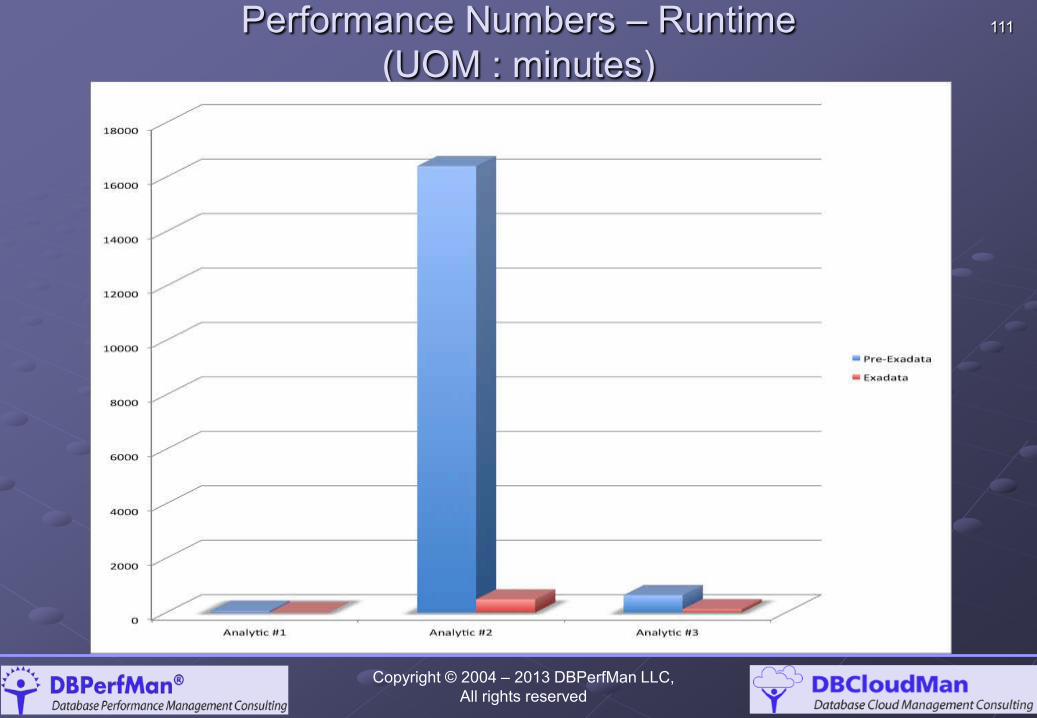
111 Performance Numbers – Runtime (UOM : minutes)
Copyright © 2004 – 2013 DBPerfMan LLC, All rights reserved
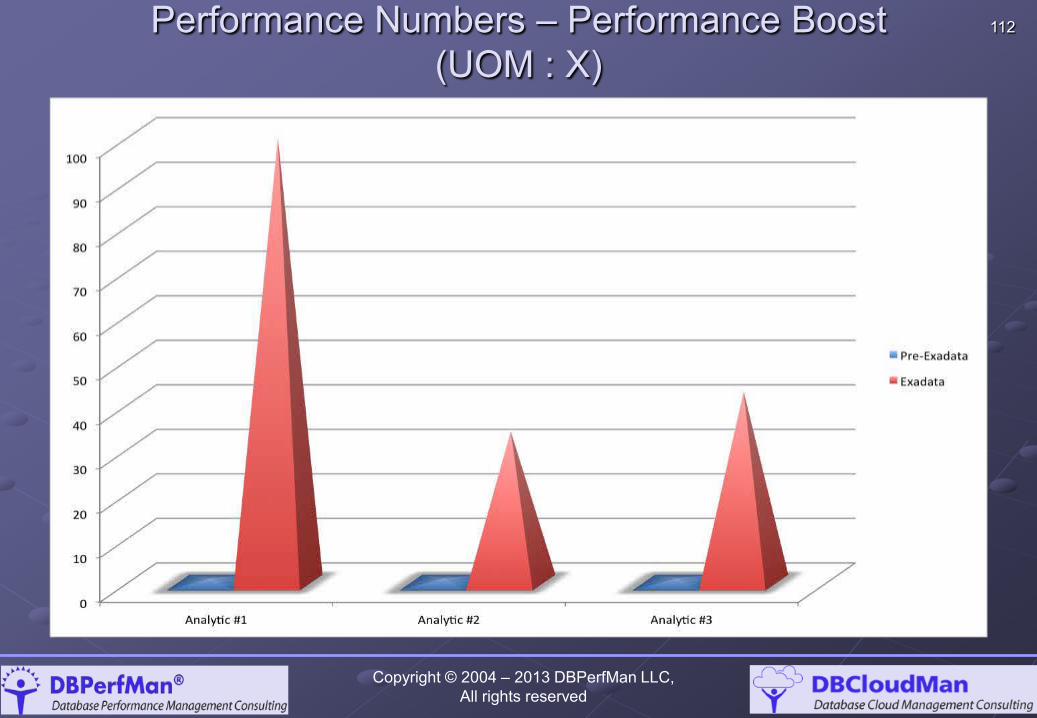
112 Performance Numbers – Performance Boost (UOM : X)
Copyright © 2004 – 2013 DBPerfMan LLC, All rights reserved
113
Q & A
Copyright © 2004 – 2013 DBPerfMan LLC, All rights reserved
114
Gratitude My customers Tanel Poder, Kerry Osborne, Tim Gorman & Kellyn Pot’vin Sreenadha Reddy & Harikrishna Gollapothu
Copyright © 2004 – 2013 DBPerfMan LLC, All rights reserved
115
Conclusion Oracle Exadata – delivers intelligent I/O for Oracle databases Great platform for data consolidation Lends itself very well for multi-tenancy and pluggable databases Leveraging smart scans is very important HCC facilitates reduction of data footprint with performance boosts for historical reporting
Copyright © 2004 – 2013 DBPerfMan LLC,
All rights reserved
116
References 1. Osborne et. al : Expert Oracle Exadata, Apress, 2011
2. Patel et. al : Oracle Net Services : Performance, Scalability,
HA & Security Best Practices, Oracle Open World, 2012/2013
3. Poder, Tanel – SGASTATX script, http://blog.tanelpoder.com/files/scripts/sgastatx.sql
Copyright © 2004 – 2013 DBPerfMan LLC, All rights reserved
117
Thank You!
Visit us at http://www.dbperfman.com and http://www.dbcloudman.com