Cdm Gds Profile
68
DISTRICT SOCIO ECONOMIC PROFILE GROWTH & DEVELOPMENT SUMMIT 2007
-
Upload
aviwe-chimurenga-tyumre-poqo -
Category
Documents
-
view
30 -
download
0
description
AFRIKA
Transcript of Cdm Gds Profile

D I S T R I C T S O C I O E C O N O M I C P RO F I L E
G ROW T H & D EV E LO P M E N T S U M M I T 2007

C O N T E N TS
I N T RO D U C T I O N · · · · · · · · · · · · · · · · · · · · · · 4
Aims of the Summit · · · · · · · · · · · · · · · · · · · · · · · · · · · · · · · · · · · · · 4
Aims of this document · · · · · · · · · · · · · · · · · · · · · · · · · · · · · · · · · · · 5
Methodology· · · · · · · · · · · · · · · · · · · · · · · · · · · · · · · · · · · · · · · · · · · · 5
D I S T R I C T S N A P S H OT · · · · · · · · · · · · · · · · · · · 6
S O C I O E C O N O M I C I N F R A S T RU C T U R E · · · · · 10
Delivery of Basic Services · · · · · · · · · · · · · · · · · · · · · · · · · · · · · · · 10
WATER· · · · · · · · · · · · · · · · · · · · · · · · · · · · · · · · · · · · · · · · · · 10
SANITATION · · · · · · · · · · · · · · · · · · · · · · · · · · · · · · · · · · · · · 11
WATER AND SANITATION BACKLOGS · · · · · · · · · · · · · · · · 13
ELEC TRICIT Y · · · · · · · · · · · · · · · · · · · · · · · · · · · · · · · · · · · · 14
HOUSING · · · · · · · · · · · · · · · · · · · · · · · · · · · · · · · · · · · · · · · 15
Build and maintain infrastructure · · · · · · · · · · · · · · · · · · · · · · · · 16
PROVINCIAL DEPAR TMENT
INFRASTRUC TURE EXPENDITURE PLANS · · · · · · · · · · · · · 16
PROVINCIAL GOVERNMENT INFRASTRUC TURE
EXPENDITURE: CONCLUSIONS · · · · · · · · · · · · · · · · · · · · · · 19
MUNICIPAL INFRASTRUC TURE GRANT (MIG) · · · · · · · · · · 19
STRATEGIC INFRASTRUC TURE PROJEC TS · · · · · · · · · · · · · 20
S E C TO R D EV E LO P M E N T · · · · · · · · · · · · · · · 22
Job Creation and Livelihoods · · · · · · · · · · · · · · · · · · · · · · · · · · · · 22
AGRICULTURE · · · · · · · · · · · · · · · · · · · · · · · · · · · · · · · · · · · 22
T IMBER · · · · · · · · · · · · · · · · · · · · · · · · · · · · · · · · · · · · · · · · · 23
MANUFAC TURING · · · · · · · · · · · · · · · · · · · · · · · · · · · · · · · · 24
CONSTRUC TION · · · · · · · · · · · · · · · · · · · · · · · · · · · · · · · · · 24
TRADE AND BUSINESS SER VICES/IC T · · · · · · · · · · · · · · · · 24
TOURISM · · · · · · · · · · · · · · · · · · · · · · · · · · · · · · · · · · · · · · · 25
MINING · · · · · · · · · · · · · · · · · · · · · · · · · · · · · · · · · · · · · · · · · 27
H R & S K I L L S D EV E LO P M E N T · · · · · · · · · · · · 28
Skills Upgrade · · · · · · · · · · · · · · · · · · · · · · · · · · · · · · · · · · · · · · · · · 28
I N S T I T U T I O N A L D EV E LO P M E N T · · · · · · · · · 30
Improve Public Services · · · · · · · · · · · · · · · · · · · · · · · · · · · · · · · · · 30
Health · · · · · · · · · · · · · · · · · · · · · · · · · · · · · · · · · · · · · · · · · · · · · · · · · 32
Health services delivery · · · · · · · · · · · · · · · · · · · · · · · · · · · · · · · · · 33
Education · · · · · · · · · · · · · · · · · · · · · · · · · · · · · · · · · · · · · · · · · · · · · · 34
HIV & AIDS · · · · · · · · · · · · · · · · · · · · · · · · · · · · · · · · · · · · · · · · · · · · · 35
Developing Municipal Capacity and Co-operation · · · · · · · · 37
ALIGNMENT AND COOPERATION · · · · · · · · · · · · · · · · · · · 37
GAPS IN THE 2006-07 IDP · · · · · · · · · · · · · · · · · · · · · · · · · 37
SUPPOR T BY DEPAR TMENT OF PROVINCIAL
AND LOCAL GOVERNMENT (DPLG) AND GTZ · · · · · · · · · 37
SUPPOR T TO LOCAL MUNICIPALIT IES · · · · · · · · · · · · · · · 38
MUNICIPAL COOPERATION · · · · · · · · · · · · · · · · · · · · · · · · 38
R E G I O N A L L I N K AG E S · · · · · · · · · · · · · · · · · · 40
Agreement with the Cape Winelands DM · · · · · · · · · · · · · · · · 40
Agreement with the NMBMM · · · · · · · · · · · · · · · · · · · · · · · · · · · 40
P OV E RT Y P RO F I L E · · · · · · · · · · · · · · · · · · · · 42
Human Development Index (HDI) · · · · · · · · · · · · · · · · · · · · · · · 42
Persons Living in Poverty · · · · · · · · · · · · · · · · · · · · · · · · · · · · · · · · 42
Social grant dependency · · · · · · · · · · · · · · · · · · · · · · · · · · · · · · · · 43
C O N C LU S I O N S · · · · · · · · · · · · · · · · · · · · · · · 44
AC RO N Y M S · · · · · · · · · · · · · · · · · · · · · · · · · 46
G D S AG R E E M E N T · · · · · · · · · · · · · · · · · · · · · 48

4
A I M S O F T H E S U M M I T
The aim of the GDS is to reach broad agreement on:
� a development path and programme for the district;
� what each social partner (government, business, labour and
community sector) should contribute to the implementation of
the programme;
� Strengthening the strategic thrust of the district IDP to ensure
planning and implementation alignment between the spheres
of government, as well as public entities.
In this regard the GDS should seek to address the following
specific questions and issues:
1. The Cacadu district’s economic potential and which sectors
of the economy should be promoted (this would need, where
applicable, to be informed by the IDP, LED and the RIDS)
2. Commitments by government, business, labour and
community sector to ensure investment in each of the
sectors
3. Actions required by government and each partner to deal
with constraints to such investments, including dealing with
bureaucratic delays, EIA processes and land use management
Building on the results of the National Growth and Development
Summit in June 2003, government proposed that all District
and Metropolitan Municipalities hold Growth and Development
Summits (GDS) in their area of jurisdiction.
The summits should provide opportunities for building
partnerships with social partners by bringing together
representatives from the broadest sections of society: labour,
business, community sector and government (local, province
and national).
Government has identified district and metropolitan areas as the
pivotal sites on which to build an understanding of the nature
and distribution of regional economic potential across the
country.
Collaborative action between government and social partners
across all the three spheres is vital in forging a common vision for
promoting rising levels of growth, investment, job creation, and
people-centred development
I N T RO D U C T I O N

5
A I M S O F T H I S D O C U M E N T
1. To ensure that discussion on the above issues takes place on
an informed basis
2. To present a coherent picture of the social, demographic, and
economic profile and service levels of the area
3. To present a picture of the challenges facing local government
especially in relation to capacity
4. To suggest the mechanisms & processes for monitoring progress
on the decisions reached and the governance framework for
ongoing dialogue and feedback among social partners.
The district GDS presents a unique opportunity for constructing
partnerships and harnessing the collective energies and
contributions of a range of actors and role players with a view to
enhancing accelerated and shared growth.
The district GDS has the potential to unlock the potential of all
localities, and ensure that all sectors of society identify their role
and contribute to the common national objective to build a
better life for all.
M E T H O D O LO G Y
This profile for Cacadu District is based on a number of documents
and information from a range of sources. These broadly include
the following:
� ECSECC data, publications and reports
� District and local municipal IDPs
� Cacadu’s EGDS (Economic Growth and Development Strategy)
� Data from the Rapid Assessment of services in the Eastern Cape
conducted in 2006)
� Data from Cacadu’s Situational analysis and Development of a
Strategy to Address Backlogs in Water and Sanitation Services in
the Cacadu Region (2005)
� Various research reports
4. Social and economic infrastructure programmes required
to improve investments and provide basic services to
communities
5. Contribution by each partner to the construction of such
infrastructure, including the possibility of PPP
6. Second Economy interventions (EPWP including roads & ECD,
co-operatives, micro-credit, procurement, land reform, etc)
and the role of each sector in such interventions
7. Promoting local procurement – what interventions are
required
8. Improving capacity of local government and contribution
of each social partner: including role of public sector unions
in ensuring efficiency, role of all in fighting corruption,
contribution by private sector and professionals to skills
required by the district/metro
9. Establishing partnerships and/or regional growth coalitions
which will act as a mechanism for cooperative action at all
levels and a robust framework for monitoring and evaluating
progress
6
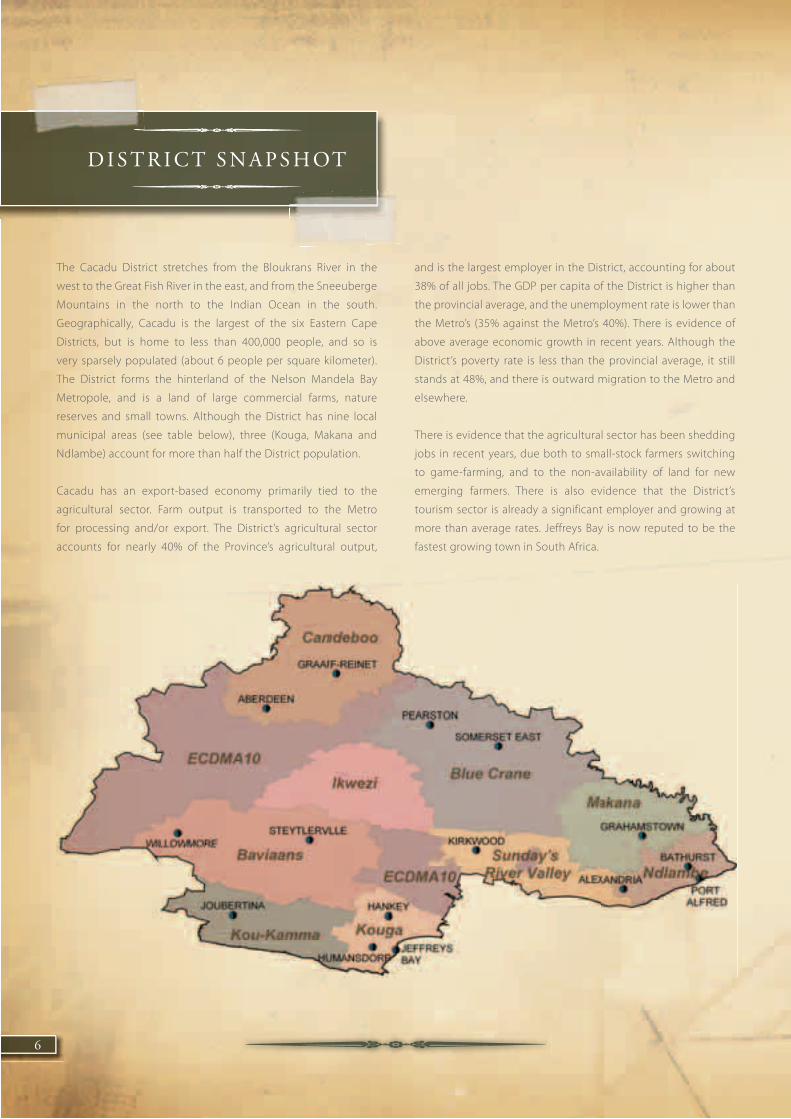
and is the largest employer in the District, accounting for about
38% of all jobs. The GDP per capita of the District is higher than
the provincial average, and the unemployment rate is lower than
the Metro’s (35% against the Metro’s 40%). There is evidence of
above average economic growth in recent years. Although the
District’s poverty rate is less than the provincial average, it still
stands at 48%, and there is outward migration to the Metro and
elsewhere.
There is evidence that the agricultural sector has been shedding
jobs in recent years, due both to small-stock farmers switching
to game-farming, and to the non-availability of land for new
emerging farmers. There is also evidence that the District’s
tourism sector is already a significant employer and growing at
more than average rates. Jeffreys Bay is now reputed to be the
fastest growing town in South Africa.
The Cacadu District stretches from the Bloukrans River in the
west to the Great Fish River in the east, and from the Sneeuberge
Mountains in the north to the Indian Ocean in the south.
Geographically, Cacadu is the largest of the six Eastern Cape
Districts, but is home to less than 400,000 people, and so is
very sparsely populated (about 6 people per square kilometer).
The District forms the hinterland of the Nelson Mandela Bay
Metropole, and is a land of large commercial farms, nature
reserves and small towns. Although the District has nine local
municipal areas (see table below), three (Kouga, Makana and
Ndlambe) account for more than half the District population.
Cacadu has an export-based economy primarily tied to the
agricultural sector. Farm output is transported to the Metro
for processing and/or export. The District’s agricultural sector
accounts for nearly 40% of the Province’s agricultural output,
D I S T R I C T S N A P S H OT

7
Municipal Area Population Main towns Main Products
Kou-Kamma 34 296 Kareedouw | Joubertina | Stormsrivier Forestry | Deciduous Fruit | Dairy | Flowers (Proteas)Honeybush Tea | Tourism
Baviaans 18,000 Willowmore | Steytlerville Eco-tourism | Game/Hunting | Sheep
Camdeboo 44 367 Graaff-Reinet | Aberdeen | Nieu-Bethesda Game | Sheep | Goats | Tourism
Kouga 70 689 Humansdorp | Jeffrey’s Bay | St Francis | Patensie | Hankey Citrus | Vegetables | Tobacco | Tourism | Dairy | Forestry
Ikwezi 10 363 Jansenville Game | Sheep | Goats
Blue Crane Route 36,000 Somerset East | Cookhouse | Pearston Sheep | Goats | Game | BeefField Crop Irrigation (Lucerne) | Ostriches
Sunday’s River Valley 41 590 Kirkwood | Addo | Paterson Citrus | Lucerne | Flowers | Tourism/Game
Ndlambe 55 476 Port Alfred | Alexandria | Kenton-on-Sea Boesmansrivier | Bathurst
Tourism/Game Reserves | Beef | Dairy | Pineapples | Chicory
Makana 74 529 Grahamstown | Alicedale Game | Beef | Goats | Tourism (e.g. Eco-Tourism, various Festivals) | University Graduates
DMA (excluding national parks) 6 550 Mainly rural | Rietbron and small settlements Sheep | Goats | Game

8
� Construction, Trade & Finance showed strong growth of real GVA
and jobs
� The growth of Community Services GVA was below the provincial
average (because Cacadu is a relatively privileged region).
It is also clear from the local municipal-level data that most
growth is occurring in the coastal municipalities. Specifically,
Kouga accounted for 25% of District jobs in 1996 and 28% of
District jobs in 2005.
From the table below we can identify the following broad trends
in the district economy:
� Relatively strong real growth of GVA over the period (1996 to
2005), but only 5,000 net job creation
� Nearly all net job creation was from Community Services sector
(public sector). That is, job creation in some private sectors was
offset by job losses in others.
� The agricultural sector (including forestry) showed real growth
over the period, but a decline in jobs (presumably due to game
farming etc)
� There was quite strong growth in manufacturing & jobs were
maintained.
G V A A N D E M P L O Y M E N T P E R S E C T O R F O R C A C A D U 1 9 9 6 – 2 0 0 6
Sector GVA 1996 GVA 2005 Change Joba 1996 Jobs 2005 Change
Agriculture R 1 070 000 000 R 1 192 000 000 11.3 % 31 887 26 333 -17.4 %
Mining R 437 000 000 R 330 000 000 -24.5 % 149 95 -36.4 %
Manufactruring R 399 000 000 R 521 000 000 30.5 % 4 920 4 922 0.00 %
Electricity R 114 000 000 R 126 000 000 10.00 % 416 440 5.8 %
Construction R 132 000 000 R 215 000 000 62.1 % 3 067 5 202 69.6 %
Trade R 486 000 000 R 785 000 000 61.6 % 6 719 10 5277 56.7 %
Transport R 183 000 000 R 332 000 000 81.0 % 1 571 1 505 -4.2 %
Finance R 562 000 000 R 846 000 000 50.6 % 2 543 4 176 64.2 %
Community Services R 1 489 000 000 R 1 606 000 000 7.8 % 14 322 19 283 34.6 %
Households – – – 10 595 8 883 -16.1 %
Total R 4 933 000 000 R 6 218 000 000 26.0 % 76 188 81 368 6.8 %
Note: Gross Value Added (GVA) at constant 2000 prices; “jobs” refers to formal employmentSource: Global Insight 2006
9
To address Provincial development challenges and opportunities,
the Provincial Growth and Development Plan (PGDP) was launched
in 2004, and the PGDP finds expression in the District’s IDP’s.
More recently, AsgiSA has been launched to accelerate economic
growth throughout South Africa. The Cacadu District has also
developed its own Economic and Development Framework,
based on five strategic pillars: economic infrastructure, sector
development, HR and skills, institutional development and
regional linkages. The District may be in a position to benefit
from two AsgiSA programmes: biofuels and forestry.
The present document aims to outline the elements of a
development strategy for the Cacadu District that is consistent
with, and informed by, the DM’s Development Framework.
Specifically, this document considers how to:
� Promote Socio-economic Infrastructure
� Engage in Sector Development
� Address HR and Skills Development
� Maximise Institutional Development
� Ensure Regional Linkages
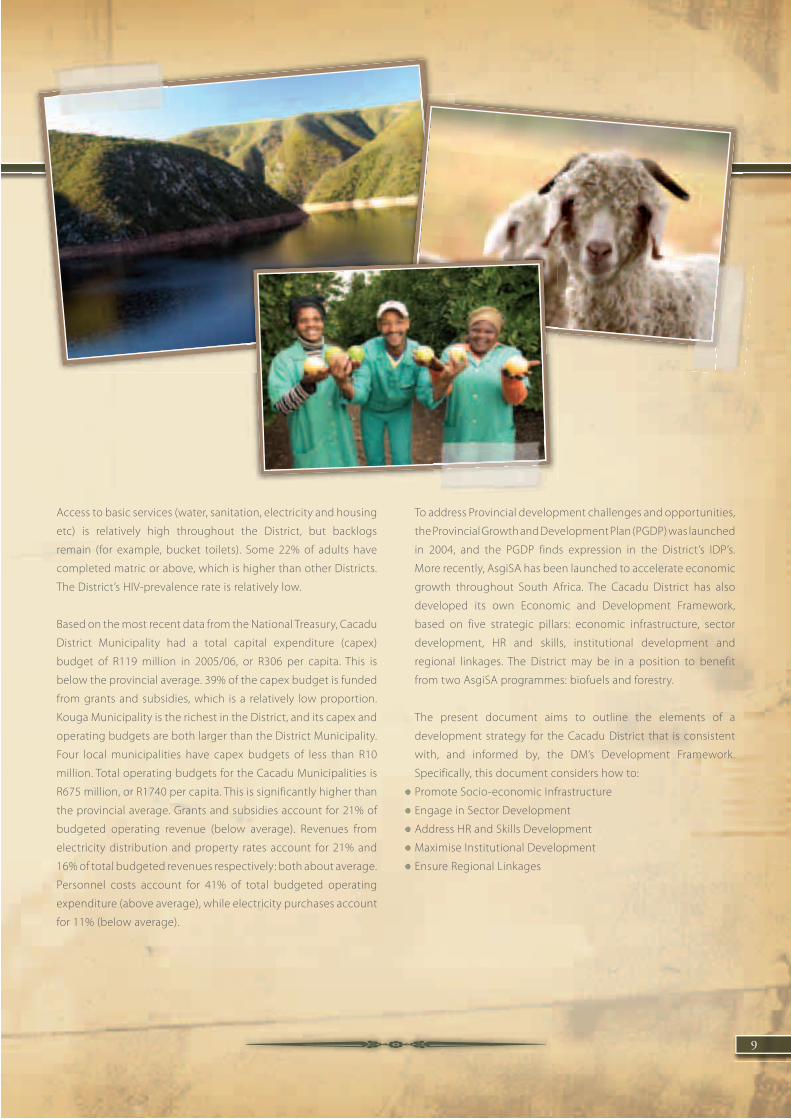
Access to basic services (water, sanitation, electricity and housing
etc) is relatively high throughout the District, but backlogs
remain (for example, bucket toilets). Some 22% of adults have
completed matric or above, which is higher than other Districts.
The District’s HIV-prevalence rate is relatively low.
Based on the most recent data from the National Treasury, Cacadu
District Municipality had a total capital expenditure (capex)
budget of R119 million in 2005/06, or R306 per capita. This is
below the provincial average. 39% of the capex budget is funded
from grants and subsidies, which is a relatively low proportion.
Kouga Municipality is the richest in the District, and its capex and
operating budgets are both larger than the District Municipality.
Four local municipalities have capex budgets of less than R10
million. Total operating budgets for the Cacadu Municipalities is
R675 million, or R1740 per capita. This is significantly higher than
the provincial average. Grants and subsidies account for 21% of
budgeted operating revenue (below average). Revenues from
electricity distribution and property rates account for 21% and
16% of total budgeted revenues respectively: both about average.
Personnel costs account for 41% of total budgeted operating
expenditure (above average), while electricity purchases account
for 11% (below average).
10
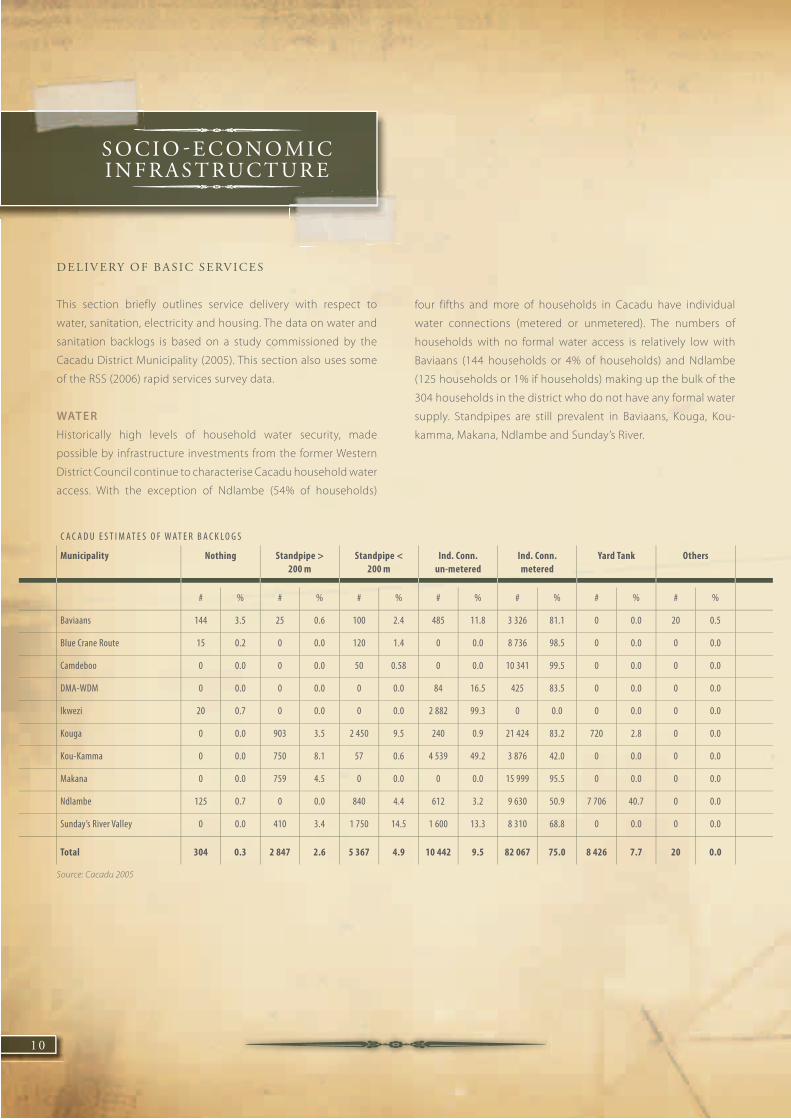
four fifths and more of households in Cacadu have individual
water connections (metered or unmetered). The numbers of
households with no formal water access is relatively low with
Baviaans (144 households or 4% of households) and Ndlambe
(125 households or 1% if households) making up the bulk of the
304 households in the district who do not have any formal water
supply. Standpipes are still prevalent in Baviaans, Kouga, Kou-
kamma, Makana, Ndlambe and Sunday’s River.
D E L I V E RY O F B A S I C S E RV I C E S
This section briefly outlines service delivery with respect to
water, sanitation, electricity and housing. The data on water and
sanitation backlogs is based on a study commissioned by the
Cacadu District Municipality (2005). This section also uses some
of the RSS (2006) rapid services survey data.
WATER
Historically high levels of household water security, made
possible by infrastructure investments from the former Western
District Council continue to characterise Cacadu household water
access. With the exception of Ndlambe (54% of households)
S O C I O E C O N O M I C I N F R A S T RU C T U R E
C A C A D U E S T I M A T E S O F W A T E R B A C K L O G S
Municipality Nothing Standpipe > 200 m
Standpipe < 200 m
Ind. Conn. un-metered
Ind. Conn. metered
Yard Tank Others
# % # % # % # % # % # % # %
Baviaans 144 3.5 25 0.6 100 2.4 485 11.8 3 326 81.1 0 0.0 20 0.5
Blue Crane Route 15 0.2 0 0.0 120 1.4 0 0.0 8 736 98.5 0 0.0 0 0.0
Camdeboo 0 0.0 0 0.0 50 0.58 0 0.0 10 341 99.5 0 0.0 0 0.0
DMA-WDM 0 0.0 0 0.0 0 0.0 84 16.5 425 83.5 0 0.0 0 0.0
Ikwezi 20 0.7 0 0.0 0 0.0 2 882 99.3 0 0.0 0 0.0 0 0.0
Kouga 0 0.0 903 3.5 2 450 9.5 240 0.9 21 424 83.2 720 2.8 0 0.0
Kou-Kamma 0 0.0 750 8.1 57 0.6 4 539 49.2 3 876 42.0 0 0.0 0 0.0
Makana 0 0.0 759 4.5 0 0.0 0 0.0 15 999 95.5 0 0.0 0 0.0
Ndlambe 125 0.7 0 0.0 840 4.4 612 3.2 9 630 50.9 7 706 40.7 0 0.0
Sunday’s River Valley 0 0.0 410 3.4 1 750 14.5 1 600 13.3 8 310 68.8 0 0.0 0 0.0
Total 304 0.3 2 847 2.6 5 367 4.9 10 442 9.5 82 067 75.0 8 426 7.7 20 0.0
Source: Cacadu 2005

11
SANITATION
Although households in all local municipal areas in Cacadu
are above the provincial average in terms of formal household
sanitation, the levels vary among local municipal areas.
The bucket system is still prevalent in Cacadu and constitutes a
significant challenge as far as sanitation backlogs are concerned.
Almost half of households in Ikwezi (49%) still rely on the bucket
system with high levels also recorded for Baviaans (38%), Blue
Crane Route (19%), Kouga (15%), Makana (9%) and Koukama (7%).
Households with no formal sanitation are only recorded in
Makana (759 households or 5%) and Baviaans (130 households
or 3%). Otherwise significant levels of households who access
sub RDP standard sanitation (pit latrines) are found in Sunday’s
river (33% of households), Kou-Kamma (9%), Ndlambe (4%) and
Camdeboo (2%).

12
C A C A D U E S T I M A T E S O F W A T E R B A C K L O G S
Municipality Nothing Pit Latrine VIP Bucket System Conser. Tank Septic Tank SBS System FW System
# % # % # % # % # % # % # % # %
Baviaans 130 3.2 4 0.1 351 8.6 1 561 38.3 102 2.5 449 11.0 0 0.0 1 483 36.3
Blue Crane Route 0 0.0 15 0.2 0 0.0 1 723 19.4 825 9.3 0 0.0 0 0.0 6 308 71.1
Camdeboo 0 0.0 217 2.1 0 0.0 53 0.5 165 1.6 1 015 9.8 725 7.0 8 216 79.1
DMA-WDM 0 0.0 0 0.0 84 16.5 0 0.0 0 0.0 78 15.3 0 0.0 347 68.2
EC DMA 10 0 0.0 0 0.0 0 0.0 0 0.0 0 0.0 0 0.0 0 0.0 0 0.0
Ikwezi 0 0.0 20 0.7 0 0.0 1 430 49.3 606 20.9 0 0.0 0 0.0 846 29.2
Kouga 0 0.0 0 0.0 0 0.0 3 883 15.1 7 122 27.7 2 434 9.5 150 0.6 12 148 47.2
Kou-Kamma 0 0.0 807 8.7 0 0.0 621 6.7 0 0.0 1 514 16.4 2 676 29.0 3 624 39.2
Makana 759 4.5 0 0.0 2 283 13.6 1 483 8.8 443 2.6 0 0.0 0 0.0 11 790 70.4
Ndlambe 0 0.0 840 4.4 3 785 20.0 0 0.0 5 195 27.5 2 446 12.9 3 276 17.3 3 371 17.8
Sunday’s River Valley 0 0.0 3 960 32.8 1 043 8.6 1 100 9.1 0 0.0 145 1.2 0 0.0 5 822 48.2
Source: Cacadu 2005

13
WATER AND SANITATION BACKLOGS
The water and sanitation backlogs for Cacadu are all associated with
urban settlements with virtually no rural settlements occurring
within the district. The costs for eradicating the estimated water
and sanitation backlogs for Cacadu amount to R664m (R223m
for water and R441m for sanitation). Makana (26%), Kou Kamma
(20%), Sunday’s River Valley Valley (17%) and Baviaans (12%) make
up three quarters of the estimated water backlog for Cacadu.
The estimated sanitation backlogs are largely accounted for by
Ndlambe (23%), Kouga (22%), Sunday’s River Valley (15%) and
Makana (13%) accounting from almost three quarters of the
estimated sanitation backlogs.
According to Cacadu’s projections (2005), the Municipal
Infrastructure Grant (MIG) will not be sufficient to meet the 2014
deadline for the eradication of backlogs. In terms of Cacadu’s
proposed Backlog Eradication Programme (BEP) the eradication
of the backlog by 2012 would require an additional R306.4m over
and above the MIG. The shortfall would increase to R422.3m if
the 2014 target is used.
The eradication of backlogs in water and sanitation in the District
(in line with national targets) is well within reach, provided the
Districts’ backlog eradication plan (BEP) is adequately resourced
and implemented. There is clearly a need to lobby for more MIG
funding to achieve the targets.
E S T I M A T E D W A T E R A N D S A N I T A T I O N B A C K L O G S F O R C A C A D U
LM name Category Water Development Cost Inclusive of Bulk
development and reticulation
Sanitation Development Cost
R % R %
Camdeboo Urban R 7,247,481 R 13,804,525
Total R 7,247,481 3 R 13,804,525 3.1
Blue Crane Route Urban R 8,195,304 R 26,178,854
Total R 8,195,304 4 R 26,178,854 5.9
Ikwezi Urban R 4,218,681 R 17,587,860
Total R 4,218,681 2 R 17,587,860 4.0
Makana Urban R 58,959,320 R 56,411,563
Total R 58,959,320 26 R 56,411,563 12.8
Ndlambe Urban R 15,879,925 R 100,344,668
Total R 15,879,925 7 R 100,344,668 22.8
Sunday’s River Valley Urban R 37,186,204 R 67,633,517
Total R 37,186,204 17 R 67,633,517 15.4
Baviaans Urban R 26,069,778 R 31,203,103
Total R 26,069,778 12 R 31,203,103 7.1
Kouga Urban R 19,556,984 R 95,344,997
Total R 19,556,984 9 R 95,344,997 21.6
Kou-Kamma Urban R 43,606,396 R 30,125,010
Total R 43,606,396 20 R 30,125,010 6.8
Aberdeen Plain Urban R 2,060,975 R 1,905,607
Total R 2,060,975 1 R 1,905,607 0.4
Cacadu Total R 222,981,047 R 440,539,703
Source: DHLGTA and DWAF, 2006

14
households in Cacadu were connected to the grid. Challenges
associated with greater access to the grid for household energy
in Cacadu are generally associated with household rather than
community connectedness to the grid. All the main urban
centres in Cacadu are connected to the grid.
ELEC TRICIT Y
Household access to electricity for the local municipal areas in
Cacadu is widespread with a consistently high proportion of
households reporting access to electricity at least for lighting. In
2006 some 83% of households in Cacadu reported using electricity
at least for lighting. Over the period 2001 - 2006 a full 11% of
Electricity Gas Paraffin Candles Solar & Other
Census 2001 RSS 2006 Census 2001 RSS 2006 Census 2001 RSS 2006 Census 2001 RSS 2006 Census 2001 RSS 2006
% % % % % % % % % %
Eastern Cape 49.7 67.1 0.3 0.4 23.3 14.0 25.9 18.3 0.8 0.2
Cacadu 71.9 82.6 0.4 0.5 19.3 11.7 7.7 5.2 0.6 0.1
Baviaans 69.3 73.1 0.4 0.0 16.8 21.7 12.2 5.3 1.4 0.0
Blue Crane Route 65.0 95.0 0.3 0.9 22.5 2.1 11.3 2.1 0.8 0.0
Camdeboo 84.8 92.7 0.1 2.7 5.8 3.0 8.8 1.6 0.5 0.0
EC DMA 10 44.3 60.0 0.9 1.4 26.7 31.6 25.7 7.0 2.5 0.0
Ikwezi 72.2 77.9 0.3 0.0 22.7 18.1 4.1 4.0 0.8 0.0
Kouga 76.2 82.00 0.2 0.7 14.9 15.1 8.4 2.2 0.3 0.0
Kou-Kamma 76.2 87.5 0.3 0.0 4.6 11.2 18.5 1.2 0.5 0.0
Makana 73.4 72.0 0.7 0.0 23.4 17.2 2.0 10.8 0.5 0.0
Ndlambe 66.6 80.1 0.4 0.0 29.1 8.9 3.4 10.3 0.4 0.7
Sunday’s River Valley 65.7 78.6 0.2 0.0 28.2 18.7 5.3 2.7 0.7 0.0
Source: SSA 2001 and RSS 2006

15
The current level of housing backlogs in Cacadu as reported by
the local municipalities is given in the table below.
HOUSING
Levels of informal housing in Cacadu are higher than the
provincial average for the local municipal areas of Makana (23%),
Sunday’s River Valley (20%), Ndlambe (17%) and Kouga (17%).
These areas also generally reflect a significant growth of informal
housing over the period 2001 – 2006 suggesting that they may
be key nodes for in migration within the district.
Informal Housing
Census 2001 RSS 2006
% %
Eastern Cape 10.9 5.3
Cacadu 12.1 12.4
Baviaans 1.9 1.1
Blue Crane Route 7.3 0.0
Camdeboo 7.6 5.4
EC DMA 10 0.4 13.7
Ikwezi 3.4 2.5
Kouga 21.4 16.5
Kou-Kamma 6.4 7.5
Makana 12.8 23.1
Ndlambe 15.0 16.8
Sunday’s River Valley 11.2 20.2
Source: SSA 2001 and RSS 2006
E S T I M A T E D H O U S I N G B A C K L O G S I N C A C A D U
Local Municipality Housing Backlog
# of Units %
Baviaans 767 2.0
Blue Crane Route 2 140 5.5
Camdeboo 5 700 14.6
Ikwezi 1 575 4.0
Kouga 2 971 7.6
Kou-Kamma 1 060 2.7
Makana 12 000 30.8
Ndlambe 5 721 14.7
Sunday’s River Valley 7 010 18.0
Total 38 944 100
Source: Information as provided by LMs, October 2006

16
Provincial Department of Education� Education is a key element of social and economic development.
The Provincial Department of Education has planned and budgeted
up to R250m on education infrastructure in the Cacadu District
over the current medium term expenditure cycle (06/07 – 08/09).
� The Provincial Department is spending R59m in 06/07, rising to
R74m in 07/08 and then to R116m in 08/09 (a 90%+ increase
over the three year period), and this represents about 9% of
total departmental education infrastructure investment over the
current medium term cycle.
� Almost all of the spending is targeted at rehabilitation and
upgrading, as well as routine maintenance, with 29 schools and
3 FET colleges targeted for upgrading to receive R134m over the
three year period. The balance of the expenditure is on routine
maintenance for all schools in the district. Therefore a notable
shift towards quality as opposed to quantity (quantity has been
the norm for previous medium term expenditure cycles).
� These upgrading and maintenance amounts are crucial in two
respects, 1) by upgrading, maintaining and ‘protecting’ existing
assets ensuring guarantee of returns well into the future, and
2) direct and indirect cash injections boost local economies, as
routine maintenance activities are generally labour-intensive.
� Provincial government education infrastructure spending per
capita in the Cacadu District over the three year period, in total, is
R625 per person, the highest per capita ratio in the Eastern Cape.
BU I L D A N D M A I N TA I N I N F R A S T RU C T U R E
It has been repeatedly suggested that one of the major factors
contributing to the low level of economic competitiveness and
social cohesion, and the failure to exploit economic potential,
has been the poor state of infrastructure and infrastructure-
related services. This section of the district profile attempts to
summarise the physical infrastructure development plans that
have been budgeted for over the medium term, and that are
likely to contribute to a more enabling social and economic
environment in the Cacadu District.
Unlike all other districts in the province, Cacadu has a relatively
well developed infrastructure, and backlogs aren’t as acute as in
other areas. The vast natural land, vegetation and water resources
that exist within the district, and the existing infrastructure
base, provide the basis for socio-economic development. But
it is well-planned and prioritised, strategic and complementary
infrastructure investments that will promote high levels of social
development, and stimulate sustainable economic growth.
PROVINCIAL DEPARTMENT
INFR ASTRUC TURE EXPENDITURE PLANS
from 06/07 – 08/09 in the Cacadu District:
The total infrastructure spend directed towards the Cacadu District
by the Eastern Cape provincial government departments amounts
to approximately R1bn over the current medium term expenditure
cycle. This represents signifi cant public sector infrastructure
investment that hopefully ‘crowds in’ private investment.

17
Provincial Department of Agriculture� The Cacadu District has vast natural resources and beauty,
and these resources are at the heart of any sustainable growth
potential and economic activity in the District.
� Given this existing natural resource base, the Provincial
Department of Agriculture plays an important catalyst role in
promoting subsistence farming (food security) and small and
large scale commercial agriculture.
� Over the current medium term period (06/07 – 08/09), the
Provincial Department of Agriculture will spend approximately
R31m on infrastructure in the Cacadu District, representing 15.5%
of the total infrastructure spend (R200m over the medium term)
by the provincial department in the District.
� The allocation is targeted largely at fencing, stock water,
irrigation, storage and shearing sheds, tunnels, dip-tanks, and
soil conservation works.
� The Provincial Agriculture infrastructure spend per capita amounts
to approximately R77 per person in the Cacadu District.
Provincial Department of Health � The provincial health department has planned and budgeted
for a total health infrastructure spending of R55m in the current
medium term expenditure cycle for the Cacadu District
� This provincial health infrastructure expenditure in Cacadu
amounts to approximately 3% of total health infrastructure
spending by the provincial government over the medium term
cycle.
� The allocation is targeted at clinics and hospitals, with major
investment concentrated in Camdeboo (R35m) and in particular
the Kroonvale Clinic in Graff-Reinet, and the Midlands Hospital.
� The balance of expenditure is on routine maintenance of all
health facilities throughout the district.
� The relatively small allocation to the Cacadu District (relative to
other districts and the Metro in the Eastern Cape) is indicative
of the fairly well established health facilities in the district, the
existence of private institutions, and a small population.
� However, access to health facilities - in terms of distances
between health institutions and human settlements – remains a
critical challenge as people have to travel long distances to get
to health facilities.
� The provincial health infrastructure spending per capita in
the Cacadu District over the medium term amounts to an
approximate R137.5 per person.
18
Provincial Department of Housing,
Local Government & Traditional Affairs� In the current financial year – 06/07 - the Provincial department
has budgeted and begun implementing a R22m housing
programme in Cacadu: 1669 houses at Kliplaat, Tsitsikamma,
Mfengu, Addo and Noluthando.
Provincial Department of Sport,
Recreation, Arts and Culture� The total Provincial Department allocation to Cacadu amounts to
just R1.5m over the current medium term expenditure cycle.
� This amount has been set aside in the 06/07 financial year for
construction work on the Tsitsikamma Museum.
� The Steytlerville Sports Field has been planned but yet to be
budgeted for. Estimated cost is R1m.
� The Cacadu allocation of the Department’s infrastructure budget
represents 0.4% of total departmental infrastructure spending
throughout the Province.
� The infrastructure per capita spending for the department in the
district lies at R3.8 per person of infrastructure spend.
Provincial Department of Social Development� The provincial department has allocated almost R16.5m
in infrastructure spending over the current medium term
expenditure cycle to the Cacadu District.
� The expenditure is targeted at new construction of the
Humansdorp Multi-purpose Centre (R6.8m), the Graaff-Reinet
Multi-purpose Centre (R3.1m), and the Grahamstown Multi-
purpose Centre (R6.3m).
� A further R0.3m is allocated for maintenance and upgrade
of parkhomes, and routine maintenance of existing social
development infrastructure.
� The total infrastructure spending in Cacadu represents 24%
of total Social Development infrastructure spending in the
province.
� The social development infrastructure per capita spending over
the medium term is approximately R41 per person.
Provincial Department of Roads and Transport� Another key element of required infrastructure development in
the District is the road network. The Cacadu District suffers from
significant road infrastructure backlogs given the largely rural
(farmland) character of the District.
� In light of these backlogs, and recognising the key enabling
role that transport infrastructure has for economic and social
development, the provincial roads and transport department
has allocated approximately R791m to road infrastructure in the
Cacadu District area, rising from over R172m in 06/07 to R275m
in 07/08 and then rising further to R344m in 08/09.
� This total allocation over the medium term represents
approximately 15% of the total provincial allocation towards road
infrastructure, and amounts to a per capita spend of R1900 per
person in total over the medium term expenditure framework,
the highest across the entire province.
� The major transport projects envisaged in Cacadu are:
Fonteinskloof to Nanara Road (R185m), Addo Paterson MR450
(R67m), and Patensie to Hankey (R43m).
� The balance of the funds (over R400m) has been committed to
routine area-wide maintenance of all roads in the Cacadu District,
over the current medium term expenditure cycle.
19
MUNICIPAL INFR ASTRUC TURE GR ANT (MIG)
The National Government provides infrastructure subsidies
to ensure that all households have access to a basic level of
infrastructure services. The benefits of this intervention are well
known, particularly in relation to the public good characteristics
of many municipal services. The key objectives of the Municipal
Infrastructure Grant are to:
� fully subsidise the capital costs of providing basic services to
poor households: this implies that priority must be given to
meeting the basic infrastructure needs of poor households,
through the provision of appropriate bulk, connector and internal
infrastructure in key services;
� distribute funding for municipal infrastructure in an equitable,
transparent and efficient manner, which supports a co-ordinated
approach to local development and maximises developmental
outcomes;
� assist in enhancing the developmental capacity of municipalities,
through supporting multi-year planning and budgeting systems;
and
� provide a mechanism for the co-ordinated pursuit of national
policy priorities with regard to basic municipal infrastructure
programmes, while avoiding the duplication and inefficiency
associated with sectorally fragmented grants.
PROVINCIAL GOVERNMENT INFR ASTRUC TURE
EXPENDITURE: CONCLUSIONS� These significant provincial infrastructure expenditure plans
in the Cacadu District will provide a meaningful platform for
social and economic development given the opportunities such
spending opens up in both the first and second economies.
� Relative to other Districts and the Metro in the Eastern Cape,
Cacadu, in total provincial infrastructure spend over the current
medium term cycle, will receive approximately 11%.
� It is important for social and economic infrastructure to
complement each other, thereby mutually reinforcing the sum
total of benefits derived from the infrastructure expenditure and
its economy-wide linkages.
� It is necessary, but not sufficient, to just build new infrastructure.
Maintenance of existing infrastructure needs to also be prioritised.
Currently, maintenance of state-owned immoveable assets is poor
inevitably leading to rapid deterioration of buildings and other
assets. Maintenance funds have always and may probably remain
limited. Much of the limitations with respect to maintenance
can be attributed to poor levels of definition with respect to the
responsibility for maintenance budgeting.
� The distinction between levels of responsibility between Public
Works and User departments as reflected by the infrastructure
plans will go a long way towards regularizing maintenance
planning.
� Finally, it is commendable that a paradigm shift is evident
through the infrastructure allocations, with the focus on the
quality of infrastructure and services, as opposed simply to the
quantity, especially in education and health.

20
2010 World Cup� As part of the build up to the 2010 FIFA World Cup, appropriate
supporting mechanisms are being established to realise the
benefits of hosting this major event in the province. To this
effect, various departments are working on a strategy to identify
relevant opportunities associated with enhancing the tourism
attractions of the District.
� The Metro is a host city for the 2010 World Cup, but the spin-
offs, especially in terms of tourism, accommodation, and leisure
will be most prominent in Cacadu given the existing presence of
tourist attractions and facilities relative to the Metro.
� From a tourism perspective, the Department of Economic Affairs,
Environment and Tourism is working within the Provincial 2010
Committee to ensure that the necessary supporting environment
is created for tourism to flourish. Many investment opportunities
are expected to emerge out of this exercise.
� The infrastructure spending (predominantly in the Metro) will
generate direct, indirect and induced effects with cross-linkages
and spill-over effects that will live long beyond the 2010 event
itself.
STR ATEGIC INFR ASTRUC TURE PROJEC TS
Road Upgrade of R3321 � Access to the Baviaanskloof and surrounding areas is by means
of the R332 road, which is the only access point to and from the
Baviaanskloof from Patensie in the east and Willowmore in the
west.
� The road (R332) that goes through the Baviaans Mega-Reserve is
the only entry point into and exit point out to the reserve. This
road leads from Patensie in the east to Willowmore in the west.
This is the only road through the Baviaanskloof and as such is the
only access to the area for both tourists and the local population.
It is currently in a very bad condition, with certain areas only
accessible to 4x4 vehicles and is continuously deteriorating.
� In addition to accessibility, for the purposes of conservation of
the area, the road needs to be in a good state
� The Baviaanskloof Mega-Reserve is located in the western parts
of the Eastern Cape between the Baviaans and Koega mountain
ranges, northwest of Port Elizabeth.
� The Baviaanskloof Mega-Reserve area is the third largest
conservation area in South Africa (184,385 ha) and unique in
offering a rich cultural and ecological experience to visitors,
as illustrated by the awarding of the status of “World Heritage
Site” to this area. The area has outstanding natural beauty and
biodiversity with a variety of mammal and plant species. These
natural assets can lead to sustainable economic growth through
tourism and nature-based commercial ventures.
� A community of around 1,200 people live in this area and work
predominantly in the agricultural sector.
� The road is a public road and the responsibility of the Department
of Roads and Transport of the Eastern Cape Provincial
Government. Currently the road is maintained from Willowmore
up to Geelhoutbos, as well as the section between Komdomo
and Poortjies.
1 Drawn from the Cacadu EGDS, 2006

21
The backlogs for roads, stormwater and transportation stand at
about R2.9bn, broken down as follows:
� R495 million (maintenance).
� R605 million (rehabilitation).
� R1.8 billion (upgrade infrastructure).
In addition to funding constraints, some of the key challenges
facing Cacadu in transport services include:
� Roads classification is not finalized yet resulting in overlapping of
function between the Provincial Government, CDM and the local
municipalities
� Lack of service level agreements between the Province and the
Municipalities with regard to maintenance of roads within the
municipal area or jurisdiction.
� A dilapidated and inefficient rail system that has been neglected
over many years, and is now costly to revive.
Transport
An efficient, safe and sustainable transport network and system
is a key requirement for further infrastructure and economic
growth in Cacadu. And with the 2010 World Cup on the horizon,
it is important that the transport network and systems are
maintained and improved.
Local Municipalities in Cacadu are currently responsible for the
provision and maintenance of:
� 1 444 km of surfaced roads.
� 5 847 km of gravel roads.
� 9 000 km of un-surfaced roads
� 68 bridges
Current budgets allocated to transport infrastructure, including
stormwater infrastructure need to be reviewed in order to
deal with the backlogs. This will require further lobbying
and engagement with provincial and national government
departments (and their public entities), as well as with the local
private sector (through PPPs).

22
Each of these industries requires a coalition of committed players,
able to design realistic and sustainable development strategies,
and detailed Industry Action Plans, specifying investments
to be packaged, timelines and milestones, stakeholders and
responsibilities. Preparatory work and the start-up of many small
municipal LED pilot projects have already taken place for all these
industries in the Cacadu District, and the main challenge is to
galvanise role-players to ensure accelerated and shared growth,
and good quality investments. In particular, the sustainability of
municipal LED pilots (in all industries) will require careful attention,
to ensure new private investment, expansion and local replication.
AGRICULTURE
The District already has a strong and very diversified agricultural
sector. The diversification is illustrated by the variety of leading
products listed in the table above (in the District snapshot) and
results from the fact that all of SA’s agro-ecological zones are
present in the District: forest, grassland, succulent karoo, fynbos,
savannah grasslands and thicket. While the sector is mature
and dominated by a relatively small number of commercial
farmers, there are many opportunities to expand incomes and
employment in the sector. For example, irrigation enterprises
could be developed in the Fish and Sunday’s River valleys by
increasing water transfers from the Gariep Dam. (DWAF are
already considering this). This could provide opportunities for
emerging farmers in citrus, floriculture, vegetables and biofuels
(linked to the sugar beet project between Cookhouse and
Cradock). Other opportunities for emerging farmers include
essential oils, aloe ferox, pineapples, dairy and deciduous fruits.
The main constraint at the moment seems to be land availability.
The land redistribution process seems to be proceeding very
slowly in the District, and there needs to be urgent discussions
with the Department of Land Affairs and commercial farmers to
see how to speed up the process.
J O B C R E AT I O N A N D L I V E L I H O O D S
H H I N C O M E A N D U N E M P L O Y E M E N T F O R C A C A D U
Unemployment(expanded Definition)
Global Insight
HH Income less than R 1500/ month
RSS
1996 2005 2006
% % %
Cacadu 27.9 34.9 57.6
Baviaans 22.4 31.0 47.0
Blue Crane Route 35.8 47.1 56.0
Camdeboo 29.6 38.8 48.8
Ikwezi 25.7 34.3 53.7
Kouga 20.1 247.7 43.8
Kou-Kamma 4.9 6.2 52.5
Makana 33.0 40.6 74.8
Ndlambe 32.0 38.1 78.4
Sunday’s River Valley 35.6 43.9 56.7
Source: Global Insight, 2006 and RSS, 2006
In the context of the very high unemployment and poverty rates
mentioned above, there is clearly an urgent need for major new
private sector investments to create jobs and improve livelihoods
in the Cacadu District. Based on existing economic activity,
market opportunities and present resource/assets/skill bases the
particular industries offering potential include:
� Agriculture
� Timber
� Manufacturing
� Construction
� Trade and Business Services/ICT
� Tourism
S E C TO R D EV E LO P M E N T

23
TIMBER
There are already forests in the District: in Tsitsikamma, Kouga
(e.g. Longmore), and Alexandria (Ndlambe), and a small
secondary industry (indigenous-wood furniture in Humansdorp
and Kareedouw etc).The District needs to explore with DWAF
and AsgiSA the feasibility of expanding the area under forestry
to accommodate small-scale growers. Opportunities for more
timber value addition should also be explored.

24
CONSTRUC TION
The construction sector is expanding in the District, as a result of
coastal property development (eg Jeffreys Bay and the Kenton
Eco Estate, estimated to be a R600m investment) and the
increasing fiscal allocations for public infrastructure (see section
above on infrastructure).
The jobs and empowerment impact of this increasing construction
activity will be optimized by the full use and extension of EPWP
and Emerging Contractors Development Programmes.
TR ADE AND BUSINESS SERVICES/IC T
These are important activities for job creation and livelihoods.
For example:
� Improved infrastructure for informal traders (hawkers stalls and
taxi ranks)
� Business mentoring for emerging businesses
MANUFAC TURING
This is a small but not insignifi cant part of the District economy,
accounting for some 7% of District GDP. Existing producers include
chicory processing, some fruit processing, wood processing
(Koukamma, Kouga) and small-scale leather, taxidermy and crafts.
There is also potential for expanding agri-processing in the
District with some new investments and initiatives currently
underway in the district. These include:
� The R140m investment in Bathurst to process pineapples into
fibre and bio chemicals;
� A proposed plant for fibre extraction and paper making from
Agaves in Graaf-Reinet;
� A proposed tomato puree factory in Kirkwood with an R80m
investment and the potential to create 180 jobs
� The R1.4m charcoal processing in Kareedouw
� A proposed granadilla paste processing plant in Somerset East/
Cookhouse/Pearston;
� Processing of essential oils linked to a number of trials underway
(Woodlands, Baviaans, Graaf-Reinet and Middleberg)
The District’s agricultural output (eg wool and mohair) is mainly
sent to the Metropole for value addition. With much of the wool
and mohair plant (for washing, scouring, de-greasing etc) in the
Metropole being very old and needing replacement, there may
be an opportunity for new plant to be located in the District
provided that adequate quantities (and quality) of water are
available.
25
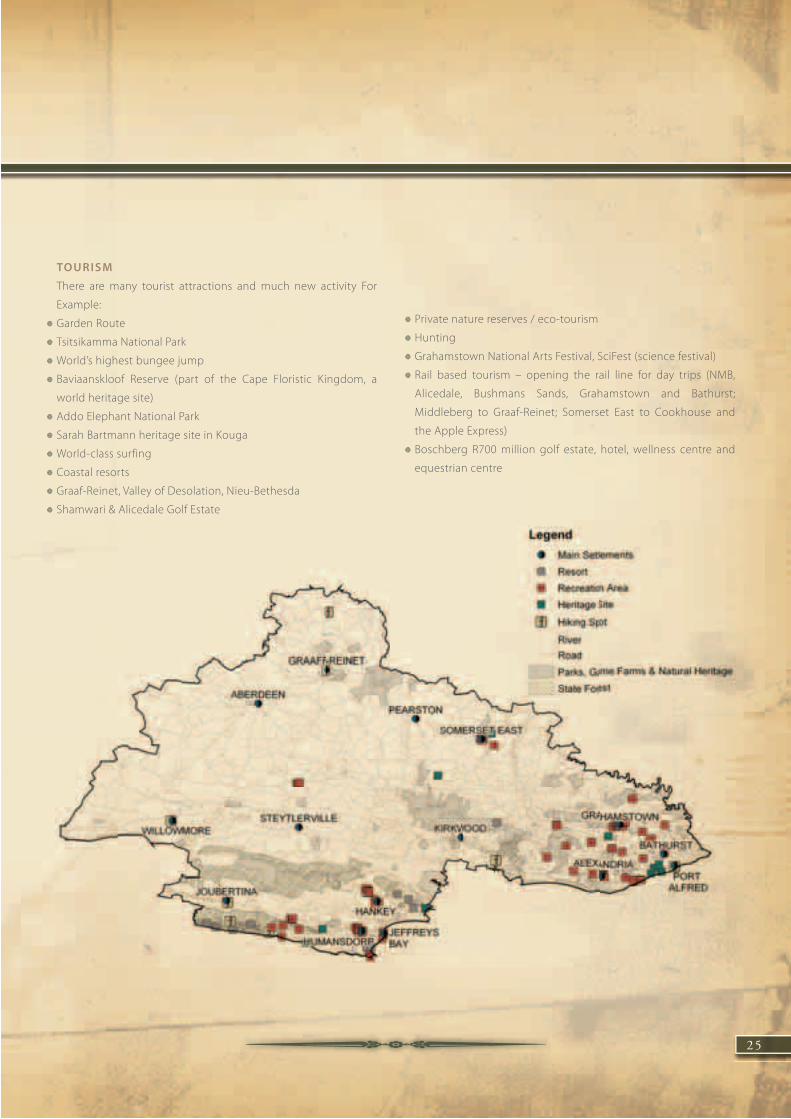
� Private nature reserves / eco-tourism
� Hunting
� Grahamstown National Arts Festival, SciFest (science festival)
� Rail based tourism – opening the rail line for day trips (NMB,
Alicedale, Bushmans Sands, Grahamstown and Bathurst;
Middleberg to Graaf-Reinet; Somerset East to Cookhouse and
the Apple Express)
� Boschberg R700 million golf estate, hotel, wellness centre and
equestrian centre
TOURISM
There are many tourist attractions and much new activity For
Example:
� Garden Route
� Tsitsikamma National Park
� World’s highest bungee jump
� Baviaanskloof Reserve (part of the Cape Floristic Kingdom, a
world heritage site)
� Addo Elephant National Park
� Sarah Bartmann heritage site in Kouga
� World-class surfing
� Coastal resorts
� Graaf-Reinet, Valley of Desolation, Nieu-Bethesda
� Shamwari & Alicedale Golf Estate

26
Game Farming
There has been an increasing shift to game farming in many
areas in Cacadu which were traditionally livestock farming
areas. This shift has been accompanied by the increasing size
of economically productive units necessitated by the nature
of game farming. It has also been accompanied by shifts in
employment practices with claims that many traditional farm
workers have been made redundant. As a result there have been
serious questions raised about the socio-economic impact in
this shift in land use. While game farming is clearly a positive
trend as far as the promotion of regional tourism is concerned
and there are some indications that it promotes relatively more
secure and meaningful employment opportunities there is still
insufficient evidence as to its overall employment generating
potential as opposed to other land uses. A recent study by the
Centre for African Conservation Ecology (2006) at the NMMU
which surveyed 13 game farms in the Eastern Cape, highlights
some positive features associated with the emergence of private
game farms. It also indicates that the barriers to entry into this
sector have been rising with the costs of establishing a game
farm having increased by R10m since 2004 to a median of about
R42m in 2006.
Local Tourism Organisations
All but the smallest towns have tourism information centres that
provide information on local attractions and accommodation to
visitors.
Links to Metro
Nelson Mandela Bay is an integral part of the district’s tourism
economy, as it serves as the gateway to the district, particularly
for international tourists that arrive by air or by road to and from
the Garden Route and the Western Cape.
Infrastructure
The road through the Gamtoos valley to the Baviaans Mega-
reserve (R332) is currently accessible only to four-wheel drive
vehicles. The reserve is destined to remain mainly a wilderness
area, with limited access (unlike the Addo Elephant National
Park), but its current inaccessibility severely hampers the flow of
tourists through the Kloof.
The Addo Elephant National Park is one of the most visited
tourism attractions in the district. The access road between the
Metro and Addo is in a very poor condition and urgently in need
of upgrading.
While work has been done on other tourism routes in the district,
there is a great need for further upgrading, particularly for tour
buses.
27
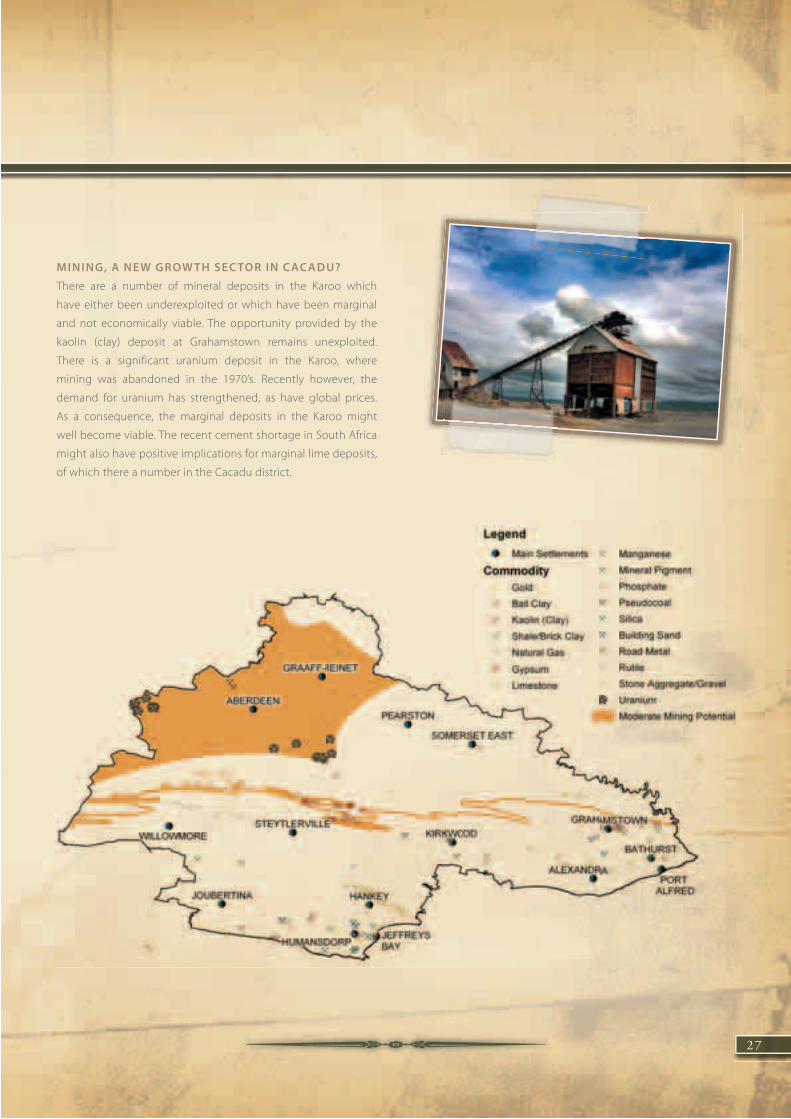
MINING, A NE W GROW TH SEC TOR IN C AC ADU?
There are a number of mineral deposits in the Karoo which
have either been underexploited or which have been marginal
and not economically viable. The opportunity provided by the
kaolin (clay) deposit at Grahamstown remains unexploited.
There is a significant uranium deposit in the Karoo, where
mining was abandoned in the 1970’s. Recently however, the
demand for uranium has strengthened, as have global prices.
As a consequence, the marginal deposits in the Karoo might
well become viable. The recent cement shortage in South Africa
might also have positive implications for marginal lime deposits,
of which there a number in the Cacadu district.
28
There is a need to increase the skills base of the district to facilitate
a reduction in unemployment. This may be achieved through the
training of individuals in sector-specific skills, in sectors in which
currently there is a shortage of employable individuals.
One of the main aims of human resource and skills development
is to facilitate an improvement in the accessibility of skills
development programmes for communities in a manner
that is conducive to an improved availability of skilled labour.
The improvement of the labour force is integrated with the
improvement of the skills and literacy levels of the community.
It goes without saying that a redress of employable skills training
is necessary in Cacadu. An approach that can be followed to
facilitate this revolves around the provision of opportunities for
local residents of the district to participate in skills enhancement
and development programmes. It is, however, important, to
note that when dealing with human capital, i.e. labour, that this
is primarily a renewable resource and therefore as the needs of
the community change and expand, this labour base within the
district should be moulded to accurately meet the requirements
of the economy.
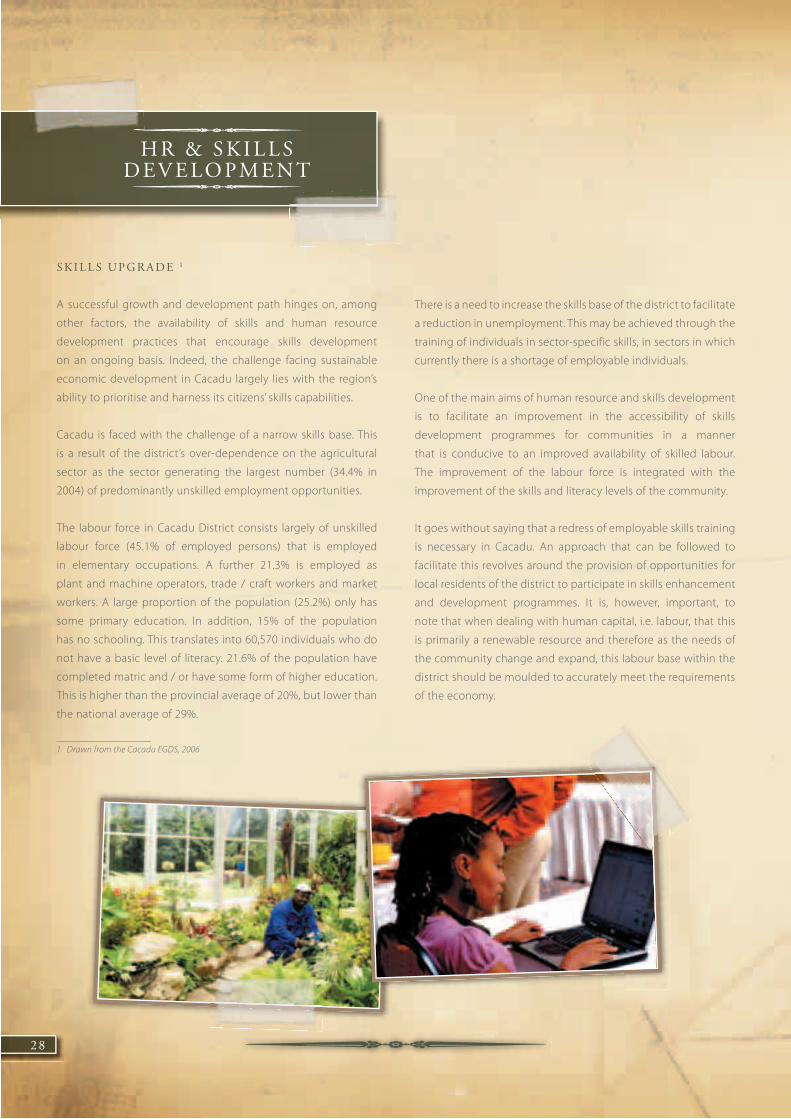
S K I L L S U P G R A D E 1
A successful growth and development path hinges on, among
other factors, the availability of skills and human resource
development practices that encourage skills development
on an ongoing basis. Indeed, the challenge facing sustainable
economic development in Cacadu largely lies with the region’s
ability to prioritise and harness its citizens’ skills capabilities.
Cacadu is faced with the challenge of a narrow skills base. This
is a result of the district’s over-dependence on the agricultural
sector as the sector generating the largest number (34.4% in
2004) of predominantly unskilled employment opportunities.
The labour force in Cacadu District consists largely of unskilled
labour force (45.1% of employed persons) that is employed
in elementary occupations. A further 21.3% is employed as
plant and machine operators, trade / craft workers and market
workers. A large proportion of the population (25.2%) only has
some primary education. In addition, 15% of the population
has no schooling. This translates into 60,570 individuals who do
not have a basic level of literacy. 21.6% of the population have
completed matric and / or have some form of higher education.
This is higher than the provincial average of 20%, but lower than
the national average of 29%.
1 Drawn from the Cacadu EGDS, 2006
H R & S K I L L S D EV E LO P M E N T

29
In response to these skills challenges, the Cacadu District
Municipality is planning a dedicated sector-focused technical
college located in Somerset East to roll out a range of skills
programmes geared towards the priority social ad economic
sectors. A time frame of 2–3 years has been set to conduct,
1) a skills audit and develop a database thereof, and 2) for the
construction (upgrading) and equipping and resourcing of the
technical college.
Furthermore, the Kouga Training Centre Project is being
implemented, involving a R2.2m upgrade (construction) at
the facility in Humansdorp. The skills roll out will be mostly
dedicated to the tourism and hospitality sector, and is expected
to be operational in 2009. An Academy of Visual Arts, Crafts and
Performing Arts, planned for Aberdeen, and in partnership with
the Nelson Mandela University, SABC, Performing Arts Council
(PAC), Artists, and Camdeboo residents, is set to commence in
2008. The total estimated cost is R1.5m.
Emphasis should be placed on job creation – and for local
government this means creating and fostering an enabling
environment - within the District to reduce the skills leakage. The
retention of skilled labour and the return of skilled labour to the
district is crucial to local economic development in that the loss of
the most educated members may undermine community-based
organisations and erode that population’s capacity to respond to
local economic development programmes implemented at the
local level.
A large number of skilled individuals in the Cacadu District, youth
and recent graduates in particular, are seeking employment
outside of the district, e.g. in neighbouring Nelson Mandela Bay,
East London etc. The typical ‘pull’ factors of migration provide
possible explanations for this phenomenon - a more competitive
remuneration package and a relatively larger number of
employment opportunities.
Furthermore, HIV and AIDS have, are and will continue to affect
productivity as cited during various stakeholder engagements.

30
� Clinic access is way above the provincial average of 70% (between
85% in Baviaans to 100% in Blue Crane Route and Sunday’s River)
with only the isolated communities spread across the DMA
reporting levels lower than the provincial average (62%)
� Access to emergency health services (ambulances) was lower
than the average for the province (43%) for Ndlambe (39%) and
the DMA (20%) with the remaining areas above the provincial
norm (between 55% in Makana to 71% in Ikwezi)
� Public primary school access was below the provincial norm
(87%) for Makana (67%) and the DMA communities (70%) with
the other areas recording higher levels (between 81% in Ndlambe
to 100% in Baviaans).
I M P ROV E P U B L I C S E RV I C E S
Although services access reported by local households in Cacadu
are in many instances above the provincial norm there are a
number of instances where this is not the case. These include
the following:
� Households reported lower levels than the provincial average
(35%) in terms of access to good roads in Blue Crane (13%),
Ikwezi (12%), Ndlambe (28%) and Kou-Kamma (29%) and the
DMA areas (7%).
� In terms of access to hospitals Ikwezi (41%), Ndlambe (40%),
Sunday’s River (38%), Baviaans (25%), Kouga (43%) and the DMA
(7%) were all below the provincial average (43%) with Kou-
kamma on par with the provincial average.
I N S T I T U T I O N A L D EV E LO P M E N T
H O U S E H O L D A C C E S S T O B A S I C S E R V I C E S F O R C A C A D U
Roads in good condition Hospitals Clinics Amabulance Services Public Schools/Primary Schools
% % % % %
Eastern Cape 34.9 43.2 69.6 42.6 87.0
Cacadu 40.5 48.0 94.8 55.2 88.2
Baviaans 44.4 24.6 84.6 64.9 100.0
Blue Crane Route 13.1 53.7 100.00 70.8 98.8
Camdeboo 36.0 73.5 99.2 63.0 99.2
EC DMA 10 6.9 6.6 61.9 20.2 69.9
Ikwezi 11.7 41.0 96.2 71.2 89.8
Kouga 62.5 25.8 96.69 35.9 93.7
Kou-Kamma 28.7 42.5 96.3 56.3 93.8
Makana 47.7 63.5 89.6 55.2 66.8
Ndlambe 27.8 40.1 89.1 39.4 81.3
Sunday’s River Valley 38.5 37.8 100.0 67.0 98.7
Source: RSS 2006

31

32
H E A LT H
Data on health infrastructure in Cacadu, and its distribution
across the local municipal areas, is provided in the table below:
H E A LT H S E R V I C E S I N F R A S T R U C T U R E
CHCs & Hospitals Set Clinics Satellites Mobiles Totals
CDM LM Prov CDM LM Prov CDM LM Prov CDM LM Prov
Camdeboo 0 0 0 0 4 1 1 2 0 3 0 0 11
Blue Crane Route 0 0 0 0 6 0 1 0 0 3 0 0 10
Ikwezi 0 0 0 1 2 0 1 0 0 1 0 0 5
Baviaans 0 0 0 1 1 0 0 0 0 2 0 0 4
Total Cambedoo Health Sub-District 0 0 0 2 13 1 3 2 0 9 0 0 30
Makana 0 0 0 1 7 1 1 0 0 3 0 0 13
Ndlambe 0 0 0 4 5 1 0 0 0 4 0 0 14
Sunday’s River Valley 0 0 0 2 3 0 1 1 0 3 0 0 10
Total Makana Health Sub-District 0 0 0 7 15 2 2 1 0 10 0 0 37
Kouga 0 0 1 4 2 0 2 0 0 2 0 0 11
Kou-Kamma 0 0 1 4 0 0 04 0 0 3 0 0 12
Total Kouga Health Sub-District 0 0 2 8 2 0 6 0 0 5 0 0 23
EC DMA 10 0 0 0 1 0 0 0 0 0 2 0 0 3
Total for Cacadu District 0 0 2 18 30 3 11 3 0 26 0 0 93
Source: Health Services, 2007

33
The high levels of staff vacancies in Cacadu clinics are reflected in
the higher than average nurse workload. The workload for nurses
in Cacadu is second only to that of clinics in the NMBM.
N U R S E C L I N I C W O R K L O A D
2000 2001 2002 2003 2004 2005 2006
Alfred Nzo DM 20.5 20.5 20.5 21.7 21.5 20.9 19.9
Amathole DM 25.1 26.0 25.9 25.4 23.1 24.0 24.5
Cacadu DM 33.3 39.2 40.9 42.1 46.9 46.9 44.4
Chris Hani DM 17.6 17.9 16.5 19.5 20.8 22.7 26.2
N Mandela Bay MM 35.1 38.0 37.3 40.5 42.8 47.2 50.2
OR Tambo DM 20.8 20.6 20.4 21.6 22.5 24.3 24.6
Ukhahlamba DM 27.8 22.8 26.7 27.9 27.1 26.2 27.1
Total 24.5 25.3 25.1 26.2 26.2 27.7 28.7
Source: DoH, February 2007
Key challenges for improving health care services which are
confirmed by the provincial IDP engagement process (January,
2007) include engaging the provincial Department of Health on
the following:
� To ensure that the minimum staff complement required to
deliver basic healthcare services is in place.
� Skills development in Human Resource, Financial and Supply chain
management have been identifi ed as critical areas for improving
services delivery
� Referral systems and the transportation of patients needs to be
improved
� Primary Health Care services (PHC package), not available in all
PHC facilities need to be included
� Upgrading and improvement of facilities, structures, and extensions.
� Upgrading and improvement of equipment at facilities, and
provision of vehicles.
� Integration of Specialized services and Provincially Aided Hospitals
� Ensure that the District Health Plan (DHP) is operationalised through
the participation of a wide range of stakeholders in Cacadu
H E A LT H S E RV I C E S D E L I V E RY
Primary Health care services are delivered by Cacadu District
Municipality (CDM), the Local Municipalities (LM), and the Eastern
Cape Department of Health clinics in local communities. According
to the IDP Engagement in January 2007 the following issues with
regards to the delivery of health services were identifi ed:
� Most PHC clinics are fully compliant with the full PHC Package
� Service delivery is affected by the severe staff shortages and
insufficient budget allocations
� The rural nature of the Cacadu District makes it difficult to recruit
and retain staff such as scarce professional categories.
The staff establishment of Cacadu district municipality is 1,628
employees while there are 699 vacancies suggesting a vacancy
rate of 43%. This extremely high level of vacancies has had
significant consequences for services delivery affecting both
corporate and clinical performance.
C A C A D U D I S T R I C T F I L L E D V S V A C A N T P O S T S
Institution FilledPosts
Vacant Posts
Established Vacancy Rate
Cacadu DM 149 49 198 25 %
Cacadu EC DoH Office (Prov) 3 1 4 25 %
Kouga 70 58 128 45 %
Makana 71 97 168 58 %
Cambedoo 49 41 90 46 %
Andries Vosloo 117 83 200 42 %
Humansdorp Hospital 101 85 186 46 %
Midlands Hospital 104 74 178 42 %
Port Alfred Hospital 79 102 181 56 %
Settlers Hospital 335 158 493 32 %
Total 1 078 748 1 826 41 %
Source: DoH, IDP Engagements, January 2007

E D U C AT I O N
School sanitation infrastructure in Cacadu schools requires
urgent upgrading with about one tenth of schools reporting no
formal infrastructure and significantly more relying on pit latrines
or the bucket system.
S C H O O L S A N I T A T I O N
Flush to Sewer Flush to Septic Ventilated Pit Pit Bucket No Sanitation
# % # % # % # % # % # %
Craddock 30 28.6 17 16.2 13 12.4 32 30.5 4 3.8 9 8.6
Graaf-Reinet 34 31.8 34 31.8 9 8.4 15 14.0 5 4.7 10 9.3
Grahamstown 39 40.6 14 14.6 16 16.7 14 14.6 0 0.0 13 13.5
Source: EMIS, 2006
34

35
The epidemic in the province is expected to reach a peak by
2010, at about 16% of the population, before the number of new
infections even out (ECAC, 2004).
The Department of Health has embarked on a range of prevention,
care and treatment interventions. In Cacadu district, 4 hospitals
are accredited for dispensing anti-retroviral treatment, treating a
total of 1005 patients in January 2006. However, there is still a need
to accredit additional points and increase the number of people
on treatment. Most public clinics offer Voluntary Counselling
and Testing (VCT) and in 2006 86.4% of those attending public
clinics opted for VCT (men and women). Only 30.1% of males
who visited clinics opted for VCT. However this figure does not
tell us about the percentage of the total population who have
undergone VCT, the quality of the services, or whether patients
came back to get their results.
Access to clinics and health facilities is a challenge, as reported
elsewhere in this profile. A vacancy rate of 43% in the health
department is impacting negatively on access to as well as
standard of services.
A study of responses to HIV and AIDS in the Eastern Cape revealed
pockets of high prevalence and risk in seasonal agriculture in the
Cacadu district. Epidemiological risk profiles in the commercial
farming sector differ greatly according to the type of production,
geographic factors, and the quantity and type of employment
available. HIV was particularly identified to be a problem on
pineapple farms, citrus and deciduous fruit farms, particularly
due to the seasonal and migratory nature of the industry. The
responses of the industry are limited, and few NGOs work in the
area. Staff from DoH public health clinics do on occasion address
farm workers on request and they have also undertaken VCT on
farms when requested to do so. It appears that this service is
available mainly on request, rather than as an active outreach
service (ECAC, 2005). Access to medical services for farm workers
H I V & A I D S
The Cacadu District Municipality had an antenatal prevalence rate 1of 19.0% in 2005, up from 16.8% in 2002, which is significantly
below the provincial average for the Eastern Cape (28.03% in
2004). Cacadu has the lowest antenatal prevalence of all Eastern
Cape districts. However this figure is likely to hide pockets of
vulnerability in urban informal and formal settlements, and
among high risk populations such as seasonal farm labour.
E S T I M A T E S O F H I V P R E V A L E N C E I N T H E E A S T E R N C A P E B A S E D O N A N T E N A T A L S U R V E Y S
Antenatal 2002 Antenatal 2004 Antenatal 2004
% % %
Alfred Nzo DM 28.3 30.1 27.6
Amathole DM 21.7 27.1 27.3
Cacadu DM 16.8 20.2 19.0
Chris Hani DM 25.3 27.3 30.2
N Mandela Bay MM 32.6 31.2 34.5
OR Tambo DM 23.6 29.2 33.8
Ukhahlamba DM 19.0 24.9 22.4
Total 23.6 27.1 28.0
Source: DoH Antenatal Survey, 2004
It is estimated that 10% of the total population of the Eastern
Cape is HIV positive, and 19.2% of adults (20-64 years) (ASSA 2003
Model). For the province as a whole, women have higher HIV
prevalence than men, the African population is at higher risk, and
the epidemic is growing fastest among youth (15-25 years). It is
particularly young women that become infected. Prevalence for
males exceeds that of women only in the 30-34 age group (ECAC,
2005). Early sexual debut, age difference between partners and
transactional relationships is reported to play a role in driving the
epidemic (ECAC, 2005). Hence, prevention programs should be
targeted towards young people.
1 Antenatal prevalence refers to the percentage of pregnant women attending public clinics who test positive for HIV. Data is only available per district, and it is difficult to extrapolate this data for the entire population.
36
industry, expected to contribute significantly to growth in the
next few years, and a receiver of massive state investment, does
not have any coordinated initiatives to response to the impact of
the pandemic. The South African Business Coalition on HIV and
AIDS (SABCOHA) is opening its provincial office in Port Elizabeth
and can play a major role in supporting the private sector to
respond to HIV and AIDS.
NGOs and other community organisations contribute
tremendously to the response to HIV and AIDS. However funding
of these organisations is a challenge, and often the lack of funding
leads organisations to move from one area to the other, without
acquiring the necessary depth and focus of their work. There is a
need for the HIV and AIDS plan in the IDP to integrate the entire
multisectoral response to HIV and AIDS, and not only focus on
public sector service and primary health care delivery.
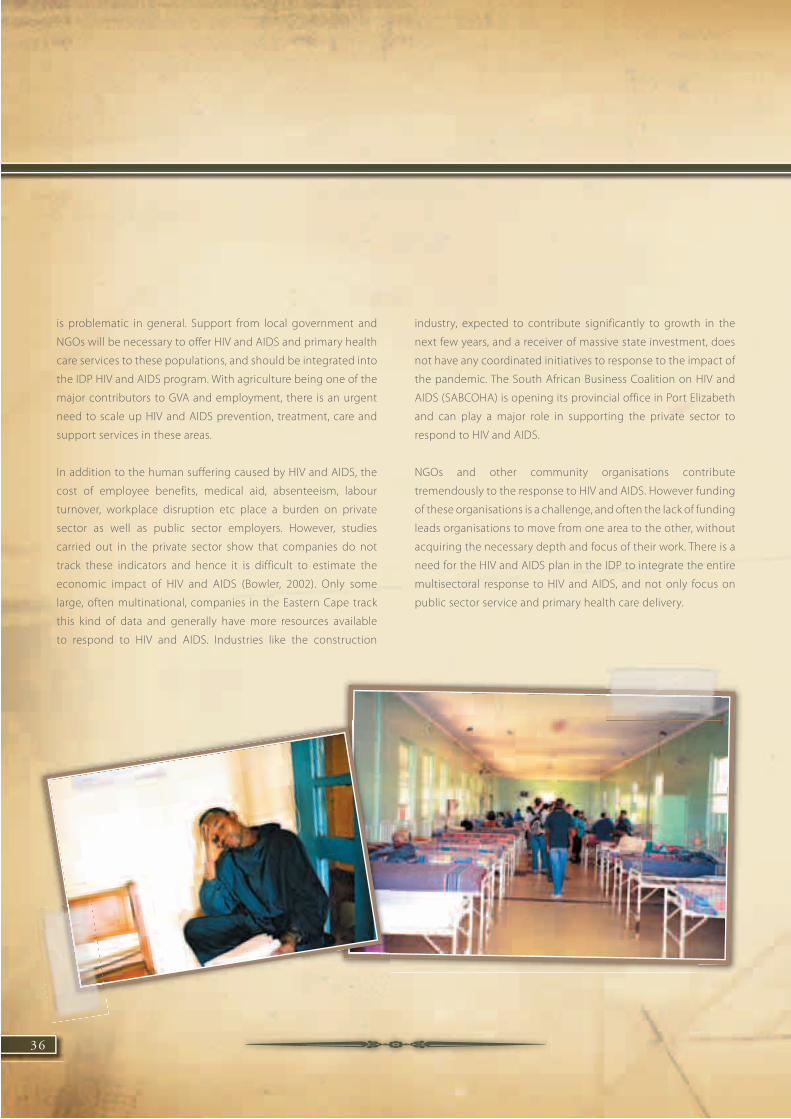
is problematic in general. Support from local government and
NGOs will be necessary to offer HIV and AIDS and primary health
care services to these populations, and should be integrated into
the IDP HIV and AIDS program. With agriculture being one of the
major contributors to GVA and employment, there is an urgent
need to scale up HIV and AIDS prevention, treatment, care and
support services in these areas.
In addition to the human suffering caused by HIV and AIDS, the
cost of employee benefits, medical aid, absenteeism, labour
turnover, workplace disruption etc place a burden on private
sector as well as public sector employers. However, studies
carried out in the private sector show that companies do not
track these indicators and hence it is difficult to estimate the
economic impact of HIV and AIDS (Bowler, 2002). Only some
large, often multinational, companies in the Eastern Cape track
this kind of data and generally have more resources available
to respond to HIV and AIDS. Industries like the construction

37
SUPPORT BY DEPARTMENT OF PROVINCIAL AND
LOC AL GOVERNMENT (DPLG) AND GTZ
The DPLG & the GTZ have a national program known as
‘Strengthening Local Government Programme’ (SLGP). Within the
SLGP is a newly introduced stream that focuses on ensuring that
Intergovernmental Relations (IGR) serve to strengthen planning
alignment within the IDP process. The overall purpose of the
program is to ensure that “Municipal development is supported
within and across all spheres and sectors of government, whilst
reflecting balanced stakeholder inclusivity”. Cacadu is one of the
pilots to benefit through this programme.
This programme is led by GTZ and entails identifying and
conceptualizing “…appropriate modalities that would catalyze
the effective ownership of integrated development by all spheres
of government. This is sought through the alignment of IDP with
the entire public planning system. Central to this component is
also the need to test and conceptualize implementation protocols
(regulated in the IGR Framework Act 2005) and multi-stakeholder
development agreements as managerial instruments that would
trigger a culture of integrated planning and service delivery
across spheres of government as well as between government
and civil society and the private sector.”
GTZ’s areas of delivery are:
1. Strengthening Inter-Governmental Relations;
2. Strengthening stakeholder analysis and management; and
3. Facilitating alignment with other spheres of government and
with the NSDP in particular.
D EV E LO PI N G M U N I C I PA L C A PAC I T Y A N D C O O PE R AT I O N
ALIGNMENT AND COOPER ATION
Cacadu district municipality together with its nine local
municipalities suffered a drastic financial decline due to the
establishment of the Nelson Mandela Bay Metro. However that
has come and gone. A concerted effort towards the stimulation
of economic development and employment-creation are vital.
An immediate implementation of the Economic Growth and
Development Strategy will kick-start a process of maximising
the benefits of the natural resource base (including national,
provincial and municipal protected areas/nature reserves and
privately-owned game farms) of the area for the benefit of local
communities as well as exploring tourist development and other
economic opportunities.
GAPS IN THE 2006-07 IDP � Vision is not based on five-year service delivery targets
� Development strategies not linked to provincial and national
targets
� Very poor sector department involvement and sector alignment
coordination
� Environmental/bio-diversity/conservation issues poorly managed
� Non completion of all sector plan and cross-cutting programmes
38
MUNICIPAL COOPER ATION
Integration and alignment with provincial and national spheres
of government has been continuously highlighted as a challenge
for Cacadu DM and its local municipalities. The Provincial IDP
hearings that took place early in the year are seen as a start
of a process that will improve and enhance alignment and
integration of government programmes, projects and budgets.
The following are key areas for 2007-08 IDP:
Adjustment of powers and functions� Municipal Health Services responsibility of the DMs
� DM responsible for Disaster Management
� Decision taken by MINMEC to transfer Primary Health Care to
Province, however the implementation of this decision could
take time
� Adjustment of Fire fighting from LMs to DM – LMs however
requested to continue with service whilst representations being
made to MEC: DHLG&TA
� LMs are Water Service Authorities
� DM to take full responsibility of the Municipal Planning function
in Ikwezi LM
SUPPORT TO LOC AL MUNICIPALITIES
Cacadu DM has resolved on the following KPAs to support local
municipalities:
� Review Formulation and Promulgation of by-laws
� Human Resource management
� IT Disaster Recovery Plans
� Establishment of Internal audit services
� Shared audit committees
� Training on the roll out of MFMA
� IDP Support Services and do-it-yourself (DIY) manual
� Local Economic Development (LED) manual
� LED strategy for the District Management Area
� Job Evaluation
� Programme / Project Management Unit (PMU) Support
� Detailed prognosis of local municipalities
39
Good governance � Audit Committees and Internal Audit
� Ward Committees training completed in seven local municipalities
� Steering Committees training in 2 LMs (and the DMA)
� Train the Trainer programme
� Good Governance Survey
District-wide forums to engage with local municipalities� District Mayors Forum
� Municipal Managers Forum
� CFO Forum
� IDP Forum
� LED Forum
� District Wide Infrastructure Forum
� Tourism Forum
� District Health Forum
� District Aids Council
� Disaster Management Forum
� Communicators Forum

40
AG R E E M E N T W I T H T H E N M B M M
The two Municipalities committed themselves to:
� The establishment of an inter municipality forum with the
purpose of exchanging experiences and knowledge on the
different aspects of local government administration; to co-
operate on economic development and tourism in order to
encourage co-operation between the business communities,
especially medium and small-size business, of both local
government entities; the promotion and support of mutually
beneficial infrastructural development; and any other strategic
matters which affect the respective municipalities.
� The two municipalities further agree that they will seek to arrange
for their mutual benefit in whatever international relations each
may have or intends to establish with foreign local government
institutions or otherwise.
� In giving effect to the spirit and purpose of this agreement, the
municipalities shall seek to develop joint strategies on matters
of local economic development, tourism and infrastructure
development by means of sharing ideas and experiences and
exposing each to the other’s resources and infrastructure.
Critical to the growth and development fortunes of the Cacadu
District is the development of linkages with strategic partners
in the region. The CDM has begun to forge such linkages with
two formal agreements already entered into with the NMBMM
and the Winelands District Municipality. The content of these
agreement s are briefly outlined below.
AG R E E M E N T W I T H T H E C A PE W I N E L A N D S D M
In the agreement the two District Municipalities committed
themselves to:
� the exchange experience and knowledge on various aspects
of local government transformation, management (including
performance management) and administration,
� the development of co-operation on the levels of economic
development and tourism in terms of developing joint local
economic and tourism development strategies, sharing resources
and infrastructure where possible and to develop small and
medium sized business linkages between the two districts
� The two municipalities endeavour to ensure mutual benefit in
whatever international relations and linkages are forged
� Agree to co-ordinate the agreement through a Joint Co-
ordinating Committee (JCM) which will meet bi annually and
be made up of Executive Mayors, Mayoral Committee members,
Municipal Managers and any other relevant representatives. The
JCM will mandate the municipal managers to establish a joint
implementation committees (JIC)
R E G I O N A L L I N K AG E S
� Co-ordination of the activities and agreements emanating from
the implementation of this agreement shall be effected by means
of a Joint Co-ordination Committee (JCC) which shall meet twice
a year with delegations from each municipality respectively,
comprising the Executive Mayors(as co-ordinators), Mayoral
Committee members and the Municipal Managers who may be
accompanied by a mutually agreed number of officials of both
the municipalities.
What now remains is the implementation of these agreements in
terms of specific projects and initiatives between the partners.
41

42
PE R S O N S L I V I N G I N P OV E RT Y
The number of people in poverty is an indicator of household
members who reside in households whose total income falls
below a particular level. The level used here is based on Global
Insight data which use the Bureau for Market Research (BMR)
Minimum Living Level (MLL) which ranges from R893 for a single
person household to R3314 for an eight person household. Based
on this measure the levels of poverty (an economic measure of
household income) in Cacadu have actually increased signifi cantly
between 1996 – 2005. Yet the proportion of people in poverty
across the district is lower than the provincial average with only
Ndlambe recording the same value as the provincial average.
P E R C E N T A G E O F P E O P L E I N P O V E R T Y
1996 2005
% %
Eastern Cape 54.3 64.7
Cacadu 38.2 47.8
Baviaans 34.9 42.2
Blue Crane Route 43.9 58.7
Camdeboo 30.6 34.9
Ikwezi 46.3 60.0
Kouga 26.6 32.9
Kou-Kamma 27.9 32.5
Makana 40.0 51.5
Ndlambe 51.5 64.4
Sunday’s River Valley 46.1 58.1
Source: Global Insight, 2006
H U M A N D EV E LO P M E N T I N D E X H D I
The HDI is a measure of development which includes life
expectancy, literacy and income. It thus provides a composite
index of development presenting these three dimensions in
one indicator. Overall the HDI is on average higher for the local
municipal areas of Cacadu than the provincial averages. The only
exceptions are Ndlambe and Sunday’s River Valley.
H U M A N D E V E L O P M E N T I N D E X F O R C A C A D U D M A N D L M S
1996 2005
Eastern Cape 0.49 0.53
Cacadu 0.53 0.57
Baviaans 0.51 0.55
Blue Crane Route 0.51 0.55
Camdeboo 0.53 0.57
Ikwezi 0.51 0.55
Kouga 0.57 0.62
Kou-Kamma 0.49 0.54
Makana 0.56 0.60
Ndlambe 0.48 0.52
Sunday’s River Valley 0.47 0.51
Source: Global Insight, 2006
P OV E RT Y P RO F I L E

S O C I A L G R A N T D E PE N D E N C Y
Households where at least one member accesses a social grant
in Cacadu is on a par with the provincial average of 64% in
Camdeboo and higher than this in Ikwezi (75%), Sunday’s River
(76%) and Baviaans (78%). The remaining areas are lower than the
provincial norm (between 47% in Kouga and 58% in Ndlambe).
Whether Household member is receiving
Social Grant
Proportion of Household Members who receive a Social
Grant
Yes No
% % %
Eastern Cape 64.4 35.6 20.7
Cacadu 55.5 44.5 23.4
Baviaans 77.9 22.1 31.2
Blue Crane Route 56.2 43.8 24.6
Camdeboo 64.3 35.7 28.1
EC DMA 10 53.8 46.2 24.6
Ikwezi 74.8 25.2 36.1
Kouga 46.8 53.2 16.2
Kou-Kamma 52.5 47.5 19.5
Makana 51.0 49.0 23.3
Ndlambe 58.4 41.6 22.9
Sunday’s River Valley 75.5 24.5 34.6
Source: RSS, 2006
43

44
What then could be possible components of an accelerated
future growth path that is equitable and jobs creating?
� Land redistribution must be accelerated in the District. DLA must
complete an area-based redistribution plan as soon as possible,
which promotes viable and intensive smallholder schemes where
possible.
� Specifically, the DM and DWAF should give higher priority to
smallholder schemes made possible by the augmentation of the
!Gariep-Fish River water transfer infrastructure.
� Investment promotion efforts need to be intensified (possibly
in association with CDC and other development partners)
particularly around mining (uranium, cement and ceramics) and
agro-processing.
� Strengthened local responses for tourism property developments
and other enterprise opportunities
� Skilled inward migration led by lifestyles/entrepreneurial
opportunities
� Shack eradication in line with national targets, combined with
municipal/provincial services improvements.
The Cacadu district faces a unique set of growth and development
challenges shaped by its geo physical features and history. It is
characterized largely by urban (asset poor) communities residing
in generally small towns surrounded by private farmlands. The
district is often characterized as better off than those to the west
of the Fish River. The levels of infrastructure backlogs are indeed
generally lower than the infrastructure poor areas to the west
of the province due to infrastructure investments historically
secured through being linked to NMB. While significant numbers
of local residents are infrastructure poor however, the most
severe expression of poverty in Cacadu is associated with the
limited access to and opportunities for livelihoods and jobs.
Some of the key features of the context for growth and
development in Cacadu include the following:
� A large and robust agricultural sector that is growing but not
creating jobs
� A public sector that is probably reaching the limits of its direct
job creation capacity
� A growing construction industry (& private services sectors)
linked to tourism and coastal lifestyles and public infrastructure
investment.
� The absence of major public/private investments and projects
� The benefits of existing growth accruing to existing fixed asset-
holders (farmers and tourism establishments), and income
distribution remaining highly unequal.
� A growing underclass of unskilled shackdwellers.
� No clear growth “trajectory”, despite an abundance of natural
resources and locational advantages
C O N C LU S I O N S

45
This GDS summit is a starting point for setting out a minimum
agenda for growth and development in the District. The Summit
is potentially very important for setting in motion processes
to improve municipal planning and management capacities,
particularly with respect to co-operation with other arms of
Government, and with Business. The private sector, business-
support agencies and the municipalities need to work together
to develop detailed priority sector action plans.
The outcome of the Summit should be the development of a
“Framework Agreement” that outlines institutional roles and
responsibilities to accelerate growth and development in the
District. This Agreement should also suggest the mechanisms and
processes for monitoring progress in the decisions reached and
the governance framework for ongoing dialogue and feedback
among the social partners.
The district GDS presents a unique opportunity for constructing
partnerships and harnessing the collective energies and
contributions of a range of actors and role players with a view to
enhancing accelerated and shared growth.

46
HH Household
HR Human Resources
IDP Integrated Development Plan
IGR Inter Governmental Relations
JCM Joint Co-ordinating Committee
JIC Joint Implementation Committee
KPA’s Key Performance Areas
LED Local Economic Development
LM Local Municipality
MEC Member of the Executive Committee
MFMA Municipal Finance Management Act
MIG Municipal Infrastructure Grant
MLL Minimum Living Level
NMBMM Nelson Mandela Bay Metropolitan Municipality
NSDP National Spatial Development Perspective
PAC Performing Arts Council
PGDP Provincial Growth and Development Plan
PHC Primary Health Care
PMU Project Management Unit
PPP Public-Private partnership
RIDS Regional Industrial Development Strategy
RSS Rapid Services Survey (2006)
SABC South African Broadcasting Corporation
SLDP Strengthening Local Government Programme
SMME Small, medium and micro enterprises
SOE State-owned enterprises
SSA Statistics South Africa
VCT Voluntary counselling and testing
AsgiSA Accelerated and Shared Growth Initiative
ASSA Actuarial Society of South Africa
ARC Agricultural Research Council
BEP Backlog Eradication Programme
BMR Bureau for Market Research
CDC Coega Development Corporation
CDM Cacadu District Municipality
DHLGTA Department of Housing Local Government &
Traditional Affairs
DHP District Health Plan
DIY Do It Yourself
DM District Municipality
DMA District Management Area
DOH Department of Health
DPLG Department of Provincial and Local Government
DPW Department of Public Works
DWAF Department of Water and Forestry
ECAC Eastern Cape Aids Council
ECD Early childhood development
ECSECC Eastern Cape Socio-economic Council
EGDS Economic Growth and Development Strategy
EIA Environmental Impact Assessment
EPWP Expanded Public Works Programme
FET Further Education and Training
GDS Growth and Development Summit
GGP Gross Geographic Product
GVA Gross Value Added
HDI Human Development Index
AC RO N Y M S

G D S S U M M I TAG R E E M E N T
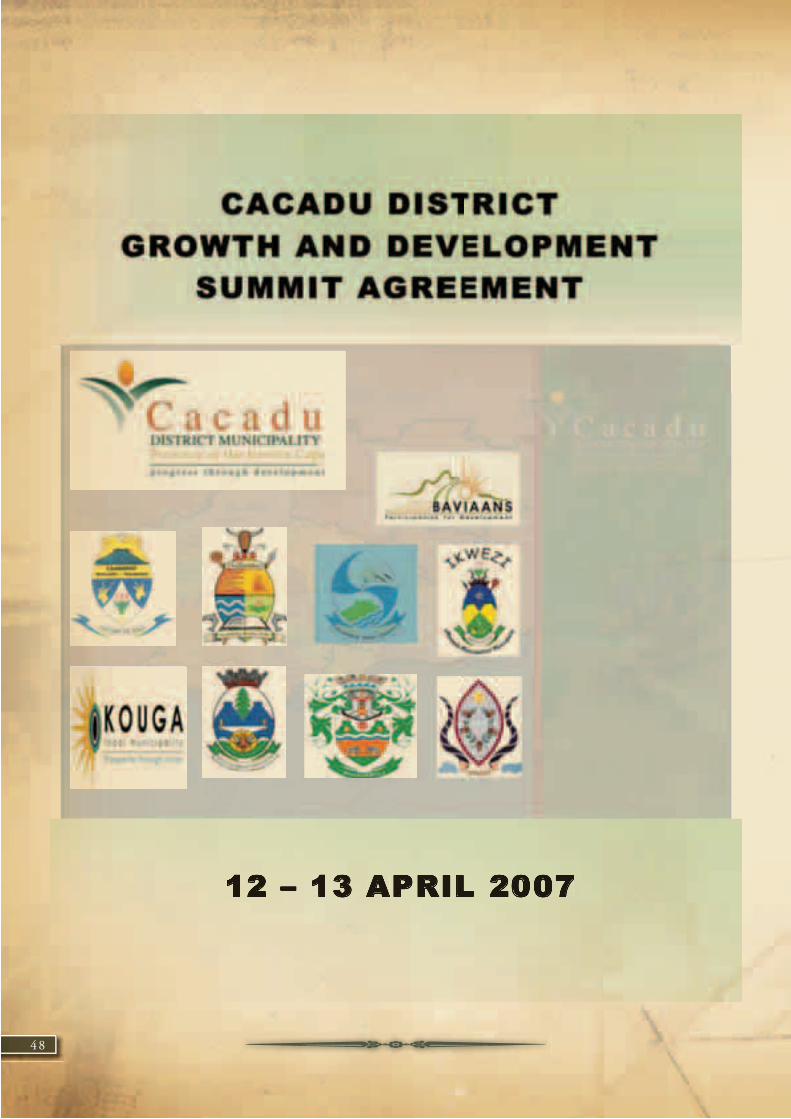
48

49

50
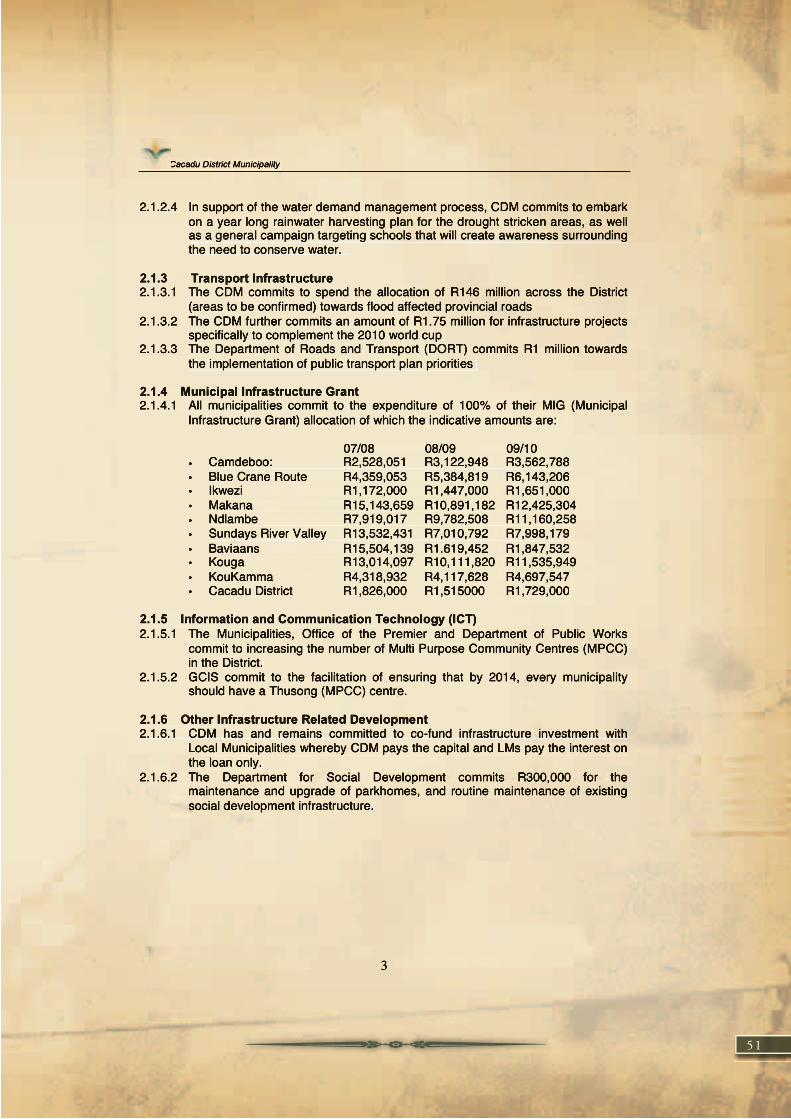
51
52

53

54

55

56
57

58
59

60

61

62
63

64


66
N OT E S


2boyz[J5863-AEastern Cape Socio-Economic Consultative Council
1st Floor, Global Life Bldng, Cnr Phalo Ave & Circular Drive, Bhisho
Tel.: +27 (0)40 635 1590 | Fax: +27 (0)40 635 1571
E-Mail: [email protected] | Internet: www.ecsecc.org