Capital Punishment 2002
17
By Thomas P. Bonczar and Tracy L. Snell BJS Statisticians Thirteen States executed 71 prisoners during 2002. The number executed was 5 greater than in 2001. Those executed during 2002 had been under sentence of death an average of 10 years and 7 months, 15 months less than that for inmates executed in 2001. At yearend 2002, 3,557 prisoners were under sentence of death. California held the largest number on death row (614), followed by Texas (450), Florida (366), and Pennsylvania (241). Twenty-four people were under a Federal death sentence. During 2002, 27 States and the Federal prison system received 159 prisoners under sentence of death. Texas (37 admissions), California (14), Alabama (11), Florida (10), and Pennsylvania (9) accounted for more than half of those sentenced in 2002. During 2002, 69 men and 2 women were executed: 53 whites and 18 blacks. The executed inmates included 6 Hispanics (all white). Seventy were carried out by lethal injection; one by electrocution. From January 1, 1977, to December 31, 2002, 820 inmates were executed by 32 States and the Federal Bureau of Prisons. Two-thirds of the executions occurred in 5 States: Texas (289), Virginia (87), Missouri (59), Oklahoma (55), and Florida (54). U.S. Department of Justice Office of Justice Programs Bureau of Justice Statistics Bulletin Capital Punishment, 2002 November 2003, NCJ 201848 • At yearend 2002, 37 States and the Federal prison system held 3,557 prisoners under sentence of death, 20 fewer than at yearend 2001. • The 159 inmates received under sentence of death represent the small- est number of admissions since 1973. Persons under sentence of death 199 2 200 2 White 1,532 1,931 Black 1,044 1,554 American Indian 25 27 Asian 15 33 Unknown race 2 12 • The 364 Hispanic inmates under sentence of death accounted for 12% of inmates with a known ethnicity. • At yearend the youngest death-row inmate was 18; the oldest was 87. • Fifty-one women were under sentence of death in 2002, up from 36 in 1992. • After declining for two years, the number of executions increased to 71 during 2002. • Of the 6,912 people under sentence of death between 1977 and 2002, 12% were executed, 4% died by causes other than execution, and 33% received other dispositions. • The number of States authorizing lethal injection increased from 22 in 1992 to 37 in 2002. In 2002, 99% of executions were by lethal injection, compared to two-thirds in 1992. • Since 1977, 654 of the 820 execu- tions (80%) were by lethal injection. *For 2003 data on executions, see page 11. Highlights 3,557 Total 71 Total 600 25 other jurisdictions Wisconsin 86 Louisiana 1 California West Virginia 95 Tennessee 1 Louisiana Vermont 112 Oklahoma 2 North Carolina Rhode Island 112 Georgia 2 Mississippi North Dakota 120 Arizona 2 Alabama Minnesota 159 Illinois 3 South Carolina Michigan 191 Alabama 3 Florida Massachusetts 205 Ohio 3 Ohio Maine 206 North Carolina 4 Virginia Iowa 241 Pennsylvania 4 Georgia Hawaii 366 Florida 6 Missouri District of Columbia 450 Texas 7 Oklahoma Alaska 614 California 33 Texas Jurisdictions without a death penalty Number of prisoners under sentence of death Executions during 2002* Status of death penalty, December 31, 2002
Transcript of Capital Punishment 2002
By Thomas P. Bonczar and Tracy L. Snell
BJS Statisticians
Thirteen States executed 71 prisonersduring 2002. The number executedwas 5 greater than in 2001. Thoseexecuted during 2002 had been undersentence of death an average of 10years and 7 months, 15 months lessthan that for inmates executed in 2001.
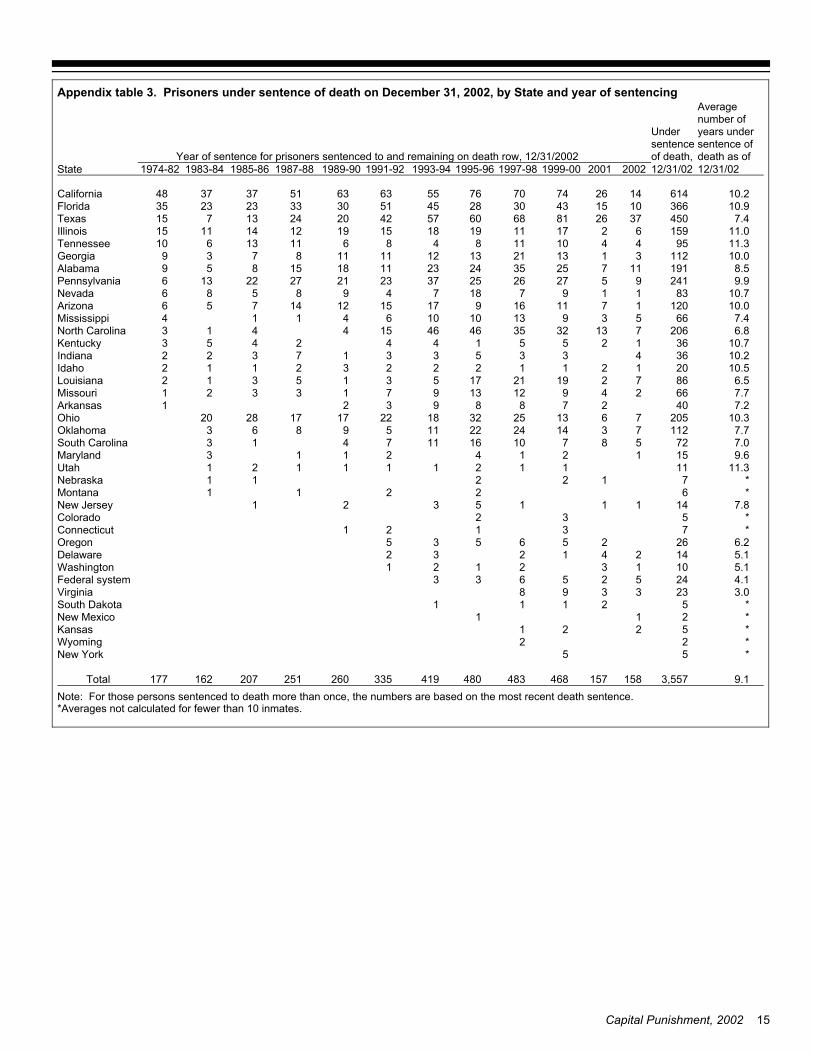
At yearend 2002, 3,557 prisoners wereunder sentence of death. Californiaheld the largest number on death row(614), followed by Texas (450), Florida(366), and Pennsylvania (241).Twenty-four people were under aFederal death sentence.
During 2002, 27 States and theFederal prison system received 159prisoners under sentence of death.Texas (37 admissions), California (14),Alabama (11), Florida (10), andPennsylvania (9) accounted for morethan half of those sentenced in 2002.
During 2002, 69 men and 2 womenwere executed: 53 whites and 18blacks. The executed inmates included6 Hispanics (all white). Seventy werecarried out by lethal injection; one byelectrocution.
From January 1, 1977, to December31, 2002, 820 inmates were executedby 32 States and the Federal Bureau ofPrisons. Two-thirds of the executionsoccurred in 5 States: Texas (289),Virginia (87), Missouri (59), Oklahoma(55), and Florida (54).
U.S. Department of JusticeOffice of Justice Programs
Bureau of Justice StatisticsBulletin
Capital Punishment, 2002 November 2003, NCJ 201848
• At yearend 2002, 37 States and theFederal prison system held 3,557prisoners under sentence of death, 20 fewer than at yearend 2001.
• The 159 inmates received undersentence of death represent the small-est number of admissions since 1973. Persons under sentence of death
1992 2002
White 1,532 1,931Black 1,044 1,554American Indian 25 27Asian 15 33Unknown race 2 12
• The 364 Hispanic inmates undersentence of death accounted for 12%of inmates with a known ethnicity.
• At yearend the youngest death-rowinmate was 18; the oldest was 87.
• Fifty-one women were undersentence of death in 2002, up from 36 in 1992. • After declining for two years, thenumber of executions increased to 71 during 2002.
• Of the 6,912 people under sentenceof death between 1977 and 2002, 12% were executed, 4% died bycauses other than execution, and 33% received other dispositions.• The number of States authorizinglethal injection increased from 22 in1992 to 37 in 2002. In 2002, 99% ofexecutions were by lethal injection,compared to two-thirds in 1992.
• Since 1977, 654 of the 820 execu-tions (80%) were by lethal injection.
*For 2003 data on executions, see page 11.
Highlights
3,557Total71Total
60025 other jurisdictions
Wisconsin86Louisiana1CaliforniaWest Virginia95Tennessee1LouisianaVermont112Oklahoma2North CarolinaRhode Island112Georgia2MississippiNorth Dakota120Arizona2AlabamaMinnesota159Illinois3South CarolinaMichigan191Alabama3FloridaMassachusetts205Ohio3OhioMaine206North Carolina4VirginiaIowa241Pennsylvania4GeorgiaHawaii366Florida6MissouriDistrict of Columbia450Texas7OklahomaAlaska614California33Texas
Jurisdictions withouta death penalty
Number of prisoners under sentence of deathExecutions during 2002*
Status of death penalty, December 31, 2002
Bureau of Justice Statistics
This report is one in a series. More recent editions may be available. To view a list of all in the series go to http://www.ojp.usdoj.gov/bjs/pubalp2.htm#cp
Capital punishment laws
At yearend 2002 the death penalty wasauthorized by 38 States and theFederal Government (table 1 andappendix table 1). No State enactednew legislation authorizing capitalpunishment in 2002.
The United States Supreme Courtstruck a portion of the Arizona capitalpunishment statutes on June 24, 2002(Ring v. Arizona, 122 S. Ct. 2428(2002)). The Court found that allowinga judge, rather than a jury, to decidethe presence of aggravating factorsviolates a defendant’s Sixth Amend-ment right to a trial by a jury.
Statutory changes
During 2002, 11 States revised statu-tory provisions relating to the deathpenalty. By State, the changes were asfollows:
Alabama — Authorized lethal injectionas a method of execution, effective7/1/2002. An inmate may elect inwriting to be executed by electrocutionwithin 30 days of the date of sentence.The statute also mandates that a deathsentence will not be reduced if themethod of execution is found to beunconstitutional (Ala. Code §15-18-82).
Arizona Revised the capital statuteto allow a jury to sentence a defendantto death by a unanimous decisionwhen finding of at least one aggravat-ing circumstance (A.R.S. 13-703.01),effective 8/1/2002.
Colorado — Revised its code of crimi-nal procedure to allow determination ofa death sentence by unanimous jurydecisions rather than by 3-judge panels(C.R.S. 18-1.3-1201), effective7/12/2002.
Delaware — Amended its code ofcriminal procedure to allow juries todecide the existence of aggravatingcircumstances. If a jury is unable tounanimously find the presence of anaggravating factor, a judge cannotoverride that verdict and the defendantmay not be sentenced to death (Del.Code 11 § 4209(c)(3), (d)(1)).
2 Capital Punishment, 2002
Alabama. Intentional murder with 18 aggravating factors (Ala. Stat. Ann.13A-5-40(a)(1)-(18)).
Arizona*. First-degree murder accompaniedby at least 1 of 10 aggravating factors (A.R.S13-703(F)).
Arkansas*. Capital murder (Ark. Code Ann.5-10-101) with a finding of at least 1 of 10aggravating circumstances; treason.
California. First-degree murder with specialcircumstances; train wrecking; treason; perjurycausing execution.
Colorado*. First-degree murder with at least1 of 15 aggravating factors; treason.
Connecticut*. Capital felony with 8 forms ofaggravated homicide (C.G.S. 53a-54b).
Delaware*. First-degree murder with aggravating circumstances.
Florida*. First-degree murder; felony murder;capital drug trafficking; capital sexual battery.
Georgia*. Murder; kidnaping with bodily injuryor ransom when the victim dies; aircraft hijacking; treason.
Idaho. First-degree murder with aggravatingfactors; aggravated kidnaping.
Illinois. First-degree murder with 1 of 15aggravating circumstances.
Indiana*. Murder with 16 aggravating circum-stances (IC 35-50-2-9).
Kansas*. Capital murder with 8 aggravatingcircumstances (KSA 21-3439).
Kentucky*. Murder with aggravating factors;kidnaping with aggravating factors (KRS532.025).
Louisiana. First-degree murder; aggravatedrape of victim under age 12; treason (La. R.S.14:30, 14:42, and 14:113).
Maryland*. First-degree murder, eitherpremeditated or during the commission of afelony, provided that certain death eligibilityrequirements are satisfied.
Mississippi. Capital murder (97-3-19(2)MCA); aircraft piracy (97-25-55(1) MCA).
Missouri*. First-degree murder (565.020RSMO 1994).
Montana. Capital murder with 1 of 9 aggravating circumstances (46-18-303 MCA);capital sexual assault (45-5-503 MCA).
Nebraska*. First-degree murder with a findingof at least 1 statutorily-defined aggravatingcircumstance.
Nevada. First-degree murder with at least 1 of14 aggravating circumstances (NRS 200.030,200.033, 200.035).
New Hampshire. Six categories of capitalmurder (RSA 630:1, RSA 630:5).
New Jersey. Knowing/purposeful murder byone's own conduct; contract murder; solicita-tion by command or threat in furtherance of anarcotics conspiracy (NJSA 2C:11-3C).
New Mexico*. First-degree murder with atleast 1 of 7 statutorily-defined aggravatingcircumstances (Section 30-2-1 A, NMSA).
New York*. First-degree murder with 1 of 12aggravating factors(NY Penal Law §125.27).
North Carolina*. First-degree murder (NCGS§14-17).
Ohio. Aggravated murder with at least 1 of 9aggravating circumstances (O.R.C. secs.2903.01, 2929.02, and 2929.04).
Oklahoma. First-degree murder in conjunc-tion with a finding of at least 1 of 8 statutorilydefined aggravating circumstances.
Oregon. Aggravated murder (ORS 163.095).
Pennsylvania. First-degree murder with 18aggravating circumstances.
South Carolina*. Murder with 1 of 10 aggra-vating circumstances (§ 16-3-20(C)(a)).
South Dakota*. First-degree murder with 1 of 10 aggravating circumstances; aggravatedkidnaping.
Tennessee*. First-degree murder with 1 of 15aggravating circumstances (Tenn. Code Ann.§ 39-13-204).
Texas. Criminal homicide with 1 of 8 aggra-vating circumstances (TX Penal Code 19.03).
Utah*. Aggravated murder (76-5-202, UtahCode Annotated).
Virginia. First-degree murder with 1 of 13aggravating circumstances (VA Code § 18.2-31).
Washington*. Aggravated first-degreemurder.
Wyoming. First-degree murder.
Table 1. Capital offenses, by State, 2002
*Nineteen States excluded mentally retarded persons from capital sentencing as of December 31,2002: Arizona, Arkansas, Colorado, Connecticut, Delaware, Florida, Georgia, Indiana, Kansas,Kentucky, Maryland, Missouri, Nebraska, New Mexico, New York, North Carolina, South Dakota,Tennessee, and Washington. Mental retardation is a mitigating factor in South Carolina and Utah.
Delaware also prohibited imposition ofa death sentence on any defendantfound by the trial judge to be “seriouslymentally retarded” and setting forthprocedures for such a determination(Del. Code 11 § 4209(d)(3)). Bothchanges were effective 7/22/2002.
Indiana — Raised the minimum age ofeligibility for a death sentence from 16to 18 years of age at the time themurder was committed (IC 35-50-2-3).
Indiana also revised portions of itsstatutes to require submission of aseparate verdict form for each aggra-vating circumstance alleged by theState. Revisions were also approvedpreventing a sentencing judge fromoverriding a jury’s unanimous verdict inthe sentencing phase of a capital trialto sentence a defendant to death or lifewithout parole (IC 35-50-2-9). Thesechanges became effective 7/1/2002.
Nebraska — Changed its sentencingprocedures to allow juries to unani-mously decide the existence or nonex-istence of aggravating circumstances(Neb. § 29-2519 to 29-2522), effective11/23/2002.
New Jersey — Expanded the definitionof felony murder to include acts ofterrorism resulting in death (N.J.S.A2C:11-3c), effective 6/18/2002.
Oklahoma — Added to the definition offirst degree murder terrorist acts result-ing in death. Terrorist acts include any“act of violence resulting in damage toproperty or personal injury perpetratedto coerce a civilian population orgovernment into granting illegal politicalor economic demands” (Okla. Stat.Ann. 21 § 1268), effective 6/6/2002.
Tennessee — Added to its definition offelony murder “killing of another in theperpetration of ... acts of terrorism”(Tenn. Code Ann. § 39-13-202(a)(2))and to its list of aggravating circum-stances murder committed in thecourse of an act of terrorism (Tenn.Code Ann. § 39-13-204(i)(15)), effec-tive 7/4/2002.
Utah — Amended its statute to includeas a mitigating factor diminishedmental capacity as a result of retarda-tion (Utah Code Ann. § 76-3-207),effective 5/6/2002.
Virginia — Added as an aggravatingfactor deliberate killing of any person inthe commission of an act of terrorism(Va. Code § 18.2-31(13)), effective7/1/2002.
Automatic review Of the 38 States with capital statutes atyearend, 37 provided for review of alldeath sentences regardless of thedefendant’s wishes. In South Carolinathe defendant had the right to waivesentence review if he or she wasdeemed competent by the court (Statev. Torrence, 473 S.E. 3d 703 (S.C.1996)). Federal death penalty proce-dures did not provide for automaticreview after a sentence of death hadbeen imposed.
The State’s highest appellate courtusually conducted the review. If eitherthe conviction or sentence werevacated, the case could be remandedto the trial court for additional proceed-ings or retrial. As a result of retrial orresentencing, a death sentence couldbe reimposed.
While most of the 37 States authorizedan automatic review of both theconviction and sentence, Idaho,Indiana, Kentucky, Oklahoma, andTennessee required review of thesentence only. In Idaho review of theconviction had to be filed throughappeal or forfeited. In Indiana andKentucky a defendant could waivereview of the conviction.
In Virginia a defendant could waive anappeal of trial court error but could notwaive review of the death sentence forarbitrariness and proportionality. InMississippi the question of whether thedefendant could waive the right toautomatic review had not beenaddressed. In Wyoming neither statutenor case law precluded a waiver ofappeal.
Arkansas rule requires review ofspecific issues relating to both capitalconvictions and sentences (Ark. R.App. P. — Crim 10). Recent case lawheld waivers of this review are notpermitted (Newman v. State, No.CR02-811, 2002 Westlaw 31030906(Ark. Sept. 12, 2002)).
Capital Punishment, 2002 3
Figure 1
0
500
1,000
1,500
2,000
2,500
3,000
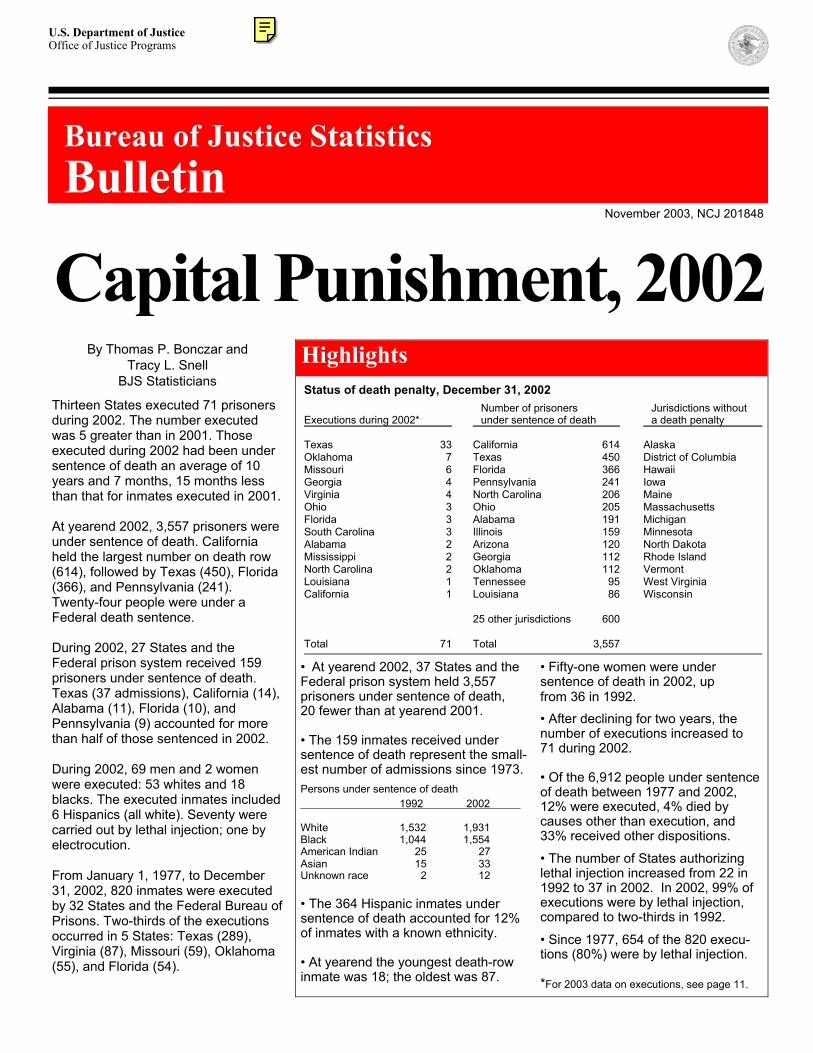
3,557
In 1972 the Supreme Courtruled unconstitutional thedeath penalty as thenadministered.
In 1976 the Courtupheld revised Statecapital punishment laws.
Persons under sentence of death, 1953-2002
1953 1960 1970 1980 1990 2002
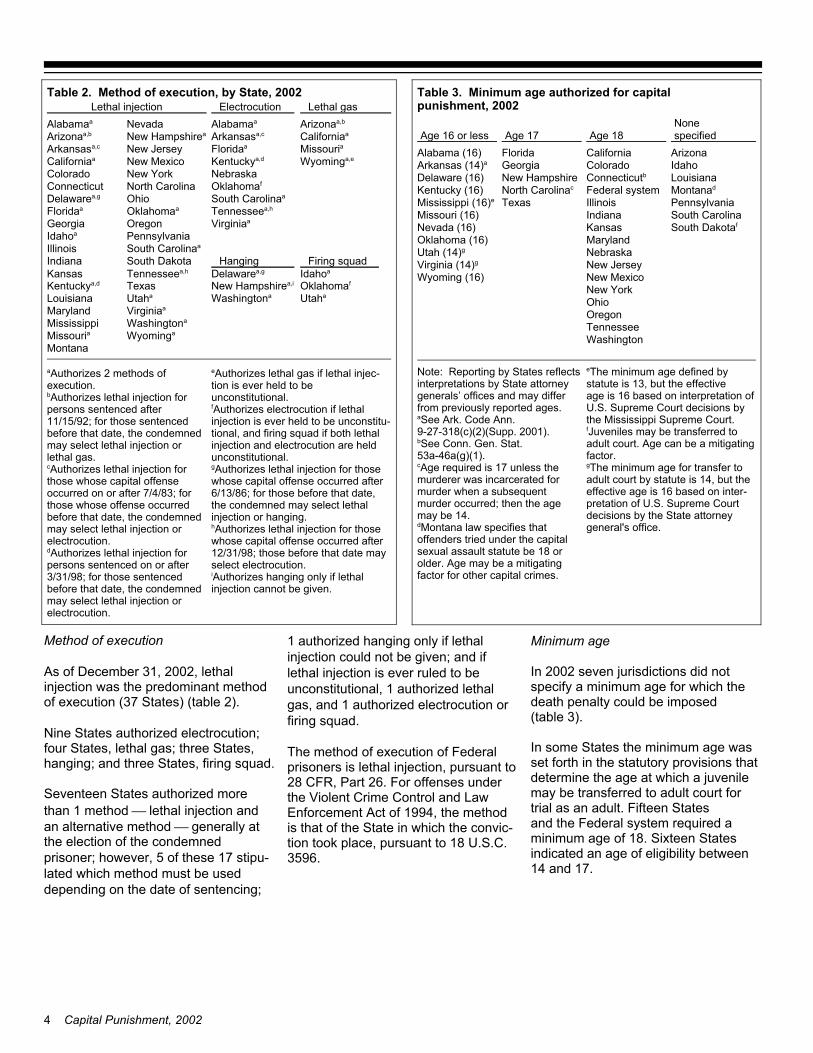
Method of execution
As of December 31, 2002, lethal injection was the predominant methodof execution (37 States) (table 2).
Nine States authorized electrocution; four States, lethal gas; three States,hanging; and three States, firing squad.
Seventeen States authorized morethan 1 method lethal injection andan alternative method generally atthe election of the condemnedprisoner; however, 5 of these 17 stipu-lated which method must be useddepending on the date of sentencing;
1 authorized hanging only if lethalinjection could not be given; and iflethal injection is ever ruled to beunconstitutional, 1 authorized lethalgas, and 1 authorized electrocution orfiring squad.
The method of execution of Federalprisoners is lethal injection, pursuant to28 CFR, Part 26. For offenses underthe Violent Crime Control and LawEnforcement Act of 1994, the methodis that of the State in which the convic-tion took place, pursuant to 18 U.S.C.3596.
Minimum age
In 2002 seven jurisdictions did notspecify a minimum age for which thedeath penalty could be imposed (table 3).
In some States the minimum age wasset forth in the statutory provisions thatdetermine the age at which a juvenilemay be transferred to adult court fortrial as an adult. Fifteen States and the Federal system required aminimum age of 18. Sixteen Statesindicated an age of eligibility between14 and 17.
4 Capital Punishment, 2002
eThe minimum age defined bystatute is 13, but the effective age is 16 based on interpretation ofU.S. Supreme Court decisions bythe Mississippi Supreme Court.fJuveniles may be transferred toadult court. Age can be a mitigatingfactor.gThe minimum age for transfer toadult court by statute is 14, but theeffective age is 16 based on inter-pretation of U.S. Supreme Courtdecisions by the State attorneygeneral's office.
Note: Reporting by States reflectsinterpretations by State attorneygenerals’ offices and may differfrom previously reported ages. aSee Ark. Code Ann.9-27-318(c)(2)(Supp. 2001).bSee Conn. Gen. Stat.53a-46a(g)(1). cAge required is 17 unless themurderer was incarcerated formurder when a subsequentmurder occurred; then the agemay be 14.dMontana law specifies thatoffenders tried under the capitalsexual assault statute be 18 orolder. Age may be a mitigatingfactor for other capital crimes.
WashingtonTennesseeOregonOhioNew YorkNew MexicoWyoming (16)New JerseyVirginia (14)gNebraskaUtah (14)gMarylandOklahoma (16)
South DakotafKansasNevada (16)South CarolinaIndianaMissouri (16)PennsylvaniaIllinoisTexas Mississippi (16)eMontanadFederal systemNorth CarolinacKentucky (16)LouisianaConnecticutbNew HampshireDelaware (16)IdahoColoradoGeorgiaArkansas (14)aArizonaCaliforniaFloridaAlabama (16)specifiedAge 18Age 17Age 16 or lessNone
Table 3. Minimum age authorized for capital punishment, 2002
eAuthorizes lethal gas if lethal injec-tion is ever held to beunconstitutional.fAuthorizes electrocution if lethalinjection is ever held to be unconstitu-tional, and firing squad if both lethalinjection and electrocution are heldunconstitutional.gAuthorizes lethal injection for thosewhose capital offense occurred after6/13/86; for those before that date,the condemned may select lethalinjection or hanging.hAuthorizes lethal injection for thosewhose capital offense occurred after12/31/98; those before that date mayselect electrocution.iAuthorizes hanging only if lethalinjection cannot be given.
aAuthorizes 2 methods ofexecution.bAuthorizes lethal injection forpersons sentenced after11/15/92; for those sentencedbefore that date, the condemnedmay select lethal injection orlethal gas.cAuthorizes lethal injection forthose whose capital offenseoccurred on or after 7/4/83; forthose whose offense occurredbefore that date, the condemnedmay select lethal injection orelectrocution.dAuthorizes lethal injection forpersons sentenced on or after3/31/98; for those sentencedbefore that date, the condemnedmay select lethal injection orelectrocution.
MontanaWyomingaMissouriaWashingtonaMississippiVirginiaaMaryland
UtahaWashingtonaUtaha LouisianaOklahomafNew Hampshirea,iTexasKentuckya,dIdahoaDelawarea,gTennesseea,hKansas
Firing squadHangingSouth DakotaIndianaSouth CarolinaaIllinoisPennsylvaniaIdahoa
VirginiaaOregonGeorgiaTennesseea,hOklahomaaFloridaaSouth CarolinaaOhioDelawarea,gOklahomafNorth CarolinaConnecticutNebraskaNew YorkColorado
Wyominga,eKentuckya,dNew MexicoCaliforniaaMissouriaFloridaaNew JerseyArkansasa,cCaliforniaaArkansasa,cNew HampshireaArizonaa,bArizonaa,bAlabamaaNevadaAlabamaa
Lethal gasElectrocutionLethal injectionTable 2. Method of execution, by State, 2002
Capital Punishment, 2002 5
bTotals include persons of races other than whiteand black.cThe reporting of race and Hispanic origin differsfrom that presented in tables 8 and 10. In thistable white and black inmates include Hispanics.dExcludes persons held under Armed Forcesjurisdiction with a military death sentence formurder.eRace has been changed from American Indianto white for 1 inmate.
and 1 each in Missouri, Maryland, Mississippi,North Carolina, California, and Idaho). Data for12/31/01 also include 1 inmate in California whowas erroneously reported as being removedfrom under sentence of death. aIncludes 21 deaths from natural causes (3 eachin Illinois and Texas; 2 each in Florida, Nevada,and North Carolina; and 1 each in Arizona,California, Colorado, Kentucky, Louisiana,Maryland, Ohio, Oklahoma, and Pennsylvania);3 deaths from suicide (1 each in Alabama,Illinois, and Pennsylvania); and 1 inmatemurdered by another inmate (in Indiana).
Note: Some figures shown for yearend 2001are revised from those reported in CapitalPunishment, 2001, NCJ 197020. The revisedfigures include 12 inmates who were eitherreported late to the National Prisoner Statis-tics program or were not in custody of Statecorrectional authorities on 12/31/01 (3 eachin Illinois and Mississippi; 2 in California; and1 each in Ohio, Florida, Oklahoma, andTennessee) and exclude 17 inmates whowere relieved of a death sentence by12/31/01 (3 in Louisiana; 2 each in Illinois,Indiana, Tennessee, and Arizona;
022000000000022 Wyoming5510000000011549 Washington28110000000002811 Utah1242600000000012426 Oregon022000022011033 New Mexico
344883000134011355086 Nevada056000000000056 Montana0202000001101102020 Idaho225000011000236 Colorado
2213696140111344914218364605 Californiae1210312000014501113106124 Arizona
2775888990113141741419276589898 West
10132313402221391726 Virginia185260450112233437122537188260453 Texas385695000044224365895 Tennessee353772123123145363773 South Carolina42641121670223374069114 Oklahoma
11880206112761452712185215 North Carolina362966022101225352964 Mississippi1051500011211210515 Maryland592686011325707552985 Louisiana8283600001101182836 Kentucky
54571120442133035362116 Georgia13323336612358143710136236373 Florida
410140001120225914 Delaware241640000000000241640 Arkansas90100191022134651185100186 Alabama
8461,0141,88416456126366447551048411,0401,905 South
055000000000055 South Dakota10597205123123617101100204 Ohio
167000000000167 Nebraska323466156022202314172 Missouri235000011202044 Kansas
112536000112134112334 Indiana1025715900024642610059159 Illinois2532274832794101415621244238485 Midwest
1508024100045954914981241 Pennsylvania145000101000246 New York68140001230117916 New Jersey000000000000000 New Hampshire347000000000347 Connecticut
160962670006713551016198270 Northeast
1,5361,9253,533185371396710871801541,5221,9653,558 State1862400000023516319 Federald
1,5541,9313,557185371396710873831591,5381,9683,577 U.S. total
Black WhiteTotalb Black WhiteTotalb Black WhiteTotalb Black White Totalb Blackc Whitec Totalband Stateof death, 12/31/02Executed(excluding executions)asentence of deathof death, 12/31/01Region under sentencedeath rowReceived underPrisoners under sentencePrisonersRemoved from
Table 4. Prisoners under sentence of death, by region, State, and race, 2001 and 2002
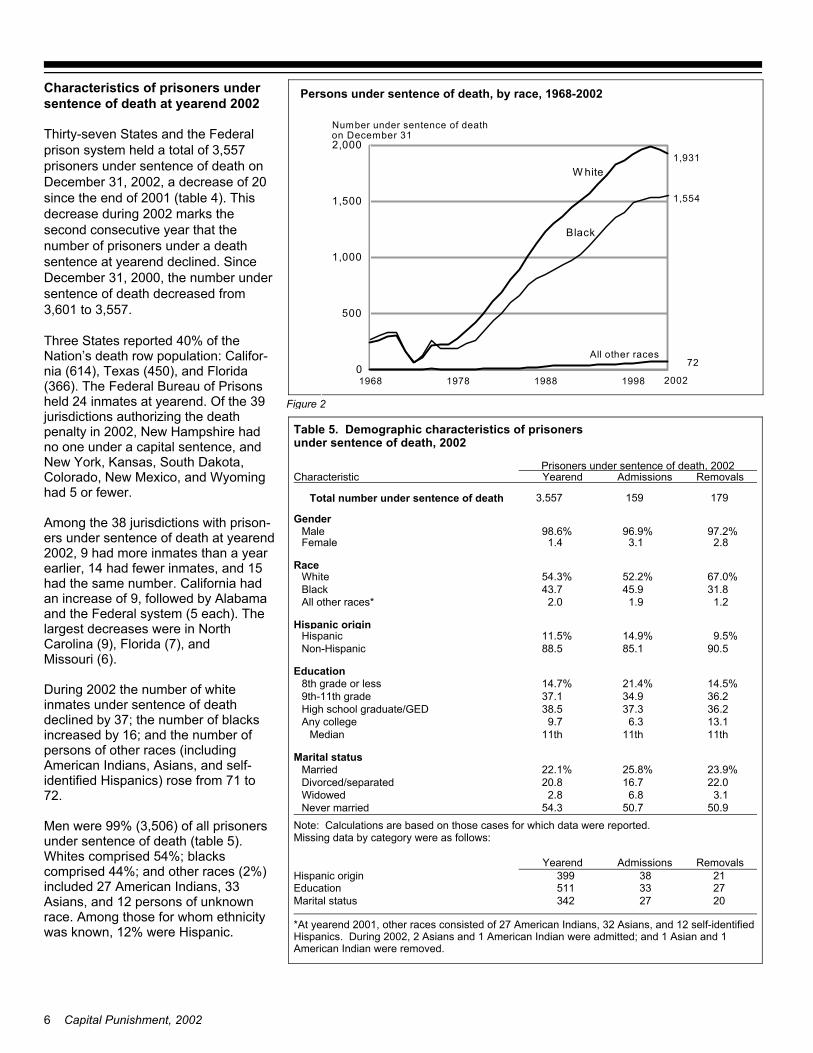
Characteristics of prisoners undersentence of death at yearend 2002
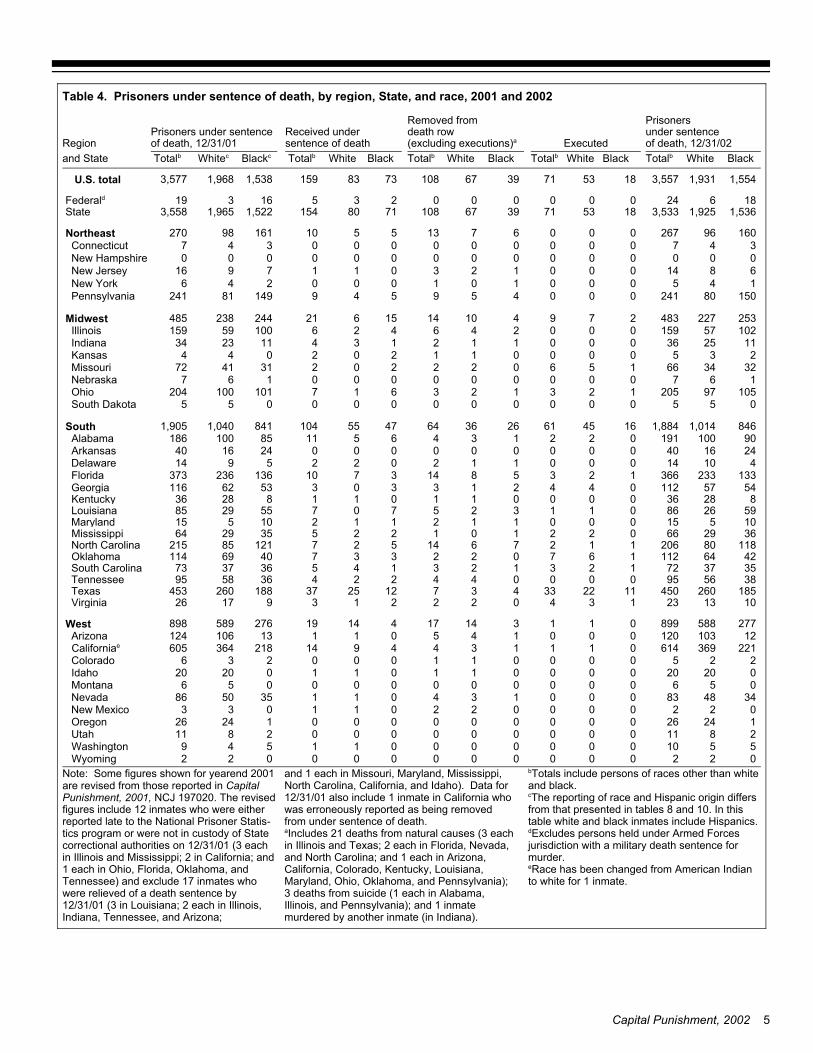
Thirty-seven States and the Federalprison system held a total of 3,557prisoners under sentence of death onDecember 31, 2002, a decrease of 20since the end of 2001 (table 4). Thisdecrease during 2002 marks thesecond consecutive year that thenumber of prisoners under a deathsentence at yearend declined. SinceDecember 31, 2000, the number undersentence of death decreased from3,601 to 3,557. Three States reported 40% of theNation’s death row population: Califor-nia (614), Texas (450), and Florida(366). The Federal Bureau of Prisonsheld 24 inmates at yearend. Of the 39jurisdictions authorizing the deathpenalty in 2002, New Hampshire hadno one under a capital sentence, andNew York, Kansas, South Dakota,Colorado, New Mexico, and Wyominghad 5 or fewer.
Among the 38 jurisdictions with prison-ers under sentence of death at yearend2002, 9 had more inmates than a yearearlier, 14 had fewer inmates, and 15had the same number. California hadan increase of 9, followed by Alabamaand the Federal system (5 each). Thelargest decreases were in NorthCarolina (9), Florida (7), and Missouri (6).
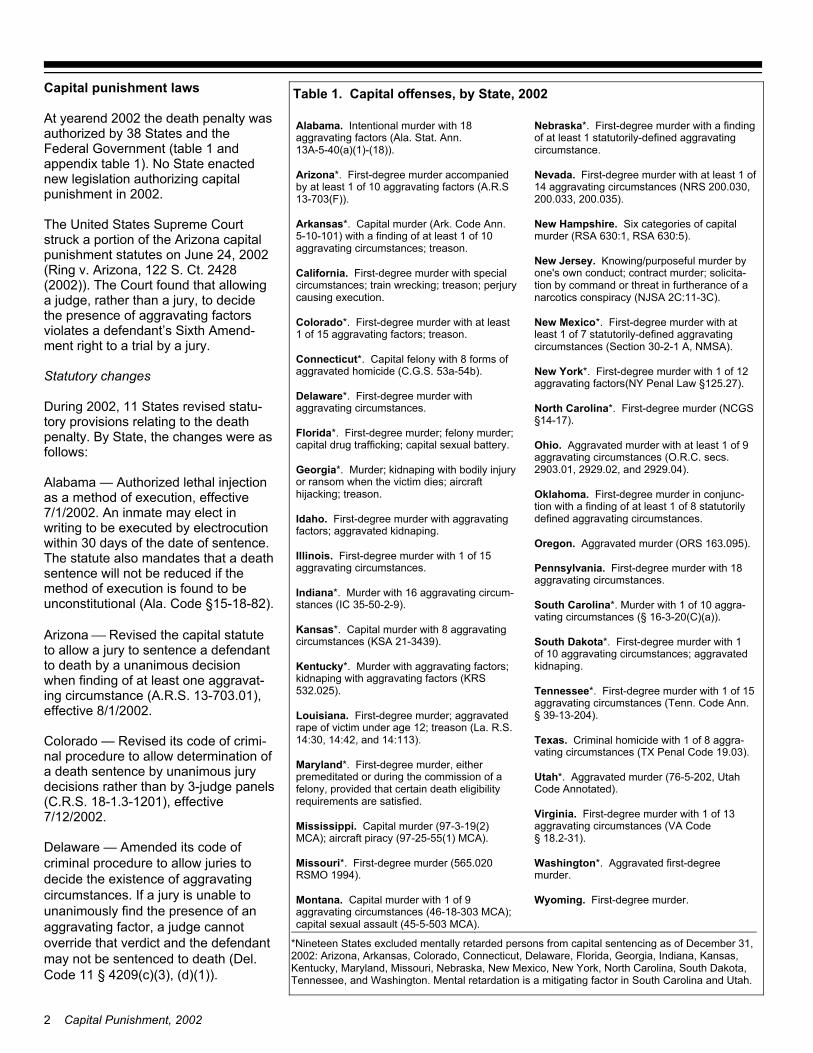
During 2002 the number of whiteinmates under sentence of deathdeclined by 37; the number of blacksincreased by 16; and the number ofpersons of other races (includingAmerican Indians, Asians, and self-identified Hispanics) rose from 71 to72.
Men were 99% (3,506) of all prisonersunder sentence of death (table 5).Whites comprised 54%; blackscomprised 44%; and other races (2%)included 27 American Indians, 33Asians, and 12 persons of unknownrace. Among those for whom ethnicitywas known, 12% were Hispanic.
6 Capital Punishment, 2002
1968 1978 1988 19980
500
1,000
1,500
2,000
Number under sentence of death
2002
W hite
Black
All other races
on December 31
1,931
1,554
72
Persons under sentence of death, by race, 1968-2002
Figure 2
*At yearend 2001, other races consisted of 27 American Indians, 32 Asians, and 12 self-identifiedHispanics. During 2002, 2 Asians and 1 American Indian were admitted; and 1 Asian and 1American Indian were removed.
2027342Marital status2733511Education2138399Hispanic origin
RemovalsAdmissionsYearend
Note: Calculations are based on those cases for which data were reported. Missing data by category were as follows:
50.950.754.3Never married3.16.82.8Widowed
22.016.720.8Divorced/separated%23.9%25.8%22.1Married
Marital status
11th11th11thMedian13.16.39.7Any college36.237.338.5High school graduate/GED36.234.937.19th-11th grade
%14.5%21.4%14.78th grade or lessEducation
90.585.188.5Non-Hispanic%9.5%14.9%11.5Hispanic
Hispanic origin
1.21.92.0All other races*31.845.943.7Black
%67.0%52.2%54.3WhiteRace
2.83.11.4Female%97.2%96.9%98.6Male
Gender
1791593,557Total number under sentence of death
RemovalsAdmissionsYearendCharacteristicPrisoners under sentence of death, 2002
Table 5. Demographic characteristics of prisoners under sentence of death, 2002
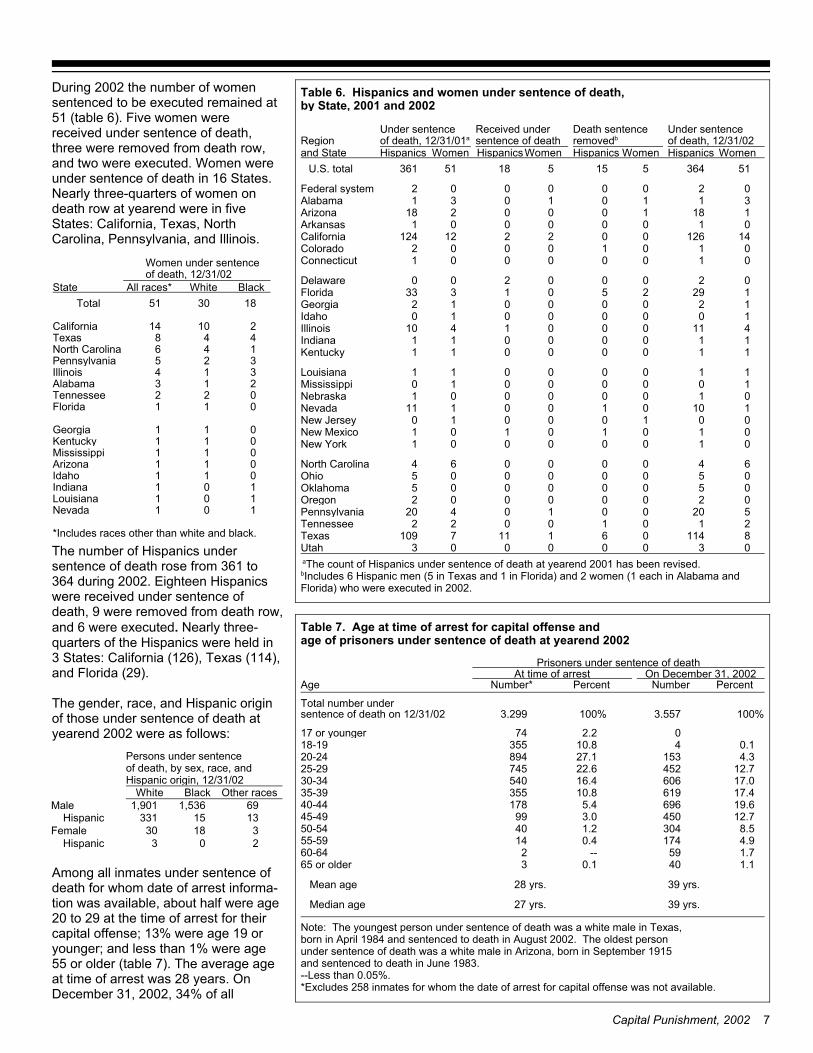
During 2002 the number of womensentenced to be executed remained at51 (table 6). Five women werereceived under sentence of death,three were removed from death row,and two were executed. Women wereunder sentence of death in 16 States.Nearly three-quarters of women ondeath row at yearend were in fiveStates: California, Texas, NorthCarolina, Pennsylvania, and Illinois.
The number of Hispanics undersentence of death rose from 361 to364 during 2002. Eighteen Hispanicswere received under sentence ofdeath, 9 were removed from death row,and 6 were executed. Nearly three-quarters of the Hispanics were held in3 States: California (126), Texas (114),and Florida (29).
The gender, race, and Hispanic originof those under sentence of death atyearend 2002 were as follows:
Among all inmates under sentence ofdeath for whom date of arrest informa-tion was available, about half were age20 to 29 at the time of arrest for theircapital offense; 13% were age 19 oryounger; and less than 1% were age55 or older (table 7). The average ageat time of arrest was 28 years. OnDecember 31, 2002, 34% of all
Capital Punishment, 2002 7
*Includes races other than white and black.
101Nevada101Louisiana101Indiana011Idaho011Arizona011Mississippi011Kentucky011Georgia
011Florida022Tennessee213Alabama314Illinois325Pennsylvania146North Carolina448Texas21014California
183051TotalBlackWhiteAll races*State
of death, 12/31/02Women under sentence
aThe count of Hispanics under sentence of death at yearend 2001 has been revised.bIncludes 6 Hispanic men (5 in Texas and 1 in Florida) and 2 women (1 each in Alabama andFlorida) who were executed in 2002.
03000003Utah8114061117109Texas21010022Tennessee5200010420Pennsylvania02000002Oregon05000005Oklahoma05000005Ohio64000064North Carolina
01000001New York01010101New Mexico00100010New Jersey1100100111Nevada01000001Nebraska10000010Mississippi11000011Louisiana
11000011Kentucky11000011Indiana4110001410Illinois10000010Idaho12000012Georgia1292501333Florida02000200Delaware
01000001Connecticut01010002Colorado
14126002212124California01000001Arkansas1181000218Arizona31101031Alabama02000002Federal system
5136451551851361U.S. totalWomenHispanicsWomenHispanicsWomenHispanicsWomenHispanicsand State
of death, 12/31/02removedbsentence of deathof death, 12/31/01aRegionUnder sentenceDeath sentenceReceived underUnder sentence
Table 6. Hispanics and women under sentence of death,by State, 2001 and 2002
203 Hispanic31830Female
1315331 Hispanic 691,5361,901Male
Other racesBlackWhite
Persons under sentence of death, by sex, race, and Hispanic origin, 12/31/02
Note: The youngest person under sentence of death was a white male in Texas, born in April 1984 and sentenced to death in August 2002. The oldest person under sentence of death was a white male in Arizona, born in September 1915 and sentenced to death in June 1983.--Less than 0.05%.*Excludes 258 inmates for whom the date of arrest for capital offense was not available.
39 yrs.27 yrs. Median age
39 yrs.28 yrs. Mean age
1.1400.1365 or older1.759--260-644.91740.41455-598.53041.24050-54
12.74503.09945-4919.66965.417840-4417.461910.835535-3917.060616.454030-3412.745222.674525-294.315327.189420-240.1410.835518-19
02.27417 or younger
%1003,557%1003,299sentence of death on 12/31/02Total number under
PercentNumberPercentNumber*AgeOn December 31, 2002At time of arrest
Prisoners under sentence of death
Table 7. Age at time of arrest for capital offense and age of prisoners under sentence of death at yearend 2002
inmates were age 30 to 39, and 66%were age 25 to 44. The youngestoffender under sentence of death was18; the oldest was 87.
Criminal history of inmates undersentence of death in 2002
Among inmates under a deathsentence on December 31, 2002, forwhom criminal history information wasavailable, 64% had prior felony convic-tions, including 8% with at least oneprevious homicide conviction (table 8).
Among those for whom legal status atthe time of the capital offense wasavailable, 40% had an active criminaljustice status. Less than half of thesewere on parole, and a quarter were onprobation. The remaining quarter hadcharges pending, were incarcerated,had escaped from incarceration, or hadsome other criminal justice status.
Criminal history patterns differed byrace and Hispanic origin. More blacks
(69%) than whites (62%) or Hispanics(58%) had a prior felony conviction.About the same percentage of whites,blacks, and Hispanics had a priorhomicide conviction (8%). A slightlyhigher percentage of Hispanics (23%)or blacks (18%) than whites (15%)were on parole when arrested for theircapital offense.
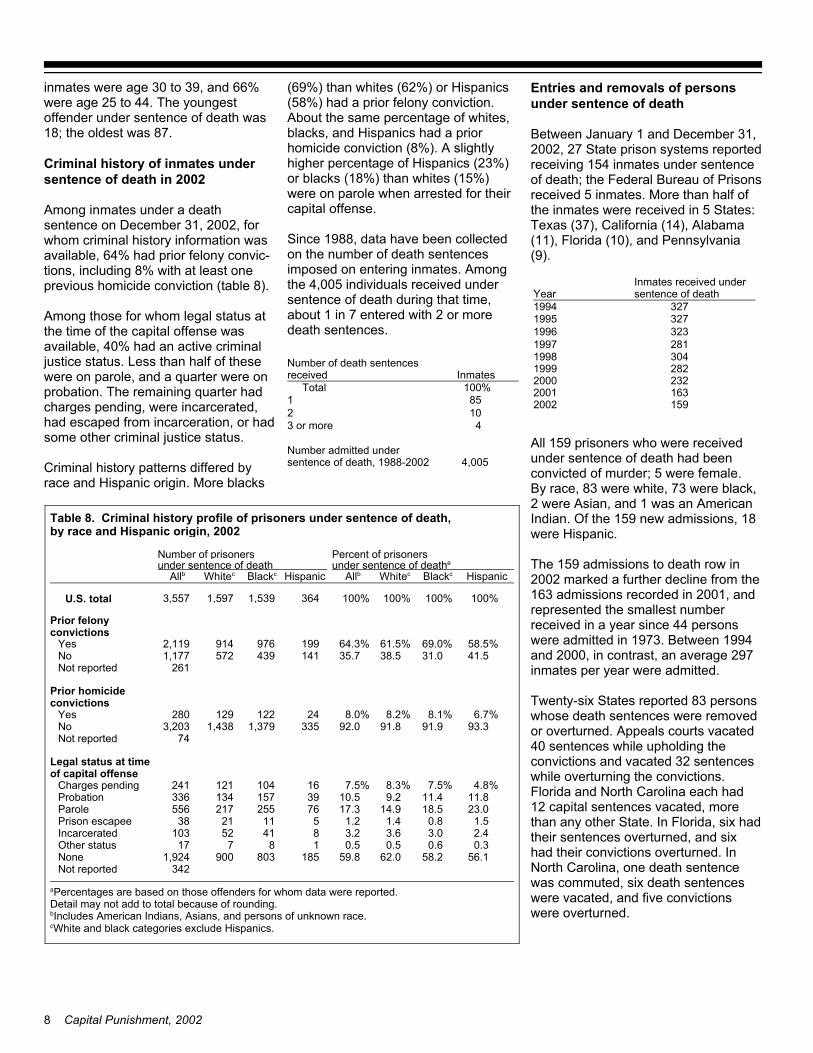
Since 1988, data have been collectedon the number of death sentencesimposed on entering inmates. Amongthe 4,005 individuals received undersentence of death during that time,about 1 in 7 entered with 2 or moredeath sentences.
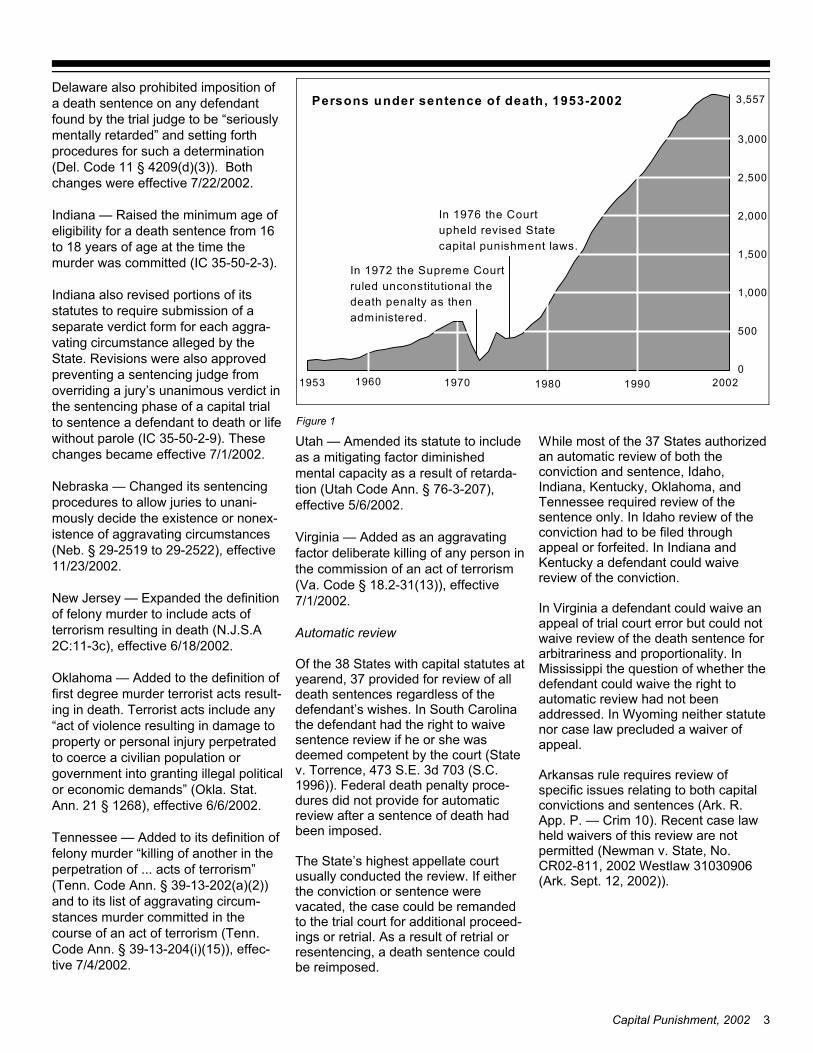
Entries and removals of personsunder sentence of death Between January 1 and December 31,2002, 27 State prison systems reportedreceiving 154 inmates under sentenceof death; the Federal Bureau of Prisonsreceived 5 inmates. More than half ofthe inmates were received in 5 States:Texas (37), California (14), Alabama(11), Florida (10), and Pennsylvania(9).
All 159 prisoners who were receivedunder sentence of death had beenconvicted of murder; 5 were female.By race, 83 were white, 73 were black,2 were Asian, and 1 was an AmericanIndian. Of the 159 new admissions, 18were Hispanic.
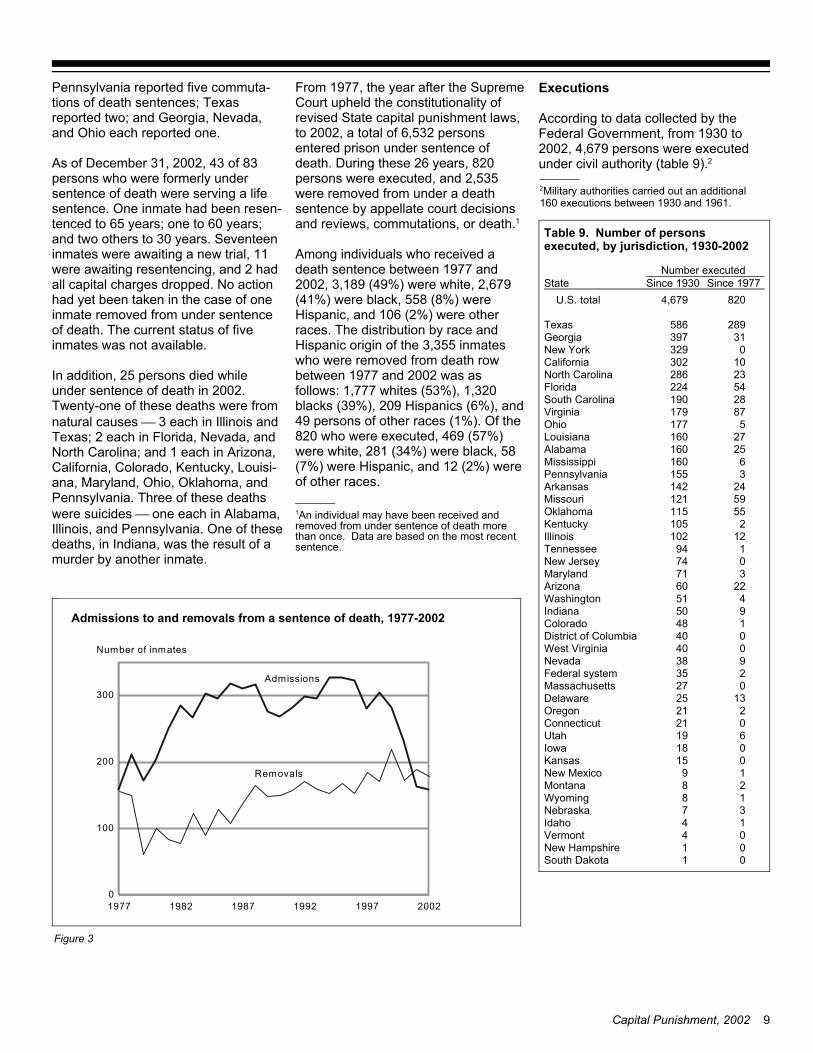
The 159 admissions to death row in2002 marked a further decline from the163 admissions recorded in 2001, andrepresented the smallest numberreceived in a year since 44 personswere admitted in 1973. Between 1994and 2000, in contrast, an average 297inmates per year were admitted.
Twenty-six States reported 83 personswhose death sentences were removedor overturned. Appeals courts vacated40 sentences while upholding theconvictions and vacated 32 sentenceswhile overturning the convictions.Florida and North Carolina each had12 capital sentences vacated, morethan any other State. In Florida, six hadtheir sentences overturned, and sixhad their convictions overturned. InNorth Carolina, one death sentencewas commuted, six death sentenceswere vacated, and five convictionswere overturned.
8 Capital Punishment, 2002
4,005Number admitted undersentence of death, 1988-2002
43 or more102851
%100 TotalInmates
Number of death sentencesreceived
aPercentages are based on those offenders for whom data were reported. Detail may not add to total because of rounding.bIncludes American Indians, Asians, and persons of unknown race.cWhite and black categories exclude Hispanics.
342Not reported56.158.262.059.81858039001,924None0.30.60.50.518717Other status2.43.03.63.284152103Incarcerated1.50.81.41.25112138Prison escapee
23.018.514.917.376255217556Parole11.811.49.210.539157134336Probation
%4.8%7.5%8.3%7.516104121241Charges pendingof capital offenseLegal status at time
74Not reported93.391.991.892.03351,3791,4383,203No
%6.7%8.1%8.2%8.024122129280YesconvictionsPrior homicide
261Not reported41.531.038.535.71414395721,177No
%58.5%69.0%61.5%64.31999769142,119YesconvictionsPrior felony
%100%100%100%1003641,5391,5973,557 U.S. total
HispanicBlackcWhitecAllbHispanicBlackcWhitecAllbunder sentence of deathaunder sentence of deathPercent of prisonersNumber of prisoners
Table 8. Criminal history profile of prisoners under sentence of death, by race and Hispanic origin, 2002
159200216320012322000282199930419982811997323199632719953271994
Inmates received undersentence of deathYear
Pennsylvania reported five commuta-tions of death sentences; Texasreported two; and Georgia, Nevada,and Ohio each reported one.
As of December 31, 2002, 43 of 83persons who were formerly undersentence of death were serving a lifesentence. One inmate had been resen-tenced to 65 years; one to 60 years;and two others to 30 years. Seventeeninmates were awaiting a new trial, 11were awaiting resentencing, and 2 hadall capital charges dropped. No actionhad yet been taken in the case of oneinmate removed from under sentenceof death. The current status of fiveinmates was not available.
In addition, 25 persons died whileunder sentence of death in 2002.Twenty-one of these deaths were fromnatural causes 3 each in Illinois andTexas; 2 each in Florida, Nevada, andNorth Carolina; and 1 each in Arizona,California, Colorado, Kentucky, Louisi-ana, Maryland, Ohio, Oklahoma, andPennsylvania. Three of these deathswere suicides one each in Alabama,Illinois, and Pennsylvania. One of thesedeaths, in Indiana, was the result of amurder by another inmate.
From 1977, the year after the SupremeCourt upheld the constitutionality ofrevised State capital punishment laws,to 2002, a total of 6,532 personsentered prison under sentence ofdeath. During these 26 years, 820persons were executed, and 2,535were removed from under a deathsentence by appellate court decisionsand reviews, commutations, or death.1
Among individuals who received adeath sentence between 1977 and2002, 3,189 (49%) were white, 2,679(41%) were black, 558 (8%) wereHispanic, and 106 (2%) were otherraces. The distribution by race andHispanic origin of the 3,355 inmateswho were removed from death rowbetween 1977 and 2002 was asfollows: 1,777 whites (53%), 1,320blacks (39%), 209 Hispanics (6%), and49 persons of other races (1%). Of the820 who were executed, 469 (57%)were white, 281 (34%) were black, 58(7%) were Hispanic, and 12 (2%) wereof other races.
Executions
According to data collected by theFederal Government, from 1930 to2002, 4,679 persons were executedunder civil authority (table 9).2
Capital Punishment, 2002 9
Figure 3
1977 1982 1987 1992 1997 20020
100
200
300
Number of inmates
Removals
Admissions
Admissions to and removals from a sentence of death, 1977-2002
1An individual may have been received andremoved from under sentence of death morethan once. Data are based on the most recentsentence.
2Military authorities carried out an additional 160 executions between 1930 and 1961.
01South Dakota01New Hampshire04Vermont14Idaho37Nebraska18Wyoming28Montana 19New Mexico 015Kansas018Iowa 619Utah021Connecticut221Oregon
1325Delaware027Massachusetts235Federal system938Nevada040West Virginia040District of Columbia148Colorado950Indiana451Washington
2260Arizona371Maryland074New Jersey194Tennessee
12102Illinois2105Kentucky
55115Oklahoma59121Missouri24142Arkansas3155Pennsylvania6160Mississippi
25160Alabama27160Louisiana5177Ohio
87179Virginia28190South Carolina54224Florida23286North Carolina10302California0329New York
31397Georgia289586Texas
8204,679 U.S. totalSince 1977Since 1930State
Number executed
Table 9. Number of persons executed, by jurisdiction, 1930-2002
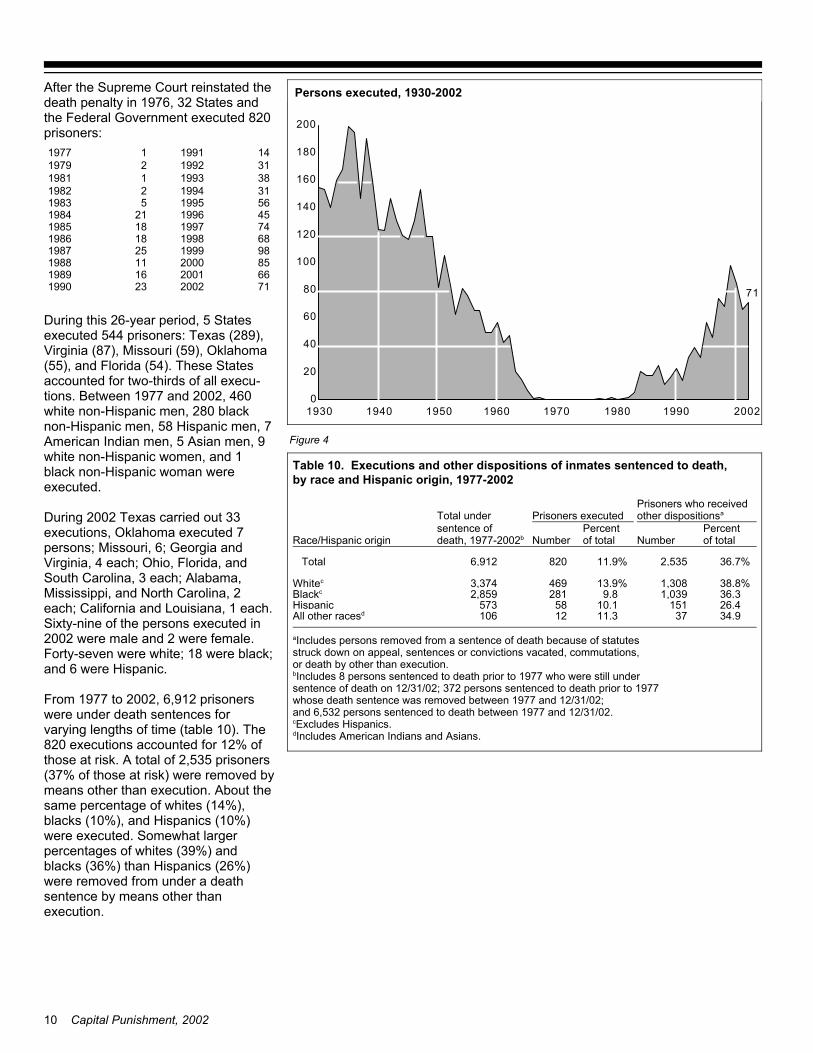
After the Supreme Court reinstated thedeath penalty in 1976, 32 States andthe Federal Government executed 820prisoners:
During this 26-year period, 5 Statesexecuted 544 prisoners: Texas (289),Virginia (87), Missouri (59), Oklahoma(55), and Florida (54). These Statesaccounted for two-thirds of all execu-tions. Between 1977 and 2002, 460white non-Hispanic men, 280 blacknon-Hispanic men, 58 Hispanic men, 7American Indian men, 5 Asian men, 9white non-Hispanic women, and 1black non-Hispanic woman wereexecuted. During 2002 Texas carried out 33executions, Oklahoma executed 7persons; Missouri, 6; Georgia andVirginia, 4 each; Ohio, Florida, andSouth Carolina, 3 each; Alabama,Mississippi, and North Carolina, 2each; California and Louisiana, 1 each.Sixty-nine of the persons executed in2002 were male and 2 were female.Forty-seven were white; 18 were black;and 6 were Hispanic.
From 1977 to 2002, 6,912 prisonerswere under death sentences forvarying lengths of time (table 10). The820 executions accounted for 12% ofthose at risk. A total of 2,535 prisoners(37% of those at risk) were removed bymeans other than execution. About thesame percentage of whites (14%),blacks (10%), and Hispanics (10%)were executed. Somewhat largerpercentages of whites (39%) andblacks (36%) than Hispanics (26%)were removed from under a deathsentence by means other thanexecution.
10 Capital Punishment, 2002
Figure 4
7120022319906620011619898520001119889819992519876819981819867419971819854519962119845619955198331199421982381993119813119922197914199111977
aIncludes persons removed from a sentence of death because of statutes struck down on appeal, sentences or convictions vacated, commutations, or death by other than execution.bIncludes 8 persons sentenced to death prior to 1977 who were still under sentence of death on 12/31/02; 372 persons sentenced to death prior to 1977 whose death sentence was removed between 1977 and 12/31/02; and 6,532 persons sentenced to death between 1977 and 12/31/02.cExcludes Hispanics.dIncludes American Indians and Asians.
34.93711.312106All other racesd26.415110.158573Hispanic36.31,0399.82812,859Blackc38.8%1,30813.9%4693,374Whitec
36.7%2,53511.9%8206,912 Total
Percent of total
Number
Percent of totalNumber
sentence ofdeath, 1977-2002bRace/Hispanic origin
other dispositionsaPrisoners executed Total underPrisoners who received
Table 10. Executions and other dispositions of inmates sentenced to death,by race and Hispanic origin, 1977-2002
0
20
40
60
80
100
120
140
160
180
200
1930 1940 1960 1970 1990 20021950 1980
71
Persons executed, 1930-2002
Among prisoners executed from 1977to 2002, the average time spentbetween the imposition of the mostrecent sentence received and execu-tion was more than 10 years (table 11).White prisoners had spent an averageof 9 years and 11 months, and blackprisoners, 10 years and 10 months.The 71 prisoners executed in 2002were under sentence of death anaverage of 10 years and 7 months.
For the 820 prisoners executedbetween 1977 and 2002, the mostcommon method of execution waslethal injection (654). Other methodswere electrocution (150), lethal gas(11), hanging (3), and firing squad (2).
00002Firing squad00003Hanging00038Lethal gas0126978Electrocution5656209378 injection
Lethal
5758281469TotalAsianIndianpanicBlackWhiteexecution
icanHis-Method ofAmer-
Executions, 1977-2002
Among prisoners under sentence ofdeath at yearend 2002, the averagetime spent in prison was 9 years and 1month, up 6 months from that in 2001.
8095Hispanic97109Black
102113White
8183Female97110Male
mo97 mo109 TotalMedianMeansentence of death
Elapsed timesince sentencingInmates under
The median time between the imposi-tion of a death sentence and yearend2002 was 97 months. Overall, theaverage time for women was 6 yearsand 11 months, 27 months less thanthat for men (9 years and 2 months).On average, whites, blacks, andHispanics had spent from 95 to 113months under a sentence of death.
Capital Punishment, 2002 11
Note: Average time was calculated from the most recent sentencing date.aIncludes American Indians and Asians.bIncludes Hispanics.
1201301271853712002166134142174866200114213413735498520001411431433361981999132128130184868199814712613327457419971531121251431451996144128134223356199513211712211203119941211121131423381993135104114111931199210712411677141991919795716231990
112789588161989897280561119889678861213251987
1027887711181986806571711181985717674813211984
mo58 mo49 mo5129111977-83
mo130 mo119 mo123283524820 Total
BlackbWhitebAll racesaBlackbWhitebAll racesaexecutionsentence to execution for:Number executedYear ofAverage elapsed time from
Table 11. Time under sentence of death and execution, by race, 1977-2002
To provide the latest data on capitalpunishment, BJS gathers informationfollowing each execution. The datainclude the date of execution, thejurisdiction, method used, and thename, race, and gender of eachperson executed.
As of November 7, 2003, 11 Statesand the Federal Governmentexecuted 60 inmates. This is fourmore than the number executed as of the same date in 2002.
Two States accounted for more thanhalf of the executions carried outduring this period: Texas carried out21, and Oklahoma carried out 14.
Lethal injection accounted for 59 ofthe executions; electrocution, for 1.
Forty-one of those executed werewhite, 18 were black, and 1 wasAmerican Indian. No women wereexecuted.
Final counts for 2003 will appear inCapital Punishment 2003, released in late 2004. This annual report willcomprise data collected from Stateand Federal correctional agencies. The report will cover all persons undersentence of death on December 31,2003, as well as those removed fromunder sentence of death.
*Virginia executed 1 prisoner by electrocution.
60 TotalLethal injection1ArkansasLethal injection1FederalLethal injection*2VirginiaLethal injection2MissouriLethal injection2IndianaLethal injection3GeorgiaLethal injection3FloridaLethal injection3AlabamaLethal injection3OhioLethal injection5North CarolinaLethal injection14OklahomaLethal injection21Texas
Method usedNumber ofexecutionsJurisdiction
Advance count of executions: January 1, 2003 — November 7, 2003
Methodology
Capital punishment information iscollected annually as part of theNational Prisoner Statistics program(NPS-8). This data series is collectedin two parts: data on persons undersentence of death are obtained fromthe department of corrections in eachjurisdiction currently authorizing capitalpunishment; and information on thestatus of death penalty statutes isobtained from the Office of the AttorneyGeneral in each of the 50 States, theDistrict of Columbia, and the FederalGovernment. Data collection forms andmore detailed tables are available onthe BJS website <www.ojp.usdoj.gov/bjs/abstract/cp02.htm> and in the Correctional Populations in the UnitedStates — Statistical Tables, also on thewebsite. NPS-8 covers all personsunder sentence of death at any timeduring the year who were held in aState or Federal nonmilitary correc-tional facility. Included are capitaloffenders transferred from prison tomental hospitals and those who mayhave escaped from custody. Excludedare persons whose death sentenceshave been overturned by the court,
regardless of their current incarcerationstatus.
The statistics reported in this Bulletinmay differ from data collected by otherorganizations for a variety of reasons: (1) NPS-8 adds inmates to the popula-tion under sentence of death not atsentencing but at the time they areadmitted to a State or Federal correc-tional facility; (2) If inmates enteredprison under a death sentence or werereported as being relieved of a deathsentence in one year but the court hadacted in the previous year, the countsare adjusted to reflect the dates ofcourt decisions (see the note on table 4for the affected jurisdictions); (3) NPScounts are always for the last day ofthe calendar year and will differ from counts for more recent periods.
All data in this report have beenreviewed for accuracy by the dataproviders in each jurisdiction prior topublication.
12 Capital Punishment, 2002
U.S. Department of JusticeOffice of Justice ProgramsBureau of Justice Statistics
Washington, DC 20531
Official BusinessPenalty for Private Use $300
The Bureau of Justice Statistics is the statistical agency of the U.S. Department of Justice. Lawrence A. Greenfeld is director.
BJS Bulletins present the first release of findings from permanent data collection programs.
This Bulletin was written by Thomas P. Bonczar and Tracy L. Snell underthe supervision of Allen J. Beck.
Tina Dorsey edited the report. JayneRobinson prepared the report for finalprinting.
At the U.S. Census Bureau, PatriciaA. Clark collected the data under thesupervision of Steven M. Bittner andMarilyn M. Monahan.
November 2003, NCJ 201848 G
PRESORTED STANDARDPOSTAGE & FEES PAID
DOJ/BJSPermit No. G-91
This report in portable documentformat and in ASCII and its relatedstatistical data and tables— includingfive appendix tables — are availableat the BJS World Wide Web Internetsite: http://www.ojp.usdoj.gov/bjs/
Capital Punishment, 2002 13
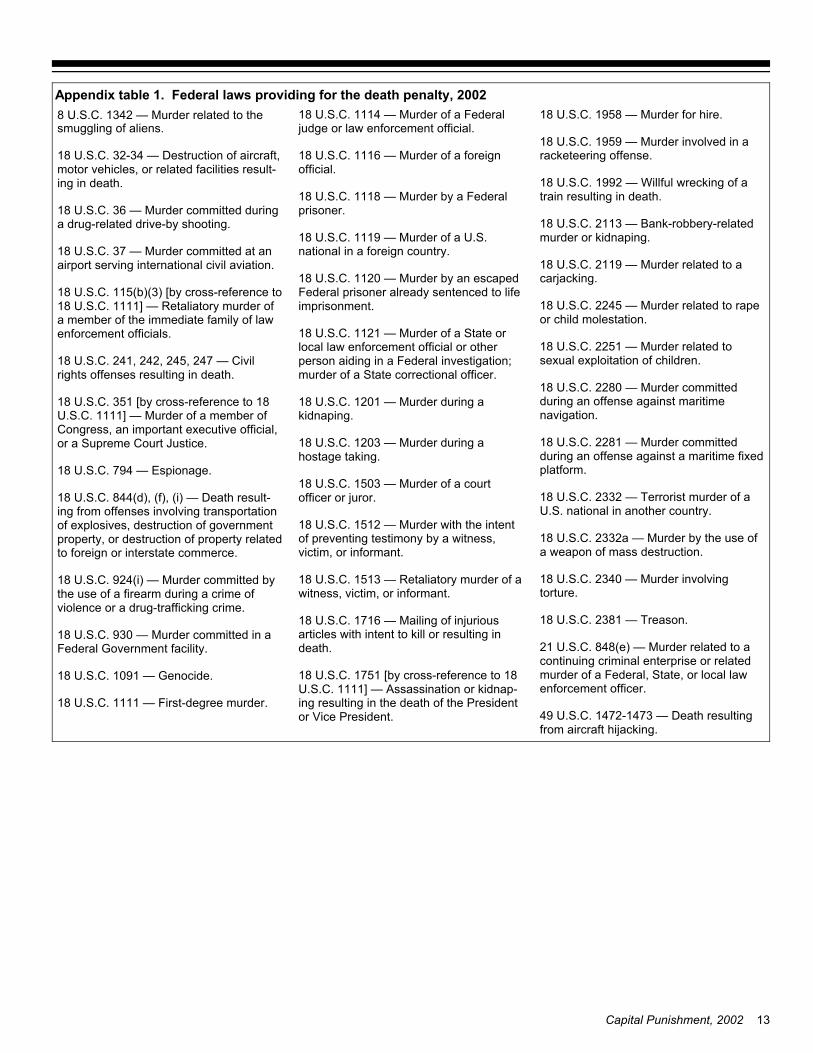
8 U.S.C. 1342 — Murder related to thesmuggling of aliens.
18 U.S.C. 32-34 — Destruction of aircraft,motor vehicles, or related facilities result-ing in death.
18 U.S.C. 36 — Murder committed duringa drug-related drive-by shooting.
18 U.S.C. 37 — Murder committed at anairport serving international civil aviation.
18 U.S.C. 115(b)(3) [by cross-reference to18 U.S.C. 1111] — Retaliatory murder ofa member of the immediate family of lawenforcement officials.
18 U.S.C. 241, 242, 245, 247 — Civilrights offenses resulting in death.
18 U.S.C. 351 [by cross-reference to 18U.S.C. 1111] — Murder of a member of Congress, an important executive official,or a Supreme Court Justice.
18 U.S.C. 794 — Espionage.
18 U.S.C. 844(d), (f), (i) — Death result-ing from offenses involving transportationof explosives, destruction of governmentproperty, or destruction of property relatedto foreign or interstate commerce.
18 U.S.C. 924(i) — Murder committed bythe use of a firearm during a crime ofviolence or a drug-trafficking crime.
18 U.S.C. 930 — Murder committed in aFederal Government facility.
18 U.S.C. 1091 — Genocide.
18 U.S.C. 1111 — First-degree murder.
18 U.S.C. 1114 — Murder of a Federaljudge or law enforcement official.
18 U.S.C. 1116 — Murder of a foreignofficial.
18 U.S.C. 1118 — Murder by a Federalprisoner.
18 U.S.C. 1119 — Murder of a U.S.national in a foreign country.
18 U.S.C. 1120 — Murder by an escapedFederal prisoner already sentenced to lifeimprisonment.
18 U.S.C. 1121 — Murder of a State orlocal law enforcement official or otherperson aiding in a Federal investigation;murder of a State correctional officer.
18 U.S.C. 1201 — Murder during akidnaping.
18 U.S.C. 1203 — Murder during ahostage taking.
18 U.S.C. 1503 — Murder of a courtofficer or juror.
18 U.S.C. 1512 — Murder with the intentof preventing testimony by a witness,victim, or informant.
18 U.S.C. 1513 — Retaliatory murder of awitness, victim, or informant.
18 U.S.C. 1716 — Mailing of injuriousarticles with intent to kill or resulting indeath.
18 U.S.C. 1751 [by cross-reference to 18U.S.C. 1111] — Assassination or kidnap-ing resulting in the death of the Presidentor Vice President.
18 U.S.C. 1958 — Murder for hire.
18 U.S.C. 1959 — Murder involved in aracketeering offense.
18 U.S.C. 1992 — Willful wrecking of atrain resulting in death.
18 U.S.C. 2113 — Bank-robbery-relatedmurder or kidnaping.
18 U.S.C. 2119 — Murder related to acarjacking.
18 U.S.C. 2245 — Murder related to rapeor child molestation.
18 U.S.C. 2251 — Murder related tosexual exploitation of children.
18 U.S.C. 2280 — Murder committedduring an offense against maritimenavigation.
18 U.S.C. 2281 — Murder committedduring an offense against a maritime fixedplatform.
18 U.S.C. 2332 — Terrorist murder of aU.S. national in another country.
18 U.S.C. 2332a — Murder by the use ofa weapon of mass destruction.
18 U.S.C. 2340 — Murder involvingtorture.
18 U.S.C. 2381 — Treason.
21 U.S.C. 848(e) — Murder related to acontinuing criminal enterprise or relatedmurder of a Federal, State, or local lawenforcement officer.
49 U.S.C. 1472-1473 — Death resultingfrom aircraft hijacking.
Appendix table 1. Federal laws providing for the death penalty, 2002
14 Capital Punishment, 2002
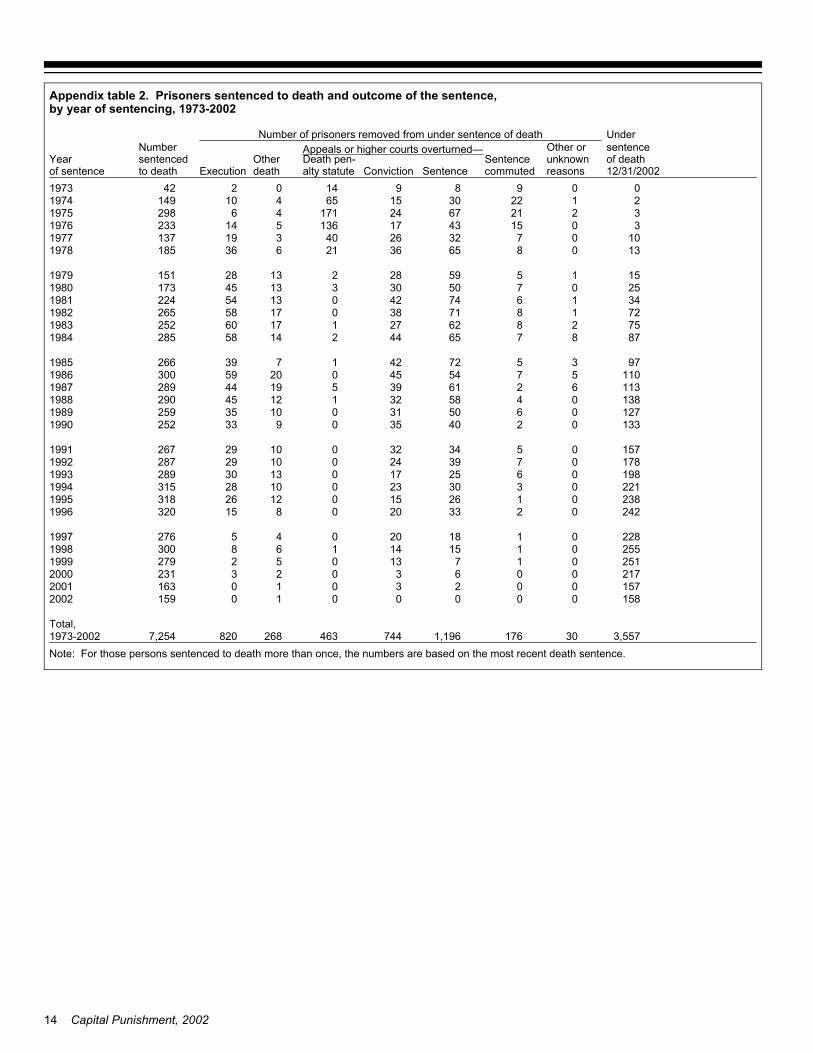
Note: For those persons sentenced to death more than once, the numbers are based on the most recent death sentence.3,557301761,1967444632688207,2541973-2002
Total,
15800000101592002157002301016320012170063023231200025101713052279199925501151416830019982280118200452761997
24202332008153201996238012615012263181995221033023010283151994198062517013302891993178073924010292871992157053432010292671991
133024035093325219901270650310103525919891380458321124529019881136261395194428919871105754450205930019869735724217392661985
878765442145828519847528622711760252198372187138017582651982341674420135422419812507503031345173198015155928213281511979
13086536216361851978100732264031913719773015431713651423319763221672417146298197521223015654101491974009891402421973
sentenceof death12/31/2002
Other orunknownreasons
Sentencecommuted
Appeals or higher courts overturned—Death pen-alty statute Conviction Sentence
OtherdeathExecution
Numbersentencedto death
Year of sentence
UnderNumber of prisoners removed from under sentence of death
Appendix table 2. Prisoners sentenced to death and outcome of the sentence,by year of sentencing, 1973-2002
Capital Punishment, 2002 15
Note: For those persons sentenced to death more than once, the numbers are based on the most recent death sentence.*Averages not calculated for fewer than 10 inmates.
9.13,557158157468483480419335260251207162177 Total
*55New York*22Wyoming*5221Kansas*211New Mexico*52111South Dakota
3.0233398Virginia4.124525633Federal system5.110132121Washington5.114241232Delaware6.226256535Oregon
*73121Connecticut*532Colorado
7.8141115321New Jersey*62211Montana*712211Nebraska
11.311112111121Utah9.61512142113Maryland7.0725871016117413South Carolina7.7112731424221159863Oklahoma
10.320576132532182217172820Ohio7.24027889321Arkansas7.76624912139713321Missouri6.586721921175315312Louisiana
10.520121122232112Idaho10.23643353317322Indiana10.73612551442453Kentucky6.820671332354646154413North Carolina7.46653913101064114Mississippi
10.0120171116917151214756Arizona10.7831197187498586Nevada9.9241952726253723212722136Pennsylvania8.519111725352423111815859Alabama
10.0112311321131211118739Georgia11.39544101184861113610Tennessee11.01596217111918151912141115Illinois7.445037268168605742202413715Texas
10.9366101543302845513033232335Florida10.2614142674707655636351373748California
12/31/0212/31/02200220011999-001997-981995-96 1993-941991-92 1989-901987-881985-861983-841974-82Statedeath as ofof death,Year of sentence for prisoners sentenced to and remaining on death row, 12/31/2002sentence ofsentenceyears underUndernumber ofAverage
Appendix table 3. Prisoners under sentence of death on December 31, 2002, by State and year of sentencing
16 Capital Punishment, 2002
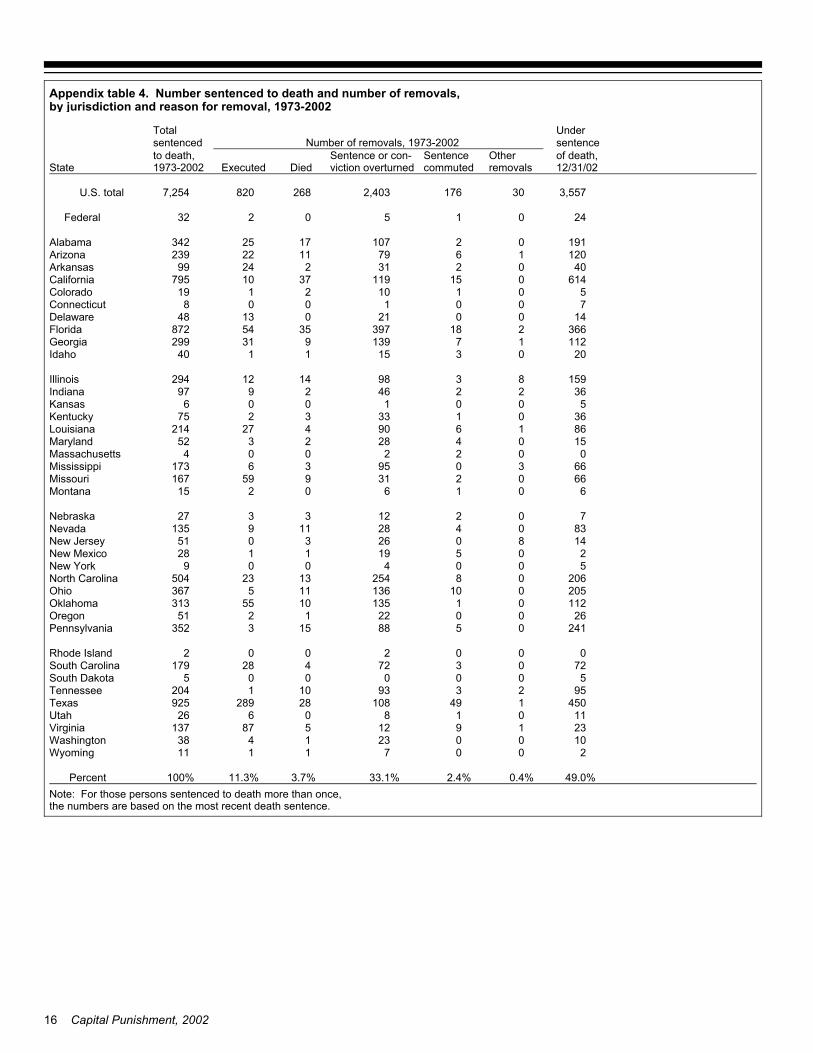
Note: For those persons sentenced to death more than once, the numbers are based on the most recent death sentence.
49.0%0.4%2.4%33.1%3.7%11.3%100% Percent
20071111Wyoming1000231438Washington231912587137Virginia110180626Utah
45014910828289925Texas952393101204Tennessee5000005South Dakota
720372428179South Carolina0002002Rhode Island
2410588153352Pennsylvania2600221251Oregon
112011351055313Oklahoma205010136115367Ohio206082541323504North Carolina
5004009New York205191128New Mexico
1480263051New Jersey830428119135Nevada702123327Nebraska
60160215Montana660231959167Missouri66309536173Mississippi0022004Massachusetts
1504282352Maryland861690427214Louisiana3601333275Kentucky5001006Kansas
3622462997Indiana15983981412294Illinois
2003151140Idaho11217139931299Georgia3662183973554872Florida14002101348Delaware7001008Connecticut501102119Colorado
6140151193710795California40023122499Arkansas
12016791122239Arizona191021071725342Alabama
240150232 Federal
3,557301762,4032688207,254 U.S. total
12/31/02removalscommutedviction overturned DiedExecuted1973-2002Stateof death,Other SentenceSentence or con-to death,sentenceNumber of removals, 1973-2002sentencedUnderTotal
Appendix table 4. Number sentenced to death and number of removals,by jurisdiction and reason for removal, 1973-2002
Capital Punishment, 2002 17
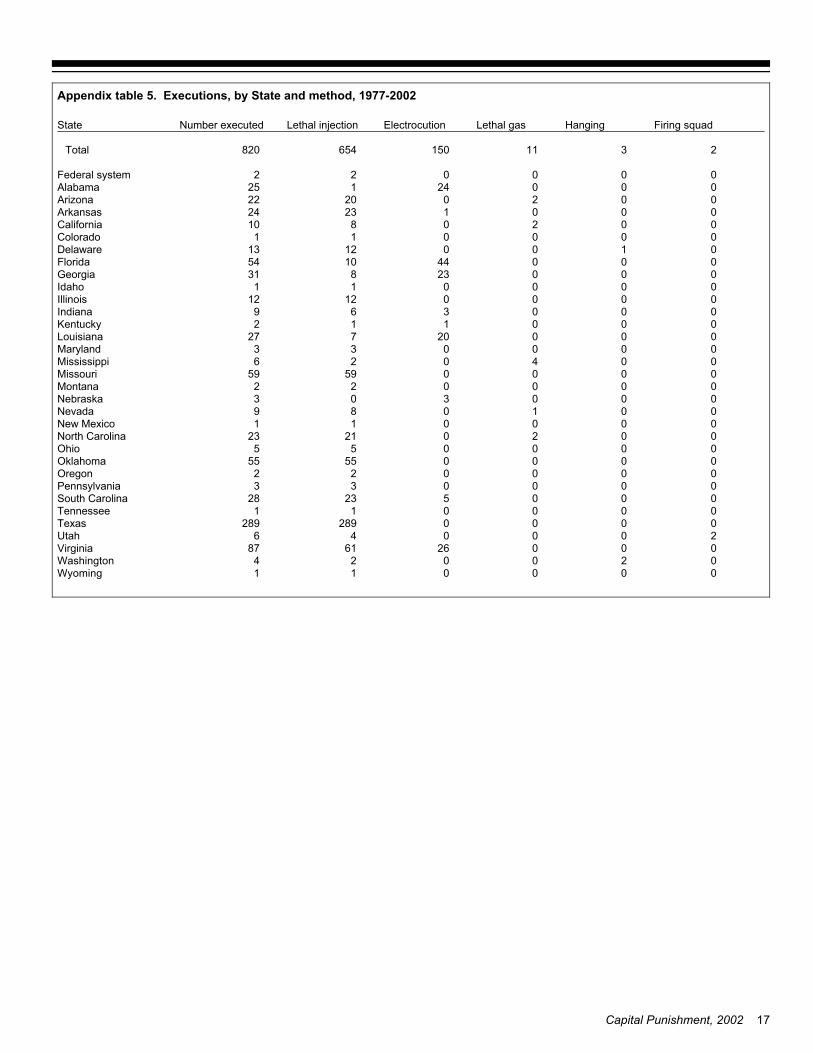
000011Wyoming020024Washington000266187Virginia200046Utah0000289289Texas000011Tennessee00052328South Carolina000033Pennsylvania000022Oregon00005555Oklahoma000055Ohio00202123North Carolina000011New Mexico001089Nevada000303Nebraska000022Montana00005959Missouri004026Mississippi000033Maryland00020727Louisiana000112Kentucky000369Indiana00001212Illinois000011Idaho00023831Georgia000441054Florida01001213Delaware000011Colorado0020810California00012324Arkansas00202022Arizona00024125Alabama000022Federal system
2311150654820Total
Firing squadHangingLethal gasElectrocutionLethal injectionNumber executedState
Appendix table 5. Executions, by State and method, 1977-2002