Canada Research Mining & Natural Resourcescdn.ceo.ca.s3-us-west-2.amazonaws.com/1bg6983-Cameco...
15
Canada Research Published by Raymond James Ltd. Please read domestic and foreign disclosure/risk information beginning on page 12 and Analyst Certification on page 11. Raymond James Ltd. | 2100 – 925 West Georgia Street | Vancouver BC Canada V6C 3L2 Mining & Natural Resources April 4, 2016 Industry Comment - Changes Cameco's Updated Cigar Tech Report Boosts Costs, Underscores Challenges, Helps Make Case for NexGen Recommendation We are revising our valuation on Cameco based on a new 43-101 technical report for the 50%-owned Cigar Lake mine released last week. Disclosure was updated for a revised mine plan, development method, freezing techniques, etc., but the most noteworthy change was, to us, a large increase in go-forward capital requirements. Incorporation of these higher costs cuts our NPV(8%) on the mine and our target valuation on the company. The cost creep speaks to both the complexity of the Cigar Lake orebody, as well as the difficulty of bringing-on high-grade uranium production in general, but particularly at sandstone/unconformity-hosted deposits. We believe this should give Cameco further impetus to reduce the technical risk of its production pipeline; in this report, we discuss why NexGen Energy Ltd. is a possible acquisition target to achieve this goal. Analysis Cigar Costs Jump. The new 43-101 report updates the old one (Feb-2012) in several respects including more borehole data; operational experience and progress (mine now near nameplate rates; three JBS rigs running); the New Austrian Tunneling Method (NATM) for underground development; ground-freezing exclusively using freeze holes from surface (from a combination with underground previously); and recent mill and TMF modifications. Ramped production rates of 18 Mlbs/yr will now be achieved in 2017 (from 2018) and average LOM cash operating costs are slightly higher at C$18.75/lb (from C$18.57/lb). Most importantly, total remaining LOM capex for the mine and McClean Lake mill on a 100% basis is C$1.2 bln, up from C$300 mln in the 2012 report, due to ‘general cost inflation’, mining/milling scope changes and capitalization of certain development and freezing expenses. Payback to Cameco, per the report, would be achieved in 2022 on a pre-tax basis. RJL Model Changes. We incorporated these metrics and our updated US$/C$ FX assumption of 0.73 (from 0.69) into our model, leading to a 19% drop in our post-tax Cigar NPV(8%) to C$4.7 bln, of which C$2.3 bln is Cameco’s share. We model Cigar returning ~C$427 mln/yr FCF over the next five years (100% basis) at RJL prices. Thinking Could Shift. While Cigar is now running well, the mine’s construction and ramp-up was, in retrospect, costlier, lengthier and more dangerous than conceived at the outset. We estimate the mine will make good cash flow going-forward, but when sunk costs and economics are considered in their entirety, we believe Cameco will hesitate to develop sandstone/unconformity deposits in future. This then begs the question – when uranium prices inevitably rebound, justifying greater output, where does the company get its next phase of greenfield growth? We believe Millennium, the conventional answer to that question, is no longer the ‘easy’ choice. NexGen Should Be in Crosshairs. Rather, we believe Cameco could (and should) turn its focus to the fastest-growing, easily-mineable, high-grade deposit anywhere – Arrow, 100%-owned by NexGen Energy Ltd. – which just happens to be in a very familiar jurisdiction, Canada’s Athabasca Basin. Company Ticker(s) Current Target Price Div. Total Suitability Rating Primary Secondary Price Old New Yield Return Old New Old New Uranium Cameco Corporation CCO-TSX CCJ-NYSE C$16.52 C$25.00 C$22.00 2% 33% H/GRW H/GRW OP2 OP2 NexGen Energy Ltd. NXE-TSXV C$1.93 C$2.50 C$2.50 0% 30% H/SPEC H/SPEC SB1 SB1 Note: Target prices are for a 6-12 month period; M/INC - Medium Risk/Income, M/GRW - Medium Risk/Growth, H/GRW - High Risk/Growth, H/INC - High Risk/Income, H/SPEC - High Risk/Speculation; SB1 - Strong Buy, OP2 - Outperform, MP3 - Market Perform, UP4 - Underperform, UR - Under Review, R - Restricted. Raymond James Ltd. David Sadowski 604.659.8255 [email protected] Brian Martin CFA (Associate) 604.654.1236 [email protected]
Transcript of Canada Research Mining & Natural Resourcescdn.ceo.ca.s3-us-west-2.amazonaws.com/1bg6983-Cameco...

Canada Research Published by Raymond James Ltd.
Please read domestic and foreign disclosure/risk information beginning on page 12 and Analyst Certification on page 11. Raymond James Ltd. | 2100 – 925 West Georgia Street | Vancouver BC Canada V6C 3L2
Mining & Natural Resources April 4, 2016 Industry Comment - Changes
Cameco's Updated Cigar Tech Report Boosts Costs, Underscores Challenges, Helps Make Case for NexGen
Recommendation We are revising our valuation on Cameco based on a new 43-101 technical report for the 50%-owned Cigar Lake mine released last week. Disclosure was updated for a revised mine plan, development method, freezing techniques, etc., but the most noteworthy change was, to us, a large increase in go-forward capital requirements. Incorporation of these higher costs cuts our NPV(8%) on the mine and our target valuation on the company. The cost creep speaks to both the complexity of the Cigar Lake orebody, as well as the difficulty of bringing-on high-grade uranium production in general, but particularly at sandstone/unconformity-hosted deposits. We believe this should give Cameco further impetus to reduce the technical risk of its production pipeline; in this report, we discuss why NexGen Energy Ltd. is a possible acquisition target to achieve this goal.
Analysis Cigar Costs Jump. The new 43-101 report updates the old one (Feb-2012) in several
respects including more borehole data; operational experience and progress (mine now near nameplate rates; three JBS rigs running); the New Austrian Tunneling Method (NATM) for underground development; ground-freezing exclusively using freeze holes from surface (from a combination with underground previously); and recent mill and TMF modifications. Ramped production rates of 18 Mlbs/yr will now be achieved in 2017 (from 2018) and average LOM cash operating costs are slightly higher at C$18.75/lb (from C$18.57/lb). Most importantly, total remaining LOM capex for the mine and McClean Lake mill on a 100% basis is C$1.2 bln, up from C$300 mln in the 2012 report, due to ‘general cost inflation’, mining/milling scope changes and capitalization of certain development and freezing expenses. Payback to Cameco, per the report, would be achieved in 2022 on a pre-tax basis.
RJL Model Changes. We incorporated these metrics and our updated US$/C$ FX assumption of 0.73 (from 0.69) into our model, leading to a 19% drop in our post-tax Cigar NPV(8%) to C$4.7 bln, of which C$2.3 bln is Cameco’s share. We model Cigar returning ~C$427 mln/yr FCF over the next five years (100% basis) at RJL prices.
Thinking Could Shift. While Cigar is now running well, the mine’s construction and ramp-up was, in retrospect, costlier, lengthier and more dangerous than conceived at the outset. We estimate the mine will make good cash flow going-forward, but when sunk costs and economics are considered in their entirety, we believe Cameco will hesitate to develop sandstone/unconformity deposits in future. This then begs the question – when uranium prices inevitably rebound, justifying greater output, where does the company get its next phase of greenfield growth? We believe Millennium, the conventional answer to that question, is no longer the ‘easy’ choice.
NexGen Should Be in Crosshairs. Rather, we believe Cameco could (and should) turn its focus to the fastest-growing, easily-mineable, high-grade deposit anywhere – Arrow, 100%-owned by NexGen Energy Ltd. – which just happens to be in a very familiar jurisdiction, Canada’s Athabasca Basin.
Company Ticker(s) Current Target Price Div. Total Suitability Rating Primary Secondary Price Old New Yield Return Old New Old New
Uranium Cameco Corporation CCO-TSX CCJ-NYSE C$16.52 C$25.00 C$22.00 2% 33% H/GRW H/GRW OP2 OP2 NexGen Energy Ltd. NXE-TSXV C$1.93 C$2.50 C$2.50 0% 30% H/SPEC H/SPEC SB1 SB1
Note: Target prices are for a 6-12 month period; M/INC - Medium Risk/Income, M/GRW - Medium Risk/Growth, H/GRW - High Risk/Growth, H/INC - High Risk/Income, H/SPEC - High Risk/Speculation; SB1 - Strong Buy, OP2 - Outperform, MP3 - Market Perform, UP4 - Underperform, UR - Under Review, R - Restricted.
Raymond James Ltd.
David Sadowski 604.659.8255
Brian Martin CFA (Associate)
604.654.1236 [email protected]
Canada Research | Page 2 of 15 Mining & Natural Resources
Raymond James Ltd. | 2100 – 925 West Georgia Street | Vancouver BC Canada V6C 3L2
Cameco’s Growth Options
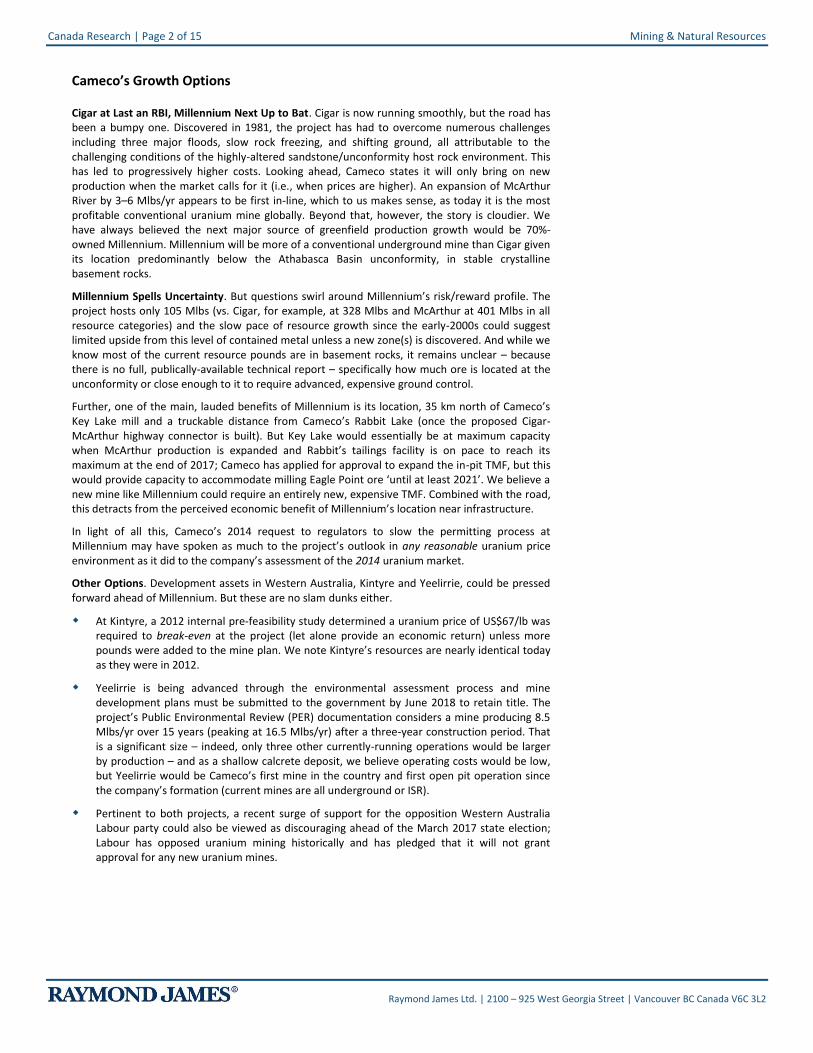
Cigar at Last an RBI, Millennium Next Up to Bat. Cigar is now running smoothly, but the road has been a bumpy one. Discovered in 1981, the project has had to overcome numerous challenges including three major floods, slow rock freezing, and shifting ground, all attributable to the challenging conditions of the highly-altered sandstone/unconformity host rock environment. This has led to progressively higher costs. Looking ahead, Cameco states it will only bring on new production when the market calls for it (i.e., when prices are higher). An expansion of McArthur River by 3–6 Mlbs/yr appears to be first in-line, which to us makes sense, as today it is the most profitable conventional uranium mine globally. Beyond that, however, the story is cloudier. We have always believed the next major source of greenfield production growth would be 70%-owned Millennium. Millennium will be more of a conventional underground mine than Cigar given its location predominantly below the Athabasca Basin unconformity, in stable crystalline basement rocks.
Millennium Spells Uncertainty. But questions swirl around Millennium’s risk/reward profile. The project hosts only 105 Mlbs (vs. Cigar, for example, at 328 Mlbs and McArthur at 401 Mlbs in all resource categories) and the slow pace of resource growth since the early-2000s could suggest limited upside from this level of contained metal unless a new zone(s) is discovered. And while we know most of the current resource pounds are in basement rocks, it remains unclear – because there is no full, publically-available technical report – specifically how much ore is located at the unconformity or close enough to it to require advanced, expensive ground control.
Further, one of the main, lauded benefits of Millennium is its location, 35 km north of Cameco’s Key Lake mill and a truckable distance from Cameco’s Rabbit Lake (once the proposed Cigar-McArthur highway connector is built). But Key Lake would essentially be at maximum capacity when McArthur production is expanded and Rabbit’s tailings facility is on pace to reach its maximum at the end of 2017; Cameco has applied for approval to expand the in-pit TMF, but this would provide capacity to accommodate milling Eagle Point ore ‘until at least 2021’. We believe a new mine like Millennium could require an entirely new, expensive TMF. Combined with the road, this detracts from the perceived economic benefit of Millennium’s location near infrastructure.
In light of all this, Cameco’s 2014 request to regulators to slow the permitting process at Millennium may have spoken as much to the project’s outlook in any reasonable uranium price environment as it did to the company’s assessment of the 2014 uranium market.
Other Options. Development assets in Western Australia, Kintyre and Yeelirrie, could be pressed forward ahead of Millennium. But these are no slam dunks either.
At Kintyre, a 2012 internal pre-feasibility study determined a uranium price of US$67/lb was required to break-even at the project (let alone provide an economic return) unless more pounds were added to the mine plan. We note Kintyre’s resources are nearly identical today as they were in 2012.
Yeelirrie is being advanced through the environmental assessment process and mine development plans must be submitted to the government by June 2018 to retain title. The project’s Public Environmental Review (PER) documentation considers a mine producing 8.5 Mlbs/yr over 15 years (peaking at 16.5 Mlbs/yr) after a three-year construction period. That is a significant size – indeed, only three other currently-running operations would be larger by production – and as a shallow calcrete deposit, we believe operating costs would be low, but Yeelirrie would be Cameco’s first mine in the country and first open pit operation since the company’s formation (current mines are all underground or ISR).
Pertinent to both projects, a recent surge of support for the opposition Western Australia Labour party could also be viewed as discouraging ahead of the March 2017 state election; Labour has opposed uranium mining historically and has pledged that it will not grant approval for any new uranium mines.
Mining & Natural Resources Canada Research | Page 3 of 15
Raymond James Ltd. | 2100 – 925 West Georgia Street | Vancouver BC Canada V6C 3L2
NexGen as an Acquisition Target for Cameco
NexGen is the Standout Answer. We submit that NexGen’s Arrow could represent the clearest pathway for Cameco to increase high-margin, low risk production in light of:
Low technical risk – Arrow sits entirely within competent basement rocks, with high-grade ore starting over 200 m vertically below the Athabasca sandstone unconformity. This is important, as the orebody’s host rocks are water impermeable and stable enough to obviate the need for expensive ground freezing. Mineralization occurs as thick, stacked, steeply-dipping lenses that appear amenable to raise-boring and/or long-hole stoping. Cameco should have a high degree of comfort with this geological setting – Arrow is highly analogous to Cameco’s operating Eagle Point underground mine, which started up in 1994 and continues to run at 0.59% U3O8 grades (about 1/5
th of Arrow’s average resource grade).
Safe, familiar jurisdiction – Formed by the merger of two government companies in 1988, Cameco dominates the Canadian uranium industry today, operating three uranium mines there, including two of the world’s most prolific. Canada represented 82% of the company’s 2015 production and the country makes up 77% of our minesite NAV. This familiarity with unique high-grade operations in the Basin and the Canadian regulatory environment is to us one of the company’s greatest intangible advantages. We note Saskatchewan ranks 4
th in the
world amongst jurisdictions in the latest Fraser Institute mining Policy Perception index.
Cornerstone of a new district – Arrow hosts 202 Mlbs in 43-101 resources today and we believe could surpass 250 Mlbs in a resource update during 2H16E. With seemingly continuous success expanding the discovery, size potential already appears in excess of Cigar Lake at Arrow alone. While the Eastern Athabasca Basin has provided the bulk of historic Canadian uranium production, the western region, led by Arrow but also including regional deposits like Fission’s 108 Mlbs Patterson Lake South to the west and Areva/UEX’ 96 Mlbs Shea Creek to the north, is quickly re-emerging as a globally important district. We believe whoever controls Arrow will be in the driver’s seat for the region’s development.
Stunning cash flow potential – Arrow’s west Basin location suggests a new mill would be required for future operations, which pushes our modeled upfront capital costs for the project to C$1.2 bln. But given the likely ease of mining, lack of freezing required, and significant grades, production costs would be amongst the world’s lowest – we model US$7/lb operating cash costs and US$22/lb all-in sustaining – supporting significant cash flow (see Exhibit 1 below or our Mar-17-16 NexGen Comment, Switching to DCF Valuation on Back of Mammoth Arrow, NXE price $1.32, for details). We see production starting in 2025E and averaging 14.3 Mlbs/yr over 12 years, which would rank it as the fourth largest mine in the world, is equivalent to ~50% of Cameco’s 2016E production, and would provide ~C$566 mln/yr in after-tax cash flow at US$70/lb (or C$393 mln/yr at US$50/lb). After-tax capital payback is achieved in a scant 1.4 years at US$70/lb or 2.2 years at US$50/lb. Our model is based on stand-alone development by NexGen – Cameco could conceivably fast-track the development timeline, and toll-milling of regional deposits could improve overall economics considerably. Our assumptions are also based on a 182 Mlbs mineral inventory, which is probably already out of date. A larger reserve could justify higher production rates.
Good price given economics – Even after NexGen’s recent share price appreciation to C$554 mln in market capitalization, we believe Cameco could pay a significant premium for NexGen. Our ‘buy & build’ cost analysis suggests an acquirer could buy all outstanding shares of NXE (fully-diluted) at up to a 190% premium to the current share price, and build the project for our estimated capex of C$1.2 bln and it would still be an accretive acquisition, based on our modeled Arrow cash flows at US$70/lb uranium and US$0.73/C$ FX discount rate, discounted to today’s dollars at 8%. At a more conservative uranium price assumption of US$50/lb, this buy & build analysis suggests an offer with a premium up to 48% would be accretive. This would still only imply a price of US$4.6 per resource pound – less than half the US$10/lb Rio Tinto paid for Hathor in 2012. Further, this analysis excludes any value for upside beyond current 43-101 resources.
Unencumbered – NexGen Energy owns 100% of Arrow, which has no royalties in the main project area, nor any production off-take agreements encumbering the host Rook 1 property. To our knowledge, NexGen also has no major blocks of equity controlled by Cameco’s competitors.

Canada Research | Page 4 of 15 Mining & Natural Resources
Raymond James Ltd. | 2100 – 925 West Georgia Street | Vancouver BC Canada V6C 3L2
Cameco is undoubtedly tracking NexGen closely and probably has a confidentiality agreement (CA) signed to access non-public data on the project. Exhibit 1: RJL Model Parameters for NexGen’s Arrow Project
Source: Raymond James Ltd., NexGen Energy Ltd.
Why the Wait? If the Arrow project is indeed such a good fit for Cameco, why – one could ask – has NexGen not already been the target of a takeout bid? Speculating on M&A is never easy, but we would point out that:
Cameco’s focus on ramping-up Cigar and the go-forward capital that mine now requires or – perhaps even more likely – the chance of a large payment as a result of the transfer pricing dispute with the CRA, could be compelling the company to preserve its balance sheet and not rush into M&A. This should not preclude an all-share deal, however.
It could be that Cameco truly prefers the potential of its pipeline, led by Millennium, Yeelirrie and Kintyre, and including the Wheeler River JV with Denison (CCO’s share of resources is only 34 Mlbs) or new 68 Mlbs Fox Lake discovery, to that of Arrow, despite our aforementioned arguments.
The likely requirement of a brand new mill at Arrow for processing, and the associated permitting process, cost and timeline could be viewed as unpalatable.
There are few ‘obvious’ other suitors to put pressure on Cameco with a competitive bid for NexGen. Areva outright publically stated as recently as March 8 that it is not looking to buy new uranium development projects; Rio Tinto’s uranium strategy, which one could argue included a pivot to Canada with the 2012 Hathor acquisition to offset ageing, high cost Rössing and Ranger production, is now, to us, unknown; other Canadian players like Fission, Denison and UEX are too small to make an acquisition of NexGen’s size; and some nuclear utilities, while likely very interested in investing in development stage assets (as evidenced by CGN’s Dec-2015 investment into Fission), do not have the operational expertise to take on a project like Arrow alone.
Arrow may be viewed as too early-stage and uncertain by Cameco. Or it could be that Cameco sees NexGen’s valuation as too rich at current levels given its stage of delineation.
Economic Parameters Unit RJL Rook 1 Production & Consolidated Cost Profile
LT Uranium Price US$/lb $70
Exchange Rate US$/C$ 0.73
Effective LOM Tax Rate % 26%
Operational Summary
Start Year yr 2025E
Mine Life # of yrs 12
Mine Type OP/UG UG
Processing Type Alkaline SX
Ore Mined mln t 2.7
Mine Dilution % 25%
Mill Capacity tpd 750 Rook 1 Production Schedule
Uranium Head Grade % U3O8 2.94%
Uranium Recovered Mlbs 171
Uranium Recovery % 97%
Annual Uranium Production Mlbs/yr 14.3
Cost Summary
Mining Cost (Ore + Waste) C$/t $267
Processing Cost C$/t $139
G&A Cost C$/t $89
Total Unit Costs (Ore) C$/t $619
Operating Cash Costs US$/lb $7.2 Rook 1 Project After-tax Cash Flows
All-in Sustaining Costs US$/lb $21.6
Up-front Capex C$mln $1,200
Sustaining Capital C$mln $252
LOM Capital C$mln $1,502
Valuation
Discount Rate % 8%
Post-Tax IRR % 43%
Post-Tax NPV US$mln $1,704
Post-Tax NPV C$mln $2,334
2024E 2025E 2026E 2027E 2028E 2029E 2030E 2031E 2032E
$0
$15
$30
$45
$60
0.0
5.0
10.0
15.0
20.0
Per
Po
un
d C
ost
s (U
S$/l
b)
Pro
du
ctio
n (M
lbs)
Production (Mlbs U3O8) Cash Cost (US$/lb) Royalties (US$/lb)
Sustaining Capital (US$/lb) Tax (US$/lb) Corporate G&A (US$/lb)
RJL Uranium Price
0%
1%
2%
3%
4%
0.0
5.0
10.0
15.0
20.0
2024E 2025E 2026E 2027E 2028E 2029E 2030E 2031E 2032E
Gra
de
(%U
3O
8)
Pro
du
ctio
n (M
lbs)
A2 High-Grade A2 A3 Milled Head Grade (%U3O8)
-$6,000
-$2,000
$2,000
$6,000
-$600
-$200
$200
$600
20
20E
20
21E
20
22E
20
23E
20
24E
20
25E
20
26E
20
27E
20
28E
20
29E
20
30E
20
31E
20
32E
20
33E
20
34E
20
35E
20
36E
20
37E
Cu
mu
lati
ve C
F (U
S$
mln
)
An
nu
al C
F (U
S$ m
ln)
Cumulative After-tax FCF After-tax Operating CF

Mining & Natural Resources Canada Research | Page 5 of 15
Raymond James Ltd. | 2100 – 925 West Georgia Street | Vancouver BC Canada V6C 3L2
Irrespective of rationale, we believe a problem with a wait-and-see strategy, if Cameco truly is interested in the project, is the longer Cameco waits, the more expensive an acquisition could become, either via further appreciation in the share price of NexGen – e.g., fueled by drilling success, resource growth, de-risking, uranium price increases – or via an unexpected takeout bid by a competitor. Cameco’s bidding war with Rio Tinto for Hathor serves as a cautionary tale.
Changes to RJL Cameco Valuation
We have adjusted our Cigar Lake mine DCF for changes in the new technical report, chiefly higher capital expenditures over the remaining life of mine through 2028, slightly higher operating costs and an updated production profile. Our DCF is based on 2P reserves of 222 Mlbs grading 16.7% U3O8, while we ascribe in-situ value to Inferred Phase 2 resources of 103 Mlbs grading 16.4%. We have also updated our model for a US$/C$ foreign exchange rate of 0.73 (from 0.69). These changes have an overall negative impact on our NAVPS and CFPS projections, used to drive our target price.
Our target is based on a 50/50 blend of (i) a 1.1x P/NAV multiple applied to our C$18.77 NAVPS (from C$22.02) and (ii) a 9x P/CF multiple applied to 2017E CFPS of C$2.49 (from C$2.78).
We retain our Outperform rating in light of a compelling return to target, as well as a tight share price correlation with uranium prices and our belief that prices should begin to rebound from current 11-year lows in the spot market towards mine-incentivizing levels during 2016/2017.

Canada Research | Page 6 of 15 Mining & Natural Resources
Raymond James Ltd. | 2100 – 925 West Georgia Street | Vancouver BC Canada V6C 3L2
Exhibit 2: Financial and Operational Snapshot for Cameco Corp.
Source: Raymond James Ltd., Cameco Corp., Capital IQ, UxC
RAYMOND JAMES LTD. RESEARCH Analyst: David Sadowski 604 659 8255
Rating: Outperform 2 CCO-T [email protected] Mth Target C$ 22.00 NAV $18.77Projected Return: 33.2% YR-END: Dec 31 Reporting currency: CDN
Market Statistics Investment Thesis Share Price C$ 16.52 Shares Basic (mln) 395.8- Vertically integrated / diverse revenue streams (production, conversion, uranium trading) 52 Week High 21.44 Shares Fully Diluted (mln) 402.6
- Exceptional exploration potential in the Athabasca Basin of Northern Saskatchewan 52 Week Low 14.56 Adj. Shares used in NAV calc (mln) 402.6- Strong North American asset base with low sovereign risk Market Cap. (mln) 6,538 Avg Daily Volume: 1,121,940- Decades of low operating cost production potential with world's largest high-grade resources/reserves Enterprise Value (mln) 7,918 Annualized Dividend $0.40- Only uranium equity with over $1bln market capitalization and pays a 2.4% dividend Div Yield % 2.42%Key Attributes:- One of world's largest uranium producers Financial Metrics 2013A 2014A 2015A 2016E 2017E
- Controlling interest in the mammoth Cigar Lake and McArthur River uranium mines Cash ($ mln) 229.1 566.6 458.6 602.3 923.7
- Cigar Lake recent performance suggests majority of technical risk hurdle is behind the company Working capital ($ mln) 1053.3 1551.9 1512.3 1610.5 1759.7
- Owns the Port Hope UF6 Conversion facility - 1 of 4 in the western world Current ratio (x) 2.5 4.0 3.3 3.2 3.0
Key Concerns LT Debt ($ mln) 1293.4 1491.2 1492.2 1379.7 1267.2
- Cost control and operational risk at McArthur and particularly Cigar, which comrpises 95% of growth Common Equity (mln) 5348.3 5443.6 5547.0 5934.0 6450.2- Zero take-out potential due to Canadian legislation Price/book (x) 0.81 0.77 0.74 0.72 0.67- While LT contracts are in place, the stock is sensitive to the uranium price - an opaque, illiquid market LTD/(LTD + Equity) 19.5% 21.5% 21.2% 18.9% 16.4%- On-going litigation with CRA over transfer pricing arrangement ROE 8% 8% 6% 9% 10%
ROIC 6% 5% 4% 6% 7%Reserve & Resource Interest Tonnes Grade U3O8 CCO'sProven & Probable Reserves (%) ('000) (% U3O8) (Mlbs) (Mlbs) Earnings/Cash Flow 2013A 2014A 2015A 2016E 2017E
McArthur River 70% 1,395 10.94% 336.5 234.9 RJ Uranium Forecast US$/lb 38.53 33.00 36.83 38.00 50.00Cigar Lake 50% 602 16.70% 221.6 110.9 Revenue ($mln) 2438.7 2397.5 2754.4 2966.4 3349.4Crow Butte 100% 413 0.08% 0.7 0.7 EBITDA ($mln) 700.4 613.4 558.4 888.8 1121.1Inkai 58% 51,616 0.07% 75.0 43.2 EBITDA margin 29% 26% 20% 30% 33%North Butte/Brown Ranch 100% 1,018 0.08% 1.9 1.9 EV/EBITDA (x) 11.3 12.9 14.2 8.9 7.1Rabbit Lake 100% 914 0.59% 11.9 11.9 EBIT ($mln) 417.6 274.4 245.9 590.9 846.5Smith Ranch-Highland 100% 2,999 0.10% 6.3 6.3 Adj. Net earnings ($mln) 445.3 431.2 344.3 545.3 674.4Key Lake 83% 61 0.52% 0.7 0.6 Adj. EPS ($/sh) 1.13 1.09 0.87 1.38 1.70
59,017 0.50% 654.6 410.3 P/E (x) 14.7 15.2 18.9 12.0 9.7Measured & Indicated Resource ('000) (% U3O8) (Mlbs) (Mlbs) Operating Cash Flow ($mln) 529.9 480.2 450.0 753.8 986.1
McArthur River 70% 67 3.80% 5.6 3.9 CFPS ($/sh) 1.69 1.48 1.32 1.90 2.49Cigar Lake 50% 20 7.41% 3.3 1.7 P/CF (x) 9.8 11.2 12.5 8.7 6.6Crow Butte 100% 2,773 0.25% 15.2 15.2 Capex ($mln) -645.7 -480.1 -358.6 -339.3 -394.0Gas Hills - Peach 100% 4,313 0.14% 13.3 13.3Smith Ranch-Highland 100% 15,580 0.06% 19.8 19.8 Valuation C$ mln $/share % of Total AssetsInkai 58% 31,366 0.08% 52.6 30.3 McArthur River (DCF 8%) - 70% 3,917 9.73 52%Millennium 70% 1,443 2.39% 75.9 53.1 Cigar Lake (DCF 8%) - 50% 2,340 5.81 31%North Butte/Brown Ranch 100% 5,763 0.07% 8.8 8.8 JV Inkai (DCF 8%) - 60% 1,395 3.47 18%Phoenix 30% 166 19.14% 70.2 21.1 Rabbit Lake (DCF 8%) - 100% 171 0.42 2%Rabbit Lake 100% 1,403 0.86% 26.7 26.7 US ISR (DCF 8%) - 100% 239 0.59 3%Ruby Ranch 100% 2,215 0.08% 4.1 4.1 Development Projects ($/lb) 463 1.15 6%Shirley Basin 100% 1,727 0.12% 4.4 4.4 Exploration & Invstm Assets 991 2.46 13%
107,558 0.21% 498.6 377.2 Uranium Purchase Program 93 0.23 1%Fuel Services (DCF 8%) 209 0.52 3%
Inferred Resources 62% 268,600 0.10% 612.9 380.6 Nukem (DCF 8%) 108 0.27 1%9,926 24.66 131%
Global Resources 66% 435,175 0.18% 1,766.1 1,168.2Working Capital (1Q16E) 1,498 3.72 19.8%
Options & Warrants 153 0.38 2.0%LT Liabilities (1,837) (4.56) -24.3%SG&A + CRA Risk (2,184) (5.43) -28.9%
Future Equity Dilution 0 0.00 0.0%NAV 7,556 18.77 100.0%
Note: Resources do not include ReservesSource: Cameco Corp., Raymond James Ltd. Dec.31, 2015 Implied Target Current
Valuation Measures Multiple MultipleOperating Summary 2013A 2014A 2015A 2016E 2017E Price/NAVPS (x) 1.1x 0.9xU3O8 (mln lb) 23.6 23.3 28.4 30.4 31.1 Price/2017E CFPS (x) 9x 7xCosts per lb Sold (C$/lb; incl D&A) $33.0 $34.6 $38.8 $40.6 $39.8 EV/Prodn U3O8 $336 $340 $279 $260 $255 Target Price C$:
Cameco Corporation
3-Apr-16
NAV Exposure by Country 2015 Revenue Per Business Segment
C$ 22.00
68%
20%
12%
Uranium Nukem Fuel
77%
14%
3% 1%5%
CAN KAZ US GER AUS
05101520253035404550
0
5
10
15
20
25
30
35
40
2012A 2013A 2014A 2015A 2016E 2017E 2018E 2019E 2020E
C1
& C
OG
S (C
$/l
b)
Ura
niu
m P
rod
uct
ion
(M
lbs)
Crow Butte Smith Ranch-Highland JV InkaiRabbit Lake Cigar Lake McArthur RiverTotal COGS incl D&A C1 Cash Costs

Mining & Natural Resources Canada Research | Page 7 of 15
Raymond James Ltd. | 2100 – 925 West Georgia Street | Vancouver BC Canada V6C 3L2
Exhibit 3: Financial and Operational Snapshot for NexGen Energy Ltd.
Source: Raymond James Ltd., NexGen Energy Ltd., Capital IQ, UxC
RAYMOND JAMES LTD. RESEARCH Analyst: David Sadowski 604 659 8255
Rating: Strong Buy 1 NXE-V [email protected] Mth Target C$ 2.50 NAV $4.47 Reporting currency: CDN 4-Apr-16Projected Return: 29.5% YR-END: Dec 31 Market Statistics
Share Price C$ 1.93 Shares Basic (mln) 286.9Investment Thesis 52 Week High/Low C$1.55 / 0.40 Shares Diluted (mln) 333.9- 100% owner of the Rook 1 project in the western Athabasca Basin of northern Saskatchewan Market Cap. (mln) $554 Adj. Shares used in NAV calc (mln) 372.7- Arrow: steeply-dipping high-grade uranium lenses in stable, water-impermeable basement rocks Enterprise Value (mln) $538 Avg Daily Volume: 1,761,050- Strong balance sheet, low geopolitical risk, and high takeout potential Total model'd lbs in DCF (mln) n/a Dividend $0.00Key Attributes:- Maiden 43-101 Inferred resource out Mar-2016 totals a mammoth 202 Mlbs grading 2.63% U3O8 Financial Metrics 2014A 2015A 2016E 2017E 2018E- High-grade core - at 10% cut-off grade, resources are 101 Mlbs grading 20.8% U3O8 Cash ($mln) 13.8 34.3 15.6 10.0 10.0- Big growth potential: mineralized hit rate is exceptional, zone appears wide open particularly to SW Working capital 12.4 33.8 15.1 9.5 9.5- Athabasca Basin is the premier uranium jurisdiction globally, and is in foreign buyers' crosshairs Current ratio (x) 8.1 34.8 16.1 10.5 10.5
- Arrow is an Eagle Point lookalike. Eagle has >150 Mlbs in historic prod'n & remaining resources LT Debt 0.0 0.0 0.0 0.0 0.0
Key Concerns Common Equity 55.1 100.2 106.4 135.9 160.9- Weaker infrastructure on the west side of the Athabasca Basin and project at an early stage Price/book (x) 4.7 5.5 5.4 4.6 4.2
- Risks inherent to uranium - a somewhat opaque, illiquid market LTD/(LTD + Equity) 0.0% 0.0% 0.0% 0.0% 0.0%ROE -15% -5% -5% -4% -3%
Share Structure Shares Avg Price Avg Expiry Value Included ROIC -15% -5% -5% -4% -3%Common Shares 286,884,616
Options 27,124,446 $0.48 11-Sep-19 $12,946,511 yes Earnings/Cash Flow 2014A 2015A 2016E 2017E 2018EWarrants 19,918,592 $0.59 27-Jul-16 $11,844,288 yes RJL Uranium Forecast (US$/lb) 33.00 36.83 38.00 50.00 60.00
Fully Diluted 333,927,654 $24,790,798 Revenue (C$mln) 0.0 0.0 0.0 0.0 0.0EBITDA (C$mln) -3.4 -4.8 -4.9 -4.9 -4.9
Reserves & Resources Profile EBITDA margin 0.0 0.0 0.0 0.0 0.0Rook 1 - Arrow - 43-101 Inferred Resources Tonnage Grade U3O8 NXE's EV/EBITDA (x) nm nm nm nm nmat 0.25% headline cut-off grade (Mt) (% U3O8) (Mlbs) (Mlbs) EBIT (C$mln) -3.5 -5.0 -4.9 -4.9 -4.9A1 0.38 0.50% 4.2 4.2 Net earnings (C$mln) -8.4 -4.6 -4.9 -4.9 -4.9A2 1.48 0.85% 27.6 27.6 EPS (C$) -0.06 -0.02 -0.02 -0.01 -0.01A2 High-grade 0.41 13.33% 120.5 120.5 P/E (x) nm nm nm nm nmA3 1.13 1.90% 47.3 47.3 Operating Cash Flow (C$mln) -2.0 -2.7 -2.8 -2.8 -2.8A4 0.08 1.30% 2.3 2.3 CFPS (C$) -0.01 -0.01 -0.01 -0.01 -0.01Total 3.48 2.63% 201.9 201.9 P/CF (x) nm nm nm nm nm
Exploration Expense (C$mln) -12.1 -22.3 -25.0 -35.0 -25.0Resources at 1% U3O8 Cut-off 1.49 5% 178.3 178.3Resources at 10% U3O8 Cut-off 0.22 21% 101.3 101.3 Unfunded Valuation C$mln C$/share % of NAV Multiple Adj. $/sh
MinesiteUS$EV/lb Current 43-101 Uranium Resources of 202 Mlbs 2.00 Rook 1 - 100% (DCF; NPV[8%]) $2,334 $6.26 140.0% 0.4x $2.32US$EV/lb Notional RJL 6-12 Months Resource Target of 250 Mlbs 1.61 Rook 1 - 100% (US$2.5/lb x 250 Mlbs) $856 $2.30 51.4% 1.0x $2.30
50%/50% Weighted DCF & In-situ Value $1,595 $4.28 95.7% $2.31Other Assets (notional) $10 $0.03 0.6% 1.0x $0.03
$1,605 $4.31 96.3% $2.33FinancialWorking Capital (4Q16E) $15 $0.04 0.9% 1.0x $0.04Options/warrants (4Q16E) $16 $0.04 0.9% 1.0x $0.04Future Equity (issues to 2018E, $1.40/sh) $54 $0.15 3.3% 1.0x $0.15SG&A, Other Corp. Adj. (5-year NPV, 8%) -$23 ($0.06) -1.4% 1.0x ($0.06)NAV (and NAV/diluted sh) $1,667 $4.47 100.0% 55.9% $2.50
Implied Target CurrentValuation Measures Multiple MultiplePrice/ NAVPS (x) 0.6x 0.4xTarget Price C$: C$ 2.50
Top HoldersShares %~37,000,000 13%28,400,000 10%19,376,265 7%15,277,029 5%14,946,800 5%~10,545,783 4%10,000,000 3%10,000,000 3%5,305,200 2%5,197,300 2%130,836,239 100%
Source: Capital IQ, Thomson ONE, Bloomberg, NexGen
NexGen Energy Ltd.
Optionors
Rosseau
Mega Uranium
Tigers Realm
1832 AM
Global X
Mgmt, directors and advisory
BlackRock
BMO
RBC
Others
Rook 1 Value per Diluted Share (C$/sh) US$EV/lb$0.50 $1.00 $2.00 $2.25 $2.50 $2.75 $3.00 $3.25 $3.50
200 0.41 0.82 1.64 1.85 2.05 2.26 2.46 2.67 2.87225 0.46 0.92 1.85 2.08 2.31 2.54 2.77 3.00 3.23
250 0.51 1.03 2.05 2.31 2.56 2.82 3.08 3.33 3.59
275 0.56 1.13 2.26 2.54 2.82 3.10 3.38 3.67 3.95
300 0.62 1.23 2.46 2.77 3.08 3.38 3.69 4.00 4.31
325 0.67 1.33 2.67 3.00 3.33 3.67 4.00 4.33 4.67
350 0.72 1.44 2.87 3.23 3.59 3.95 4.31 4.67 5.03Targ
et R
ook
1 R
es.
(M
lbs
U3O
8)
Rook 1 Production & Consolidated Cost Profile
Rook 1 Production Schedule
2024E 2025E 2026E 2027E 2028E 2029E 2030E 2031E 2032E
$0
$15
$30
$45
$60
0.0
5.0
10.0
15.0
20.0
Per P
ound
Cos
ts
(US$
/lb)
Prod
ucti
on (M
lbs)
Production (Mlbs U3O8) Cash Cost (US$/lb) Royalties (US$/lb)Sustaining Capital (US$/lb) Tax (US$/lb) Corporate G&A (US$/lb)
RJL Uranium Price
0%
1%
2%
3%
4%
0.0
5.0
10.0
15.0
20.0
2024E 2025E 2026E 2027E 2028E 2029E 2030E 2031E 2032E
Grad
e (%
U3O
8)
Prod
ucti
on (M
lbs)
A2 High-Grade A2 A3 Milled Head Grade (%U3O8)

Canada Research | Page 8 of 15 Mining & Natural Resources
Raymond James Ltd. | 2100 – 925 West Georgia Street | Vancouver BC Canada V6C 3L2
Uranium
Cameco Corporation CCO-TSX
Rating: Outperform Suitability: High Risk/Growth
Current Price (Apr-03-16) C$16.52 Target Price (6-12 mos) Old: C$25.00 New: C$22.00 52-Week Range C$21.44 - C$14.56 Total Return to Target 33% Market Capitalization (mln) C$6,539 Dividend/Yield C$0.40/2.4% Shares Outstanding (mln, basic) 395.8 Current Net Debt (mln) C$1,380 10 Day Avg Daily Volume (000s) 875 Enterprise Value (mln) C$7,918 Total Resource (Mlbs) 1,168.20 Shares Outstanding (mln, f.d.) 402.6
Cash 1Q 2Q 3Q 4Q Full Revenue NAVPS P/CFPS P/NAV Flow/Share Mar Jun Sep Dec Year (mln)
2015A C$0.04 C$0.27 C$0.34 C$0.67 C$1.32 C$2,754 12.5x Old 2016E 0.44 0.48 0.50 0.73 2.14 3,111 22.02
New 2016E 0.39 0.41 0.44 0.67 1.90 2,966 18.77 8.7x 0.9x Old 2017E 0.00 0.00 0.00 0.00 2.78 3,548 NA
New 2017E 0.00 0.00 0.00 0.00 2.49 3,349 NA 6.6x NA
EPS Working Capex Uranium Production Unit Capital (mln) (mln) Price
(US$/lb) (Mlbs) Costs (C$/lb;
incl D&A)
2015A C$0.87 C$1,512.3 C$(358.6) US$37.00 28.4 C$38.8 Old 2016E 1.49 1,708.6 (341.9) 38.00 30.0 43.3
New 2016E 1.38 1,610.5 (339.3) 38.00 30.4 40.6 Old 2017E 1.78 2,008.5 (361.0) 50.00 31.2 43.6
New 2017E 1.70 1,759.7 (394.0) 50.00 31.1 39.9
Source: Raymond James Ltd., Thomson One
NexGen Energy Ltd. NXE-TSXV
Rating: Strong Buy Suitability: High Risk/Speculation Current Price (Apr-03-16) C$1.93 Target Price (6-12 mos) C$2.50 52-Week Range C$2.00 - C$0.48 Total Return to Target 30% Market Capitalization (mln) C$379 Dividend/Yield C$0.00/0.0% Shares Outstanding (mln, basic) 286.9 Current Net Debt (mln) -C$16 10 Day Avg Daily Volume (000s) 1,854 Enterprise Value (mln) C$363 Shares Outstanding (mln, f.d.) 333.9 Attributable RJL Target Resource (Mlbs U3O8)
250
EPS 1Q 2Q 3Q 4Q Full Revenues NAV P/E P/NAV Mar Jun Sep Dec Year (mln)
2015A C$0.00 C$(0.01) C$0.00 C$(0.01) C$(0.02) C$0 NM Old 2016E 0.00 0.00 0.00 0.00 (0.02) 0 4.47
New 2016E 0.00 0.00 0.00 0.00 (0.02) 0 4.47 NM 0.4x Old 2017E NA NA NA NA (0.01) 0 NA
New 2017E NA NA NA NA (0.01) 0 NA NM NA
CFPS Cash Uranium Exploration Total Production and
Equivalents (C$ mln)
Price (US$/lb)
Expense (C$ mln)
Debt (C$ mln)
(Mlbs U308)
2015A C$(0.01) C$34.3 US$37.00 C$(22.3) C$0.0 0 Old 2016E (0.01) 15.6 38.00 (25.0) 0.0 0
New 2016E (0.01) 15.6 38.00 (25.0) 0.0 0 Old 2017E (0.01) 10.0 50.00 (35.0) 0.0 0
New 2017E (0.01) 10.0 50.00 (35.0) 0.0 0
Source: Raymond James Ltd., Thomson One

Mining & Natural Resources Canada Research | Page 9 of 15
Raymond James Ltd. | 2100 – 925 West Georgia Street | Vancouver BC Canada V6C 3L2
Company Citations
Company Name Ticker Exchange Currency Closing Price RJ Rating RJ Entity
Denison Mines Corp. DML TSX C$ 0.73 2 RJ Ltd. Fission Uranium Corp. FCU TSX C$ 0.67 2 RJ Ltd. UEX Corp. UEX TSX C$ 0.22 2 RJ Ltd.
Notes: Prices are as of the most recent close on the indicated exchange and may not be in US$. See Disclosure section for rating definitions. Stocks that do not trade on a U.S. national exchange may not be registered for sale in all U.S. states. NC=not covered.

Canada Research | Page 10 of 15 Mining & Natural Resources
Raymond James Ltd. | 2100 – 925 West Georgia Street | Vancouver BC Canada V6C 3L2
IMPORTANT INVESTOR DISCLOSURES Raymond James & Associates (RJA) is a FINRA member firm and is responsible for the preparation and distribution of research created in the United States. Raymond James & Associates is located at The Raymond James Financial Center, 880 Carillon Parkway, St. Petersburg, FL 33716, (727) 567-1000. Non-U.S. affiliates, which are not FINRA member firms, include the following entities which are responsible for the creation and distribution of research in their respective areas; In Canada, Raymond James Ltd. (RJL), Suite 2100, 925 West Georgia Street, Vancouver, BC V6C 3L2, (604) 659-8200; In Latin America, Raymond James Argentina S.A., San Martin 344, 22nd Floor, Buenos Aires, C10004AAH, Argentina, +54 11 4850 2500; In Europe, Raymond James Euro Equities, SAS, 40, rue La Boetie, 75008, Paris, France, +33 1 45 61 64 90, and Raymond James Financial International Ltd., Broadwalk House, 5 Appold Street, London, England EC2A 2AG, +44 203 798 5600.
This document is not directed to, or intended for distribution to or use by, any person or entity that is a citizen or resident of or located in any locality, state, country, or other jurisdiction where such distribution, publication, availability or use would be contrary to law or regulation. The securities discussed in this document may not be eligible for sale in some jurisdictions. This research is not an offer to sell or the solicitation of an offer to buy any security in any jurisdiction where such an offer or solicitation would be illegal. It does not constitute a personal recommendation nor does it take into account the particular investment objectives, financial situations, or needs of individual clients. Information in this report should not be construed as advice designed to meet the individual objectives of any particular investor. Investors should consider this report as only a single factor in making their investment decision. Consultation with your investment advisor is recommended. Past performance is not a guide to future performance, future returns are not guaranteed, and a loss of original capital may occur.
The information provided is as of the date above and subject to change, and it should not be deemed a recommendation to buy or sell any security. Certain information has been obtained from third-party sources we consider reliable, but we do not guarantee that such information is accurate or complete. Persons within the Raymond James family of companies may have information that is not available to the contributors of the information contained in this publication. Raymond James, including affiliates and employees, may execute transactions in the securities listed in this publication that may not be consistent with the ratings appearing in this publication.
With respect to materials prepared by Raymond James Ltd. (“RJL”), all expressions of opinion reflect the judgment of the Research Department of RJL, or its affiliates, at this date and are subject to change. RJL may perform investment banking or other services for, or solicit investment banking business from, any company mentioned in this document.
All Raymond James Ltd. research reports are distributed electronically and are available to clients at the same time via the firm’s website (http://www.raymondjames.ca). Immediately upon being posted to the firm’s website, the research reports are then distributed electronically to clients via email upon request and to clients with access to Bloomberg (home page: RJLC), Capital IQ and Thomson Reuters. Selected research reports are also printed and mailed at the same time to clients upon request. Requests for Raymond James Ltd. research may be made by contacting Raymond James Ltd. during market hours at (604) 659‐8000.
In the event that this is a compendium report (i.e., covers 6 or more subject companies), Raymond James Ltd. may choose to provide specific disclosures for the subject companies by reference. To access these disclosures, clients should refer to: http://www.raymondjames.ca (click on Equity Capital Markets / Equity Research / Research Disclosures) or call toll‐free at 1‐800‐667‐2899.
ANALYST INFORMATION
Analyst Compensation: Equity research analysts and associates at Raymond James are compensated on a salary and bonus system. Several factors enter into the compensation determination for an analyst, including i) research quality and overall productivity, including success in rating stocks on an absolute basis and relative to the local exchange composite Index and/or a sector index, ii) recognition from institutional investors, iii) support effectiveness to the institutional and retail sales forces and traders, iv) commissions generated in stocks under coverage that are attributable to the analyst’s efforts, v) net revenues of the overall Equity Capital Markets Group, and vi) compensation levels for analysts at competing investment dealers.
Analyst Stock Holdings: Effective September 2002, Raymond James equity research analysts and associates or members of their households are forbidden from investing in securities of companies covered by them. Analysts and associates are permitted to hold long positions in the securities of companies they cover which were in place prior to September 2002 but are only permitted to sell those positions five days after the rating has been lowered to Underperform.

Mining & Natural Resources Canada Research | Page 11 of 15
Raymond James Ltd. | 2100 – 925 West Georgia Street | Vancouver BC Canada V6C 3L2
The views expressed in this report accurately reflect the personal views of the analyst(s) covering the subject securities. No part of said person's compensation was, is, or will be directly or indirectly related to the specific recommendations or views contained in this research report. In addition, said analyst has not received compensation from any subject company in the last 12 months.
RATINGS AND DEFINITIONS
Raymond James Ltd. (Canada) definitions: Strong Buy (SB1) The stock is expected to appreciate and produce a total return of at least 15% and outperform the S&P/TSX Composite Index over the next six months. Outperform (MO2) The stock is expected to appreciate and outperform the S&P/TSX Composite Index over the next twelve months. Market Perform (MP3) The stock is expected to perform generally in line with the S&P/TSX Composite Index over the next twelve months and is potentially a source of funds for more highly rated securities. Underperform (MU4) The stock is expected to underperform the S&P/TSX Composite Index or its sector over the next six to twelve months and should be sold.
Raymond James & Associates (U.S.) definitions: Strong Buy (SB1) Expected to appreciate, produce a total return of at least 15%, and outperform the S&P 500 over the next six to 12 months. For higher yielding and more conservative equities, such as REITs and certain MLPs, a total return of at least 15% is expected to be realized over the next 12 months. Outperform (MO2) Expected to appreciate and outperform the S&P 500 over the next 12-18 months. For higher yielding and more conservative equities, such as REITs and certain MLPs, an Outperform rating is used for securities where we are comfortable with the relative safety of the dividend and expect a total return modestly exceeding the dividend yield over the next 12-18 months. Market Perform (MP3) Expected to perform generally in line with the S&P 500 over the next 12 months. Underperform (MU4) Expected to underperform the S&P 500 or its sector over the next six to 12 months and should be sold. Suspended (S) The rating and price target have been suspended temporarily. This action may be due to market events that made coverage impracticable, or to comply with applicable regulations or firm policies in certain circumstances, including when Raymond James may be providing investment banking services to the company. The previous rating and price target are no longer in effect for this security and should not be relied upon.
Raymond James Argentina S.A. rating definitions: Strong Buy (SB1) Expected to appreciate and produce a total return of at least 25.0% over the next twelve months. Outperform (MO2) Expected to appreciate and produce a total return of between 15.0% and 25.0% over the next twelve months. Market Perform (MP3) Expected to perform in line with the underlying country index. Underperform (MU4) Expected to underperform the underlying country index. Suspended (S) The rating and price target have been suspended temporarily. This action may be due to market events that made coverage impracticable, or to comply with applicable regulations or firm policies in certain circumstances, including when Raymond James may be providing investment banking services to the company. The previous rating and price target are no longer in effect for this security and should not be relied upon.
Raymond James Europe (Raymond James Euro Equities SAS & Raymond James Financial International Limited) rating definitions: Strong Buy (1) Expected to appreciate, produce a total return of at least 15%, and outperform the Stoxx 600 over the next 6 to 12 months. Outperform (2) Expected to appreciate and outperform the Stoxx 600 over the next 12 months. Market Perform (3) Expected to perform generally in line with the Stoxx 600 over the next 12 months. Underperform (4) Expected to underperform the Stoxx 600 or its sector over the next 6 to 12 months. Suspended (S) The rating and target price have been suspended temporarily. This action may be due to market events that made coverage impracticable, or to comply with applicable regulations or firm policies in certain circumstances, including when Raymond James may be providing investment banking services to the company. The previous rating and target price are no longer in effect for this security and should not be relied upon.
In transacting in any security, investors should be aware that other securities in the Raymond James research coverage universe might carry a higher or lower rating. Investors should feel free to contact their Financial Advisor to discuss the merits of other available investments.
Suitability Ratings (SR)
Medium Risk/Income (M/INC) Lower to average risk equities of companies with sound financials, consistent earnings, and dividend yields above that of the S&P 500. Many securities in this category are structured with a focus on providing a consistent dividend or return of capital.
Medium Risk/Growth (M/GRW) Lower to average risk equities of companies with sound financials, consistent earnings growth, the potential for long-term price appreciation, a potential dividend yield, and/or share repurchase program.
High Risk/Income (H/INC) Medium to higher risk equities of companies that are structured with a focus on providing a meaningful dividend but may face less predictable earnings (or losses), more leveraged balance sheets, rapidly changing market dynamics, financial and competitive issues, higher price volatility (beta), and potential risk of principal. Securities of companies in this category may have a less predictable income stream from dividends or distributions of capital.
High Risk/Growth (H/GRW) Medium to higher risk equities of companies in fast growing and competitive industries, with less predictable earnings (or losses), more leveraged balance sheets, rapidly changing market dynamics, financial or legal issues, higher price volatility (beta), and potential risk of principal.
High Risk/Speculation (H/SPEC) High risk equities of companies with a short or unprofitable operating history, limited or less predictable revenues, very high risk associated with success, significant financial or legal issues, or a substantial risk/loss of principal.

Canada Research | Page 12 of 15 Mining & Natural Resources
Raymond James Ltd. | 2100 – 925 West Georgia Street | Vancouver BC Canada V6C 3L2
RATING DISTRIBUTIONS
Coverage Universe Rating Distribution* Investment Banking Distribution
RJL RJA RJ Arg RJEE/RJFI RJL RJA RJ Arg RJEE/RJFI
Strong Buy and Outperform (Buy) 67% 57% 53% 47% 41% 19% 0% 0%
Market Perform (Hold) 32% 38% 47% 39% 13% 5% 0% 0%
Underperform (Sell) 2% 5% 0% 14% 0% 7% 0% 0%
* Columns may not add to 100% due to rounding.
RAYMOND JAMES RELATIONSHIP DISCLOSURES
Raymond James Ltd. or its affiliates expects to receive or intends to seek compensation for investment banking services from all companies under research coverage within the next three months.
Company Name Disclosure
Cameco Corporation Raymond James Ltd - the analyst and/or associate has viewed the material operations of Cameco Corporation.
Raymond James Ltd - within the last 12 months, Cameco Corporation has paid for all or a material portion of the travel costs associated with a site visit by the analyst and/or associate.
NexGen Energy Ltd. Raymond James Ltd - the analyst and/or associate has viewed the material operations of NexGen Energy Ltd..
Raymond James Ltd - within the last 12 months, NexGen Energy Ltd. has paid for all or a material portion of the travel costs associated with a site visit by the analyst and/or associate.
Raymond James Ltd. has managed or co-managed a public offering of securities within the last 12 months with respect to NexGen Energy Ltd..
Raymond James Ltd. has provided investment banking services within the last 12 months with respect to NexGen Energy Ltd..
Raymond James Ltd. has received compensation for investment banking services within the last 12 months with respect to NexGen Energy Ltd..
STOCK CHARTS, TARGET PRICES, AND VALUATION METHODOLOGIES
Valuation Methodology: The Raymond James methodology for assigning ratings and target prices includes a number of qualitative and quantitative factors including an assessment of industry size, structure, business trends and overall attractiveness; management effectiveness; competition; visibility; financial condition, and expected total return, among other factors. These factors are subject to change depending on overall economic conditions or industry- or company-specific occurrences.
Target Prices: The information below indicates target price and rating changes for the subject companies included in this research.

Mining & Natural Resources Canada Research | Page 13 of 15
Raymond James Ltd. | 2100 – 925 West Georgia Street | Vancouver BC Canada V6C 3L2
Valuation Methodology: We value Cameco Corp. on a comparative basis by applying a blended 50/50 average of historic P/NAV and P/CF to our company NAVPS estimate and future cash flow projection, respectively.
Valuation Methodology: We value NexGen Energy Ltd. on a sum-of-the-parts NAV basis, which is primarily based on our notional estimate for contained metal at Rook 1, to which we ascribe a multiple that is based on: (i) current peer trading levels and (ii) takeout valuations on recent, high-grade, Canadian uranium assets (i.e. comparables).
RISK FACTORS
General Risk Factors: Following are some general risk factors that pertain to the businesses of the subject companies and the projected target prices and recommendations included on Raymond James research: (1) Industry fundamentals with respect to customer demand or product / service pricing could change and adversely impact expected revenues and earnings; (2) Issues relating to major competitors or market shares or new product expectations could change investor attitudes toward the sector or this stock; (3) Unforeseen developments with respect to the management, financial condition or accounting policies or practices could alter the prospective valuation.

Canada Research | Page 14 of 15 Mining & Natural Resources
Raymond James Ltd. | 2100 – 925 West Georgia Street | Vancouver BC Canada V6C 3L2
Risks - Cameco Corporation i) A decline in the price of gold affects the equity resource market independent of commodity; as such, Cameco may be at risk of not being able to fund future exploration or development if gold prices decline; ii) uranium is a highly regulated business and therefore requires long lead times in order to permit projects; Cameco is at risk of being delayed on future development of current or future projects; iii) continued escalation of mining-related capital costs may reduce profitability; iv) uncertainty surrounding the long-term uranium supply-demand framework and resulting price levels.
Risks - NexGen Energy Ltd. General risks experienced by mining companies. The operation of mines, mills and exploration projects is complex and is exposed to a number of risks, many of which are beyond the company’s control, including regulatory or environmental compliance issues; personal accidents; metallurgical/other processing problems; unexpected rock formations; ground or slope failures; flooding or fires; earthquakes; rock bursts; equipment failures; consultant errors and, interruption due to inclement, weather conditions, road closures, and/or local protests. Decline in the Price of Uranium. A drop in the price of uranium could cause investors and creditors to become disenchanted with uranium equities and would have a negative impact on our valuation models. Risks to our uranium price forecasts include, but are not limited to, industry sentiment, lower-than-expected demand most critically in Asia, North America, and Western Europe or higher-than-expected supply, for example increased dispositions by the US Department of Energy or state-owned mining companies that do not prioritize economic returns over strategic sources of supply. Resource Risk. The company currently does not have published 43-101 - compliant reserves or resources at its flagship property. Our models are based on RJL estimated resource and notional resource upside. These estimates contain uncertainties and assumptions of size, continuity to mineralization, etc. The actual data for grade, tonnage and dilution may be different than modeled, affecting the results of our expectations and numbers used in potential future DCFs. Continuing cost pressures could also increase labour and materials, etc. changing the economics of projects. Project Risk. NexGen’s principle projects are currently in the exploration stage and may experience challenges with regard to obtaining adequate and timely financing, receiving the required permits for eventual construction and operation, equipment availability, metallurgical/processing problems, and/or productivity issues. Other risks that can arise include capital and operating cost inflation and for exploration companies, weaker-than-expected drill intervals, resource estimates (as above), economic studies and other poor results that may not be easily anticipated based on publically-available information or the subjective nature of the inputs used. Environmental/Regulatory Risks. NexGen focuses on uranium, which as a commodity has historically attracted more attention from environmental groups and governments than other metals. The industry is highly regulated in Canada and generally is safer and has less of an impact on the environment than other more lightly regulated industries. While positive, this also may result in high levels of scrutiny, either from Canada’s regulatory bodies, such as the Canadian Nuclear Safety Commission, or environmentalist groups, which could disrupt the day-to-day operations of the company. The above risks do not represent an exhaustive
Additional Risk and Disclosure information, as well as more information on the Raymond James rating system and suitability categories, is available for Raymond James at rjcapitalmarkets.com/Disclosures/index and for Raymond James Limited at www.raymondjames.ca/researchdisclosures.
INTERNATIONAL DISCLOSURES
FOR CLIENTS IN THE UNITED STATES:
Any foreign securities discussed in this report are generally not eligible for sale in the U.S. unless they are listed on a U.S. exchange. This report is being provided to you for informational purposes only and does not represent a solicitation for the purchase or sale of a security in any state where such a solicitation would be illegal. Investing in securities of issuers organized outside of the U.S., including ADRs, may entail certain risks. The securities of non-U.S. issuers may not be registered with, nor be subject to the reporting requirements of, the U.S. Securities and Exchange Commission. There may be limited information available on such securities. Investors who have received this report may be prohibited in certain states or other jurisdictions from purchasing the securities mentioned in this report. Please ask your Financial Advisor for additional details and to determine if a particular security is eligible for purchase in your state.
Raymond James Ltd. is not a U.S. broker‐dealer and therefore is not governed by U.S. laws, rules or regulations applicable to U.S. broker‐dealers. Consequently, the persons responsible for the content of this publication are not licensed in the U.S. as research analysts in accordance with applicable rules promulgated by the U.S. Self Regulatory Organizations.
Any U.S. Institutional Investor wishing to effect trades in any security should contact Raymond James (USA) Ltd., a U.S. broker‐dealer affiliate of Raymond James Ltd.
FOR CLIENTS IN THE UNITED KINGDOM:
For clients of Raymond James & Associates (London Branch) and Raymond James Financial International Limited (RJFI): This document and any investment to which this document relates is intended for the sole use of the persons to whom it is addressed, being persons who are Eligible Counterparties or Professional Clients as described in the FCA rules or persons described in Articles 19(5) (Investment professionals) or 49(2) (High net worth companies, unincorporated associations etc) of the Financial Services and Markets Act 2000 (Financial Promotion) Order 2005 (as amended) or any other person to whom this promotion may lawfully be directed. It is not intended

Mining & Natural Resources Canada Research | Page 15 of 15
Raymond James Ltd. | 2100 – 925 West Georgia Street | Vancouver BC Canada V6C 3L2
to be distributed or passed on, directly or indirectly, to any other class of persons and may not be relied upon by such persons and is therefore not intended for private individuals or those who would be classified as Retail Clients.
For clients of Raymond James Investment Services, Ltd.: This report is for the use of professional investment advisers and managers and is not intended for use by clients.
For purposes of the Financial Conduct Authority requirements, this research report is classified as independent with respect to conflict of interest management. RJA, RJFI, and Raymond James Investment Services, Ltd. are authorised and regulated by the Financial Conduct Authority in the United Kingdom.
FOR CLIENTS IN FRANCE:
This document and any investment to which this document relates is intended for the sole use of the persons to whom it is addressed, being persons who are Eligible Counterparties or Professional Clients as described in “Code Monétaire et Financier” and Règlement Général de l’Autorité des Marchés Financiers. It is not intended to be distributed or passed on, directly or indirectly, to any other class of persons and may not be relied upon by such persons and is therefore not intended for private individuals or those who would be classified as Retail Clients.
For clients of Raymond James Euro Equities: Raymond James Euro Equities is authorised and regulated by the Autorité de Contrôle Prudentiel et de Résolution and the Autorité des Marchés Financiers.
For institutional clients in the European Economic Area (EEA) outside of the United Kingdom: This document (and any attachments or exhibits hereto) is intended only for EEA institutional clients or others to whom it may lawfully be submitted.
Raymond James Euro Equities is a French Investment Services Provider authorized by the Autorité de contrôle prudentiel et de résolution and regulated by the Autorité de contrôle prudentiel et de résolution and the Autorité des Marchés Financiers. For non-European exchanges, Raymond James Euro Equities operates under the name Raymond James International.
Proprietary Rights Notice: By accepting a copy of this report, you acknowledge and agree as follows:
This report is provided to clients of Raymond James only for your personal, noncommercial use. Except as expressly authorized by Raymond James, you may not copy, reproduce, transmit, sell, display, distribute, publish, broadcast, circulate, modify, disseminate or commercially exploit the information contained in this report, in printed, electronic or any other form, in any manner, without the prior express written consent of Raymond James. You also agree not to use the information provided in this report for any unlawful purpose.
This report and its contents are the property of Raymond James and are protected by applicable copyright, trade secret or other intellectual property laws (of the United States and other countries). United States law, 17 U.S.C. Sec.501 et seq, provides for civil and criminal penalties for copyright infringement. No copyright claimed in incorporated U.S. government works.
Additional information is available upon request. This document may not be reprinted without permission.
RJL is a member of the Canadian Investor Protection Fund. ©2016 Raymond James Ltd.