Sub Level Stoping
100
Assessment of undergorund mining of Nussir copper deposit With special emphasize on cut-off and mining method Audun Mortveit Sletten Earth Sciences and Petroleum Engineering Supervisor: Steinar Løve Ellefmo, IGB Co-supervisor: Øystein Rushfeldt, Nussir ASA Per Smeberg, Nussir ASA Ola Eriksen, Nussir ASA Department of Geology and Mineral Resources Engineering Submission date: June 2012 Norwegian University of Science and Technology
-
Upload
alexis-saavedra -
Category
Documents
-
view
48 -
download
3
description
mineria
Transcript of Sub Level Stoping
Assessment of undergorund mining of Nussir copper depositWith special emphasize on cut-off and mining
method
Audun Mortveit Sletten
Earth Sciences and Petroleum Engineering
Supervisor: Steinar Løve Ellefmo, IGBCo-supervisor: Øystein Rushfeldt, Nussir ASA
Per Smeberg, Nussir ASAOla Eriksen, Nussir ASA
Department of Geology and Mineral Resources Engineering
Submission date: June 2012
Norwegian University of Science and Technology

Abstract
The narrow steeply dipping strata bound sediment hosted copper deposit, Nussir, located in
Kvalsund community, Finmark, Norway, have been subject to an assessment of underground
mining. Resources classified as Indicated, within a 0,9%Cu cut-off limit have been identified
as suitable for sublevel open stoping mining method, accessed by 590m long tunnel from
fjord, a 2000m haulage tunnel in footwall progressing westward along strike and two
individual ramps separated by 1280m along strike. Stopes are dimensioned 40m long and 3m
wide on average with 62m and 102m height, with two and three sublevel drifts respectively.
The stoping layout’s stability rely on 5m rib pillars, 8m sill pillars and yielding pillars in stope
centre, calculated from geotechnical data and empirical design methods. The retreating
mining method implies narrow ore mining practices, utilizing small mechanized equipment,
developing drifts along strike in two directions from ramp. Stopes are planned produced by
up-and-downward drilling of 20m holes carefully planned within the narrow mineralisation,
blasted carefully to avoid dilution from stope walls. Dilution causing head grade drop and
obtaining of available treatment capacity, must be expected and dealt with. Cable bolting of
the on average 60⁰ dipping hangwall from drifts, is necessary to avoid caving. Dillution,
estimated as dependent on mineralisation thickness, have been added to the stope resources
obtained by wireframe evaluation of block model in DataMine. A planned production
schedule of development tunnels and stoping, producing 3Mt in 6 years time, is the basis for a
financial model with 245million NOK in capital expenditures and 177NOK/tonne in mining
costs. The planned mining operation gives a Net Present value of 32million NOK. Project
value is considered highly sensitive to changes in copper price, mining costs and copper
grade.

II

III
Sammendrag
Den smale, steilstående og lagbundne kobberforekomsten Nussir, i Kvalsund kommune, i
Finnmark, har vært gjenstand for en vurdering av underjordsdrift. Ressurser klassifisert som
indikert, innenfor en cut-off grense på 0,9% Cu er valgt ut for skivepallbrytning. Adkomsten
sikres med en 590m lang tunnel fra fjorden i øst, en 2000m lang transportort i liggveggen som
går vestover langs strøket og to ramper med avstand 1280m langs strøket. Strossene er
dimensjonert med en lengde på 40m og bredde på 3m i gjennomsnitt. Høyden er 62m og
102m, med henholdsvis to og tre ortnivåer. Stabiliteten til strossene sikres med 5m
ribbepilarer, 8m horisontalpilarer og ettergivende pilarer i sentrum av hver strosse. Pilarene er
beregnet ut fra geotekniske data og empiriske designmetoder. Den smale malmen og valgt
brytningsmetode forutsetter at det tas i bruk metoder for smalmalmsbrytning; bruk av små,
smale maskiner, der orter drives langs strøket i to retninger fra rampen. Strossene er planlagt
produsert med langhullsboring både oppover og nedover med 20m hullengde. Hullene må
være nøyaktig boret innenfor den smale mineraliseringen og sprengt forsiktig for å unngå
gråbergsinnblanding inn i strossa fra veggene. Gråbergsinnblanding vil forårsake fortynning
av produserte gehalter og ta opp tilgjengelig produksjonskapasitet. Dette må forventes og
håndteres. Hengveggen som gjennomsnittlig faller 60⁰, må kabelboltes systematisk fra orter,
for å redusere innrasing. Gråbergsinnblanding, estimert som avhengig av mineraliseringens
tykkelse, har blitt lagt til tonnasjen og verdiene i hver strosse, ved hjelp av
wireframeevaluering av blokkmodellen i DataMine. Den planlagte produksjonsplanen med
oppfaring og strossing som produserer totalt 3 Mt i løpet av 6 år, er grunnlaget for en
økonomisk modell med 245 millioner NOK i kapitalkostnader og 177NOK/tonn i
driftskostnader. Den planlagte gruvedriften gir en netto nåverdi av 32million NOK.
Prosjektsverdi er ansett som svært følsom for endringer i kobberpris, driftskostnader og
kobbergehalt.

IV
V
Forord
Denne diplomoppgaven er avlagt ved NTNU masterstudiet i teknologi, som det så fint heter
etter at de byttet ut det klingende, men noe utdaterte begrepet sivilingeniørstudie. Sivilist er
jeg da fortsatt, men bergmand er vel egentlig mitt nye liv og virke, ettersom oppgaven du nå
holder, er avlagt ved institutt for geologi og bergteknikk.
Glad i stein? Ja det kan du trygt si, men helst en digital en, som jeg kan snurre, løfte, og endre
farge på med et tastetrykk! En stein som kan måles og veies, flyttes og dreies, på et blunk.
Forvaltning er stikkordet, og tegning er verktøyet. Alle steiner kan tegnes, gråstein og gull,
kalkstein og kull. Favoritten er derimot sedimentære kobberforekomster, som jeg liker å farge
lyseblå, som fargen på babyklær eller himmelen en vakker sommerdag. Tegnede steiner gir
uante muligheter! Et bilde av det ukjente, en form, et volum, et innhold med varierende
kobbergehalter som hjelper oss å bestemme hva vi skal gjøre med fjellet under oss.
Forvaltning av mineralske ressurser, på en bærekraftig måte, der man estimerer verdier, ikke
med silkehansker og pinsett, men med Krig! Ja, Krige var hans navn. Mannen fra Afrika som
statistisk beregnet hvor mye gull som lå i Witwatersrand til alles begeistring. Ja følelsene er
sterke blant dem som har mineralressurser tett på kroppen. Naboer klager sin store nød,
gruveslusker feller gledestårer når godene kan høstes etter strevet og geologene sperrer opp
øynene når nye kjerneprøver kommer rykende ferske opp fra undergrunnen. For det er dem
som veileder min tegning av steinene. Steinene som jeg planlegger å grave ut med bor,
emusjonsprengstoff, last og bær maskiner og lastebiler som farter rundt inni fjellet på jakt
etter malm. Steiner med mineraler over cut-off grensen, slik at det gir profitt å grave dem ut.
Gjennom strosser og orter, som jeg tegner inn i fjellet på min datamaskin!
Det har vært en ære å jobbe med Nussir forekomstens gruvedesign og bli tatt inn i varmen av
CEO Øystein Rushfeldt, Geolog Magne Martinsen, Gruveingeniørene Per Smeberg og Ola
Eriksen som har kommet med ideer og tanker. Også stor takk til smalmalmsspesialisten Pekka
Läppalainen og Jouni Hansen-Haug , sistnevnte som stolt viste meg rundt i Zinkgruvan’s
smale orter. Ikke minst takk til ekspertene på NTNU, Siv Krane Rodahl og Ida Berg som har
deltatt i gode faglige gruvediskusjoner. Og selvsagt veilederen min, Steinar Løve Ellefmo,
som annenhver uke dette året har fulgt opp arbeidet.
Audun Mortveit Sletten Trondheim 18.6.2012

VI
VII
Table of Contents
ABSTRACT ............................................................................................................................................................................... I
SAMMENDRAG .................................................................................................................................................................... III
FORORD ................................................................................................................................................................................. V
LIST OF FIGURES ............................................................................................................................................................... XI
LIST OF TABLES .............................................................................................................................................................. XIII
1. INTRODUCTION .......................................................................................................................................................... 1
1.1 About Nussir ................................................................................................................ 1
1.2 Current status ............................................................................................................... 2
1.3 Mining – a modifying factor ........................................................................................ 2
1.4 Description of this assignment .................................................................................... 3
2. PREVIOUS MINE DESIGN ASSESSMENTS ............................................................................................................ 5
3. GEOLOGY ..................................................................................................................................................................... 9
3.1 The Nussir deposit ....................................................................................................... 9
3.2 Geometric model ....................................................................................................... 10
3.3 Block model ............................................................................................................... 10
4. GEOTECHNICAL CONSIDERATIONS .................................................................................................................. 13
4.1 Background ................................................................................................................ 13
4.1.1 Empirical Design Methods ................................................................................. 13
4.1.2 Q-system ............................................................................................................. 16
4.2 Geotechnical data ...................................................................................................... 17
4.2.1 Drill ability ......................................................................................................... 17
4.2.2 Q values .............................................................................................................. 18
4.2.3 Rock strength ...................................................................................................... 19
4.2.4 Stress estimates .................................................................................................. 20
4.3 Stope design ............................................................................................................... 21
4.4 Dimensioning pillars .................................................................................................. 25
4.5 Stability of mine ........................................................................................................ 27
5. DILLUTION AND CUT-OFF ..................................................................................................................................... 29
5.1 Economic definition of ore ........................................................................................ 29
5.2 Economic Cut-off ...................................................................................................... 30
5.3 Dillution’s effect on grade ......................................................................................... 31
5.4 Dilution in narrow mining ......................................................................................... 32
5.5 Nussir dilution estimates ........................................................................................... 32
6. MINING METHODS ................................................................................................................................................... 35
6.1 Underground Mining methods ................................................................................... 35

VIII
6.1.1 Sublevel open stoping ........................................................................................ 35
6.1.2 Sublevel up-hole benching ................................................................................. 36
6.1.3 Cut and fill .......................................................................................................... 36
6.1.4 Narrow vein mining ........................................................................................... 37
6.2 Narrow mining case studies ....................................................................................... 37
6.2.1 Zinkgruvan research project ............................................................................... 38
6.2.2 Field visit to Zinkgruvan .................................................................................... 41
6.2.3 Viscaria mine ...................................................................................................... 43
6.3 Choosing mining method ........................................................................................... 45
7. NUSSIR MINE DESIGN.............................................................................................................................................. 47
7.1 Defining minable areas .............................................................................................. 47
7.2 Modelling stopes ........................................................................................................ 49
7.3 Mine descriptions ...................................................................................................... 50
7.3.1 Access tunnel ...................................................................................................... 50
7.3.2 Main haulage level ............................................................................................. 51
7.3.3 Drifts ................................................................................................................... 51
7.3.4 Ramps ................................................................................................................. 53
7.3.5 Slots .................................................................................................................... 53
7.3.6 Stoping ............................................................................................................... 54
7.3.7 Ore pass and waste pass ..................................................................................... 55
7.3.8 Cable bolting ...................................................................................................... 55
7.4 Mechanized equipment for narrow mining ............................................................... 56
7.4.1 Production drill rig ............................................................................................. 57
7.4.2 Bolting rigs ......................................................................................................... 58
7.4.3 Loader ................................................................................................................. 59
7.4.4 Haulage truck ..................................................................................................... 60
7.5 Schedule ..................................................................................................................... 61
8. FINANCIAL ANALYSIS............................................................................................................................................. 63
8.1 Costs .......................................................................................................................... 63
8.1.1 Unit costs ............................................................................................................ 63
8.1.2 Capital costs ....................................................................................................... 64
8.1.3 Treatment costs .................................................................................................. 64
8.1.4 Marketing cost .................................................................................................... 65
8.2 Cash Flow .................................................................................................................. 66
IX
8.3 Sensitivity analysis .................................................................................................... 67
9. DISCUSSION ................................................................................................................................................................ 69
9.1 How geology affects mine design ............................................................................. 69
9.2 Narrow ore mining practices ..................................................................................... 70
9.3 Resource to reserve definition ................................................................................... 71
10. CONCLUSION ............................................................................................................................................................. 73
11. FURTHER WORK ....................................................................................................................................................... 75
REFERENCES ....................................................................................................................................................................... 77

X

XI
List of figures
Figure 1General relationship between exploration results, mineral resources and ore reserves 3
Figure 2 Sub-level retreat (SLR) mining method proposed for exploiting Nussir's eastern part.
Golder 2009 ................................................................................................................................ 6
Figure 3 Mine design layout, SLOS with 50m subl.interval. and 300x350m stopes. (Smeberg,
et al., 2011) ................................................................................................................................. 7
Figure 4 Block model of Nussir showing Kriging estimated copper grades. (Wheeler, 2012) 11
Figure 5 Block model of Nussir divided in spatially sampled inferred resources (red) and
indicated resources (blue) being those within a grid of sample intersections not more than
250x250m. (Wheeler, 2012) ..................................................................................................... 12
Figure 6 Extended Mathews’ stability graph based on logistic regression .............................. 15
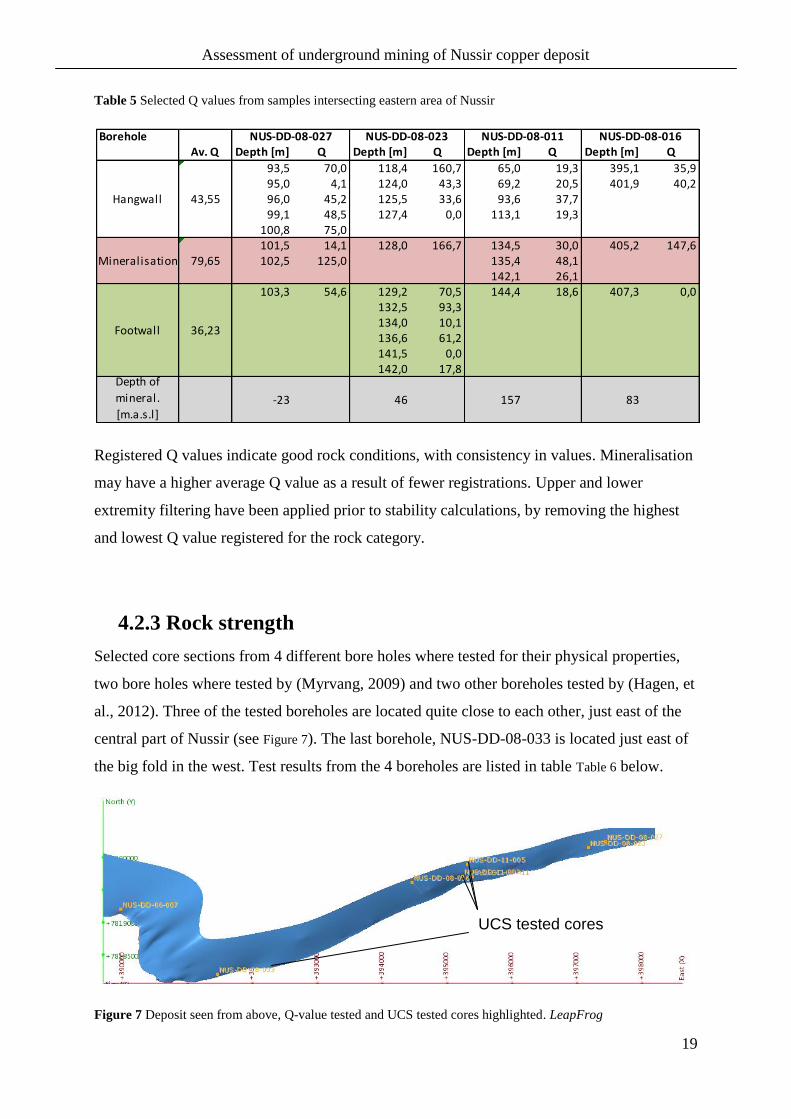
Figure 7 Deposit seen from above, Q-value tested and UCS tested cores highlighted.
LeapFrog .................................................................................................................................. 19
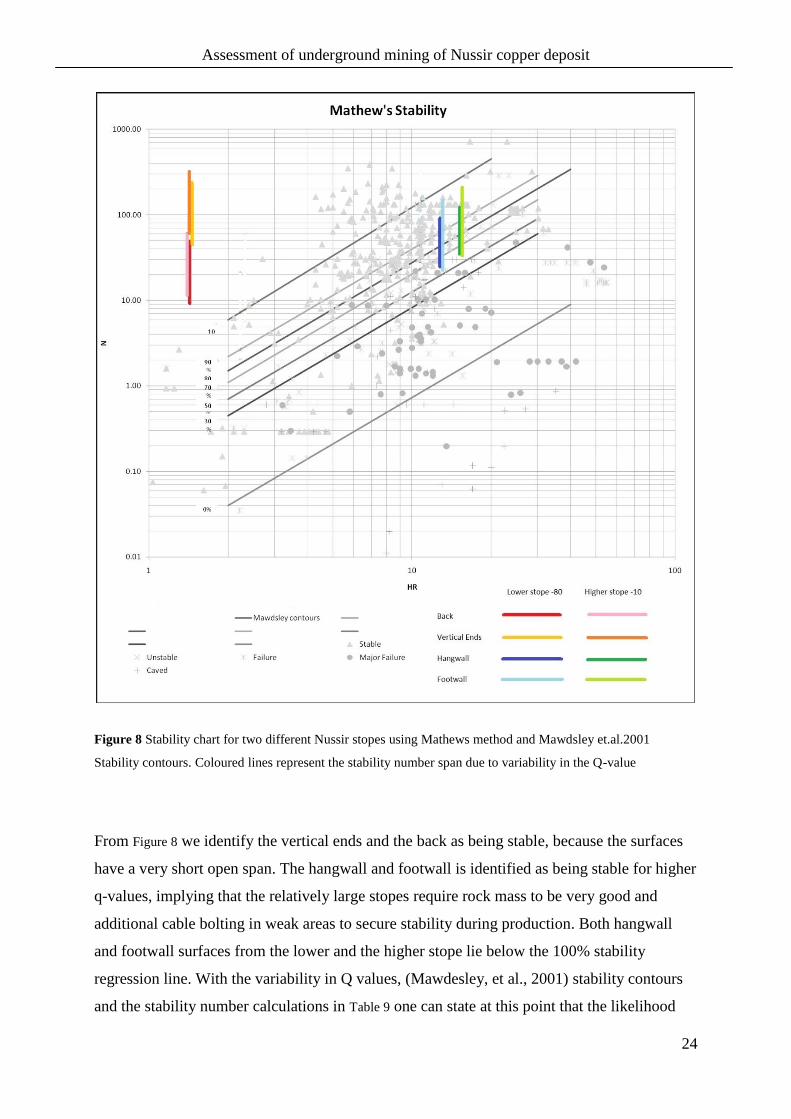
Figure 8 Stability chart for two different Nussir stopes using Mathews method and Mawdsley
et.al.2001 Stability contours. Coloured lines represent the stability number span due to
variability in the Q-value .......................................................................................................... 24
Figure 9 Results from tributary area method. Given UCS=120Mpa and the stress estimates
from 4.2.4. ................................................................................................................................ 26
Figure 10 Illustration of tributary area method for calculating necessary pillar area Ap carrying
the area At with the load σt caused by stresses. ........................................................................ 26
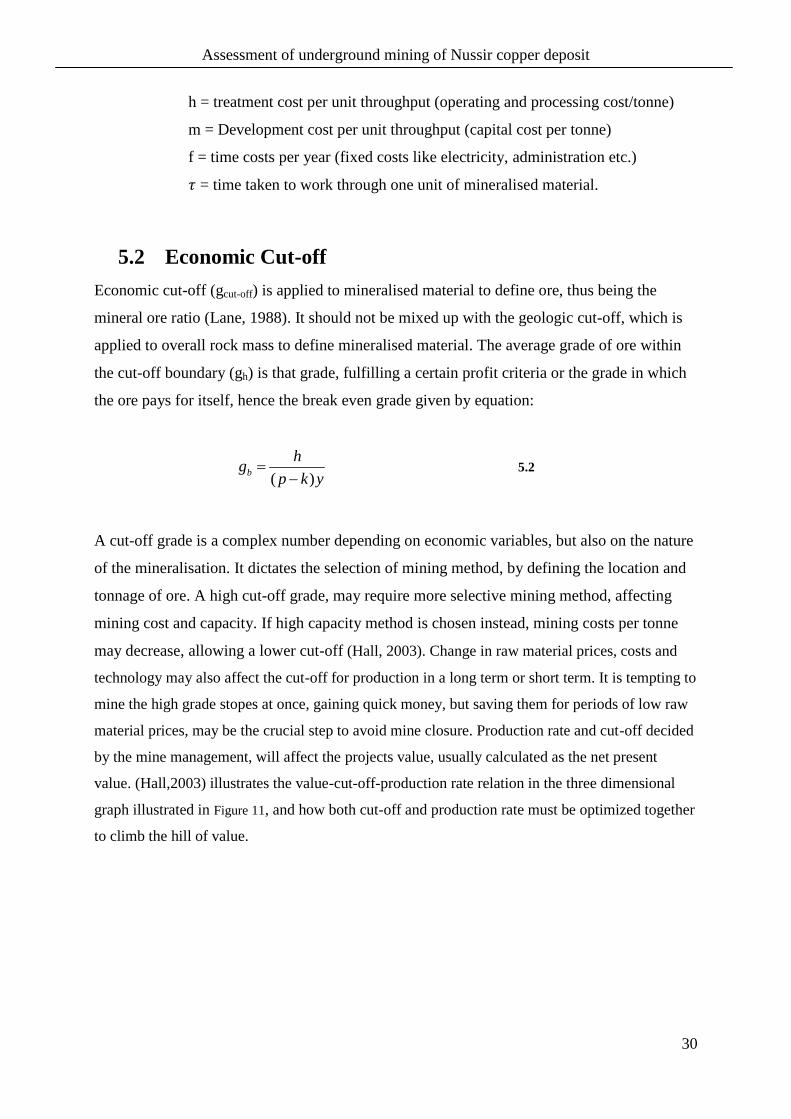
Figure 11 Finding and climbing the hill of value. Illustrating the relation between project
value, cut-off and capacity. (Hall, 2003) .................................................................................. 31
Figure 12 Imaginary relation between mineralisation thickness and dilution, given that sub-
level interval and mining equipment remain the same for all stopes. ...................................... 33
Figure 13Illustration of top-down bench stoping production cycle ......................................... 36
Figure 14 Overview of Zinkgruvan resources and reserves. Current narrow mining operation
is in the yellow reserves named Cecilia. Narrow test mining in the 80’s happened at level 496
of Nygruvan. Zinkgruvan Mining ............................................................................................. 41
Figure 15 Mine layout for Cecilia ore body at Zinkgruvan. Ore thickness is 3-5m, 17m
sublevel interval. Zinkgruvan Mining ...................................................................................... 42
Figure 16 Sublevel stoping methods applied to 10m thick Viscaria deposit in the 80’s.
Sublevel interval is consequently decreased for declining ore dip, seen in (B) and (C).
Unfavorable ground conditions caused by graphite schist and low dip require additional cable
bolting for support of hangwall (Mäkinen, et al., 1987). ......................................................... 44
Figure 17 Indicated resources in east (grey). Inferred are (red). Block model seen from south.
.................................................................................................................................................. 47
Figure 18 Minable areas chosen from Adam Wheelers block model, defined as indicated
resources > 0,9% Cu ................................................................................................................. 48
Figure 19 Deposit thickness estimation. Error introduced by marked borehole not fully
intersecting deposit. (Wheeler, 2012) ...................................................................................... 48
Figure 20 Grade- tonnage curve minable areas. Cu equiv. is Cu + Au and Ag grades in price
relation to Cu ............................................................................................................................ 48
Figure 21 Stope wireframing workprogress ............................................................................. 49

XII
Figure 22 Nussir stope layout of the minable areas from Figure 18 seen from south. Stope ID
comprise of stope letter, number and level at which stopes are loaded. Rib pillar width is 5m,
Sill pillar height is 8m. ............................................................................................................. 50
Figure 23 Drill drift illustration in wide stopes to the left and narrow stopes to the right. Cable
bolting of hangwall (thick grey lines) and production long holes illustrated. .......................... 52
Figure 24 Ramp DC 1:7 gradient, 30m2 face area, providing access to drill drifts ................. 53
Figure 25 Cross section of stopes DC with development tunnels in footwall and drill drives
following ore boundary. ........................................................................................................... 54
Figure 26 Stope 102m high vertically, 40m long and 3m thick. Proposed cable bolting of
hangwall illustrated .................................................................................................................. 56
Figure 27 Suggested equipment placed in cross sections. a) LHD in drill drift, b)production
rig in drill drift, c) haulage truck in combined drill and loading drift. ..................................... 56
Figure 28 Suggested longhole production drill rig, Simba 1254 from Atlas Copco ................ 57
Figure 29 Suggested LHD for narrow drifts, model ST1030 from Atlas Copco. (Copco) ...... 59
Figure 30 Treatment costs for Nussir mine design .................................................................. 65
Figure 31 Project cash flows year by year ............................................................................... 66
Figure 32 Sensitivity analysis of Nussir project’s NPV for a +-15% variability in Cu price,
process recovery and mining cost. ........................................................................................... 67
XIII
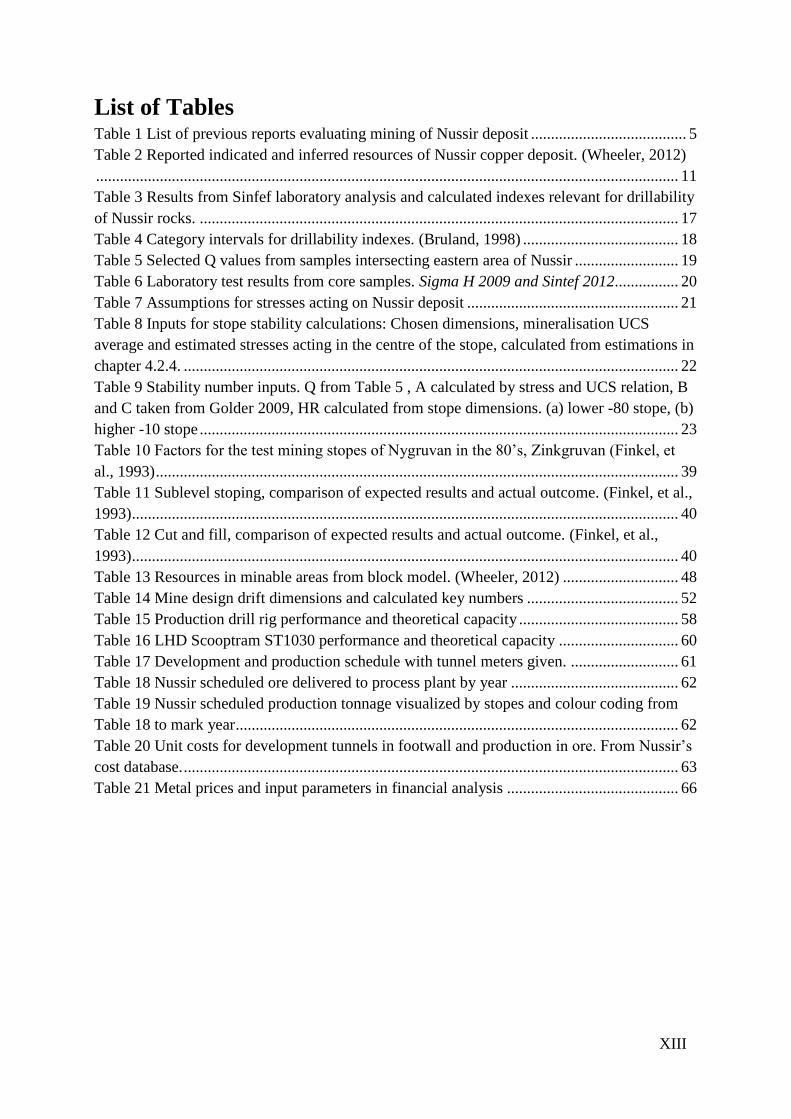
List of Tables Table 1 List of previous reports evaluating mining of Nussir deposit ....................................... 5
Table 2 Reported indicated and inferred resources of Nussir copper deposit. (Wheeler, 2012)
.................................................................................................................................................. 11
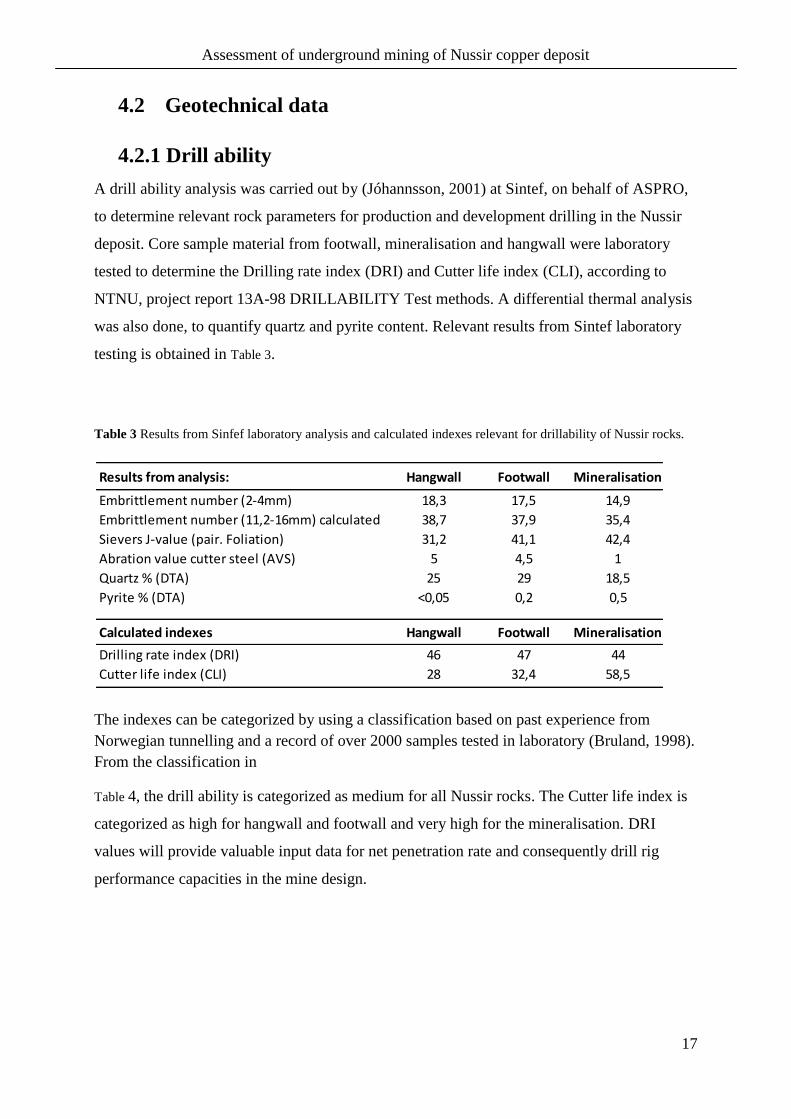
Table 3 Results from Sinfef laboratory analysis and calculated indexes relevant for drillability
of Nussir rocks. ........................................................................................................................ 17
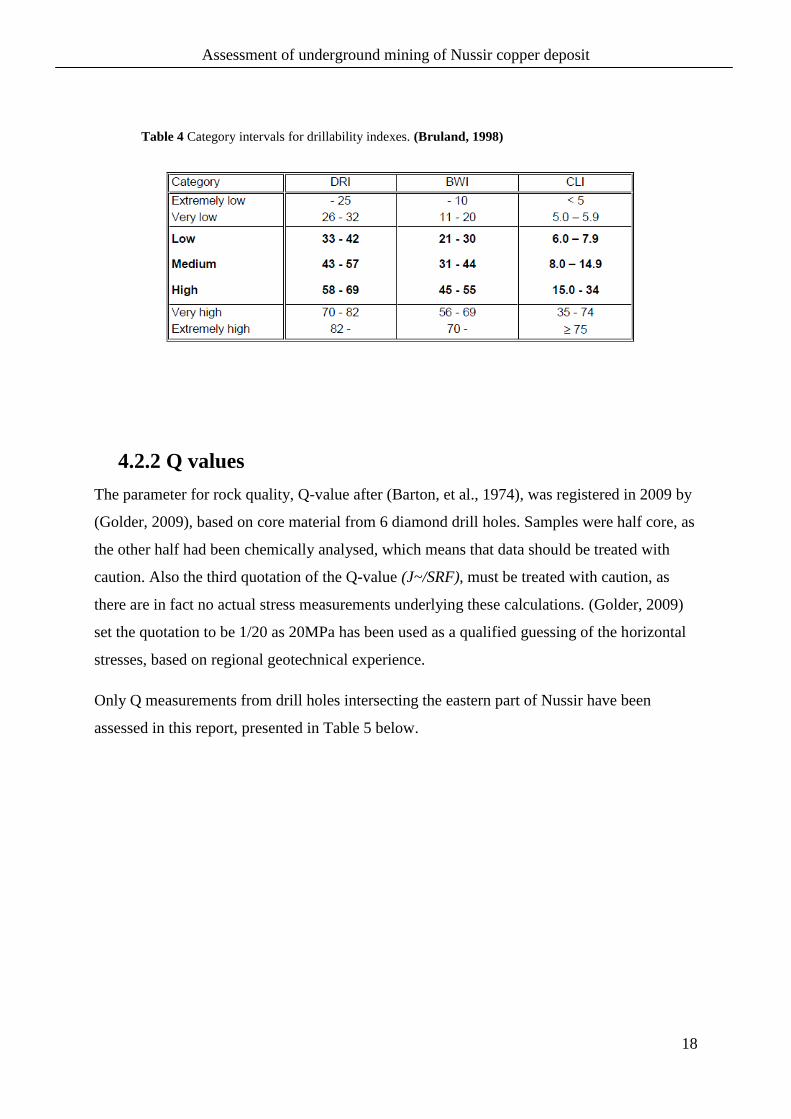
Table 4 Category intervals for drillability indexes. (Bruland, 1998) ....................................... 18
Table 5 Selected Q values from samples intersecting eastern area of Nussir .......................... 19
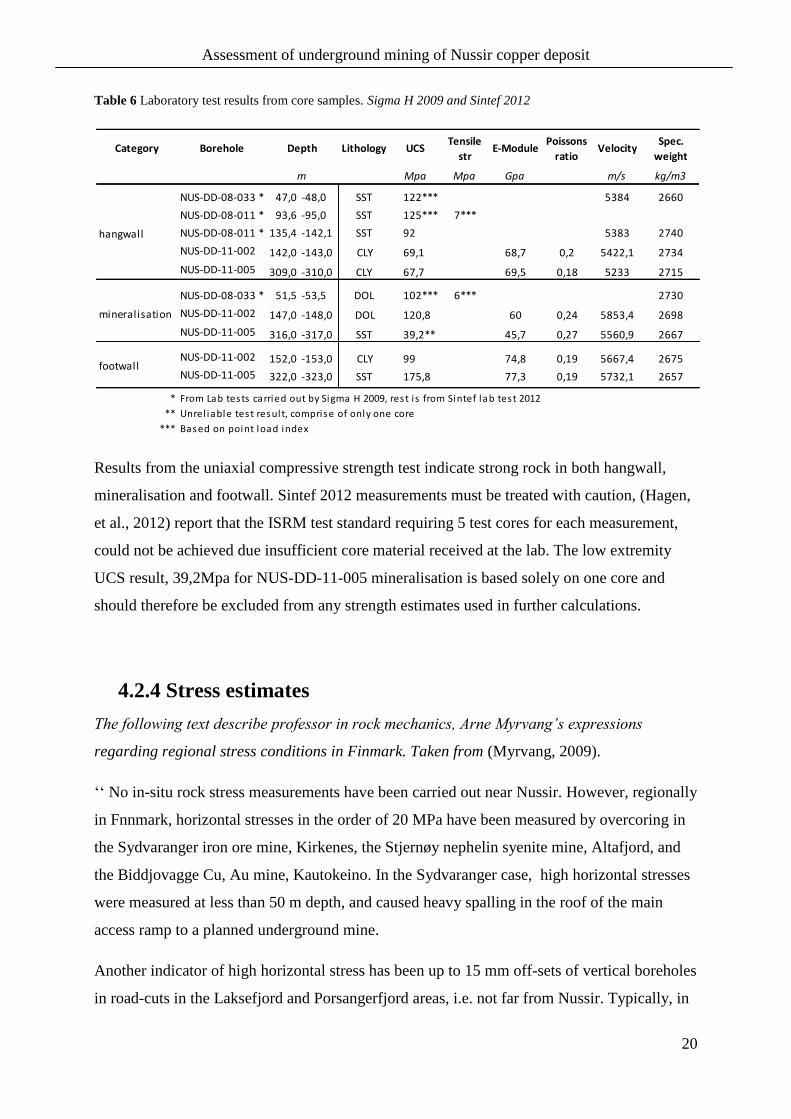
Table 6 Laboratory test results from core samples. Sigma H 2009 and Sintef 2012................ 20
Table 7 Assumptions for stresses acting on Nussir deposit ..................................................... 21
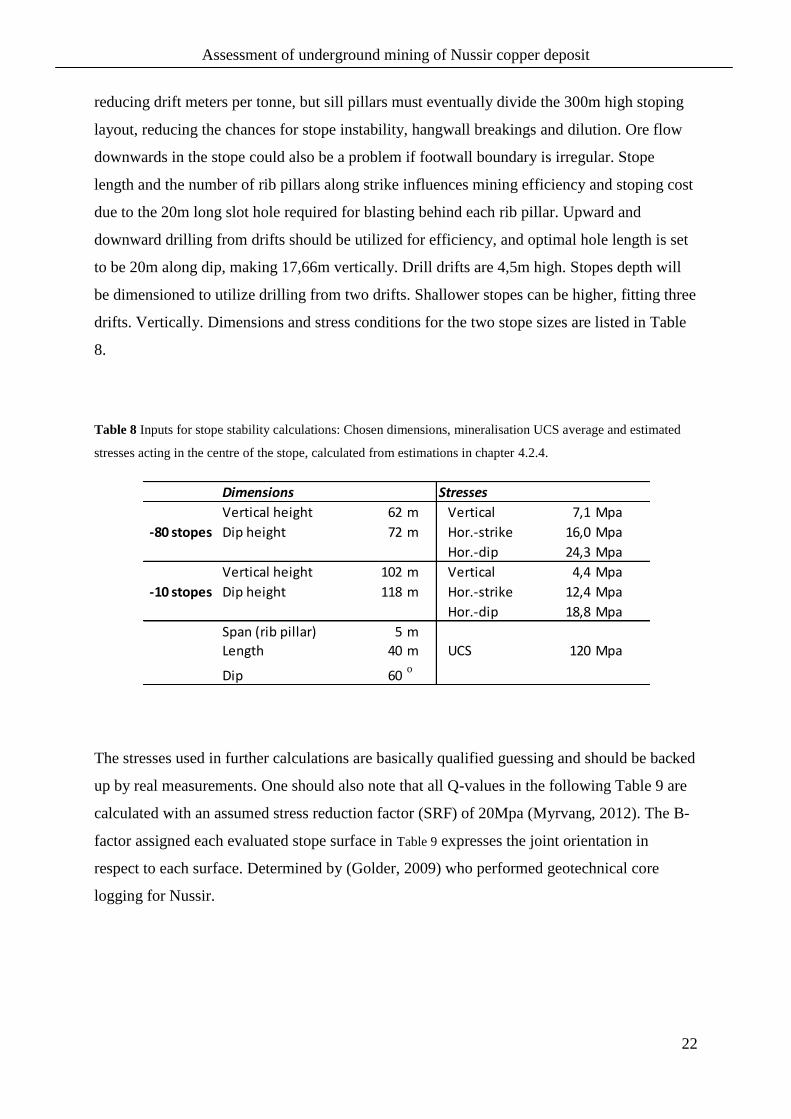
Table 8 Inputs for stope stability calculations: Chosen dimensions, mineralisation UCS
average and estimated stresses acting in the centre of the stope, calculated from estimations in
chapter 4.2.4. ............................................................................................................................ 22
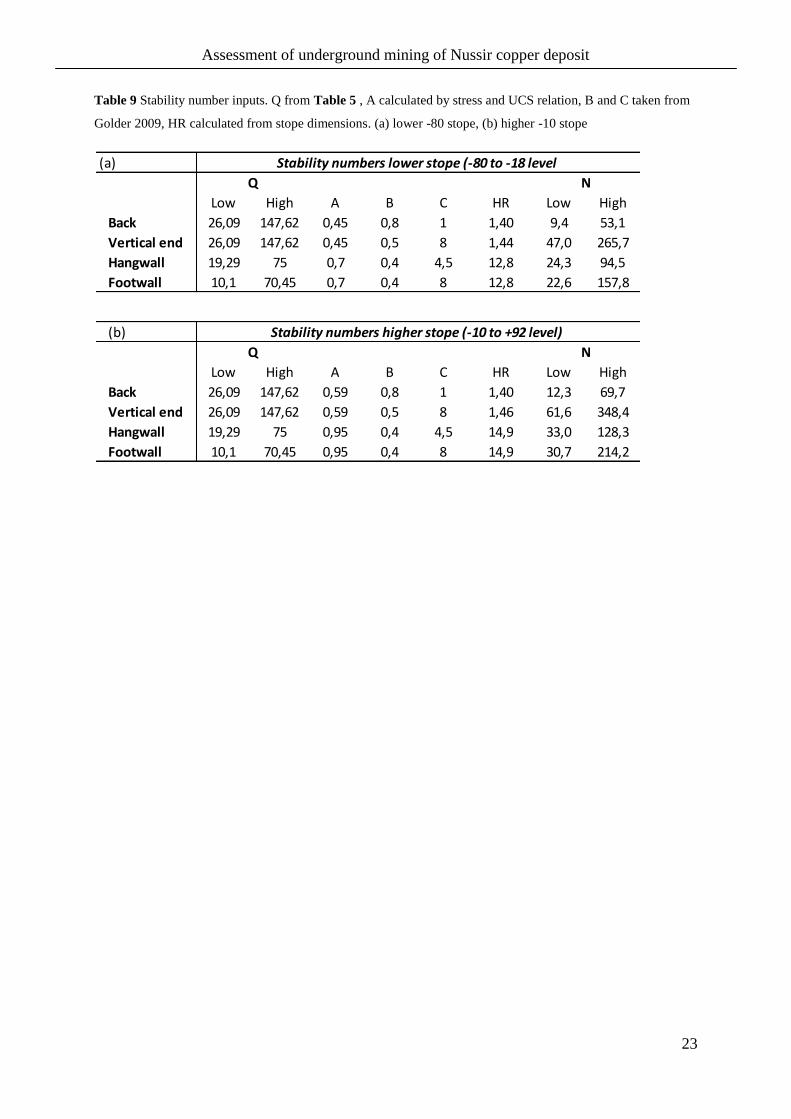
Table 9 Stability number inputs. Q from Table 5 , A calculated by stress and UCS relation, B
and C taken from Golder 2009, HR calculated from stope dimensions. (a) lower -80 stope, (b)
higher -10 stope ........................................................................................................................ 23
Table 10 Factors for the test mining stopes of Nygruvan in the 80’s, Zinkgruvan (Finkel, et
al., 1993) ................................................................................................................................... 39
Table 11 Sublevel stoping, comparison of expected results and actual outcome. (Finkel, et al.,
1993) ......................................................................................................................................... 40
Table 12 Cut and fill, comparison of expected results and actual outcome. (Finkel, et al.,
1993) ......................................................................................................................................... 40
Table 13 Resources in minable areas from block model. (Wheeler, 2012) ............................. 48
Table 14 Mine design drift dimensions and calculated key numbers ...................................... 52
Table 15 Production drill rig performance and theoretical capacity ........................................ 58
Table 16 LHD Scooptram ST1030 performance and theoretical capacity .............................. 60
Table 17 Development and production schedule with tunnel meters given. ........................... 61
Table 18 Nussir scheduled ore delivered to process plant by year .......................................... 62
Table 19 Nussir scheduled production tonnage visualized by stopes and colour coding from
Table 18 to mark year ............................................................................................................... 62
Table 20 Unit costs for development tunnels in footwall and production in ore. From Nussir’s
cost database. ............................................................................................................................ 63
Table 21 Metal prices and input parameters in financial analysis ........................................... 66

XIV
Assessment of underground mining of Nussir copper deposit
1
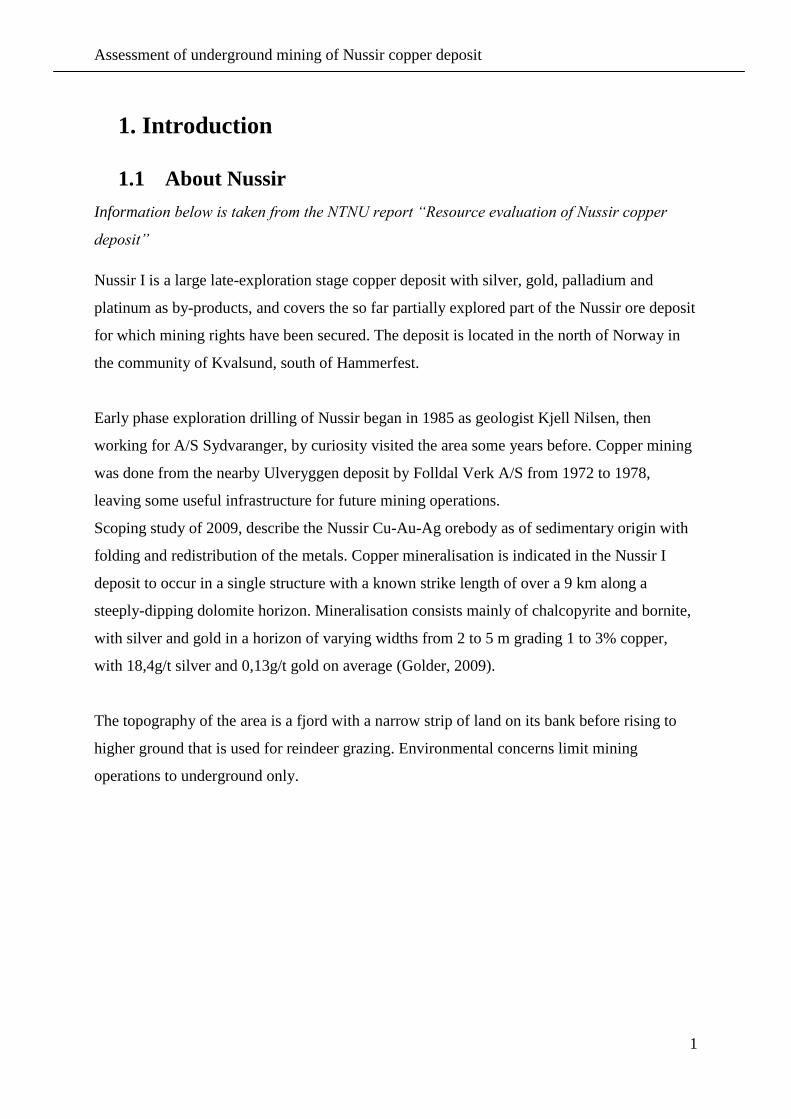
1. Introduction
1.1 About Nussir
Information below is taken from the NTNU report “Resource evaluation of Nussir copper
deposit”
Nussir I is a large late-exploration stage copper deposit with silver, gold, palladium and
platinum as by-products, and covers the so far partially explored part of the Nussir ore deposit
for which mining rights have been secured. The deposit is located in the north of Norway in
the community of Kvalsund, south of Hammerfest.
Early phase exploration drilling of Nussir began in 1985 as geologist Kjell Nilsen, then
working for A/S Sydvaranger, by curiosity visited the area some years before. Copper mining
was done from the nearby Ulveryggen deposit by Folldal Verk A/S from 1972 to 1978,
leaving some useful infrastructure for future mining operations.
Scoping study of 2009, describe the Nussir Cu-Au-Ag orebody as of sedimentary origin with
folding and redistribution of the metals. Copper mineralisation is indicated in the Nussir I
deposit to occur in a single structure with a known strike length of over a 9 km along a
steeply-dipping dolomite horizon. Mineralisation consists mainly of chalcopyrite and bornite,
with silver and gold in a horizon of varying widths from 2 to 5 m grading 1 to 3% copper,
with 18,4g/t silver and 0,13g/t gold on average (Golder, 2009).
The topography of the area is a fjord with a narrow strip of land on its bank before rising to
higher ground that is used for reindeer grazing. Environmental concerns limit mining
operations to underground only.
Assessment of underground mining of Nussir copper deposit
2
1.2 Current status
Current mineral right’s owner, junior prospecting company Nussir ASA, with CEO Øystein
Rushfeldt, have been developing the prospect since 2005. Scoping study was carried out in
2009 and the resource estimation was updated in may 2012, by 6 additional sample
intersections drilled in 2011. Permission to extract minerals are granted from the Norwegian
directorate of mineral resources, application for tailings disposal in the fjord and impact
assessment report is approved by local authorities, waiting for final approving from the
climate and pollution agency. Initial study of mineral processing was carried out by SGS
Minerals Services in 2011. Conceptual mine design proposals have been conducted by Nussir
mining engineers based on available geological knowledge and reasonable assumptions about
rock mechanical conditions.
1.3 Mining – a modifying factor
A mine design is an assessment of the technical and economical feasibility of extracting a
mineral resource. In mineral resource classification rules like the JORC code or the NI-43-
101, mining is also defined as one of the modifying factors considered when defining a
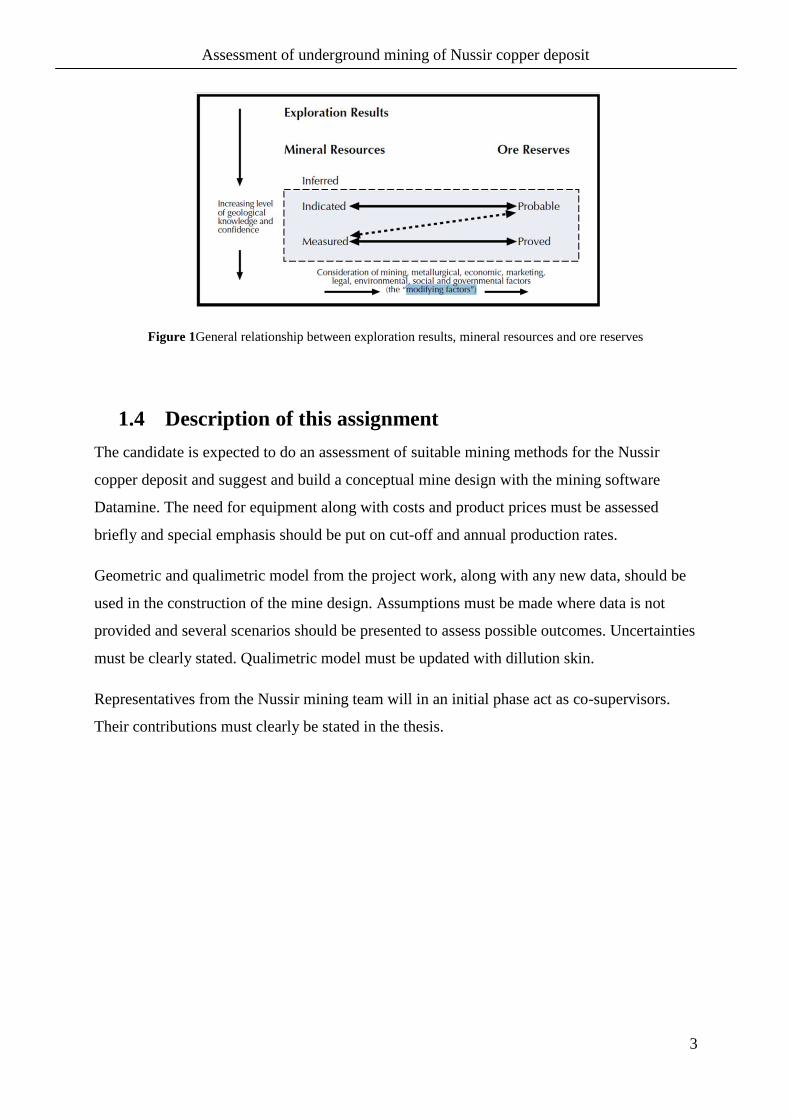
resource as a reserve, illustrated in Figure 1. Other modifying factors are metallurgical,
economic, environmental, marketing, legal, governmental and social factors. All these factors
must be assessed and sorted out in a feasibility study before investors are willing to finance a
mine start. The mining factor, mentioned above, is one of the most comprehensive factors,
where geological factors, such as knowledge of the geology of the deposit, must be sufficient
so that it is predictable and verifiable. Extraction and mine plans must be based on ore
models, with statistical and variography to ensure the ore is sampled properly. Quantification
of geotechnical risk—basically, managing the geological faults, joints, and ground fractures
so the mine does not collapse (JORC, 2004). The mining factor is essentially a consideration
of the technical risk.
Assessment of underground mining of Nussir copper deposit
3
Figure 1General relationship between exploration results, mineral resources and ore reserves
1.4 Description of this assignment
The candidate is expected to do an assessment of suitable mining methods for the Nussir
copper deposit and suggest and build a conceptual mine design with the mining software
Datamine. The need for equipment along with costs and product prices must be assessed
briefly and special emphasis should be put on cut-off and annual production rates.
Geometric and qualimetric model from the project work, along with any new data, should be
used in the construction of the mine design. Assumptions must be made where data is not
provided and several scenarios should be presented to assess possible outcomes. Uncertainties
must be clearly stated. Qualimetric model must be updated with dillution skin.
Representatives from the Nussir mining team will in an initial phase act as co-supervisors.
Their contributions must clearly be stated in the thesis.

Assessment of underground mining of Nussir copper deposit
4
Assessment of underground mining of Nussir copper deposit
5
2. Previous mine design assessments
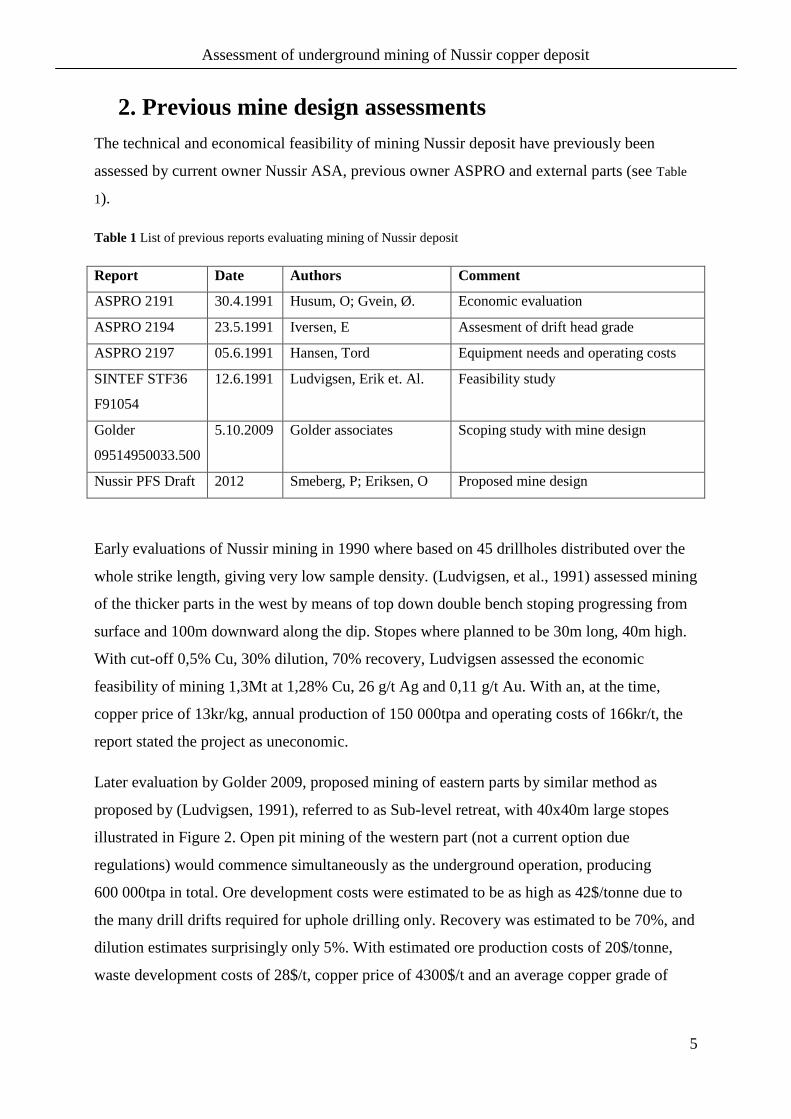
The technical and economical feasibility of mining Nussir deposit have previously been
assessed by current owner Nussir ASA, previous owner ASPRO and external parts (see Table
1).
Table 1 List of previous reports evaluating mining of Nussir deposit
Report Date Authors Comment
ASPRO 2191 30.4.1991 Husum, O; Gvein, Ø. Economic evaluation
ASPRO 2194 23.5.1991 Iversen, E Assesment of drift head grade
ASPRO 2197 05.6.1991 Hansen, Tord Equipment needs and operating costs
SINTEF STF36
F91054
12.6.1991 Ludvigsen, Erik et. Al. Feasibility study
Golder
09514950033.500
5.10.2009 Golder associates Scoping study with mine design
Nussir PFS Draft 2012 Smeberg, P; Eriksen, O Proposed mine design
Early evaluations of Nussir mining in 1990 where based on 45 drillholes distributed over the
whole strike length, giving very low sample density. (Ludvigsen, et al., 1991) assessed mining
of the thicker parts in the west by means of top down double bench stoping progressing from
surface and 100m downward along the dip. Stopes where planned to be 30m long, 40m high.
With cut-off 0,5% Cu, 30% dilution, 70% recovery, Ludvigsen assessed the economic
feasibility of mining 1,3Mt at 1,28% Cu, 26 g/t Ag and 0,11 g/t Au. With an, at the time,
copper price of 13kr/kg, annual production of 150 000tpa and operating costs of 166kr/t, the
report stated the project as uneconomic.
Later evaluation by Golder 2009, proposed mining of eastern parts by similar method as
proposed by (Ludvigsen, 1991), referred to as Sub-level retreat, with 40x40m large stopes
illustrated in Figure 2. Open pit mining of the western part (not a current option due
regulations) would commence simultaneously as the underground operation, producing
600 000tpa in total. Ore development costs were estimated to be as high as 42$/tonne due to
the many drill drifts required for uphole drilling only. Recovery was estimated to be 70%, and
dilution estimates surprisingly only 5%. With estimated ore production costs of 20$/tonne,
waste development costs of 28$/t, copper price of 4300$/t and an average copper grade of

Assessment of underground mining of Nussir copper deposit
6
1,33%, Golder concluded the project to be uneconomic. A financial sensitivity analysis from
the same report, stated that positive NPV could be achieved at a 5000$/tonne copper price.
Figure 2 Sub-level retreat (SLR) mining method proposed for exploiting Nussir's eastern part. Golder 2009
The previous assessments of mine design presented above, share more or less the same
mining method where short sublevel interval cause excessive ore development cost due to the
necessity of many drill drifts. More recent mine design proposals carried out by Nussir’s own
mining engineers Per Smeberg and Ola Eriksen, solve the excessive drill drift cost, by
suggesting up and downward drilling and 50m sub-level interval. Their mine design proposed
in the PFS Draft of January 2012, suggests up to 300m high stopes, supported by evenly
distributed small pillars, instead of rib and sill pillars suggested in the previous reports. This
reduced footwall development tunnels to one haulage level, ramp and some ore passes,
making waste rock development costs as low as 50,81NOK/t. Mine operating costs where
estimated to be 150NOK/t for 3,5million tonne total production.

Assessment of underground mining of Nussir copper deposit
7
Figure 3 Mine design layout, SLOS with 50m subl.interval. and 300x350m stopes. (Smeberg, et al., 2011)

Assessment of underground mining of Nussir copper deposit
8
Assessment of underground mining of Nussir copper deposit
9
3. Geology
3.1 The Nussir deposit
Information below is taken from the NTNU report “Resource evaluation of Nussir copper
deposit”
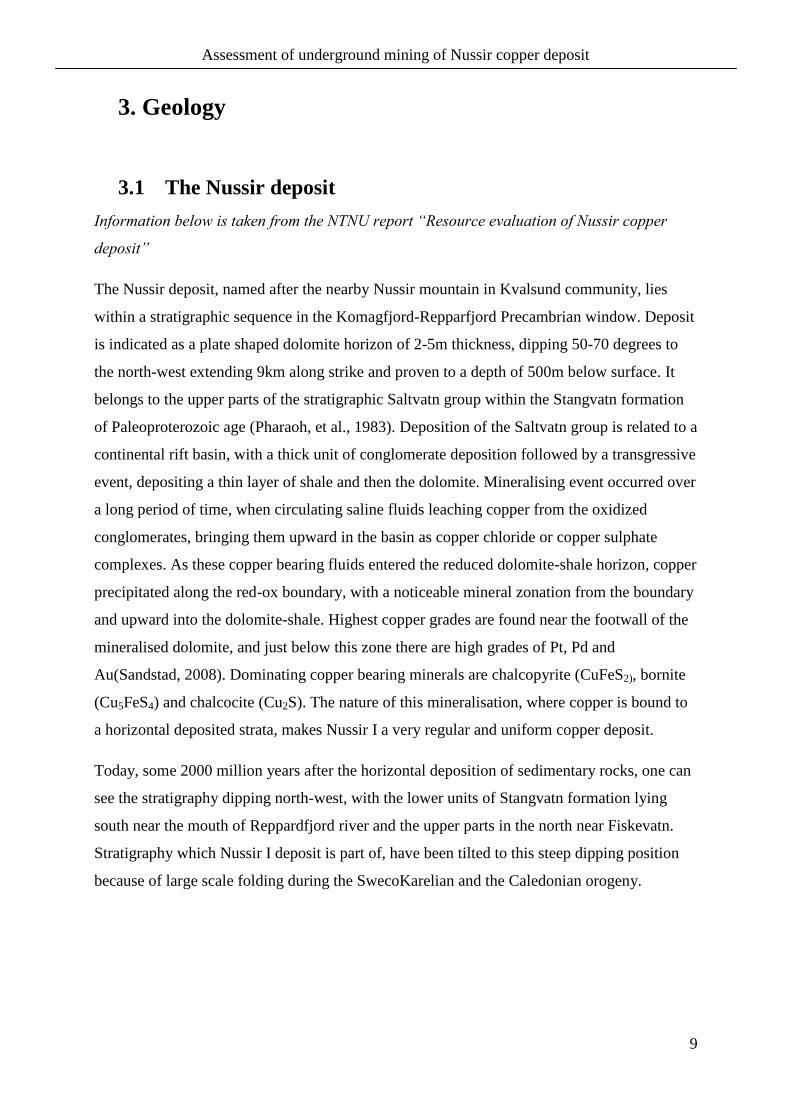
The Nussir deposit, named after the nearby Nussir mountain in Kvalsund community, lies
within a stratigraphic sequence in the Komagfjord-Repparfjord Precambrian window. Deposit
is indicated as a plate shaped dolomite horizon of 2-5m thickness, dipping 50-70 degrees to
the north-west extending 9km along strike and proven to a depth of 500m below surface. It
belongs to the upper parts of the stratigraphic Saltvatn group within the Stangvatn formation
of Paleoproterozoic age (Pharaoh, et al., 1983). Deposition of the Saltvatn group is related to a
continental rift basin, with a thick unit of conglomerate deposition followed by a transgressive
event, depositing a thin layer of shale and then the dolomite. Mineralising event occurred over
a long period of time, when circulating saline fluids leaching copper from the oxidized
conglomerates, bringing them upward in the basin as copper chloride or copper sulphate
complexes. As these copper bearing fluids entered the reduced dolomite-shale horizon, copper
precipitated along the red-ox boundary, with a noticeable mineral zonation from the boundary
and upward into the dolomite-shale. Highest copper grades are found near the footwall of the
mineralised dolomite, and just below this zone there are high grades of Pt, Pd and
Au(Sandstad, 2008). Dominating copper bearing minerals are chalcopyrite (CuFeS2), bornite
(Cu5FeS4) and chalcocite (Cu2S). The nature of this mineralisation, where copper is bound to
a horizontal deposited strata, makes Nussir I a very regular and uniform copper deposit.
Today, some 2000 million years after the horizontal deposition of sedimentary rocks, one can
see the stratigraphy dipping north-west, with the lower units of Stangvatn formation lying
south near the mouth of Reppardfjord river and the upper parts in the north near Fiskevatn.
Stratigraphy which Nussir I deposit is part of, have been tilted to this steep dipping position
because of large scale folding during the SwecoKarelian and the Caledonian orogeny.
Assessment of underground mining of Nussir copper deposit
10
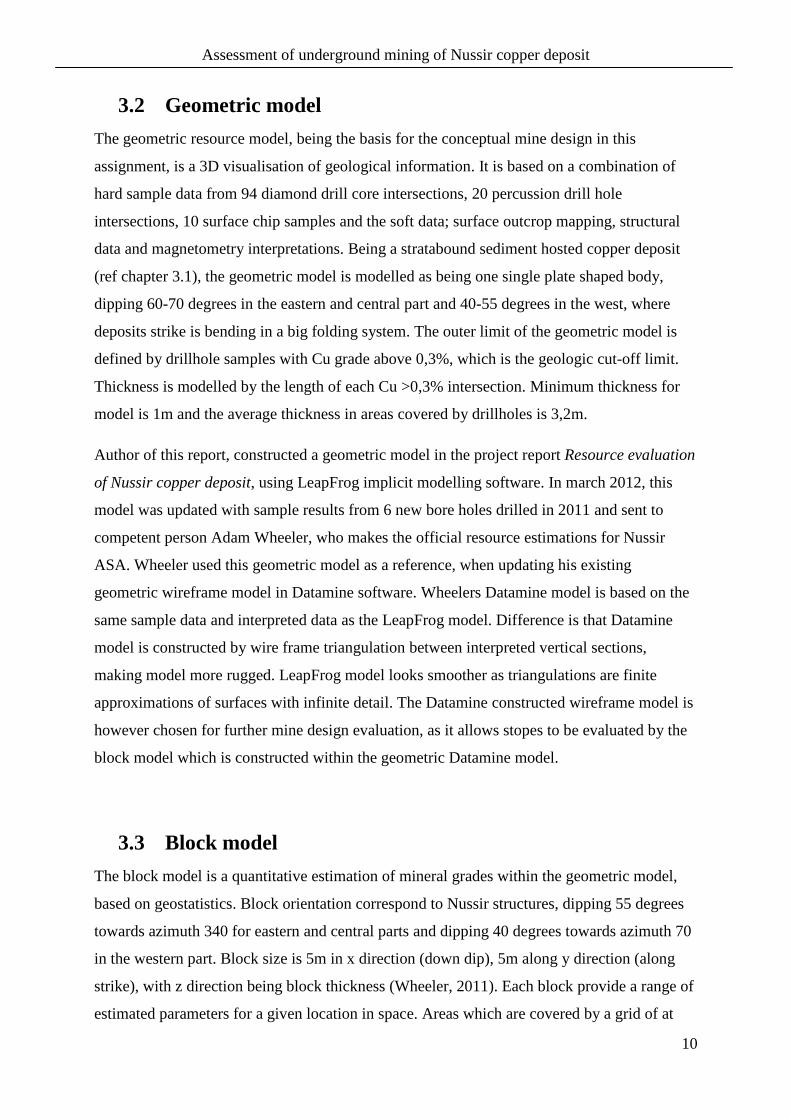
3.2 Geometric model
The geometric resource model, being the basis for the conceptual mine design in this
assignment, is a 3D visualisation of geological information. It is based on a combination of
hard sample data from 94 diamond drill core intersections, 20 percussion drill hole
intersections, 10 surface chip samples and the soft data; surface outcrop mapping, structural
data and magnetometry interpretations. Being a stratabound sediment hosted copper deposit
(ref chapter 3.1), the geometric model is modelled as being one single plate shaped body,
dipping 60-70 degrees in the eastern and central part and 40-55 degrees in the west, where
deposits strike is bending in a big folding system. The outer limit of the geometric model is
defined by drillhole samples with Cu grade above 0,3%, which is the geologic cut-off limit.
Thickness is modelled by the length of each Cu >0,3% intersection. Minimum thickness for
model is 1m and the average thickness in areas covered by drillholes is 3,2m.
Author of this report, constructed a geometric model in the project report Resource evaluation
of Nussir copper deposit, using LeapFrog implicit modelling software. In march 2012, this
model was updated with sample results from 6 new bore holes drilled in 2011 and sent to
competent person Adam Wheeler, who makes the official resource estimations for Nussir
ASA. Wheeler used this geometric model as a reference, when updating his existing
geometric wireframe model in Datamine software. Wheelers Datamine model is based on the
same sample data and interpreted data as the LeapFrog model. Difference is that Datamine
model is constructed by wire frame triangulation between interpreted vertical sections,
making model more rugged. LeapFrog model looks smoother as triangulations are finite
approximations of surfaces with infinite detail. The Datamine constructed wireframe model is
however chosen for further mine design evaluation, as it allows stopes to be evaluated by the
block model which is constructed within the geometric Datamine model.
3.3 Block model
The block model is a quantitative estimation of mineral grades within the geometric model,
based on geostatistics. Block orientation correspond to Nussir structures, dipping 55 degrees
towards azimuth 340 for eastern and central parts and dipping 40 degrees towards azimuth 70
in the western part. Block size is 5m in x direction (down dip), 5m along y direction (along
strike), with z direction being block thickness (Wheeler, 2011). Each block provide a range of
estimated parameters for a given location in space. Areas which are covered by a grid of at
Assessment of underground mining of Nussir copper deposit
11
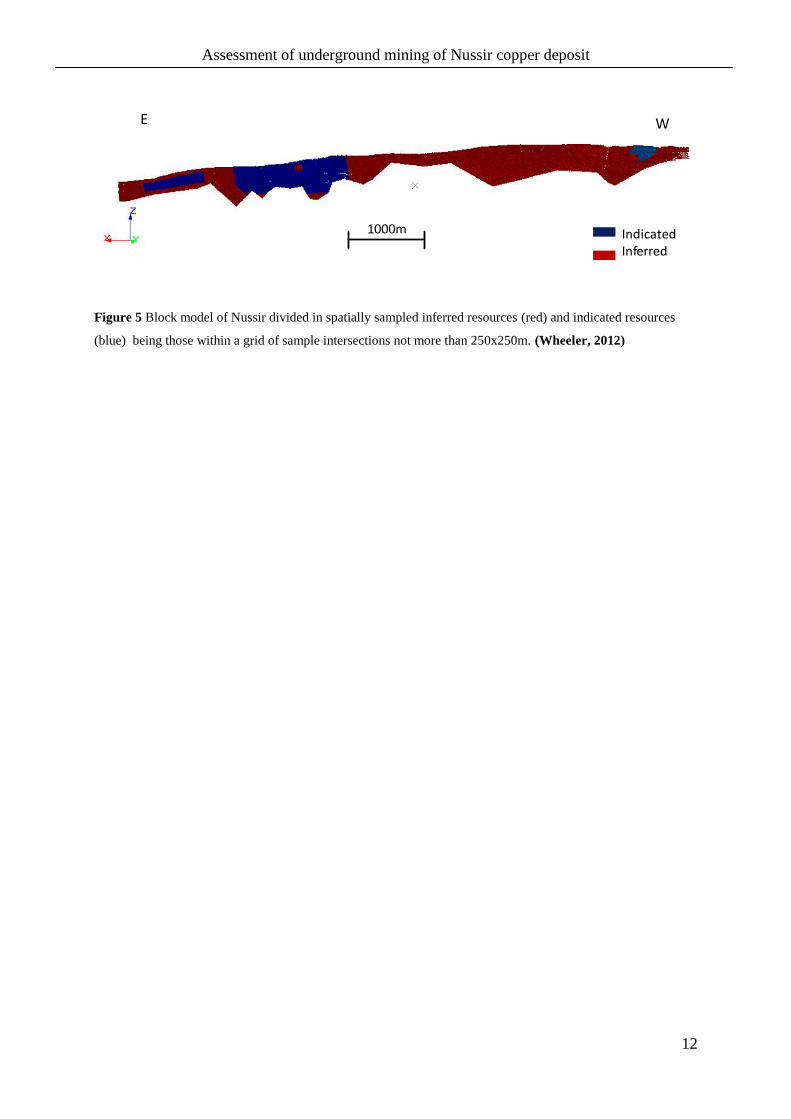
least 250m x 250m (along-strike x down-dip) drilling were demarcated as indicated resources.
All other modelled resources were allocated as inferred. No areas have sufficient sampling
density to be demarcated as measured.
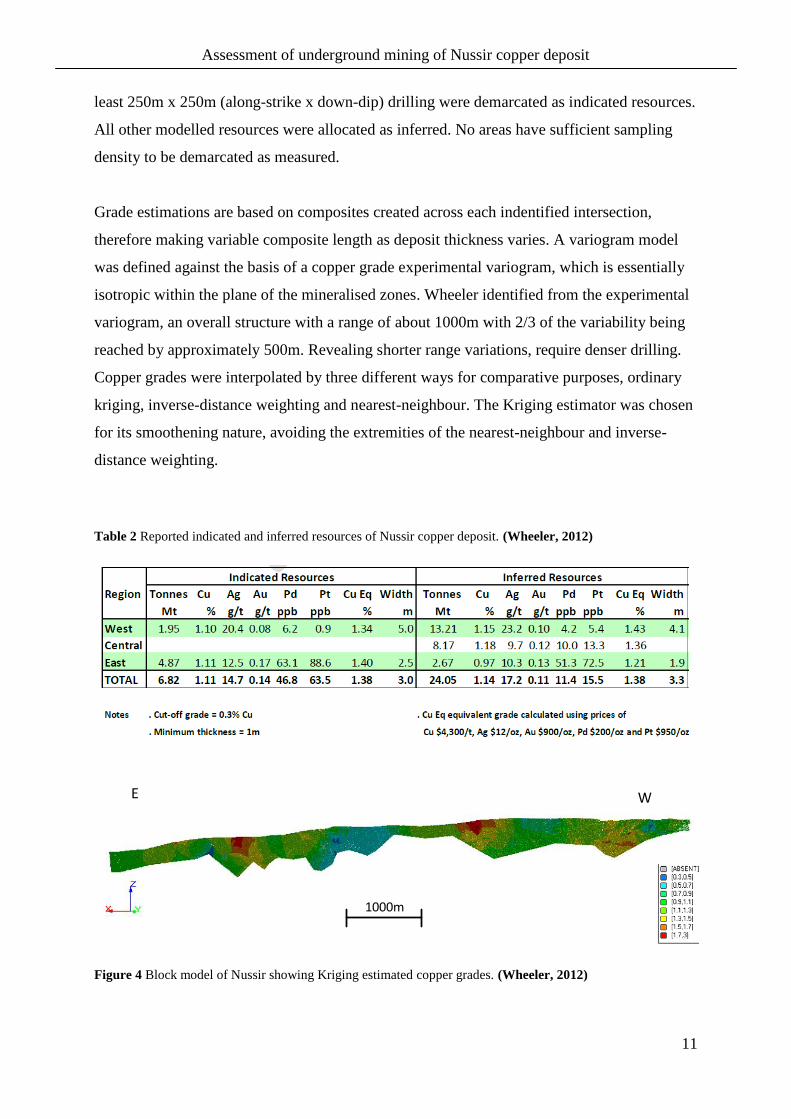
Grade estimations are based on composites created across each indentified intersection,
therefore making variable composite length as deposit thickness varies. A variogram model
was defined against the basis of a copper grade experimental variogram, which is essentially
isotropic within the plane of the mineralised zones. Wheeler identified from the experimental
variogram, an overall structure with a range of about 1000m with 2/3 of the variability being
reached by approximately 500m. Revealing shorter range variations, require denser drilling.
Copper grades were interpolated by three different ways for comparative purposes, ordinary
kriging, inverse-distance weighting and nearest-neighbour. The Kriging estimator was chosen
for its smoothening nature, avoiding the extremities of the nearest-neighbour and inverse-
distance weighting.
Table 2 Reported indicated and inferred resources of Nussir copper deposit. (Wheeler, 2012)
Figure 4 Block model of Nussir showing Kriging estimated copper grades. (Wheeler, 2012)
E W
1000m
Assessment of underground mining of Nussir copper deposit
12
Figure 5 Block model of Nussir divided in spatially sampled inferred resources (red) and indicated resources
(blue) being those within a grid of sample intersections not more than 250x250m. (Wheeler, 2012)
IndicatedInferred
1000m
E W

Assessment of underground mining of Nussir copper deposit
13
4. Geotechnical considerations
The following chapter consider relevant theory for underground mine excavations and how
stability can be assessed prior to mine start. All relevant geotechnical data for the Nussir area
is presented in sub ch. 4.2 and the calculation methods for this report is presented in ch.4.3.
4.1 Background
4.1.1 Empirical Design Methods
Mine structures, whether it is a pillar or an opening, is influenced by numerous blocks of
intact rock, which can be individually assessed for their properties on a laboratory scale. The
challenge arise, when trying to assess a structure in a mine wide scale, where the rock mass
behaviour is difficult, or impossible to determine solely on rock block properties. Instead of a
design relying solely on a deterministic approach, empirical methods can be implemented to
assess stability of structures by the use of past practices to predict future behaviour based
upon factors most critical towards the design (Pakalnis, 1998).
Design methods can be categorized as being analytical, observational or empirical, but they
can also be combined as steps in the assessment of a design. In rock mechanics, analytical
design methods are based upon an estimate of the constitutive behaviour of a rock mass, such
as a failure criteria, which may be Hoek-Brown criterion or Mohr-Coulomb criteria. Once a
constitutive rock mass behaviour is given, it becomes part of the design method and is not
varied. Empirical methods on the other hand, combine more input data, providing an estimate
of the constitutive properties of a rock mass. Based on the collection and analysis of case
histories, the input data, such as joint orientation, orientation of opening, strength and spacing,
are given weights reflecting the relative influence on stability. Numerical codes, analytical
tools and observational approaches still have a great value as tools to the overall process,
which will incorporate an empirical component towards the design. A failure criteria can be
empirically derived based on weighted constitutive properties of the rock mass and a measure
of the underground geometry (Pakalnis, 1998).
Empirical methods have gained acceptance since the mid 80’s, largely because of their
predictive capabilities, needed for mine design evaluation. The stability graph method for
open stope design, proposed by Mathews et al (1981) and subsequently modified by Potvin

Assessment of underground mining of Nussir copper deposit
14
(1988) and Nickson (1992), is specifically chosen for the evaluation of Nussir mine design.
The method assesses the likelihood of major instability or caving of the excavation surfaces
forming the open stope, using the Stability Graph which compares the Stability Number (N)
of the rockmass in which the surface is excavated and the hydraulic radius (HS) of the
surface. The stability number N is given by:
* * *N Q A B C 4.1
Where:
Q Factor - Also called the Q-value, expressing quality of rock, explained in ch.4.1.2.
A Factor - This value is designed to accout for the influence of high stresses reducing the rock
mass stability. The A value is determined by the ratio of the unconfined compressive strength
of the intact rock divided by the maximum induced stress parallel to the opening surface. The
A factor is set to 1.0 if the intact rock strength is ten (10) or more times the induced stress
indicating that high stress is not a problem. The A factor is set to 0.1 if the rock strength is
two (2) times the induced stress or less indicating that high stresses significantly reduce the
opening stability.
B Factor - This value looks at the influence of the orientation of discontinuities with respect
to the surface analysed. This factor states that joints oriented at 90° to a surface are not a
problem to stability and a value of 1.0 is given to the value of B. Discontinuities dipping
within 20° to the surface are the least stable representing structure which can topple within the
stope. A value of B=0.2 is given for this condition.
C Factor - This value considers the orientation of the surface being analysed. A value of eight
(s) is assigned for the design of vertical walls and a value of two (2) is given for horizontal
backs. This factor reflects the inherently more stable nature of a vertical wall compared to a
horizontal back.
The Hydraulic Radius (HR) = excavation surface area/excavation surface circumference.
Assessment of underground mining of Nussir copper deposit
15
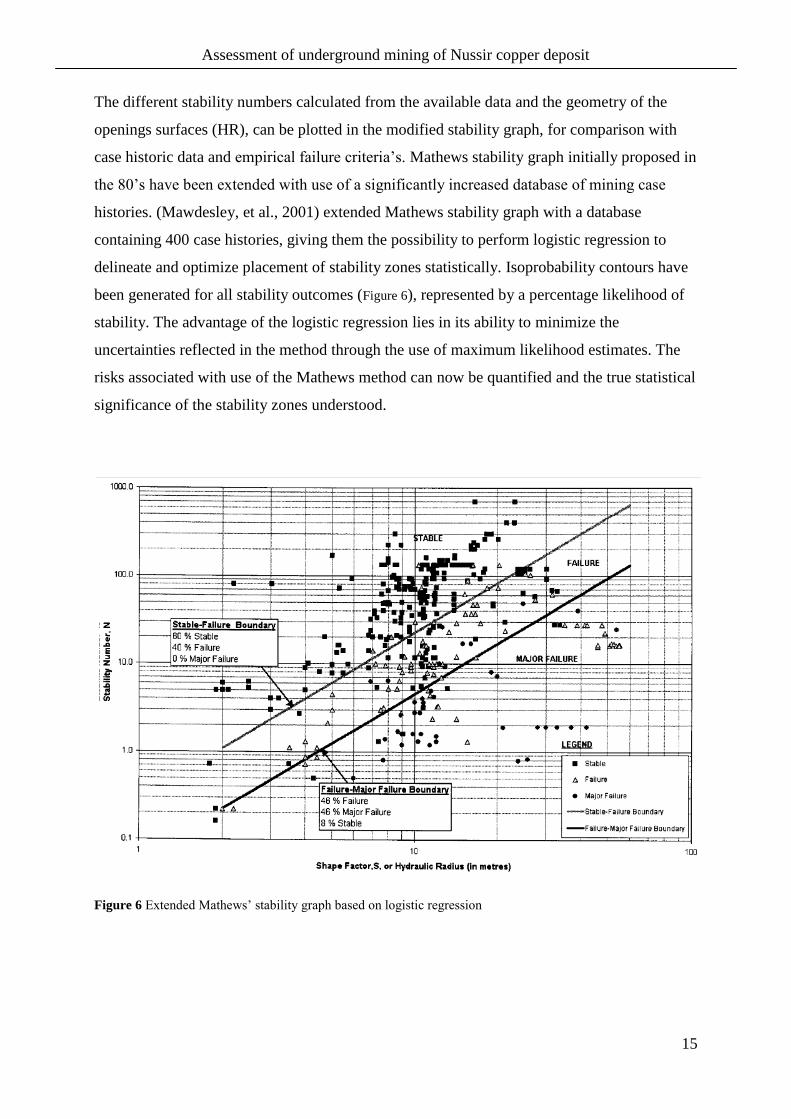
The different stability numbers calculated from the available data and the geometry of the
openings surfaces (HR), can be plotted in the modified stability graph, for comparison with
case historic data and empirical failure criteria’s. Mathews stability graph initially proposed in
the 80’s have been extended with use of a significantly increased database of mining case
histories. (Mawdesley, et al., 2001) extended Mathews stability graph with a database
containing 400 case histories, giving them the possibility to perform logistic regression to
delineate and optimize placement of stability zones statistically. Isoprobability contours have
been generated for all stability outcomes (Figure 6), represented by a percentage likelihood of
stability. The advantage of the logistic regression lies in its ability to minimize the
uncertainties reflected in the method through the use of maximum likelihood estimates. The
risks associated with use of the Mathews method can now be quantified and the true statistical
significance of the stability zones understood.
Figure 6 Extended Mathews’ stability graph based on logistic regression

Assessment of underground mining of Nussir copper deposit
16
4.1.2 Q-system
The Q-system for rock mass classification developed by Barton, Lien, and Lunde (1974),
expresses the quality of the rock mass in the so-called Q-value, on which are based design and
support recommendations for underground excavations. The Q-value varies on a logarithmic
scale from 0,001 to 1000, where everything above 10 is regarded as good rock mass quality
(Barton, et al., 1974). Q is calculated by:
a w
n r
J JRQDQ x x
J J SRF 4.2
Where,
RQD = Rock Quality Designation;
Jn = Joint set number;
Ja = Joint alteration;
Jr = joint roughness;
Jw = Joint water number; and,
SRF = Stress reduction factor.
The first quotient appearing in equation 4.2, (RQD/Jn) represents the overall structure of the
rock mass, and it happens to be a crude measure of the relative block size
The second quotient (J,./Ja) represents the roughness and degree of alteration of the joint
walls or filling materials.
The third quotation (J~/SRF) consists of two stress parameters. The parameter J~ is a measure
of water pressure, which has an adverse effect on the shear strength of joints due to a
reduction in effective normal stress. Water may in addition cause softening and possible
outwash in the case of clay filled joints. The parameter SRF is a measure of: (1) loosening
load in the case of excavation through shear zones and clay bearing rock, (2) rock stress in
competent rock, (3) squeezing or swelling loads in plastic incompetent rock. The quotient
(J~/SRF) is a complicated empirical factor describing the "active stresses" (Barton, et al.,
1974).
Assessment of underground mining of Nussir copper deposit
17
4.2 Geotechnical data
4.2.1 Drill ability
A drill ability analysis was carried out by (Jóhannsson, 2001) at Sintef, on behalf of ASPRO,
to determine relevant rock parameters for production and development drilling in the Nussir
deposit. Core sample material from footwall, mineralisation and hangwall were laboratory
tested to determine the Drilling rate index (DRI) and Cutter life index (CLI), according to
NTNU, project report 13A-98 DRILLABILITY Test methods. A differential thermal analysis
was also done, to quantify quartz and pyrite content. Relevant results from Sintef laboratory
testing is obtained in Table 3.
Table 3 Results from Sinfef laboratory analysis and calculated indexes relevant for drillability of Nussir rocks.
The indexes can be categorized by using a classification based on past experience from
Norwegian tunnelling and a record of over 2000 samples tested in laboratory (Bruland, 1998).
From the classification in
Table 4, the drill ability is categorized as medium for all Nussir rocks. The Cutter life index is
categorized as high for hangwall and footwall and very high for the mineralisation. DRI
values will provide valuable input data for net penetration rate and consequently drill rig
performance capacities in the mine design.
Results from analysis: Hangwall Footwall Mineralisation
Embrittlement number (2-4mm) 18,3 17,5 14,9
Embrittlement number (11,2-16mm) calculated 38,7 37,9 35,4
Sievers J-value (pair. Foliation) 31,2 41,1 42,4
Abration value cutter steel (AVS) 5 4,5 1
Quartz % (DTA) 25 29 18,5
Pyrite % (DTA) <0,05 0,2 0,5
Calculated indexes Hangwall Footwall Mineralisation
Drilling rate index (DRI) 46 47 44
Cutter life index (CLI) 28 32,4 58,5
Assessment of underground mining of Nussir copper deposit
18
Table 4 Category intervals for drillability indexes. (Bruland, 1998)
4.2.2 Q values
The parameter for rock quality, Q-value after (Barton, et al., 1974), was registered in 2009 by
(Golder, 2009), based on core material from 6 diamond drill holes. Samples were half core, as
the other half had been chemically analysed, which means that data should be treated with
caution. Also the third quotation of the Q-value (J~/SRF), must be treated with caution, as
there are in fact no actual stress measurements underlying these calculations. (Golder, 2009)
set the quotation to be 1/20 as 20MPa has been used as a qualified guessing of the horizontal
stresses, based on regional geotechnical experience.
Only Q measurements from drill holes intersecting the eastern part of Nussir have been
assessed in this report, presented in Table 5 below.
Assessment of underground mining of Nussir copper deposit
19
Table 5 Selected Q values from samples intersecting eastern area of Nussir
Registered Q values indicate good rock conditions, with consistency in values. Mineralisation
may have a higher average Q value as a result of fewer registrations. Upper and lower
extremity filtering have been applied prior to stability calculations, by removing the highest
and lowest Q value registered for the rock category.
4.2.3 Rock strength
Selected core sections from 4 different bore holes where tested for their physical properties,
two bore holes where tested by (Myrvang, 2009) and two other boreholes tested by (Hagen, et
al., 2012). Three of the tested boreholes are located quite close to each other, just east of the
central part of Nussir (see Figure 7). The last borehole, NUS-DD-08-033 is located just east of
the big fold in the west. Test results from the 4 boreholes are listed in table Table 6 below.
Figure 7 Deposit seen from above, Q-value tested and UCS tested cores highlighted. LeapFrog
BoreholeDepth [m] Q Depth [m] Q Depth [m] Q Depth [m] Q
93,5 70,0 118,4 160,7 65,0 19,3 395,1 35,995,0 4,1 124,0 43,3 69,2 20,5 401,9 40,296,0 45,2 125,5 33,6 93,6 37,799,1 48,5 127,4 0,0 113,1 19,3
100,8 75,0101,5 14,1 128,0 166,7 134,5 30,0 405,2 147,6102,5 125,0 135,4 48,1
142,1 26,1103,3 54,6 129,2 70,5 144,4 18,6 407,3 0,0
132,5 93,3134,0 10,1136,6 61,2141,5 0,0142,0 17,8
-23 46 157 83
NUS-DD-08-027 NUS-DD-08-023 NUS-DD-08-011 NUS-DD-08-016
Depth of
mineral.
[m.a.s.l]
Av. Q
Footwall
Mineralisation
Hangwall 43,55
79,65
36,23
UCS tested cores
Assessment of underground mining of Nussir copper deposit
20
Table 6 Laboratory test results from core samples. Sigma H 2009 and Sintef 2012
Results from the uniaxial compressive strength test indicate strong rock in both hangwall,
mineralisation and footwall. Sintef 2012 measurements must be treated with caution, (Hagen,
et al., 2012) report that the ISRM test standard requiring 5 test cores for each measurement,
could not be achieved due insufficient core material received at the lab. The low extremity
UCS result, 39,2Mpa for NUS-DD-11-005 mineralisation is based solely on one core and
should therefore be excluded from any strength estimates used in further calculations.
4.2.4 Stress estimates
The following text describe professor in rock mechanics, Arne Myrvang’s expressions
regarding regional stress conditions in Finmark. Taken from (Myrvang, 2009).
‘‘ No in-situ rock stress measurements have been carried out near Nussir. However, regionally
in Fnnmark, horizontal stresses in the order of 20 MPa have been measured by overcoring in
the Sydvaranger iron ore mine, Kirkenes, the Stjernøy nephelin syenite mine, Altafjord, and
the Biddjovagge Cu, Au mine, Kautokeino. In the Sydvaranger case, high horizontal stresses
were measured at less than 50 m depth, and caused heavy spalling in the roof of the main
access ramp to a planned underground mine.
Another indicator of high horizontal stress has been up to 15 mm off-sets of vertical boreholes
in road-cuts in the Laksefjord and Porsangerfjord areas, i.e. not far from Nussir. Typically, in
Category Borehole Lithology UCSTensile
strE-Module
Poissons
ratioVelocity
Spec.
weight
Mpa Mpa Gpa m/s kg/m3
NUS-DD-08-033 * 47,0 -48,0 SST 122*** 5384 2660
NUS-DD-08-011 * 93,6 -95,0 SST 125*** 7***
NUS-DD-08-011 * 135,4 -142,1 SST 92 5383 2740
NUS-DD-11-002 142,0 -143,0 CLY 69,1 68,7 0,2 5422,1 2734
NUS-DD-11-005 309,0 -310,0 CLY 67,7 69,5 0,18 5233 2715
NUS-DD-08-033 * 51,5 -53,5 DOL 102*** 6*** 2730
NUS-DD-11-002 147,0 -148,0 DOL 120,8 60 0,24 5853,4 2698
NUS-DD-11-005 316,0 -317,0 SST 39,2** 45,7 0,27 5560,9 2667
NUS-DD-11-002 152,0 -153,0 CLY 99 74,8 0,19 5667,4 2675
NUS-DD-11-005 322,0 -323,0 SST 175,8 77,3 0,19 5732,1 2657
* From Lab tests carried out by Sigma H 2009, rest i s from Sintef lab test 2012
** Unrel iable test result, comprise of only one core
*** Based on point load index
hangwall
mineralisation
footwall
Depth
m

Assessment of underground mining of Nussir copper deposit
21
most cases the maximum horizontal stress seems to be oriented N-S to NW-SE. However, in
some of the locations high horizontal stresses have been measured also in the E-W direction.
Based on this, at Nussir, one must expect horizontal stresses considerably higher than the
vertical stress due to gravity even at moderate depths. This may result in stress induced roof
spalling in different types of drifts, and may also affect the stability of the hanging wall of
stopes. High horizontal stress normal to the strike of the orebody could result in shorter stope
lengths and increased waste dilution, and also spalling in drift along the strike. On the other
hand, high horizontal stress along the strike could favour longer stopes and less chance of
waste dilution.’’
Based on personal communication with Arne Myrvang 8th
of may 2012, discussing Nussir
stress consitions, I establish the following assumptions for further use in stope calculations:
Table 7 Assumptions for stresses acting on Nussir deposit
4.3 Stope design
In order to maintain a high level of safety in the mine, stopes must be dimensioned in
accordance with the actual conditions, at the same time keeping in mind that stope design has
a high influence on mining efficiency, recovery and costs. With the available data and
knowledge regarding rock mass and stress conditions, having a high level of uncertainty, one
can only suggest a conceptual stope design.
As the stope width will be given by ore thickness, varying between 2-5m, the main parameters
to determine is the maximum stope height one can allow before a horizontal sill pillar have to
be left, dividing the ore vertically. And the maximum stope length along strike one can allow
before a rib pillar or internal pillar is left for support. Stope height should be maximized,
Component Notation Unit
Vertical stress σv = ρgh Mpa
Density rock ρ = 2770 kg/m3
Gravity constant g = 9,81 m/s2
Max. Horizontal stress σH = 2 x σv + 10 Mpa
Direction of max. horizontal stress 160 Azimut
Min.horizontal stress σh = 0,66 x σH MPa
Direction of min. horizontal stress 70 Azimuth
Assessment of underground mining of Nussir copper deposit
22
reducing drift meters per tonne, but sill pillars must eventually divide the 300m high stoping
layout, reducing the chances for stope instability, hangwall breakings and dilution. Ore flow
downwards in the stope could also be a problem if footwall boundary is irregular. Stope
length and the number of rib pillars along strike influences mining efficiency and stoping cost
due to the 20m long slot hole required for blasting behind each rib pillar. Upward and
downward drilling from drifts should be utilized for efficiency, and optimal hole length is set
to be 20m along dip, making 17,66m vertically. Drill drifts are 4,5m high. Stopes depth will
be dimensioned to utilize drilling from two drifts. Shallower stopes can be higher, fitting three
drifts. Vertically. Dimensions and stress conditions for the two stope sizes are listed in Table
8.
Table 8 Inputs for stope stability calculations: Chosen dimensions, mineralisation UCS average and estimated
stresses acting in the centre of the stope, calculated from estimations in chapter 4.2.4.
The stresses used in further calculations are basically qualified guessing and should be backed
up by real measurements. One should also note that all Q-values in the following Table 9 are
calculated with an assumed stress reduction factor (SRF) of 20Mpa (Myrvang, 2012). The B-
factor assigned each evaluated stope surface in Table 9 expresses the joint orientation in
respect to each surface. Determined by (Golder, 2009) who performed geotechnical core
logging for Nussir.
Dimensions Stresses
Vertical height 62 m Vertical 7,1 Mpa
-80 stopes Dip height 72 m Hor.-strike 16,0 Mpa
Hor.-dip 24,3 Mpa
Vertical height 102 m Vertical 4,4 Mpa
-10 stopes Dip height 118 m Hor.-strike 12,4 Mpa
Hor.-dip 18,8 Mpa
Span (rib pillar) 5 m
Length 40 m UCS 120 Mpa
Dip 60o
Assessment of underground mining of Nussir copper deposit
23
Table 9 Stability number inputs. Q from Table 5 , A calculated by stress and UCS relation, B and C taken from
Golder 2009, HR calculated from stope dimensions. (a) lower -80 stope, (b) higher -10 stope
(a)
Low High A B C HR Low High
Back 26,09 147,62 0,45 0,8 1 1,40 9,4 53,1
Vertical end 26,09 147,62 0,45 0,5 8 1,44 47,0 265,7
Hangwall 19,29 75 0,7 0,4 4,5 12,8 24,3 94,5
Footwall 10,1 70,45 0,7 0,4 8 12,8 22,6 157,8
(b)
Low High A B C HR Low High
Back 26,09 147,62 0,59 0,8 1 1,40 12,3 69,7
Vertical end 26,09 147,62 0,59 0,5 8 1,46 61,6 348,4
Hangwall 19,29 75 0,95 0,4 4,5 14,9 33,0 128,3
Footwall 10,1 70,45 0,95 0,4 8 14,9 30,7 214,2
Stability numbers lower stope (-80 to -18 level
NQ
Q N
Stability numbers higher stope (-10 to +92 level)
Assessment of underground mining of Nussir copper deposit
24
Figure 8 Stability chart for two different Nussir stopes using Mathews method and Mawdsley et.al.2001
Stability contours. Coloured lines represent the stability number span due to variability in the Q-value
From Figure 8 we identify the vertical ends and the back as being stable, because the surfaces
have a very short open span. The hangwall and footwall is identified as being stable for higher
q-values, implying that the relatively large stopes require rock mass to be very good and
additional cable bolting in weak areas to secure stability during production. Both hangwall
and footwall surfaces from the lower and the higher stope lie below the 100% stability
regression line. With the variability in Q values, (Mawdesley, et al., 2001) stability contours
and the stability number calculations in Table 9 one can state at this point that the likelihood
Assessment of underground mining of Nussir copper deposit
25
for stope stability may be anything between 58% and 98%. The likelihood for stability in
stopes should ideally be 90% (Lappalainen, 2012). To achieve this, additional yielding pillars
should be left in the centre of each stope, to reduce the open span (Lappalainen, 2012). Cable
bolting of hangwall should be carried out additionally when needed.
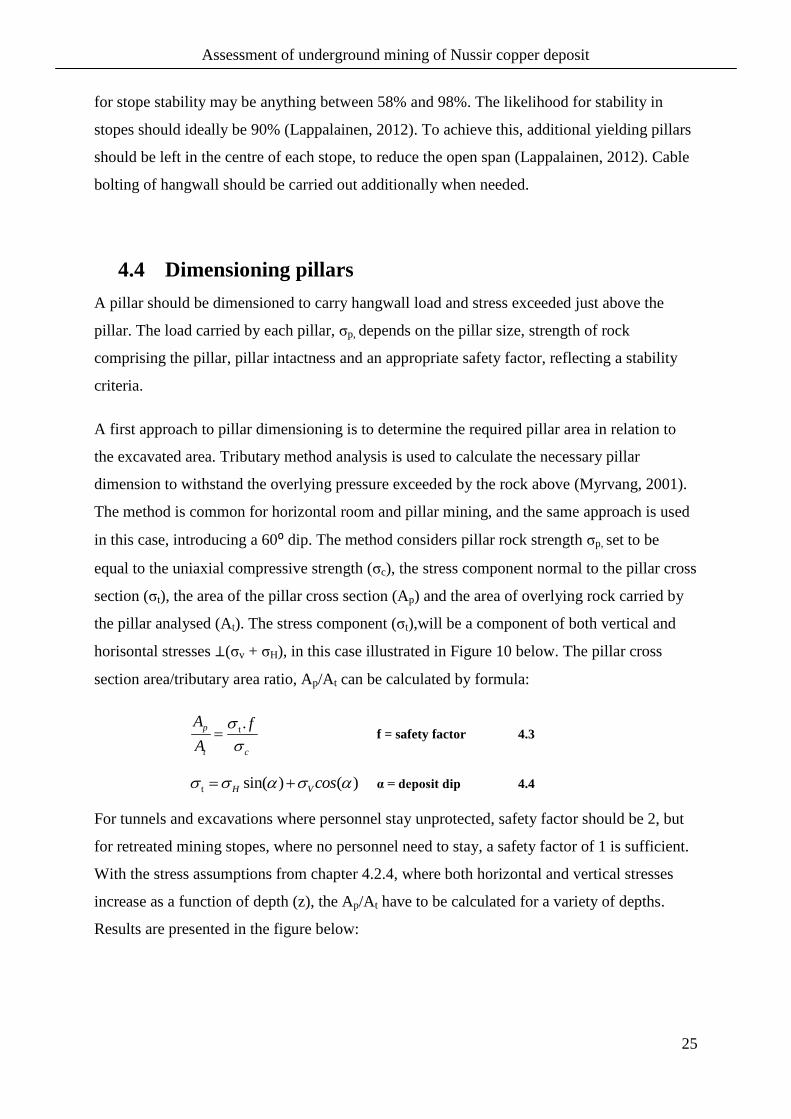
4.4 Dimensioning pillars
A pillar should be dimensioned to carry hangwall load and stress exceeded just above the
pillar. The load carried by each pillar, σp, depends on the pillar size, strength of rock
comprising the pillar, pillar intactness and an appropriate safety factor, reflecting a stability
criteria.
A first approach to pillar dimensioning is to determine the required pillar area in relation to
the excavated area. Tributary method analysis is used to calculate the necessary pillar
dimension to withstand the overlying pressure exceeded by the rock above (Myrvang, 2001).
The method is common for horizontal room and pillar mining, and the same approach is used
in this case, introducing a 60⁰ dip. The method considers pillar rock strength σp, set to be
equal to the uniaxial compressive strength (σc), the stress component normal to the pillar cross
section (σt), the area of the pillar cross section (Ap) and the area of overlying rock carried by
the pillar analysed (At). The stress component (σt),will be a component of both vertical and
horisontal stresses ⊥(σv + σH), in this case illustrated in Figure 10 below. The pillar cross
section area/tributary area ratio, Ap/At can be calculated by formula:
t .p
t c
A f
A
f = safety factor 4.3
t sin( ) ( )H V cos α = deposit dip 4.4
For tunnels and excavations where personnel stay unprotected, safety factor should be 2, but
for retreated mining stopes, where no personnel need to stay, a safety factor of 1 is sufficient.
With the stress assumptions from chapter 4.2.4, where both horizontal and vertical stresses
increase as a function of depth (z), the Ap/At have to be calculated for a variety of depths.
Results are presented in the figure below:

Assessment of underground mining of Nussir copper deposit
26
Figure 9 Results from tributary area method. Given UCS=120Mpa and the stress estimates from 4.2.4.
The tributary area method results indicate that the necessary pillar cross section area for a
pillar located at the deepest parts of the suggested Nussir mine, must be 23% of the deposit
surface area. At shallower levels, fewer, or smaller pillars could be sufficient, according to
results in Figure 9, but in our case, we have increased the stope height for shallower levels
rather than decreasing pillar sizes. Pillar size for the main supporting pillars between the
stopes, will be 5m thick rib pillars and 8m high sill pillars.
Figure 10 Illustration of tributary area method for calculating necessary pillar area Ap carrying the area At with
the load σt caused by stresses.
0
100
200
300
400
500
600
7 % 12 % 17 % 23 % 28 % 33 %
Depth below surface [m]
Required pillar area Ap/At [%]

Assessment of underground mining of Nussir copper deposit
27
In addition to the overall rib and sill pillar support, a large internal rib pillar should be left
between each stoping section A,B,C and D for global stability of mine. Suggested pillar width
is 10m, but this could easily be increased if necessary. Also additional yielding pillars should
be left in the centre of each stope with 5m width and 10 m height. In the highest stopes with
118m dip height, two of these pillars will be needed. The yielding pillars will be left below
drift in the downhole stoping sequence. By the term yielding, it means that the pillar is
planned to yield over after time, due to stresses, stille being able to carry some load
(Lappalainen, 2012). There will be some 380 tonnes ore loss per yielding pillar including
some 15 tonnes of crushed material trapped on top of each pillar.
Ore loss in pillar design for 62m high stopes, illustrated in Figure 10 is calculated by Ap/At
relation to be 20,1% including 15 tonnes crushed ore trapped on yielding pillar.
4.5 Stability of mine
The empirical Mathew’s method, modified by (Mawdesley, et al., 2001), is a well regarded
calculation method, but input data used in this report, must be treated with caution. The
proposed stope layout, with given dimensions in ch.4.3 p.21, are therefore empirically
estimated to be stable with a probability range of 58-98%, rather than stating a fixed
probability number. This probability range is used to reflect the variability of registered Q-
values, rather than Q-value average. The Q-values also introduce uncertainties in itself,
relying on a guestimated stress reduction factor of 20MPa. Values area also a subject of an
individual geologists work, in this case (Golder, 2009).
The mine is highly dependent on achieving stability. Even though stopes are retreated with no
personnel staying within the open stopes, 90% of stopes are recommended to be stable after
excavation (Lappalainen, 2012). The recommendation is considered viable, coming from an
experienced mining engineer with narrow mining experience, and logical in the sense that
stope failure incur ore loss and dilution, but the likelihood that 10% of stopes fail, is a risk we
can defend by cost savings of utilizing bigger stopes.

Assessment of underground mining of Nussir copper deposit
28
The largest uncertainty for mine stability in this report is the in-situ stresses acting upon the
mine design. Both direction and magnitude of the principal stress, used in calculations are
guestimates. Direction assumed normal to strike, is the optimum direction when opening
stopes along strike. The consequence of principal stress oriented parallel to stopes, can be
derived from the Mathews method stability number (N) equation. A factor will decrease when
stope parallel stresses are higher, giving a lower stability number for the stope surface. The
magnitude of horizontal stresses have high influence on mine stability as it determines the
strain exceeded on stope walls and pillars. Assumed values of horizontal stress, are believed
to be realistic, with a slight probability of being exaggerated. The assumption of σH=2σV +10
(Mpa) is anyhow backed up by regional stress conditions in Finmark and recommendations
from a rock mechanical professor with Finmark experience (Myrvang, 2012).
Pillar dimensions and stope open spans, are identified as the most important mine parameters
for stability. Pillars carry the concetrated pressure from surrounding rock, when stopes are
opened, and stope surfaces have a certain span of unsupported area between pillars. Pillar
dimensioning by tributary area method, is regarded as suitable for the overall pillar area
dimensioning at this early stage of mine planning, before numerical analyses provide
foundation for optimal pillar dimensioning. Results should however be treated with caution:
The load in which each pillar is able to carry σp, will normally be lower than the rock strength
comprising the pillar σc, due to pillar spalling and fractures. It is therefore realistic to assume
that reality demand larger pillar area, creating lower ore recovery.
Stability of hangwall and footwall in stopes, cannot be achieved without additional support of
yielding pillars and cable bolting, according to Mathew’s method. Whether the proposed
additional support is sufficient, is difficult to quantify without numerical analysis. Stopes are
anyhow chosen to be dimensioned this way, given the stability uncertainties, as it allows more
cost efficient mining, than smaller stopes.
The other option is of course to reduce stope size to 40m long, 45m high separated by rib and
sill pillars, providing a hangwall hydraulic radius of 11,3, plotting within the 70% stability
contour for the lower Q-value scenario. Consequence is 33% more drill drifts required,
yielding 8% increased mining production cost.

Assessment of underground mining of Nussir copper deposit
29
5. Dillution and cut-off
5.1 Economic definition of ore
Economic definition of ore as that definition which maximize the net present value of a
mining operation. Present value dependent on time, the resource and a set of variables in
which describes the way in which the operation is to be conducted (Lane, 1988). Purpose of
an economic model is to provide a means for calculating the effect of changes in certain
variables. Economic model components are:
Mineralised material; Also called the mining component, concerning the development
needed to access the interior of a mineralised body. For underground mines, it includes
Development, raising and cross-cutting. Costs are incurred per tonne of mineralised material
made accessible and capacity is the maximum rate at which the needed development can be
carried out.
Ore; can also be called the treatment component, concerning with the extraction and
treatment of that parts of a mineralised body defined to be ore. For underground mines, it
includes Stoping, Hauling, grinding and separation. Costs are incurred per tonne of ore
extracted and the capacity is the maximum of throughput of ore that the installation can
handle.
Mineral; can also be called the marketing component, involving smelting refining and
selling. Costs are incurred per unit of mineral and the capacity is a limit of the output of
mineral.
Cash flow arising from one unit of mineralised material is:
C = Marketing income – Treatment cost – Mining cost – Fixed costs
5.1
Where; p = price per unit of mineral
k = marketing cost/unit unit mineral output (smelting, refinement and selling)
y = yield of mineral in the treatment process in percentage (process recovery)
gh= average grade of the ore as a mineral, ore ratio (head grade)
x = amount of mineralised material classified as ore (tonnage in the unit)
Assessment of underground mining of Nussir copper deposit
30
h = treatment cost per unit throughput (operating and processing cost/tonne)
m = Development cost per unit throughput (capital cost per tonne)
f = time costs per year (fixed costs like electricity, administration etc.)
= time taken to work through one unit of mineralised material.
5.2 Economic Cut-off
Economic cut-off (gcut-off) is applied to mineralised material to define ore, thus being the
mineral ore ratio (Lane, 1988). It should not be mixed up with the geologic cut-off, which is
applied to overall rock mass to define mineralised material. The average grade of ore within
the cut-off boundary (gh) is that grade, fulfilling a certain profit criteria or the grade in which
the ore pays for itself, hence the break even grade given by equation:
( )b
hg
p k y
5.2
A cut-off grade is a complex number depending on economic variables, but also on the nature
of the mineralisation. It dictates the selection of mining method, by defining the location and
tonnage of ore. A high cut-off grade, may require more selective mining method, affecting
mining cost and capacity. If high capacity method is chosen instead, mining costs per tonne
may decrease, allowing a lower cut-off (Hall, 2003). Change in raw material prices, costs and
technology may also affect the cut-off for production in a long term or short term. It is tempting to
mine the high grade stopes at once, gaining quick money, but saving them for periods of low raw
material prices, may be the crucial step to avoid mine closure. Production rate and cut-off decided
by the mine management, will affect the projects value, usually calculated as the net present
value. (Hall,2003) illustrates the value-cut-off-production rate relation in the three dimensional
graph illustrated in Figure 11, and how both cut-off and production rate must be optimized together
to climb the hill of value.
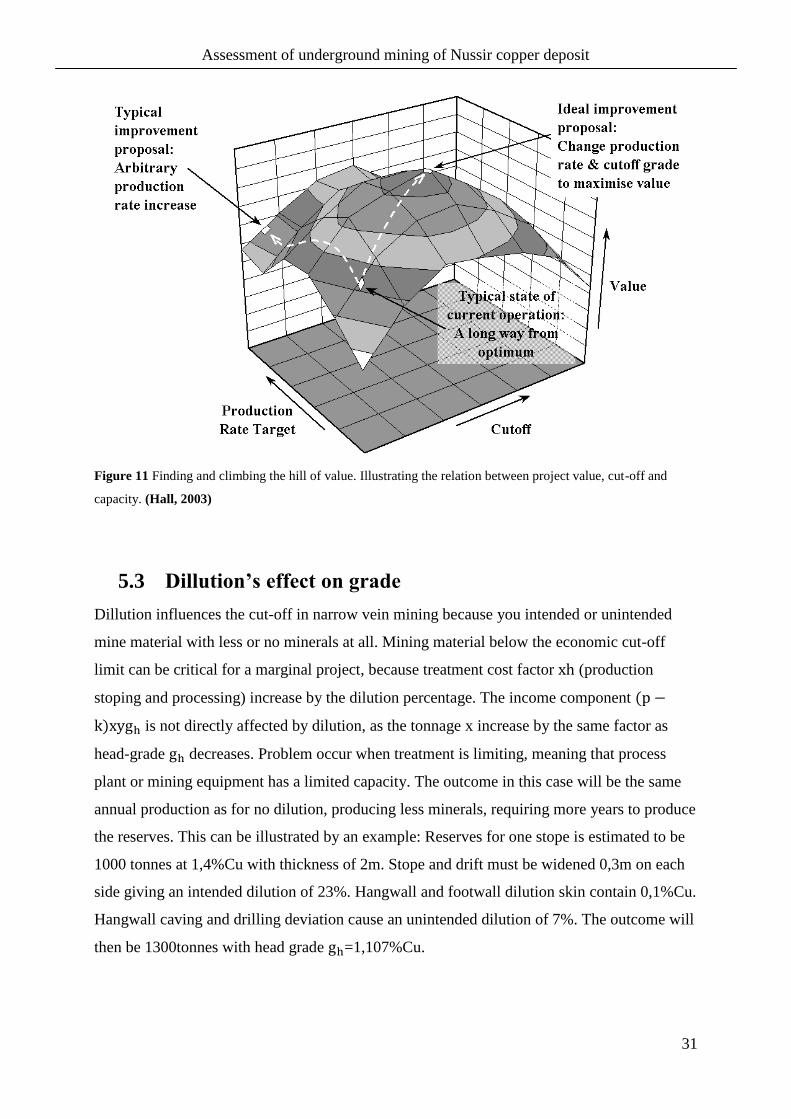
Assessment of underground mining of Nussir copper deposit
31
Figure 11 Finding and climbing the hill of value. Illustrating the relation between project value, cut-off and
capacity. (Hall, 2003)
5.3 Dillution’s effect on grade
Dillution influences the cut-off in narrow vein mining because you intended or unintended
mine material with less or no minerals at all. Mining material below the economic cut-off
limit can be critical for a marginal project, because treatment cost factor (production
stoping and processing) increase by the dilution percentage. The income component
is not directly affected by dilution, as the tonnage x increase by the same factor as
head-grade decreases. Problem occur when treatment is limiting, meaning that process
plant or mining equipment has a limited capacity. The outcome in this case will be the same
annual production as for no dilution, producing less minerals, requiring more years to produce
the reserves. This can be illustrated by an example: Reserves for one stope is estimated to be
1000 tonnes at 1,4%Cu with thickness of 2m. Stope and drift must be widened 0,3m on each
side giving an intended dilution of 23%. Hangwall and footwall dilution skin contain 0,1%Cu.
Hangwall caving and drilling deviation cause an unintended dilution of 7%. The outcome will
then be 1300tonnes with head grade =1,107%Cu.

Assessment of underground mining of Nussir copper deposit
32
5.4 Dilution in narrow mining
Dilution in narrow vein mining is a serious concern that may cause dramatic head grade drop
for the mined ore. Dilution can easily occur because the ore itself is so thin, that excavation
may intended or unintended include country rock from hangwall or footwall. The intended
dilution, which we can calculate in advance, may be drifts dimensioned for machine width in
a part of the ore where thickness is less than drift width. This dilution can be reduced by
utilizing special narrow mining equipment and carefully plan drifts to follow ore boundary
(Finkel, et al., 1993). The unintended dilution, may be caused by long hole drill holes
deviating into the country rock or hangwall caving in the stopes. Longhole deviation can be
reduced by using modern longhole rigs, analysing drill cuttings to verify that drilling actually
takes place in the ore. However, the safest way to reduce risk of drill hole deviation, is
reducing sublevel interval, making shorter drill holes. Dilution from hangwall caving can be
reduced by cable bolting the hangwall from each drill drift or leaving more pillars. For high
grade ores, the additional cost of cable bolting can easily be defended by the value of each
stope, but for low grade ores, leaving pillars may be more economic. This question is
discussed in more detail with examples from the Viscaria mine (ch. 6.2.3 p.43).
When evaluating Nussir mine design, sublevel interval pops up in several occasions as a key
parameter for stability, cost, production rate, dilution and turnover. Higher sublevel intervals,
meaning fewer drill drifts, will cause a lower operating cost, as stoping is a cheaper way to
extract ore than drifting, but drill holes would have to be longer, thus more dilution caused by
deviation. More drill drifts will also allow denser cable bolting of hangwall, reducing the
unsupported span.
5.5 Nussir dilution estimates
Dillution must be included in the calculation of probable reserves, because every past
experience with narrow ore mining point to the fact that dilution will occur (ch.6.2 p.37).
What we know about the Nussir deposit from drilling is that the nature of the mineralisation,
make mineral grades vary along ore thickness. A general trend is identified, being increased
Cu-grade in the middle of the mineralised horizon, with decresing Cu-grade toward footwall
and hangwall. High Au and Ag grades are normally located in the middle or just below the
middle of the mineralisation and high Pd and Pt grades usually occur along footwall, just
below the high Cu-grades (Sletten, 2011). Thickness of the minable area covered in this
Assessment of underground mining of Nussir copper deposit
33
report, varies between 1,43-6,2 with an average of 2,9m. Mineralisation regularity have been
described as very smooth and straight, being a sediment horizon (Sletten, 2011, ch. 2).
Wireframe model of indicated resources also present deposit surface as smooth. Even if
sampling density is only 150-250m, implying that deposit may be bulky between holes, I
choose to consider current model as realistic for ore boundary in the following estimations.
With the current knowledge and data, I choose thickness as the resource variable affecting
dilution, given that sublevel interval and mining equipment remain the same for all stopes.
The relation will be given by the curve and equation in Figure 12 below.
Figure 12 Imaginary relation between mineralisation thickness and dilution, given that sub-level interval and
mining equipment remain the same for all stopes.
Dillution equation:
0.96250.7725D t , t= thickness 5.3
Calculated resources in each stope, will be added dilution. This means that the tonnage per
stope will increase by the dilution percent from equation
C=( 5.1:
0 %
20 %
40 %
60 %
80 %
100 %
120 %
1 1,5 2 3 4 6
Dillution
Mineralisation thickness [m]
Possible dillution curve
D=0,7725t-0,9625
Assessment of underground mining of Nussir copper deposit
34
mod (100% )elTonnage Tonnage D 5.4
Head grade will be given by:
mod
100%
el dillutionh
g Dgg
D
5.5
Dilution grade will be set to be 0,1%Cu, 1ppmAg and 0,02ppm Au, based on a simple drill
sample observation.

Assessment of underground mining of Nussir copper deposit
35
6. Mining methods
6.1 Underground Mining methods
6.1.1 Sublevel open stoping
Sublevel open stoping (SLOS) is used for mining mineral deposits with; steep dip where the
footwall inclination exceeds the angle of repose; stable rock in both hanging wall and
footwall; competent ore and host rock; and regular ore boundaries. SLOS recovers the ore in
large open stopes, which are normally backfilled to enable recovery of pillars.
The orebody is divided into separate stopes, between which ore sections are set aside for
pillars to support the roof and the hanging wall. Pillars are normally shaped as vertical beams,
across the orebody. Horizontal sections of ore are also left as crown pillars (Hartman, 1987).
Miners want the largest possible stopes, to obtain the highest mining efficiency, subject to the
stability of the rock mass. This limits their design dimensions.
Sublevel drifts are located within the orebody, between the main levels, for longhole drilling
of blast patterns. The drill pattern accurately specifies where the blastholes are collared, and
the depth and angle of each hole. Drawpoints are located below the stope to enable safe
mucking by LHD machines, which may tip into an adjacent orepass, or into trucks or rail cars.
The trough-shaped stope bottom is typical, with loading drifts at regular intervals. Nowadays,
the loading level can be integrated with the undercut, and mucking out performed by a remote
control LHD working in the open stope. This will reduce the amount of drift development in
waste rock. Sublevel stoping requires a straightforward shape of stopes and ore boundaries,
within which only ore is drilled. In larger orebodies, modules of ore may be mined along
strike, as primary and secondary stopes.
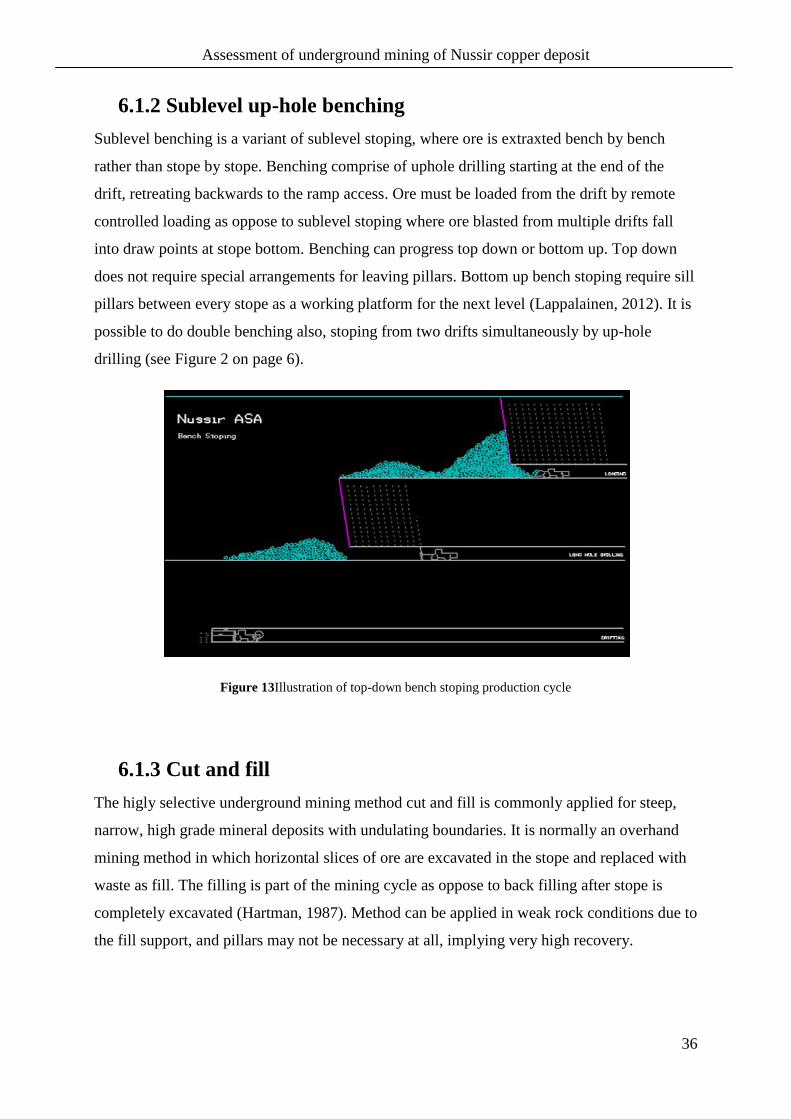
Assessment of underground mining of Nussir copper deposit
36
6.1.2 Sublevel up-hole benching
Sublevel benching is a variant of sublevel stoping, where ore is extraxted bench by bench
rather than stope by stope. Benching comprise of uphole drilling starting at the end of the
drift, retreating backwards to the ramp access. Ore must be loaded from the drift by remote
controlled loading as oppose to sublevel stoping where ore blasted from multiple drifts fall
into draw points at stope bottom. Benching can progress top down or bottom up. Top down
does not require special arrangements for leaving pillars. Bottom up bench stoping require sill
pillars between every stope as a working platform for the next level (Lappalainen, 2012). It is
possible to do double benching also, stoping from two drifts simultaneously by up-hole
drilling (see Figure 2 on page 6).
Figure 13Illustration of top-down bench stoping production cycle
6.1.3 Cut and fill
The higly selective underground mining method cut and fill is commonly applied for steep,
narrow, high grade mineral deposits with undulating boundaries. It is normally an overhand
mining method in which horizontal slices of ore are excavated in the stope and replaced with
waste as fill. The filling is part of the mining cycle as oppose to back filling after stope is
completely excavated (Hartman, 1987). Method can be applied in weak rock conditions due to
the fill support, and pillars may not be necessary at all, implying very high recovery.
Assessment of underground mining of Nussir copper deposit
37
6.1.4 Narrow vein mining
Special methods and variants of the methods described above, can be used to mine steeply
dipping narrow ore bodies. The term vein is commonly used in addition, because narrow
deposit are usually associated with a vein mineralisation, but as for the case of Nussir a
narrow mineralisation can also be a thin sedimentary horizon. Definitions vary, but (Finkel, et
al., 1993) define narrow ore bodies to be less than 4m thick. Prior to the development of
mechanized mining in the 80’s, steep narrow deposits, where mined by labour intensive
methods with handheld equipment, if mineralisation was rich or labour was cheap. Methods
relied mainly on timber sets to support the walls during mining, but the technique of
backfilling started developing when material handling became more efficient, also known as
the cut-and fill method. In high labour cost countries, mining engineers saw the need for
improved capacity and efficiency to economically mine steep narrow ore bodies, but the
dimension of available equipment where so large that drifts and stopes would have to be made
wider than the mineralisation (Finkel, et al., 1993).
Modern mining methods for steep narrow ore bodies, aim to mine selective, cost efficient and
safely, by utilizing small mechanized equipment. Stability is either achieved by back fill or
pillars. Retreating methods allow stopes to deform after extraction, as long as the overall
stability of the mine is maintained. Including cut and fill described in 6.1.3, there are a variety
of possible mining methods, unique to each deposit.
6.2 Narrow mining case studies
Mining is a practical discipline, theories can only be used as principles and guidelines. Every
deposit is unique and so is the mine producing from it. Three different case studies will
therefore be presented, to gain background knowledge about narrow ore mining: An extensive
research project from Zinkgruvan, a field visit to Zinkgruvan and experiences from Viscaria.
Assessment of underground mining of Nussir copper deposit
38
6.2.1 Zinkgruvan research project
An extensive research project was carried out in the 80’s by Finkel, Olson and Thorshag, to
demonstrate by full scale trials at Zinkgruvan, the technical and economical feasibility of
applying mechanised sublevel stoping and cut and fill for mining steeply dipping narrow ore
bodies. Previous mining practices of narrow ore bodies, where labour intensive, with low
production and excessive dilution, reducing value of the product. Together with partners Atlas
Copco, Sandvik Rock Tools, Boliden Mineral, Nitro Nobel and SveDeFo, test mining was
carried out on a selected block in Nygruvan, of 50m height and 150m length. The area is
characterised by distinct layering in both strike and dip directions with distinct ore
boundaries.
The zink, copper, lead, silver mine in the southern part of the Bergslagen region of central
Sweden, can be looked upon as a reference mine for studying mining of steeply dipping
narrow vein ore bodies. The Zinc-rich ores at Zinkgruvan, consist of sphalerite and galena,
occurring as stratified, calciferous, leptite impregnations. Grades vary from 6-10% Zn, 1,5-
5% Pb and about 45g/tonne Ag. Ore body occur in a 5-25m thick stratified zone in the upper
part of a meta-volcanic sedimentary group. The geometry of the ore body is a 5m long tabular
body, known to a depth of 1500m (Lundin) with a thickness varying between 0,5 and 10m.
Strike is east-west, dipping 70-75⁰ north, and the orebody is intersected by a north-northeast
subvertical fault system dividing mining area into two blocks, the Knalla mine in the west and
Nygruven to the east.
In rock mechanical terms, the area chosen for test mining, is dominated by good rock
qualities. Hangwall consist of a homogeneous gneiss-leptite of good strength. The ore is
compact and of continuous and regular mineralisation. The ore block above and to the side of
the test area, where mined out. The stress state is therefore assumed to be representative of
that of a typical mining block. The maximum principal stress is horizontal, oriented
perpendicular to strike, and of relatively high magnitude (Finkel, et al., 1993).
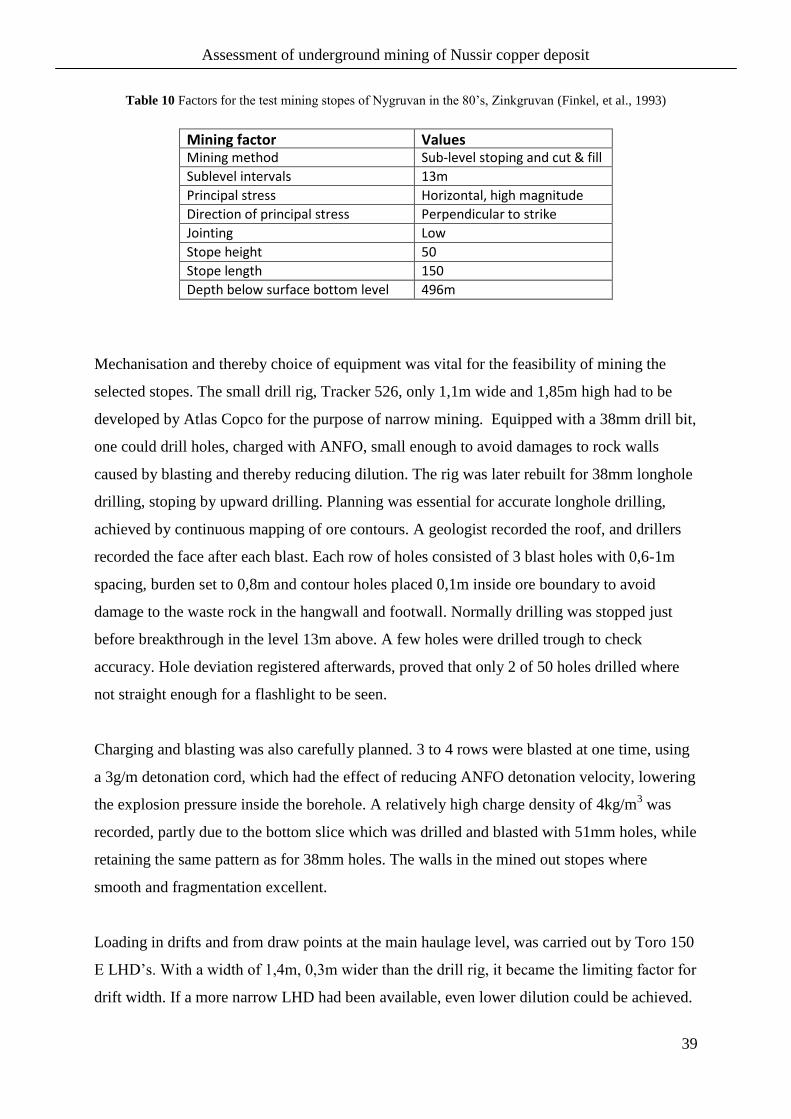
Assessment of underground mining of Nussir copper deposit
39
Table 10 Factors for the test mining stopes of Nygruvan in the 80’s, Zinkgruvan (Finkel, et al., 1993)
Mining factor Values Mining method Sub-level stoping and cut & fill
Sublevel intervals 13m
Principal stress Horizontal, high magnitude
Direction of principal stress Perpendicular to strike
Jointing Low
Stope height 50
Stope length 150
Depth below surface bottom level 496m
Mechanisation and thereby choice of equipment was vital for the feasibility of mining the
selected stopes. The small drill rig, Tracker 526, only 1,1m wide and 1,85m high had to be
developed by Atlas Copco for the purpose of narrow mining. Equipped with a 38mm drill bit,
one could drill holes, charged with ANFO, small enough to avoid damages to rock walls
caused by blasting and thereby reducing dilution. The rig was later rebuilt for 38mm longhole
drilling, stoping by upward drilling. Planning was essential for accurate longhole drilling,
achieved by continuous mapping of ore contours. A geologist recorded the roof, and drillers
recorded the face after each blast. Each row of holes consisted of 3 blast holes with 0,6-1m
spacing, burden set to 0,8m and contour holes placed 0,1m inside ore boundary to avoid
damage to the waste rock in the hangwall and footwall. Normally drilling was stopped just
before breakthrough in the level 13m above. A few holes were drilled trough to check
accuracy. Hole deviation registered afterwards, proved that only 2 of 50 holes drilled where
not straight enough for a flashlight to be seen.
Charging and blasting was also carefully planned. 3 to 4 rows were blasted at one time, using
a 3g/m detonation cord, which had the effect of reducing ANFO detonation velocity, lowering
the explosion pressure inside the borehole. A relatively high charge density of 4kg/m3 was
recorded, partly due to the bottom slice which was drilled and blasted with 51mm holes, while
retaining the same pattern as for 38mm holes. The walls in the mined out stopes where
smooth and fragmentation excellent.
Loading in drifts and from draw points at the main haulage level, was carried out by Toro 150
E LHD’s. With a width of 1,4m, 0,3m wider than the drill rig, it became the limiting factor for
drift width. If a more narrow LHD had been available, even lower dilution could be achieved.
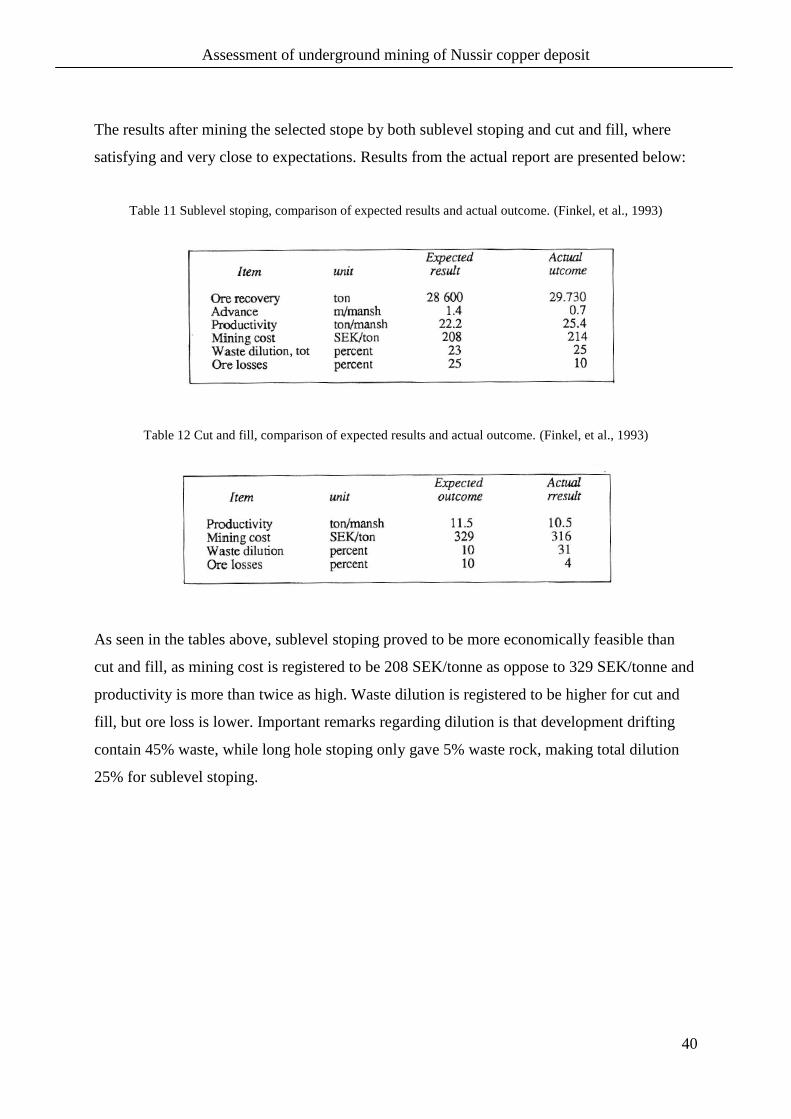
Assessment of underground mining of Nussir copper deposit
40
The results after mining the selected stope by both sublevel stoping and cut and fill, where
satisfying and very close to expectations. Results from the actual report are presented below:
Table 11 Sublevel stoping, comparison of expected results and actual outcome. (Finkel, et al., 1993)
Table 12 Cut and fill, comparison of expected results and actual outcome. (Finkel, et al., 1993)
As seen in the tables above, sublevel stoping proved to be more economically feasible than
cut and fill, as mining cost is registered to be 208 SEK/tonne as oppose to 329 SEK/tonne and
productivity is more than twice as high. Waste dilution is registered to be higher for cut and
fill, but ore loss is lower. Important remarks regarding dilution is that development drifting
contain 45% waste, while long hole stoping only gave 5% waste rock, making total dilution
25% for sublevel stoping.

Assessment of underground mining of Nussir copper deposit
41
6.2.2 Field visit to Zinkgruvan
Author of this report made a field visit to Zinkgruvan, currently operated by Lundin Mining
on the 15th of March 2012, to gain experience from their current narrow mining operation of
the Cecilia orebody, discussing technical solutions with mine planning chief Jouni Hansen-
Haug.
Total production of 1 million tonne ore at Zinkgruvan was reached in 2011, with aims of even
higher production for 2012, as their new ramp access allow higher capacity and flexible
logistic for the mine (Lundin). Current mining operations are divided in three separate, steeply
dipping ores: The thick Burkland ore representing over 50% of planned production, the large
plate shaped ore Nygruvan, and the small narrow Cecilia orebody 3 km south of Nygruvan
(Figure 14), targeted for investigation due to its similarities with Nussir.
Figure 14 Overview of Zinkgruvan resources and reserves. Current narrow mining operation is in the yellow
reserves named Cecilia. Narrow test mining in the 80’s happened at level 496 of Nygruvan. Zinkgruvan Mining
The reserves of Cecilia ore, make up a tabular plate shape of 350 height, 360m length along
strike, dipping 70o and thickness varying between 3 and 5m. Mining of Cecilia recently
started at level 650m and will advance upward by single lift benching, referred to as Avoca
mining, involving bottom up mining, with lateral drill drift development along strike from a
ramp to both directions until the cut-off boundary (Figure 15). Drill drift interval (sublevel
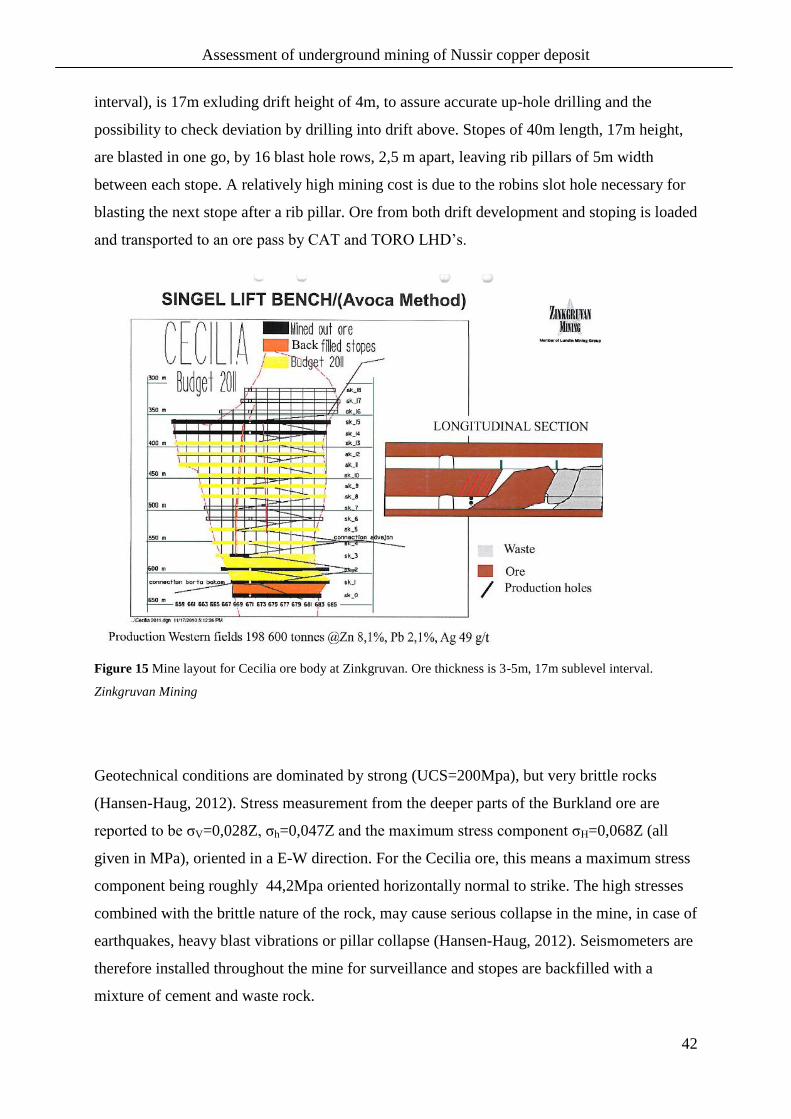
Assessment of underground mining of Nussir copper deposit
42
interval), is 17m exluding drift height of 4m, to assure accurate up-hole drilling and the
possibility to check deviation by drilling into drift above. Stopes of 40m length, 17m height,
are blasted in one go, by 16 blast hole rows, 2,5 m apart, leaving rib pillars of 5m width
between each stope. A relatively high mining cost is due to the robins slot hole necessary for
blasting the next stope after a rib pillar. Ore from both drift development and stoping is loaded
and transported to an ore pass by CAT and TORO LHD’s.
Figure 15 Mine layout for Cecilia ore body at Zinkgruvan. Ore thickness is 3-5m, 17m sublevel interval.
Zinkgruvan Mining
Geotechnical conditions are dominated by strong (UCS=200Mpa), but very brittle rocks
(Hansen-Haug, 2012). Stress measurement from the deeper parts of the Burkland ore are
reported to be σV=0,028Z, σh=0,047Z and the maximum stress component σH=0,068Z (all
given in MPa), oriented in a E-W direction. For the Cecilia ore, this means a maximum stress
component being roughly 44,2Mpa oriented horizontally normal to strike. The high stresses
combined with the brittle nature of the rock, may cause serious collapse in the mine, in case of
earthquakes, heavy blast vibrations or pillar collapse (Hansen-Haug, 2012). Seismometers are
therefore installed throughout the mine for surveillance and stopes are backfilled with a
mixture of cement and waste rock.

Assessment of underground mining of Nussir copper deposit
43
Being a steeply dipping (70o), narrow ore deposit (3-5m), ore boundary control at Cecilia, is
vital for keeping dilution low. Otherwise will occupy limited haulage capacity, which is
already associated with long distances and high costs. . Zinkgruvan have established a good
practice for mining, where drill drifts are carefully planned in accordance with mineralisation.
For each blast section, geologist sketch the hangwall and footwall lithology, to identify
whether drift excavation has gone too far into country rock or if mineralisation still remain in
the drift walls. From this, dilution and ore loss is registered, and the next blast is adjusted to
match ore boundary. Drifts will then vary in width, to match ore thickness exactly. Luckily,
ore thickness is the limiting factor for drift width, not machine width, which was the case in
Olson and Thorsag’s narrow mining trials in Nygruvan. When drifts are excavated to the end
of economic mineralisation at several levels, accurate up-hole drilling can be done based on
data collected from drifts.
6.2.3 Viscaria mine
A mining operation worth mentioning, when discussing narrow mining, is the Viscaria copper
and gold mine in northern Sweden, operating between 1983 and 1997. The sediment hosted
deposit occur as a copper rich graphite and copper rich limestone with thickness varying
between 5 and 30m with an average width of 10m (Mäkinen, et al., 1987). The dip also varies
between 80⁰ and 90⁰ in the northern area, and between 70⁰ and 80⁰ in the souther area, where
dip declines to 45⁰ below 200m depth. Ground conditions vary throughout the mine for
different lithologic units. Strongest are the greenstones with measured compressive strength
(UCS) of 225MPa. The graphite schist often occurring along hangwall have a measured
compressive strength of 100MPa. In 1987 the production was reported to be 1,3Mt at 2,5%
Cu with 250 employees (Viscaria,1987)
Viscaria deposit was primarily mined by tree variants of sublevel stoping, where sublevel
intervals are adjusted according to dip, thickness and ground conditions (Viscaria, 1987). As
seen in Figure 16A, near vertical parts of deposit being 10m thick was efficiently exploited by
30m longholes both upward and downward. When dip is below 60⁰ illustrated in (C), one
needed twice as many drill drifts for cable bolting purposes. (Mäkinen and Paganus) predicted
that a hangwall collapse in stopes dipping less than 60⁰ with 2 - 3,5%Cu would cause greater
economic loss than the additional cost of an extra drift-level and/or cable bolting. They also

Assessment of underground mining of Nussir copper deposit
44
calculated backfilling to be profitable in the high, near vertical stopes (Figure 16A), if grade
was above 4%Cu.
Figure 16 Sublevel stoping methods applied to 10m thick Viscaria deposit in the 80’s. Sublevel interval is
consequently decreased for declining ore dip, seen in (B) and (C). Unfavorable ground conditions caused by
graphite schist and low dip require additional cable bolting for support of hangwall (Mäkinen, et al., 1987).
An other method described in a paper from 1997 by (Marttala) is called the top slicing
method, applied to mine parts of Viscaria deposit less than 4m wide. Method is similar to up-
hole single benching with top-down progression. Sill pillars are left between every sublevel
and rib pillars are left along strike, drilling 25m upward from each drift level. Relatively high
production capacity is achieved, by 5m wide drifts, with loading drifts every 50m to the
hangwall side of drifts, allowing space for a 10t remote controlled LHD and 30t highway
trucks into the drift. Drift dilution is in the order of 25-50%, but (Marttala, 1997) express that
drift face where some times blasted in two operations to separate ore from waste. Yet, only
practically doable in the case of near vertical ore boundaries and plenty of time to do the extra
job.
Assessment of underground mining of Nussir copper deposit
45
6.3 Choosing mining method
Initial evaluation of possible mining methods for Nussir copper deposit, is not necessary for
this study, but rather a detailed assessment of mine design parameters for the selected method,
and establishment of known narrow mining practices. Previous assessment of Nussir mining
methods, carried out by (Golder, 2009), identified the more likely and favourable mining
methods, based on empirical selection methods. From UBC mining method selection, cut and
fill came out as the most favoured option, followed by sublevel stoping and shrinkage stoping.
Cut and fill method is proven favourable because of the underlying parameters of the
selection method; geometry, thickness, plunge and rock mass quality, but it is not favourable
when considering the value of mineralisation in relation to method costs. With the current
level of copper price being 6600$/t and the average copper equivalent grade (Cu grade+ Ag
and Au grade in price relation to Cu), being 1,45%Cu for the targeted areas, each tonne of ore
has an approximate value of 400NOK in sales revenue. We can see from a first glance that ore
value is not high enough to defend cut and fill, which is a high operational cost method.
Shrinkage stoping, is not considered as a possible method due to hazardous working
conditions occuring when the working platform in the stope is a pile of crushed ore.
Top-down bench stoping was considered for Nussir by (Smeberg, et al., 2011) for its ability to
open up large stopes without the risk of blocked production due to hangwall breakings, but
ramp access to the top requires high investments before mining can start. Method might be
more suitable when advancing in depth. Bottom up double bench stoping, leaving sill pillars
every 50m vertically have also been considered during the thesis, for its ability to mine safely
in small stopes being 40m long, 44m high. However, this method require 12 drill drifts,
drilling upward only, increasing mining costs.
The large 300x350m stope layout with evenly distributed small pillars, suggested by
(Smeberg, et al., 2011), was considered as an alternative for it’s low development and drift
costs, but later rejected after studying narrow mining practices. The 300m high stope design,
without any sill pillars in between, involve high risk and low flexibility.
Sublevel stoping is hereby the favourable mining method for Nussir deposit, as it can easily
be adapted to the narrow steep geometry, with lower operational costs and higher capacity
compared to cut and fill and bench stoping. Progression should be bottom up, with 40m sub-
level intervals, drilling 20m updip from bottom drift and upward and downward from higher
drifts.

Assessment of underground mining of Nussir copper deposit
46
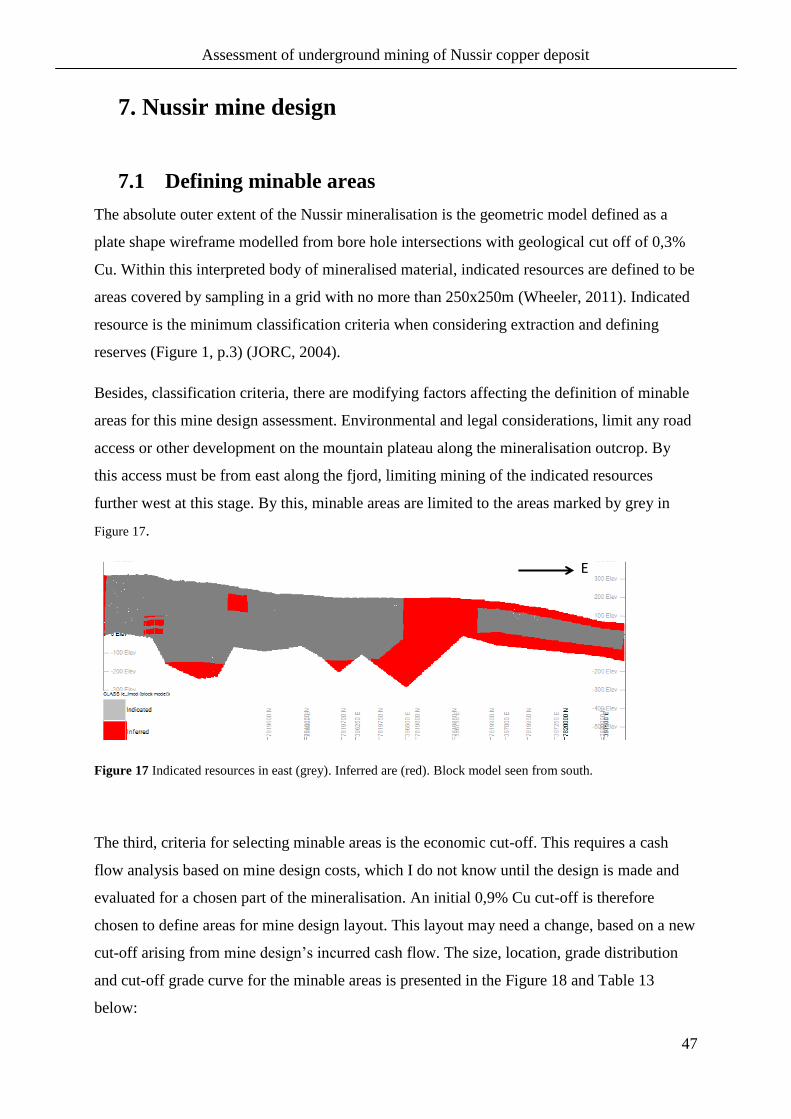
Assessment of underground mining of Nussir copper deposit
47
7. Nussir mine design
7.1 Defining minable areas
The absolute outer extent of the Nussir mineralisation is the geometric model defined as a
plate shape wireframe modelled from bore hole intersections with geological cut off of 0,3%
Cu. Within this interpreted body of mineralised material, indicated resources are defined to be
areas covered by sampling in a grid with no more than 250x250m (Wheeler, 2011). Indicated
resource is the minimum classification criteria when considering extraction and defining
reserves (Figure 1, p.3) (JORC, 2004).
Besides, classification criteria, there are modifying factors affecting the definition of minable
areas for this mine design assessment. Environmental and legal considerations, limit any road
access or other development on the mountain plateau along the mineralisation outcrop. By
this access must be from east along the fjord, limiting mining of the indicated resources
further west at this stage. By this, minable areas are limited to the areas marked by grey in
Figure 17.
Figure 17 Indicated resources in east (grey). Inferred are (red). Block model seen from south.
The third, criteria for selecting minable areas is the economic cut-off. This requires a cash
flow analysis based on mine design costs, which I do not know until the design is made and
evaluated for a chosen part of the mineralisation. An initial 0,9% Cu cut-off is therefore
chosen to define areas for mine design layout. This layout may need a change, based on a new
cut-off arising from mine design’s incurred cash flow. The size, location, grade distribution
and cut-off grade curve for the minable areas is presented in the Figure 18 and Table 13
below:
E
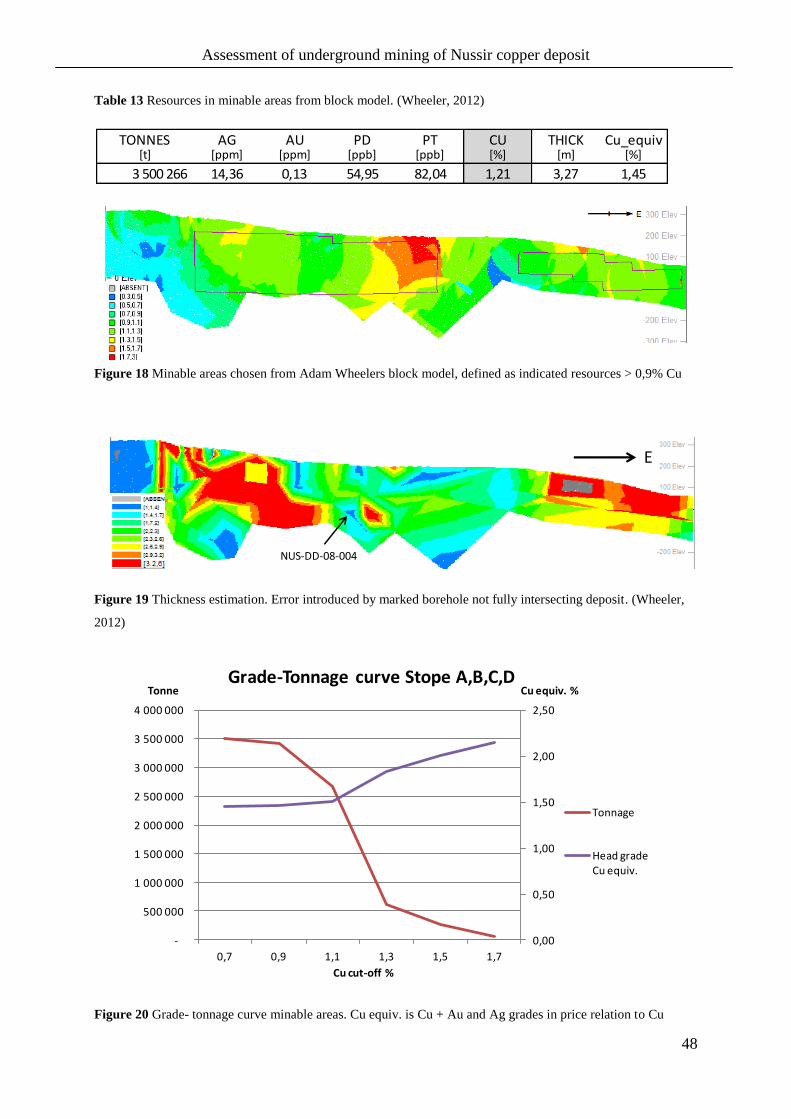
Assessment of underground mining of Nussir copper deposit
48
Table 13 Resources in minable areas from block model. (Wheeler, 2012)
Figure 18 Minable areas chosen from Adam Wheelers block model, defined as indicated resources > 0,9% Cu
Figure 19 Thickness estimation. Error introduced by marked borehole not fully intersecting deposit. (Wheeler,
2012)
Figure 20 Grade- tonnage curve minable areas. Cu equiv. is Cu + Au and Ag grades in price relation to Cu
TONNES AG AU PD PT CU THICK Cu_equiv[t] [ppm] [ppm] [ppb] [ppb] [%] [m] [%]
3 500 266 14,36 0,13 54,95 82,04 1,21 3,27 1,45
E
NUS-DD-08-004
0,00
0,50
1,00
1,50
2,00
2,50
-
500 000
1 000 000
1 500 000
2 000 000
2 500 000
3 000 000
3 500 000
4 000 000
0,7 0,9 1,1 1,3 1,5 1,7
Cu equiv. %Tonne
Cu cut-off %
Grade-Tonnage curve Stope A,B,C,D
Tonnage
Head grade Cu equiv.
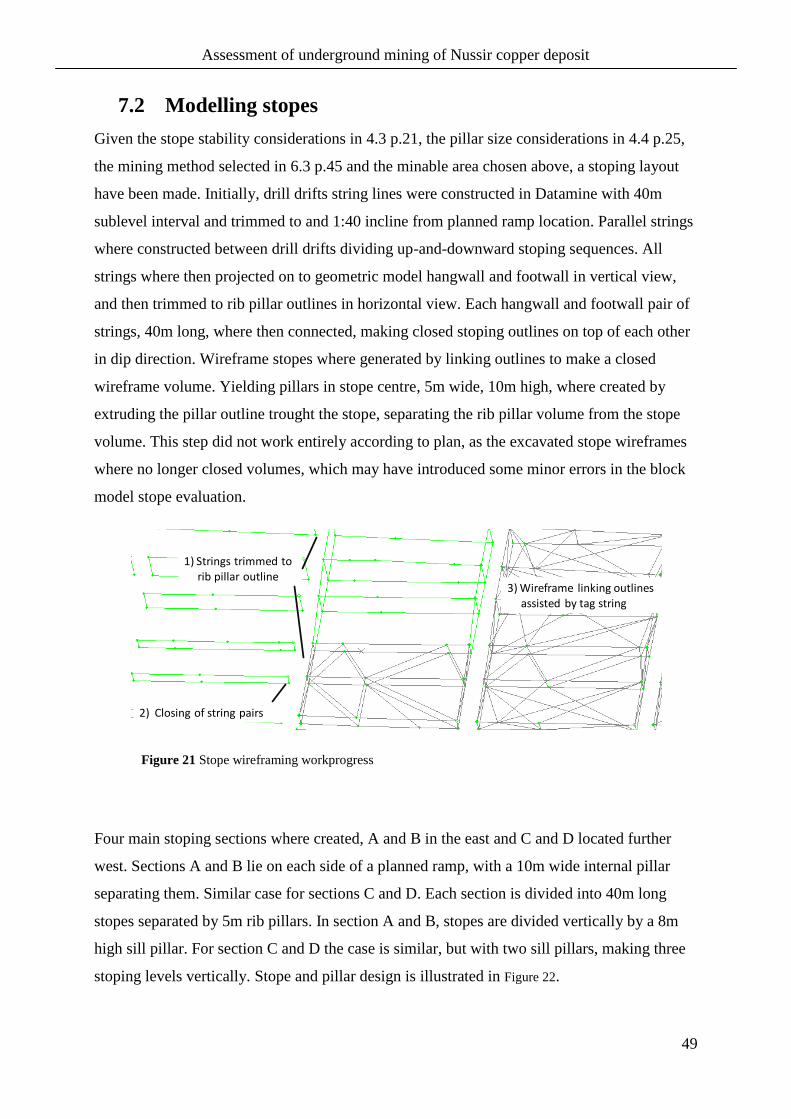
Assessment of underground mining of Nussir copper deposit
49
7.2 Modelling stopes
Given the stope stability considerations in 4.3 p.21, the pillar size considerations in 4.4 p.25,
the mining method selected in 6.3 p.45 and the minable area chosen above, a stoping layout
have been made. Initially, drill drifts string lines were constructed in Datamine with 40m
sublevel interval and trimmed to and 1:40 incline from planned ramp location. Parallel strings
where constructed between drill drifts dividing up-and-downward stoping sequences. All
strings where then projected on to geometric model hangwall and footwall in vertical view,
and then trimmed to rib pillar outlines in horizontal view. Each hangwall and footwall pair of
strings, 40m long, where then connected, making closed stoping outlines on top of each other
in dip direction. Wireframe stopes where generated by linking outlines to make a closed
wireframe volume. Yielding pillars in stope centre, 5m wide, 10m high, where created by
extruding the pillar outline trought the stope, separating the rib pillar volume from the stope
volume. This step did not work entirely according to plan, as the excavated stope wireframes
where no longer closed volumes, which may have introduced some minor errors in the block
model stope evaluation.
Figure 21 Stope wireframing workprogress
Four main stoping sections where created, A and B in the east and C and D located further
west. Sections A and B lie on each side of a planned ramp, with a 10m wide internal pillar
separating them. Similar case for sections C and D. Each section is divided into 40m long
stopes separated by 5m rib pillars. In section A and B, stopes are divided vertically by a 8m
high sill pillar. For section C and D the case is similar, but with two sill pillars, making three
stoping levels vertically. Stope and pillar design is illustrated in Figure 22.
1) Strings trimmed to rib pillar outline
2) Closing of string pairs
3) Wireframe linking outlinesassisted by tag string

Assessment of underground mining of Nussir copper deposit
50
Figure 22 Nussir stope layout of the minable areas from Figure 18 seen from south. Stope ID comprise of stope
letter, number and level at which stopes are loaded. Rib pillar width is 5m, Sill pillar height is 8m.
7.3 Mine descriptions
7.3.1 Access tunnel
Stoping will start at +10 level between stoping section A and B. This allows quick access
from the main road along the fjord, where topography is low. Access tunnel will be 8,5m wide
and 6m high, face area 50m2, giving sufficient space for conveyor belt, air ducts in the roof,
water pipes and large vehicles. Two alternative portal locations have been discussed in
Nussir: From the little valley of Dypelv, 1km northwest of Øyen industrial area, requiring a
590m access tunnel, or a 2000m long tunnel from flat area in front of a steep rock face formed
by a previous quarry operation – about 60m above sea level in the vicinity of the processing
Plant at Øyen. Pros and cons for the longer tunnel is that conveyor belt will be little affected
by snow and ice during winter if underground all the way, but development cost become high
and access to mine will be granted later. Final decision depend on location of processing
plant, but the shortest alternative will be used in this report because it’s reducing capital costs.
C1 C2 C3 C4 C5 C6 C7 C8 C9 C10 C11
A1 A2 A3 A4 A5 A6 A7 A8
+ 10
D14 D13 D12 D11 D10 D9 D8 D7 D6 D5 D4 D3 D2 D1
B9 B8 B7 B6 B5 B4 B3 B2 B1
- 80
- 60
+100
+10
40m
40m
62m
102m
102m
Level
Level
102m
Assessment of underground mining of Nussir copper deposit
51
7.3.2 Main haulage level
From the access tunnel, a 50m2 haulage tunnel will be driven at -10 level with a 1:40 incline
westward along the mineralisation footwall to the western end of stoping section B, length is
410m. Haulage tunnel need only be 135m eastward from the access point with 30m2 face area,
as this way is approaching a dead end, in terms of current block model. Placed 30m away
from the mineralisation, and reinforced by shotcrete and bolting, stability will be granted
during and after production of the stopes. Draw points every 45m along strike, provide
loading access into each stope at +10 level.
Some time before stopes A and B are mined out, haulage tunnel will progress westward along
strike, declining 1:22, reaching the eastern end of stope C after 385m. From here, the 1100m
long haulage tunell for stope C and D will be made at level -10. The combined access and
haulage tunnel is the largest vein of the Nussir mine, containing extended conveyor belt to
stope C and D, ventilation and access. In addition, it provides perfect location for probe
drilling prior to stoping.
7.3.3 Drifts
The long deposit geometry require drill drifts to be very long, saving ramp developments
along strike. Drill drifts are drilled and blasted with 40m vertical spacing, from the ramp
towards east and west, allowing two faces to progress on the same level. Drift dimensions will
vary by deposit thickness and drift function. Drifts at stope bottom, without haulage tunnels,
will be 5m wide and 4,5m high allowing space for haulage trucks. Sub-level drifts will have
minimum 4,5m width allowing space for horizontal drilling of cable bolt holes, or
dimensioned to deposit thickness if this is thicker, illustrated in Figure 23. Loading drifts will
be established every 100m in footwall for truck loading. These will also be used for probe
drilling to prove grades and boundaries. Drifts should anyhow be placed along hangwall
contact with angled wall, otherwise stresses are likely to concentrate in uneven areas of stope
hangwall, causing failure and consequently increasing risk of potential caving (Lappalainen,
2012). Sublevel interval is given by the stability considerations in (ch.4.3 p.21) and the
dilution considerations in (ch.5.5 p.32). Sub-level interval may change after dilution and
stability is registered. Drift key numbers are given in Table 14.
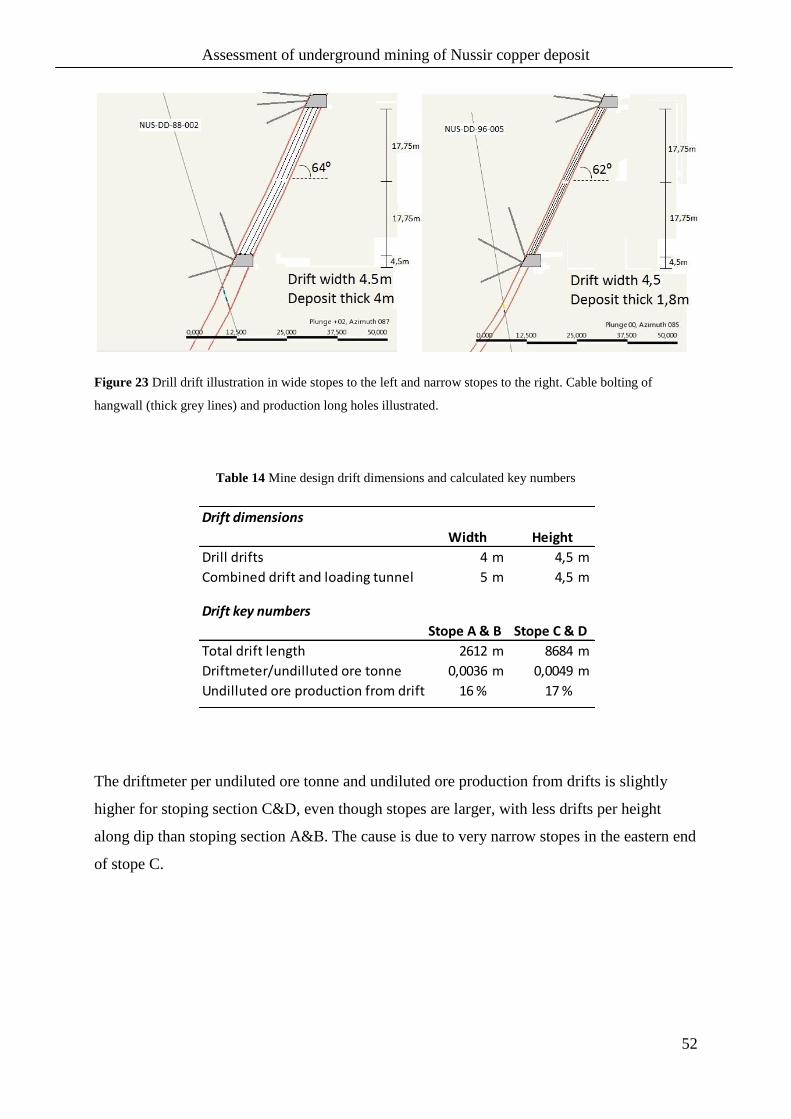
Assessment of underground mining of Nussir copper deposit
52
Figure 23 Drill drift illustration in wide stopes to the left and narrow stopes to the right. Cable bolting of
hangwall (thick grey lines) and production long holes illustrated.
Table 14 Mine design drift dimensions and calculated key numbers
The driftmeter per undiluted ore tonne and undiluted ore production from drifts is slightly
higher for stoping section C&D, even though stopes are larger, with less drifts per height
along dip than stoping section A&B. The cause is due to very narrow stopes in the eastern end
of stope C.
Drift dimensions
Width Height
Drill drifts 4 m 4,5 m
Combined drift and loading tunnel 5 m 4,5 m
Drift key numbers
Stope A & B Stope C & D
Total drift length 2612 m 8684 m
Driftmeter/undilluted ore tonne 0,0036 m 0,0049 m
Undilluted ore production from drifts 16 % 17 %

Assessment of underground mining of Nussir copper deposit
53
7.3.4 Ramps
A ramp ascending with a gradient of 1:7 will be driven from the Haulage level to level 90 and
down to level minus 60 in stope A and B. Ramp at C and D stopes will be driven from
haulage level at minus 10 level to 180 level and down to minus 80 level, illustrated in Figure
24. Ramps will give access to the various mine levels. The cross section of the ramp will be 30
m2. From the highest level in the mine a ventilation raise will be mined to the surface. The
raise will also form an emergency escape way. The ramps will be established along the strike
with a distance of 1300m. Each ramp will give access to two stopes on each side of the ramp.
Ramp in CD stopes noes not have equally the same amount of stopes on each side, because
stoping section C, will be extended eastward by 135m when resources are better sampled
from more drilling.
Figure 24 Ramp DC 1:7 gradient, 30m2 face area, providing access to drill drifts
7.3.5 Slots
Slot holes will be driven upward and downward from drill drift to establish a free face for
blasting after each rib pillar. Slot holes of 20m length will be excavated by raise boring
machine. Reaming holes surrounding the slot hole will be drilled and blasted first to open up
the stope without damaging pillars, before the rest of the stope is blastet.
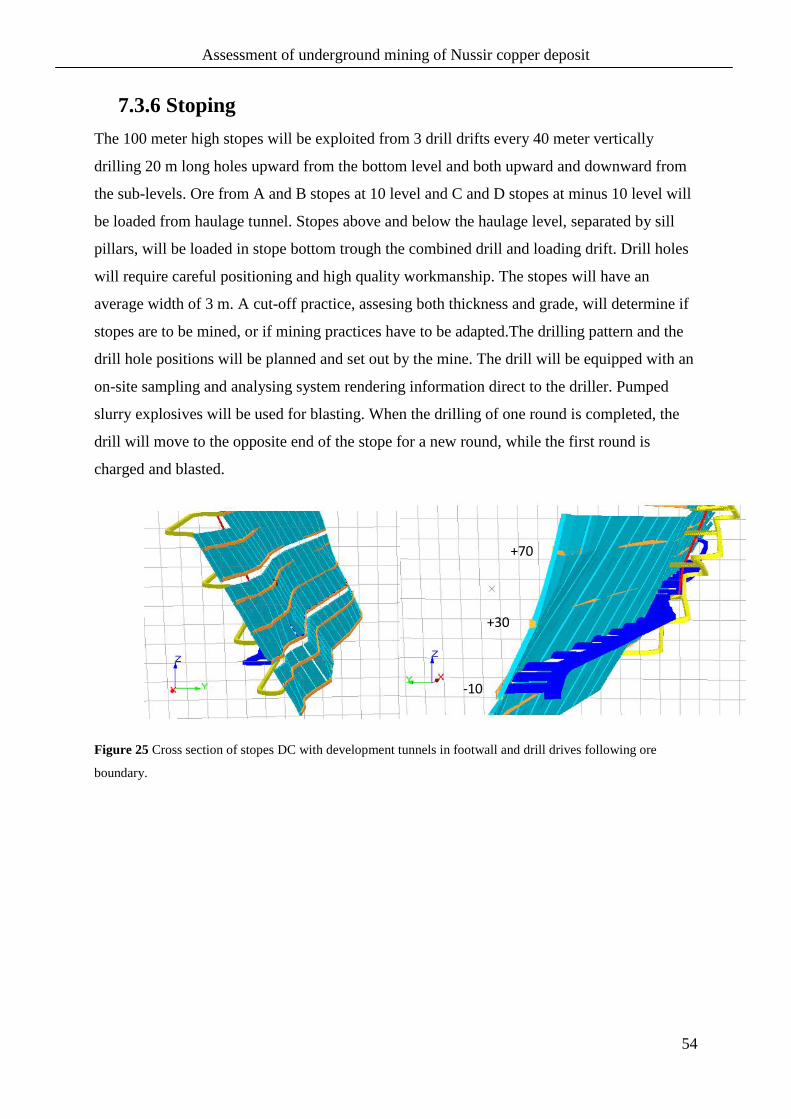
Assessment of underground mining of Nussir copper deposit
54
7.3.6 Stoping
The 100 meter high stopes will be exploited from 3 drill drifts every 40 meter vertically
drilling 20 m long holes upward from the bottom level and both upward and downward from
the sub-levels. Ore from A and B stopes at 10 level and C and D stopes at minus 10 level will
be loaded from haulage tunnel. Stopes above and below the haulage level, separated by sill
pillars, will be loaded in stope bottom trough the combined drill and loading drift. Drill holes
will require careful positioning and high quality workmanship. The stopes will have an
average width of 3 m. A cut-off practice, assesing both thickness and grade, will determine if
stopes are to be mined, or if mining practices have to be adapted.The drilling pattern and the
drill hole positions will be planned and set out by the mine. The drill will be equipped with an
on-site sampling and analysing system rendering information direct to the driller. Pumped
slurry explosives will be used for blasting. When the drilling of one round is completed, the
drill will move to the opposite end of the stope for a new round, while the first round is
charged and blasted.
Figure 25 Cross section of stopes DC with development tunnels in footwall and drill drives following ore
boundary.
-10
+70
+30
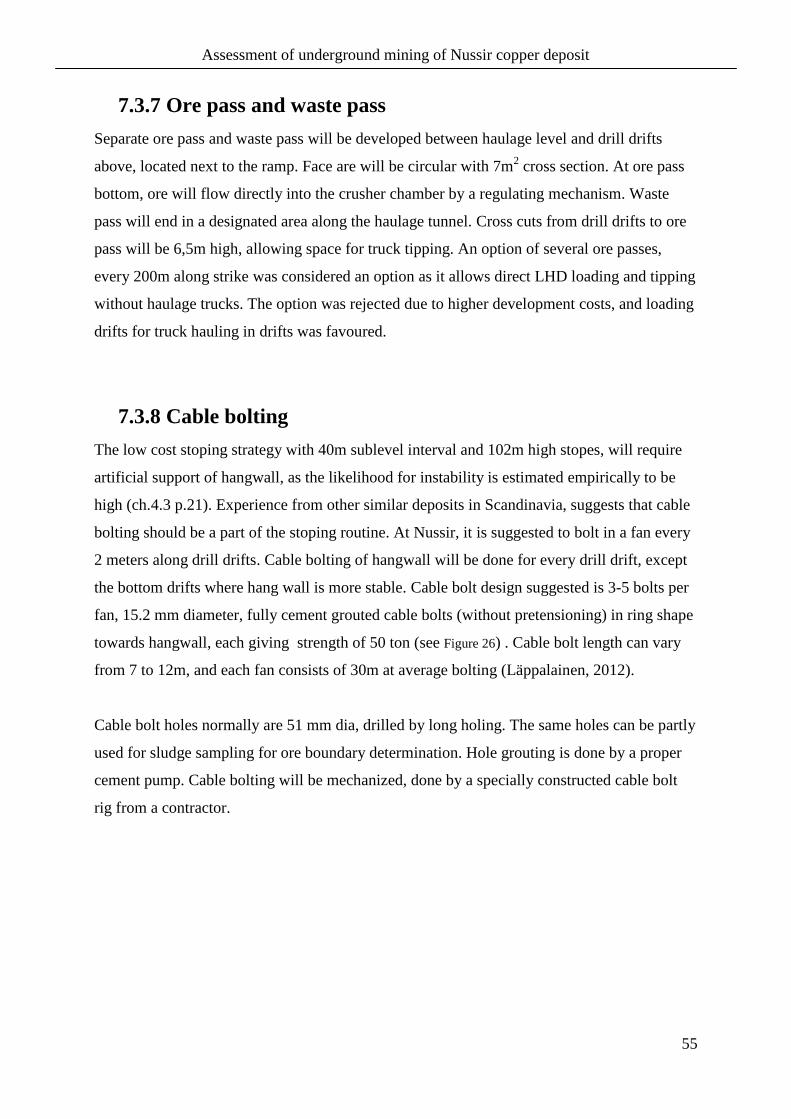
Assessment of underground mining of Nussir copper deposit
55
7.3.7 Ore pass and waste pass
Separate ore pass and waste pass will be developed between haulage level and drill drifts
above, located next to the ramp. Face are will be circular with 7m2 cross section. At ore pass
bottom, ore will flow directly into the crusher chamber by a regulating mechanism. Waste
pass will end in a designated area along the haulage tunnel. Cross cuts from drill drifts to ore
pass will be 6,5m high, allowing space for truck tipping. An option of several ore passes,
every 200m along strike was considered an option as it allows direct LHD loading and tipping
without haulage trucks. The option was rejected due to higher development costs, and loading
drifts for truck hauling in drifts was favoured.
7.3.8 Cable bolting
The low cost stoping strategy with 40m sublevel interval and 102m high stopes, will require
artificial support of hangwall, as the likelihood for instability is estimated empirically to be
high (ch.4.3 p.21). Experience from other similar deposits in Scandinavia, suggests that cable
bolting should be a part of the stoping routine. At Nussir, it is suggested to bolt in a fan every
2 meters along drill drifts. Cable bolting of hangwall will be done for every drill drift, except
the bottom drifts where hang wall is more stable. Cable bolt design suggested is 3-5 bolts per
fan, 15.2 mm diameter, fully cement grouted cable bolts (without pretensioning) in ring shape
towards hangwall, each giving strength of 50 ton (see Figure 26) . Cable bolt length can vary
from 7 to 12m, and each fan consists of 30m at average bolting (Läppalainen, 2012).
Cable bolt holes normally are 51 mm dia, drilled by long holing. The same holes can be partly
used for sludge sampling for ore boundary determination. Hole grouting is done by a proper
cement pump. Cable bolting will be mechanized, done by a specially constructed cable bolt
rig from a contractor.
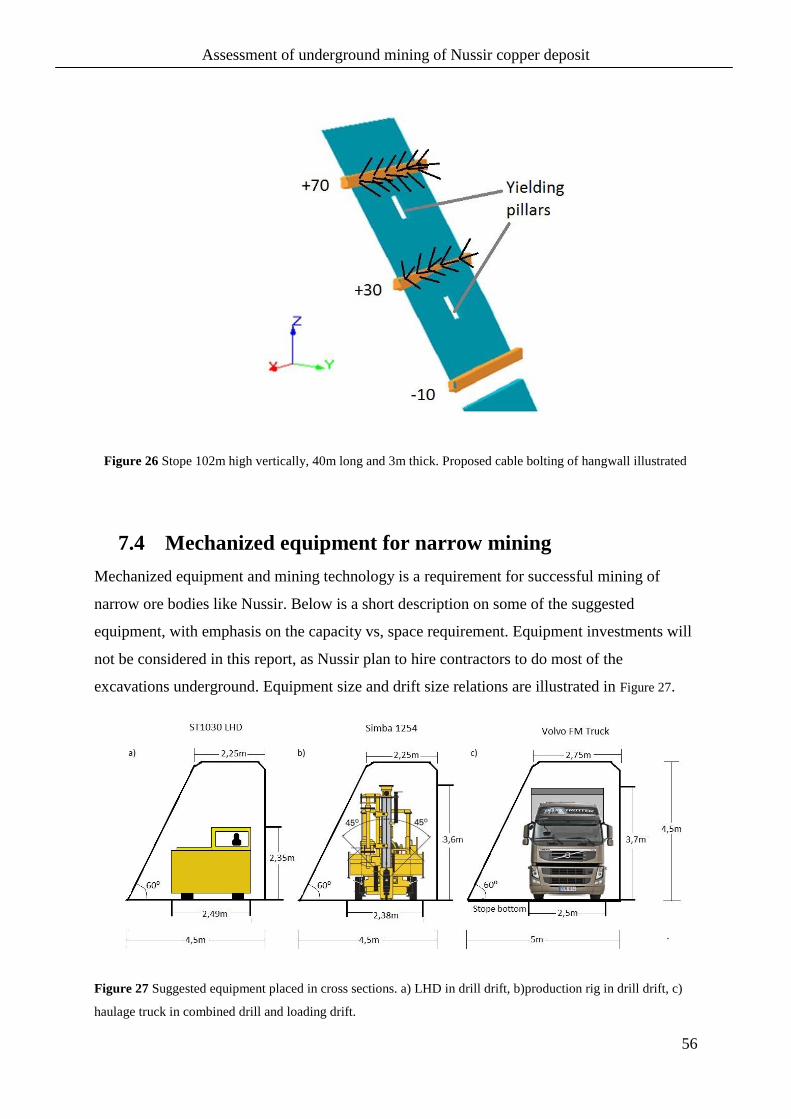
Assessment of underground mining of Nussir copper deposit
56
Figure 26 Stope 102m high vertically, 40m long and 3m thick. Proposed cable bolting of hangwall illustrated
7.4 Mechanized equipment for narrow mining
Mechanized equipment and mining technology is a requirement for successful mining of
narrow ore bodies like Nussir. Below is a short description on some of the suggested
equipment, with emphasis on the capacity vs, space requirement. Equipment investments will
not be considered in this report, as Nussir plan to hire contractors to do most of the
excavations underground. Equipment size and drift size relations are illustrated in Figure 27.
Figure 27 Suggested equipment placed in cross sections. a) LHD in drill drift, b)production rig in drill drift, c)
haulage truck in combined drill and loading drift.
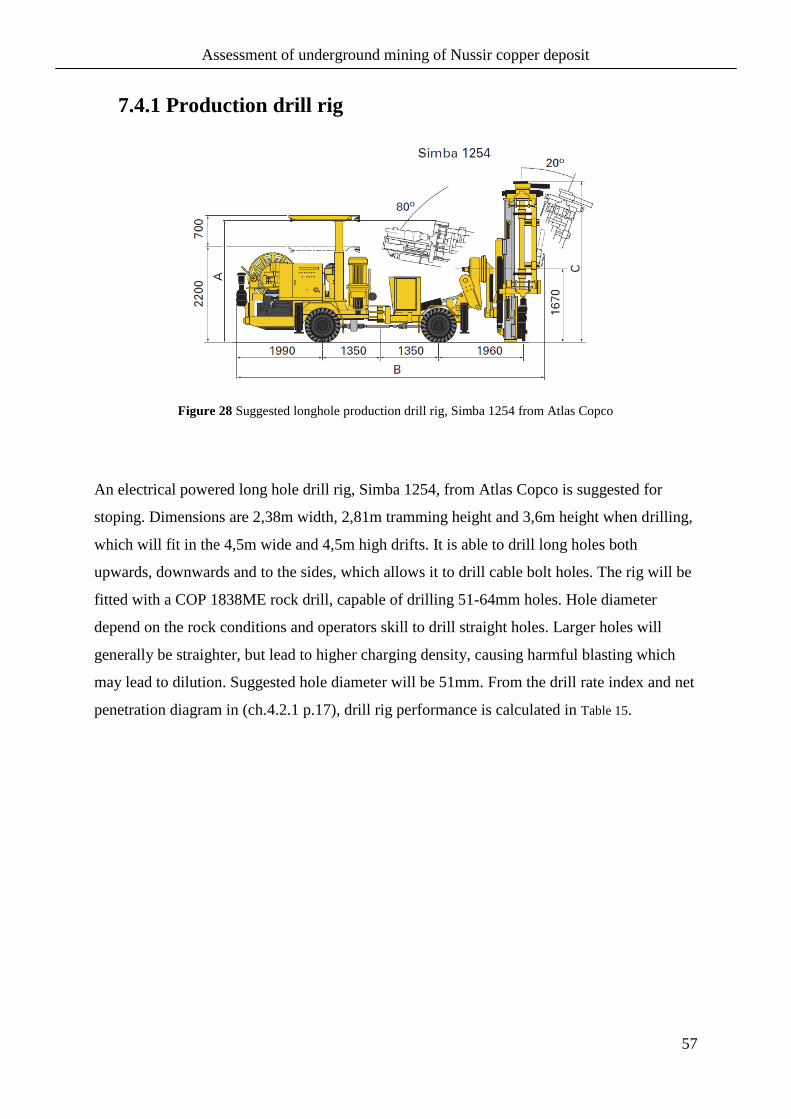
Assessment of underground mining of Nussir copper deposit
57
7.4.1 Production drill rig
Figure 28 Suggested longhole production drill rig, Simba 1254 from Atlas Copco
An electrical powered long hole drill rig, Simba 1254, from Atlas Copco is suggested for
stoping. Dimensions are 2,38m width, 2,81m tramming height and 3,6m height when drilling,
which will fit in the 4,5m wide and 4,5m high drifts. It is able to drill long holes both
upwards, downwards and to the sides, which allows it to drill cable bolt holes. The rig will be
fitted with a COP 1838ME rock drill, capable of drilling 51-64mm holes. Hole diameter
depend on the rock conditions and operators skill to drill straight holes. Larger holes will
generally be straighter, but lead to higher charging density, causing harmful blasting which
may lead to dilution. Suggested hole diameter will be 51mm. From the drill rate index and net
penetration diagram in (ch.4.2.1 p.17), drill rig performance is calculated in Table 15.
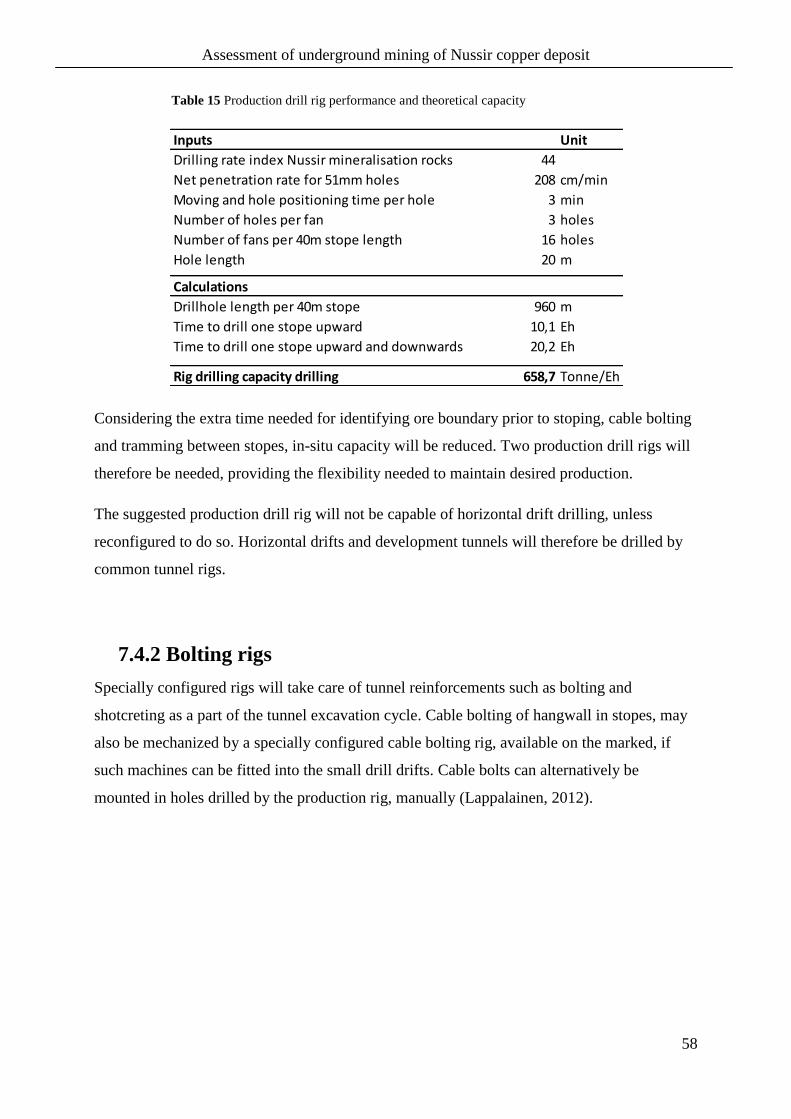
Assessment of underground mining of Nussir copper deposit
58
Table 15 Production drill rig performance and theoretical capacity
Considering the extra time needed for identifying ore boundary prior to stoping, cable bolting
and tramming between stopes, in-situ capacity will be reduced. Two production drill rigs will
therefore be needed, providing the flexibility needed to maintain desired production.
The suggested production drill rig will not be capable of horizontal drift drilling, unless
reconfigured to do so. Horizontal drifts and development tunnels will therefore be drilled by
common tunnel rigs.
7.4.2 Bolting rigs
Specially configured rigs will take care of tunnel reinforcements such as bolting and
shotcreting as a part of the tunnel excavation cycle. Cable bolting of hangwall in stopes, may
also be mechanized by a specially configured cable bolting rig, available on the marked, if
such machines can be fitted into the small drill drifts. Cable bolts can alternatively be
mounted in holes drilled by the production rig, manually (Lappalainen, 2012).
Inputs Unit
Drilling rate index Nussir mineralisation rocks 44
Net penetration rate for 51mm holes 208 cm/min
Moving and hole positioning time per hole 3 min
Number of holes per fan 3 holes
Number of fans per 40m stope length 16 holes
Hole length 20 m
Calculations
Drillhole length per 40m stope 960 m
Time to drill one stope upward 10,1 Eh
Time to drill one stope upward and downwards 20,2 Eh
Rig drilling capacity drilling 658,7 Tonne/Eh
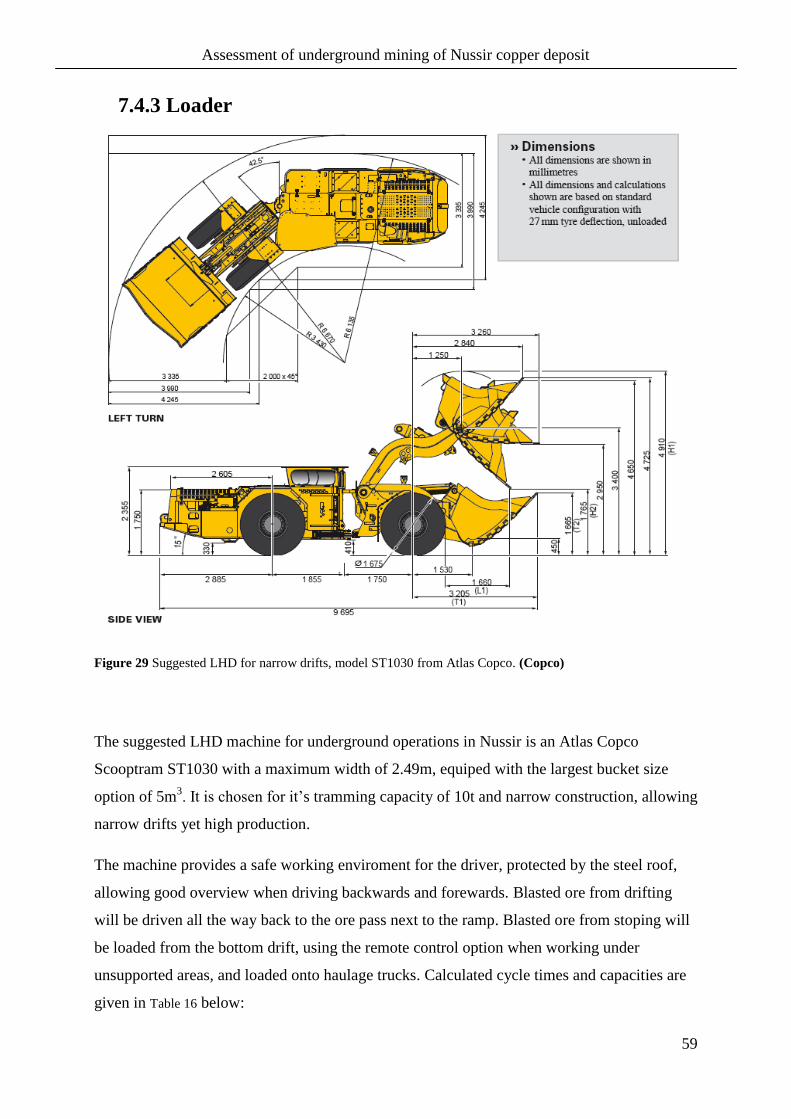
Assessment of underground mining of Nussir copper deposit
59
7.4.3 Loader
Figure 29 Suggested LHD for narrow drifts, model ST1030 from Atlas Copco. (Copco)
The suggested LHD machine for underground operations in Nussir is an Atlas Copco
Scooptram ST1030 with a maximum width of 2.49m, equiped with the largest bucket size
option of 5m3. It is chosen for it’s tramming capacity of 10t and narrow construction, allowing
narrow drifts yet high production.
The machine provides a safe working enviroment for the driver, protected by the steel roof,
allowing good overview when driving backwards and forewards. Blasted ore from drifting
will be driven all the way back to the ore pass next to the ramp. Blasted ore from stoping will
be loaded from the bottom drift, using the remote control option when working under
unsupported areas, and loaded onto haulage trucks. Calculated cycle times and capacities are
given in Table 16 below:
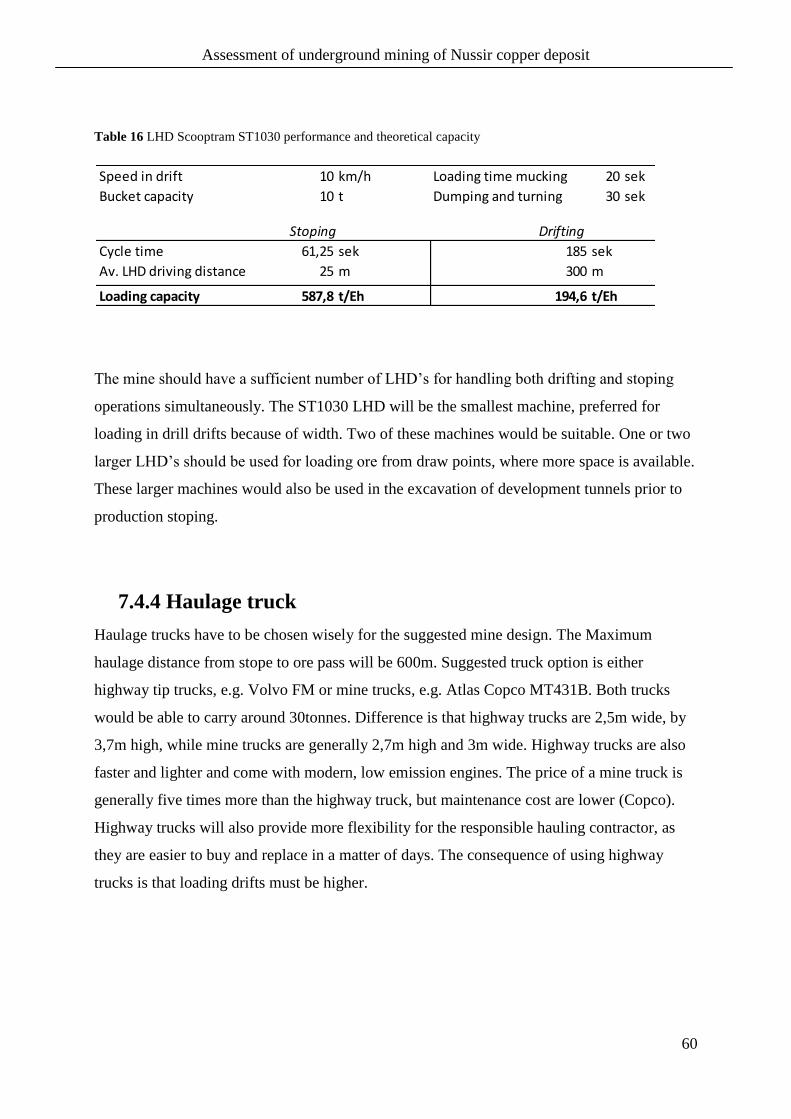
Assessment of underground mining of Nussir copper deposit
60
Table 16 LHD Scooptram ST1030 performance and theoretical capacity
The mine should have a sufficient number of LHD’s for handling both drifting and stoping
operations simultaneously. The ST1030 LHD will be the smallest machine, preferred for
loading in drill drifts because of width. Two of these machines would be suitable. One or two
larger LHD’s should be used for loading ore from draw points, where more space is available.
These larger machines would also be used in the excavation of development tunnels prior to
production stoping.
7.4.4 Haulage truck
Haulage trucks have to be chosen wisely for the suggested mine design. The Maximum
haulage distance from stope to ore pass will be 600m. Suggested truck option is either
highway tip trucks, e.g. Volvo FM or mine trucks, e.g. Atlas Copco MT431B. Both trucks
would be able to carry around 30tonnes. Difference is that highway trucks are 2,5m wide, by
3,7m high, while mine trucks are generally 2,7m high and 3m wide. Highway trucks are also
faster and lighter and come with modern, low emission engines. The price of a mine truck is
generally five times more than the highway truck, but maintenance cost are lower (Copco).
Highway trucks will also provide more flexibility for the responsible hauling contractor, as
they are easier to buy and replace in a matter of days. The consequence of using highway
trucks is that loading drifts must be higher.
Speed in drift 10 km/h Loading time mucking 20 sek
Bucket capacity 10 t Dumping and turning 30 sek
Stoping Drifting
Cycle time 61,25 sek 185 sek
Av. LHD driving distance 25 m 300 m
Loading capacity 587,8 t/Eh 194,6 t/Eh
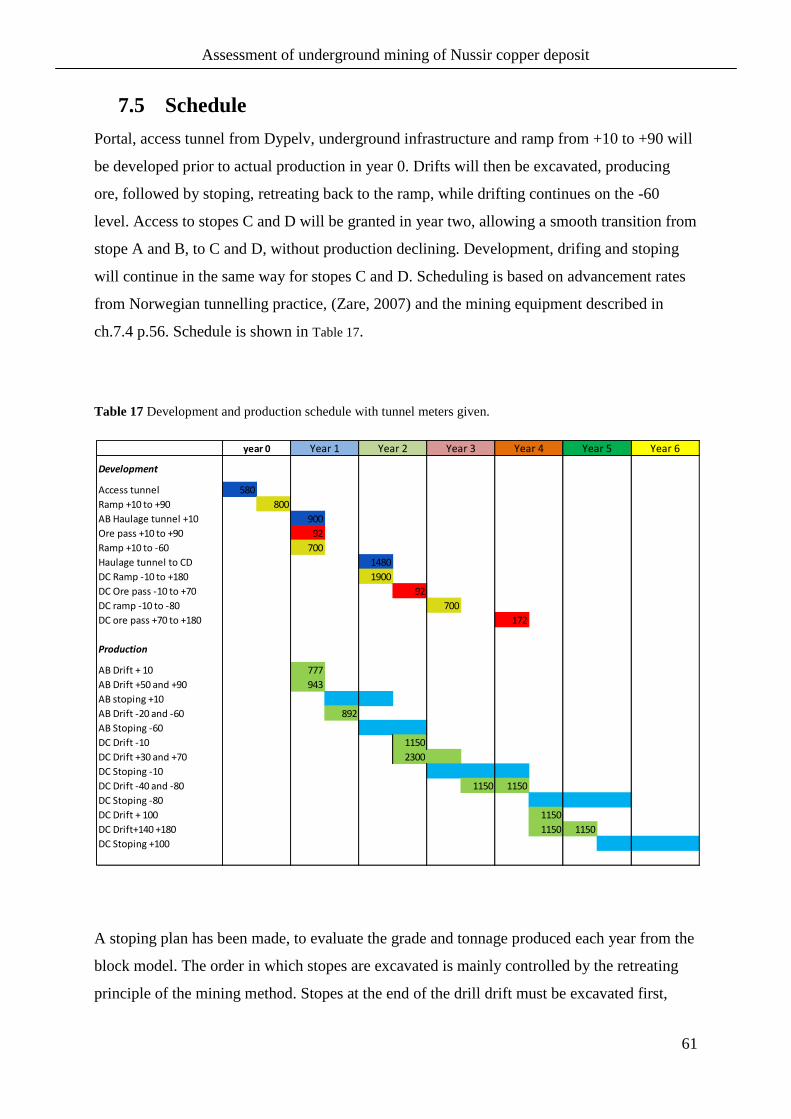
Assessment of underground mining of Nussir copper deposit
61
7.5 Schedule
Portal, access tunnel from Dypelv, underground infrastructure and ramp from +10 to +90 will
be developed prior to actual production in year 0. Drifts will then be excavated, producing
ore, followed by stoping, retreating back to the ramp, while drifting continues on the -60
level. Access to stopes C and D will be granted in year two, allowing a smooth transition from
stope A and B, to C and D, without production declining. Development, drifing and stoping
will continue in the same way for stopes C and D. Scheduling is based on advancement rates
from Norwegian tunnelling practice, (Zare, 2007) and the mining equipment described in
ch.7.4 p.56. Schedule is shown in Table 17.
Table 17 Development and production schedule with tunnel meters given.
A stoping plan has been made, to evaluate the grade and tonnage produced each year from the
block model. The order in which stopes are excavated is mainly controlled by the retreating
principle of the mining method. Stopes at the end of the drill drift must be excavated first,
Development
Access tunnel 580
Ramp +10 to +90 800
AB Haulage tunnel +10 900
Ore pass +10 to +90 92
Ramp +10 to -60 700
Haulage tunnel to CD 1480
DC Ramp -10 to +180 1900
DC Ore pass -10 to +70 92
DC ramp -10 to -80 700
DC ore pass +70 to +180 172
Production
AB Drift + 10 777
AB Drift +50 and +90 943
AB stoping +10
AB Drift -20 and -60 892
AB Stoping -60
DC Drift -10 1150
DC Drift +30 and +70 2300
DC Stoping -10
DC Drift -40 and -80 1150 1150
DC Stoping -80
DC Drift + 100 1150
DC Drift+140 +180 1150 1150
DC Stoping +100
Year 6year 0 Year 1 Year 2 Year 3 Year 4 Year 5
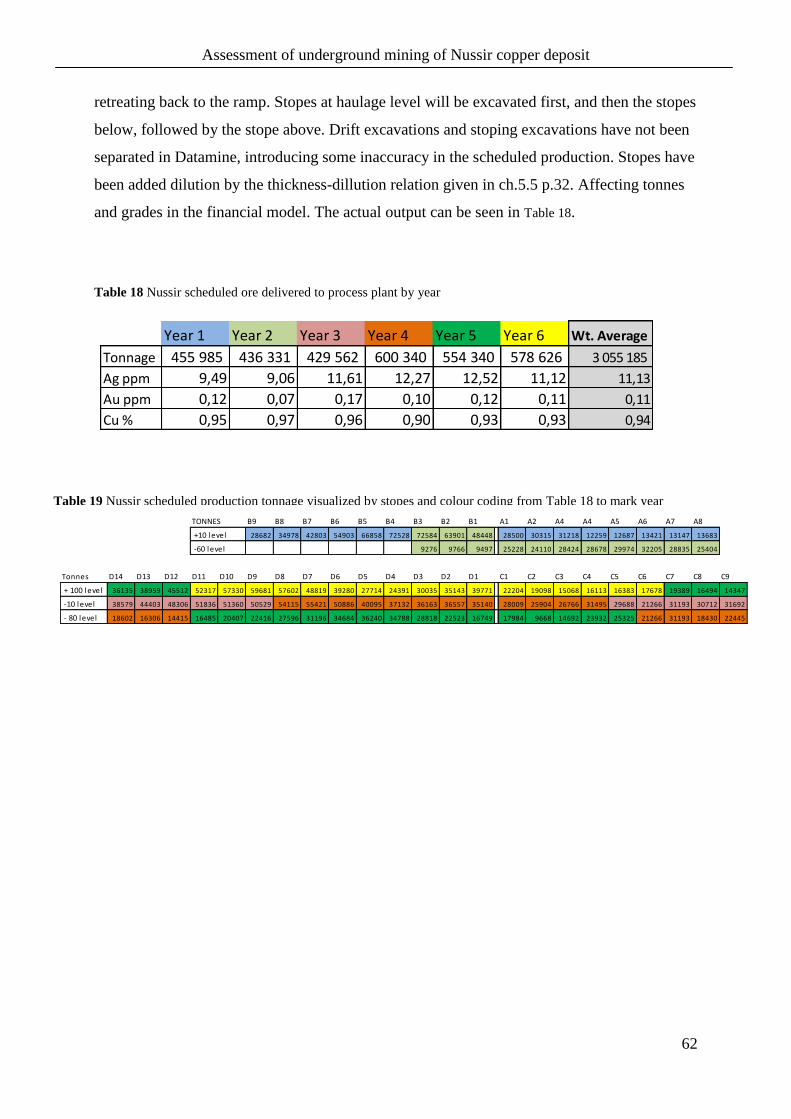
Assessment of underground mining of Nussir copper deposit
62
retreating back to the ramp. Stopes at haulage level will be excavated first, and then the stopes
below, followed by the stope above. Drift excavations and stoping excavations have not been
separated in Datamine, introducing some inaccuracy in the scheduled production. Stopes have
been added dilution by the thickness-dillution relation given in ch.5.5 p.32. Affecting tonnes
and grades in the financial model. The actual output can be seen in Table 18.
Table 18 Nussir scheduled ore delivered to process plant by year
Year 1 Year 2 Year 3 Year 4 Year 5 Year 6 Wt. Average
Tonnage 455 985 436 331 429 562 600 340 554 340 578 626 3 055 185
Ag ppm 9,49 9,06 11,61 12,27 12,52 11,12 11,13
Au ppm 0,12 0,07 0,17 0,10 0,12 0,11 0,11
Cu % 0,95 0,97 0,96 0,90 0,93 0,93 0,94
TONNES B9 B8 B7 B6 B5 B4 B3 B2 B1 A1 A2 A4 A4 A5 A6 A7 A8
+10 level 28682 34978 42803 54903 66858 72528 72584 63901 48448 28500 30315 31218 12259 12687 13421 13147 13683
-60 level 9276 9766 9497 25228 24110 28424 28678 29974 32205 28835 25404
Tonnes D14 D13 D12 D11 D10 D9 D8 D7 D6 D5 D4 D3 D2 D1 C1 C2 C3 C4 C5 C6 C7 C8 C9
+ 100 level 36135 38959 45512 52317 57330 59681 57602 48819 39280 27714 24391 30035 35143 39771 22204 19098 15068 16113 16383 17678 19389 16494 14347
-10 level 38579 44403 48306 51836 51360 50529 54115 55421 50886 40095 37132 36163 36557 35140 28009 25904 26766 31495 29688 21266 31193 30712 31692
- 80 level 18602 16306 14415 16485 20407 22416 27596 31196 34684 36240 34788 28818 22523 16749 17984 9668 14692 23932 25325 21266 31193 18430 22445
Table 19 Nussir scheduled production tonnage visualized by stopes and colour coding from Table 18 to mark year
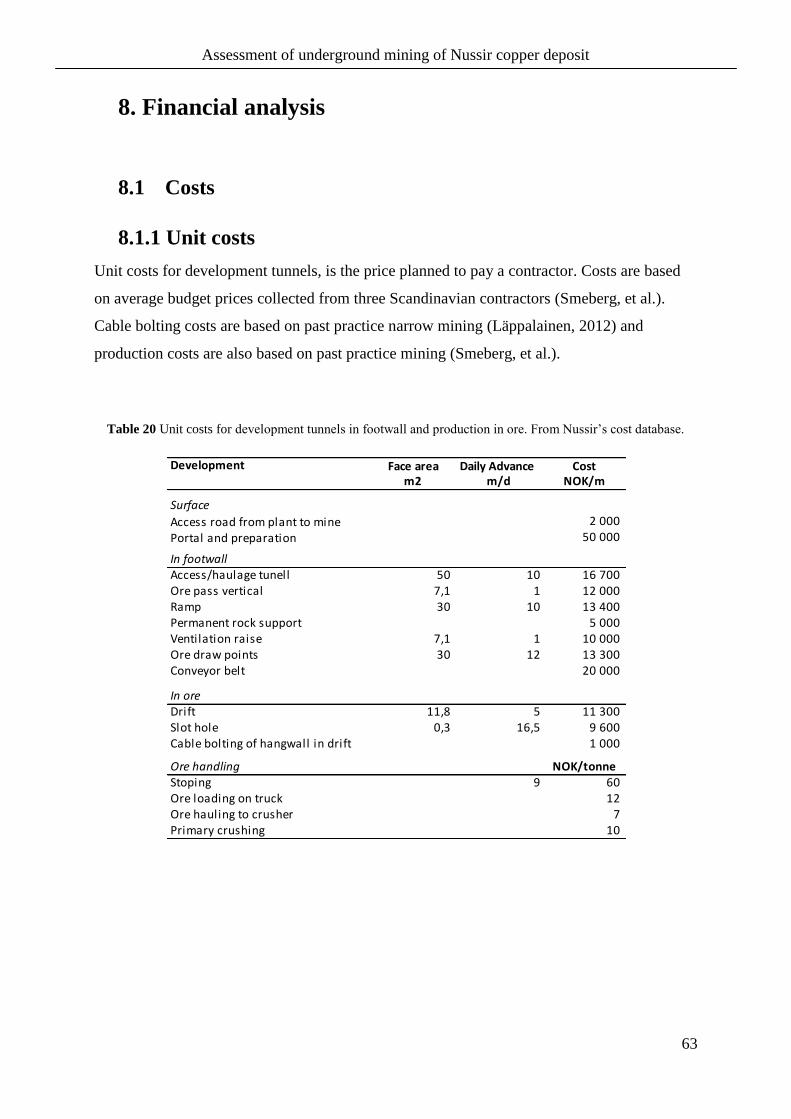
Assessment of underground mining of Nussir copper deposit
63
8. Financial analysis
8.1 Costs
8.1.1 Unit costs
Unit costs for development tunnels, is the price planned to pay a contractor. Costs are based
on average budget prices collected from three Scandinavian contractors (Smeberg, et al.).
Cable bolting costs are based on past practice narrow mining (Läppalainen, 2012) and
production costs are also based on past practice mining (Smeberg, et al.).
Table 20 Unit costs for development tunnels in footwall and production in ore. From Nussir’s cost database.
Development Face area Daily Advance Costm2 m/d NOK/m
Surface
Access road from plant to mine 2 000
Portal and preparation 50 000
In footwallAccess/haulage tunell 50 10 16 700 Ore pass vertical 7,1 1 12 000 Ramp 30 10 13 400 Permanent rock support 5 000 Ventilation raise 7,1 1 10 000 Ore draw points 30 12 13 300 Conveyor belt 20 000
In oreDrift 11,8 5 11 300 Slot hole 0,3 16,5 9 600 Cable bolting of hangwall in drift 1 000
Ore handling NOK/tonneStoping 9 60 Ore loading on truck 12 Ore hauling to crusher 7 Primary crushing 10

Assessment of underground mining of Nussir copper deposit
64
8.1.2 Capital costs
Capital costs, also refered to as the mining cost (Lane, 1988), in this mine design assessment
will only include development costs necessary to gain access to the minable areas described in
ch.7.1 p.47. It will be the access tunnel, ramps, ore passes, haulage tunnel, ventilation shaft,
conveyor belt and permanent rock support. Other necessary capital costs such as the
establishment of the processing plant, infrastructure and pre investment costs, will not be
included, as they should ideally be depreciated over a longer life of mine, with larger reserves
than the 3 million tonnes considered in this report. Capital expenditures will be paid as the
developments are being done. The cost for developing stopes C and D will therefore be paid
in year 2 instead of year 0. Capital costs for each development step will be depreciated over
the lifetime of the actual development. Total capital costs required for accessing the
mineralised materials is:
CAPEX = 254,5 million NOK
83,3NOK per tonne produced.
8.1.3 Treatment costs
Treatment cost are the tonnage dependent costs, including all costs required to extract and
process the mineralised materials defined as ore by the mine design, after mineralised material
is made accessible by developments (Lane, 1988). Processing costs are given by past practice
experiences from Nussir, given the annual production. Mining costs include, drifting, slot
drifting, stoping, cable bolting, loading, hauling and primary crushing. Mining cost is given
per tonne and is calculated as the total cost for mining production divided by diluted ore.
Treatment costs are:
Prosessing cost = 64,9NOK/tonne ore produced
Mining cost = 177,18NOK/tonne produced
Major mining cost are identified by Figure 30, to be drifting and slot drifting. Stoping costs
are also high on the graph, but not when considering the ore tonnage directly produced from
the stoping operation. Drifting and slot drifting costs are highly influenced by mine design
layout which determines sub-level, affecting the number of drifts, and pillar layout, affecting
the number of slot holes needed.

Assessment of underground mining of Nussir copper deposit
65
Figure 30 Treatment costs for Nussir mine design
8.1.4 Marketing cost
Marketing cost is defined as smelting, refining, transportation and selling (Lane, 1988). Costs
are incurred per tonne copper produced from the processing plant. Silver and gold are bound
to the copper minerals (Sandstad, 2008) and will not be given any extra costs. The marketing
cost is based on numbers from Nussir’s financial model, calculated to be:
Marketing cost = 2082,5 NOK/tonne copper concentrate
0,00
10,00
20,00
30,00
40,00
50,00
60,00
70,00
Drill drift in stope
A,B,C,D
Cable bolting of hangwall
Slot for every rib
pillar
Stoping (A,B,C,D)
Ore loading Ore haulage on truck to
crusher
Primary crushing
Processing
NOK/tonneTreatment costs

Assessment of underground mining of Nussir copper deposit
66
8.2 Cash Flow
A cash flow analysis have been calculated for the mining selected areas from ch.7.1 p.47,
during a 6 year period, given that mine development is the only capital expenditure. Input
parameters in the analysis include:
Table 21 Metal prices and input parameters in financial analysis
The revenue per tonne after tonnage dependent costs are paid, is relatively stable at
410NOK/tonne, which is partly due to the fact that mining costs/tonne is an overall average
and partly due to blending of ore qualities from two different stope sections.
The mining operation starts off with negative cash flows during the initial two years of
production, due to high development costs related to the rapid development of stope D and C.
By the end of year three, all developments are taken care of, leaving only production costs
(Figure 31). The capital expenditure of 254,5million NOK is going to be paid back after 5
years and 9 months, only three months before end of mining.
Figure 31 Project cash flows year by year
Item Rate
Copper price 6600 US$/tonne
Silver Price 20 US$/Oz
Gold Price 1000 US$/Oz
Royalty 0,75 %
Tax rate 28 %
Discount rate 10 %
kr -80 000 000,00
kr -60 000 000,00
kr -40 000 000,00
kr -20 000 000,00
kr -
kr 20 000 000,00
kr 40 000 000,00
kr 60 000 000,00
Year 0 Year 1 Year 2 Year 3 Year 4 Year 5 Year 6
Year 0 Year 1 Year 2 Year 3 Year 4 Year 5 Year 6
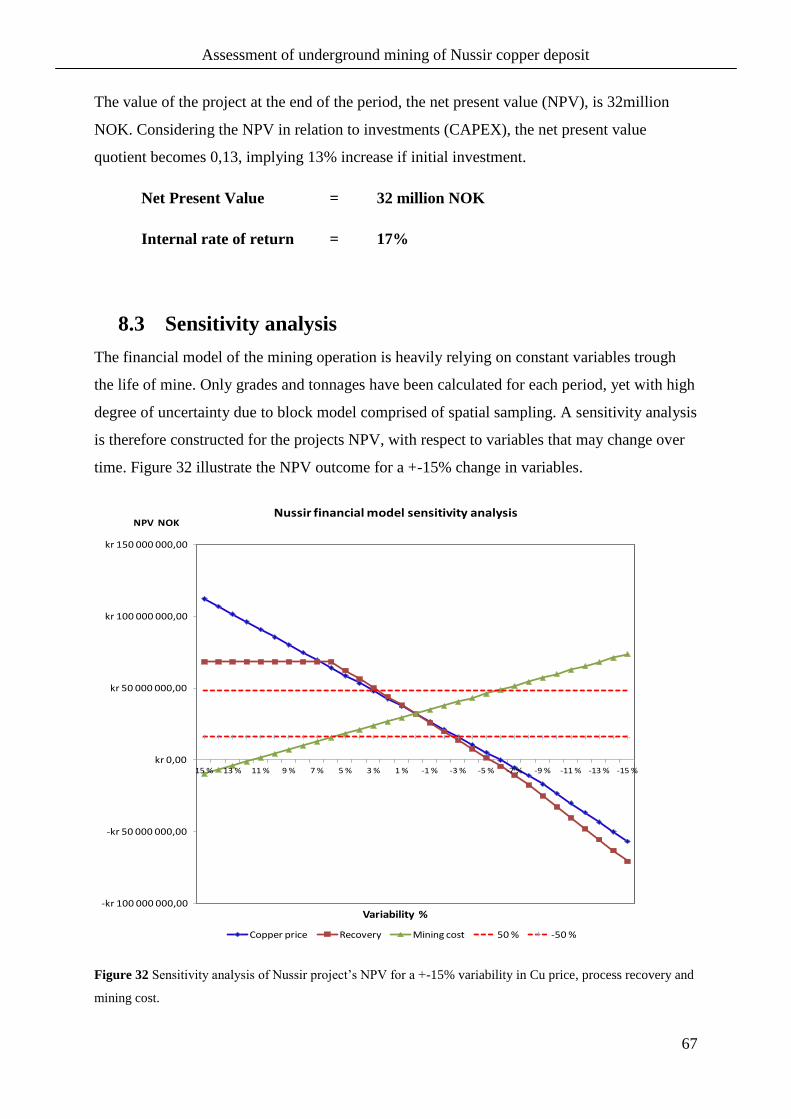
Assessment of underground mining of Nussir copper deposit
67
The value of the project at the end of the period, the net present value (NPV), is 32million
NOK. Considering the NPV in relation to investments (CAPEX), the net present value
quotient becomes 0,13, implying 13% increase if initial investment.
Net Present Value = 32 million NOK
Internal rate of return = 17%
8.3 Sensitivity analysis
The financial model of the mining operation is heavily relying on constant variables trough
the life of mine. Only grades and tonnages have been calculated for each period, yet with high
degree of uncertainty due to block model comprised of spatial sampling. A sensitivity analysis
is therefore constructed for the projects NPV, with respect to variables that may change over
time. Figure 32 illustrate the NPV outcome for a +-15% change in variables.
Figure 32 Sensitivity analysis of Nussir project’s NPV for a +-15% variability in Cu price, process recovery and
mining cost.
-kr 100 000 000,00
-kr 50 000 000,00
kr 0,00
kr 50 000 000,00
kr 100 000 000,00
kr 150 000 000,00
15 % 13 % 11 % 9 % 7 % 5 % 3 % 1 % -1 % -3 % -5 % -7 % -9 % -11 % -13 % -15 %
NPV NOK
Variability %
Nussir financial model sensitivity analysis
Copper price Recovery Mining cost 50 % -50 %
Assessment of underground mining of Nussir copper deposit
68
The Nussir mining project’s overall economy is very sensitive to a range of variables.
Producing raw materials, is a conjecture business, where product prices vary with world
economy, making the blue line in Figure 32 highly representative for possible project
outcomes. From Figure 32, we can identify the variability that cause zero NPV, which is 6%
decrease in copper price from estimated 6600$/tonne to 6200$/tonne. If the price for copper
stays on a stable level of 7590$/tonne, project will come out with an NPV of 112 million
NOK, 350% increase from base case.
The best way to deal with price uncertainty in mining base metals, is to control the ore grade,
by saving high grade blocks for periods of recession.
Mining cost is also identified as a variable with great influence on project value. A 12%
increase of mining costs, will cause zero NPV according to current financial model. This
implies that project is very sensitive to mine design parameters affecting mining cost, such as
driftmeters per tonne, stoping costs, slot drifting and loading and hauling cycles.
Assessment of underground mining of Nussir copper deposit
69
9. Discussion
The technical and economical feasibility of mining the steeply dipping narrow mineralisation
of Nussir have been assessed with high degrees of uncertainty in factors which have been
identidyed to influence economy. The geotechnical parameters, stress, Q-values and fractures,
will influence stope and pillar dimensions, which again will affect ore loss, driftmeters/tonne
and efficiency in material flow. Suggested stope dimensions, are empirically estimated to be
unstable, without the additional yielding pillars and cable bolting in stopes. By this, mine
design is identified as dependent on favourable rock and stress conditions, for project to be
economical.
The working cycles during mining operation have not been described in detail, assuming that
contractor will get the job done. Producing from two stopes simultaneously on each side of
ramp, suggested in schedule, will give optimal blending of grades, given current block model.
The question is, whether annual production in schedule can be maintained, when working in
the 600m long drifts with only one entrance? The current mine design assumes that efficiency
will be maintained by meeting bays and loading drifts, allowing vehicles to pass each other in
drifts.
9.1 How geology affects mine design
Current geometric wireframe model is chosen as representative for ore boundary
determination in ch.5.5 p.32. Dillution estimates, stability, ore recovery and the whole design
is based on that assumption. Mine design is, in my opinion feasible for mining a deposit
similar to the geometric model. The mine design is also flexible to some ore boundary
irregularities, as long as boundaries are not waving back and forth within 20m up dip.
Denser drilling would also improve our interpretation of the crucial parameter thickness.
Modelled thickness between three samples will be given by each sample intersections length.
The influence of one sample is consequently having large impact on thickness and tonnage. It
is therefore unfortunate that hole NUS-DD-08-004 was stopped during drilling only 1m into
the mineralised zone. Known mistakes like this, and possible mistakes that we do not know
of, from core handling and assaying, strongly affects the resource, from which mine design is
based on.
Assessment of underground mining of Nussir copper deposit
70
Either way, the geometric models is what I know at this stage, consequently affecting the
plan. However, the plan is not static, it’s merely for the sake of planning, helping us to
understand the technical challenges in narrow mining. The plan, or mine design suggested in
this thesis, should be updated, whenever new geological information come fresh out of the
borehole.
9.2 Narrow ore mining practices
An interesting topic for discussion is whether the proposed mine design is realistic in terms of
narrow ore mining. Narrow ore mining have been well described in this report, as a concept of
mining steeply dipping ore bodies below 4m thickness, with small, but efficient mechanized
equipment, seeking the optimum between dilution and ore loss. Mining practices have been
well exemplified by two reports and one field visit, representing 4 different narrow mining
layouts. Studying examples from industry have been preferred as background material for this
thesis, rather than pure theoretical papers. Each of the 4 narrow mining practices, two from
Zinkgruvan and two from Viscaria, reflect the importance of adapting mine design to
geological conditions.
Both Viscaria mine an Zinkgruvan, mine an ore with twice as high value as Nussir.
Zinkgruvan reserves in the Cecilia orebody is 8,1%Zn, 2,1%Pb and 49g/tAg. With current
Zink price of 2000$ per tonne, the sales value per ore including additional minerals will be
over 1000NOK/tonne. Mining costs are consequently allowed to be high in Zinkgruvan.
When considering that Zinkgruvan have this value on ore, and 3-5m ore thickness, it is
obvious that their established narrow vein mining practices cannot be initiated for the low
grade Nussir deposit, even if deposits have somewhat similar geometry.

Assessment of underground mining of Nussir copper deposit
71
9.3 Resource to reserve definition
The resources selected for mine design assessment in this report, have a resource
classification of indicated which is sufficient for defining probable reserves according to
(JORC, 2004). Modifying factors such as environmental concerns are not yet sorted out, as
they are waiting for final approval with authorities. Geotechnical factors are partly sortet out
with remaining uncertainties regarding stresses and fracture zones. The uncertainty in stress
conditions, will in my opinion reflect the question whether to go for the suggested mine
design in this report or go for a double bench stoping method, which induce 12-15% higher
mining costs. Uncertainties in fracture zones, may influence ore loss in minor or major areas
of the mine design, implying less resources to be defined as ore. The economical feasibility of
starting a mine, based on selected resources is not present at 6600$/tonne copper price. A start
up project should be financially stronger, to cover the additional process plant and
infrastructure capital costs.
By this, no resources will be conversed to reserves from the assessment.

Assessment of underground mining of Nussir copper deposit
72

Assessment of underground mining of Nussir copper deposit
73
10. Conclusion
Selected mining method is sublevel open stoping with 40m sublevel interval, 40m
long stopes with height 62m and 102m.
Mining of the indicated resources above 0,9%Cu cut-off in eastern part of Nussir,
including thickness-dependent dilution will produce 3,05Mt ore with 0,94%Cu,
11,13g/t Ag and 0,11g/t Au.
Dilution increase tonnage throughput and treatment costs. It decreases head-grade of
ore and may also decrease production of minerals, if treatment capacity is limiting.
The financial model derived from the mine design indicate positive project value for 6
years life of mine, only if mining development is the only capital expense.
Equipment should be fit to drifts and vice versa, finding the optimum between
capacity and dilution.
No reserves can be defined from the resources at Nussir.

Assessment of underground mining of Nussir copper deposit
74
Assessment of underground mining of Nussir copper deposit
75
11. Further work
1) Update geological wireframe model with interpretation of fault zone, which may cross
cut and affect areas of stope C and D.
2) Asses the technical and economical feasibility of mining the Inferred resources in
Nussir west, and see it contributes to the financial model in this report.
3) Numerical stability analysis of proposed pillar layout, by exporting stope wireframes
to Phase 2 software.
4) Evaluate the economic situation of investing in mining equipment, instead of hiring
contractor, for the proposed mine design.
5) Assess the possibility of dumping blasted ore directly onto conveyorbelt, possibly via
ore pass, reducing hauling costs. Ask Vegard Olsen at Orica mining services.
6) Evaluate ventilation needs for given mine design and machinery, and add costs to
financial model.
7) Evaluate possibility of opening stopes by cut-blasting instead of slot raises. Will the
cost saving be worth possible blast damages to stope walls?
8) Carry out hydraulic fracturing of borehole to quantify stress conditions.

Assessment of underground mining of Nussir copper deposit
76
Assessment of underground mining of Nussir copper deposit
77
References
Barton, N.R, Lien, R and Lunde, J. 1974. Engineering classification of rock masses for the
design of tunnel support. s.l. : Rock mechanics and rock engineering, 1974. BF01239496.
Bruland, Amund. 1998. Hard Rock Tunnel Boring, Drillability Test Methods, Doctoral
thesis. Trondheim : NTNU, 1998. 1998:81.
Copco, Atlas. Atlas Copco Norge. [Online] Atlas Copco. [Cited: 28 May 2012.]
http://www.atlascopco.no/nono/products/navigationbyproduct/.
Finkel, M, et al. 1993. Narrow ore mining in Zinkgruvan, Sweden. Stockholm : Swedish
Rock Engineering Research, 1993. 1104-1773.
Golder, Associates. 2009. Scoping study of proposed mining of Nussir copper prospect
W.Finnmark, Norway. London : Golder Associates, 2009. 09514950033.500.
Hagen, Simon A and Følke, Kjartan. 2012. Bestemmelse av bergmekaniske egenskapertil 6
prøver fra Nussir. Trondheim : Sintef Byggforsk, 2012. 12020BM.
Hall, B,C. 2003. How Mining Companies Improve Share Price by Destroying shareholder
value. Montreal : s.n., 2003. 1194.
Hansen-Haug, Jouni. 2012. Personal communication. Zinkgruvan, 15 March 2012.
Hartman, Howard L. 1987. Introductory mining engineering. Tuscaloosa : John Wiley &
Sons Inc, 1987. 0-471-82004-0.
Jóhannsson, Ægir. 2001. Testing av borbarhet for adkomsttunellen til Nussirforekomsten.
Trondheim : Sintef Bygg og Miljøteknikk, 2001. ASPRO 2472.
JORC. 2004. JORC code. [Online] The Joint Ore Reserves Committee of The Australasian
Institute of Mining and Metallurgy, Australian Institute of Geoscientists and Minerals Council
of Australia (JORC), 2004. [Cited: 19 December 2011.] http://www.jorc.org/.
Lane, Kenneth F. 1988. The economic definition of ore. London : Mining Journal Books
Ltd., 1988. 0 900117 45 1.
Lappalainen, Pekka. 2012. Personal communication about Nussir mine design. Trondheim,
8 May 2012.
Ludvigsen, Erik, et al. 1991. "Nussirforekomsten" En mulighetsstudie. Trondheim : Sintef,
1991. STF36 F91054.
Lundin, Mining. Lundin Mining Corporation. [Online] [Cited: 31 January 2012.]
http://www.lundinmining.com/i/pdf/Summary_Report_Zinkgruvan.pdf.
Läppalainen, Pekka. 2012. E-mail correspondence 9th of june. 2012.
Assessment of underground mining of Nussir copper deposit
78
Marttala, Karl-Erik, Halonen, Tommi. 1997. Underground mining in narrow ores without
backfill. 1997.
Mawdesley, C, Truman, R and Whiten, W.J. 2001. Extending the Mathews stability graph
for open–stope design. s.l. : Mining Technology, 2001.
Mortimer, G.J. 1950. Grade Control. Trans.Inst.Min.Metall. 1950, Vol. 59.
Myrvang, Arne. 2001. Bergmekanikk kompendium. Trondheim : Tapir akademisk forlag,
2001.
—. 2012. Personal communication. Trondheim, 8 May 2012.
—. 2009. Report conserning a field visit to the Nussir copper deposit, Kvalsund, Norway, 23-
24 July 2009. Trondheim : Sigma H, 2009.
Mäkinen, Ilpo and Paganus, Taiste. 1987. Stability of hanging walls at the Viscaria copper
mine. Kiruna : International Society of Rock mechanics, 1987. 6CONGRESS-1987-203.
Pakalnis, R. 1998. Empirical Design Methods - UBS Geomechanics. Vancouver : University
of British Columbia, 1998.
Pharaoh, Tim C, Jansen, Øystein and Ramsey, Donald M. 1983. Stratigraphy and
structure of the northern part of Repparfjord-Komagfjord Window, Finnmark, Northern
Norway. Trondheim : Universitetsforlaget, 1983. B0007B7JF6.
Sandstad, Jan Sverre. 2008. Geochemistry of drill cores from the Nussir copper deposit,
Kvalsund, Finnmark, Northern Norway. Trondheim : Norges geologiske institutt, 2008. 0800-
3416.
Sletten, Audun M. 2011. Resource evaluation of Nussir copper deposit. Trondheim : NTNU,
2011.
Smeberg, Per and Eriksen, Ola. 2011. Nussir PFS Draft 7.april 11. s.l. : Nussir ASA, 2011.
—. Unit costs from contractors.
Wheeler, Adam. 2011. Nussir project - Resource estimation update. Redruth : s.n., 2011.
—. 2012. Nussir resource update memo may 2012 v1 Draft. Redruth : s.n., 2012.
Zare, Shokrollah. 2007. Drill and blast tunneling, Advance rate, Doctoral Thesis.
Trondheim : NTNU, 2007. 2007:123(3).

Appendices

Appendix 1 Tunneling and drilling performance numbers
Assesment of underground mining of Nussir copper deposit
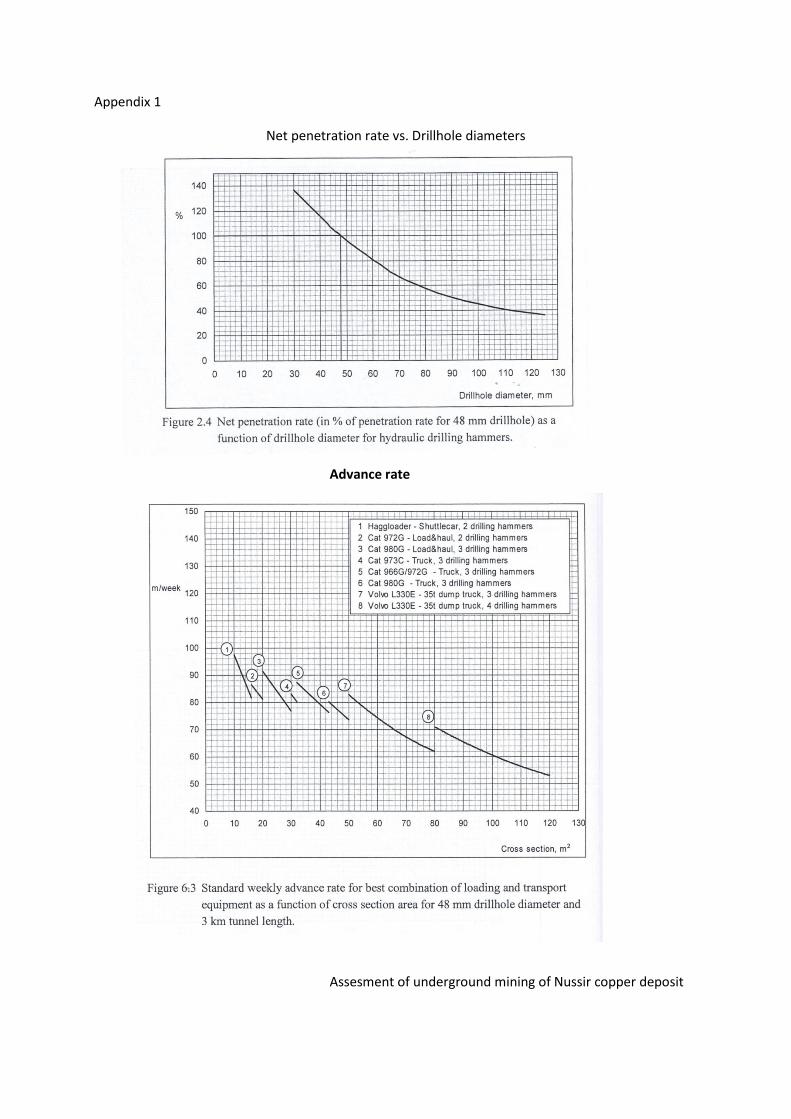
Appendix 1
Net penetration rate vs. Drillhole diameters
Advance rate
Assesment of underground mining of Nussir copper deposit
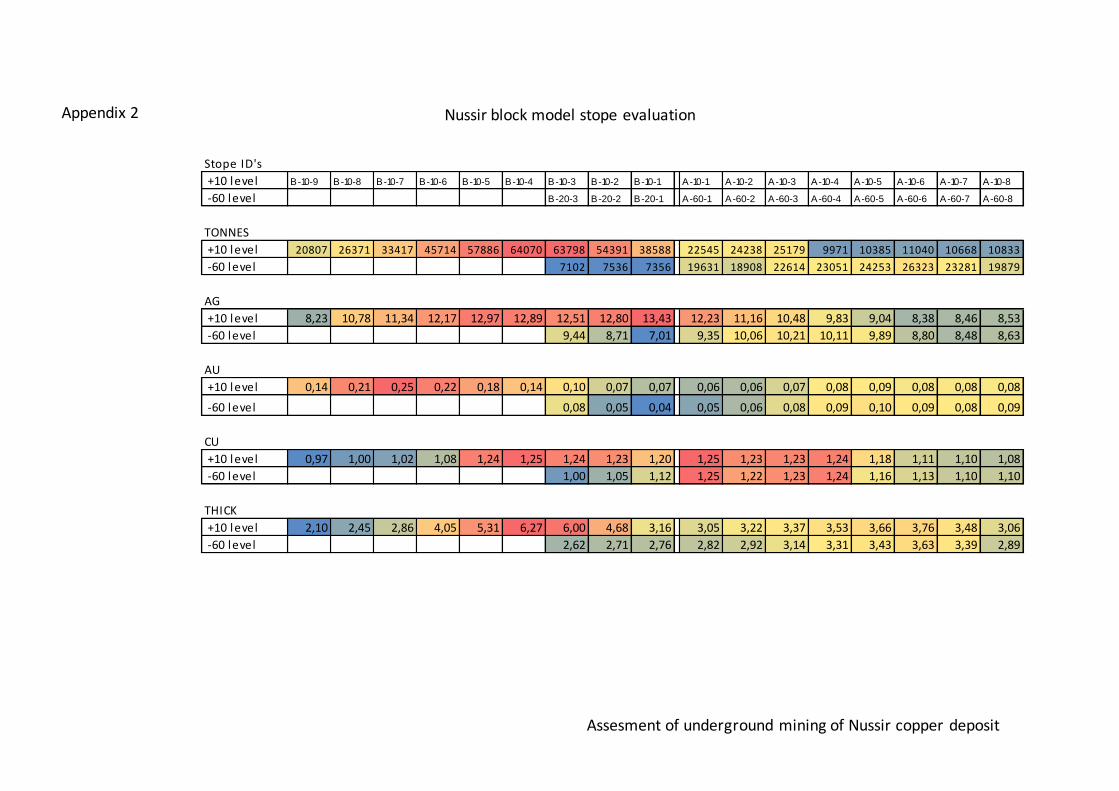
Stope ID's
+10 level B-10-9 B-10-8 B-10-7 B-10-6 B-10-5 B-10-4 B-10-3 B-10-2 B-10-1 A-10-1 A-10-2 A-10-3 A-10-4 A-10-5 A-10-6 A-10-7 A-10-8
-60 level B-20-3 B-20-2 B-20-1 A-60-1 A-60-2 A-60-3 A-60-4 A-60-5 A-60-6 A-60-7 A-60-8
TONNES
+10 level 20807 26371 33417 45714 57886 64070 63798 54391 38588 22545 24238 25179 9971 10385 11040 10668 10833
-60 level 7102 7536 7356 19631 18908 22614 23051 24253 26323 23281 19879
AG
+10 level 8,23 10,78 11,34 12,17 12,97 12,89 12,51 12,80 13,43 12,23 11,16 10,48 9,83 9,04 8,38 8,46 8,53
-60 level 9,44 8,71 7,01 9,35 10,06 10,21 10,11 9,89 8,80 8,48 8,63
AU
+10 level 0,14 0,21 0,25 0,22 0,18 0,14 0,10 0,07 0,07 0,06 0,06 0,07 0,08 0,09 0,08 0,08 0,08
-60 level 0,08 0,05 0,04 0,05 0,06 0,08 0,09 0,10 0,09 0,08 0,09
CU
+10 level 0,97 1,00 1,02 1,08 1,24 1,25 1,24 1,23 1,20 1,25 1,23 1,23 1,24 1,18 1,11 1,10 1,08
-60 level 1,00 1,05 1,12 1,25 1,22 1,23 1,24 1,16 1,13 1,10 1,10
THICK
+10 level 2,10 2,45 2,86 4,05 5,31 6,27 6,00 4,68 3,16 3,05 3,22 3,37 3,53 3,66 3,76 3,48 3,06
-60 level 2,62 2,71 2,76 2,82 2,92 3,14 3,31 3,43 3,63 3,39 2,89
Nussir block model stope evaluation
Assesment of underground mining of Nussir copper deposit
Appendix 2

Stope ID's
+ 100 level D-100-14 D-100-13 D-100-12 D-100-11 D-100-10 D-100-9 D-100-8 D-100-7 D-100-6 D-100-5 D-100-4 D-100-3 D-100-2 D-100-1 C-100-1 C-100-2 C-100-3 C-100-4 C-100-5 C-100-6 C-100-7 C-100-8 C-100-9
-10 level D-10-14 D-10-13 D-10-12 D-10-11 D-10-10 D-10-9 D-10-8 D-10-7 D-10-6 D-10-5 D-10-4 D-10-3 D-10-2 D-10-1 C-10-1 C-10-2 C-10-3 C-10-4 C-10-5 C-80-6 C-10-7 C-10-8 C-10-9
- 80 level D-80-14 D-80-13 D-80-12 D-80-11 D-80-10 D-80-9 D-80-8 D-80-7 D-80-6 D-80-5 D-80-4 D-80-3 D-80-2 D-80-1 C-80-1 C-80-2 C-80-3 C-80-4 C-80-5 C-80-6 C-10-7 C-80-8 C-80-9
Tonnes
+ 100 level 29723 31467 37315 43608 48370 50703 48677 39970 30482 19483 15836 20838 25553 29923 16485 13378 10276 11253 11363 12639 14087 11270 9302
-10 level 30724 35922 39776 42861 42281 41415 45020 46484 42084 31812 28843 27627 27524 26200 20447 18721 19749 23756 21392 15954 22706 22337 23138
- 80 level 13720 11678 10062 12018 15501 17595 22221 25630 28988 30234 28557 23206 17705 12690 12742 6405 10545 19103 20006 15954 22706 13413 16557
AG ppm
+ 100 level 9,21 9,08 8,76 10,01 12,68 15,34 15,50 14,35 12,11 9,94 9,63 11,27 13,40 14,61 15,07 14,95 14,86 17,41 22,49 29,03 31,13 32,14 35,57
-10 level 6,57 7,71 8,75 9,57 10,95 11,84 12,71 13,53 14,07 13,97 13,33 13,97 15,80 17,20 16,47 13,67 12,44 17,00 20,85 28,08 25,03 26,80 27,90
- 80 level 5,95 6,85 6,96 7,49 8,94 9,97 11,13 13,35 15,87 16,39 16,05 15,27 15,43 16,06 31,86 12,47 16,68 22,65 23,58 28,08 25,03 29,30 27,08
AU ppm
+ 100 level 0,22 0,23 0,21 0,21 0,19 0,18 0,18 0,15 0,10 0,06 0,05 0,05 0,07 0,09 0,09 0,09 0,08 0,09 0,10 0,11 0,11 0,12 0,13
-10 level 0,37 0,31 0,23 0,22 0,21 0,19 0,17 0,12 0,09 0,08 0,06 0,07 0,08 0,09 0,09 0,08 0,08 0,09 0,10 0,17 0,12 0,13 0,12
- 80 level 0,33 0,34 0,33 0,30 0,25 0,22 0,20 0,14 0,10 0,09 0,08 0,07 0,07 0,07 0,22 0,04 0,06 0,10 0,12 0,17 0,12 0,18 0,16
CU %
+ 100 level 1,07 1,17 1,22 1,27 1,30 1,28 1,26 1,22 1,20 1,20 1,18 1,05 0,97 0,93 0,94 1,13 1,17 1,24 1,41 1,51 1,52 1,63 1,74
-10 level 0,86 0,99 1,11 1,16 1,20 1,17 1,19 1,22 1,22 1,19 1,14 0,99 1,01 1,05 1,03 1,14 1,20 1,26 1,33 1,37 1,47 1,58 1,65
- 80 level 0,80 0,87 0,89 0,95 1,04 1,11 1,09 1,08 1,14 1,17 1,14 1,02 1,04 1,11 1,41 1,19 1,25 1,31 1,34 1,37 1,47 1,51 1,48
THICK m
+ 100 level 3,76 3,40 3,69 4,08 4,41 4,62 4,46 3,66 2,78 1,87 1,45 1,79 2,12 2,43 2,30 1,85 1,69 1,83 1,79 1,99 2,11 1,70 1,44
-10 level 3,15 3,43 3,79 3,88 3,78 3,69 4,03 4,24 3,89 3,10 2,79 2,59 2,43 2,34 2,15 2,07 2,24 2,45 2,05 2,40 2,13 2,12 2,15
- 80 level 2,24 2,00 1,83 2,14 2,53 2,94 3,34 3,74 4,15 4,10 3,72 3,34 2,96 2,50 1,92 1,54 2,02 3,19 3,03 2,40 2,13 2,12 2,24
Nussir block model stope evaluationAppendix 2
Assesment of underground mining of Nussir copper deposit
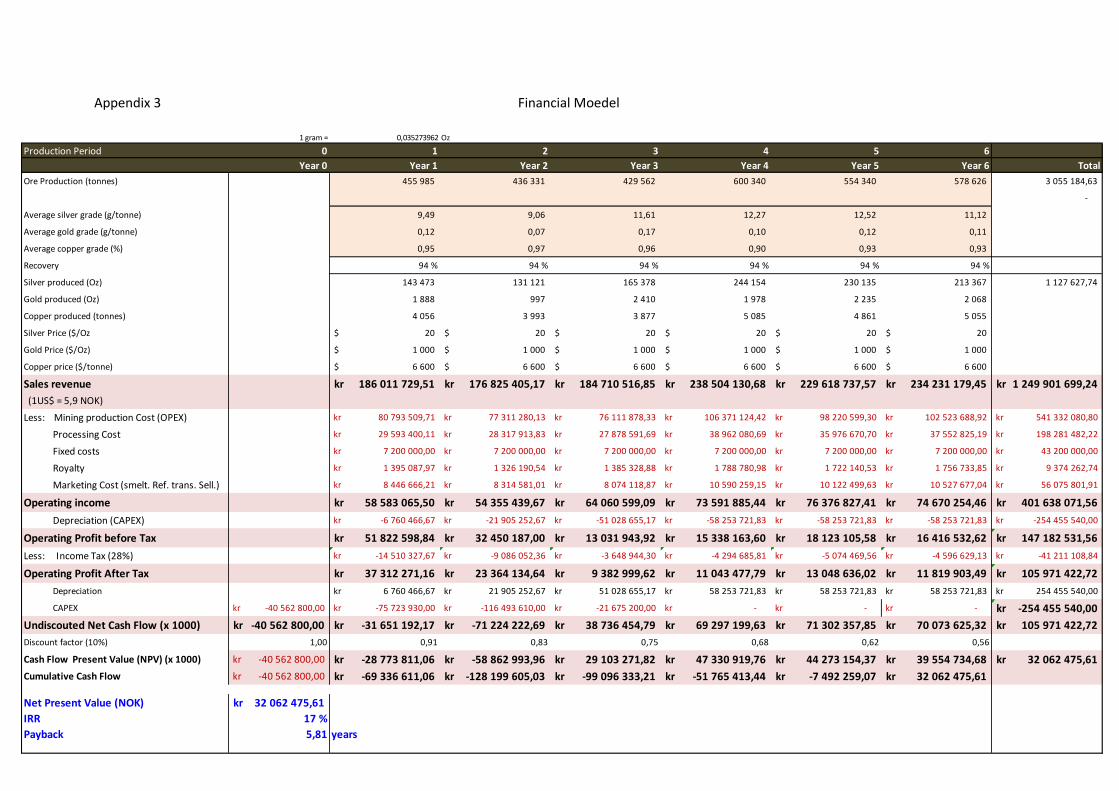
Appendix 3 Financial Moedel
Assesment of underground mining of Nussir copper deposit
1 gram = 0,035273962 Oz
Production Period 0 1 2 3 4 5 6
Year 0 Year 1 Year 2 Year 3 Year 4 Year 5 Year 6 Total
Ore Production (tonnes) 455 985 436 331 429 562 600 340 554 340 578 626 3 055 184,63
-
Average silver grade (g/tonne) 9,49 9,06 11,61 12,27 12,52 11,12
Average gold grade (g/tonne) 0,12 0,07 0,17 0,10 0,12 0,11
Average copper grade (%) 0,95 0,97 0,96 0,90 0,93 0,93
Recovery 94 % 94 % 94 % 94 % 94 % 94 %
Silver produced (Oz) 143 473 131 121 165 378 244 154 230 135 213 367 1 127 627,74
Gold produced (Oz) 1 888 997 2 410 1 978 2 235 2 068
Copper produced (tonnes) 4 056 3 993 3 877 5 085 4 861 5 055
Silver Price ($/Oz 20$ 20$ 20$ 20$ 20$ 20$
Gold Price ($/Oz) 1 000$ 1 000$ 1 000$ 1 000$ 1 000$ 1 000$
Copper price ($/tonne) 6 600$ 6 600$ 6 600$ 6 600$ 6 600$ 6 600$
Sales revenue 186 011 729,51kr 176 825 405,17kr 184 710 516,85kr 238 504 130,68kr 229 618 737,57kr 234 231 179,45kr 1 249 901 699,24kr
(1US$ = 5,9 NOK)
Less: Mining production Cost (OPEX) 80 793 509,71kr 77 311 280,13kr 76 111 878,33kr 106 371 124,42kr 98 220 599,30kr 102 523 688,92kr 541 332 080,80kr
Processing Cost 29 593 400,11kr 28 317 913,83kr 27 878 591,69kr 38 962 080,69kr 35 976 670,70kr 37 552 825,19kr 198 281 482,22kr
Fixed costs 7 200 000,00kr 7 200 000,00kr 7 200 000,00kr 7 200 000,00kr 7 200 000,00kr 7 200 000,00kr 43 200 000,00kr
Royalty 1 395 087,97kr 1 326 190,54kr 1 385 328,88kr 1 788 780,98kr 1 722 140,53kr 1 756 733,85kr 9 374 262,74kr
Marketing Cost (smelt. Ref. trans. Sell.) 8 446 666,21kr 8 314 581,01kr 8 074 118,87kr 10 590 259,15kr 10 122 499,63kr 10 527 677,04kr 56 075 801,91kr
Operating income 58 583 065,50kr 54 355 439,67kr 64 060 599,09kr 73 591 885,44kr 76 376 827,41kr 74 670 254,46kr 401 638 071,56kr
Depreciation (CAPEX) -6 760 466,67kr -21 905 252,67kr -51 028 655,17kr -58 253 721,83kr -58 253 721,83kr -58 253 721,83kr -254 455 540,00kr
Operating Profit before Tax 51 822 598,84kr 32 450 187,00kr 13 031 943,92kr 15 338 163,60kr 18 123 105,58kr 16 416 532,62kr 147 182 531,56kr
Less: Income Tax (28%) -14 510 327,67kr -9 086 052,36kr -3 648 944,30kr -4 294 685,81kr -5 074 469,56kr -4 596 629,13kr -41 211 108,84kr
Operating Profit After Tax 37 312 271,16kr 23 364 134,64kr 9 382 999,62kr 11 043 477,79kr 13 048 636,02kr 11 819 903,49kr 105 971 422,72kr
Depreciation 6 760 466,67kr 21 905 252,67kr 51 028 655,17kr 58 253 721,83kr 58 253 721,83kr 58 253 721,83kr 254 455 540,00kr
CAPEX -40 562 800,00kr -75 723 930,00kr -116 493 610,00kr -21 675 200,00kr -kr -kr -kr -254 455 540,00kr
Undiscouted Net Cash Flow (x 1000) -40 562 800,00kr -31 651 192,17kr -71 224 222,69kr 38 736 454,79kr 69 297 199,63kr 71 302 357,85kr 70 073 625,32kr 105 971 422,72kr
Discount factor (10%) 1,00 0,91 0,83 0,75 0,68 0,62 0,56
Cash Flow Present Value (NPV) (x 1000) -40 562 800,00kr -28 773 811,06kr -58 862 993,96kr 29 103 271,82kr 47 330 919,76kr 44 273 154,37kr 39 554 734,68kr 32 062 475,61kr
Cumulative Cash Flow -40 562 800,00kr -69 336 611,06kr -128 199 605,03kr -99 096 333,21kr -51 765 413,44kr -7 492 259,07kr 32 062 475,61kr
Net Present Value (NOK) 32 062 475,61kr
IRR 17 %
Payback 5,81 years