Campus Environment 2008
136
A+ B- C D CAMPUS ENVIRONMENT 2008 A National Report Card on Sustainability in Higher Education Trends and New Developments in College and University Leadership, Academics and Operations
-
Upload
road2build -
Category
Documents
-
view
137 -
download
12
Transcript of Campus Environment 2008
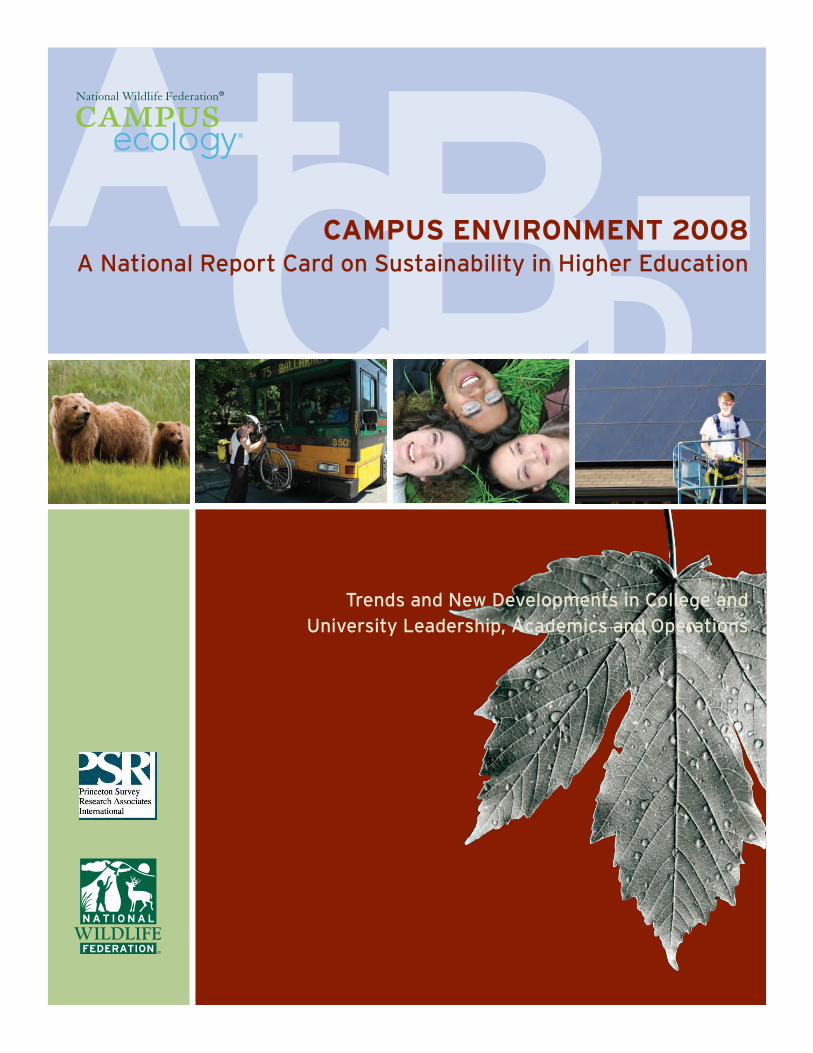
A+B-C DCAMPUS ENVIRONMENT 2008
A National Report Card on Sustainability in Higher Education
Trends and New Developments in College and University Leadership, Academics and Operations
CAMPUS ENVIRONMENT 2008 A National Report Card on Sustainability in Higher Education
Co-SponsorsNational Association of State Universities and
Land-Grant Colleges (NASULGC)
American Association of Community Colleges (AACC)
Society for College and University Planning (SCUP)
APPA – Leadership in Educational Facilities
American Society of Landscape Architects (ASLA)
National Association of College and
University Business Officers (NACUBO)
National Association for Educational Procurement (NAEP)
National Association of Campus Activities (NACA)
Association for the Advancement of
Sustainability in Higher Education (AASHE)
Clean Air-Cool Planet (CA-CP)
Energy Action Coalition (EAC)
Nelson Institute for Environmental Studies, UW-Madison
AuthorsMary McIntosh, PhD, President, Princeton Survey
Research Associates International (PSRAI)
Kenneth Gaalswyk, Project Director, Princeton Survey
Research Associates International (PSRAI)
L. Julian Keniry, Senior Director, Campus and
Community Leadership, National Wildlife Federation
David J. Eagan, PhD, Campus Ecology writer, based
at the University of Wisconsin-Madison
PSRAI Survey Research TeamMary McIntosh
Ken Gaalswyk
Kimberly Hewitt
Crystal Carpenter
Project Team LeadersKevin Coyle, Vice President, Education and Training,
National Wildlife Federation
L. Julian Keniry, Senior Director, Campus and
Community Leadership, National Wildlife Federation
David J. Eagan, Campus Ecology writer, based at
the University of Wisconsin-Madison
Kristy M. Jones, Manager, Campus Climate Education and Action,
National Wildlife Federation
Mary Burnette, Associate Director of Communications,
National Wildlife Federation
(See Acknowledgments for list of other project team members and supporters)
Special Thanks to:National Wildlife Federation thanks the Kendeda Fund for
generous support of this and other Campus Ecology projects.
If you have questions please call National Wildlife Federation at
(703) 438-6000, (800) 822-9919 or email [email protected]
To keep up with the latest at Campus Ecology,
visit www.CampusEcology.org
If you choose to print this document, please minimize
its carbon footprint by using chlorine-free, high post-
consumer content paper (30% or higher), if possible.
Please reuse or recycle the printed document and
recycle your printer toner cartridges.
Cover Images
Grizzly bears - Jess R. Lee/www.jessleephotos.com
Bike rider and bus - Jacqui James, courtesy of University of Washington
Young adults in grass - istockphoto/Ravet007
Student with solar panel - Jackson Solway, courtesy of Colorado College
Design and typesetting by 86 North Design, Philadelphia
© 2008 National Wildlife FederationPermission is granted to copy with attribution and for noncommercial
purposes only. Visit www.nwf.org
A+B-C DCAMPUS ENVIRONMENT 2008:
A National Report Card on Sustainability in Higher Education
Trends and New Developments in College and University Leadership, Academics and Operations
Craig LaCasse
Greg Thomas
Brian Kenny

1CAMPUS ENVIRONMENT 2008
Campus Environment 2008 presents the findings of a comprehensive national campus survey conducted by National Wildlife Federation (NWF). This is the second in a series of nationwide surveys designed to track trends and advance knowledge about environmental stewardship, sustainability activities and related curricular offerings in higher education.
The first survey report from 2001, State of the Campus Environment, is available online http://www.nwf.org/CampusEcology/resources/HTML/stateofthecampusreport.cfm
The original survey—the first of its kind—established national benchmarks and revealed many positive developments in environmental management and sustainability on campus, as well as areas needing improvement. Conducted seven years later, the 2008 survey and report allows comparison over time, showing changes and trends as colleges and universities advance into the first decade of the 21st century.
About this Report
Foreword ........................................................................................................... 2
Section IExecutive Summary ......................................................................................... 4
Section IISurvey Findings, Analysis and Exemplary Schools ..................................... 10
1. Management ..................................... 10
2. Academics ......................................... 24
3. Operations ......................................... 37
Section IIIReport Card ....................................................................................................... 69
Section IVSchools with Exemplary Programs ................................................................ 73
Section VCriteria for Exemplary Programs .................................................................. 83
Section VIMethods, Review Process, and Rationale ...................................................... 87
Section VIIDistribution and List of Participating Schools ............................................. 91
Section VIIITopline Results ................................................................................................ 115
Acknowledgments ......................................................................................... 132
Contents
“The NWF Report Card is the
Gold Standard for charting
the sustainability movement in
higher education. Coverage of
both operational and academic
programs is particularly important.
Strongly recommended reading
for administrators, faculty and
students,” said David W. Orr,
professor of Environmental
Studies and senior advisor to the
president, Oberlin College. He is
also the author of Earth in Mind,
Ecological Literacy, The Last
Refuge, and Design on the Edge.

2NATIONAL WILDLIFE FEDERATION CAMPUS ECOLOGY
This 2008 Report Card on Sustainability in U.S. Higher Education
contains some surprises. It shows that many positive changes are
occurring on U.S. campuses, especially in the greening of campus
operations. There are no surprises there. But unexpectedly, it also
informs us that between the years 2001 and 2008, the amount of
sustainability-related education offered on campuses did not increase
and may have even declined. As an educator, I found this a cause for
deep concern.
America and the world are in the midst of revolutionary change. In just the past few years, the threat of global warming has shifted in the United States from a distant worry to a present and intense national public conversation. Business leaders and policy makers are responding with new proposals every day and markets are shifting dramatically. These shifts have been rapid by any measure and they challenge American higher education to keep pace and ultimately to lead in the realm of the environment and sustainability.
Two things are certain. First and foremost, we have never before had an environmental challenge on such an immense scale as to force modern society to remake itself. America will require a new energy economy and needs to get started on that right away. Second, addressing this problem and shaping a more sustainable, low carbon society will require new thinking supported by new technology, design, financing, businesses, institutions, consumer behaviors and careers paths. That is where higher education comes in. It plays important roles by both being part of a changing world and also actively shaping the future direction of that world.
American higher education has risen to past challenges—and has the people and resources already in place to meet today’s challenges head-on. It produces 30 percent of the world’s scientists and a remarkably large percentage of the world’s business, diplomatic and government leaders. Higher education leaders have always been clear that the successful development of human talent and globally-competitive skills provides the United States with many critical opportunities and advantages.
But even institutions as accomplished as U.S. colleges and universities change at different speeds and in different ways. This National Report Card finds the changes needed to embrace the new energy economy started long ago on campuses, but may actually be lagging in higher education overall. The report finds that campus leaders —presidents, administrators and physical plant managers—value sustainability. They speak to it, hire staff to support it, and the campuses they lead are steadily becoming “greener.” But at the same time, the educational programs they offer to students do not appear to be keeping pace.
Our 2001 to 2008 comparison of the curricular and academic dimensions of sustainability shows no significant gains in those seven years despite the growing depth of the global warming challenge and what it means to future professions and their related disciplines.
by Kevin Coyle
Vice President, Education and Training,
National Wildlife Federation
Foreword

3CAMPUS ENVIRONMENT 2008
The men and women who, in 20 years, will lead our businesses, educational institutions and government agencies are in school now. We need to offer them the kind of academic and professional preparation that will ready them to envision and create a different kind of world. It will be a world which has new and cleaner forms of energy production, transportation, agriculture, natural resource management, health care, scientific research, micro and macro businesses, and other essential technological advances. To achieve this at the speed required will call for serious new support including new guidance and funding from federal and state governments, and a complete rethinking of how we educate every degree candidate from architecture and engineering to accounting and even teaching itself.
National Wildlife Federation will join other organizations to carry the message to our government leaders that we can not afford to lag on sustainability in higher education. We will work for more education funds and the rapid distribution of educational best practices for U.S. colleges and universities.
As a nation, we have a rich tradition of excellence in higher education. But we are witnessing national and global changes that could challenge its very foundations. This Report Card tells us there is a widening gap between where American higher education actually is on teaching sustainability and where it should be. It serves as a warning. If we are unable to bridge the gap there could be dire consequences. But with greater focus on making the transition and given adequate human and financial resources, we can bring academia up to speed and help shape a brighter and more sustainable future.
Foreword (cont.)

4NATIONAL WILDLIFE FEDERATION CAMPUS ECOLOGY
Few, if any, sectors of American society are better positioned than U.S. higher education—and perhaps none face the moral imperative—to lead on issues of environmental performance and sustainability. With less than 5 percent of the world’s population, the U.S. uses almost 25 percent of the world’s resources and its universities are among the most numerous and well-to-do in the world. Endowed with excellent research facilities, libraries, inspirational educators leading a broad array of disciplines, energized students and experienced staff, colleges and universities enjoy a unique mix of resources that, when harnessed with vision and persistence, can help lead society towards a more sustainable future.
The purpose of Campus Environment 2008 is to explore the extent to which college and university leaders value environmental performance and sustainability and are putting these values into practice. We not only report on current activity and performance, but also compare these trends with our 2001 study. Other studies by peer groups, looking in different ways at select colleges and universities, have emerged since 2001. Taken together, these surveys provide varied lenses through which to view the vast and complex subject of campus leadership for sustainability, and signal the growing interest in this topic. With more than 1,068 campuses responding in 2008 (176 more than in 2001) this study, conducted by Princeton Survey Research Associates International, remains the largest in the United States, enabling us to glimpse beyond the anecdotal into nationwide trends across all types of campuses, large and small, public and private, in all regions of the country and spanning the current decade.
For a variety of reasons, even though the data would permit it, we do not attempt to rank or grade individual campuses. Instead, we analyze trends in terms of collective percentages of schools engaged in important good practices in the areas of leadership, management, academics and operations. Based on their survey responses, this report identifies campuses having exemplary programs in specific areas and also recognizes those with the greatest number of exemplary programs1. The findings highlight areas where more emphasis is needed and where considerable progress is underway. In some cases, our findings challenge the claims of recently published articles about campus greening that suggest promising new trends based on a few anecdotal examples. In other cases, our findings corroborate such stories.
Some of the important outcomes of the study are highlighted below, listed according to the three topic areas in the survey: management, academics and operations. For all survey questions, a comprehensive “report card” was prepared to show the relative strengths of particular campus practices. See page 69 for the complete report card and grading criteria. A few of the more significant marks are given here, showing trends since 2001.
AT A GLANCENumber of states participating in the survey ...............................................50Number of campuses participating ..................................................................1,068Percentage of all U.S. colleges & universities ...............................................27%Number of participating schools recognized for exemplary
programs or having a strong commitment to “do more.”...........................334
Executive Summary
(1) See also Campus Environment 2008: Exemplary States List at www.nwf.org/campusecology.
Section I

5CAMPUS ENVIRONMENT 2008
1. Greener overall leadership of the university
A welcome discovery is that university leaders value environmental, social and economic sustainability considerably more than in 2001 and are putting structures in place to broaden and sustain engagement campus-wide. Indicators of this commitment include increased goal-setting for improving performance, more staffing for sustainability programs, and a rise in orientation programs for students, faculty and staff on the “green” aims and practices of their college or university.
Leadership trends 2001 2008 Trend
Setting and reviewing sustainability goals B- B i
Staffing sustainability programs C B- i
Orienting students, staff and faculty D C- i
Commitment to do more on the above 11% 33% i
2. Equipping students to lead the way
Academics still lag behind the vision, management and operations of the campus—even more so than when this survey was first conducted in 2001. Today’s student is just as unlikely as in 2001 to graduate with exposure to basic ecological principles, much less with an understanding of how the human-designed economy can work in harmony with natural systems. At only a minority of schools have fifty percent or more of the students taken a course on the basic functions of the earth’s natural systems and even fewer have taken courses on the connection between human activity and environmental sustainability. Areas such as business, engineering and teacher education still lag far behind the natural and physical sciences in offering environmental or sustainability courses within their disciplines. Relatively small percentages of campuses offer interdisciplinary degree opportunities in environmental and sustainability studies. Moreover, considerably fewer campuses today require all students to take courses on environmental or sustainability topics.
Academic trends 2001 2008 Trend
Educating a majority of students on the basic functions of earth’s natural systems
C C- m
Have programs to support faculty professional development on environmental or sustainability topics
B C+ m
All students take at least one course related to environment or sustainability
8% 4% m
Executive Summary (cont.)
Section I

6NATIONAL WILDLIFE FEDERATION CAMPUS ECOLOGY
3. Greening the day-to-day operations of the campus
Efforts to green the campus shine most brightly in day-to-day operations. Facilities leaders, together with students and faculty, have been instrumental in driving programs to conserve energy and water, increase the amount of clean energy used to power the campus, and reduce waste. Almost all campuses are working to improve the efficiency of heating, ventilation and air conditioning (HVAC) systems, which are responsible for the largest share of direct emissions of carbon dioxide to the atmosphere. Since 2001, a new movement to reduce emissions of carbon dioxide (CO2) and shift to cleaner sources of energy has taken hold in a whole variety of ways. For example, one-third (32%) of colleges and universities, use off-campus renewable energy sources to meet some of their electricity, heating and cooling needs, and more than 36 percent of schools say they have plans to generate more renewable energy on campus. A sizeable number of campuses are also working actively toward people- and wildlife-friendly landscapes.
Trends in campus operations 2001 2008 Trends
Heating, ventilation and cooling efficiency upgrades campus-wide
C- C i
*Using some form of renewable or cleaner energy sources to meet campus electricity, heating and cooling needs
C- C i
Water conserving upgrades campus-wide C- C+ i
Greener transportation solutions C- C i
Waste diversion rates C C —
Sustainable landscapes B- B- —
*Although still a small percentage overall, 6% of campuses use renewables for 90% or
more of their energy needs, compared to 1% in 2001.
Little progress has been made to date, though, in reducing the congestion, pollution and other environmental impacts associated with staff and student commuting.Taken together, the findings of the current survey are quite encouraging. While some areas are in need of significant improvement, there is a sense of real progress across the board. Given the quantum leap in campus activities related to sustainability and climate change over the past two years, we expect more trends to be headed sharply upward when we repeat this survey in five years or so.
The 2008 survey was sent to all 2- and 4-year schools in the United States and over a quarter responded, making this a truly representative snapshot of higher education today. But many schools with strong environmental credentials did not participate—for whatever reason—which means the lists of exemplary schools in this report could be even longer. There are many positive signs that increasing numbers of colleges and universities are responding to the growing call for leadership and commitment to a sustainable tomorrow. And because we recognize the need for widespread, collaborative engagement across all sectors of society, we invite and welcome any comments, inquiries and ideas to further the national conversation about what sustainability means in practice and how higher education can help lead the way.
Executive Summary (cont.)
Section I

7CAMPUS ENVIRONMENT 2008
• Most promising new development: Rising percentage of campuses setting goals for reducing
emissions of carbon dioxide (CO2) and other greenhouse gases.
• Second most promising new development: In 2008, campus leaders much more likely to rank environmental
and sustainability programs among their highest priorities, and competing priorities are no longer the obstacle that they were in 2001.
• Most prevalent environmental initiative: 2008: Water conservation and efficiency 2001: Recycling
• Most popular performance goal: In 2008: Conserving energy In 2001: Environmental performance in new buildings
• The biggest obstacle to expanding environmental and sustainability programming:
2008: Money
2001: Other priorities
• New motivator for sustainability programs: In 2008, the cost effectiveness of environmental and
sustainability improvements is a much stronger motivator than was the case in 2001.
• Changing impetus for sustainability programs: In 2008, government regulation is a much less significant motivator for environmental and sustainability programs than in 2001.
• Big plans to do more: Since 2001, significant increases in plans to hire recycling,
energy and green purchasing coordinators, recycle all waste and surplus goods including construction materials, and improve the
performance of new and existing buildings.
• Areas most likely to be staffed: Recycling managers and staff who administer sustainability programs.
Trend Highlights
Executive Summary (cont.)
Section I

8NATIONAL WILDLIFE FEDERATION CAMPUS ECOLOGY
• Biggest opportunities missed Educating about sustainability to pre-service teachers as well as
undergraduates across most disciplines.
• Steady progress Using renewable energy, improving efficiency of heating, ventilation
and air conditioning.
• Still struggling Little progress in the congestion, pollution and costs associated with
students and staff driving alone to campus.
• Biggest surprise Decline in teaching and learning about sustainability. What we expected
Trend Highlights
Executive Summary (cont.)
Section I

9CAMPUS ENVIRONMENT 2008
Expectations vs. Reality
What we expected Students would be the main drivers of change on the majority of campuses.
What we found Students, faculty and staff are listed equally as instigators of change
on campus. A third of schools each list one of these groups as the main driver.
What we expected Academics would receive a big boost since 2001 because of the imperative
set forth by climate scientists to realign human activities with the natural systems of the earth.
What we found Curriculum connections are slipping. In terms of academic offerings,
students are slightly less likely in 2008 to be environmentally literate when they graduate in 2008 than in 2001.
What we expected The area most likely to be staffed would be energy management because
of the motivation to save money, but that sustainability staffing overall might decrease due to the impact of rising energy and other costs on overall budgets.
What we found Staffing overall is on the rise. Recycling coordinators are the most
commonly staffed positions, followed by sustainability coordinators and then energy conservation managers. A majority of schools not only have sustainability staff in place, but large percentages have plans to increase sustainability staffing across diverse departments.
What we expected Most sustainability staff would report to specific departments or serve in
mid-level positions.
What we found Sustainability staff play prominent roles on campus. A majority of all
sustainability positions report to the central administration and a large number of positions are vice president, associate vice president, or similarly high-level.
What we expected A surge in orientation of new faculty, staff and students to the campus
sustainability goals and programs, which would be a relatively simple and cost effective way to increase participation.
What we found There is room for improvement. Indeed, a modest increase in orientation
programs occurred for new faculty, staff and students, but most campuses are still overlooking this relatively easy and powerful step.
Executive Summary (cont.)
Section I

10NATIONAL WILDLIFE FEDERATION CAMPUS ECOLOGY
Key Findings2
Environmental and Sustainability Programs Align with Campus Culture, ValuesA large majority of colleges and universities continue to say that environmental or sustainability programs fit the culture and values of their campus. Solid majorities again say environmental or sustainability programs are good public relations and are cost effective. A sizeable minority say their programs are helpful in recruiting students as well as faculty and staff. Notably, schools have grown more appreciative of these benefits since 2001.
Setting and Reviewing Environmental and Sustainability Goals is WidespreadA majority of schools continue to set and review goals for conserving energy, environmental performance of existing and new buildings, and reducing solid waste and maximizing recycling. Nearly half set and review goals for conserving water while large minorities set and review goals for protecting natural habitats and reducing greenhouse gas emissions. Although more schools are committed to conserving energy, schools have either stalled or backed off their efforts at setting and reviewing environmental and sustainability goals since 2001.
Put That in Writing!—More Colleges and Universities Have Done SoThe commitment that many campuses have made to increased environmental sustainability and stewardship continues to be more than just rhetoric. A majority of schools currently have written declarations promoting environmental sustainability or stewardship or plan to develop them. And a majority also have written declarations that state that educating students about sustainability or stewardship is part of the school’s academic mission. On both counts, more schools are now committed than in 2001.
Increased Commitment to Hire Environmental and Sustainability ProfessionalsAmerican colleges and universities have stepped up efforts since 2001 to hire personnel to tackle important sustainability issues and implement programs. A larger majority of colleges and universities have hired a recycling coordinator or manager, while half have hired a staff person or administrator who leads sustainability issues. Nearly half have also hired an energy conservation coordinator or manager, and have an environmental/sustainability task force, committee, or council. A small minority have hired a green purchasing coordinator, though one-third have plans to do so.
Section II
Survey Findings, Analysis & Exemplary Schools
1. Management
(2) Results in this section are based on the return of surveys from 667 colleges and universities, completed by a Chancellor, President, Vice President, Provost, Sustainability Director, Sustainability Coordinator, or a member of their staff. Results based on the full sample of respondents have a margin of error of plus or minus four percent.

11CAMPUS ENVIRONMENT 2008
Key Findings (cont.)Leadership in Place, plus Improvement in “Green” Orientations for Students and StaffLeadership, accountability, and education can also drive campus performance. One-third of campuses surveyed have a director who leads environmental and sustainability efforts, and nearly as many campuses turn to a leader within the administration. And a solid majority of leaders report to the campus administration, though few schools hold campus units accountable for environmental performance. One-quarter of schools have an orientation session or publication about campus-focused sustainability or environmental programs, roughly twice as many
as in 2001.
Environmental and Sustainability Programs Still Face RoadblocksWhile colleges and universities have increased efforts to improve campus environmental and sustainable performance, challenges still abound. Large majorities of schools once again cite inadequate funding, inadequate staff time, and more pressing campus needs as impediments to their programs. Funding challenges have become more prevalent since 2001 while the challenge of competing campus needs has eased somewhat.
Section II
Survey Findings, Analysis & Exemplary Schools (cont.)
1. Management

12NATIONAL WILDLIFE FEDERATION CAMPUS ECOLOGY
Reasons Schools Implement Environmental or Sustainability Programs3
American colleges and universities continue to find a variety of benefits to developing their environmental or sustainability programs, and more schools now appreciate these benefits than in 2001.
A key reason, according to a large majority of colleges and universities (76%), is that environmental or sustainability programs fit the culture and values of the campus. Solid majorities of schools also say environmental or sustainability programs are good for public relations (66%) and cost-effective (62%). And a large minority of colleges and universities say that offering such programs helps them recruit students (35%) and faculty or staff (27%). These reasons are cited more often by four-year schools than two-year schools.
Colleges and universities have grown to appreciate these benefits since 2001. Specifically, schools are more likely now than in 2001 to say that the culture and values of the campus (76% vs. 63%), public relations (66% vs. 47%), cost-effectiveness (62% vs. 40%) and student-recruitment potential (35% vs. 17%) have encouraged them to implement environmental or sustainability programs.
Section II
Survey Findings, Analysis & Exemplary Schools (cont.)
1. Management
(3) The analysis and tables for each question are based on all respondents. The percentages in each table will not sum to 100% because the percentage of respondents who did not answer each question is not displayed in the tables, and in some cases the “No” responses have been omitted. For exact wording of questions and detailed findings, please refer to the Topline section of the report.
Q10. To what extent has your campus been encouraged to implement environmental or sustainability programs because you …?
% who say A Great Deal or Somewhat
2008 2001
Total4-Year Degree
2-Year Degree
Total4-Year Degree
2-Year Degree
Think environmental or sustainability programs fit the culture and values of the campus
76% 79% 69% 63% 67% 58%
Have found environmental or sustainability programs are good for public relations
66% 69% 62% 47% 51% 39%
Have found them to be cost-effective 62% 67% 56% 40% 42% 39%
Have found environmental or sustainability programs help recruit students
35% 42% 23% 17% 20% 11%
Have found environmental or sustainability programs help recruit faculty or staff
27% 30% 22% — — —

13CAMPUS ENVIRONMENT 2008
Reasons Schools Implement Environmental or Sustainability Programs (cont.)
Consistent with the large majority of schools that think environmental or sustainability programs fit in with the culture and values of the campus, roughly seven in 10 campuses say that staff (70%), faculty (69%) and student (67%) interest in the topic plays a role in encouraging their campus to implement environmental or sustainability programs. This represents an increase from 2001 in all three areas (49%, 49% and 47%, respectively).
Notably, the role of government regulations as a motivator dropped to 44 percent from 60 percent in 2001. And two in 10 (21%) schools cite alumni interest as a motivating factor, up from 8 percent in 2001.
Q9. To what extent have each of the following played a role in encouraging your campus to implement environmental or sustainability programs …?
% who say A Great Deal or Somewhat
2008 2001
Total4-Year Degree
2-Year Degree Total
4-Year Degree
2-Year Degree
Staff interest 70% 74% 63% 49% 54% 42%
Faculty interest 69% 72% 65% 49% 53% 41%
Student interest 67% 72% 58% 47% 56% 29%
Government regulations 44% 42% 48% 60% 56% 65%
Alumni interest 21% 27% 13% 8% 8% 7%
Written Environmental and Sustainability Policies
For many schools, environmental protection and sustainability fit well into their culture and values, and they set goals and put policies in writing which reflect that. Colleges and universities were asked about two types of general written commitments: promoting environmental sustainability or stewardship, and including environmental sustainability or stewardship as part of the academic mission.
More than six in 10 schools (65%) either have a written commitment to promote environmental sustainability or stewardship or have plans to develop one, representing an increase since 2001 (43%). Four-year schools are more likely to have a formal declaration of commitment, though two-year schools are just as likely as four-year schools to have plans to develop one.
Section II
Survey Findings, Analysis & Exemplary Schools (cont.)
1. Management
Q1. Some campuses have a written declaration that they are committed to promoting environmental sustainability or stewardship, while other campuses do not. Does your campus have a formal declaration of commitment?
2008 2001
Total4-Year Degree
2-Year Degree Total
4-Year Degree
2-Year Degree
Yes 37% 44% 25% 27% 30% 22%
Have plans to develop one 28% 28% 29% 16% 17% 14%
No 32% 24% 46% 54% 49% 63%

14NATIONAL WILDLIFE FEDERATION CAMPUS ECOLOGY
Written Environmental and Sustainability Policies (cont.)
Many schools also have written declarations promoting environmental sustainability or stewardship as part of their academic mission. Over half (53%) of colleges and universities either have a written declaration that educating students about environmental responsibility is part of their academic mission or plan on developing one in the future, up from one-third (34%) in 2001. Four-year schools are more likely than two-year schools to have these written policies.
Q2. Does your campus have a written declaration that educating students about environmental sustainability or stewardship is part of its academic mission?
2008 2001
Total4-Year Degree
2-Year Degree Total
4-Year Degree
2-Year Degree
Yes 25% 30% 16% 21% 25% 14%
Have plans to develop one 28% 26% 30% 13% 14% 12%
No 41% 36% 49% 61% 56% 71%
Setting and Review of Environmental and Sustainability Goals
Colleges and universities continue to develop policies and standards that cover a range of environmental and sustainability concerns, from energy conservation to recycling to protecting natural habitats. Even more schools might not formalize their policies in writing but nonetheless might regularly set and review their goals.
Colleges and universities are most likely to regularly set and review goals for conserving energy (72%) and the environmental performance of existing and new buildings (65%), two activities that most directly affect the financial bottom line. Schools are also more likely to set and review goals for reducing solid waste and maximizing recycling (60%). Other activities that receive attention from many school policy makers include conserving water (49%), protecting natural habitats (39%) and reducing emissions of CO2 and other greenhouse gases (35%).
Compared to 2001, colleges and universities have a mixed record. Schools are now more likely than in 2001 to regularly set and review goals for conserving energy (72% vs. 64%). The numbers have largely stayed the same for environmental performance of buildings, as well as conserving water. But fewer schools now compared to 2001 say they regularly set and review goals for protecting natural habitats (39% vs. 47%).
Section II
Survey Findings, Analysis & Exemplary Schools (cont.)
1. Management

15CAMPUS ENVIRONMENT 2008
Q3A/B. Does your campus regularly set and review goals for …?
2008 2001
Total4-Year Degree
2-Year Degree
Total4-Year Degree
2-Year Degree
Conserving energy
Yes, campus-wide 45% 49% 41% 43% 47% 37%
Yes, in some campus units 27% 27% 27% 21% 20% 21%
Have plans to establish policies, goals or standards
35% 35% 37% — — —
Environmental performance of existing and new buildings
Yes, campus-wide 40% 41% 39% 45% 47% 41%
Yes, in some campus units 25% 26% 23% 19% 22% 16%
Have plans to establish policies, goals or standards
37% 41% 34% — — —
Reducing solid waste and maximizing recycling
Yes, campus-wide 29% 33% 24% 32% 35% 29%
Yes, in some campus units 31% 32% 29% 24% 23% 24%
Have plans to establish policies, goals or standards
38% 41% 37% — — —
Conserving water
Yes, campus-wide 27% 28% 26% 23% 25% 19%
Yes, in some campus units 22% 23% 20% 18% 22% 11%
Have plans to establish policies, goals or standards
34% 37% 30% — — —
Reducing emissions of CO2 and other greenhouse gases
Yes, campus-wide 22% 26% 14% — — —
Yes, in some campus units 13% 14% 13% — — —
Have plans to establish policies, goals or standards
31% 36% 28% — — —
Protecting natural habitats
Yes, campus-wide 19% 21% 15% 25% 26% 24%
Yes, in some campus units 20% 19% 24% 22% 24% 18%
Have plans to establish policies, goals or standards
21% 20% 21% — — —
NOTE: Only schools that do not regularly set and review goals were asked if they have plans to establish written policies, goals or standards.
Setting and Review of Environmental and Sustainability Goals (cont.)
While a lot is going on in schools at the policy level, more can be done in encouraging future development and review of goals regarding environmental and sustainability issues. Among schools that do not regularly set and review goals in these areas, between two and 10 and four in 10 state they plan to establish written policies, goals or standards for their campus either in some units or campus-wide.
Section II
Survey Findings, Analysis & Exemplary Schools (cont.)
1. Management

16NATIONAL WILDLIFE FEDERATION CAMPUS ECOLOGY
Q4A/B. Does your campus have …?
2008 2001
Recycling coordinator or manager
Yes 57% 51%
Have plans to name one 48% 5%
A staff person or administrator who leads sustainability issues
Yes 51% —
Have plans to name one 48% —
Environmental/sustainability task force, committee, council
Yes 49% —
Have plans to form one 55% —
Energy conservation coordinator or manager
Yes 45% 36%
Have plans to name one 46% 6%
Green purchasing coordinator or manager
Yes 14% 7%
Have plans to name one 36% 6%
Environmental and Sustainability Personnel on Campus
Colleges and universities have stepped up their efforts somewhat since 2001 in hiring people to head specific environmental or sustainability positions. A large minority has plans to do more. And campus leadership is not lacking—over one-third of campuses have a director who leads environmental and sustainability efforts, and nearly as many have someone in the administration who leads. Moreover, a solid majority of these leaders report directly to the campus administration.
Nearly six in 10 (57%) colleges and universities report having a recycling coordinator or manager, up slightly from 2001 (51%). Half of the schools have staff or administrators responsible for leading sustainability issues (51%), and just as many report having an environmental or sustainability task force, committee or council (49%). Nearly as many (45%) have an energy conservation coordinator or manager, an increase since 2001 (36%). Comparatively few (14%) have a green purchasing coordinator or manager. But this represents a twofold increase since 2001 (7%).
About half or more of the campuses plan to do more—they have plans to hire the people needed to carry out specific environmental or sustainability tasks. Though plans to hire a green purchasing coordinator or manager is not as high a priority compared to the others, current interest is much stronger compared to 2001 (36% vs. 6%).
Section II
Survey Findings, Analysis & Exemplary Schools (cont.)
1. Management

17CAMPUS ENVIRONMENT 2008
Section II
Survey Findings, Analysis & Exemplary Schools (cont.)
1. Management
California Polytechnic State University (San Luis Obispo, CA)
California Polytechnic promotes sustainability campus-wide. Cal Poly’s Master
Plan articulates sustainability principles that inform campus development, and
the campus operations department has a sustainability action plan that outlines
specific targets. Progress is monitored and summarized in biennial reports (see
www.facilities.calpoly.edu/sustainability).
Results have been impressive. The university’s efforts have led to a 13
percent reduction in energy use per square foot of building space since 2003;
additional conservation projects are expected to reduce energy demand by
another 15 percent by 2010. The campus installed its first solar photovoltaic
array and is constructing a cogeneration facility. Through extensive water
conservation practices, indoor water use has fallen to its lowest level in a
decade—despite significant increases in buildings and campus population.
Commuting has declined due to new on-campus housing, subsidized transit
and other transportation demand management efforts. In 2007, Cal Poly
diverted 70 percent of its solid waste from landfills, and on-campus composting
facilities handle post-consumer food waste from campus dining. The university
is completing a new Leadership in Energy and Environmental Design (LEED)
certified student housing complex for more than 2,650 students. Academically,
there are over 125 courses directly related to sustainability, and some
departments offer minors in sustainability. Efforts are underway to ensure that
sustainability “literacy” is part of every graduate’s experience.
Leading School for Environmental or Sustainability Goal-Setting(See page 21 for other campuses recognized as exemplary in this category.)
Co
pyri
gh
t: C
alif
orn
ia P
oly
tech
nic
Sta
te U
niv
ers
ity
Cal Poly is the second largest land-holding
university in California, offering more than
125 courses related to sustainability.
Campus Profile

18NATIONAL WILDLIFE FEDERATION CAMPUS ECOLOGY
Q5B. Where does the person in this position report?
2008
Central administration 52%
Facilities, Physical Plant, Operations department 24%
Academic Dean of College 7%
Board of Trustees 1%
Other position or department (specify) 2%
Not applicable 2%
Environmental and Sustainability Personnel on Campus
Having leaders in place to monitor and direct campus efforts may also make a difference in whether campuses can achieve their environmental and sustainability goals.
According to more than one-third (36%) of colleges and universities, the director is the highest-level paid position that is responsible for leading environmental performance or sustainability. Nearly as many (30%) report having a leadership position within the administration, with the vice president or assistant vice president (23%) the most prevalent. A much smaller number of schools report coordinators (9%) or managers (8%) as the highest-level position responsible for leading environmental performance or sustainability.
Section II
Survey Findings, Analysis & Exemplary Schools (cont.)
1. Management
Q5A. What is the highest-level paid position that is responsible for leading environmental performance or sustainability?
2008
Director 36%
Vice President or Assistant Vice President 23%
Coordinator 9%
Manager 8%
Vice Chancellor or Assistant Vice Chancellor 2%
Dean, Provost or Officer 2%
President or Assistant President 2%
Chancellor or Assistant Chancellor 1%
Other position (specify) 4%
No position 2%
More than half (52%) of the individuals responsible for leading environmental performance or sustainability at their campus typically report to the central administration, according to colleges and universities surveyed. One-quarter (24%) report to the facilities or operations department while a smaller number (7%) report to the academic dean.

19CAMPUS ENVIRONMENT 2008
Q6. Does your campus offer an orientation session or publication about campus-focused sustainability or environmental programs to …?
% who say Yes
2008 2001
Total4-Year Degree
2-Year Degree
Total4-Year Degree
2-Year Degree
Students 27% 34% 14% 13% 16% 7%
Staff 23% 27% 17% 13% 13% 13%
Faculty 22% 25% 17% 11% 11% 11%
Note: In 2001, campuses were only asked about orientation sessions.
Q16A. Does your school hold campus units accountable for environmental performance, through incentives and/or penalties?
2008
Total4-Year Degree
2-Year Degree
Yes 6% 7% 4%
No 78% 76% 82%
Environmental and Sustainability Personnel on Campus (cont.)
While schools have leaders in place who are accountable for leading campus efforts on environmental and sustainability performance, very few schools are holding campus units accountable. Fewer than one in 10 (6%) colleges and universities say they hold campus units accountable for environmental performance through incentives and/or penalties. Eight in 10 (78%) do not hold campus units accountable.
Orientation Sessions and Publications
One way to help personnel carry out their mission is to educate and inform the campus population about campus environmental and sustainability programs. Schools have improved their orientation efforts aimed at students, staff and faculty since 2001, though there continues to be room for improvement.
One-quarter of campuses now offer an orientation session or publication about campus-focused sustainability or environmental programs to students (27%), staff (23%) or faculty (22%)—roughly twice as many campuses as in 2001 for all three groups. Four-year colleges and universities are more likely than two-year schools to offer students, staff and faculty an orientation session or publication about campus-focused sustainability or environmental programs.
Section II
Survey Findings, Analysis & Exemplary Schools (cont.)
1. Management

20NATIONAL WILDLIFE FEDERATION CAMPUS ECOLOGY
Q8. How much of a challenge are each of the following to your campus expanding its environmental or sustainability programs?
2008 2001
Inadequate funding
One of the biggest challenges 46% 37%
A key challenge, but not one of the biggest 28% 26%
Inadequate staff time
One of the biggest challenges 46% 42%
A key challenge, but not one of the biggest 24% 27%
Concern that other campus needs are more pressing
One of the biggest challenges 34% 44%
A key challenge, but not one of the biggest 26% 24%
Concern that environmental or sustainability programs are not cost-effective
One of the biggest challenges 9% 10%
A key challenge, but not one of the biggest 20% 21%
Lack of faculty or staff interest in participating in environmental stewardship programs
One of the biggest challenges 6% —
A key challenge, but not one of the biggest 19% —
Lack of student interest in participating in environmental stewardship programs
One of the biggest challenges 6% —
A key challenge, but not one of the biggest 18% —
Challenges to Expansion of Environmental and Sustainability Programs
American colleges and universities continue to face a number of challenges to expanding their environmental and sustainability programs. Funding challenges are on the rise since 2001, while slightly fewer campuses cite competing priorities as a challenge.
Most of the challenges to expanding programs are resource based, including inadequate funding (74%), inadequate staff time (70%) and other campus needs taking higher priority (60%). Fewer presidents say that concerns about the cost-effectiveness (29%), inadequate faculty or staff interest (25%) or inadequate student interest (24%) are the biggest or key challenges to expanding environmental or sustainability programs. More schools now cite inadequate funding as a challenge to expansion compared to 2001 (74% vs. 63%), while fewer schools cite other campus needs being more pressing (60% vs. 68%).
Across the board, two-year schools are more likely than four-year schools to cite these factors as challenges to expanding their environmental and sustainability programs. And school size is also a factor, with smaller schools more likely to be challenged. Public schools are more likely than private schools to rate inadequate funding as well as inadequate staff time as a challenge. There is some regional variation, with the South more likely than other regions to cite inadequate funding.
Section II
Survey Findings, Analysis & Exemplary Schools (cont.)
1. Management

21CAMPUS ENVIRONMENT 2008
Exemplary Schools for Environmental or Sustainability Goal-Setting (Q1, Q2, Q3A)
School Location School Location
Augsburg College Minneapolis, MN Northern Kentucky University Highland Heights, KY
Ball State University Muncie, IN Orange County Community College Middletown, NY
California State Polytechnic University San Luis Obispo, CA Otterbein College Westerville, OH
California State University Sacramento, CA Pacific Lutheran University Tacoma, WA
California State University San Bernardino, CA Pacific University Forest Grove, OR
California State University, Monterey Bay Seaside, CA Point Loma Nazarene University San Diego, CA
Cape Cod Community College West Barnstable, MA Princeton University Princeton, NJ
Catawba College Salisbury, NC Rosemont College Rosemont, PA
College of the Atlantic Bar Harbor, ME Santa Clara University Santa Clara, CA
Colorado College Colorado Springs, CO South Georgia College Douglas, GA
Earlham College and Earlham School of Religion
Richmond, IN State University of New York College of Environmental Science & Forestry
Syracuse, NY
Edgewood College Madison, WI University of Arizona Tucson, AZ
Emory University Atlanta, GA University of Memphis Memphis, TN
George Washington University Washington, DC University of Minnesota Morris, MN
Georgia Institute of Technology Atlanta, GA University of Montana Missoula, MT
Idaho State University Pocatello, ID University of South Carolina Columbia, SC
Lane Community College Eugene, OR University of Virginia Charlottesville, VA
Los Angeles Pierce College Woodland Hills, CA Victor Valley College Victorville, CA
Michigan State University East Lansing, MI Western Washington University Bellingham, WA
Mount Holyoke College South Hadley, MA Willamette University Salem, OR
Section II
Survey Findings, Analysis & Exemplary Schools (cont.)
1. Management
Colleges and Universities that Lead on Environmental or Sustainable Goal-Setting
Some schools have gone to particularly great lengths to ensure that the environment and sustainability are part of their planning process. These exemplary schools have established a written declaration committing to the promotion of environmental sustainability or stewardship and have a written declaration that educating students about environmental sustainability or stewardship is part of their academic mission. Moreover, these schools have taken the lead in setting and reviewing goals for conservation and environmental or sustainability issues. These schools are mostly four-year schools and are located throughout the United States, though many schools reside in the West, and are fairly divided between public and private.

22NATIONAL WILDLIFE FEDERATION CAMPUS ECOLOGY
Schools Committed to Doing More with Environmental or Sustainability Goal-Setting (Q3B)
School Location School Location
Art Institute of Atlanta Atlanta, GA New Mexico State University Alamogordo, NM
Clark Atlanta University Atlanta, GA Olympic College Bremerton, WA
College of the Siskiyous Weed, CA Palo Alto College San Antonio, TX
Eastfield College Mesquite, TX University of Hawaii Windward Community College
Kaneohe, HI
Iowa Central Community College Fort Dodge, IA University of Saint Francis Fort Wayne, IN
Lane College Jackson, TN Whittier College Whittier, CA
Linfield College McMinnville, OR Wilson Technical Community College Wilson, NC
Lynchburg College Lynchburg, VA Young Harris College Young Harris, GA
Section II
Survey Findings, Analysis & Exemplary Schools (cont.)
1. Management
Exemplary Schools for Employing Environmental and Sustainability Personnel and Offering an Orientation or Publication (Q4A, Q6)
School Location School Location
California State Polytechnic University San Luis Obispo, CA Santa Rosa Junior College Santa Rosa, CA
Clarkson University Potsdam, NY Southern Connecticut State University New Haven, CT
Cogswell Polytechnical College Sunnyvale, CA State University of New York Stony Brook, NY
College of the Atlantic Bar Harbor, ME Texas A & M University Galveston, TX
Dakota County Technical College Rosemount, MN University of California La Jolla, CA
Elon University Elon, NC University of California Santa Barbara, CA
Furman University Greenville, SC University of Colorado Boulder, CO
Georgia Institute of Technology Atlanta, GA University of Massachusetts Boston, MA
Hartwick College Oneonta, NY University of Michigan Ann Arbor, MI
Massachusetts Maritime Academy Buzzards Bay, MA University of Montana Missoula, MT
Michigan State University East Lansing, MI University of Wisconsin Oshkosh, WI
North Lake College Irving, TX Willamette University Salem, OR
Pacific University Forest Grove, OR Winona State University Winona, MN
Rutgers State University of New Jersey Camden, NJ
There is another group of colleges and universities that do not currently set and review goals for environmental sustainability or stewardship, but are especially committed to doing more to develop written policies, goals or standards. These schools tend to be smaller schools and two-year schools, and are located throughout the United States.
Colleges and Universities that Lead in Hiring Personnel and Orientations
Although most schools have made some efforts toward hiring personnel who deal with environmental issues, there is an elite group that has been particularly active in this area. These colleges and universities all have a staff person or administrator who leads sustainability issues; an environmental/sustainability task force, committee or council; a recycling coordinator or manager; an energy conservation coordinator or manager; and a green purchasing coordinator or manager. They also offer an orientation or publication about campus-focused sustainability or environmental programs to students, faculty and staff. These schools tend to be four-year schools, with slightly more private than public schools. They are located throughout the United States, with schools from the East and West well represented

23CAMPUS ENVIRONMENT 2008
Section II
Survey Findings, Analysis & Exemplary Schools (cont.)
1. Management
University of Colorado at Boulder
The University of Colorado at Boulder (CU) has been staffing campus
sustainability for nearly 40 years. Beginning in 1970 with creation of the
Environmental Center, CU has gradually been adding sustainability-focused
staff campus-wide. To advise and guide campus activities, CU’s chancellor
recently formed a high-level sustainability council (all vice chancellors) to help
steer and coordinate all energy, environment and sustainability initiatives,
including education and research-related functions.
The Environmental Center currently has eight full-time professional staff and
over 100 students part-time to operate programs on campus recycling, energy
conservation, alternative transportation, environmental justice and earth
education. Elsewhere on campus, the Facilities Management division employs
a Conservation Resource Officer charged with saving energy and water, and a
Sustainability Director who oversees recycling, Integrated Pest Management
(IPM) and other operations areas. CU’s student government employs two
students part-time as sustainability and environmental justice program liaisons,
and the Housing and Dining division has a recycling and sustainable foods
coordinator and works with residence hall advisors on sustainability-related
communication to assist with dorm conservation programs. The Environmental
Safety and Health office staffs all campus hazardous materials and regulatory
programs, and the Purchasing Department has a Director of Sustainable
Purchasing who manages green purchasing across three campuses.
Leading School for Employing Environmental and
Sustainability Personnel(See page 22 for other campuses recognized as exemplary in this category.)
Co
pyri
gh
t: C
asey
A. C
ass,
Un
ive
rsit
y o
f C
olo
rad
o a
t B
ou
lde
r
Recycling collection area
at Global Jam
Campus Profile

24NATIONAL WILDLIFE FEDERATION CAMPUS ECOLOGY
Key Findings4
Academic Commitment to Environment and Sustainability Wanes
Fewer of America’s colleges and universities are incorporating the
environment and sustainability issues into their curricula than in
2001. Just over half of colleges and universities now offer either an
undergraduate major or minor in environmental and sustainability
studies, down from two-thirds in 2001. However, nearly as many schools
now offer an interdisciplinary degree program as offer a major degree
and minor degree, which may account for at least some of the decline
in majors and minors. And while a large majority of campuses continue
to report that at least some of their undergraduates are exposed
to basic ecology and environmental sustainability, this number has
decreased since 2001. Relatively few schools offer a certificate or other
recognition in environmental or sustainability studies.
Requirements and Recruitment Programs Decline
Perhaps related to undergraduate exposure to environmental or
sustainability courses, campuses have also eased up on requiring
students to take courses on the environment or sustainability—just
one-quarter maintain this requirement compared with one-third in 2001.
And recruitment programs to attract students studying environmental
or sustainability issues have also dropped off somewhat.
Room for Growth Outside of Natural Sciences
A solid majority of colleges and universities offer undergraduate
courses on environmental issues in natural sciences departments,
and nearly half offer them in physical sciences departments. A large
minority of schools offer courses in the social sciences and humanities
departments, with less coverage in the health sciences, business,
engineering and teacher-education departments.
Faculty Environmental and Sustainability Research Declines
Support for faculty professional development has also declined since
2001. One-third of all campuses have programs to support faculty
professional development on environmental or sustainability topics,
down from half in 2001. Consistent with 2001, few schools evaluate
or recognize how faculty integrates environmental or sustainability
topics into their courses. And a small minority of schools continue to
have research institutes that study sustainability, climate change or
clean energy issues, though this is less prevalent now among four-year
schools.
Section II
Survey Findings, Analysis & Exemplary Schools
2. Academics
(4) Results in this section are based on the return of surveys from 667 colleges and universities, completed by a Chancellor, President, Vice President, Provost, Sustainability Director, Sustainability Coordinator, or a member of their staff. Results based on the full sample of respondents have a margin of error of plus or minus four percent.

25CAMPUS ENVIRONMENT 2008
Environment and Sustainability in the Curricula Declines Somewhat5
As the debate about climate change and possible consequences continues, campuses have implemented many different avenues for students to pursue studies on the environment and sustainability, including interdisciplinary degree programs, majors or minors and courses. Virtually all campuses in the United States continue to incorporate the environment and sustainability, at least in some way, into the academic curriculum. But this effort has declined since 2001, according to colleges and universities surveyed.
Recruiting Students
One of the ways colleges and universities can build their environmental and sustainability programs is to generate interest among potential college applicants year after year. However, only a minority of schools continue to have recruitment programs in place—and fewer schools are making this effort compared to 2001.
Only 19 percent of colleges and universities surveyed have a program to recruit students, down from 25 percent in 2001. Although four-year schools continue to be three times more likely to have a recruitment program in place compared to two-year schools (25% vs. 8%), most of the decline in recruitment programs has happened among four-year schools. Specifically, 25 percent of four-year schools now report having a recruitment program to attract students interested in studying environmental and sustainability issues compared with 33 percent in 2001.
Section II
Survey Findings, Analysis & Exemplary Schools (cont.)
2. Academics
Q14. Does your campus have a recruiting program to attract students interested in studying environmental and sustainability issues?
2008 2001
Total4-Year Degree
2-Year Degree
Total4-Year Degree
2-Year Degree
Yes 19% 25% 8% 25% 33% 10%
No 66% 59% 78% 66% 56% 84%
(5) The analysis and tables for each question are based on all respondents. The percentages in each table will not sum to 100% because the percentage of respondents who did not answer each question is not displayed in the tables, and in some cases the “No” responses have been omitted. For exact wording of questions and detailed findings, please refer to the Topline section of the report.

26NATIONAL WILDLIFE FEDERATION CAMPUS ECOLOGY
Ecology and Environmental Sustainability in the Classroom
Topics involving the environment and sustainability can reach students through a variety of course offerings across departments and disciplines. Though a large majority of campuses continue to report that at least some of their undergraduates are exposed to basic ecology and environmental sustainability issues, there has been a decrease since 2001.
Seven in 10 (69%) schools report that their undergraduate student body has taken at least one course addressing basic functions of the earth’s natural systems. And more than two in 10 (24%) report that more than half of their undergraduates have taken such a course before graduation.
On the downside, fewer campuses in 2008 than in 2001 (69% vs. 80%) report that their undergraduates have been exposed to at least one course addressing basic functions of the earth’s natural systems.
Courses on the connection between human activity and environmental sustainability continue to be slightly less prevalent, though a large majority of schools report at least some exposure among undergraduates prior to graduation. Seven in 10 (70%) colleges and universities report that their undergraduates have taken at least one course addressing issues or topics related to human activity and environmental sustainability, though less than two in 10 (16%) say more than half of their undergraduates have taken this type of course before graduation.
Again, fewer schools now than in 2001 (70% vs. 79%) report that undergraduates have taken at least one class addressing issues or topics related to human activity and environmental sustainability prior to graduation.
Section II
Survey Findings, Analysis & Exemplary Schools (cont.)
2. Academics
Q15A. By graduation, roughly what percentage of your total undergraduate student body has taken at least one course, regardless of department, addressing basic functions of the earth’s natural systems?
2008 2001
Total4-Year Degree
2-Year Degree
Total4-Year Degree
2-Year Degree
None 11% 8% 14% 8% 7% 9%
1% to 50% 45% 42% 53% 47% 44% 52%
51% to 100% 24% 29% 17% 33% 36% 28%
Q15B. By graduation, roughly what percentage of your total undergraduate student body has taken at least one course, regardless of department, addressing issues or topics related to human activity and environmental sustainability?
2008 2001
Total4-Year Degree
2-Year Degree
Total4-Year Degree
2-Year Degree
None 10% 7% 13% 9% 7% 11%
1% to 50% 54% 53% 58% 59% 58% 62%
51% to 100% 16% 17% 13% 20% 22% 16%

27CAMPUS ENVIRONMENT 2008
Leading School for Students Taking a Course on Ecology or Sustainability
(See page 35 for other campuses recognized as exemplary in this category.)
College of the Atlantic (Bar Harbor, ME)
College of the Atlantic offers only one major: Human Ecology. This means that whatever
else a student studies, course discussions include the broader picture of humanity’s
relationship with the natural, built and social environment. Beginning with the Human
Ecology Core Course for first-year students, it would be difficult to graduate without having
explored issues in ecology or sustainability, given courses like Environmental Chemistry,
Field Ecology, Food Systems, Economics of Environmental & Social Issues, Agroecology
of the Yucatan, Environmental Psychology, Hydro-policy in a Thirsty World, Poetry & the
American Environment, Shelter: Humans, Landscape & the Built Environment, Mountain
Poets of China and Japan, Evolution and Conservation, or Ecology and Literature of the
Sea. Even within courses focused on installation art, music composition, Kant, Wittgenstein
or puppetry, questions and ideas about the interconnectedness of the human and natural
world are sure to be raised.
Section II
Survey Findings, Analysis & Exemplary Schools (cont.)
2. Academics
Leading School for Students Taking a Course on
Ecology or Sustainability
(See page 35 for other campuses recognized as exemplary in this category.)
Georgia Institute of Technology (Atlanta)
In research, policy and practice, members of the Georgia Institute of Technology
community are recognized leaders in the field of sustainability, and their commitment is
reflected in many areas, including green cleaning, recycling, a sustainable food project
and landscaping. Georgia Tech uses environmentally friendly soaps, paper products, floor
finishes, garbage bags and towel dispensers, and it requires all vendors to provide only
green products. The Institute’s cleaning equipment uses 70 percent less water and 90
percent fewer chemicals than traditional equipment. Georgia Tech’s recycling initiative
received the 2008 American Forest & Paper Association College and University Recycling
Award for outstanding school, business and community recycling efforts.
A sustainable food initiative works with local family farms to provide campus dining
services with fresh, organic, locally produced vegetables, meats, dairy and bread. The
Landscape Master Plan dictates the use of drought-tolerant vegetation, reduction of
impervious surfaces, stormwater capture and landscape management practices that help
reduce CO2 and hydrocarbon emissions. In addition, an important university goal is for
every student to take at least one course focusing on sustainability. Georgia Tech offers
more than 100 courses with a sustainability emphasis, spanning all six colleges.
COA Faculty Member Helen Hess and students Genelle Harrison
and Henry Steinberg experience outdoor learning at COA’s
coastal campus.
Copyright: Toby Hollis, courtesy of College of the Atlantic.
Cell Phone Recycling Activity at Georgia Tech’s Earth Day Celebration
Copyright: Rob Felt, courtesy of Georgia Institute of Technology
Campus Profiles

28NATIONAL WILDLIFE FEDERATION CAMPUS ECOLOGY
Majors, Minors and Degree Programs
Many colleges and universities remain committed to environmental and sustainability studies by offering a major or minor for undergraduate students, though the percent has decreased since 2001. And though a sizeable minority of schools have plans to develop a major or minor, growth overall has declined since 2001.
A bare majority (53%) of colleges and universities now offer either a major or minor in environmental or sustainability studies, representing a decrease since 2001 (67%). Specifically, three in 10 colleges and universities offer undergraduates the opportunity to major (27%) or minor (26%) in environmental or sustainability studies. Among four-year colleges and universities, eight in 10 (78%) offer either an undergraduate major or minor in environmental studies—down from nine in 10 (89%) in 2001.
In addition to offering majors and minors in environmental or sustainability studies, many schools have incorporated environmental studies into the curriculum through interdisciplinary degree programs. Two in 10 colleges and universities (20%) offer an undergraduate interdisciplinary degree program in environmental or sustainability studies. Four-year schools (28%) are much more likely than two-year schools (6%) to offer these degree programs. One in 10 (9%) of the campuses say they have plans to develop one.
Few colleges and universities (9%) offer certificates or other recognition in environmental or sustainability studies. The majority of campuses (65%) do not offer certificates for such studies. And few (10%) have plans to develop such a program.
Section II
Survey Findings, Analysis & Exemplary Schools (cont.)
2. Academics
Q11. Does your campus offer an undergraduate …?
2008 2001
Total4-Year Degree
2-Year Degree
Total4-Year Degree
2-Year Degree
Major in environmental or sustainability studies
Yes 27% 38% 10% 35% 44% 17%
We have plans to develop one 8% 8% 9% 5% 5% 3%
Minor in environmental or sustainability studies
Yes 26% 40% 4% 32% 45% 7%
Have plans to develop one 7% 7% 7% 4% 5% 2%
Interdisciplinary degree program in environmental or sustainability studies
Yes 20% 28% 6% — — —
Have plans to develop one 9% 10% 8% — — —
Certificate or other recognition in environmental or sustainability studies
Yes 9% 7% 11% — — —
Have plans to develop one 10% 8% 14% — — —

29CAMPUS ENVIRONMENT 2008
Leading School for Having Recruiting Programs and Offering
Interdisciplinary Degrees in Environmental or Sustainability Studies
(See page 33 for other campuses recognized as exemplary in this category.)
Berry College (Mount Berry, GA)
The Environmental Sciences (ES) major at Berry College is an interdisciplinary program
for the study of the earth’s environment and human interactions with that environment.
All students in the program take courses that address environmental issues from
natural science, socio-cultural and economic perspectives. Each also chooses an area of
concentration in biology, chemistry, geoscience or public policy. A flexible combination of
courses allows ES majors a broad-spectrum curriculum that would be difficult to obtain in
more traditional science or social science programs.
At more than 26,000 acres, Berry features the world’s largest contiguous college campus.
This spectacular expanse contains vast tracts of forests, meadows, lakes and streams in
the southern Appalachian foothills of Northwest Georgia. Due to the geographical richness
of the campus, classes in environmental sciences and other programs take advantage
of a diverse ecosystem without having to leave campus. Since signing the American
College & University Presidents Climate Commitment in the summer 2007, Berry has been
gearing up students, faculty and staff to combat climate change. Their goal is to create a
clean, sustainable campus and to promote and foster environmental stewardship through
education, research, policies and actions.
Section II
Survey Findings, Analysis & Exemplary Schools (cont.)
2. Academics
Exemplary School for Offering Majors and Minors and Requiring
Environmental or Sustainability Courses
(See page 32 for other campuses recognized as exemplary in this category.)
Ball State University (Muncie, IN)
Ball State’s longtime commitment to environmental sustainability extends to many
academic programs. Undergraduate students with a passion for the environment can choose
majors such as Environmental Communication/Interpretation, Land Management, Natural
Resources, Park and Recreation Management, Aquatic Biology and Fisheries, Ecology and
Wildlife Biology. Minors include Environmental Management, International Management,
Energy and Environmental Policy, as well as the acclaimed clustered minors program in
Environmentally Sustainable Practices, which was the 2002 recipient of the Sustainable
Buildings Industry Council Best Practice Sustainability Award for Best Curriculum. Ball State
also has master’s programs in natural resources and environmental management, as well as
a master’s in biology with the option to focus on fisheries or wildlife.
Among the course options students can take to satisfy core curriculum requirements are
Geography of the Cultural Environment, Environment and Society, Oceans and Nations, and
International Natural Resources: Development and Conservation. Students get hands-on
experience at five natural areas totaling more than 300 acres, which are managed as part of
Ball State’s Field Station and Environmental Education Center.
Campus Profiles
30NATIONAL WILDLIFE FEDERATION CAMPUS ECOLOGY
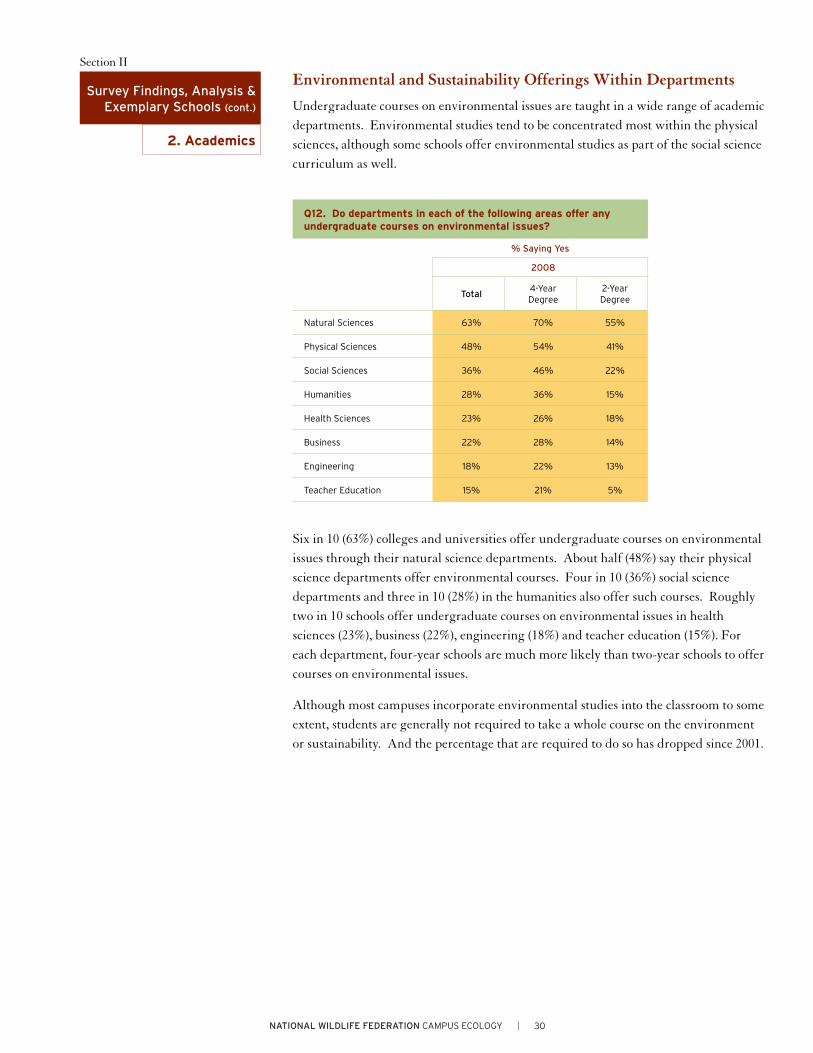
Environmental and Sustainability Offerings Within Departments
Undergraduate courses on environmental issues are taught in a wide range of academic departments. Environmental studies tend to be concentrated most within the physical sciences, although some schools offer environmental studies as part of the social science curriculum as well.
Six in 10 (63%) colleges and universities offer undergraduate courses on environmental issues through their natural science departments. About half (48%) say their physical science departments offer environmental courses. Four in 10 (36%) social science departments and three in 10 (28%) in the humanities also offer such courses. Roughly two in 10 schools offer undergraduate courses on environmental issues in health sciences (23%), business (22%), engineering (18%) and teacher education (15%). For each department, four-year schools are much more likely than two-year schools to offer courses on environmental issues.
Although most campuses incorporate environmental studies into the classroom to some extent, students are generally not required to take a whole course on the environment or sustainability. And the percentage that are required to do so has dropped since 2001.
Section II
Survey Findings, Analysis & Exemplary Schools (cont.)
2. Academics
Q12. Do departments in each of the following areas offer any undergraduate courses on environmental issues?
% Saying Yes
2008
Total4-Year Degree
2-Year Degree
Natural Sciences 63% 70% 55%
Physical Sciences 48% 54% 41%
Social Sciences 36% 46% 22%
Humanities 28% 36% 15%
Health Sciences 23% 26% 18%
Business 22% 28% 14%
Engineering 18% 22% 13%
Teacher Education 15% 21% 5%

31CAMPUS ENVIRONMENT 2008
Environmental and Sustainability Offerings Within Departments (cont.)
Relatively few (4%) schools surveyed explicitly require all students to take at least one course related to the environment and sustainability, half as many as compared with 2001 (8%). More broadly, one-quarter of schools (26%) require at least some students to take an environmental studies course, also down from 2001 (34%). Four-year colleges and universities (32%) are more likely than two-year ones (17%) to require at least some students to take an environmental or sustainability class.
Section II
Survey Findings, Analysis & Exemplary Schools (cont.)
2. Academics
Q13. We are interested in whether you have any campus-wide requirement that students take courses on environmental or sustainability topics or issues. Which of the following best describes your campus?
2008 2001
Total4-Year Degree
2-Year Degree
Total4-Year Degree
2-Year Degree
Campus-wide, all students are explicitly required to take at least one course related to the environment or sustainability
4% 4% 4% 8% 9% 5%
Most students are required 3% 3% 2% 5% 5% 4%
Some students are required 19% 25% 11% 21% 25% 14%
No students are required 59% 53% 71% 63% 55% 77%
Q16A. Does your campus...?
% Saying Yes
2008 2001
Total4-Year Degree
2-Year Degree
Total4-Year Degree
2-Year Degree
Have programs to support faculty professional development on environmental or sustainability topics
36% 38% 35% 50% 49% 54%
Formally evaluate/recognize how faculty have integrated environmental or sustainability topics into their courses
10% 12% 9% 8% 9% 5%
Providing Support and Professional Development for Faculty
There are two key ways for colleges and universities to promote environmental and sustainability studies—they can offer students the opportunity to take courses, and they can support faculty development. As noted, the opportunities for students to learn about environmental or sustainability issues has declined somewhat since 2001. The 2008 findings suggest that efforts to support or encourage faculty engagement through professional development and research have also faltered.
More than one-third (36%) of colleges and universities still have programs to support faculty professional development on environmental or sustainability topics, but this is down from half (50%) in 2001. This decrease since 2001 occurred among both four-year schools (38% vs. 49%) and two-year schools (35% vs. 54%).
A small minority of schools continue to support professors who bring the environment and sustainability issues into the classroom. Consistent with 2001, one in 10 (12%) colleges and universities continue to formally evaluate or recognize how the faculty has integrated environmental or sustainability topics into their courses. This support is similar for four-year and two-year schools.

32NATIONAL WILDLIFE FEDERATION CAMPUS ECOLOGY
Section II
Survey Findings, Analysis & Exemplary Schools (cont.)
2. Academics
Providing Support and Professional Development for Faculty (cont.)
The number of schools that offer research institutes focused on the environment and sustainability has held steady overall since 2001 but declined somewhat among four-year schools. Two in 10 (19%) colleges and universities surveyed have research institutes that study sustainability, climate change or clean energy issues. This finding is not significantly different from 2001 (23%) by statistical standards.
Consistent with 2001, four-year colleges and universities (26%) are far more likely than two-year ones (7%) to have research institutes. But the number of four-year schools with research institutes has declined since 2001, according to the colleges and universities surveyed. With perhaps fewer resources at their disposal, four-year schools are now less likely than in 2001 to have environmental or sustainability research institutes (26% vs. 32%)
Q17. Does your campus house any research institutes that study sustainability, climate change or clean energy issues?
2008 2001
Total4-Year Degree
2-Year Degree
Total4-Year Degree
2-Year Degree
Yes 19% 26% 7% 23% 32% 6%
No 67% 59% 80% 71% 61% 89%
Colleges and Universities that Lead in Implementing Environmental and Sustainability Studies
A good portion of colleges and universities offer majors or minors in environmental studies, and a solid number of schools require at least some students to take courses on the environment. But some schools stand apart in their dedication to bring environmental and sustainability studies to the classroom. These exemplary campuses offer undergraduates the option of both an environmental studies major and minor. Moreover, they require all or most students to take at least one course related to the environment or sustainability. These schools are fairly divided between private and public schools, and are spread out across the country, though most are four-year institutions.
Exemplary Schools for Offering Majors and Minors and Requiring Environmental or Sustainability Courses (Q11a, Q11b, Q13)
School Location School Location
Arizona State University Tempe, AZ Ohio University Southern Campus Ironton, OH
Ball State University Muncie, IN Oregon State University Corvallis, OR
Bemidji State University Bemidji, MN Robert Morris University Moon Township, PA
Bucknell University Lewisburg, PA St. Cloud State University Saint Cloud, MN
Eckerd College Saint Petersburg, FL University of Memphis Memphis, TN
Florida Gulf Coast University Fort Myers, FL University of Northern Iowa Cedar Falls, IA
Hocking Technical College Nelsonville, OH University of Saint Francis Fort Wayne, IN
Massachusetts Maritime Academy Buzzards Bay, MA University of Southern Maine Portland, ME

33CAMPUS ENVIRONMENT 2008
Section II
Survey Findings, Analysis & Exemplary Schools (cont.)
2. Academics
Colleges and Universities that Lead in Implementing Environmental and Sustainability Studies
Other schools are noteworthy for having both recruiting programs for students and for offering interdisciplinary degree programs in environmental or sustainability studies. This list of exemplary schools contains a mixture of public and private schools from across the United States, though most are four-year schools.
Leading Schools for Having Recruiting Programs and Offering
Interdisciplinary Degrees in Environmental or Sustainability Studies
(See pages 33—34 for other campuses recognized as exemplary in this category.)
Colorado College (Colorado Springs)
Given its proximity to the Rockies and unique curricular calendar, Colorado College draws
intellectually adventurous students seeking to enhance their connection with nature. In its
marketing literature, the college promotes its natural environment and strong “sense of
place” along with its challenging academic program. Prospective students see a beautiful
campus with a commitment to sustainability as evidenced by xeriscape gardens, LEED
certification for two new buildings, an urban garden, a food service committed to local
products, and composting systems initiated through a National Wildlife Federation grant.
In 2008, Colorado College installed its first on-campus solar project and plans to achieve
carbon neutrality within five years.
The college has a block plan calendar in which students take one class at a time for 3-1/2
weeks, eight times a year. The Environmental Program requires students to study real-world
environmental issues related primarily to the campus community, local community and the
Southwest region. Since 2000, the Environmental Program shifted from one grounded in the
disciplines to an interdisciplinary approach rare among liberal arts colleges. It offers a new
major in Environmental Policy and Economics, as well as established majors in Environmental
Science, Environmental Physics and Environmental Chemistry. The college also offers a
minor in Environmental Issues and a “design your own” major for those wishing to build
connections across several areas, such as green architecture, hydrology and climate change.
A 95 percent graduation rate indicates the appeal and success of this curriculum.
Exemplary Schools for Having Recruiting Programs and Offering Interdisciplinary Degrees in Environmental or Sustainability Studies (Q11c, Q14)
School Location
Adelphi University Garden City, NY
Alfred University Alfred, NY
Arizona State University Tempe, AZ
Augsburg College Minneapolis, MN
Berry College Mount Berry, GA
Burlington County College Pemberton, NJ
California State University, Channel Islands Camarillo, CA
Catawba College Salisbury, NC
Cedar Valley College Lancaster, TX
Clarkson University Potsdam, NY
College of Saint Benedict Saint Joseph, MN
Colorado College student David Amster-Olszewski poses
with the first on-campus solar project, a project he helped spearhead.
Copyright: Jackson Solway, courtesy of Colorado College
Campus Profile

34NATIONAL WILDLIFE FEDERATION CAMPUS ECOLOGY
Section II
Survey Findings, Analysis & Exemplary Schools (cont.)
2. Academics
Colleges and Universities that Lead in Implementing Environmental and Sustainability Studies (cont.)
Exemplary Schools for Having Recruiting Programs and Offering Interdisciplinary Degrees in Environmental or Sustainability Studies (Q11c, Q14) (CONTINUED)
School Location School Location
Colorado College Colorado Springs, CO Prescott College Prescott, AZ
Columbus State Community College Columbus, OH Richard Stockton College Pomona, NJ
Delaware Valley College Doylestown, PA Ripon College Ripon, WI
Duke University Durham, NC Salt Lake Community College Salt Lake City, UT
Eastern Illinois University Charleston, IL Santa Rosa Junior College Santa Rosa, CA
Eckerd College Saint Petersburg, FL Spelman College Atlanta, GA
Elon University Elon, NC State University of New York Stony Brook, NY
Emory University Atlanta, GA State University of New York Cortland, NY
Ferrum College Ferrum, VA State University of New York Potsdam, NY
Fort Valley State University Fort Valley, GA State University of New York College of Technology
Delhi, NY
Furman University Greenville, SC Sterling College Craftsbury Common, VT
Georgia Institute of Technology Atlanta, GA Tufts University Medford, MA
Goddard College Plainfield, VT University of Arizona Tucson, AZ
Idaho State University Pocatello, ID University of California La Jolla, CA
Kennesaw State University Kennesaw, GA University of California Los Angeles, CA
Lehigh University Bethlehem, PA University of Colorado Boulder, CO
Lipscomb University Nashville, TN University of Illinois Springfield, IL
Manhattanville College Purchase, NY University of New Hampshire Durham, NH
Methodist University Fayetteville, NC University of San Francisco San Francisco, CA
Michigan State University East Lansing, MI University of South Carolina Columbia, SC
Middlebury College Middlebury, VT University of Vermont Burlington, VT
Montreat College Montreat, NC University of Wisconsin Green Bay, WI
Niagara University Niagara University, NY Utah State University Logan, UT
NorthWest Arkansas Community College Bentonville, AR Vermont Technical College Randolph Center, VT
Oberlin College Oberlin, OH Warren Wilson College Asheville, NC
Palm Beach Atlantic University West Palm Beach, FL Whitman College Walla Walla, WA
Paul Smith’s College of Arts and Sciences Paul Smiths, NY Willamette University Salem, OR

35CAMPUS ENVIRONMENT 2008
Section II
Survey Findings, Analysis & Exemplary Schools (cont.)
2. Academics
Colleges and Universities that Lead in Implementing Environmental and Sustainability Studies (cont.)
A select group of colleges and universities stand apart for having most of their students exposed to environmental studies or sustainability at some point before they graduate. At these exemplary schools, more than 75 percent of undergraduates have taken at least one course addressing basic functions of the earth’s natural systems and at least one course on issues or topics related to human activity and environmental sustainability before graduation. The majority of schools listed below are private schools, but are fairly evenly divided between four-year and two-year schools and are located throughout the country.
Exemplary Schools for Students Taking a Course on Ecology or Sustainability (Q15)
School Location
Chattahoochee Valley Community College Phenix City, AL
College of Menominee Nation Keshena, WI
College of the Atlantic Bar Harbor, ME
Frank Lloyd Wright School of Architecture Scottsdale, AZ
Franklin College of Indiana Franklin, IN
Georgia Institute of Technology Atlanta, GA
Grayson County College Denison, TX
Jefferson Davis Community College Brewton, AL
Life Chiropractic College West Hayward, CA
New School of Architecture and Design San Diego, CA
Rochester College Rochester Hills, MI
Southern Adventist University Collegedale, TN
Southwestern College of Business Cincinnati, OH
State University of New York College of Environmental Science & Forestry
Syracuse, NY
Sterling College Craftsbury Common, VT
University of Hawaii Windward Community College Kaneohe, HI
University of Montana Missoula, MT
University of Northern Iowa Cedar Falls, IA
University of Wisconsin Eau Claire, WI
University of Wisconsin Madison, WI
Watkins College of Art & Design and Watkins Film School Nashville, TN
Whittier College Whittier, CA

36NATIONAL WILDLIFE FEDERATION CAMPUS ECOLOGY
Section II
Survey Findings, Analysis & Exemplary Schools (cont.)
2. Academics
Colleges and Universities that Make the Environment and Sustainability Part of the Faculty Experience
Although most schools do not evaluate faculty based on how they have brought the environment into the classroom, there is a group of exemplary schools that have taken this step towards promoting environmental studies. These schools not only have programs to support faculty professional development on environmental topics, but also formally evaluate or recognize how faculty have integrated environmental topics into their courses and hold campus units accountable for environmental performance through incentives and/or penalties. These colleges and universities tend to be four-year schools and public schools but are located throughout the nation.
Leading School for Supporting and Evaluating Faculty on
Environmental or Sustainability Studies
(See above, page 36 for other campuses recognized as exemplary in this category.)
Missouri State University (Springfield)
At Missouri State University (MSU), the entire campus focuses each year on a public affairs
“theme”—and the topic for 2008—2009 is sustainability. Theme-year events and discussions
will culminate in a three-day conference in April 2009 that will bring environmental, economic
and social sustainability experts from across the United States and around the world to the
MSU campus to discuss sustainability in an open forum. As in past years, the conference will be
structured as a series of dialogues among MSU faculty, students, staff, K–12 students and the
general public, and it will promote a call to action locally, regionally, nationally and globally.
A series of workshops that deal with incorporating sustainability into the curriculum will be held
prior to the public affairs conference. MSU will bring in experts from within the university and
elsewhere to develop an understanding of how its current curriculum addresses sustainability.
Faculty who already incorporate sustainability explicitly in their courses will work with faculty
who are new to the topic or are looking for ideas on ways to incorporate it into their own
classes. In addition, sustainability is being developed as the cornerstone principle for a course
that all freshmen will be required to complete.
Exemplary Schools for Supporting and Evaluating Faculty on Environmental or Sustainability Studies and Holding Campus Units Accountable (Q16)
School Location School Location
Bastyr University Kenmore, WA Missouri State University Springfield, MO
City University of New York Brooklyn College
Brooklyn, NY North Lake College Irving, TX
College of the Atlantic Bar Harbor, ME Robeson Community College Lumberton, NC
Dakota County Technical College Rosemount, MN Rutgers State University of New Jersey Newark, NJ
Emory University Atlanta, GA University of Virginia Charlottesville, VA
Georgia Institute of Technology Atlanta, GA Willamette University Salem, OR
Massachusetts Bay Community College Wellesley, MA
Campus Profile

37CAMPUS ENVIRONMENT 2008
Key Findings6
Campuses Remain Committed To Energy Efficiency—A Big
Push for the Future
Colleges and universities across the nation continue to make concerted
efforts to improve energy efficiency and are solidly behind doing more.
Large majorities of schools report making lighting, water and HVAC
upgrades—consistent with 2001—as well as Information Technology (IT)
energy upgrades. Solid majorities have implemented efficiency design
standards, Leadership in Energy and Environmental Design (LEED)
certification and life-cycle analysis for buildings and retrofits. More
than one-quarter of colleges and universities surveyed (indicating an
estimated 1,000 schools nation-wide) have adopted formal plans for
reducing greenhouse gas emissions. Schools have also increased their
use of renewable energy sources as well as generation and cogeneration
efforts to meet their energy demands. And more than one-third have
plans to do more with renewable energy, a substantial increase since
2001. These commitments are perhaps particularly important as overall
campus square footage of heated or cooled space—as well as building
square footage overall—has increased somewhat.
Transportation Programs Have Stalled, but Alternative
Energy Use Increases
Campus transportation continues to be a relatively low-performing
area with perhaps great opportunity. Colleges and universities have
maintained their commitment to provide adequate and protected
bicycle racks, but despite some improvement, they continue to fall short
in providing free or discounted bus or transit passes for the campus
population, creating carpooling or vanpooling programs and providing
incentives to not drive alone. Finding alternatives to commuting alone
could reduce the carbon footprint of a number of schools, as the
majority of schools report that the majority of faculty and staff and a
large minority of students drive alone to campus. On a positive note,
while roughly one-third of schools are planning to increase the number
of parking spaces on campus, roughly the same number of schools
is either planning to maintain or decrease their parking. Moreover, a
notable minority of campuses currently use alternatives to fossil fuels,
and the number of schools using alternative fuels or energy for fleet
vehicles has doubled since 2001.
(6) Results in this section are based on the return of surveys from 570 colleges and universities, completed by a Vice President of Administration, Provost, Chief of Facilities or Plant Operations, Sustainability Director, Sustainability Coordinator or a staff member from one of these offices. Results based on the full sample of respondents have a margin of error of plus or minus four percent.
Section II
Survey Findings, Analysis & Exemplary Schools
3. Operations
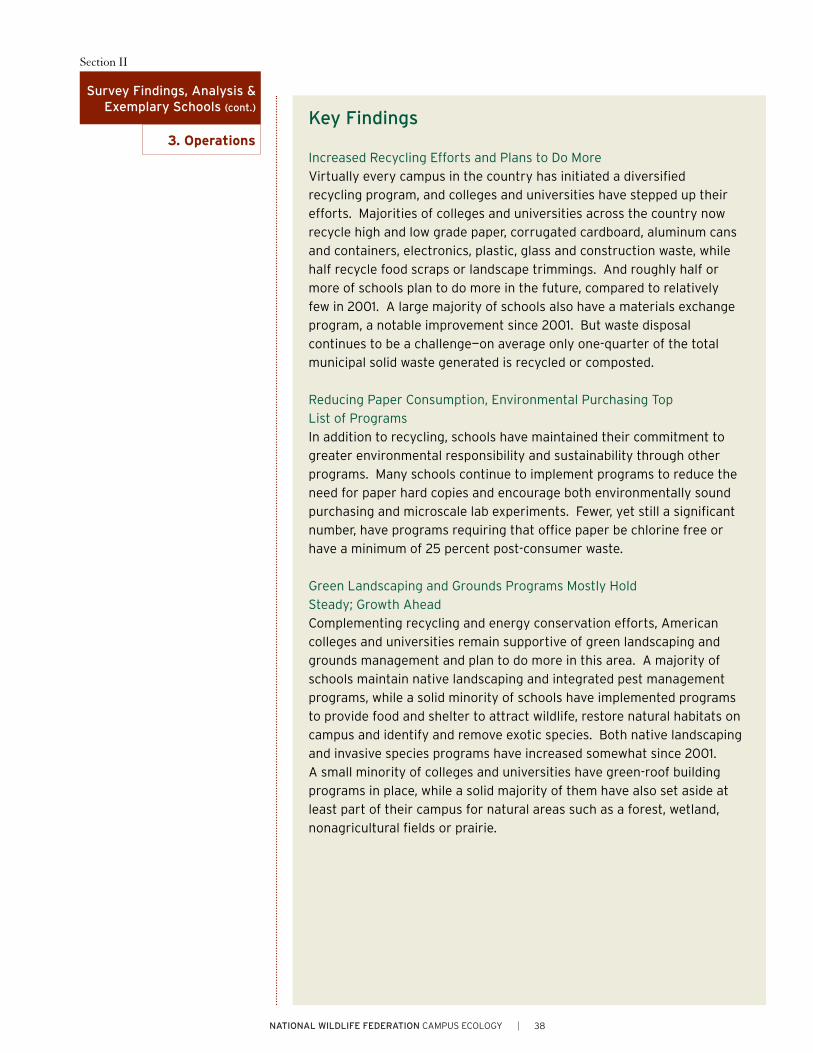
38NATIONAL WILDLIFE FEDERATION CAMPUS ECOLOGY
Key Findings
Increased Recycling Efforts and Plans to Do More
Virtually every campus in the country has initiated a diversified
recycling program, and colleges and universities have stepped up their
efforts. Majorities of colleges and universities across the country now
recycle high and low grade paper, corrugated cardboard, aluminum cans
and containers, electronics, plastic, glass and construction waste, while
half recycle food scraps or landscape trimmings. And roughly half or
more of schools plan to do more in the future, compared to relatively
few in 2001. A large majority of schools also have a materials exchange
program, a notable improvement since 2001. But waste disposal
continues to be a challenge—on average only one-quarter of the total
municipal solid waste generated is recycled or composted.
Reducing Paper Consumption, Environmental Purchasing Top
List of Programs
In addition to recycling, schools have maintained their commitment to
greater environmental responsibility and sustainability through other
programs. Many schools continue to implement programs to reduce the
need for paper hard copies and encourage both environmentally sound
purchasing and microscale lab experiments. Fewer, yet still a significant
number, have programs requiring that office paper be chlorine free or
have a minimum of 25 percent post-consumer waste.
Green Landscaping and Grounds Programs Mostly Hold
Steady; Growth Ahead
Complementing recycling and energy conservation efforts, American
colleges and universities remain supportive of green landscaping and
grounds management and plan to do more in this area. A majority of
schools maintain native landscaping and integrated pest management
programs, while a solid minority of schools have implemented programs
to provide food and shelter to attract wildlife, restore natural habitats on
campus and identify and remove exotic species. Both native landscaping
and invasive species programs have increased somewhat since 2001.
A small minority of colleges and universities have green-roof building
programs in place, while a solid majority of them have also set aside at
least part of their campus for natural areas such as a forest, wetland,
nonagricultural fields or prairie.
Section II
Survey Findings, Analysis & Exemplary Schools (cont.)
3. Operations

39CAMPUS ENVIRONMENT 2008
Energy and Utilities7
Energy Efficiency UpgradesLarge majorities of American colleges and universities continue to make energy and utility upgrades. But schools are more committed now than in 2001 to making upgrades campus-wide. Lighting upgrades once again top the list of energy and utilities efficiency programs implemented on campuses, followed by water, HVAC, and information technology (IT). Perhaps taking advantage of the long-term cost benefits, a solid majority of schools plan to do more in the future.
The vast majority (81%) of colleges and universities have implemented lighting efficiency upgrades in all or some campus units. Three-fourths have carried out water efficiency upgrades (76%). Accounting for substantial energy demand for schools, three-fourths also say they have implemented HVAC upgrades (73%). Although the findings in all three of these areas are similar to 2001 in terms of implementing upgrades in at least some campus units, schools now appear more likely to be taking a comprehensive approach to efficiency improvements. Specifically, schools in 2008 are more likely than in 2001 to implement upgrades campus-wide for lighting efficiency (51% vs. 34%), water efficiency (37% vs. 22%) and HVAC (32% vs. 20%).
Section II
Survey Findings, Analysis & Exemplary Schools (cont.)
3. Operations
(7) The analysis and tables for each question are based on all respondents. The percentages in each table will not sum to 100% because the percentage of respondents who did not answer each question is not displayed in the tables, and in some cases the “No” responses have been omitted. For exact wording of questions and detailed findings, please refer to the Topline section of the report. (8) Lighting efficiency upgrades: light fixtures, occupancy sensors, daylight sensors.Water efficiency upgrades: toilets, showerheads, faucets, recirculating fountains and chilled water.Heating, ventilation and air conditioning upgrades: thermal insulation of buildings, downsizing of fans and pumps, occupancy or CO2 sensors, variable-air-volume ventilation, air-side economizers, direct digital controls, thermostat setbacks, capturing waste heat.Information technology (IT) energy load reductions: efficient server systems and Energy Star-labeled computer equipment.The findings for 2001 regarding plans to do more are not shown due to differences in question wording in the 2008 survey and 2001 survey.
Q29A/B. Has your campus implemented …?
20088 2001
Lighting efficiency upgrades
Yes, campus-wide 51% 34%
Yes, in some campus units 30% 47%
Have plans to do more 74% 21%
Water efficiency upgrades
Yes, campus-wide 37% 22%
Yes, in some campus units 39% 51%
Have plans to do more 72% 19%
Heating, ventilation, air conditioning (HVAC) upgrades
Yes, campus-wide 32% 20%
Yes, in some campus units 41% 53%
Have plans to do more 73% 25%
IT energy load reductions
Yes, campus-wide 30% —
Yes, in some campus units 36% —
Have plans to do more 67% —

40NATIONAL WILDLIFE FEDERATION CAMPUS ECOLOGY
Leading School for Energy Efficiency and Conservation
(See page 59 for other campuses recognized as exemplary in this category.)
St. Olaf College (Northfield, MN)
A new building at St. Olaf showcases its commitment to energy
conservation and sustainability. Regents Hall of Natural and Mathematical
Sciences is a comprehensive teaching and research facility that is on
track to be confirmed as a LEED Platinum-rated project in fall 2008. The
building site takes advantage of scenic views while harvesting daylight for
the interior. Its roof features a rain collection system that provides water
for the greenhouse, a combination of planted green and highly reflective
surfaces that cut heating and cooling demand, and a stormwater system
that manages runoff from the building into the surrounding area. Electrical
needs for the 200,000 square foot facility are met by St. Olaf’s 1.65-
megawatt wind turbine (which generates 1/3 of overall campus electricity).
Academic programs within the building also incorporate environmental
stewardship practices. The chemistry curriculum has adopted green lab
methods, with experiments based primarily on water-based reactions. In
addition to cutting lab waste, “green” chemistry reduces the need for high
turnover rates of conditioned air. Campus-wide, the college has adopted
sustainable design guidelines for all new projects, which will result in
measurably lower operating costs and environmental impact.
Section II
Survey Findings, Analysis & Exemplary Schools (cont.)
3. Operations
Energy Efficiency Upgrades (cont.)With computing power and data storage playing a vital role for many higher education institutions, two-thirds (66%) of schools have implemented IT energy load reductions in all or some campus units.
Though there remains some room for improvement in energy and utilities upgrades, American colleges and universities appear up to the task. Seven in 10 or more schools say they have plans to do more upgrades in the future for lighting efficiency (74%), water efficiency (72%), HVAC (73%) and IT energy reductions (67%).
Small schools (enrollment less than 1,000) are less likely than larger schools to have implemented IT energy upgrades, while schools in the East are less likely than those in the Midwest, South and West to have done so.
St. Olaf’s new Regents Hall of Natural and Mathematical
Sciences, a comprehensive teaching and research facility, is
seeking LEED Platinum.
Copyright: David Gonnerman, St. Olaf College
Campus Profile

41CAMPUS ENVIRONMENT 2008
Section II
Survey Findings, Analysis & Exemplary Schools (cont.)
3. Operations
Building Efficiency Standards and Greenhouse Gas EmissionsA majority of colleges and universities have implemented a variety of efficiency standards for new buildings or retrofits but are less likely to have adopted formal plans for reducing greenhouse gas emissions, though solid majorities plan to do more in the future.
Q30A/B. Has your campus implemented any …?
2008
Efficiency standards for new buildings or retrofits of existing buildings
Yes, campus-wide 31%
Yes, in some campus units 31%
Have plans to do more 68%
Life-cycle analysis for new buildings or retrofit projects
Yes, campus-wide 21%
Yes, in some campus units 28%
Have plans to do more 58%
LEED certification for new buildings or retrofits of existing buildings
Yes, campus-wide 12%
Yes, in some campus units 23%
Have plans to do more 58%
Formal plans for reducing emissions of CO2 and other greenhouse gases
Yes, campus-wide 12%
Yes, in some campus units 15%
Have plans to do more 49%
Six in 10 (62%) colleges and universities have implemented efficiency standards for new buildings or retrofits of existing buildings, while seven in 10 (68%) plan to do more in this area. Nearly half of all campuses (49%) have implemented life-cycle analysis for new building or retrofit projects, with well over half (58%) planning to do more in the future.
Fewer schools have adopted Leadership in Energy and Environmental Design (LEED) certification standards and formal emission reductions plans. One-third (35%) have implemented LEED certification for new buildings or retrofits of existing buildings, though a solid majority (58%) of schools have plans to do more in the future.
As support for comprehensive climate initiatives such as the Presidents Climate Commitment have increased year by year, one-quarter (27%) of colleges and universities now report that they have implemented formal plans for reducing emissions of CO2 and other greenhouse gases. Nearly half (49%) of campuses plan to do more on reducing emissions.

42NATIONAL WILDLIFE FEDERATION CAMPUS ECOLOGY
Section II
Survey Findings, Analysis & Exemplary Schools (cont.)
3. Operations
Building Efficiency Standards and Greenhouse Gas Emissions (cont.) Although there is some variation, smaller schools (enrollment less than 1,000) are less likely than larger schools and private schools are less likely than public schools to have implemented plans in all four areas. Region matters to some degree—schools in the East are less likely than schools in other regions to have implemented efficiency standards for new buildings or retrofits of existing buildings, while schools in the West stand out for being more likely to implement life-cycle analysis and LEED certification.
As reported in the Management section of this report, more than one-third (35%) of colleges and universities report that they regularly set and review goals for reducing emissions of CO2 and other greenhouse gases. Overall, it appears that many schools have integrated these goals into their operational planning, with 27 percent reporting formal plans for reducing emissions of CO2 and other greenhouse gases.
Another strategy for increasing building efficiency—and thereby reducing a campus’s environmental impact—is to closely monitor energy consumption on a building-by-building basis through the use of utility sub-meters.
A majority (56%) of colleges and universities report that they have sub-meters or individual building meters at least to some extent to track energy consumption by building, including two in 10 (20%) who say more than 75 percent of their buildings are sub-metered.
In addition to the one-quarter of schools that have formally adopted plans to reduce greenhouse gas emissions, nearly half have taken action to address the issue to some degree since the 2001 survey. Specifically, 45 percent of schools report that their campus has implemented a significant new program to curb CO2 and other greenhouse gases emissions since 2001, while 10 percent say they have not.
One specific approach some campuses take to offset their carbon footprint from campus operations is to purchase carbon credits or renewable energy certificates (RECs). One school in 10 says it purchases carbon credits or renewable certificates all of the time (2%) or sometimes (6%) to offset campus greenhouse gas emissions from campus operations and activities such as commuting, business travel, conferences and other goods and services. The majority (61%) of schools have never purchased credits or certificates.
Q35. About what percentage of your buildings on campus have sub-meters or individual building meters to track energy consumption (electricity or heat) by building?
2008
None 12%
1% to 25% 18%
26% to 50% 9%
51% to 75% 9%
76% to 100% 20%
Q26. Since 2001, the year of the last survey, has your campus implemented any significant new programs to curb CO2 and other greenhouse gas emissions?
2008
Yes 45%
No 10%
Q44. How often does your campus purchase carbon credits or renewable energy certificates (RECs) to offset campus greenhouse gas emissions (emissions resulting directly from campus operations, as well as indirectly from activities such as commuting, business travel, conferences and other goods and services)?
2008
All of the time 2%
Sometimes 6%
Never 61%

43CAMPUS ENVIRONMENT 2008
Section II
Survey Findings, Analysis & Exemplary Schools (cont.)
3. Operations
Electricity Generated and Alternative Energy SourcesThe number of colleges and universities that generate or cogenerate at least some of their own electricity has doubled since the 2001 survey, though most report not generating any electricity at all.
A total of 13 percent of colleges and universities report generating or cogenerating at least some electricity in 2006—twice as many as reported in the 2001 survey (6%). And a small but notable number of schools are producing a significant amount of energy—fully 6 percent of schools report generating or cogenerating up to 1,000 megawatts (MWHs) of electricity in 2006, up from just 2 percent as reported in 2001.9
Over half (52%) of schools did not generate or cogenerate any electricity, an increase from 42 percent in 2001. The likely reason for both an increase and decrease in this area is that more schools provided data for the 2008 survey—just one-third (37%) of colleges and universities did not respond to the electricity generation question compared to over half (53%) in 2001.
Fossil fuels are the most common energy source used for on-campus generation, but a noteworthy number of schools are utilizing solar, wind, biomass and other forms of clean energy to meet their energy demands. In total, 12 percent of schools report using at least some form of clean energy to some extent for on-campus generation.
Fossil Fuels A total of 31 percent of schools report that at least some of the electricity generated on campus comes from fossil fuels, such as coal, natural gas, or fuel oil. Most of these schools (27%) report that more than 90 percent of the total amount of electricity generated comes from fossil fuels.
Solar Electricity A total of 12 percent of schools report that at least some of the electricity generated on campus comes from solar electricity (photovoltaic)—10 percent say that 1–10 percent of their total generation comes from solar, while 2 percent say more than 90 percent comes from solar electricity.
Wind A total of 5 percent of schools report at least some of the electricity generated on campus comes from wind energy, with most schools reporting 1–10 percent (2%).
Biomass A total of 2 percent of schools report at least some of the electricity generated on campus comes from biomass energy, with nearly all of this in the 1–10 percent (2%) range.
Other Clean Sources A total of 5 percent of schools report at least some of the electricity generated on campus comes from other clean sources, such as landfill gas or fuel cells. Most of this generation is in the 1 to 10 percent range (3% of schools); of the remaining schools reporting, 1 percent generate 11 to 20 percent of their electricity from clean energy sources, and another 1 percent generate more than 90 percent from clean sources.
Q34. Thinking about the electricity your campus generated or cogenerated in 2006, about how many megawatt hours (MWHs) of electricity did you generate?
2008 2001
None 51% 42%
Less than 10 MWHs 3% 1%
10 to less than 100 1% —
100 to less than 1,000 2% 1%
1,000 to less than 5,000 1% 1%
5,000 to less than 10,000 1% 1%
10,000 to less than 25,000 1% —
25,000 to less than 50,000 1% —
50,000 to less than 100,000 1% 0.2%
More than 100,000 2% 2%
*Figures for the 2001 survey are based on 1999
(9) Responses for this question have been converted from kilowatt hours to megawatt hours.

44NATIONAL WILDLIFE FEDERATION CAMPUS ECOLOGY
Electricity Generated and Alternative Energy Sources (cont.)Colleges and universities were also asked about cogeneration for heat and electricity from other sources. A total of 9 percent of schools report using at least some cogenerated heat and electricity (combined heat and power, or CHP) produced by renewables or lower-carbon fuels other than coal. These schools report a wide range of cogeneration use, from 1–10 percent (2% of campuses) to more than 90 percent (3% of campuses).
On-site energy sources for heating and cooling is another option campuses pursue to reduce fossil fuel consumption. A total of 14 percent of schools report using at least some energy from on-site ground-source (geothermal) heat pumps, direct-heat geothermal, solar, biomass, landfill gas, aquifer or lake-source thermal systems for their on-campus heating and cooling energy demands. The majority of these campuses (9% of all schools reporting) say that 1–10 percent of their on-campus heating and cooling is met by these energy sources, while others report 11–20 percent (2%) and 21–30 percent (1%).
Taken together, a total of 21 percent of schools report using either on-campus clean sources for heating and cooling or on-campus co-generated heat and electricity. And a large minority of colleges and universities plan to rely on renewable sources in the future to meet their energy demand. More than one-third (36%) of schools say they have plans to do more to meet their campus’s electricity, heating and cooling demand with on-campus renewable sources. This represents a nearly four-fold increase since 2001 (10%).
Section II
Survey Findings, Analysis & Exemplary Schools (cont.)
3. Operations
Q27D. Do you have plans to do more as far as meeting your campus’s electricity, heating and cooling demand by using on-campus renewable sources?
2008 2001
Yes 36% 10%
Q28. Roughly what percentage of your campus’s total electricity demand is met by off-campus renewable energy sources, including purchasing RECs?
2008 2001
0% 46% 63%
1% - 10% 17% 11%
11% - 20% 5% 3%
21% - 30% 1% 2%
31% - 40% 1% 2%
41% - 50% — 1%
51% - 60% 1% —
61% - 70% — 1%
71% - 80% — 1%
81% - 90% — 1%
91% - 100% 6% 1%
Note: Figures for 2001 include both on-campus and off-campus sources
Renewable Energy SourcesAlthough not used as often as building efficiency standards and improvements, some schools are purchasing RECs or using off-campus renewable energy sources, such as solar electric (photovoltaic), solar thermal, wind, hydro, geothermal, biomass, landfill gas or fuel cells (excluding nuclear), to meet their electricity demands. One-third (32%) of colleges and universities report using off-campus renewable energy sources compared with (23%) in 2001 for both on-campus and off-campus sources.. A total of 15 percent of schools report that more than 10 percent of their electricity needs are met by off-campus renewable energy sources or certificates, including 6 percent that say more than 90 percent of their off-campus needs are met by such sources.

45CAMPUS ENVIRONMENT 2008
TRANSPORTATION
Transit Incentives and Passes, Vehicle Pooling and Bicycles Transportation continues to be an area where campuses are doing somewhat less to reduce their environmental impact, though some schools say they plan to do more. A majority (61%) of schools in 2008 continue to offer adequate and protected bicycle racks, virtually unchanged since 2001 (59%). But many schools also continue to fall short beyond this basic transportation provision.
Section II
Survey Findings, Analysis & Exemplary Schools (cont.)
3. Operations
Q36A/B. Does your campus offer …?
2008 2001
Adequate and protected bicycle racks
Yes, campus-wide 31% 34%
Yes, in some campus units 30% 25%
Have plans to do more 43% 5%
Free or discounted bus or public transit passes to students
Yes, campus-wide 26% 20%
Yes, in some campus units 5% 4%
Have plans to do more 24% 2%
Free or discounted bus or public transit passes to faculty and staff
Yes, campus-wide 20% 15%
Yes, in some campus units 1% 3%
Have plans to do more 19% 2%
Carpooling or vanpooling program
Yes, campus-wide 13% 11%
Yes, in some campus units 8% 5%
Have plans to do more 22% 4%
Incentives not to drive alone
Yes, campus-wide 10% 10%
Yes, in some campus units 3% 3%
Have plans to do more 19% 2%
Bicycle lanes
Yes, campus-wide 5% 7%
Yes, in some campus units 7% 6%
Have plans to do more 16% 3%
A minority of campuses surveyed in 2008 offer incentives for use of public or pooled transportation. Three in 10 (31%) offer discounted bus or public transit passes to students, representing an improvement since 2001 (24%).
Other transportation programs are less common and have stalled since 2001. Two in 10 campuses offer free or discounted bus or transit passes to faculty and staff (21%) and a carpooling or vanpooling program (21%). Just over one in 10 offer incentives not to drive alone (13%) and bicycle lanes (12%).

46NATIONAL WILDLIFE FEDERATION CAMPUS ECOLOGY
Section II
Survey Findings, Analysis & Exemplary Schools (cont.)
3. Operations
Transit Incentives and Passes, Vehicle Pooling and Bicycles (cont.)On a positive note, colleges and universities plan to do more in the future, a notable contrast to 2001. Four in 10 (43%) say they plan to do more with bicycle racks. Roughly two in 10 schools say they plan to do more with all the remaining transportation programs.
Most likely because transportation programs are most necessary at larger colleges and universities, schools with enrollment of 8,000 or higher are far more likely than smaller ones to have established each of these programs.
Consistent with the finding that relatively few colleges and universities have incentive programs in place to discourage people from commuting alone, the vast majority of schools say that faculty, staff and students drive to campus alone. The majority (57%) of schools surveyed report that more than 60 percent of their faculty and staff travel to campus by driving alone. This includes a plurality of 40 percent reporting that more than 80 percent of faculty and staff drive alone to campus. To put it another way, a plurality (40%) of schools report that less than 20 percent of faculty and staff are finding alternatives to driving alone when traveling to campus.
Students appear more likely to share transportation. A total of 39 percent of schools report that more than 60 percent of their students travel to campus by driving alone. Roughly one in 10 colleges and universities report that 1–20 percent (9%), 21–40 percent (7%), and 41–60 percent (10%) of students drive alone to campus, meaning that for at least one-quarter (27%) of schools, a large number of their students are finding alternatives to driving alone to campus.
Exemplary School on Transportation Programs
(See page 63 for other campuses recognized as exemplary in this category.)
University of Washington (Seattle)
Q37A/B. Approximately what percentage of your faculty and staff or students travel to campus by driving alone (one occupant in the vehicle)?
2008
Faculty and staff
None .3%
1% - 20% 1%
21% - 40% 3%
41% - 60% 5%
61% - 80% 17%
81% - 100% 40%
Students
None 1%
1% - 20% 9%
21% - 40% 7%
41% - 60% 10%
61% - 80% 17%
81% - 100% 22%
The award-winning transportation program at the University of Washington
(UW)—U-PASS—offers a wide variety of transport options for students and
staff and helps cut UW’s carbon footprint. While providing unlimited access
to public transit, U-PASS is far more than a bus pass. In partnership with the
campus wellness center, it provides discounts on bicycle and pedestrian safety
equipment, an emergency ride home program for employees, and merchant
discounts with deals on everything from ice cream to theater tickets. It also
includes a parking management component that subsidizes car- and van-
pooling, and parking discounts are available for drivers who commute by more
sustainable alternatives most of the time.
U-PASS rewards bicycling and walking through programs that engage commuters in friendly competitions. The annual Walk-In and winter
Ride-in-the-Rain Challenge encourage hundreds of UW staff and students to take to the streets without a car. For commuters who leave
their cars at home, UW’s unique UCAR program offers hybrid vehicles at an hourly rate to individuals conducting university business.
For personal trips, U-PASS holders can take advantage of a discounted membership in Zipcar. Despite a 23 percent growth in campus
population over the last 20 years, today’s peak hour traffic remains below 1990 levels. On any given day, more than three-quarters of the
campus commutes using an alternative to driving alone.
U-PASS buses provide bike racks to make sustainable
transportation for the campus community convenient.
Copyright: Jacqui James, courtesy of University of Washington
Campus Profile

47CAMPUS ENVIRONMENT 2008
Section II
Survey Findings, Analysis & Exemplary Schools (cont.)
3. Operations
Use of alternative fuels or energy on campus remains prevalent among larger rather than smaller colleges and universities, in four-year as opposed to two-year schools, and is also more prevalent among schools in the West than schools in the Midwest or South.
At least in the near short-term, schools are fairly divided about adding alternative fuels or energy to their fleet. One-third either say their campus plans to add alternative fuel or energy vehicles to the campus fleet in the next two years (35%), they do not have such plans (33%), or declined to answer the question (33%).
Alternative Energy FleetsThough there is much room for improvement, use of fossil fuel alternatives has increased on American college and university campuses since 2001. Among schools that answered the question, 40 percent say that none of their fleet vehicles on campus use alternative fuels or energy such as electric, hybrid electric, propane, biodiesel or biofuel. Notably, twice as many schools in 2008 use alternative fuels or energy in at least some of their fleet vehicles compared with 2001 (27% vs. 13%).
Q42. About how many fleet vehicles on campus use alternative energy sources or fuels (e.g., electric, hybrid electric, propane, biodiesel, biofuels, etc.)?
2008 2001
Total4-Year Degree
2-Year Degree
Total4-Year Degree
2-Year Degree
0% 40% 36% 47% 51% 49% 56%
1% — 10% 14% 17% 9% 8% 11% 2%
11% — 20% 5% 5% 6% 1% 1% —
21% — 30% 3% 4% 1% 1% 1% 1%
31% — 40% 1% 2% — * 1% —
41% — 50% 1% * 1% 1% 1% 1%
51% — 60% 1% 1% 1% — — —
61% — 70% 1% * 1% — — —
71% — 80% * * — * * —
81% — 90% * * — * * —
91% — 100% * — 1% 1% * 1%
SOLID WASTE, RECYCLING AND MATERIALS EXCHANGE
Recycling and CompostingSchools also reduce their environmental impact by recycling and composting. Six in 10 (56%) recycle or compost at least some of the municipal solid waste generated on their campus, roughly the same as in 2001 (61%). Two in 10 (18%) report recycling or composting more than 40 percent of their waste. Only 6 percent of schools say that none of the municipal solid waste generated on campus is recycled or composted. Among the schools that provide an answer to this question, the average recycling rate of their total municipal waste generated is 29 percent. This average “diversion rate” is similar to the one reported in 2001 (26%). Even though a large number of schools recycle at least somewhat, roughly 70 percent of waste generated ends up in landfills or incinerators.
Q23B. What percentage of municipal solid waste was recycled or composted in 2006?
2008 2001
0% 6% 4%
1% — 10% 12% 11%
11% — 20% 12% 9%
21% — 30% 10% 13%
31% — 40% 4% 11%
41% — 50% 5% 5%
51% — 60% 4% 4%
61% — 70% 3% 3%
71% — 80% 4% 2%
81% — 90% 1% 2%
91% — 100% 1% 1%

48NATIONAL WILDLIFE FEDERATION CAMPUS ECOLOGY
RecyclingWhat do campuses collect for recycling? Paper (higher and lower grade), corrugated cardboard, electronics, and aluminum top the list in 2008. Most schools report that they recycle higher grades of paper (89%) and lower grades of paper (85%) in all or some campus units. Nearly as many schools say they recycle electronics (84%), corrugated cardboard (83%) and aluminum cans or containers (82%).
Solid majorities of colleges and universities continue to collect other items for recycling as well. Six in 10 schools say they recycle plastic bottles and jars (69%), construction and demolition waste (60%) and glass bottles and jars (55%). Exactly half collect food scraps or landscape trimmings for composting or mulch (50%).
Encouragingly, American colleges and universities have either improved recycling efforts or kept about the same pace since 2001. Recycling efforts have improved notably for construction and demolition waste (+13%) and plastic bottles and jars (+23%). Schools have maintained roughly the same level of recycling or improved somewhat since 2001 for lower grade paper (+8%), higher grade paper (+5%), glass bottles and jars (+5%), cardboard (+2%), food scraps or landscape trimmings (+1%). Only aluminum has declined slightly (-2%).
Further underscoring their commitment to recycling, nearly half or more of campuses say they have plans to do more recycling in all nine of the waste areas we asked about. This represents a substantial increase since 2001, when roughly one in 10 schools had plans to increase their recycling efforts.
Overall, larger colleges and universities, private schools and schools in the East report more recycling than smaller schools, public schools and schools in the West, Midwest and South.
Section II
Survey Findings, Analysis & Exemplary Schools (cont.)
3. Operations
Q18A/B. Does your campus collect … for recycling?
2008 2001
Higher grades of paper
Yes, campus-wide 70% 67%
Yes, in some campus units 19% 17%
Have plans to do more 56% 14%
Lower grades of paper
Yes, campus-wide 67% 57%
Yes, in some campus units 18% 20%
Have plans to do more 53% 12%
Electronics
Yes, campus-wide 62% -
Yes, in some campus units 22% -
Have plans to do more 50% -
Corrugated cardboard
Yes, campus-wide 65% 64%
Yes, in some campus units 18% 17%
Have plans to do more 47% 9%
Aluminium cans or containers
Yes, campus-wide 60% 61%
Yes, in some campus units 22% 23%
Have plans to do more 56% 10%
Plastic bottles and jars
Yes, campus-wide 50% 31%
Yes, in some campus units 19% 15%
Have plans to do more 53% 9%
Construction and demolition waste
Yes, campus-wide 32% 25%
Yes, in some campus units 28% 22%
Have plans to do more 48% 6%
Glass bottles and jars
Yes, campus-wide 40% 35%
Yes, in some campus units 15% 15%
Have plans to do more 44% 8%
Food scraps or landscape trimmings for composting or mulching
Yes, campus-wide 25% 29%
Yes, in some campus units 25% 20%
Have plans to do more 45% 8%

49CAMPUS ENVIRONMENT 2008
Materials ExchangeA materials exchange program can reduce waste by diverting furniture and equipment from the campus waste stream. A large majority—77 percent—of schools say their campus currently has a materials surplus, exchange or recovery program for such things as computers, furniture, office supplies and lab equipment in at least some campus units. This represents an increase from 54 percent in 2001.
Section II
Survey Findings, Analysis & Exemplary Schools (cont.)
3. Operations
Leading School for Recycling More than 80 Percent of
Total Municipal Solid Waste (See page 67 for other campuses recognized as exemplary in this category.)
Pacific University (Forest Grove, OR)
Pacific University’s recycling center is a core part of the university’s municipal solid waste
management system. The center processes paper, cardboard and other recyclables collected
from campus buildings, and helps reduce trips by recycling and garbage trucks by providing a
centralized location for recyclables. Organic wastes, such as pre-consumer food scraps from
dining services and grass clippings, are composted at the campus B-Street Farm. An end-of-
semester collection of household goods is donated through a Goodwill trailer.
These and other programs—originating five years ago through the efforts of students, faculty
and staff—gave birth to the Greening Pacific initiative. What began as an effort to reduce paper
waste and purchase more green office supplies has developed into a strong commitment to
environmentally responsible behavior for the entire campus community. Projects include:
• Five new green buildings and a pledge to continue building green in the future,
• A working permaculture farm that produces and sells organic produce,
• Purchase of organic foods and use of biodegradable utensils by campus dining services,
• Implementation of many energy reduction measures,
• Printing of the university’s alumni magazine on recycled paper.
Q19A. Does your campus have a materials surplus, exchange or recovery program, for example, for computers, furniture, office supplies or lab equipment?
2008 2001
Yes, campus-wide 58% 30%
Yes, in some campus units 19% 24%
Have plans to do more 47% 12%
Moreover, 58 percent now report having a materials exchange program campus-wide compared with just 30 percent in 2001. Larger schools and public schools are more likely than smaller and private schools to have a materials exchange program, particularly at the campus-wide level.
Recycling Center at Pacific University
Copyright: Colin Stapp, Pacific University
Campus Profile

50NATIONAL WILDLIFE FEDERATION CAMPUS ECOLOGY
Section II
Survey Findings, Analysis & Exemplary Schools (cont.)
3. Operations
Environmentally Friendly Management of Materials and Sustainable PurchasingTraditionally, schools and paper go hand-in-hand together, so both the reduction of hard copies and attention to the type of paper purchased are significant ways for schools to reduce their environmental impact. This fact continues to be important to colleges and universities—a strong majority once again report having programs in place to reduce the need for hard copies (68%). Moreover, when asked about paper purchasing practices, four in 10 (36%) schools said they purchase office paper with a minimum of 25 percent post-consumer waste—an increase since 2001 (29%). One in 10 of them (10%) continue to say they purchase paper that is chlorine-free. More generally, six in 10 (61%) schools report they have programs to encourage environmentally sound purchasing, an improvement since 2001 (49%).
Lab experiments are another area to reduce a campus’s environmental impact and support sustainability. Four in 10 (38%) schools again report having programs in place in all or some campus units to encourage lab courses to implement microscale experiments that consume milliliters rather than liters.
Q20A/B, Q21A/B, Q22A/B. Does your campus have any program in place to …?
2008 2001
Reduce the need for paper hard copies
Yes, campus-wide 32% 32%
Yes, in some campus units 36% 37%
Have plans to do more 67% 15%
Specify that office paper must contain a minimum of 25% post-consumer waste (PCW)
Yes, campus-wide 21% 16%
Yes, in some campus units 15% 13%
Have plans to do more 42% 9%
Specify any chlorine-free requirements for office paper
Yes, campus-wide 5% 3%
Yes, in some campus units 5% 5%
Have plans to do more 25% 5%
Encourage environmentally friendly or sustainable purchasing
Yes, campus-wide 24% 16%
Yes, in some campus units 37% 33%
Have plans to do more 65% 19%
Encourage lab courses to implement microscale experiments
Yes, campus-wide 14% 19%
Yes, in some campus units 24% 24%
Have plans to do more 35% 7%
Looking ahead, schools are much more likely now than in 2001 to report plans for doing more in these areas. For example, seven in 10 say they plan to do more in terms of reducing hard copies (67%) and encouraging environmentally friendly or sustainable purchasing (65%) compared with two in 10 schools surveyed in 2001.
With the exception of reducing hard copies, small schools (enrollment less than 1,000) are less likely than larger schools to have these programs in place. Public schools are more likely than private ones to have a materials exchange program, while Eastern schools are more likely than schools in other regions to specify that paper must contain 25 percent post-consumer waste.

51CAMPUS ENVIRONMENT 2008
Section II
Survey Findings, Analysis & Exemplary Schools (cont.)
3. Operations
GREEN LANDSCAPING AND GROUNDS
Sustainable Landscaping and Grounds ProgramsEffective sustainability practices in landscaping and grounds programs can provide campuses with a variety of benefits, including carbon sequestration, reduced stormwater runoff and pollutants, increased biodiversity and improved stream and water quality. Colleges and universities have largely continued their green landscaping and grounds programs at a constant level, though programs have increased since 2001 in two areas—native landscaping and identifying or removing invasive species. As with programs for energy efficiency, waste, recycling and sustainability purchasing, schools intend to do much more with landscaping and grounds in the future.
Landscaping using native plants or low-maintenance vegetation tops the list of grounds programs. Fully 72 percent of schools have such a program in place in at least some campus units—an increase from 51 percent in 2001. Integrated Pest Management (IPM) continues constant at 61 percent of schools.
Q36A/B. Does your campus offer …?
2008 2001
Landscaping using native plants or low-maintenance vegetation
Yes, campus-wide 34% 21%
Yes, in some campus units 38% 30%
Have plans to do more 69% 10%
Integrated Pest Management (IPM)
Yes, campus-wide 42% 39%
Yes, in some campus units 19% 21%
Have plans to do more 45% 6%
Habitat restoration
Yes, campus-wide 12% 11%
Yes, in some campus units 28% 25%
Have plans to do more 41% 11%
Programs to provide food and shelter to attract wildlife
Yes, campus-wide 15% 12%
Yes, in some campus units 24% 25%
Have plans to do more 36% 7%
Identification and removal of invasive exotic species
Yes, campus-wide 18% 13%
Yes, in some campus units 20% 15%
Have plans to do more 38% 4%
Green roofs on buildings
Yes, campus-wide 1% —
Yes, in some campus units 12% —
Have plans to do more 28% —
Although not quite as prevalent as pest management and native landscaping programs, a significant minority of colleges and universities have established other programs as well. Four in 10 have programs to restore natural habitats on their campuses (40%) and provide food and shelter to attract wildlife (39%). Just as many (38%) have implemented programs to identify and remove invasive exotic species, more than in 2001 (28%).
Colleges and universities say they would like to do more with these green landscaping and grounds programs. Specifically, seven in 10 (69%) have plans to do more with native landscaping programs. And four in 10 or more schools plan to increase their efforts in the remaining areas as well.
The many benefits of green roofs—reduced heating and cooling costs, reduced storm-water runoff, ability to filter pollutants—are being realized by more than one in 10 (13%) campuses surveyed. Three in 10 (28%) have plans to do more with green roofs on their campuses.
Rural and small-town schools continue to do more than city and suburban campuses to provide food and shelter to attract wildlife, while large schools do more than smaller ones to restore natural habitats and remove exotic species. Midwestern colleges and universities lag behind in promoting integrated pest management and native landscaping programs. Large schools (more than 8,000 students) are more likely than smaller schools, and eastern schools are more likely than schools in other regions to have green-roof programs in place.

52NATIONAL WILDLIFE FEDERATION CAMPUS ECOLOGY
Section II
Survey Findings, Analysis & Exemplary Schools (cont.)
3. Operations
Leading School for Landscape and Grounds Management Programs
(See page 67 for other campuses recognized as exemplary in this category.)
Seattle University (Seattle, WA)
A shift to sustainable landscape practices began at Seattle University (SU) in 1979 with
the adoption of an Integrated Pest Management (IPM) program. Since 1986, the Grounds
Department has successfully and beautifully maintained the university’s 48 acres without
the use of any pesticides. Weeds and pests are controlled through building healthy soil,
proper plant selection, biological control, and the use of insecticidal soaps and acetic acid
(vinegar). The university’s grounds are monitored year-round for invasive plant species,
and considerable effort is made to remove weeds or prevent them from going to seed.
SU maintains several areas on campus as wildlife refuges, creating healthy habitat that
provides water, food and shelter for beneficial insects, birds and small mammals. Native
plants are used extensively in these areas. A 12,000 square foot ethno-botanical garden
(formerly turf grass) features plants indigenous to the Northwest along with descriptive
signs that tell how they were used by native peoples. Species-appropriate nest and
roosting boxes provide additional shelters for birds, and “houses” for orchard mason bees
encourage pollination of plants. In 1989, the campus was designated a Backyard Wildlife
Sanctuary by the state Department of Fish and Wildlife.
Sustainable Landscaping and Grounds Programs (cont.)In addition to implementing environmentally sound and sustainable landscaping programs, colleges and universities also set aside land to protect ecosystems or simply preserve natural lands. Seven in 10 (70%) colleges and universities say at least some percentage of their campus’s total land area is natural land, such as a forest, wetland, nonagricultural field or prairie. Two in 10 (20%) report that more than 50 percent of their campus land area is set aside.
Q25B. And what percentage of this acreage is natural area, such as forest, wetland, nonagricultural field, or prairie?
2008
0% 14%
1% - 10% 18%
11% - 20% 10%
21% - 30% 10%
31% - 40% 8%
41% - 50% 4%
51% - 60% 7%
61% - 70% 5%
71% - 80% 5%
81% - 90% 2%
91% - 100% 1%
Seattle University focuses on several key areas of campus to maintain
as wildlife refuges. This bioswale supplies water for wildlife.
Copyright: Seattle University
Campus Profile

53CAMPUS ENVIRONMENT 2008
Section II
Survey Findings, Analysis & Exemplary Schools (cont.)
3. Operations
BACKGROUND INFORMATION ON OPERATIONS AND FACILITIES
TransportationAs enrollments have increased since 2001, colleges and universities have increased their parking capacity somewhat, though parking on a per-student basis is lower now than in 2001. And a majority of schools either plan to keep the same number or decrease the number of parking spaces. The average commute to campus, and fleet size, are largely unchanged from 2001.
Four in 10 (41%) colleges and universities did not provide an answer when asked about their campus parking. Among schools that responded, less than half (47%) have 1,000 or fewer parking spaces, while over half (53%) have more than 1,000 spaces. In 2001, over half (53%) had 1,000 or fewer spaces, and less than half (47%) had more than 1,000 spaces. Moreover, while the mean number of parking spaces has decreased since 2001 (2,478 vs. 3,093), the median number of parking spaces has increased (1,200 vs. 938). However, the median number of parking spaces per student is now lower than in 2001 (.39 vs. .49), and the mean number of parking spaces per student is lower as well (.49 vs. .78).
Among schools that answered the question, a modest majority (54%) either say they plan to keep the same number of parking spaces (46%) or decrease their parking spaces (6%), while nearly half (48%) are planning an increase.
Consistent with 2001, the campus population continues to have a fairly short commute.Among colleges and universities that answered this question, nearly half (46%) say the average commute for students, faculty and staff who drive to campus is no more than 10 miles. Over half (55%) report that the average commute is more than 10 miles. Nearly half (49%) of all respondents did not answer this question. The median commuting distance is 12 miles and the mean is 15 miles, both similar to the findings in 2001.
Colleges and universities report roughly the same number of fleet vehicles as in 2001. Among campuses that answered the question, nearly half (48%) report leasing or owning 15 or fewer fleet vehicles, while just over half (52%) report leasing or owning more than 16 fleet vehicles. The mean number of fleet vehicles is now 66 compared with a mean of 60 in 2001, and the median is 17 fleet vehicles compared with a median of 15 in 2001.
Q39A. Thinking about students, faculty and staff together, roughly how many parking spaces does your campus provide for regular student, faculty or staff parking?
2008 2001
0 1% 2%
1 — 500 26% 23%
501 — 1000 20% 28%
1001 — 2000 25% 19%
2001 — 5000 15% 18%
5001+ 13% 10%
Q39B. Thinking about students, faculty and staff together, for students, faculty and staff who do drive to campus, what is the average commute in miles?
2008 2001
5 or less 17% 14%
6-10 29% 35%
11-15 23% 22%
16-20 18% 15%
More than 20 14% 15%
Q41. Thinking about the fleet vehicles on campus, roughly how many does the campus lease or own?
2008 2001
5 or less 17% 20%
6 — 10 18% 15%
11 — 15 13% 16%
16 — 25 15% 15%
26 — 50 16% 14%
51 — 200 14% 12%
More than 200 7% 8%

54NATIONAL WILDLIFE FEDERATION CAMPUS ECOLOGY
Section II
Survey Findings, Analysis & Exemplary Schools (cont.)
3. Operations
Solid WasteColleges and universities were asked about the total municipal solid waste (product packaging, grass clippings, furniture, clothing, bottles, food scraps, newspapers, appliances, paint, batteries) generated on their campus.
Nearly half (48%) of campuses did not provide data on their solid waste. Among the schools that responded, three in 10 (29%) generated 50 or fewer short tons of municipal solid waste in 2006. Two in 10 (20%) generated between 51 and 250 short tons, while just as many (21%) generated between 251 and 1,000 short tons. Three in 10 (30%) schools say they generated more than 1,000 short tons of municipal solid waste in 2006.
In the 2001 survey, schools were asked how much solid waste they generated in 1999. Though the numbers from the 2008 survey are similar to the findings from the 2001 survey, both the mean and median have increased. Specifically, the median short tons of waste for the 2008 survey is 269 compared with 150 for 2001, and the mean amount of waste is 1,905 compared with 1,773 short tons for 2001.
The 295 colleges and universities that responded to this question generated a total of 458,841 short tons of municipal solid waste in 2006. Not surprisingly, waste varied by the size of the school, with larger schools reporting more waste generated on their campus than smaller schools, and four-year colleges and universities producing vastly more waste than two-year colleges.
Per-student waste also varies among different types of campuses. For every student, colleges and universities generated a mean of 0.52 short tons and a median of .09 short tons of municipal solid waste in 2006. Students of four-year schools generated greater amounts of waste per student than those at two-year schools, while schools in the East, followed by schools in the Midwest, produced far greater waste per student than those in the South and West.
Leading School for Waste Reduction and Recycling
(See page 65 for other campuses recognized as exemplary in this category.)
Warren Wilson College (Asheville, NC)
Warren Wilson College’s 800 students provide nearly the entire campus
workforce, serving as plumbers, landscapers, secretaries and, of course,
recyclers. Its recycling program began in 1981 as a one-student operation.
In 1987, an Environmental Policy Class designed a Solid Waste Management
Plan that launched a new three-person recycling operation. Bins were placed
in dorms, offices and public areas, and the waste management group created
a partnership with Buncombe County and the town of Montreat to set up the
first recycling drop off centers in the county.
Q23A. Thinking about the total municipal solid waste generated on campus, roughly how many short tons (2000 lbs/ton) were generated in 2006?
2008 2001
1 — 50 29% 35%
51 — 250 20% 21%
251 — 1000 21% 17%
More than 1000 30% 27%
*Figures for the 2001 survey are based on 1999
In 1999, a full-time supervisor was hired to oversee the 20-student recycling crew. While the program no longer operates county
recycling facilities, it has grown into a multi-faceted operation that processes trash and over 25 different recyclables. The campus
composts all pre- and post-consumer food waste from cafeterias, offers reused materials through the campus FreeStore and
Surplus Program, sells hand-crafted notebooks made from waste paper, and provides educational opportunities for area schools
and organizations. The Carolina Recycling Association recently awarded the college the Outstanding College Recycling Program
Award for promoting “sustainable resource use through waste reduction, reuse and recycling on a college campus.”
Tory Selz and Emily Holzer empty food waste into the
mixer of Warren Wilson’s in-vessel GreenDrum composter.
Copyright: Jessica Wooten, courtesy of Warren Wilson College
Campus Profile

55CAMPUS ENVIRONMENT 2008
ElectricityColleges and universities were also asked about their consumption of electricity in 2006. Nearly half (49%) of campuses surveyed did not respond to the question, though this represents an improvement from 2001 (61%). Among the colleges and universities that did respond, roughly two in 10 campuses reported using fewer than 1,000 MWHs (19%), 1,000 to 5,000 MWHs (22%), 5,000 to 10,000 MWHs (17%) and 10,000 to 25,000 MWHs (21%) of electricity in 200610 Another two in 10 schools say they consume more than 25,000 MWHs (22%).
Overall, the amount of electricity reported by colleges and universities is similar to the amount reported in 2001, though more schools now report using fewer than 1,000 MWHs compared to 2001 (19% vs. 9%). As with other consumption and use patterns, four-year schools and larger schools consume far more electricity than two-year schools and smaller schools.
Section II
Survey Findings, Analysis & Exemplary Schools (cont.)
3. Operations
Q33. In 2006, about how many megawatt hours (MWHs) of electricity did your campus consume? (Include both purchased and self-generated or cogenerated electricity.)
2008 2001
Less than 1,000 MWHs 19% 9%
1,000 to less than 5,000 22% 25%
5,000 to less than 10,000 17% 17%
10,000 to less than 25,000 21% 20%
25,000 to less than 50,000 8% 8%
50,000 to less than 100,000 6% 9%
More than 100,000 8% 12%
*Figures for the 2001 survey are based on 1999
Leading School for Energy Efficiency and Conservation
(See page 59 for other campuses recognized as exemplary in this category.)
Butte College (Oroville, CA)
Located on a 928-acre wildlife refuge, Butte College was named the Grand Prize winner
of NWF’s 2008 Chill Out: Campus Solutions to Global Warming contest. From 2002 to
2006, the college’s overall usage per square foot of electricity and natural gas decreased
33 percent due to HVAC upgrades and lighting retrofits. In addition, a one megawatt
solar array provides 28 percent of the college’s electricity needs. The college operates
California’s largest community college transportation system, with three natural gas and
10 bio-diesel buses—all funded through a student-approved transportation fee. The buses
log over 250,000 miles each year and keep 1,100 students off the roads each school
day. By late 2009, Butte College will certify five new campus buildings through the U.S.
Green Building Council’s LEED standards. President Diana Van Der Ploeg has pledged the
college will be carbon neutral by 2015.
(10) Responses for this question have been converted from kilowatt hours to megawatt hours.
Butte College features the largest bus transportation system
in California
Copyright: Lisa DeLaby, Butte College
Campus Profile

56NATIONAL WILDLIFE FEDERATION CAMPUS ECOLOGY
Section II
Survey Findings, Analysis & Exemplary Schools (cont.)
3. Operations
Heating and Cooling Degree DaysThe number of heating and cooling degree days has decreased since 2001, according to colleges and universities surveyed. Similar to the 2001 survey, a majority of colleges and universities did not answer the heating days question (55%) and cooling days question (57%).
Among the campuses that responded, 51 percent reported 200 or fewer heating degree days (from base 65 degrees) compared with 41 percent in 2001. And 41 percent of schools reported more than 200 heating degree days, down from 59 percent in 2001. The decrease in heating degree days is also evident when looking at the mean and median values. Specifically, the mean number of heating degree days is now 2,020 compared with 2,519 in 2001, while the median number is now 200 compared with 280 in 2001.
Q31A. How many heating degree days, from base 65 degrees, does your campus have?
2008 2001
0 4% —
1 — 100 16% 17%
101 — 200 31% 24%
201 — 1000 12% 11%
1001 — 5000 14% 22%
5001 — 10000 23% 25%
Q31B. How many cooling degree days, from base 65 degrees, does your campus have?
2008 2001
0 4% 1%
1 — 100 13% 12%
101 — 200 34% 25%
201 — 1000 33% 36%
1001 — 5000 17% 25%
5001 — 10000 0.3% —
Turning to cooling degree days, 51 percent of colleges and universities surveyed said they have 200 or fewer cooling degree days (from base 65 degrees), representing a decrease from 38 percent in 2001. At the higher end of the scale, 50 percent of schools reported more than 200 cooling degree days compared with 61 percent in 2001. The mean number of cooling degree days is now 568 compared with 755 in 2001, while the median number of cooling degree days is now 200 compared with 322 in 2001.

57CAMPUS ENVIRONMENT 2008
Section II
Survey Findings, Analysis & Exemplary Schools (cont.)
3. Operations
Square FootageThe building area that campuses heat or cool has increased somewhat since 2001. Consistent with 2001, three in 10 (28%) campuses did not provide information on the amount of square footage they heat or cool.
Looking at colleges and universities that answered the question, nearly half (45%) have less than 600,000 square feet of heated or air conditioned buildings on their campuses. This represents a slight drop from over half (54%) in 2001. Fully 55 percent of colleges and universities surveyed report having 600,000 or more square feet of building space that is heated or cooled, compared with 47 percent in 2001. However, the key change since 2001 appears to be at the lower range of the scale. Specifically, fewer schools in 2008 report having less than 400,000 square feet (27% vs. 39%), while a greater number of schools report having 400,000 to 999,999 square feet (38% vs. 28%).
Consistent with the reported increase in campus building space, eight in 10 (77%) colleges and universities say their heated and/or air conditioned square footage has increased since 2002 (among schools that answered the question). Two in 10 (21%) say their square footage has stayed about the same, and relatively few schools (2%) report a decrease in heated or cooled building space on campus since 2002. Larger schools, particularly schools with more than 8,000 enrolled students, are more likely to report an increase in square footage since 2002.
Q32A. What is the approximate total gross square footage of the heated and/or air conditioned buildings on campus??
2008 2001
Less than 200,000 square feet 13% 19%
200,000 to 399,999 14% 20%
400,000 to 599,999 18% 15%
600,000 to 999,999 20% 13%
1 million to less than 2 million 17% 18%
2 million to less than 3 million 5% 5%
3 million to less than 4 million 4% 2%
4 million to less than 5 million 2% 1%
More than 5 million 7% 8%
Q32B. Has this square footage increased, stayed about the same or decreased since 2002?
2008
Increased 77%
Stayed about the same 21%
Decreased 2%

58NATIONAL WILDLIFE FEDERATION CAMPUS ECOLOGY
Open-ended Questions Yield Low Response Rate
Colleges and universities did a better job than in 2001 at providing critical data on their electricity consumption and electrical generation efforts. But in other important areas, roughly the same percentage of schools as in 2001 skipped the open-ended questions in the survey. Overall, the 2008 survey provided more information than the 2001 survey because the number of schools participating in the survey increased substantially. For example, 570 surveys were completed for the Operations section in 2008 compared with 325 in 2001.
As is the case with any survey, there is always the possibility that some of the respondents simply did not want to disclose certain information. But it is unlikely that this is the major cause of the high rate of “no answers” for the facilities and operations questionnaire because regular close-ended questions on similar topics had much lower refusals (≈ 10%). Moreover, for the most basic open-ended question of how much total land area the campus included, just 19 percent gave no answer.
Therefore, it is more likely that the problem rests somewhat with the questions that were asked or, more specifically, with the kind of information that we asked campuses to provide in the survey. There are two potential challenges that might have been posed by the type of information we asked for. First, many of the open-ended questions asked schools to provide very detailed information that would have required some investigation. It is unlikely, for example, that chiefs of facilities or plant operations, the provost or sustainability personnel knew offhand how many kilowatt hours of electricity their campuses consumed or the number of heating and cooling days. Based on our experience from 2001, we knew we would be surveying very busy people, and although this questionnaire could be done in pieces, some respondents probably decided not to research the answers to these open-ended questions.
While non-response for the above reason is cause for concern, another important issue might be at stake as well. Some respondents might not have had all of this data available to them, or might not have entirely understood what we were asking for. Do all schools keep records on the number of heating and cooling degree days? It is likely that while some excel in keeping records on their energy, waste and landscaping activities, others do not.
Assuming that incomplete records and inconsistent data gathering are at least part of the problem, this suggests an important opportunity for campuses to plan ahead for future reporting needs. Because these issues are so important, it is recommended that colleges and universities explore ways to keep better records on their environmental and sustainability practices.
Section II
Survey Findings, Analysis & Exemplary Schools (cont.)
3. Operations

59CAMPUS ENVIRONMENT 2008
Section II
Survey Findings, Analysis & Exemplary Schools (cont.)
3. Operations
Colleges and Universities that Lead on Energy Conservation and Renewable Energy
Throughout the country, colleges and universities continue to implement programs to reduce energy consumption, use clean energy sources and promote sustainability. But there is a small group of schools that stands apart from the rest when it comes to energy efficiency and sustainability practices. These exemplary schools have taken most of the steps listed above to improve efficiency—using renewable energy resources or certificates; upgrading water, lighting, HVAC and IT efficiency; implementing efficiency standards, life-cycle analysis, and LEED certification for new buildings or retrofits; and committing to formal plans for reducing emissions of CO2 and other greenhouse gases. And at least six of these eight activities have been implemented campus-wide. These high performing colleges and universities vary with regard to size and the types of degrees offered. Although they are located across the nation, several of the larger schools are located in the West.
Exemplary Schools for Energy Efficiency, Conservation and Renewable Energy (Q28, Q29A, Q30A)
School Location
Aims Community College Greeley, CO
Bunker Hill Community College Boston, MA
Butte College Oroville, CA
Florida Gulf Coast University Fort Myers, FL
Johnson County Community College Overland Park, KS
Loyola University Chicago, IL
Marquette University Milwaukee, WI
Middlebury College Middlebury, VT
Naropa University Boulder, CO
Southern Polytechnic State University Marietta, GA
St. Olaf College Northfield, MN
Stanford University Stanford, CA
State University of New York College of Agriculture and Technology
Morrisville, NY
University of Arizona Tucson, AZ
University of California Santa Barbara, CA
University of Denver Denver, CO
University of Idaho Moscow, ID
Willamette University Salem, OR

60NATIONAL WILDLIFE FEDERATION CAMPUS ECOLOGY
Section II
Survey Findings, Analysis & Exemplary Schools (cont.)
3. Operations
Colleges and Universities that Lead on Energy Conservation and Renewable Energy (cont.)
There is also a group of colleges and universities that are especially committed to doing more in the future to promote energy efficiency and sustainability on their campuses, even though they might not be currently implementing the programs we asked about. These schools do not use off-campus renewable energy for their electricity demands, but plan to do more in the future with on-campus renewable energy sources; and they plan to implement the eight policies listed above—using renewable energy resources or certificates; upgrading water, lighting, HVAC and IT efficiency; implementing efficiency standards, life-cycle analysis and LEED certification for new buildings or retrofits; and implementing formal plans for reducing emissions of CO2 and other greenhouse gases. Similar to the leading schools that already excel in energy efficiency and conservation, this group includes two-year and four-year schools that vary in size. Though the schools are located all over the country, many in this group are located in the Midwest.
Schools Committed to Doing More with Energy Efficiency, Conservation and Renewable Energy (Q27D, Q28, Q29B, Q30B)
School Location School Location
Appalachian State University Boone, NC Monroe County Community College Monroe, MI
Associated Mennonite Biblical Seminary Elkhart, IN North Central Michigan College Petoskey, MI
Auburn University Auburn University, AL Northern Illinois University De Kalb, IL
Barnard College New York, NY Northwest Christian College Eugene, OR
Benedictine University Lisle, IL Nova Southeastern University Fort Lauderdale, FL
Cascadia Community College Bothell, WA Pratt Community College Pratt, KS
Catawba College Salisbury, NC Quinsigamond Community College Worcester, MA
Central Florida Community College Ocala, FL Saginaw Valley State University University Center, MI
Central Michigan University Mount Pleasant, MI Saint Mary’s College Notre Dame, IN
Cincinnati State Technical and Community College
Cincinnati, OH Salve Regina University Newport, RI
DePauw University Greencastle, IN Scott Community College Bettendorf, IA
Elizabethtown College Elizabethtown, PA Tacoma Community College Tacoma, WA
Georgia Institute of Technology Atlanta, GA Taylor University Upland, IN
Goshen College Goshen, IN University of California Riverside, CA
Hanover College Hanover, IN University of Colorado and Health Sciences Center
Denver, CO
Henry Ford Community College Dearborn, MI University of Illinois Champaign, IL
Howard Community College Columbia, MD University of Illinois Chicago, IL
Idaho State University Pocatello, ID University of Michigan Ann Arbor, MI
Iowa State University Ames, IA University of Minnesota Morris, MN
Lyndon State College Lyndonville, VT University of Texas Arlington, TX
Massachusetts College of Art Boston, MA University of Wisconsin Milwaukee, WI
Massachusetts Maritime Academy Buzzards Bay, MA Wake Technical Community College Raleigh, NC
Medical University of South Carolina Charleston, SC William Jessup University Rocklin, CA
Michigan State University East Lansing, MI Yavapai College Prescott, AZ
Molloy College Rockville Centre, NY

61CAMPUS ENVIRONMENT 2008
Section II
Survey Findings, Analysis & Exemplary Schools (cont.)
3. Operations
Colleges and Universities that Lead on Energy Conservation and Renewable Energy (cont.)
A select group of colleges and universities stand apart for harnessing on-campus clean energy sources and using cogeneration for their energy demands. All of the exemplary schools listed below report that more than 50 percent of their combined electricity generated on campus comes from wind, solar electric (photovoltaic), biomass or other clean sources such as landfill gas or fuel cells. In addition, these schools are exemplary in at least one of two areas: 1) they report that more than 50 percent of on-campus heating and cooling is met using on-site ground-source (geothermal) heat pumps, direct-heat geothermal, solar, biomass, landfill gas, aquifer or lake-source thermal systems; or 2) they report that more than 50 percent of their energy comes from on-campus cogenerated heat and electricity (combined heat and power, or CHP) produced by renewables or lower-carbon fuels than coal. These are mostly four-year schools, and a majority are public. Just over half are large schools (8,000 or more students) and most are in the West, East and Midwest.
Exemplary Schools for On-Campus Clean Energy Sources and CoGeneration (Q27A(a-d), Q27B, Q27C)
School Location School Location
Amherst College Amherst, MA Oklahoma State University Okmulgee, OK
Appalachian State University Boone, NC Randolph-Macon College Ashland, VA
California Institute of Technology Pasadena, CA Rowan University Glassboro, NJ
Central Wyoming College Riverton, WY Sacred Heart University Fairfield, CT
Chadron State College Chadron, NE Saddleback College Mission Viejo, CA
College of New Jersey Ewing, NJ San Diego State University San Diego, CA
College of the Canyons Santa Clarita, CA Southern Oregon University Ashland, OR
Deep Springs College Deep Springs, CA Stanford University Stanford, CA
Elgin Community College Elgin, IL Unification Theological Seminary Barrytown, NY
Iowa State University Ames, IA University of Arizona Tucson, AZ
Kent State University, Main Campus Kent, OH University of California Berkeley, CA
King’s College Wilkes-Barre, PA University of Illinois Champaign, IL
Louisiana Tech University Ruston, LA University of Illinois Chicago, IL
Mary Baldwin College Staunton, VA University of Maryland College Park, MD
Massachusetts Institute of Technology Cambridge, MA University of Montana Dillon, MT
Messiah College Grantham, PA University of Saint Mary Leavenworth, KS
Michigan State University East Lansing, MI University of Washington Seattle, WA
Monroe Community College Rochester, NY Vincennes University Vincennes, IN
Northland Community and Technical College
Thief River Falls, MN

62NATIONAL WILDLIFE FEDERATION CAMPUS ECOLOGY
Section II
Survey Findings, Analysis & Exemplary Schools (cont.)
3. Operations
Colleges and Universities that Lead on Energy Conservation and Renewable Energy (cont.)
Other colleges and universities are noteworthy for their extensive use of off-campus sources of renewable energy certificates or RECs. All of the exemplary schools listed below report that more than 80 percent of their campus’s total electricity demand is met through RECs or renewable energy sources such as solar electric (photovoltaic), solar thermal, wind, hydro, geothermal, biomass, landfill gas or fuel cells (excluding nuclear). This group is diverse, including large public universities as well as private and two-year community schools, though many are located in the West.
Exemplary Schools for Which More than 80% of Energy Comes from Off-Campus Renewable Sources (Q28)
School Location School Location
Alabama Agricultural and Mechanical University
Normal, AL Pacific University Forest Grove, OR
Anne Arundel Community College Arnold, MD Piedmont Technical College Greenwood, SC
Arkansas State University Newport, AR Pima County Community College District Tucson, AZ
Coleman College San Diego, CA Seattle University Seattle, WA
Columbia Basin College Pasco, WA Southern Oregon University Ashland, OR
Concordia University Austin, TX Southern Polytechnic State University Marietta, GA
Feather River Community College District Quincy, CA St. Mary’s College Saint Mary’s City, MD
Hartford Seminary Hartford, CT Texas A & M University Commerce, TX
Illinois Eastern Community Colleges, Lincoln Trail College
Robinson, IL University of California Santa Cruz, CA
Illinois Institute of Technology Chicago, IL University of Central Oklahoma Edmond, OK
Johnson County Community College Overland Park, KS University of North Carolina Chapel Hill, NC
Lake Washington Technical College Kirkland, WA University of Puget Sound Tacoma, WA
Louisiana College Pineville, LA University of Saint Mary Leavenworth, KS
Marquette University Milwaukee, WI University of Washington Seattle, WA
Naropa University Boulder, CO Warren Wilson College Asheville, NC
Northeastern Junior College Sterling, CO West Virginia University Morgantown, WV
Northern Kentucky University Highland Heights, KY Western Washington University Bellingham, WA Northwest Kansas Technical College Goodland, KS

63CAMPUS ENVIRONMENT 2008
Colleges and Universities that Lead on Transportation
There is a select group of colleges and universities that stands above the rest with regard to their transportation programs and policies. These exemplary schools are dedicated to promoting environment-friendly transportation by providing all of the following programs in at least some campus units—adequate and protected bicycle racks, free or discounted bus or public transit passes for students, free or discounted bus or public transit passes for faculty and staff, a carpooling or vanpooling program and incentives for members of the community to not drive alone. Moreover, all of these schools have at least some on-campus fleet vehicles that operate on alternative fuels or energy. About half of these schools are located in the West, and most of them are larger schools and public colleges or universities.
Section II
Survey Findings, Analysis & Exemplary Schools (cont.)
3. Operations
Exemplary Schools for Transportation Programs (36A, Q42)
School Location
Cascadia Community College Bothell, WA
Georgia Institute of Technology Atlanta, GA
Massachusetts Institute of Technology Cambridge, MA
Naropa University Boulder, CO
San Diego State University San Diego, CA
St. Cloud State University Saint Cloud, MN
University of Arizona Tucson, AZ
University of California Santa Barbara, CA
University of Michigan Ann Arbor, MI
University of North Carolina Chapel Hill, NC
University of Oregon Eugene, OR
University of Pennsylvania Philadelphia, PA
University of Washington Seattle, WA
Willamette University Salem, OR

64NATIONAL WILDLIFE FEDERATION CAMPUS ECOLOGY
Colleges and Universities that Lead on Transportation (cont.)
Other schools are committed to expanding their transportation programs in all six areas above—providing adequate and protected bicycle racks, free or discounted bus or public transit passes for students, free or discounted bus or public transit passes for faculty and staff, a carpooling or vanpooling program and incentives for members of the community to not drive alone. These committed schools tend to be larger and four-year schools, with a mix of both public and private campuses and spread out across the United States.
Section II
Survey Findings, Analysis & Exemplary Schools (cont.)
3. Operations
Schools Committed to Doing More with Transportation Programs (36B)
School Location School Location
Arizona State University Tempe, AZ Stephens College Columbia, MO
California State Polytechnic University Pomona, CA University of Arizona Tucson, AZ
Clover Park Technical College Lakewood, WA University of California Riverside, CA
Dillard University New Orleans, LA University of Central Oklahoma Edmond, OK
Evergreen State College Olympia, WA University of Massachusetts Boston, MA
Evergreen Valley College San Jose, CA University of Nevada Reno, NV
Florida Gulf Coast University Fort Myers, FL University of North Carolina Chapel Hill, NC
Georgia Institute of Technology Atlanta, GA University of North Carolina Pembroke, NC
Harvard University Cambridge, MA University of North Dakota, Main Campus Grand Forks, ND
Howard Community College Columbia, MD University of Pennsylvania Philadelphia, PA
Lafayette College Easton, PA University of Saint Francis Fort Wayne, IN
Marquette University Milwaukee, WI University of Texas Medical Branch Galveston, TX
Michigan State University East Lansing, MI University of Texas El Paso, TX
Middlebury College Middlebury, VT University of Utah Salt Lake City, UT
Naropa University Boulder, CO University of Virginia Charlottesville, VA
Pratt Community College Pratt, KS Western Washington University Bellingham, WA
Southern Polytechnic State University Marietta, GA Willamette University Salem, OR
St. Cloud State University Saint Cloud, MN Yale University New Haven, CT
Stanford University Stanford, CA

65CAMPUS ENVIRONMENT 2008
Colleges and Universities that Lead on Recycling Efforts
Most colleges and universities across the country remain committed to recycling the various sources of waste they produce, but there is a group of schools that truly stands out from the rest. These exemplary schools collect virtually all solid wastes for recycling, including paper, corrugated cardboard, aluminum, glass, plastic, food scraps or landscape trimmings, construction and demolition waste and electronics. Moreover, most of them have a materials exchange program and programs in place to encourage environmentally sound purchasing, reduce the need for paper hard copies and encourage lab courses to implement microscale experiments that will consume milliliters rather than liters. Many of these schools also specify that office paper purchased must contain a minimum 25 percent post-consumer waste and also have chlorine-free requirements for office paper. Of the 15 recycling criteria, these top recycling schools have undertaken at least 12—including 10 on a campus-wide basis.
Section II
Survey Findings, Analysis & Exemplary Schools (cont.)
3. Operations
Exemplary Schools for Recycling, Solid Waste, and Materials Flow (18A, Q19A, Q20A, Q21A, Q22A)
School Location School Location
Associated Mennonite Biblical Seminary Elkhart, IN Northeastern University Boston, MA
Bastyr University Kenmore, WA Ottawa University Ottawa, KS
Brunswick Community College Supply, NC Pacific Lutheran University Tacoma, WA
Butte College Oroville, CA Pacific University Forest Grove, OR
California State University Camarillo, CA Pacifica Graduate Institute Carpinteria, CA
Carleton College Northfield, MN Penn State Dickinson School of Law Carlisle, PA
Cascadia Community College Bothell, WA Rutgers State University of New Jersey Newark, NJ
College of the Canyons Santa Clarita, CA Southern Oregon University Ashland, OR
Columbia Basin College Pasco, WA Southern Polytechnic State University Marietta, GA
Cuyamaca College El Cajon, CA St. Olaf College Northfield, MN
Earlham College and Earlham School of Religion
Richmond, IN Stephens College Columbia, MO
Evergreen State College Olympia, WA United States Coast Guard Academy New London, CT
Hamilton College Clinton, NY University of Arizona Tucson, AZ
Hanover College Hanover, IN University of California Riverside, CA
Kankakee Community College Kankakee, IL University of Illinois Champaign, IL
Lackawanna College Scranton, PA University of Michigan Ann Arbor, MI
Landmark College Putney, VT University of North Carolina Chapel Hill, NC
Lane Community College Eugene, OR University of Oregon Eugene, OR
Marquette University Milwaukee, WI University of Puget Sound Tacoma, WA
Maryland Institute College of Art Baltimore, MD Warren Wilson College Asheville, NC
Middlebury College Middlebury, VT Wilkes University Wilkes-Barre, PA
Montclair State University Montclair, NJ Willamette University Salem, OR
Naropa University Boulder, CO Yale University New Haven, CT

66NATIONAL WILDLIFE FEDERATION CAMPUS ECOLOGY
Colleges and Universities that Lead on Recycling Efforts (cont.)
Other colleges and universities are noteworthy for their future plans to do more recycling. Some of these committed schools already have strong recycling programs but would like to improve them, while others have less-established programs in place. As was the case with the schools that currently have recycling, material exchange and environmentally friendly and sustainable purchasing programs, these committed campuses are big and small in size and are located across the country. Most are four-year schools, although there are some two-year schools in this group as well.
Section II
Survey Findings, Analysis & Exemplary Schools (cont.)
3. Operations
Schools Committed to Doing More with Recycling, Solid Waste and Materials Flow (18B, Q19B, Q20B, Q21B, Q22B)
School Location School Location
Atlanta Metropolitan College Atlanta, GA Nova Southeastern University Fort Lauderdale, FL
Ball State University Muncie, IN Ohlone College Fremont, CA
Baylor University Waco, TX Pacific University Forest Grove, OR
Cascadia Community College Bothell, WA Quinsigamond Community College Worcester, MA
Colorado College Colorado Springs, CO Sacred Heart University Fairfield, CT
Davidson County Community College Lexington, NC Saint Mary’s College Notre Dame, IN
DePauw University Greencastle, IN Southern Polytechnic State University Marietta, GA
Dillard University New Orleans, LA Stanford University Stanford, CA
Drury University Springfield, MO Stephens College Columbia, MO
Earlham College and Earlham School of Religion
Richmond, IN Trinity College Hartford, CT
East Tennessee State University Johnson City, TN University of Arkansas Pine Bluff, AR
Eastern Oklahoma State College Wilburton, OK University of California Berkeley, CA
Florida Institute of Technology Melbourne, FL University of California Santa Barbara, CA
Hamilton College Clinton, NY University of Massachusetts Boston, MA
Hanover College Hanover, IN University of North Carolina Chapel Hill, NC
Iowa State University Ames, IA University of Oklahoma Norman, OK
Kalamazoo College Kalamazoo, MI University of Puget Sound Tacoma, WA
Lesley University Cambridge, MA University of Texas Arlington, TX
Massachusetts Maritime Academy Buzzards Bay, MA University of Texas Medical Branch Galveston, TX
Mesa Community College Mesa, AZ Widener University Chester, PA
Michigan State University East Lansing, MI Willamette University Salem, OR
Mt. Hood Community College Gresham, OR Yavapai College Prescott, AZ

67CAMPUS ENVIRONMENT 2008
Section II
Survey Findings, Analysis & Exemplary Schools (cont.)
3. Operations
Colleges and Universities that Lead on Recycling Efforts (cont.)
A select group of schools report that they recycle or compost more than 80 percent of the municipal solid waste their campus generates. These exemplary leaders tend to be smaller schools, though the list includes both public and private campuses, two- and four-year schools, and they are located throughout the United States.
Colleges and Universities that Lead on Green Landscaping and Grounds Programs
Schools that stand out with regard to green landscaping and grounds management programs have implemented all of the six types of programs discussed above—habitat restoration, native landscaping programs, identification and removal of invasive exotic species, IPM, programs to provide food and shelter to attract wildlife and green roofs on buildings. And at least four of these six activities are implemented campus-wide. This group of exemplary schools tends to be four-year rather than two-year schools. Many are located in the West, and none are located in the South.
Exemplary Schools for Recycling More than 80% of Total Municipal Waste Generated (Q23B)
School Location
Arkansas State University Newport, AR
Associated Mennonite Biblical Seminary Elkhart, IN
Buffalo State College, Buffalo, NY Buffalo, NY
Chesapeake College Wye Mills, MD
Gustavus Adolphus College Saint Peter, MN
Halifax Community College Weldon, NC
Huston-Tillotson University Austin, TX
Idaho State University Pocatello, ID
Iowa State University Ames, IA
Ivy Tech Community College of Indiana Kokomo, IN
Pacific University Forest Grove, OR
Southern Polytechnic State University Marietta, GA
Watkins College of Art & Design and Watkins Film School Nashville, TN
Exemplary Schools for Green Landscaping and Grounds Management Programs (Q24A)
School Location
Bard College Annandale-On-Hudson, NY
Cascadia Community College Bothell, WA
Lackawanna College Scranton, PA
Point Loma Nazarene University San Diego, CA
Seattle University Seattle, WA
St. Olaf College Northfield, MN
University of California Santa Cruz, CA
University of Oregon Eugene, OR
University of Wisconsin Madison, WI
Willamette University Salem, OR

68NATIONAL WILDLIFE FEDERATION CAMPUS ECOLOGY
Section II
Survey Findings, Analysis & Exemplary Schools (cont.)
3. Operations
Colleges and Universities that Lead on Green Landscaping and Grounds Programs (cont.)
Another group of schools stands out due to their commitment to future plans for improving their green land management and sustainability programs. Some of these committed campuses have already taken significant steps toward improving their environmental management and sustainability programs. This large group is diverse in terms of size and location, though most are four-year institutions.
Schools Committed to Doing More with Green Landscaping and Grounds Management Programs (Q24B)
School Location School Location
Alliant International University San Diego, CA Loyola Marymount University Los Angeles, CA
Ball State University Muncie, IN Marquette University Milwaukee, WI
Bastyr University Kenmore, WA Miami University, Hamilton Campus Hamilton, OH
Baylor University Waco, TX Ohio State University, Main Campus Columbus, OH
Butte College Oroville, CA Portland State University Portland, OR
Cascadia Community College Bothell, WA Rowan University Glassboro, NJ
Cedar Valley College Lancaster, TX Saint Mary’s College Notre Dame, IN
Chatham University Pittsburgh, PA Seattle University Seattle, WA
DePauw University Greencastle, IN Southern Polytechnic State University Marietta, GA
Des Moines Area Community College Ankeny, IA St. Olaf College Northfield, MN
Drury University Springfield, MO University of California Berkeley, CA
Elizabethtown College Elizabethtown, PA University of California Santa Barbara, CA
Evergreen State College Olympia, WA University of Dallas Irving, TX
George Mason University Fairfax, VA University of Michigan, Ann Arbor Ann Arbor, MI
Georgia Institute of Technology Atlanta, GA University of Minnesota Morris, MN
Gulf Coast Community College Panama City, FL University of North Carolina Chapel Hill, NC
Gustavus Adolphus College Saint Peter, MN University of Oregon Eugene, OR
Hanover College Hanover, IN University of Pennsylvania Philadelphia, PA
Harvard University Cambridge, MA University of Utah Salt Lake City, UT
Howard Community College Columbia, MD University of Virginia Charlottesville, VA
Kankakee Community College Kankakee, IL University of Washington Seattle, WA
Kansas State University Manhattan, KS University of Wisconsin Madison, WI
Lackawanna College Scranton, PA Valencia Community College Orlando, FL
Lafayette College Easton, PA Willamette University Salem, OR

69CAMPUS ENVIRONMENT 2008
Section III
Report CardIn the Executive Summary that introduces this report, three tables show
environmental and sustainability activities with grades beside them. The
tables below show the criteria for those grades based on the percentage
of schools performing each activity. Overall grades were given for
categories of similar activities. The tables here show both the overall
grade and the grade for each component within the category. Also
included are the grades for schools in each region as well as for two-year
and four-year institutions. In many categories, schools in the East get
slightly higher grades than those in other regions as do four-year schools
compared to two-year ones.
The table immediately below shows the criteria for each grade level. This
same grading scale was used for the 2001 Report Card and for the 2008
Report Card to maintain consistency. However, because standards have
often risen over time—such as those used in LEED certification—future
report cards will raise the bar as well and apply a somewhat stricter
grading scale.
Criteria for Grades
% of Schools Performing the Activity Grade
66% — 100% of schools A
60% — 65% A-
54% — 59% B+
46% — 53% B
40% — 45% B-
34% — 39% C+
26% — 33% C
20% — 25% C-
Less than 20% D

70NATIONAL WILDLIFE FEDERATION CAMPUS ECOLOGY
Nationwide East Midwest South West2-Year
Schools4-Year
Schools
% Doing Grade
% Doing Grade
% Doing Grade
% Doing Grade
% Doing Grade
% Doing Grade
% Doing Grade
Setting and Reviewing Goals 53 B 55 B+ 48 B 51 B 63 A- 49 B 57 B+
Conserving energy 72 A 72 A 68 A 71 A 83 A 68 A 76 A
Environmental performance of existing and new buildings
65 A- 68 A 58 B+ 61 A- 76 A 62 A- 67 A
Reducing waste/maximizing recycling 60 A- 68 A 56 B+ 55 B+ 66 A 53 B 65 A-
Conserving water 49 B 44 B- 38 C+ 51 B 63 A- 46 B 51 B
Protecting natural habitats 39 C+ 36 C+ 34 C+ 42 B- 48 B 39 C+ 40 B-
Reducing emissions of carbon dioxide (CO2) and other greenhouse gases
35 C+ 43 B- 31 C 25 C- 44 B- 27 C 40 B-
Staffing of Environmental Programs 43 B- 48 B 40 B- 39 C+ 47 B 33 C 49 B
Recycling coordinator or manager 57 B+ 65 A- 52 B 53 B 60 A- 45 B- 64 A-
Staff person or administrator who leads sustainability issues
51 B 53 B 53 B 45 B- 56 B+ 41 B- 57 B+
Environmental/sustainability task force, committee or council
49 B 56 B+ 50 B 38 C+ 52 B 32 C 59 B+
Energy conservation coordinator or manager
45 B- 50 B 37 C+ 49 B 45 B- 34 C+ 51 B
Green purchasing coordinator or manager
14 D 17 D 9 D 11 D 20 C- 11 D 16 D
Orienting Students, Staff and Faculty 24 C- 29 C 20 C- 20 C- 29 C 16 D 29 C
Students 27 C 35 C+ 24 C- 19 D 31 C 14 D 34 C+
Staff 23 C- 28 C 18 D 21 C- 29 C 17 D 27 C
Faculty 22 C- 24 C- 19 D 19 D 28 C 17 D 25 C-
Integration of Environmental Topics into Academic Programs
32 C 37 C+ 33 C 28 C 32 C 23 C- 38 C+
Natural sciences 63 A- 66 A 64 A- 64 A- 63 A- 55 B+ 70 A
Physical sciences 48 B 53 B 51 B 47 B 46 B 41 B- 54 B+
Health sciences 23 C- 25 C- 25 C- 20 C- 23 C- 18 D 26 C
Social sciences 36 C+ 47 B 40 B- 24 C- 37 C+ 22 C- 46 B
Humanities 28 C 32 C 30 C 23 C- 28 C 15 D 36 C+
Engineering 18 D 23 C- 15 D 14 D 22 C- 13 D 22 C-
Business 22 C- 28 C 24 C- 17 D 23 C- 14 D 28 C
Teacher education 15 D 19 D 16 D 16 D 9 D 5 D 21 C-
Section III
Report Card(cont.)

71CAMPUS ENVIRONMENT 2008
Nationwide East Midwest South West2-Year
Schools4-Year
Schools
% Doing Grade
% Doing Grade
% Doing Grade
% Doing Grade
% Doing Grade
% Doing Grade
% Doing Grade
Professional Development for Faculty on Environmental Topics
36 C+ 36 C+ 41 B- 34 C+ 36 C+ 35 C+ 38 C+
Water Efficiency Upgrades 76 A 73 A 80 A 72 A 79 A 76 A 76 A
Energy Efficiency and Conservation 56 B+ 52 B 58 B+ 53 B 61 A- 55 B+ 57 B+
Lighting efficiency upgrades 81 A 77 A 86 A 78 A 81 A 79 A 82 A
Heating, ventilation and air conditioning upgrades
73 A 73 A 77 A 68 A 76 A 73 A 73 A
Information technology (IT) energy load reductions
66 A 53 B 72 A 66 A 71 A 68 A 66 A
Efficiency standards for new buildings or retrofits of existing buildings
62 A- 55 B+ 64 A- 57 B+ 70 A 64 A- 62 A-
Life-cycle analysis for new buildings or retrofit projects
49 B 44 B- 48 B 46 B 56 B+ 50 B 49 B
LEED certification for new buildings or retrofits of existing buildings
35 C+ 36 C+ 34 C+ 28 C 43 B- 30 C 38 C+
Formal plans for reducing emissions of CO2 and other greenhouse gases
27 C 28 C 25 C- 25 C- 33 C 20 C- 31 C
On-Campus Electricity Generation
Solar electric (photovoltaic) 12 D 15 D 8 D 5 D 16 D 9 D 13 D
Wind 5 D 8 D 7 D 1 D 2 D 3 D 5 D
Biomass 2 D 3 D 3 D 0 D 2 D 0 D 3 D
Other clean sources (landfill gas, fuel cells, etc.)
5 D 6 D 5 D 2 D 2 D 2 D 6 D
On-Campus Heating and Cooling Using On-Site Sources11
14 D 17 D 14 D 14 D 14 D 15 D 14 D
On-Campus CoGenerated Heating and Cooling12
9 D 11 D 9 D 4 D 12 D 7 D 11 D
Electricity Demand Using Off-Campus Renewable Energy13
32 C 38 C+ 30 C 15 D 42 B- 21 C- 37 C+
(11) Percentage of schools that report at least some energy comes from on-site ground-source (geothermal) heat pumps, direct-heat geothermal, solar, biomass, landfill gas, aquifer or lake-source thermal systems.
(12) Percentage of schools that report at least some energy comes from cogenerated heat and electricity (combined heat and power, or CHP) produced by renewables or lower-carbon fuels (fuels other than coal).
(13) Percentage of schools that report at least some energy comes off-campus renewable energy sources, including solar electric (photovoltaic), solar thermal, wind, hydro, geothermal, biomass, landfill gas, fuel cells (excluding nuclear) or purchasing of renewable energy certificates (RECs).
Section III
Report Card(cont.)

72NATIONAL WILDLIFE FEDERATION CAMPUS ECOLOGY
Nationwide East Midwest South West2-Year
Schools4-Year
Schools
% Doing Grade
% Doing Grade
% Doing Grade
% Doing Grade
% Doing Grade
% Doing Grade
% Doing Grade
Waste Diversion 29 C 28 C 30 C 20 C- 35 C+ 31 C 28 C
Activity Level and Array of Materials Recycled
73 A 81 A 76 A 58 B+ 75 A 63 A- 77 A
Higher grades of paper 89 A 89 A 94 A 78 A 90 A 84 A 91 A
Lower grades of paper 85 A 94 A 90 A 68 A 87 A 79 A 88 A
Electronics 84 A 87 A 87 A 78 A 84 A 79 A 86 A
Corrugated cardboard 83 A 92 A 88 A 64 A- 83 A 74 A 86 A
Aluminum cans or containers 82 A 81 A 88 A 73 A 83 A 76 A 85 A
Plastic bottles or jars 69 A 82 A 74 A 49 B 71 A 49 B 79 A
Construction and demolition waste 60 A- 70 A 59 B+ 49 B 63 A- 51 B 64 A-
Glass bottles and jars 55 B+ 78 A 59 B+ 27 C 55 B+ 35 C+ 64 A-
Food scraps or landscape trimmings for composting or mulching
50 B 53 B 47 B 36 C+ 59 B+ 40 B- 54 B+
Landscaping Overall 44 B- 41 B- 48 B 39 C+ 47 B 41 B- 45 B-
Landscaping using native plants or other low-maintenance vegetation
72 A 65 A- 76 A 68 A 79 A 70 A 74 A
Integrated pest management 61 A- 59 B+ 60 A- 56 B+ 69 A 61 A- 62 A-
Habitat restoration 40 B- 32 C 51 B 37 C+ 35 C+ 37 C+ 41 B-
Programs to provide food and shelter to attract wildlife
39 C+ 36 C+ 46 B 32 C 41 B- 39 C+ 40 B-
Identification and removal of invasive exotic species
38 C+ 31 C 41 B- 33 C 43 B- 35 C+ 39 C+
Green roofs on buildings 13 D 22 C- 12 D 7 D 13 D 6 D 16 D
Transportation Demand Management 27 C 24 C- 24 C- 20 C- 38 C+ 22 C- 29 C
Adequate and protected bicycle racks 61 A- 55 B+ 67 A 52 B 67 A 59 B+ 62 A-
Free or discounted bus or public transit passes to students
31 C 29 C 28 C 20 C- 44 B- 27 C 32 C
Free or discounted bus or public transit passes to faculty and staff
21 C- 20 C- 17 D 16 D 32 C 13 D 26 C
A carpooling or vanpooling program 21 C- 23 C- 15 D 12 D 35 C+ 18 D 23 C-
Incentives not to drive alone 13 D 12 D 5 D 6 D 27 C 9 D 15 D
Bicycle lanes 12 D 5 D 14 D 11 D 20 C- 6 D 16 D
Section III
Report Card(cont.)

73CAMPUS ENVIRONMENT 2008
These tables list by state the colleges and universities that were
recognized for having higher levels of sustainability activities
already in place or for having higher levels of “plans to do more.”
Criteria for inclusion as a school with an exemplary program are
provided in Section V.
Section IV
Schools with Exemplary Programs
State School and City Env
iro
nm
en
tal o
r S
ust
ain
abili
ty G
oal
-Set
tin
g
Pla
ns
to D
o M
ore
wit
h G
oal
-Set
tin
g
Env
iro
nm
en
tal &
Su
stai
nab
ility
Pe
rso
nn
el,
Ori
en
tati
on
s
Maj
ors
, Min
ors
& R
eq
uir
ing
Co
urs
es
Inte
rdis
cip
linar
y D
eg
rees
Stu
de
nts
Tak
ing
a C
ou
rse
on
Eco
log
y o
r S
ust
ain
abili
ty
Su
pp
ort
ing
& E
valu
atin
g F
acu
lty
En
erg
y E
ffici
en
cy, C
on
serv
atio
n &
Re
new
able
En
erg
y
Pla
ns
to D
o M
ore
wit
h E
ffici
en
cy, C
on
serv
atio
n &
Re
new
able
s
On
-Cam
pu
s C
lean
En
erg
y S
ou
rces
& C
og
en
era
tio
n
Mo
re t
han
80
% o
f E
ne
rgy
fro
m O
ff-C
amp
us
Re
new
able
s
Tran
spo
rtat
ion
Pro
gra
ms
Pla
ns
to D
o M
ore
wit
h T
ran
spo
rtat
ion
Pro
gra
ms
Re
cycl
ing
, So
lid W
aste
& M
ate
rial
s F
low
Pla
ns
to D
o M
ore
wit
h R
ecy
clin
g, S
olid
Was
te &
Mat
eri
als
Re
cycl
ing
Mo
re t
han
80
% o
f M
un
icip
al W
aste
Gre
en
Lan
dsc
apin
g &
Gro
un
ds
Pla
ns
to d
o M
ore
wit
h G
ree
n L
and
scap
ing
& G
rou
nd
s
AL Alabama Agricultural and Mechanical University, Normal ●Auburn University, Main Campus, Auburn University ●Chattahoochee Valley Community College, Phenix City ●Jefferson Davis Community College, Brewton ●
AR Arkansas State University, Newport ● ●NorthWest Arkansas Community College, Bentonville ●University of Arkansas, Pine Bluff ●
AZ Arizona State University, Tempe ● ● ●Frank Lloyd Wright School of Architecture, Scottsdale ●Mesa Community College, Mesa ●Pima County Community College District, Tucson ●Prescott College, Prescott ●University of Arizona, Tucson ● ● ● ● ● ● ●Yavapai College, Prescott ● ●
CA Alliant International University, San Diego ●Butte College, Oroville ● ● ● California Institute of Technology, Pasadena ●California State Polytechnic University, Pomona ●California State Polytechnic University, San Luis Obispo ● ●California State University, Camarillo ●California State University, Channel Islands, Camarillo ●California State University, Monterey Bay, Seaside ●California State University, Sacramento ●California State University, San Bernardino ●Cogswell Polytechnical College, Sunnyvale ●Coleman College, San Diego ●College of the Canyons, Santa Clarita ● ●College of the Siskiyous, Weed ●Cuyamaca College, El Cajon ●Deep Springs College, Deep Springs ●

74NATIONAL WILDLIFE FEDERATION CAMPUS ECOLOGY
State School and City Env
iro
nm
en
tal o
r S
ust
ain
abili
ty G
oal
-Set
tin
g
Pla
ns
to D
o M
ore
wit
h G
oal
-Set
tin
g
Env
iro
nm
en
tal &
Su
stai
nab
ility
Pe
rso
nn
el,
Ori
en
tati
on
s
Maj
ors
, Min
ors
& R
eq
uir
ing
Co
urs
es
Inte
rdis
cip
linar
y D
eg
rees
Stu
de
nts
Tak
ing
a C
ou
rse
on
Eco
log
y o
r S
ust
ain
abili
ty
Su
pp
ort
ing
& E
valu
atin
g F
acu
lty
En
erg
y E
ffici
en
cy, C
on
serv
atio
n &
Re
new
able
En
erg
y
Pla
ns
to D
o M
ore
wit
h E
ffici
en
cy, C
on
serv
atio
n &
Re
new
able
s
On
-Cam
pu
s C
lean
En
erg
y S
ou
rces
& C
og
en
era
tio
n
Mo
re t
han
80
% o
f E
ne
rgy
fro
m O
ff-C
amp
us
Re
new
able
s
Tran
spo
rtat
ion
Pro
gra
ms
Pla
ns
to D
o M
ore
wit
h T
ran
spo
rtat
ion
Pro
gra
ms
Re
cycl
ing
, So
lid W
aste
& M
ate
rial
s F
low
Pla
ns
to D
o M
ore
wit
h R
ecy
clin
g, S
olid
Was
te &
Mat
eri
als
Re
cycl
ing
Mo
re t
han
80
% o
f M
un
icip
al W
aste
Gre
en
Lan
dsc
apin
g &
Gro
un
ds
Pla
ns
to d
o M
ore
wit
h G
ree
n L
and
scap
ing
& G
rou
nd
s
CA Evergreen Valley College, San Jose ●Feather River Community College District, Quincy ●Life Chiropractic College West, Hayward ●Los Angeles Pierce College, Woodland Hills ●Loyola Marymount University, Los Angeles ●New School of Architecture and Design, San Diego ●Ohlone College, Fremont ●Pacifica Graduate Institute, Carpinteria ●Point Loma Nazarene University, San Diego ● ●Saddleback College, Mission Viejo ●San Diego State University, San Diego ● ●Santa Clara University, Santa Clara ●Santa Rosa Junior College, Santa Rosa ● ●Stanford University, Stanford ● ● ● ●University of California, Berkeley ● ● ●University of California, La Jolla ● ●University of California, Los Angeles ●University of California, Riverside ● ● ●University of California, Santa Barbara ● ● ● ● ●University of California, Santa Cruz ● ●University of San Francisco, San Francisco ●Victor Valley College, Victorville ●Whittier College, Whittier ● ●William Jessup University, Rocklin ●
CO Aims Community College, Greeley ●Colorado College, Colorado Springs ● ● ●Naropa University, Boulder ● ● ● ● ●Northeastern Junior College, Sterling ●University of Colorado and Health Sciences Center, Denver ●University of Colorado, Boulder ● ●University of Denver, Denver ●
CT Hartford Seminary, Hartford ●Sacred Heart University, Fairfield ● ●Southern Connecticut State University, New Haven ●Trinity College, Hartford ●United States Coast Guard Academy, New London ●Yale University, New Haven ● ●
Section IV
Schools with Exemplary Programs
(cont.)

75CAMPUS ENVIRONMENT 2008
State School and City Env
iro
nm
en
tal o
r S
ust
ain
abili
ty G
oal
-Set
tin
g
Pla
ns
to D
o M
ore
wit
h G
oal
-Set
tin
g
Env
iro
nm
en
tal &
Su
stai
nab
ility
Pe
rso
nn
el,
Ori
en
tati
on
s
Maj
ors
, Min
ors
& R
eq
uir
ing
Co
urs
es
Inte
rdis
cip
linar
y D
eg
rees
Stu
de
nts
Tak
ing
a C
ou
rse
on
Eco
log
y o
r S
ust
ain
abili
ty
Su
pp
ort
ing
& E
valu
atin
g F
acu
lty
En
erg
y E
ffici
en
cy, C
on
serv
atio
n &
Re
new
able
En
erg
y
Pla
ns
to D
o M
ore
wit
h E
ffici
en
cy, C
on
serv
atio
n &
Re
new
able
s
On
-Cam
pu
s C
lean
En
erg
y S
ou
rces
& C
og
en
era
tio
n
Mo
re t
han
80
% o
f E
ne
rgy
fro
m O
ff-C
amp
us
Re
new
able
s
Tran
spo
rtat
ion
Pro
gra
ms
Pla
ns
to D
o M
ore
wit
h T
ran
spo
rtat
ion
Pro
gra
ms
Re
cycl
ing
, So
lid W
aste
& M
ate
rial
s F
low
Pla
ns
to D
o M
ore
wit
h R
ecy
clin
g, S
olid
Was
te &
Mat
eri
als
Re
cycl
ing
Mo
re t
han
80
% o
f M
un
icip
al W
aste
Gre
en
Lan
dsc
apin
g &
Gro
un
ds
Pla
ns
to d
o M
ore
wit
h G
ree
n L
and
scap
ing
& G
rou
nd
s
DC George Washington University, Washington ●FL Central Florida Community College, Ocala ●
Eckerd College, Saint Petersburg ● ●Florida Gulf Coast University, Fort Myers ● ● ●Florida Institute of Technology, Melbourne ●Gulf Coast Community College, Panama City ●Nova Southeastern University, Fort Lauderdale ● ●Palm Beach Atlantic University, West Palm Beach ●Valencia Community College, Orlando ●
GA Art Institute of Atlanta, Atlanta ●Atlanta Metropolitan College, Atlanta ●Berry College, Mount Berry ●Clark Atlanta University, Atlanta ●Emory University, Atlanta ● ● ●Fort Valley State University, Fort Valley ●Georgia Institute of Technology, Atlanta ● ● ● ● ● ● ● ● ●Kennesaw State University, Kennesaw ●South Georgia College, Douglas ●Southern Polytechnic State University, Marietta ● ● ● ● ● ● ●Spelman College, Atlanta ●Young Harris College, Young Harris ●
HI University of Hawaii Windward Community College, Kaneohe ● ●
IA Des Moines Area Community College, Ankeny ●Iowa Central Community College, Fort Dodge ●Iowa State University, Ames ● ● ● ●Scott Community College, Bettendorf ●University of Northern Iowa, Cedar Falls ● ●
ID Idaho State University, Pocatello ● ● ● ●University of Idaho, Moscow ●
IL Benedictine University, Lisle ●Eastern Illinois University, Charleston ●Elgin Community College, Elgin ●Illinois Eastern Community Colleges Lincoln Trail College, Robinson ●
Illinois Institute of Technology, Chicago ●Kankakee Community College, Kankakee ● ●
Section IV
Schools with Exemplary Programs
(cont.)

76NATIONAL WILDLIFE FEDERATION CAMPUS ECOLOGY
State School and City Env
iro
nm
en
tal o
r S
ust
ain
abili
ty G
oal
-Set
tin
g
Pla
ns
to D
o M
ore
wit
h G
oal
-Set
tin
g
Env
iro
nm
en
tal &
Su
stai
nab
ility
Pe
rso
nn
el,
Ori
en
tati
on
s
Maj
ors
, Min
ors
& R
eq
uir
ing
Co
urs
es
Inte
rdis
cip
linar
y D
eg
rees
Stu
de
nts
Tak
ing
a C
ou
rse
on
Eco
log
y o
r S
ust
ain
abili
ty
Su
pp
ort
ing
& E
valu
atin
g F
acu
lty
En
erg
y E
ffici
en
cy, C
on
serv
atio
n &
Re
new
able
En
erg
y
Pla
ns
to D
o M
ore
wit
h E
ffici
en
cy, C
on
serv
atio
n &
Re
new
able
s
On
-Cam
pu
s C
lean
En
erg
y S
ou
rces
& C
og
en
era
tio
n
Mo
re t
han
80
% o
f E
ne
rgy
fro
m O
ff-C
amp
us
Re
new
able
s
Tran
spo
rtat
ion
Pro
gra
ms
Pla
ns
to D
o M
ore
wit
h T
ran
spo
rtat
ion
Pro
gra
ms
Re
cycl
ing
, So
lid W
aste
& M
ate
rial
s F
low
Pla
ns
to D
o M
ore
wit
h R
ecy
clin
g, S
olid
Was
te &
Mat
eri
als
Re
cycl
ing
Mo
re t
han
80
% o
f M
un
icip
al W
aste
Gre
en
Lan
dsc
apin
g &
Gro
un
ds
Pla
ns
to d
o M
ore
wit
h G
ree
n L
and
scap
ing
& G
rou
nd
s
IL Loyola University, Chicago ●Northern Illinois University, De Kalb ●University of Illinois, Champaign ● ● ●University of Illinois, Chicago ● ●University of Illinois, Springfield ●
IN Associated Mennonite Biblical Seminary, Elkhart ● ● ●Ball State University, Muncie ● ● ● ●DePauw University, Greencastle ● ● ●Earlham College and Earlham School of Religion, Richmond ● ● ●Franklin College of Indiana, Franklin ●Goshen College, Goshen ●Hanover College, Hanover ● ● ● ●Ivy Tech Community College of Indiana, Kokomo ●Saint Mary’s College, Notre Dame ● ● ●Taylor University, Upland ●University of Saint Francis, Fort Wayne ● ● ●Vincennes University, Vincennes ●
KS Johnson County Community College, Overland Park ● ●Kansas State University, Manhattan ●Northwest Kansas Technical College, Goodland ●Ottawa University, Ottawa ●Pratt Community College, Pratt ● ●University of Saint Mary, Leavenworth ● ●
KY Northern Kentucky University, Highland Heights ● ●LA Dillard University, New Orleans ● ●
Louisiana College, Pineville ●Louisiana Tech University, Ruston ●
MA Amherst College, Amherst ●Bunker Hill Community College, Boston ●Cape Cod Community College, West Barnstable ●Harvard University, Cambridge ● ●Lesley University, Cambridge ●Massachusetts Bay Community College, Wellesley ●
Section IV
Schools with Exemplary Programs
(cont.)

77CAMPUS ENVIRONMENT 2008
State School and City Env
iro
nm
en
tal o
r S
ust
ain
abili
ty G
oal
-Set
tin
g
Pla
ns
to D
o M
ore
wit
h G
oal
-Set
tin
g
Env
iro
nm
en
tal &
Su
stai
nab
ility
Pe
rso
nn
el,
Ori
en
tati
on
s
Maj
ors
, Min
ors
& R
eq
uir
ing
Co
urs
es
Inte
rdis
cip
linar
y D
eg
rees
Stu
de
nts
Tak
ing
a C
ou
rse
on
Eco
log
y o
r S
ust
ain
abili
ty
Su
pp
ort
ing
& E
valu
atin
g F
acu
lty
En
erg
y E
ffici
en
cy, C
on
serv
atio
n &
Re
new
able
En
erg
y
Pla
ns
to D
o M
ore
wit
h E
ffici
en
cy, C
on
serv
atio
n &
Re
new
able
s
On
-Cam
pu
s C
lean
En
erg
y S
ou
rces
& C
og
en
era
tio
n
Mo
re t
han
80
% o
f E
ne
rgy
fro
m O
ff-C
amp
us
Re
new
able
s
Tran
spo
rtat
ion
Pro
gra
ms
Pla
ns
to D
o M
ore
wit
h T
ran
spo
rtat
ion
Pro
gra
ms
Re
cycl
ing
, So
lid W
aste
& M
ate
rial
s F
low
Pla
ns
to D
o M
ore
wit
h R
ecy
clin
g, S
olid
Was
te &
Mat
eri
als
Re
cycl
ing
Mo
re t
han
80
% o
f M
un
icip
al W
aste
Gre
en
Lan
dsc
apin
g &
Gro
un
ds
Pla
ns
to d
o M
ore
wit
h G
ree
n L
and
scap
ing
& G
rou
nd
s
MA Massachusetts College of Art, Boston ●Massachusetts Institute of Technology, Cambridge ● ●Massachusetts Maritime Academy, Buzzards Bay ● ● ● ●Mount Holyoke College, South Hadley ●Northeastern University, Boston ●Quinsigamond Community College, Worcester ● ●Tufts University, Medford ●University of Massachusetts, Boston ● ● ●
MD Anne Arundel Community College, Arnold ●Chesapeake College, Wye Mills ●Howard Community College, Columbia ● ● ●Maryland Institute College of Art, Baltimore ●St. Mary’s College, Saint Mary’s City ●University of Maryland, College Park ●
ME College of the Atlantic, Bar Harbor ● ● ● ●University of Southern Maine, Portland ●
MI Central Michigan University, Mount Pleasant ●Henry Ford Community College, Dearborn ●Kalamazoo College, Kalamazoo ●Michigan State University, East Lansing ● ● ● ● ● ● ●Monroe County Community College, Monroe ●North Central Michigan College, Petoskey ●Rochester College, Rochester Hills ●Saginaw Valley State University, University Center ●University of Michigan, Ann Arbor ● ● ● ● ●
MN Augsburg College, Minneapolis ● ●Bemidji State University, Bemidji ●Carleton College, Northfield ●College of Saint Benedict, Saint Joseph ●Dakota County Technical College, Rosemount ● ●Gustavus Adolphus College, Saint Peter ● ●Northland Community and Technical College, Thief River Falls ●
St. Cloud State University, Saint Cloud ● ● ●St. Olaf College, Northfield ● ● ● ●University of Minnesota, Morris ● ● ●Winona State University, Winona ●
Section IV
Schools with Exemplary Programs
(cont.)

78NATIONAL WILDLIFE FEDERATION CAMPUS ECOLOGY
State School and City Env
iro
nm
en
tal o
r S
ust
ain
abili
ty G
oal
-Set
tin
g
Pla
ns
to D
o M
ore
wit
h G
oal
-Set
tin
g
Env
iro
nm
en
tal &
Su
stai
nab
ility
Pe
rso
nn
el,
Ori
en
tati
on
s
Maj
ors
, Min
ors
& R
eq
uir
ing
Co
urs
es
Inte
rdis
cip
linar
y D
eg
rees
Stu
de
nts
Tak
ing
a C
ou
rse
on
Eco
log
y o
r S
ust
ain
abili
ty
Su
pp
ort
ing
& E
valu
atin
g F
acu
lty
En
erg
y E
ffici
en
cy, C
on
serv
atio
n &
Re
new
able
En
erg
y
Pla
ns
to D
o M
ore
wit
h E
ffici
en
cy, C
on
serv
atio
n &
Re
new
able
s
On
-Cam
pu
s C
lean
En
erg
y S
ou
rces
& C
og
en
era
tio
n
Mo
re t
han
80
% o
f E
ne
rgy
fro
m O
ff-C
amp
us
Re
new
able
s
Tran
spo
rtat
ion
Pro
gra
ms
Pla
ns
to D
o M
ore
wit
h T
ran
spo
rtat
ion
Pro
gra
ms
Re
cycl
ing
, So
lid W
aste
& M
ate
rial
s F
low
Pla
ns
to D
o M
ore
wit
h R
ecy
clin
g, S
olid
Was
te &
Mat
eri
als
Re
cycl
ing
Mo
re t
han
80
% o
f M
un
icip
al W
aste
Gre
en
Lan
dsc
apin
g &
Gro
un
ds
Pla
ns
to d
o M
ore
wit
h G
ree
n L
and
scap
ing
& G
rou
nd
s
MO Drury University, Springfield ● ●Missouri State University, Springfield ●Stephens College, Columbia ● ● ●
MT University of Montana, Dillon ●University of Montana, Missoula ● ● ●
NC Appalachian State University, Boone ● ●Brunswick Community College, Supply ●Catawba College, Salisbury ● ● ●Davidson County Community College, Lexington ●Duke University, Durham ●Elon University, Elon ● ●Halifax Community College, Weldon ●Methodist University, Fayetteville ●Montreat College, Montreat ●Robeson Community College, Lumberton ●University of North Carolina, Chapel Hill ● ● ● ● ● ●University of North Carolina, Pembroke ●Wake Technical Community College, Raleigh ●Warren Wilson College, Asheville ● ● ●Wilson Technical Community College, Wilson ●
ND University of North Dakota, Main Campus, Grand Forks ●NE Chadron State College, Chadron ●NH University of New Hampshire, Durham ●NJ Burlington County College, Pemberton ●
College of New Jersey, Ewing ●Montclair State University, Montclair ●Princeton University, Princeton ●Richard Stockton College, Pomona ●Rowan University, Glassboro ● ●Rutgers State University of New Jersey, Camden ●Rutgers State University of New Jersey, Newark ● ●
NM New Mexico State University, Alamogordo ●NV University of Nevada, Reno ●NY Adelphi University, Garden City ●
Alfred University, Alfred ●Bard College, Annandale-On-Hudson ●Barnard College, New York ●
Section IV
Schools with Exemplary Programs
(cont.)

79CAMPUS ENVIRONMENT 2008
State School and City Env
iro
nm
en
tal o
r S
ust
ain
abili
ty G
oal
-Set
tin
g
Pla
ns
to D
o M
ore
wit
h G
oal
-Set
tin
g
Env
iro
nm
en
tal &
Su
stai
nab
ility
Pe
rso
nn
el,
Ori
en
tati
on
s
Maj
ors
, Min
ors
& R
eq
uir
ing
Co
urs
es
Inte
rdis
cip
linar
y D
eg
rees
Stu
de
nts
Tak
ing
a C
ou
rse
on
Eco
log
y o
r S
ust
ain
abili
ty
Su
pp
ort
ing
& E
valu
atin
g F
acu
lty
En
erg
y E
ffici
en
cy, C
on
serv
atio
n &
Re
new
able
En
erg
y
Pla
ns
to D
o M
ore
wit
h E
ffici
en
cy, C
on
serv
atio
n &
Re
new
able
s
On
-Cam
pu
s C
lean
En
erg
y S
ou
rces
& C
og
en
era
tio
n
Mo
re t
han
80
% o
f E
ne
rgy
fro
m O
ff-C
amp
us
Re
new
able
s
Tran
spo
rtat
ion
Pro
gra
ms
Pla
ns
to D
o M
ore
wit
h T
ran
spo
rtat
ion
Pro
gra
ms
Re
cycl
ing
, So
lid W
aste
& M
ate
rial
s F
low
Pla
ns
to D
o M
ore
wit
h R
ecy
clin
g, S
olid
Was
te &
Mat
eri
als
Re
cycl
ing
Mo
re t
han
80
% o
f M
un
icip
al W
aste
Gre
en
Lan
dsc
apin
g &
Gro
un
ds
Pla
ns
to d
o M
ore
wit
h G
ree
n L
and
scap
ing
& G
rou
nd
s
NY Buffalo State College ●City University of New York Brooklyn College, Brooklyn ●Clarkson University, Potsdam ● ●Hamilton College, Clinton ● ●Hartwick College, Oneonta ●Manhattanville College, Purchase ●Molloy College, Rockville Centre ●Monroe Community College, Rochester ●Niagara University, Niagara University ●Orange County Community College, Middletown ●Paul Smith’s College of Arts and Sciences, Paul Smiths ●State University of New York College of Agriculture and Technology, Morrisville ●
State University of New York College of Environmental Science and Forestry, Syracuse ● ●
State University of New York College of Technology, Delhi ●State University of New York College, Cortland ●State University of New York College, Potsdam ●State University of New York, Stony Brook ● ●Unification Theological Seminary, Barrytown ●
OH Cincinnati State Technical and Community College, Cincinnati ●
Columbus State Community College, Columbus ●Hocking Technical College, Nelsonville ●Kent State University, Main Campus, Kent ●Miami University Hamilton Campus, Hamilton ●Oberlin College, Oberlin ●Ohio State University, Main Campus, Columbus ●Ohio University Southern Campus, Ironton ●Otterbein College, Westerville ●Southwestern College of Business, Cincinnati ●
OK Eastern Oklahoma State College, Wilburton ●Oklahoma State University, Okmulgee ●University of Central Oklahoma, Edmond ● ●University of Oklahoma, Norman ●
OR Lane Community College, Eugene ● ●Linfield College, McMinnville ●
Section IV
Schools with Exemplary Programs
(cont.)

80NATIONAL WILDLIFE FEDERATION CAMPUS ECOLOGY
State School and City Env
iro
nm
en
tal o
r S
ust
ain
abili
ty G
oal
-Set
tin
g
Pla
ns
to D
o M
ore
wit
h G
oal
-Set
tin
g
Env
iro
nm
en
tal &
Su
stai
nab
ility
Pe
rso
nn
el,
Ori
en
tati
on
s
Maj
ors
, Min
ors
& R
eq
uir
ing
Co
urs
es
Inte
rdis
cip
linar
y D
eg
rees
Stu
de
nts
Tak
ing
a C
ou
rse
on
Eco
log
y o
r S
ust
ain
abili
ty
Su
pp
ort
ing
& E
valu
atin
g F
acu
lty
En
erg
y E
ffici
en
cy, C
on
serv
atio
n &
Re
new
able
En
erg
y
Pla
ns
to D
o M
ore
wit
h E
ffici
en
cy, C
on
serv
atio
n &
Re
new
able
s
On
-Cam
pu
s C
lean
En
erg
y S
ou
rces
& C
og
en
era
tio
n
Mo
re t
han
80
% o
f E
ne
rgy
fro
m O
ff-C
amp
us
Re
new
able
s
Tran
spo
rtat
ion
Pro
gra
ms
Pla
ns
to D
o M
ore
wit
h T
ran
spo
rtat
ion
Pro
gra
ms
Re
cycl
ing
, So
lid W
aste
& M
ate
rial
s F
low
Pla
ns
to D
o M
ore
wit
h R
ecy
clin
g, S
olid
Was
te &
Mat
eri
als
Re
cycl
ing
Mo
re t
han
80
% o
f M
un
icip
al W
aste
Gre
en
Lan
dsc
apin
g &
Gro
un
ds
Pla
ns
to d
o M
ore
wit
h G
ree
n L
and
scap
ing
& G
rou
nd
s
OR Mt. Hood Community College, Gresham ●Northwest Christian College, Eugene ●Oregon State University, Corvallis ●Pacific University, Forest Grove ● ● ● ● ● ●Portland State University, Portland ●Southern Oregon University, Ashland ● ● ●University of Oregon, Eugene ● ● ● ●Willamette University, Salem ● ● ● ● ● ● ● ● ● ● ●
PA Bucknell University, Lewisburg ●Chatham University, Pittsburgh ●Delaware Valley College, Doylestown ●Elizabethtown College, Elizabethtown ● ●King’s College, Wilkes-Barre ●Lackawanna College, Scranton ● ● ●Lafayette College, Easton ● ●Lehigh University, Bethlehem ●Messiah College, Grantham ●Penn State Dickinson School of Law, Carlisle ●Robert Morris University, Moon Township ●Rosemont College, Rosemont ●University of Pennsylvania, Philadelphia ● ● ●Widener University, Chester ●Wilkes University, Wilkes-Barre ●
RI Salve Regina University, Newport ●SC Furman University, Greenville ● ●
Medical University of South Carolina, Charleston ●Piedmont Technical College, Greenwood ●University of South Carolina, Columbia ● ●
TN East Tennessee State University, Johnson City ●Lane College, Jackson ●Lipscomb University, Nashville ●Southern Adventist University, Collegedale ●University of Memphis, Memphis ● ●Watkins College of Art & Design, Watkins Film School, Nashville ● ●
TX Baylor University, Waco ● ●Cedar Valley College, Lancaster ● ●
Section IV
Schools with Exemplary Programs
(cont.)

81CAMPUS ENVIRONMENT 2008
State School and City Env
iro
nm
en
tal o
r S
ust
ain
abili
ty G
oal
-Set
tin
g
Pla
ns
to D
o M
ore
wit
h G
oal
-Set
tin
g
Env
iro
nm
en
tal &
Su
stai
nab
ility
Pe
rso
nn
el,
Ori
en
tati
on
s
Maj
ors
, Min
ors
& R
eq
uir
ing
Co
urs
es
Inte
rdis
cip
linar
y D
eg
rees
Stu
de
nts
Tak
ing
a C
ou
rse
on
Eco
log
y o
r S
ust
ain
abili
ty
Su
pp
ort
ing
& E
valu
atin
g F
acu
lty
En
erg
y E
ffici
en
cy, C
on
serv
atio
n &
Re
new
able
En
erg
y
Pla
ns
to D
o M
ore
wit
h E
ffici
en
cy, C
on
serv
atio
n &
Re
new
able
s
On
-Cam
pu
s C
lean
En
erg
y S
ou
rces
& C
og
en
era
tio
n
Mo
re t
han
80
% o
f E
ne
rgy
fro
m O
ff-C
amp
us
Re
new
able
s
Tran
spo
rtat
ion
Pro
gra
ms
Pla
ns
to D
o M
ore
wit
h T
ran
spo
rtat
ion
Pro
gra
ms
Re
cycl
ing
, So
lid W
aste
& M
ate
rial
s F
low
Pla
ns
to D
o M
ore
wit
h R
ecy
clin
g, S
olid
Was
te &
Mat
eri
als
Re
cycl
ing
Mo
re t
han
80
% o
f M
un
icip
al W
aste
Gre
en
Lan
dsc
apin
g &
Gro
un
ds
Pla
ns
to d
o M
ore
wit
h G
ree
n L
and
scap
ing
& G
rou
nd
s
TX Concordia University, Austin ●Eastfield College, Mesquite ●Grayson County College, Denison ●Huston-Tillotson University, Austin ●North Lake College, Irving ● ●Palo Alto College, San Antonio ●Texas A & M University, Commerce ●Texas A & M University, Galveston ●University of Dallas, Irving ●University of Texas Medical Branch, Galveston ● ●University of Texas, Arlington ● ●University of Texas, El Paso, El Paso ●
UT Salt Lake Community College, Salt Lake City ●University of Utah, Salt Lake City ● ●Utah State University, Logan ●
VA Ferrum College, Ferrum ●George Mason University, Fairfax ●Lynchburg College, Lynchburg ●Mary Baldwin College, Staunton ●Randolph-Macon College, Ashland ●University of Virginia, Charlottesville ● ● ● ●
VT Goddard College, Plainfield ●Landmark College, Putney ●Lyndon State College, Lyndonville ●Middlebury College, Middlebury ● ● ● ●Sterling College, Craftsbury Common ● ●University of Vermont, Burlington ●Vermont Technical College, Randolph Center ●
WA Bastyr University, Kenmore ● ● ●Cascadia Community College, Bothell ● ● ● ● ● ●Clover Park Technical College, Lakewood ●Columbia Basin College, Pasco ● ●Evergreen State College, Olympia ● ● ●Lake Washington Technical College, Kirkland ●Olympic College, Bremerton ●
Section IV
Schools with Exemplary Programs
(cont.)
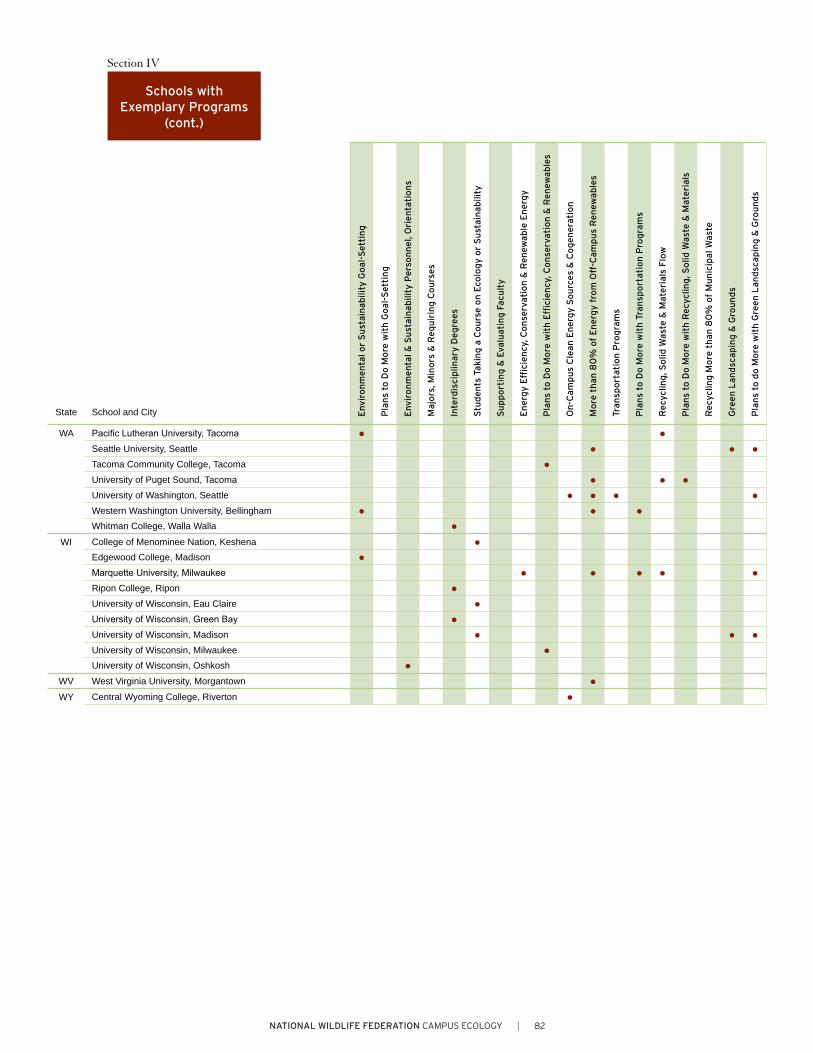
82NATIONAL WILDLIFE FEDERATION CAMPUS ECOLOGY
State School and City Env
iro
nm
en
tal o
r S
ust
ain
abili
ty G
oal
-Set
tin
g
Pla
ns
to D
o M
ore
wit
h G
oal
-Set
tin
g
Env
iro
nm
en
tal &
Su
stai
nab
ility
Pe
rso
nn
el,
Ori
en
tati
on
s
Maj
ors
, Min
ors
& R
eq
uir
ing
Co
urs
es
Inte
rdis
cip
linar
y D
eg
rees
Stu
de
nts
Tak
ing
a C
ou
rse
on
Eco
log
y o
r S
ust
ain
abili
ty
Su
pp
ort
ing
& E
valu
atin
g F
acu
lty
En
erg
y E
ffici
en
cy, C
on
serv
atio
n &
Re
new
able
En
erg
y
Pla
ns
to D
o M
ore
wit
h E
ffici
en
cy, C
on
serv
atio
n &
Re
new
able
s
On
-Cam
pu
s C
lean
En
erg
y S
ou
rces
& C
og
en
era
tio
n
Mo
re t
han
80
% o
f E
ne
rgy
fro
m O
ff-C
amp
us
Re
new
able
s
Tran
spo
rtat
ion
Pro
gra
ms
Pla
ns
to D
o M
ore
wit
h T
ran
spo
rtat
ion
Pro
gra
ms
Re
cycl
ing
, So
lid W
aste
& M
ate
rial
s F
low
Pla
ns
to D
o M
ore
wit
h R
ecy
clin
g, S
olid
Was
te &
Mat
eri
als
Re
cycl
ing
Mo
re t
han
80
% o
f M
un
icip
al W
aste
Gre
en
Lan
dsc
apin
g &
Gro
un
ds
Pla
ns
to d
o M
ore
wit
h G
ree
n L
and
scap
ing
& G
rou
nd
s
WA Pacific Lutheran University, Tacoma ● ●Seattle University, Seattle ● ● ●Tacoma Community College, Tacoma ●University of Puget Sound, Tacoma ● ● ●University of Washington, Seattle ● ● ● ●Western Washington University, Bellingham ● ● ●Whitman College, Walla Walla ●
WI College of Menominee Nation, Keshena ●Edgewood College, Madison ●Marquette University, Milwaukee ● ● ● ● ●Ripon College, Ripon ●University of Wisconsin, Eau Claire ●University of Wisconsin, Green Bay ●University of Wisconsin, Madison ● ● ●University of Wisconsin, Milwaukee ●University of Wisconsin, Oshkosh ●
WV West Virginia University, Morgantown ●WY Central Wyoming College, Riverton ●
Section IV
Schools with Exemplary Programs
(cont.)

83CAMPUS ENVIRONMENT 2008
For schools identified as having exemplary programs or committed-
to-doing-more in the report, the following table describes the criteria
and cutoffs used for determining why they were selected. Schools
with exemplary programs currently meet the criteria — based on the
2008 survey findings — while committed schools plan to do more in
areas identified below.
Section V
Criteria for Exemplary Programs
TABLE PAGE CRITERIA CUTOFF
Management Exemplary Schools for Environmental or Sustainability Goal-Setting
21
Must have a written declaration committing to the promotion of environmental sustainability or stewardship (Q1=1), have a written declaration that educating students about environmental sustainability or stewardship is part of its academic mission (Q2=1) and set and reviews goals (Q3A, items a-f).
Includes schools that meet the first two criteria and set and review goals in at least 5 of the 6 total activities.
ManagementSchools Committed to Doing More with Environmental or Sustainability Goal-Setting
22Must plan to do more in setting and reviewing goals (Q3B, items a-f).
Includes all schools that plan to do more in setting and reviewing goals and written policies in at least 5 of the 6 total activities.
ManagementExemplary Schools for Employing Environmental and Sustainability Personnel, and Offering an Orientation or Publication
22
Must have a staff person or administrator who leads sustainability issues (Q4Aa=1), an environmental/sustainability task force, committee or council (Q4Ab=1), a recycling coordinator or manager (Q4Ac=1), an energy conservation coordinator or manager (Q4Ad=1), a green purchasing coordinator or manager (Q4Ae=1), and offer an orientation or publication about campus-focused sustainability or environmental programs to students (Q6A=1), faculty (Q6B=1) and staff (Q6C=1).
Includes all schools that meet these criteria.
AcademicsExemplary Schools for Offering Majors and Minors and Requiring Environmental or Sustainability Courses
32
Must offer undergraduates the option of environmental or sustainability studies as a major (Q11A=1) and minor (Q11B=1) and require all or most students to take at least one course related to the environment (Q13=1 or 2).
Includes all schools that meet these criteria.
AcademicsExemplary Schools for Having Recruiting Programs and Offering Interdisciplinary Degrees in Environmental or Sustainability Studies
33-34
Must offer undergraduates an interdisciplinary degree in environmental or sustainability studies (Q11C=1) and have a recruiting program to attract students interested in studying environmental and sustainability issues (Q14=1).
Includes all schools that meet these criteria.
AcademicsExemplary Schools for Students Taking a Course on Ecology or Sustainability
35
Must have more than 75% of total undergraduate student body, regardless of department, have taken by graduation at least one course addressing basic functions of the earth’s natural systems (Q15A=5) and issues or topics related to human activity and environmental sustainability (Q15B=5).
Includes all schools that meet these criteria.
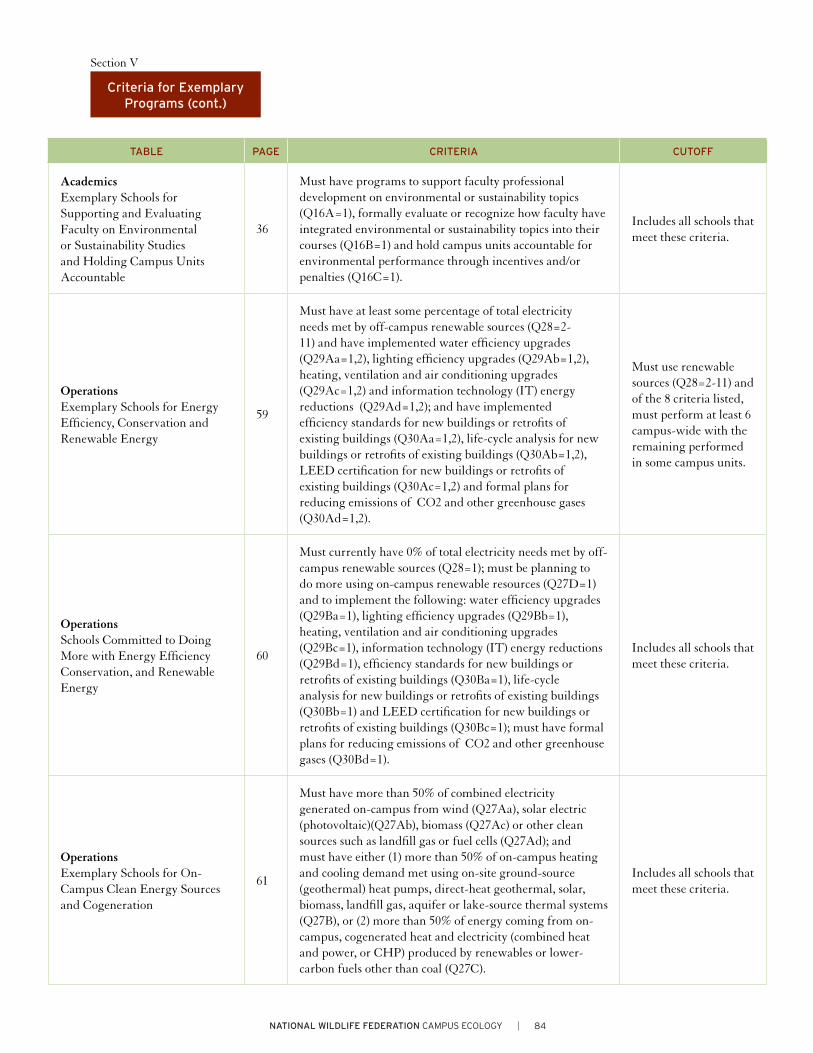
84NATIONAL WILDLIFE FEDERATION CAMPUS ECOLOGY
TABLE PAGE CRITERIA CUTOFF
AcademicsExemplary Schools for Supporting and Evaluating Faculty on Environmental or Sustainability Studies and Holding Campus Units Accountable
36
Must have programs to support faculty professional development on environmental or sustainability topics (Q16A=1), formally evaluate or recognize how faculty have integrated environmental or sustainability topics into their courses (Q16B=1) and hold campus units accountable for environmental performance through incentives and/or penalties (Q16C=1).
Includes all schools that meet these criteria.
OperationsExemplary Schools for Energy Efficiency, Conservation and Renewable Energy
59
Must have at least some percentage of total electricity needs met by off-campus renewable sources (Q28=2-11) and have implemented water efficiency upgrades (Q29Aa=1,2), lighting efficiency upgrades (Q29Ab=1,2), heating, ventilation and air conditioning upgrades (Q29Ac=1,2) and information technology (IT) energy reductions (Q29Ad=1,2); and have implemented efficiency standards for new buildings or retrofits of existing buildings (Q30Aa=1,2), life-cycle analysis for new buildings or retrofits of existing buildings (Q30Ab=1,2), LEED certification for new buildings or retrofits of existing buildings (Q30Ac=1,2) and formal plans for reducing emissions of CO2 and other greenhouse gases (Q30Ad=1,2).
Must use renewable sources (Q28=2-11) and of the 8 criteria listed, must perform at least 6 campus-wide with the remaining performed in some campus units.
OperationsSchools Committed to Doing More with Energy Efficiency Conservation, and Renewable Energy
60
Must currently have 0% of total electricity needs met by off-campus renewable sources (Q28=1); must be planning to do more using on-campus renewable resources (Q27D=1) and to implement the following: water efficiency upgrades (Q29Ba=1), lighting efficiency upgrades (Q29Bb=1), heating, ventilation and air conditioning upgrades (Q29Bc=1), information technology (IT) energy reductions (Q29Bd=1), efficiency standards for new buildings or retrofits of existing buildings (Q30Ba=1), life-cycle analysis for new buildings or retrofits of existing buildings (Q30Bb=1) and LEED certification for new buildings or retrofits of existing buildings (Q30Bc=1); must have formal plans for reducing emissions of CO2 and other greenhouse gases (Q30Bd=1).
Includes all schools that meet these criteria.
OperationsExemplary Schools for On-Campus Clean Energy Sources and Cogeneration
61
Must have more than 50% of combined electricity generated on-campus from wind (Q27Aa), solar electric (photovoltaic)(Q27Ab), biomass (Q27Ac) or other clean sources such as landfill gas or fuel cells (Q27Ad); and must have either (1) more than 50% of on-campus heating and cooling demand met using on-site ground-source (geothermal) heat pumps, direct-heat geothermal, solar, biomass, landfill gas, aquifer or lake-source thermal systems (Q27B), or (2) more than 50% of energy coming from on-campus, cogenerated heat and electricity (combined heat and power, or CHP) produced by renewables or lower-carbon fuels other than coal (Q27C).
Includes all schools that meet these criteria.
Section V
Criteria for Exemplary Programs (cont.)

85CAMPUS ENVIRONMENT 2008
TABLE PAGE CRITERIA CUTOFF
OperationsExemplary Schools for Which More than 80% of Energy Comes from Off-Campus Renewable Sources
62Must have more than 80% of campus’s total electricity demand met by off-campus renewable sources (Q28=10, 11).
Includes all schools that meet this criteria.
OperationsExemplary Schools forTransportation Programs
63
Must have free or discounted bus or public transit passes for students (Q36Aa=1,2), free or discounted bus or public transit passes for faculty and staff (Q36Ab=1,2), a carpooling or vanpooling program (Q36Ac=1,2), incentives not to drive alone (Q36Ad=1,2), adequate and protected bicycle racks (Q36Ae=1,2), bicycle lanes (Q36Af=1,2) and at least some vehicles powered by renewable sources of energy (Q42=2-11).
Must have all 6 transportation programs and at least 5 of the six campus-wide.
OperationsSchools Committed to Doing More With Transportation Programs
64
Must have plans to do more with free or discounted bus or public transit passes for students (Q36Ba=1), free or discounted bus or public transit passes for faculty and staff (Q36Bb=1), a carpooling or vanpooling program (Q36Bc=1), incentives not to drive alone (Q36Bd=1), adequate and protected bicycle racks (Q36Be=1) and bicycle lanes (Q36Bf=1).
Includes all schools that meet these criteria.
OperationsExemplary Schools for Recycling, Solid Waste and Materials Flow
65
Must recycle higher grades of paper (Q18Aa=1,2), lower grades of paper (Q18Ab=1,2), corrugated cardboard (Q18Ac=1,2), aluminum cans or containers (Q18Ad=1,2), glass bottles and jars (Q18Ae=1,2), plastic bottles and jars (Q18Af=1,2), food scraps or landscape trimmings for composting or mulching (Q18Ag=1,2), construction and demolition waste (Q18Ah=1,2) and electronics (Q18Ai=1,2); must have a materials exchange program (Q19A=1,2), encourage environmentally friendly or sustainable purchasing (Q21A=1,2), reduce the need for paper hard copies (Q22Aa=1,2), encourage lab courses to implement microscale experiments (Q22Ab=1,2), specify that office paper must contain a minimum of 25% post-consumer waste (Q20Aa=1,2) and specify that office paper be chlorine-free (Q20Ab=1,2).
Must perform at least 12 of these, and of the 12 or more, must perform at least 10 campus-wide.
Section V
Criteria for Exemplary Programs (cont.)

86NATIONAL WILDLIFE FEDERATION CAMPUS ECOLOGY
TABLE PAGE CRITERIA CUTOFF
OperationsSchools Committed to Doing More with Recycling, Solid Waste and Materials Flow
66
Must have plans to do more with recycling 9 types of goods: higher grades of paper (Q18Ba=1), lower grades of paper (Q18Bb=1), corrugated cardboard (Q18Bc=1), aluminum cans or containers (Q18Bd=1), glass bottles and jars (Q18Be=1), plastic bottles or jars (Q18Bf=1), food scraps or landscape trimmings for composting or mulching (Q18Bg=1), construction and demolition waste (Q18Bh=1) and electronics (Q18Bi=1); must have plans to do more with 6 types of activities: materials exchange program (Q19B=1), encouraging environmentally friendly or sustainable purchasing (Q21B=1), reducing the need for paper hard copies (Q22Ba=1), encouraging lab courses to implement microscale experiments (Q22Bb=1), specifying that office paper purchased must contain a minimum of 25% post-consumer waste (Q20Ba=1) and specifying that office paper be chlorine-free (Q20Bb=1).
Includes all schools that meet this criteria.
OperationsExemplary Schools for Recycling More than 80% of Total Municipal Solid Waste Generated
67Must recycle more than 80% of the total municipal waste generated (Q23B=10, 11).
Includes all schools that meet this criteria.
OperationsExemplary Schools for Green Landscaping and Grounds Management Programs
67
Must perform all 6 types of activities related to landscaping and grounds: habitat restoration (Q24Aa=1,2), landscaping using native plants or other low-maintenance vegetation (Q24Ab=1,2), identification and removal of invasive exotic species (Q24Ac=1,2), integrated pest management Q24Ad=1,2), programs to provide food and shelter to attract wildlife (Q24Ae=1,2) and green roofs on buildings Q24Af=1,2).
Must perform all 6 activities and perform at least 4 of the 6 campus-wide.
Operations Schools Committed to Doing More with Green Landscaping and Grounds Management Programs
68
Must have plans to do more in 6 types of activities related to landscaping and grounds management: habitat restoration (Q24Ba=1), landscaping using native plants or other low-maintenance vegetation (Q24Bb=1), identification and removal of invasive exotic species (Q24Bc=1), integrated pest management (Q24Bd=1), programs to provide food and shelter to attract wildlife(Q24Be=1) and green roofs on buildings (Q24Bf=1).
Includes all schools that meet these criteria.
Section V
Criteria for Exemplary Programs (cont.)

87CAMPUS ENVIRONMENT 2008
Section VI
Methods, Review Process, and Rationale
Methods
National Wildlife Federation’s (NWF) Campus Environment 2008: A National Report Card on Sustainability in Higher Education, is based on online questionnaires completed by chancellors, presidents, vice presidents, executive officers, provosts, deans, vice presidents of administration, chiefs of facilities or plant operations, sustainability directors or sustainability coordinators of accredited, degree-granting U.S. higher education institutions. The survey was conducted January 17 through May 14, 2008, by Princeton Survey Research Associates International (PSRAI). In consultation with NWF, PSRAI designed the questionnaire, including the online survey interface, managed the fieldwork, processed the data collected, and with NWF wrote the analytical report. The survey updates NWF’s 2001 benchmark survey, conducted December 6, 2000, through April 19, 2001, by PSRAI.
As with the 2001 NWF survey, schools and their administrators were identified through the 2008 Higher Education Directory of Higher Education Publications, Inc.This source lists accredited four-year and two-year degree-granting U.S. colleges and universities, as well as the names of and contact information for administrators at these schools.14 The 2008 Directory lists 3,923 eligible institutions in the United States.15 A total of eight schools were removed from the sample during fieldwork because the schools had closed or did not qualify as a four- or two-year school. Consequently, the full sample for the 2008 survey consists of 3,915 colleges and universities.
At each school we attempted to administer two separate surveys: one survey targeting the campus chancellor or president and a second survey targeting the vice president of administration or the chief of facilities or plant operations. The Topline report gives the set of questions included in each survey. In general, the chancellor and president were contacted to answer questions about the campus’s overall environmental management and sustainability strategy and about how environmental and sustainability issues are addressed in the curriculum. The vice president of administration and chief of facilities or plant operations were asked about the details of campus programs for waste, energy, grounds and transportation.
As explained in greater detail below, provosts were contacted to complete the survey when reliable contact information was not available for the individuals who were contacted initially. Or, the individuals contacted by PSRAI often forwarded the survey to other individuals at their school. Consequently, in addition to surveys completed by the individuals we contacted (chancellors, presidents, vice presidents of administration, chiefs of facilities or plant operations, and provosts), surveys were sometimes completed by other individuals such as deans, executive officers, facilities engineers, sustainability directors, sustainability coordinators and faculty.
(14) For purposes of inclusion in the Higher Education Directory, accreditation means any of the following: the institution is accredited at the college level by an accrediting agency recognized by the U.S. Secretary of Education; the institution holds pre-accredited status with such an agency (whose designation of pre-accreditation status is recognized by the U.S. Secretary of Education); or the institution is accredited at the college level by an agency recognized by the Council on Postsecondary Accreditation (COPA)/Commission on Recognition of Postsecondary Accreditation (COPRA).
(15) The Directory also lists college- and university-system offices, but these were excluded in favor of surveying only individual institutions. In the case of schools organized within a system, all affiliated institutions were invited separately to participate in the study. Respondents were instructed to answer the questions for their campus only. Thus, for this study, “school” and “institution” mean “campus.” Schools located in a U.S. Territory were excluded.

88NATIONAL WILDLIFE FEDERATION CAMPUS ECOLOGY
Section VI
Methods, Review Process, and Rationale (cont.)
Methods (cont.)
At the start of the fieldwork, each school’s chancellor or president was sent a hard copy letter explaining the study and inviting him or her to participate in the chancellors/presidents survey. This communication was followed up by email invitations to the vice president of administration or chief of facilities or plant operations. For all respondents for whom we had an email address (including presidents and chancellors), up to five reminder messages were sent to encourage participation. All letters and emails contained a list of sponsors and cosponsors for the study, as well as contact information for NWF and PSRAI.
Each respondent was assigned a unique username and password pair to gain access to the survey and identify his or her responses. Users could take the survey at any time of day or night, seven days a week, and could stop the survey at any time and return later to finish it. The web site for the online survey was monitored for indication of technical trouble, and users were able to email PSRAI with any questions or problems.
A total of 1,237 surveys were completed during fieldwork. For the chancellors/presidents survey, at least one chancellor or president was contacted at all 3,915 schools obtained from the 2008 Higher Education Directory. A total of 667 schools completed a survey that was sent to their chancellor or president. Results based on the full sample of 667 completed surveys have a margin of error of +/- 4. For the vice presidents of administration/facilities survey, 2,617 vice presidents of administration, chiefs of facilities or chiefs of plant operations were contacted, and an additional 213 provosts were contacted to replace bounced emails. A total of 570 schools completed a survey that was sent to their vice president of administration, chief of facilities or plant operations or provost. Results based on the full sample of 570 completed surveys have a margin of error of +/- 4.
A total of 899 schools completed one of the surveys and 169 schools completed both surveys. Hence, at least one survey was completed by 1,068 schools, representing 27 percent of all institutions of higher education in the United States. A combined total of 1,960 schools participated in the 2008 survey (1,068 schools) and 2001 survey (892 schools), including 348 schools that participated in both 2001 and 2008. Both surveys were studies in which all two- and four-year colleges and universities that met the criteria for the study were invited to participate. The exact same methodology was applied in 2001 and 2008—an online survey with multiple reminders and a long field period starting in the second half of the academic year, which allowed college and universities substantial time to participate. As such, there is no reason to assume that the 2001 and 2008 surveys are not comparable or that they are not representative of the environmental and sustainability activities of colleges and universities nationwide. Further confirming this point, the overall demographics of schools that completed both the 2001 and 2008 surveys match the demographic profile of schools nationwide.

89CAMPUS ENVIRONMENT 2008
Section VI
Methods, Review Process, and Rationale (cont.)
Methods (cont.)
Because every question on the survey may not apply to every school, all submitted surveys were included in this study regardless of how many questions were completed. This approach provides maximum information on a given topic and enables the perspectives of a wide variety of schools to be included. Overall, the key demographic characteristics (enrollment size, region of the country and urbanity) of the schools that completed the surveys match fairly closely the demographic characteristics of the full sample obtained from the 2008 Higher Education Directory. A weight was applied to the data to correct for a slight overrepresentation of public schools (two- and four-year) and a slight underrepresentation of private schools (two- and four-year).
We have three reasons for believing that the sample is not overly skewed towards respondents who wanted to use the survey to highlight exemplary programs: First, several campuses we know of that have exemplary programs did not respond to the survey. Second, significant numbers of respondents admitted to having little or no programming in place. Third, in some of the responses to an open-ended question at the end of the survey, respondents admitted to struggling with environmental and sustainability programming and feeling that their campus is just beginning.
Data collected from the online surveys was supplemented by data on institutional characteristics, enrollment, staff and expenditures available in the 2008 Higher Education Directory, as well as through the Integrated Postsecondary Education Data System (IPEDS), administered by the Bureau of the Census for the National Center for Education Statistics. The latest IPEDS data available was for the 2004-2005 academic year.

90NATIONAL WILDLIFE FEDERATION CAMPUS ECOLOGY
Section VI
Methods, Review Process, and Rationale (cont.)
Review Process
The 2008 survey was developed and revised through an extensive review process, beginning in summer 2007. NWF, in consultation with PSRAI, made three key changes to the 2001 survey. First, in order to streamline participation, the 2008 survey was divided into two separate surveys: one for chancellors/presidents and the other for vice presidents of administration/facilities. Provosts were contacted to complete either survey when the initial contact information was not valid. (In 2001, three separate surveys were conducted: for presidents, provosts and heads of facilities.) Second, many questions from the 2001 survey that yielded a high rate of non-response were removed (e.g., quantity of water consumed) and many open-ended responses were replaced with closed-ended scales. Finally, new questions were added to the 2008 survey to reflect changes on U.S. campuses, from administrative practices to energy conservation.
NWF solicited feedback to improve the survey questions from leaders in environmental organizations, campus-based administrators and staff, faculty and other environmental professionals. Throughout the peer review process, NWF carefully reviewed feedback and made revisions to the questionnaire when appropriate. Many people generously offered hours of their time in clarifying comments, refining technical components and reviewing particular sections of the survey. These people are noted in the acknowledgments section of this report. The survey went through four substantive revisions prior to the pilot as NWF worked with PSRAI and peers to refine indicators for environmental management, curriculum, landscaping, transportation, energy and materials. Balancing the need to collect detailed qualitative and quantitative information with the desire for a high response rate necessitated many tough decisions about what to include and leave out of the survey.
A pilot test of the survey was conducted December 2007 through early January 2008. The pilot was distributed by PSRAI to 22 individuals from a wide variety of schools who held positions similar to the individuals targeted for the survey. In addition, PSRAI tested the survey instrument extensively to check for logical errors. Once changes from the pilot process were incorporated, PSRAI began distributing the survey.
Rationale
The goal of this project was to measure progress since the 2001 survey across a range of environmental and sustainability issues, and to continue to address an important gap in available information on higher education performance. While extensive information is available on most other aspects of performance—such as enrollments, costs, state regulations, competitiveness and demographics—no such source on environmental and sustainability performance existed prior to the 2001 survey. NWF felt it important to document changes in activities and trends since the original survey, build upon their understanding of the evolving “greening” of higher education, identify opportunities, highlight outstanding precedents and generate healthy debate.
Recognizing the vital importance of leadership for sustainability in higher education, NWF launched the Campus Ecology Program in 1989. With the support of generous foundations and members, they have since worked with groups at over a third of the nation’s colleges and universities, providing consultation, training clinics, publications and fellowships. This survey project is part of NWF’s larger mission to inspire Americans to protect wildlife for our children’s future.

91CAMPUS ENVIRONMENT 2008
State School and LocationChancellors &
Presidents Survey
Vice Presidents of Adm. & Facilities
SurveyTotal
AK University of Alaska Southeast, Juneau ●
Total 0 1 1
AL Alabama Agricultural and Mechanical University, Normal ●
Athens State University, Athens ●
Auburn University, Montgomery ●
Auburn University, Auburn ●
Calhoun Community College, Decatur ● ●
Chattahoochee Valley Community College, Phenix City ●
Enterprise-Ozark Community College, Enterprise ●
Gadsden State Community College, Gadsden ●
J.F. Drake State Technical College, Huntsville ●
Jefferson Davis Community College, Brewton ●
Spring Hill College, Mobile ●
Stillman College, Tuscaloosa ●
Troy University, Troy ● ●
United States Sports Academy, Daphne ●
University of West Alabama, Livingston ●
Total 12 5 17
AR Arkansas State University, Newport ● ●
Cossatot Community College of the University of Arkansas, De Queen ●
East Arkansas Community College, Forrest City ●
Henderson State University, Arkadelphia ●
North Arkansas College, Harrison ●
NorthWest Arkansas Community College, Bentonville ●
Ozarka College, Melbourne ●
South Arkansas Community College, El Dorado ●
Southern Arkansas University Tech, Camden ●
University of Arkansas, Monticello ●
University of Arkansas, Pine Bluff ● University of Arkansas Community College, Batesville ●
Total 6 7 13
AZ Arizona State University, Tempe ● ●
Arizona Western College, Yuma ●
Central Arizona College, Coolidge ●
Chandler-Gilbert Community College, Chandler ●
Coconino County Community College, Flagstaff ●
Frank Lloyd Wright School of Architecture, Scottsdale ●
Mesa Community College, Mesa ●
Northcentral University, Prescott Valley ●
Northland Pioneer College, Holbrook ●
Phoenix Seminary, Phoenix ●
Pima County Community College District, Tucson ● ●
Prescott College, Prescott ●
Rio Salado College, Tempe ●
Scottsdale Community College, Scottsdale ●
Thunderbird School of Global Management, Glendale ●
Section VII
Distribution and List of Participating Schools

92NATIONAL WILDLIFE FEDERATION CAMPUS ECOLOGY
State School and LocationChancellors &
Presidents Survey
Vice Presidents of Adm. & Facilities
SurveyTotal
AZ Tiger Waking College of Asian Medicine, Scottsdale ●
Universal Technical Institute, Avondale ●
University of Arizona, Tucson ● ●
University of Phoenix, Phoenix ●
Yavapai College, Prescott ●
Total 13 10 23
CA Alliant International University, San Diego ●
Argosy University, Alameda ●
Art Institute of California, Orange County, Santa Ana ●
Azusa Pacific University, Azusa ●
Bakersfield College, Bakersfield ●
Barstow Community College District, Barstow ●
Butte College, Oroville ●
California Institute of Integral Studies, San Francisco ●
California Institute of Technology, Pasadena ● ●
California Lutheran University, Thousand Oaks ●
California State Polytechnic University, Pomona ● ●
California State Polytechnic University, San Luis Obispo ●
California State University, Camarillo ●
California State University, Fresno ●
California State University, Sacramento ● ●
California State University, San Bernardino ●
California State University, San Marcos ●
California State University, Channel Islands, Camarillo ●
California State University, Monterey Bay, Seaside ●
Cerritos College, Norwalk ● ●
Citrus College, Glendora ●
Cogswell Polytechnical College, Sunnyvale ●
Coleman College, San Diego ●
College of the Canyons, Santa Clarita ●
College of the Siskiyous, Weed ● ●
Cosumnes River College, Sacramento ● ●
Crafton Hills College, Yucaipa ●
Cuyamaca College, El Cajon ● ●
Deep Springs College, Deep Springs ●
Empire College School of Business, Santa Rosa ●
Evergreen Valley College, San Jose ●
Feather River Community College District, Quincy ●
Graduate Theological Union, Berkeley ●
Irvine Valley College, Irvine ●
La Sierra University, Riverside ●
Life Chiropractic College West, Hayward ●
Los Angeles Pierce College, Woodland Hills ● ●
Los Angeles Valley College, Valley Glen ● ●
Loyola Marymount University, Los Angeles ●
Monterey Institute of International Studies, Monterey ●
National University, La Jolla ●
Naval Postgraduate School, Monterey ●
NewSchool of Architecture and Design, San Diego ●
Northwestern Polytechnic University, Fremont ●
Section VII
Distribution and List of Participating Schools (cont.)

93CAMPUS ENVIRONMENT 2008
State School and LocationChancellors &
Presidents Survey
Vice Presidents of Adm. & Facilities
SurveyTotal
CA Ohlone College, Fremont ●
Pacifica Graduate Institute, Carpinteria ●
Pardee RAND Graduate School of Policy Studies, Santa Monica ●
Point Loma Nazarene University, San Diego ● ●
Redwoods Community College District, Eureka ●
Saddleback College, Mission Viejo ●
Samuel Merritt College, Oakland ●
San Bernardino Valley College, San Bernardino ●
San Diego City College, San Diego ●
San Diego State University, San Diego ●
San Joaquin College of Law, Clovis ●
Santa Barbara City College, Santa Barbara ●
Santa Clara University, Santa Clara ●
Santa Monica College, Santa Monica ●
Santa Rosa Junior College, Santa Rosa ●
Stanford University, Stanford ● ●
Thomas Jefferson School of Law, San Diego ●
Touro University, Vallejo ●
University of California, Berkeley ●
University of California, La Jolla ●
University of California, Los Angeles ●
University of California, Riverside ●
University of California, Santa Barbara ● ●
University of California, Santa Cruz ● ●
University of LaVerne, La Verne ●
University of San Francisco, San Francisco ●
University of Southern California, Los Angeles ●
Victor Valley College, Victorville ●
West Hills College Lemoore, Lemoore ●
West Valley College, Saratoga ●
Western University of Health Sciences, Pomona ●
Whittier College, Whittier ●
William Jessup University, Rocklin ● Wright Institute, Berkeley ●
Total 45 46 91
CO Aims Community College, Greeley ● ●
Colorado College, Colorado Springs ● ●
Colorado School of Mines, Golden ●
Naropa University, Boulder ●
National Theatre Conservatory, Denver ●
Northeastern Junior College, Sterling ●
Regis University, Denver ●
Rocky Mountain College of Art & Design, Lakewood ●
University of Colorado, Boulder ●
University of Colorado and Health Sciences Center, Denver ● University of Denver, Denver ●
Total 6 7 13
Section VII
Distribution and List of Participating Schools (cont.)

94NATIONAL WILDLIFE FEDERATION CAMPUS ECOLOGY
State School and LocationChancellors &
Presidents Survey
Vice Presidents of Adm. & Facilities
SurveyTotal
CT Central Connecticut State University, New Britain ●
Eastern Connecticut State University, Willimantic ● ●
Gateway Community College, New Haven ●
Goodwin College, East Hartford ●
Hartford Seminary, Hartford ●
Middlesex Community Technical College, Middletown ●
Naugatuck Valley Community College, Waterbury ●
Post University, Waterbury ●
Quinebaug Valley Community College, Danielson ●
Sacred Heart University, Fairfield ●
Saint Joseph College, West Hartford ●
Southern Connecticut State University, New Haven ● ●
Trinity College, Hartford ●
Tunxis Community College, Farmington ●
United States Coast Guard Academy, New London ●
Wesleyan University, Middletown ●
Yale University, New Haven ● ●
Total 11 9 20
DC American University, Washington ● ●
George Washington University, Washington ●
Georgetown University, Washington ●
National Defense University, Washington ● Wesley Theological Seminary, Washington ●
Total 2 4 6
DE Delaware State University, Dover ● ●
University of Delaware, Newark ●
Wesley College, Dover ●
Total 2 2 4
FL Argosy University, Sarasota ●
Baptist College of Florida, Graceville ●
Bethune Cookman College, Daytona Beach ●
Central Florida Community College, Ocala ● ●
Chipola College, Marianna ● ●
Eckerd College, Saint Petersburg ●
Edward Waters College, Jacksonville ●
Florida Atlantic University, Boca Raton ●
Florida College, Temple Terrace ●
Florida Gulf Coast University, Fort Myers ● ●
Florida Institute of Technology, Melbourne ●
Florida Keys Community College, Key West ●
Florida Southern College, Lakeland ●
Florida State University, Tallahassee ●
Gulf Coast Community College, Panama City ●
Hillsborough Community College, Tampa ●
Lake City Community College, Lake City ●
Lynn University, Boca Raton ●
Nova Southeastern University, Fort Lauderdale ●
Section VII
Distribution and List of Participating Schools (cont.)

95CAMPUS ENVIRONMENT 2008
State School and LocationChancellors &
Presidents Survey
Vice Presidents of Adm. & Facilities
SurveyTotal
FL Okaloosa-Walton College, Niceville ●
Palm Beach Atlantic University, West Palm Beach ●
Palm Beach Community College, Lake Worth ●
Pensacola Junior College, Pensacola ●
Polk Community College, Winter Haven ● ●
Ringling College of Art and Design, Sarasota ●
Seminole Community College, Sanford ●
South Florida Community College, Avon Park ● ●
Stetson University, DeLand ●
Trinity Baptist College, Jacksonville ●
University of Florida, Gainesville ●
University of North Florida, Jacksonville ● ● Valencia Community College, Orlando ●
Total 17 21 38
GA Agnes Scott College, Decatur ●
Albany State University, Albany ●
Armstrong Atlantic State University, Savannah ●
Art Institute of Atlanta, Atlanta ● ●
Atlanta Christian College, East Point ●
Atlanta Metropolitan College, Atlanta ●
Berry College, Mount Berry ●
Central Georgia Technical College, Macon ●
Chattahoochee Technical College, Marietta ●
Clark Atlanta University, Atlanta ●
Coastal Georgia Community College, Brunswick ●
Coosa Valley Technical College, Rome ●
Dalton State College, Dalton ●
Darton College, Albany ● ●
East Georgia College, Swainsboro ●
Emory University, Atlanta ●
Flint River Technical College, Thomaston ●
Fort Valley State University, Fort Valley ●
Georgia Institute of Technology, Atlanta ● ●
Interdenominational Theological Center, Atlanta ●
Kennesaw State University, Kennesaw ●
Lanier Technical College, Oakwood ●
Life University, Marietta ●
Moultrie Technical College, Moultrie ●
North Georgia College & State University, Dahlonega ●
North Georgia Technical College, Clarkesville ●
Reinhardt College, Waleska ●
Sandersville Technical College, Sandersville ●
South Georgia College, Douglas ●
Southern Polytechnic State University, Marietta ● ●
Southwest Georgia Technical College, Thomasville ●
Spelman College, Atlanta ●
Swainsboro Technical College, Swainsboro ● ●
Thomas University, Thomasville ●
University of West Georgia, Carrollton ●
Section VII
Distribution and List of Participating Schools (cont.)

96NATIONAL WILDLIFE FEDERATION CAMPUS ECOLOGY
State School and LocationChancellors &
Presidents Survey
Vice Presidents of Adm. & Facilities
SurveyTotal
GA Valdosta State University, Valdosta ●
West Georgia Technical College, LaGrange ●
Young Harris College, Young Harris ●
Total 29 14 43
HI Brigham Young University Hawaii Campus, Laie Oahu ●
Hawaii Tokai International College, Honolulu ●
Kapiolani Community College, Honolulu ●
TransPacific Hawaii College, Honolulu ●
University of Hawaii Windward Community College, Kaneohe ●
Total 3 2 5
IA AIB College of Business, Des Moines ●
Buena Vista University, Storm Lake ●
Central College, Pella ●
Clarke College, Dubuque ●
Cornell College, Mount Vernon ●
Des Moines Area Community College, Ankeny ● ●
Des Moines University, Des Moines ●
Divine Word College, Epworth ●
Graceland University, Lamoni ● ●
Grinnell College, Grinnell ●
Iowa Central Community College, Fort Dodge ●
Iowa State University, Ames ●
Kirkwood Community College, Cedar Rapids ●
Luther College, Decorah ●
Mercy College of Health Sciences, Des Moines ●
Scott Community College, Bettendorf ●
Simpson College, Indianola ●
Southwestern Community College, Creston ●
University of Northern Iowa, Cedar Falls ●
Vennard College, University Park ●
Wartburg College, Waverly ● Western Iowa Tech Community College, Sioux City ●
Total 12 12 24
ID Albertson College, Caldwell ●
Idaho State University, Pocatello ● ● University of Idaho, Moscow ●
Total 2 2 4
IL Augustana College, Rock Island ●
Aurora University, Aurora ●
Benedictine University, Lisle ●
Blackburn College, Carlinville ● ●
Bradley University, Peoria ●
Chicago Theological Seminary, Chicago ●
City Colleges of Chicago Olive-Harvey College, Chicago ●
Danville Area Community College, Danville ●
Eastern Illinois University, Charleston ● ●
Elgin Community College, Elgin ●
Section VII
Distribution and List of Participating Schools (cont.)
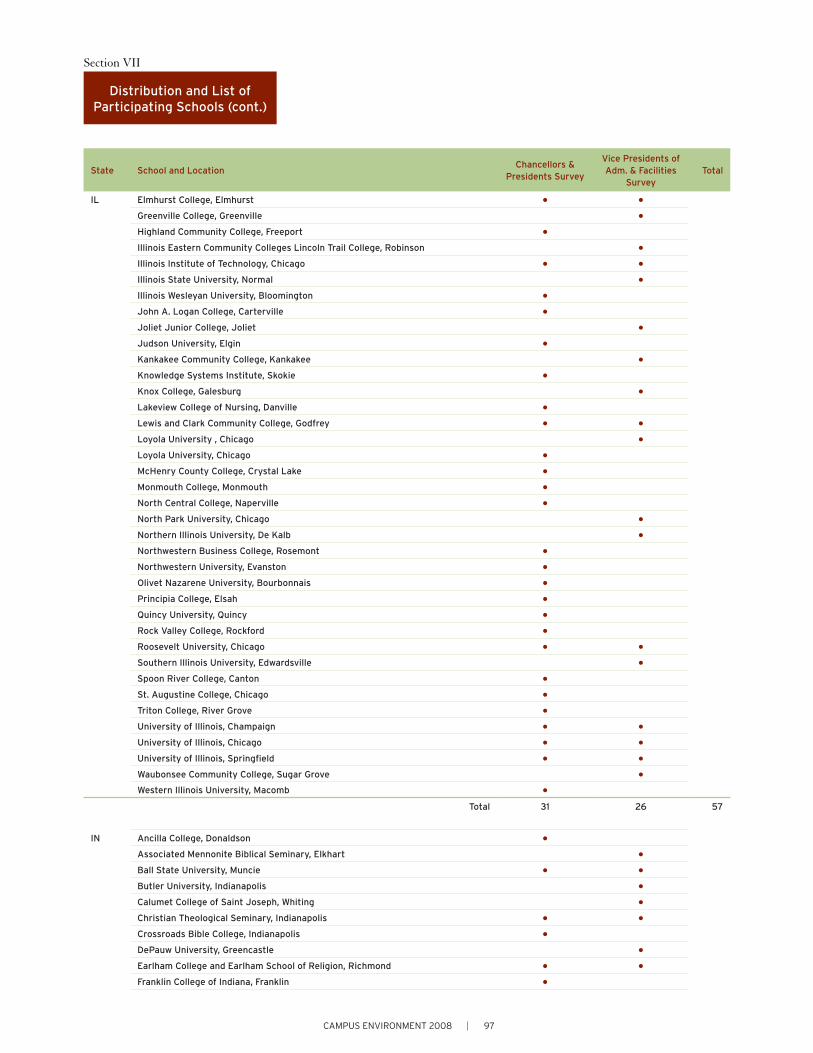
97CAMPUS ENVIRONMENT 2008
State School and LocationChancellors &
Presidents Survey
Vice Presidents of Adm. & Facilities
SurveyTotal
IL Elmhurst College, Elmhurst ● ●
Greenville College, Greenville ●
Highland Community College, Freeport ●
Illinois Eastern Community Colleges Lincoln Trail College, Robinson ●
Illinois Institute of Technology, Chicago ● ●
Illinois State University, Normal ●
Illinois Wesleyan University, Bloomington ●
John A. Logan College, Carterville ●
Joliet Junior College, Joliet ●
Judson University, Elgin ●
Kankakee Community College, Kankakee ●
Knowledge Systems Institute, Skokie ●
Knox College, Galesburg ●
Lakeview College of Nursing, Danville ●
Lewis and Clark Community College, Godfrey ● ●
Loyola University , Chicago ●
Loyola University, Chicago ●
McHenry County College, Crystal Lake ●
Monmouth College, Monmouth ●
North Central College, Naperville ●
North Park University, Chicago ●
Northern Illinois University, De Kalb ●
Northwestern Business College, Rosemont ●
Northwestern University, Evanston ●
Olivet Nazarene University, Bourbonnais ●
Principia College, Elsah ●
Quincy University, Quincy ●
Rock Valley College, Rockford ●
Roosevelt University, Chicago ● ●
Southern Illinois University, Edwardsville ●
Spoon River College, Canton ●
St. Augustine College, Chicago ●
Triton College, River Grove ●
University of Illinois, Champaign ● ●
University of Illinois, Chicago ● ●
University of Illinois, Springfield ● ●
Waubonsee Community College, Sugar Grove ● Western Illinois University, Macomb ●
Total 31 26 57
IN Ancilla College, Donaldson ●
Associated Mennonite Biblical Seminary, Elkhart ●
Ball State University, Muncie ● ●
Butler University, Indianapolis ●
Calumet College of Saint Joseph, Whiting ●
Christian Theological Seminary, Indianapolis ● ●
Crossroads Bible College, Indianapolis ●
DePauw University, Greencastle ●
Earlham College and Earlham School of Religion, Richmond ● ●
Franklin College of Indiana, Franklin ●
Section VII
Distribution and List of Participating Schools (cont.)

98NATIONAL WILDLIFE FEDERATION CAMPUS ECOLOGY
State School and LocationChancellors &
Presidents Survey
Vice Presidents of Adm. & Facilities
SurveyTotal
IN Goshen College, Goshen ● ●
Hanover College, Hanover ●
Indiana Business College, Lafayette ●
Indiana University-Purdue University, Indianapolis ●
Ivy Tech Community College of Indiana, Gary ●
Ivy Tech Community College of Indiana, Kokomo ● ●
Manchester College, North Manchester ●
Marian College, Indianapolis ●
Purdue University Main Campus, West Lafayette ●
Rose-Hulman Institute of Technology, Terre Haute ●
Saint Mary-of-the-Woods College, St Mary-of-the-Woods ●
Saint Mary’s College, Notre Dame ●
Taylor University, Fort Wayne ●
Taylor University, Upland ● ●
University of Saint Francis, Fort Wayne ● ●
Valparaiso University, Valparaiso ●
Vincennes University, Vincennes ●
Total 17 17 34
KS Allen County Community College, Iola ●
Garden City Community College, Garden City ●
Haskell Indian Nations University, Lawrence ●
Johnson County Community College, Overland Park ●
Kansas City Kansas Community College, Kansas City ●
Kansas State University, Manhattan ●
Neosho County Community College, Chanute ●
Newman University, Wichita ●
North Central Kansas Technical College, Beloit ●
Northwest Kansas Technical College, Goodland ●
Ottawa University, Ottawa ●
Pratt Community College, Pratt ●
Tabor College, Hillsboro ●
United States Army Command and General Staff College, Ft. Leavenworth ●
University of Kansas, Lawrence ●
University of Saint Mary, Leavenworth ● Washburn University, Topeka ●
Total 6 11 17
KY Ashland Community and Technical College, Ashland ●
Beckfield College, Florence ●
Centre College, Danville ●
Eastern Kentucky University, Richmond ● ●
Georgetown College, Georgetown ●
Henderson Community College, Henderson ●
Kentucky Christian University, Grayson ●
Mid-Continent University, Mayfield ● ●
Northern Kentucky University, Highland Heights ● ●
Owensboro Community and Technical College, Owensboro ●
Section VII
Distribution and List of Participating Schools (cont.)

99CAMPUS ENVIRONMENT 2008
State School and LocationChancellors &
Presidents Survey
Vice Presidents of Adm. & Facilities
SurveyTotal
KY Southeast Kentucky Community and Technical College, Cumberland ●
Thomas More College, Crestview Hills ●
Union College, Barbourville ●
Total 8 8 16
LA Baton Rouge Community College, Baton Rouge ●
Dillard University, New Orleans ●
Louisiana College, Pineville ●
Louisiana State University, Alexandria ●
Louisiana State University, Shreveport ● ●
Louisiana Tech University, Ruston ●
Louisiana Technical College, Shreveport ● ●
Louisiana Technical College, Lafayette ●
Nicholls State University, Thibodaux ●
Northwestern State University, Natchitoches ●
Our Lady of Holy Cross College, New Orleans ●
South Louisiana Community College, Lafayette ●
Southern University, New Orleans ● ●
University of Louisiana, Monroe ●
University of Louisiana, Lafayette ●
Total 10 8 18
MA Amherst College, Amherst ●
Assumption College, Worcester ●
Atlantic Union College, South Lancaster ●
Babson College, Babson Park ●
Brandeis University, Waltham ●
Bunker Hill Community College, Boston ● ●
Cape Cod Community College, West Barnstable ●
Framingham State College, Framingham ●
Harvard University, Cambridge ●
Lasell College, Newton ●
Lesley University, Cambridge ●
Massachusetts Bay Community College, Wellesley ●
Massachusetts College of Art, Boston ● ●
Massachusetts Institute of Technology, Cambridge ● ●
Massachusetts Maritime Academy, Buzzards Bay ● ●
Middlesex Community College, Bedford ●
Mount Holyoke College, South Hadley ●
Mount Ida College, Newton Centre ●
Mount Wachusett Community College, Gardner ●
New England College of Optometry, Boston ●
New England School of Acupuncture, Newton ●
Nichols College, Dudley ● ●
North Shore Community College, Danvers ●
Northeastern University, Boston ●
Quinsigamond Community College, Worcester ●
Salem State College, Salem ●
School of the Museum of Fine Arts, Boston ●
Smith College, Northampton ●
Section VII
Distribution and List of Participating Schools (cont.)

100NATIONAL WILDLIFE FEDERATION CAMPUS ECOLOGY
State School and LocationChancellors &
Presidents Survey
Vice Presidents of Adm. & Facilities
SurveyTotal
MA Tufts University, Medford ●
University of Massachusetts, Boston ● ●
University of Massachusetts, Dartmouth ●
University of Massachusetts, North Dartmouth ●
Wentworth Institute of Technology, Boston ● ●
Westfield State College, Westfield ●
Weston Jesuit School of Theology, Cambridge ●
Worcester Polytechnic Institute, Worcester ● Worcester State College, Worcester ●
Total 25 19 44
MD Anne Arundel Community College, Arnold ●
Baltimore City Community College, Baltimore ●
Bowie State University, Bowie ●
Chesapeake College, Wye Mills ●
Frederick Community College, Frederick ●
Goucher College, Towson ●
Harford Community College, Bel Air ●
Hood College, Frederick ●
Howard Community College, Columbia ●
Loyola College, Baltimore ●
Maryland Institute College of Art, Baltimore ● ●
Morgan State University, Baltimore ●
St. Mary’s College , Saint Mary’s City ●
Towson University, Baltimore ●
University of Maryland, College Park ● Washington College, Chestertown ●
Total 4 13 17
ME Bowdoin College, Brunswick ●
Central Maine Medical Center School of Nursing, Lewiston ●
College of the Atlantic, Bar Harbor ●
University of Maine, Fort Kent ●
University of Maine, Presque Isle ● University of Southern Maine, Portland ●
Total 4 2 6
MI Alpena Community College, Alpena ●
Central Michigan University, Mount Pleasant ●
Charles S. Mott Community College, Flint ●
Concordia University, Ann Arbor ●
Delta College, University Center ●
Ecumenical Theological Seminary, Detroit ●
Ferris State University, Big Rapids ●
Glen Oaks Community College, Centreville ●
Henry Ford Community College, Dearborn ●
Jackson Community College, Jackson ●
Kalamazoo College, Kalamazoo ● ●
Kettering University, Flint ●
Kirtland Community College, Roscommon ●
Section VII
Distribution and List of Participating Schools (cont.)

101CAMPUS ENVIRONMENT 2008
State School and LocationChancellors &
Presidents Survey
Vice Presidents of Adm. & Facilities
SurveyTotal
MI Kuyper College, Grand Rapids ● ●
Lake Michigan College, Benton Harbor ● ●
Madonna University, Livonia ●
Michigan State University, East Lansing ● ●
Monroe County Community College, Monroe ● ●
Montcalm Community College, Sidney ●
North Central Michigan College, Petoskey ●
Northern Michigan University, Marquette ●
Rochester College, Rochester Hills ●
Saginaw Valley State University, University Center ●
Siena Heights University, Adrian ●
Spring Arbor University, Spring Arbor ●
Thomas M. Cooley Law School, Lansing ●
University of Michigan, Ann Arbor ● ●
University of Michigan, Dearborn ●
University of Michigan, Flint ●
Walsh College of Accountancy and Business Administration, Troy ● ●
West Shore Community College, Scottville ● ● Western Michigan University, Kalamazoo ●
Total 18 22 40
MN Adler Graduate School, Richfield ●
Augsburg College, Minneapolis ●
Bemidji State University, Bemidji ●
Carleton College, Northfield ● ●
Central Lakes College, Brainerd ●
College of Saint Benedict, Saint Joseph ●
College of Saint Catherine, St. Paul ●
College of Saint Scholastica, Duluth ●
Concordia University, St. Paul ●
Dakota County Technical College, Rosemount ●
Gustavus Adolphus College, Saint Peter ●
Hamline University, St. Paul ● ●
Inver Hills Community College, Inver Grove Heights ●
Leech Lake Tribal College, Cass Lake ●
Macalester College, St. Paul ● ●
Minneapolis College of Art Design, Minneapolis ●
Minneapolis Community and Technical College, Minneapolis ●
Minnesota State University, Mankato ●
Minnesota State University, Moorhead ●
Northland Community and Technical College, Thief River Falls ●
Northwestern College, St. Paul ●
Riverland Community College, Austin ● ●
Rochester Community and Technical College, Rochester ●
Saint John’s University, Collegeville ●
St. Cloud State University, Saint Cloud ● ●
St. Olaf College, Northfield ●
University of Minnesota, Crookston ●
University of Minnesota, Duluth ●
University of Minnesota, Morris ● ●
Section VII
Distribution and List of Participating Schools (cont.)
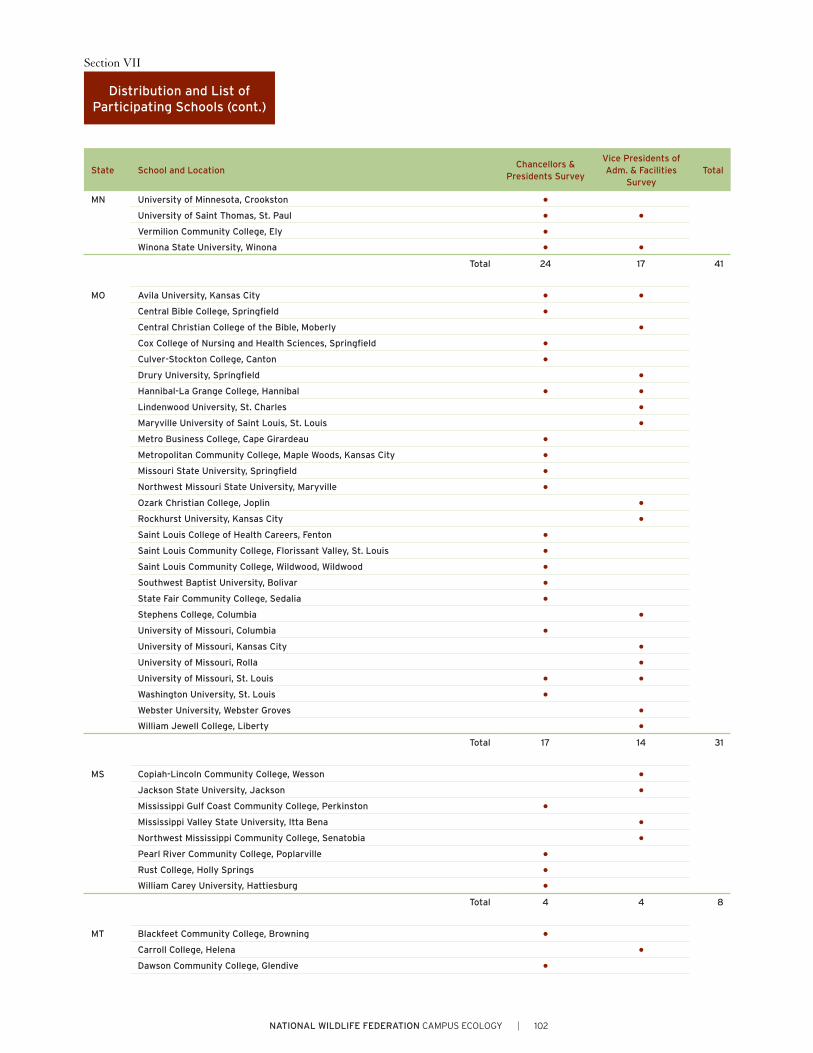
102NATIONAL WILDLIFE FEDERATION CAMPUS ECOLOGY
State School and LocationChancellors &
Presidents Survey
Vice Presidents of Adm. & Facilities
SurveyTotal
MN University of Minnesota, Crookston ●
University of Saint Thomas, St. Paul ● ●
Vermilion Community College, Ely ●
Winona State University, Winona ● ●
Total 24 17 41
MO Avila University, Kansas City ● ●
Central Bible College, Springfield ●
Central Christian College of the Bible, Moberly ●
Cox College of Nursing and Health Sciences, Springfield ●
Culver-Stockton College, Canton ●
Drury University, Springfield ●
Hannibal-La Grange College, Hannibal ● ●
Lindenwood University, St. Charles ●
Maryville University of Saint Louis, St. Louis ●
Metro Business College, Cape Girardeau ●
Metropolitan Community College, Maple Woods, Kansas City ●
Missouri State University, Springfield ●
Northwest Missouri State University, Maryville ●
Ozark Christian College, Joplin ●
Rockhurst University, Kansas City ●
Saint Louis College of Health Careers, Fenton ●
Saint Louis Community College, Florissant Valley, St. Louis ●
Saint Louis Community College, Wildwood, Wildwood ●
Southwest Baptist University, Bolivar ●
State Fair Community College, Sedalia ●
Stephens College, Columbia ●
University of Missouri, Columbia ●
University of Missouri, Kansas City ●
University of Missouri, Rolla ●
University of Missouri, St. Louis ● ●
Washington University, St. Louis ●
Webster University, Webster Groves ● William Jewell College, Liberty ●
Total 17 14 31
MS Copiah-Lincoln Community College, Wesson ●
Jackson State University, Jackson ●
Mississippi Gulf Coast Community College, Perkinston ●
Mississippi Valley State University, Itta Bena ●
Northwest Mississippi Community College, Senatobia ●
Pearl River Community College, Poplarville ●
Rust College, Holly Springs ●
William Carey University, Hattiesburg ●
Total 4 4 8
MT Blackfeet Community College, Browning ●
Carroll College, Helena ●
Dawson Community College, Glendive ●
Section VII
Distribution and List of Participating Schools (cont.)

103CAMPUS ENVIRONMENT 2008
State School and LocationChancellors &
Presidents Survey
Vice Presidents of Adm. & Facilities
SurveyTotal
MT University of Great Falls, Great Falls ●
University of Montana, Dillon ● University of Montana, Missoula ●
Total 3 3 6
NC Appalachian State University, Boone ●
Art Institute of Charlotte, Charlotte ●
Brunswick Community College, Supply ● ●
Cabarrus College of Health Sciences, Concord ●
Campbell University, Buies Creek ●
Cape Fear Community College, Wilmington ●
Catawba College, Salisbury ● ●
Catawba Valley Community College, Hickory ● ●
Davidson College, Davidson ●
Davidson County Community College, Lexington ●
Duke University, Durham ●
Elizabeth City State University, Elizabeth City ●
Elon University, Elon ●
Gardner-Webb University, Boiling Springs ●
Halifax Community College, Weldon ●
Haywood Community College, Clyde ● ●
Isothermal Community College, Spindale ●
Johnson & Wales University, Charlotte ●
Lenoir Community College, Kinston ●
Livingstone College, Salisbury ●
Martin Community College, Williamston ●
Methodist University, Fayetteville ●
Montgomery Community College, Troy ●
Montreat College, Montreat ● ●
Mount Olive College, Mount Olive ●
North Carolina School of the Arts, Winston-Salem ●
Peace College, Raleigh ●
Pfeiffer University, Misenheimer ●
Piedmont Community College, Roxboro ● ●
Pitt Community College, Winterville ●
Richmond Community College, Hamlet ●
Robeson Community College, Lumberton ●
Sandhills Community College, Pinehurst ●
Surry Community College, Dobson ●
Tri-County Community College, Murphy ●
University of North Carolina, Chapel Hill ●
University of North Carolina, Charlotte ●
University of North Carolina, Pembroke ● ●
University of North Carolina, Wilmington ●
Vance-Granville Community College, Henderson ●
Wake Technical Community College, Raleigh ● ●
Section VII
Distribution and List of Participating Schools (cont.)

104NATIONAL WILDLIFE FEDERATION CAMPUS ECOLOGY
State School and LocationChancellors &
Presidents Survey
Vice Presidents of Adm. & Facilities
SurveyTotal
NC Warren Wilson College, Asheville ● ●
Western Piedmont Community College, Morganton ●
Wilson Technical Community College, Wilson ●
Wingate University, Wingate ●
Total 31 23 54
ND Cankdeska Cikana Community College, Fort Totten ●
Dickinson State University, Dickinson ●
Mayville State University, Mayville ●
Medcenter One College of Nursing, Bismarck ●
North Dakota State College of Science, Wahpeton ●
University of Mary, Bismarck ●
University of North Dakota, Grand Forks ●
Total 4 3 7
NE Chadron State College, Chadron ●
Dana College, Blair ●
Hastings College, Hastings ●
Metropolitan Community College, Omaha ●
Mid-Plains Community College, North Platte ●
Nebraska Wesleyan University, Lincoln ●
Universal College of Healing Arts, Omaha ●
University of Nebraska, Omaha ● ●
Wayne State College, Wayne ●
Western Nebraska Community College, Scotts Bluff ●
Total 7 4 11
NH Granite State College, Concord ●
Keene State College, Keene ●
McIntosh College, Dover ●
New England College, Henniker ●
New Hampshire Community Technical College, Manchester ●
Plymouth State University, Plymouth ●
University of New Hampshire, Durham ●
University of New Hampshire, Manchester ●
Total 7 1 8
NJ Atlantic Cape Community College, Mays Landing ●
Brookdale Community College, Lincroft ●
Burlington County College, Pemberton ●
Camden County College, Blackwood ●
College of New Jersey, Ewing ● ●
Drew University, Madison ●
Gloucester County College, Sewell ●
Mercer County Community College, Trenton ●
Monmouth University, West Long Branch ●
Montclair State University, Montclair ●
New Jersey Institute of Technology, Newark ●
Ocean County College, Toms River ●
Princeton University, Princeton ●
Richard Stockton College, Pomona ●
Section VII
Distribution and List of Participating Schools (cont.)

105CAMPUS ENVIRONMENT 2008
State School and LocationChancellors &
Presidents Survey
Vice Presidents of Adm. & Facilities
SurveyTotal
NJ Rider University, Lawrenceville ●
Rowan University, Glassboro ● ●
Rutgers State University of New Jersey, Camden ●
Rutgers State University of New Jersey, Newark ● ●
Salem Community College, Carneys Point ●
UMDNJ School of Health Related Professions, Newark ●
Union County College, Cranford ● William Paterson University, Wayne ●
Total 16 9 25
NM Central New Mexico Community College, Albuquerque ●
Inst. of American Indian & Alaska Native Culture & Arts, Santa Fe ●
Luna Community College, Las Vegas ●
Mesalands Community College, Tucumcari ●
New Mexico Institute of Mining and Technology, Socorro ●
New Mexico State University, Alamogordo ●
New Mexico State University, Carlsbad ●
New Mexico State University Grants Branch, Grants ●
San Juan College, Farmington ●
University of New Mexico, Taos ●
University of New Mexico, Albuquerque ● University of New Mexico, Valencia, Los Lunas ● ●
Total 8 5 13
NV University of Nevada, Reno ● Western Nevada College, Carson City ●
Total 0 2 2
NY Adelphi University, Garden City ●
Alfred University, Alfred ●
Bard College, Annandale-On-Hudson ● ●
Barnard College, New York ●
Berkeley College, New York ●
Bryant & Stratton College, Amherst ●
Buffalo State College ●
Canisius College, Buffalo ●
Cayuga County Community College, Auburn ●
City University of New York Brooklyn College, Brooklyn ●
City University of New York City College, New York ●
City University of New York College, Staten Island ●
City University of New York Herbert H. Lehman College, Bronx ●
City University of New York Hostos Community College, Bronx ●
City University of New York Queens College, Flushing ●
Clarkson University, Potsdam ●
Cold Spring Harbor Lab./Watson Sch. of Bio. Sciences, Cold Spring Harbor ●
Colgate Rochester Crozer Divinity School, Rochester ●
Cornell University, Ithaca ●
Fashion Institute of Technology, New York ●
Fordham University, Bronx ●
Genesee Community College, Batavia ● ●
Hamilton College, Clinton ●
Hartwick College, Oneonta ●
Section VII
Distribution and List of Participating Schools (cont.)

106NATIONAL WILDLIFE FEDERATION CAMPUS ECOLOGY
State School and LocationChancellors &
Presidents Survey
Vice Presidents of Adm. & Facilities
SurveyTotal
NY Houghton College, Houghton ●
Ithaca College, Ithaca ●
Jamestown Community College, Jamestown ●
Jewish Theological Seminary of America, New York ●
Katharine Gibbs School, Melville ●
Laboratory Institute of Merchandising, New York ●
Le Moyne College, Syracuse ●
Manhattan College, Bronx ●
Manhattanville College, Purchase ●
Marymount Manhattan College, New York ●
Metropolitan College of New York, New York ●
Molloy College, Rockville Centre ●
Monroe Community College, Rochester ●
New York College of Traditional Chinese Medicine, Mineola ●
New York Institute of Technology Main Campus, Old Westbury ●
New York University, New York ●
Niagara County Community College, Sanborn ●
Niagara University, Niagara University ●
Orange County Community College, Middletown ●
Paul Smith’s College of Arts and Sciences, Paul Smiths ●
Pratt Institute, Brooklyn ●
Rockefeller University, New York ●
Schenectady County Community College, Schenectady ●
School of Visual Arts, New York ●
St. Lawrence University, Canton ●
St. Thomas Aquinas College, Sparkill ●
State University of New York, Albany ●
State University of New York, Buffalo ●
State University of New York, Cortland ●
State University of New York, Fredonia ●
State University of New York, Oswego ●
State University of New York, Potsdam ● ●
State University of New York, Purchase ●
State University of New York, Stony Brook ●
State University of New York College of Agriculture and Technology, Cobleskill ●
State University of New York College of Agriculture and Technology, Morrisville ●
State University of New York College of Environ. Science & Forestry, Syracuse ●
State University of New York College of Optometry, New York ●
State University of New York College of Technology, Canton ●
State University of New York College of Technology, Delhi ●
State University of New York Empire State College, Saratoga Springs ●
State University of New York Health Science Center, Brooklyn ●
Sullivan County Community College, Loch Sheldrake ● ●
Unification Theological Seminary, Barrytown ● ●
Union College, Schenectady ●
University of Rochester, Rochester ●
Utica College, Utica ●
Vassar College, Poughkeepsie ●
Total 53 24 77
Section VII
Distribution and List of Participating Schools (cont.)

107CAMPUS ENVIRONMENT 2008
State School and LocationChancellors &
Presidents Survey
Vice Presidents of Adm. & Facilities
SurveyTotal
OH Ashland University, Ashland ●
Baldwin-Wallace College, Berea ●
Brown Mackie College, Akron ●
Case Western Reserve University, Cleveland ●
Central Ohio Technical College, Newark ●
Cincinnati State Technical and Community College, Cincinnati ●
Columbus College of Art & Design, Columbus ●
Columbus State Community College, Columbus ●
Denison University, Granville ● ●
Heidelberg College, Tiffin ●
Hocking Technical College, Nelsonville ●
Kent State University, Kent ●
Kent State University, Canton ●
Lakeland Community College, Kirtland ●
Mercy College, Toledo ●
Miami University Hamilton Campus, Hamilton ●
Mount Union College, Alliance ● ●
Mount Vernon Nazarene University, Mount Vernon ●
Northeastern Ohio Universities Colleges of Medicine & Pharmacy, Rootstown ●
Notre Dame College, South Euclid ●
Oberlin College, Oberlin ●
Ohio State University, Lima ●
Ohio State University, Columbus ●
Ohio University, Zanesville ●
Ohio University Southern Campus, Ironton ●
Ohio University, Eastern Campus, Saint Clairsville ●
Ohio University, Main Campus, Athens ●
Otterbein College, Westerville ●
Shawnee State University, Portsmouth ●
Southwestern College of Business, Cincinnati ●
United Theological Seminary, Trotwood ●
University of Akron, Akron ●
University of Dayton, Dayton ●
University of Northwestern Ohio, Lima ●
University of Rio Grande, Rio Grande ●
Washington State Community College, Marietta ● Wittenberg University, Springfield ●
Total 20 19 39
OK East Central University, Ada ●
Eastern Oklahoma State College, Wilburton ●
Langston University, Langston ●
Northwestern Oklahoma State University, Alva ●
Oklahoma Christian University, Oklahoma City ●
Oklahoma City Community College, Oklahoma City ● ●
Oklahoma City University, Oklahoma City ●
Oklahoma State University, Okmulgee ●
Rose State College, Midwest City ●
Southeastern Oklahoma State University, Durant ●
Section VII
Distribution and List of Participating Schools (cont.)

108NATIONAL WILDLIFE FEDERATION CAMPUS ECOLOGY
State School and LocationChancellors &
Presidents Survey
Vice Presidents of Adm. & Facilities
SurveyTotal
OK Southwestern Christian University, Bethany ●
University of Central Oklahoma, Edmond ●
University of Oklahoma, Norman ● University of Tulsa, Tulsa ●
Total 7 8 15
OR Art Institute of Portland, Portland ●
Blue Mountain Community College, Pendleton ● ●
Corban College, Salem ● ●
Eugene Bible College, Eugene ●
George Fox University, Newberg ●
Klamath Community College, Klamath Falls ●
Lane Community College, Eugene ● ●
Linfield College, McMinnville ● ●
Mt. Hood Community College, Gresham ● ●
Northwest Christian College, Eugene ●
Oregon State University, Corvallis ●
Pacific Northwest College of Art, Portland ●
Pacific University, Forest Grove ● ●
Portland State University, Portland ●
Southern Oregon University, Ashland ●
University of Oregon, Eugene ●
University of Portland, Portland ● Willamette University, Salem ● ●
Total 10 15 25
PA Alvernia College, Reading ●
Bucknell University, Lewisburg ●
Bucks County Community College, Newtown ●
Carnegie Mellon University, Pittsburgh ●
Cedar Crest College, Allentown ●
Chatham University, Pittsburgh ●
Cheyney University of Pennsylvania, Cheyney ●
Community College of Beaver County, Monaca ●
Delaware Valley College, Doylestown ●
Dickinson College, Carlisle ●
Elizabethtown College, Elizabethtown ● ●
Gannon University, Erie ●
Grove City College, Grove City ●
Hussian School of Art, Philadelphia ●
JNA Institute of Culinary Arts, Philadelphia ●
Johnson College, Scranton ●
King’s College, Wilkes-Barre ●
Kutztown University of Pennsylvania, Kutztown ●
Lackawanna College, Scranton ●
Lafayette College, Easton ●
Lancaster Bible College, Lancaster ●
Lancaster Theological Seminary, Lancaster ●
Lehigh University, Bethlehem ●
Lycoming College, Williamsport ●
Section VII
Distribution and List of Participating Schools (cont.)

109CAMPUS ENVIRONMENT 2008
State School and LocationChancellors &
Presidents Survey
Vice Presidents of Adm. & Facilities
SurveyTotal
PA Marywood University, Scranton ●
Messiah College, Grantham ●
Muhlenberg College, Allentown ● ●
Penn State Delaware County, Media ●
Penn State Dickinson School of Law, Carlisle ●
Pennsylvania College of Technology, Williamsport ●
Pennsylvania Highlands Community College, Johnstown ●
Reading Area Community College, Reading ●
Reconstructionist Rabbinical College, Wyncote ●
Robert Morris University, Moon Township ● ●
Rosemont College, Rosemont ●
Saint Joseph’s University, Philadelphia ●
Shippensburg University, Shippensburg ●
Swarthmore College, Swarthmore ●
Trinity Episcopal School for Ministry, Ambridge ●
University of Pennsylvania, Philadelphia ●
Ursinus College, Collegeville ●
Valley Forge Christian College, Phoenixville ●
Washington and Jefferson College, Washington ●
Westmoreland County Community College, Youngwood ●
Widener University, Chester ● Wilkes University, Wilkes-Barre ● ●
Total 26 24 50
RI Brown University, Providence ● ●
Bryant University, Smithfield ●
Community College of Rhode Island, Warwick ●
Johnson & Wales University, Providence ●
Rhode Island School of Design, Providence ●
Salve Regina University, Newport ● ● University of Rhode Island, Kingston ●
Total 5 4 9
SC Converse College, Spartanburg ●
Francis Marion University, Florence ●
Furman University, Greenville ● ●
Horry-Georgetown Technical College, Conway ●
Lander University, Greenwood ●
Limestone College, Gaffney ●
Medical University of South Carolina, Charleston ● ●
Morris College, Sumter ●
Piedmont Technical College, Greenwood ●
Spartanburg Community College, Spartanburg ●
Spartanburg Methodist College, Spartanburg ●
University of South Carolina, Aiken ●
University of South Carolina, Columbia ●
University of South Carolina, Beaufort, Bluffton ● ●
University of South Carolina, Upstate, Spartanburg ●
Williamsburg Technical College, Kingstree ●
Winthrop University, Rock Hill ●
Total 12 8 20
Section VII
Distribution and List of Participating Schools (cont.)

110NATIONAL WILDLIFE FEDERATION CAMPUS ECOLOGY
State School and LocationChancellors &
Presidents Survey
Vice Presidents of Adm. & Facilities
SurveyTotal
SD Black Hills State University, Spearfish ● ●
Mount Marty College, Yankton ● ● University of Sioux Falls, Sioux Falls ●
Total 3 2 5
TN Aquinas College, Nashville ●
Christian Brothers University, Memphis ●
Cleveland State Community College, Cleveland ● ●
Dyersburg State Community College, Dyersburg ● ●
East Tennessee State University, Johnson City ●
Emmanuel School of Religion, Johnson City ● ●
Freed-Hardeman University, Henderson ●
Hiwassee College, Madisonville ●
Lane College, Jackson ●
Lincoln Memorial University, Harrogate ●
Lipscomb University, Nashville ●
Martin Methodist College, Pulaski ●
Meharry Medical College, Nashville ●
Motlow State Community College, Lynchburg ● ●
Nashville State Technical Community College, Nashville ●
Pellissippi State Technical Community College, Knoxville ●
Rhodes College, Memphis ●
Roane State Community College, Harriman ●
Sewanee, University of the South, Sewanee ●
Sewanee, University of the South, Sewanee ●
Southern Adventist University, Collegedale ●
Southwest Tennessee Community College, Memphis ●
Temple Baptist Seminary, Chattanooga ●
Tennessee Technological University, Cookeville ●
Tusculum College, Greeneville ●
Union University, Jackson ●
University of Memphis, Memphis ●
University of Tennessee, Knoxville ●
University of Tennessee, Martin ● ●
University of Tennessee Health Science Center, Memphis ●
Vanderbilt University, Nashville ● ●
Volunteer State Community College, Gallatin ●
Watkins College of Art & Design and Watkins Film School, Nashville ● ● Williamson Christian College, Franklin ●
Total 24 17 41
TX Abilene Christian University, Abilene ●
Art Institute of Dallas, Dallas ●
Baylor University, Waco ●
Blinn College, Brenham ●
Cedar Valley College, Lancaster ● ●
Concordia University, Austin ●
Dallas Theological Seminary, Dallas ●
Eastfield College, Mesquite ●
El Paso Community College, El Paso ●
Section VII
Distribution and List of Participating Schools (cont.)

111CAMPUS ENVIRONMENT 2008
State School and LocationChancellors &
Presidents Survey
Vice Presidents of Adm. & Facilities
SurveyTotal
TX Grayson County College, Denison ●
Hallmark Institute of Aeronautics, San Antonio ●
Houston Community College, Houston ●
Huston-Tillotson University, Austin ● ●
Kilgore College, Kilgore ●
Lamar State College, Port Arthur ●
Lamar University, Beaumont ●
Lee College, Baytown ●
Lon Morris College, Jacksonville ●
Lubbock Christian University, Lubbock ●
McLennan Community College, Waco ●
Midwestern State University, Wichita Falls ●
North Central Texas College, Gainesville ●
North Lake College, Irving ● ●
Northeast Texas Community College, Mount Pleasant ●
Our Lady of the Lake University, San Antonio ●
Palo Alto College, San Antonio ●
Rice University, Houston ●
Richland College, Dallas ●
Sanford-Brown Institute, Houston ●
Schreiner University, Kerrville ● ●
South Plains College, Levelland ●
Southwest Texas Junior College, Uvalde ●
St. Edward’s University, Austin ●
Sul Ross State University, Alpine ●
Tarleton State University, Stephenville ● ●
Tarrant County College District, Fort Worth ●
Texarkana College, Texarkana ●
Texas A & M Health Science Center Baylor College of Dentistry, Dallas ●
Texas A & M University, College Station ●
Texas A & M University, Commerce ●
Texas A & M University, Galveston ●
Texas Southmost College, Brownsville ●
Texas State Technical College, Harlingen ●
Texas Tech University, Lubbock ●
Trinity Valley Community College, Athens ●
University of Dallas, Irving ●
University of Houston, Houston ●
University of Houston, Victoria ●
University of Houston, Houston ●
University of North Texas, Denton ●
University of St. Thomas, Houston ●
University of Texas, Arlington ●
University of Texas, Austin ●
University of Texas, Richardson ●
University of Texas Health Science Center, San Antonio ●
University of Texas Medical Branch, Galveston ●
University of Texas, El Paso, El Paso ●
University of Texas, Pan American, Edinburg ●
Section VII
Distribution and List of Participating Schools (cont.)

112NATIONAL WILDLIFE FEDERATION CAMPUS ECOLOGY
State School and LocationChancellors &
Presidents Survey
Vice Presidents of Adm. & Facilities
SurveyTotal
TX Victoria College, Victoria ●
Western Technical College, El Paso ●
Western Technical Institute, El Paso ●
Total 31 35 66
UT Provo College, Provo ●
Salt Lake Community College, Salt Lake City ● ●
Southern Utah University, Cedar City ●
University of Utah, Salt Lake City ● ●
Utah State University, Logan ●
Utah Valley State College, Orem ● ● Westminster College, Salt Lake City ●
Total 6 4 10
VA Bluefield College, Bluefield ●
Eastern Virginia Medical School, Norfolk ●
Ferrum College, Ferrum ●
George Mason University, Fairfax ● ●
Germanna Community College, Locust Grove ●
Hollins University, Roanoke ●
James Madison University, Harrisonburg ●
Jefferson College of Health Sciences, Roanoke ●
Lord Fairfax Community College, Middletown ●
Lynchburg College, Lynchburg ●
Marine Corps University, Quantico ●
Mary Baldwin College, Staunton ●
Protestant Episcopal Theological Seminary, Alexandria ●
Protestant Episcopal Theological Seminary in Virginia, Alexandria ●
Randolph College, Lynchburg ●
Randolph-Macon College, Ashland ●
Regent University, Virginia Beach ●
Richard Bland College, Petersburg ●
Saint Paul’s College, Lawrenceville ●
Shenandoah University, Winchester ● ●
Sweet Briar College, Sweet Briar ●
University of Virginia, Charlottesville ● ●
Virginia Commonwealth University, Richmond ●
Virginia Wesleyan College, Norfolk ● Virginia Western Community College, Roanoke ●
Total 16 12 28
VT Goddard College, Plainfield ●
Landmark College, Putney ●
Lyndon State College, Lyndonville ●
Marlboro College, Marlboro ●
Middlebury College, Middlebury ● ●
New England Culinary Institute, Montpelier ●
Saint Michael’s College, Colchester ●
Section VII
Distribution and List of Participating Schools (cont.)

113CAMPUS ENVIRONMENT 2008
State School and LocationChancellors &
Presidents Survey
Vice Presidents of Adm. & Facilities
SurveyTotal
VT Sterling College, Craftsbury Common ●
University of Vermont, Burlington ●
Vermont Technical College, Randolph Center ● ●
Total 7 5 12
WA Bastyr University, Kenmore ● ●
Bellevue Community College, Bellevue ●
Big Bend Community College, Moses Lake ●
Cascadia Community College, Bothell ●
Central Washington University, Ellensburg ●
Centralia College, Centralia ●
Clark College, Vancouver ●
Clover Park Technical College, Lakewood ● ●
Columbia Basin College, Pasco ●
Edmonds Community College, Lynnwood ●
Evergreen State College, Olympia ●
Highline Community College, Des Moines ●
Lake Washington Technical College, Kirkland ●
Lower Columbia College, Longview ●
Northwest Indian College, Bellingham ●
Northwest University, Kirkland ●
Olympic College, Bremerton ●
Pacific Lutheran University, Tacoma ● ●
Peninsula College, Port Angeles ●
Seattle University, Seattle ●
South Puget Sound Community College, Olympia ●
Tacoma Community College, Tacoma ● ●
University of Puget Sound, Tacoma ● ●
University of Washington, Seattle ● ●
Washington State University, Pullman ●
Wenatchee Valley College, Wenatchee ●
Western Washington University, Bellingham ● ●
Whatcom Community College, Bellingham ●
Whitman College, Walla Walla ●
Yakima Valley Community College, Yakima ●
Total 18 19 37
WI Alverno College, Milwaukee ●
Cardinal Stritch University, Milwaukee ●
College of Menominee Nation, Keshena ●
Columbia College of Nursing, Milwaukee ●
Concordia University, Mequon ●
Edgewood College, Madison ●
Fox Valley Technical College, Appleton ●
Lac Courte Oreilles Ojibwa Community College, Hayward ●
Lawrence University, Appleton ● ●
Madison Area Technical College, Madison ●
Marquette University, Milwaukee ●
Northeast Wisconsin Technical College, Green Bay ●
Northland Baptist Bible College, Dunbar ●
Section VII
Distribution and List of Participating Schools (cont.)
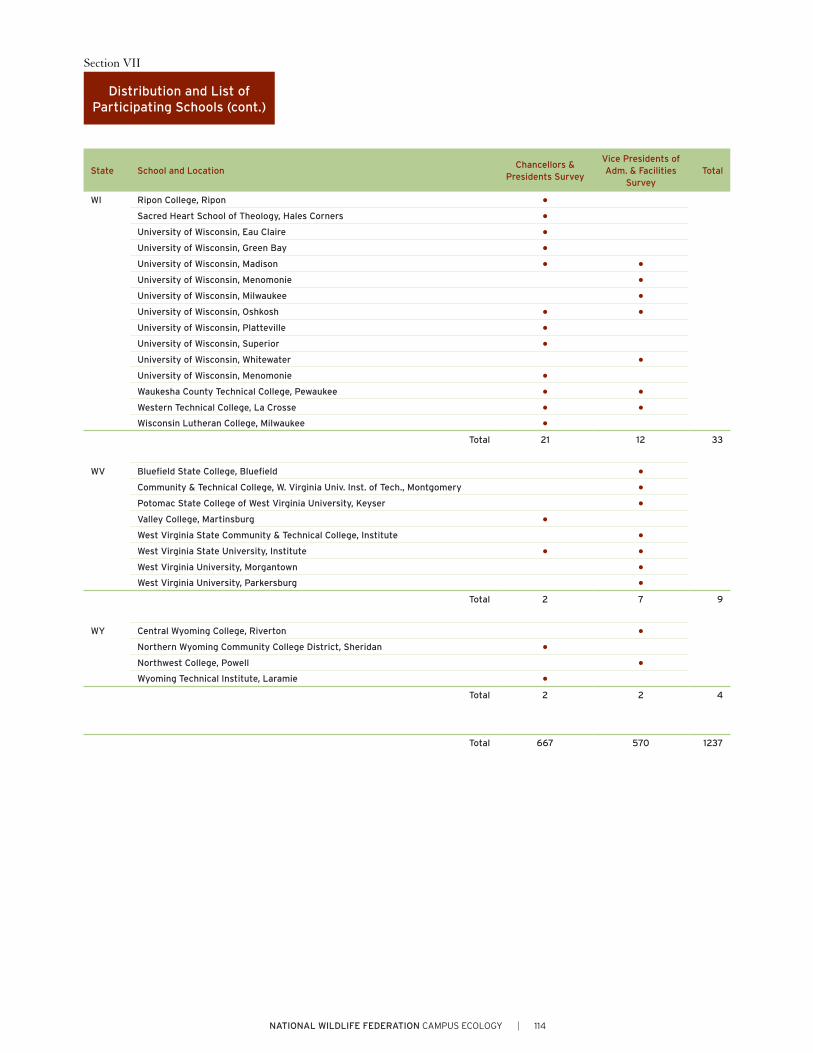
114NATIONAL WILDLIFE FEDERATION CAMPUS ECOLOGY
State School and LocationChancellors &
Presidents Survey
Vice Presidents of Adm. & Facilities
SurveyTotal
WI Ripon College, Ripon ●
Sacred Heart School of Theology, Hales Corners ●
University of Wisconsin, Eau Claire ●
University of Wisconsin, Green Bay ●
University of Wisconsin, Madison ● ●
University of Wisconsin, Menomonie ●
University of Wisconsin, Milwaukee ●
University of Wisconsin, Oshkosh ● ●
University of Wisconsin, Platteville ●
University of Wisconsin, Superior ●
University of Wisconsin, Whitewater ●
University of Wisconsin, Menomonie ●
Waukesha County Technical College, Pewaukee ● ●
Western Technical College, La Crosse ● ● Wisconsin Lutheran College, Milwaukee ●
Total 21 12 33
WV Bluefield State College, Bluefield ●
Community & Technical College, W. Virginia Univ. Inst. of Tech., Montgomery ●
Potomac State College of West Virginia University, Keyser ●
Valley College, Martinsburg ●
West Virginia State Community & Technical College, Institute ●
West Virginia State University, Institute ● ●
West Virginia University, Morgantown ● West Virginia University, Parkersburg ●
Total 2 7 9
WY Central Wyoming College, Riverton ●
Northern Wyoming Community College District, Sheridan ●
Northwest College, Powell ● Wyoming Technical Institute, Laramie ●
Total 2 2 4
Total 667 570 1237
Section VII
Distribution and List of Participating Schools (cont.)

115CAMPUS ENVIRONMENT 2008
Topline results show the raw data from the survey,
allowing better understanding of the conclusions
reached. It includes the aggregate numbers and
percentages of the responses given by participants
in the study. Where possible, the data from 2008 are
compared with 2001.
2008 SurveyN = 667 chancellors or presidents, 570 vice presidents of administration, facilities chiefs or provosts at accredited two- and four-year degree-granting U.S. colleges and universities (excluding U.S. territories) Field period: 1.17.2008–5.14.2008Margin of error: ± 4 for all responses except Q46 (± 3)
2001 SurveyN = 471 presidents, 320 provosts and 325 facilities chiefs at accredited two- and four-year degree-granting U.S. colleges and universities (excluding U.S. territories)Field period: 12.6.2000 – 4.19.2001Margin of error: ± 5 for all responses except Q46 (± 3)
Section VIII
Topline Results
Q1. Some campuses have a written declaration that they are committed to promoting environmental sustainability or stewardship, while other campuses do not have such a statement. Does your campus have a formal declaration of commitment to environmental sustainability or stewardship?
2008 2001UNWEIGHTED BASE 667 471WEIGHTED BASE 681 472Yes 37% 27%Have plans to develop one 28% 16%No 32% 54%No answer 3% 4%
Q2. Does your campus have a written declaration that educating students about environmental sustainability or stewardship is part of its academic mission?
2008 2001UNWEIGHTED BASE 667 471WEIGHTED BASE 681 472Yes 25% 21%Have plans to develop one 28% 13%No 41% 61%No answer 7% 5%
Q3AA. These first questions are about goal-setting. Does your campus regularly set and review goals for reducing solid waste and maximizing recycling?
2008 2001UNWEIGHTED BASE 667 471WEIGHTED BASE 681 472Yes, campus-wide 29% 32%Yes, in some campus units 31% 24%No 33% 30%No answer 6% 14%
Q3BA. Do you have plans to establish written policies, goals or standards for reducing solid waste and maximizing recycling? (Based on those who do not have written policies, goals or standards.)
2008 2001UNWEIGHTED BASE 248 —WEIGHTED BASE 269 —Yes, campus-wide 23% —Yes, in some campus units 15% —No/No answer 62% —
Questions Asked of Chancellors or Presidents (Q1-Q17)
Q3AB. Does your campus regularly set and review goals for conserving energy?
2008 2001UNWEIGHTED BASE 667 471WEIGHTED BASE 681 472Yes, campus-wide 45% 43%Yes, in some campus units 27% 21%No 21% 23%No answer 7% 13%
Q3BB. Do you have plans to establish written policies, goals or standards for conserving energy? (Based on those who do not have written policies, goals or standards.) 2008 2001UNWEIGHTED BASE 169 —WEIGHTED BASE 188 —Yes, campus-wide 24% —Yes, in some campus units 11% —No/No answer 65% —
Q3AC. Does your campus regularly set and review goals for conserving water?
2008 2001UNWEIGHTED BASE 667 471WEIGHTED BASE 681 472Yes, campus-wide 27% 23%Yes, in some campus units 22% 18%No 43% 48%No answer 9% 11%
Q3BC. Do you have plans to establish written policies, goals or standards for conserving water? (Based on those who do not have written policies, goals or standards.) 2008 2001UNWEIGHTED BASE 332 —WEIGHTED BASE 350 —Yes, campus-wide 21% —Yes, in some campus units 13% —No/No answer 66% —
Note: A weight was applied to the data to
correct for a slight over-representation
of public schools (two-year and four-
year) and a slight under-representation
of private schools (two-year and four-
year). The percentages in the Topline
Results are based on the weighted data.
The "unweighted base" reports the
actual number of schools that answered
each question.

116NATIONAL WILDLIFE FEDERATION CAMPUS ECOLOGY
Q3AD. Does your campus regularly set and review goals for protecting natural habitats? 2008 2001UNWEIGHTED BASE 667 471WEIGHTED BASE 681 472Yes, campus-wide 19% 25%Yes, in some campus units 20% 22%No 52% 40%No answer 9% 13%
Q3BD. Do you have plans to establish written policies, goals or standards for protecting natural habitats? (Based on those who do not have written policies, goals or standards.) 2008 2001UNWEIGHTED BASE 395 —WEIGHTED BASE 414 —Yes, campus-wide 11% —Yes, in some campus units 10% —No/No answer 80% —
Q3AE. Does your campus regularly set and review goals for environmental performance of existing and new buildings?
2008 2001UNWEIGHTED BASE 667 471WEIGHTED BASE 681 472Yes, campus-wide 40% 45%Yes, in some campus units 25% 19%No 26% 23%No answer 8% 12%
Q3BE. Do you have plans to establish written policies, goals or standards for environmental performance of existing and new buildings? (Based on those who do not have written policies, goals or standards.)
2008 2001UNWEIGHTED BASE 219 —WEIGHTED BASE 236 —Yes, campus-wide 25% —Yes, in some campus units 12% —No/No answer 63% —
Q3AF. Does your campus regularly set and review goals for reducing emissions of carbon dioxide (CO
2) and other greenhouse gases?
2008 2001UNWEIGHTED BASE 667 471WEIGHTED BASE 681 472Yes, campus-wide 22% 26%Yes, in some campus units 13% 18%No 56% 44%No answer 9% 12%
Q3BF. Do you have plans to establish written policies, goals or standards for reducing emissions of carbon dioxide (CO
2) and other greenhouse gases? (Based
on those who do not have written policies, goals or standards.)
2008 2001UNWEIGHTED BASE 418 —WEIGHTD BASE 443 —Yes, campus-wide 21% —Yes, in some campus units 10% —No/No answer 68% —
Section VIII
Topline Results (cont.)
Q4AA. Does your campus have a staff person or administrator who leads on sustainability issues? 2008 2001UNWEIGHTED BASE 667 —WEIGHTED BASE 681 —Yes 51% —No 40% —No answer 9% —
Q4BA. Does your campus have plans to do more as far as a staff person or administrator who leads on sustainability issues?
2008 2001UNWEIGHTED BASE 667 —WEIGHTED BASE 681 —Yes 48% —No/No Answer 52% —
Q4AB. Does your campus have an environmental/sustainability task force, committee or council? 2008 2001UNWEIGHTED BASE 667 —WEIGHTED BASE 681 —Yes 49% —No 43% —No answer 8% —
Q4BB. Does your campus have plans to do more as far as an environmental/sustainability task force, committee or council?
2008 2001UNWEIGHTED BASE 667 —WEIGHTED BASE 681 —Yes 55% —No/No Answer 45% —
Q4AC. Does your campus have a recycling coordinator or manager?
2008 2001UNWEIGHTED BASE 667 471WEIGHTED BASE 681 472Yes 57% 51%No 34% 35%No answer 8% 14%
Q4BC. Does your campus have plans to do more as far as a recycling coordinator or manager? 2008 2001UNWEIGHTED BASE 667 471WEIGHTED BASE 681 472Yes 48% 5%No/No Answer 52% 95%
Q4AD. Does your campus have an energy conservation coordinator or manager? 2008 2001UNWEIGHTED BASE 667 471WEIGHTED BASE 681 472Yes 45% 36%No 46% 50%No answer 9% 15%

117CAMPUS ENVIRONMENT 2008
Section VIII
Topline Results (cont.)
Q4BD. Does your campus have plans to do more as far as an energy conservation coordinator or manager? 2008 2001UNWEIGHTED BASE 667 471WEIGHTED BASE 681 472Yes 46% 6%No/No Answer 54% 94%
Q4AE. Does your campus have a green purchasing coordinator or manager? 2008 2001UNWEIGHTED BASE 667 471WEIGHTED BASE 681 472Yes 14% 7%No 77% 77%No answer 9% 16%
Q4BE. Does your campus have plans to do more as far as a green purchasing coordinator or manager? 2008 2001UNWEIGHTED BASE 667 471WEIGHTED BASE 681 472Yes 36% 6%No/No Answer 64% 94%
Q5A. What is the highest-level paid position that is responsible for leading environmental performance or sustainability?
2008 2001UNWEIGHTED BASE 667 —WEIGHTED BASE 681 —Director 36% —Vice President or Assistant Vice President 23% —Coordinator 9% —Manager 8% —Vice Chancellor or Assistant Vice Chancellor 2% —Dean, Provost or Officer 2% —President or Assistant President 2% —Chancellor or Assistant Chancellor 1% —Other position (specify) 4% —No position 2% —
Q5B. Where does the person in this position report?
2008 2001UNWEIGHTED BASE 667 —WEIGHTED BASE 681 —Central administration 52% —Facilities, Physical Plant, Operations department 24% —Academic Dean of College 7% —Board of Trustees 1% —Other position or department (specify) 2% —Not applicable 2% —
Q6A. Does your campus offer an orientation session or publication about campus-focused sustainability or environmental programs to students?
2008 2001UNWEIGHTED BASE 667 471WEIGHTED BASE 681 472Yes 27% 13%No 63% 69%No answer 10% 18%
Q6B. Does your campus offer an orientation session or publication about campus-focused sustainability or environmental programs to faculty?
2008 2001UNWEIGHTED BASE 667 471WEIGHTED BASE 681 472Yes 22% 11%No 67% 73%No answer 10% 16%
Q6C. Does your campus offer an orientation session or publication about campus-focused sustainability or environmental programs to staff?
2008 2001UNWEIGHTED BASE 667 471WEIGHTED BASE 681 472Yes 23% 13%No 67% 70%No answer 10% 17%
Q7A. Thinking about all the initiatives now in place on your campus to promote environmental responsibility and stewardship, about what percentage would you say were started within the past year?
2008 2001UNWEIGHTED BASE 667 —WEIGHTED BASE 681 —None 13% —1% to 25% 37% —26% to 50% 15% —51% to 75% 13% —76% to 100% 5% —No answer 16% —
Q7A. Thinking about all the initiatives now in place on your campus to promote environmental responsibility and stewardship, about what percentage would you say were started within the past year (TREND)?
2008 2001UNWEIGHTED BASE 667 471WEIGHTED BASE 681 472None 13% 20%1% - 50% 52% 52%51% - 100% 18% 4%No Answer 16% 24%
Q7B. Thinking about all the initiatives now in place on your campus to promote environmental responsibility and stewardship, about what percentage would you say were started within the past five years?
2008 2001UNWEIGHTED BASE 667 —WEIGHTED BASE 681 —None 13% —1% to 25% 23% —26% to 50% 29% —51% to 75% 15% —76% to 100% 6% —No answer 15% —
Q7B. Thinking about all the initiatives now in place on your campus to promote environmental responsibility and stewardship, about what percentage would you say were started within the past five years (TREND)
2008 2001UNWEIGHTED BASE 667 471WEIGHTED BASE 681 472None 13% 11%1% - 50% 52% 46%51% - 100% 20% 23%No Answer 15% 20%

118NATIONAL WILDLIFE FEDERATION CAMPUS ECOLOGY
Section VIII
Topline Results (cont.)
Q7C. Thinking about all the initiatives now in place on your campus to promote environmental responsibility and stewardship, about what percentage would you say are more than five years old?
2008 2001UNWEIGHTED BASE 667 —WEIGHTED BASE 681 —None 24% —1% to 25% 35% —26% to 50% 11% —51% to 75% 7% —76% to 100% 4% —No answer 19% —
Q7C. Thinking about all the initiatives now in place on your campus to promote environmental responsibility and stewardship, about what percentage would you say are more than five years old (TREND)?
2008 2001UNWEIGHTED BASE 667 471WEIGHTED BASE 681 472None 24% 17%1% - 50% 46% 44%51% - 100% 11% 16%No Answer 19% 23%
Q8A. How much of a challenge are each of the following to your campus in expanding its environmental or sustainability programs: inadequate funding?
2008 2001UNWEIGHTED BASE 667 471WEIGHTED BASE 681 472One of the biggest challenges 46% 37%A key challenge, but not one of the biggest 28% 26%Somewhat of a challenge 11% 18%Not a challenge at all 3% 4%No answer 11% 16%
Q8B. How much of a challenge are each of the following to your campus in expanding its environmental or sustainability programs: inadequate staff time?
2008 2001UNWEIGHTED BASE 667 471WEIGHTED BASE 681 472One of the biggest challenges 46% 42%A key challenge, but not one of the biggest 24% 27%Somewhat of a challenge 16% 15%Not a challenge at all 2% 3%No answer 11% 14%
Q8C. How much of a challenge are each of the following to your campus in expanding its environmental or sustainability programs: concern that environmental or sustainability programs are not cost-effective?
2008 2001UNWEIGHTED BASE 667 471WEIGHTED BASE 681 472One of the biggest challenges 9% 10%A key challenge, but not one of the biggest 20% 21%Somewhat of a challenge 37% 35%Not a challenge at all 22% 20%No answer 12% 14%
Q8D. How much of a challenge are each of the following to your campus in expanding its environmental or sustainability programs: concern that other campus needs are more pressing?
2008 2001UNWEIGHTED BASE 667 471WEIGHTED BASE 681 472One of the biggest challenges 34% 44%A key challenge, but not one of the biggest 26% 24%Somewhat of a challenge 22% 15%Not a challenge at all 6% 3%No answer 12% 14%
Q8E. How much of a challenge are each of the following to your campus in expanding its environmental or sustainability programs: lack of student interest in participating in environmental stewardship programs?
2008 2001UNWEIGHTED BASE 667 —WEIGHTED BASE 681 —One of the biggest challenges 6% —A key challenge, but not one of the biggest 18% —Somewhat of a challenge 33% —Not a challenge at all 32% —No answer 11% —
Q8F. How much of a challenge are each of the following to your campus in expanding its environmental or sustainability programs: lack of faculty or staff interest in participating in environmental stewardship programs?
2008 2001UNWEIGHTED BASE 667 —WEIGHTED BASE 681 —One of the biggest challenges 6% —A key challenge, but not one of the biggest 19% —Somewhat of a challenge 38% —Not a challenge at all 25% —No answer 12% —
Q9A. To what extent have each of the following played a role in encouraging your campus to implement environmental or sustainability programs: student interest?
2008 2001UNWEIGHTED BASE 667 471WEIGHTED BASE 681 472A great deal 30% 15%Somewhat 37% 32%Not too much 12% 22%Not at all 8% 12%No answer 13% 19%
Q9B. To what extent have each of the following played a role in encouraging your campus to implement environmental or sustainability programs: faculty interest?
2008 2001UNWEIGHTED BASE 667 471WEIGHTED BASE 681 472A great deal 30% 14%Somewhat 39% 35%Not too much 12% 25%Not at all 7% 10%No answer 12% 16%

119CAMPUS ENVIRONMENT 2008
Section VIII
Topline Results (cont.)
Q9C. To what extent have each of the following played a role in encouraging your campus to implement environmental or sustainability programs: staff interest?
2008 2001UNWEIGHTED BASE 667 471WEIGHTED BASE 681 472A great deal 26% 11%Somewhat 44% 38%Not too much 13% 26%Not at all 5% 8%No answer 12% 16%
Q9D. To what extent have each of the following played a role in encouraging your campus to implement environmental or sustainability programs: alumni interest?
2008 2001UNWEIGHTED BASE 667 471WEIGHTED BASE 681 472A great deal 3% 2%Somewhat 18% 6%Not too much 33% 30%Not at all 32% 46%No answer 14% 17%
Q9E. To what extent have each of the following played a role in encouraging your campus to implement environmental or sustainability programs: government regulations?
2008 2001UNWEIGHTED BASE 667 471WEIGHTED BASE 681 472A great deal 12% 24%Somewhat 32% 36%Not too much 29% 17%Not at all 14% 7%No answer 13% 16%
Q9F. To what extent have each of the following played a role in encouraging your campus to implement environmental or sustainability programs: trustee interest?
2008 2001UNWEIGHTED BASE 667 —WEIGHTED BASE 681 —A great deal 8% —Somewhat 25% —Not too much 30% —Not at all 23% —No answer 14% —
Q9G. To what extent have each of the following played a role in encouraging your campus to implement environmental or sustainability programs: rising energy prices?
2008 2001UNWEIGHTED BASE 667 —WEIGHTED BASE 681 —A great deal 38% —Somewhat 38% —Not too much 8% —Not at all 3% —No answer 13% —
Q10A. To what extent has your campus been encouraged to implement environmental or sustainability programs because you have found them to be cost-effective?
2008 2001UNWEIGHTED BASE 667 471WEIGHTED BASE 681 472A great deal 24% 9%Somewhat 17% 29%Not at all 7% 14%No answer 13% 17%
Q10B. To what extent has your campus been encouraged to implement environmental or sustainability programs because you have found they are good for public relations?
2008 2001UNWEIGHTED BASE 667 471WEIGHTED BASE 681 472A great deal 22% 9%Somewhat 44% 38%Not too much 15% 25%Not at all 6% 12%No answer 13% 16%
Q10C. To what extent has your campus been encouraged to implement environmental or sustainability programs because you have found they help recruit students?
2008 2001UNWEIGHTED BASE 667 471WEIGHTED BASE 681 472A great deal 9% 3%Somewhat 26% 14%Not too much 36% 30%Not at all 16% 36%No answer 14% 16%
Q10D. To what extent has your campus been encouraged to implement environmental or sustainability programs because you think they fit with the culture and values of the campus?
2008 2001UNWEIGHTED BASE 667 471WEIGHTED BASE 681 472A great deal 44% 28%Somewhat 32% 35%Not too much 8% 15%Not at all 4% 6%No answer 13% 16%
Q10E. To what extent has your campus been encouraged to implement environmental or sustainability programs because you have found they help recruit faculty or staff?
2008 2001UNWEIGHTED BASE 667 —WEIGHTED BASE 681 —A great deal 5% —Somewhat 22% —Not too much 38% —Not at all 21% —No answer 14% —

120NATIONAL WILDLIFE FEDERATION CAMPUS ECOLOGY
Section VIII
Topline Results (cont.)
Q11A. Does your campus offer an undergraduate major in environmental or sustainability studies?
2008 2001UNWEIGHTED BASE 667 320WEIGHTED BASE 681 320Yes 27% 35%We have plans to develop one 8% 5%No 50% 60%No answer 14% 1%
Q11B. Does your campus offer an undergraduate minor in environmental or sustainability studies?
2008 2001UNWEIGHTED BASE 667 320WEIGHTED BASE 681 320Yes 26% 32%We have plans to develop one 7% 4%No 52% 63%No answer 15% 1%
Q11C. Does your campus offer an undergraduate interdisciplinary degree program in environmental or sustainability studies?
2008 2001UNWEIGHTED BASE 667 —WEIGHTED BASE 681 —Yes 20% —We have plans to develop one 9% —No 56% —No answer 15% —
Q11D. Does your campus offer an undergraduate certificate or other recognition in environmental or sustainability studies?
2008 2001UNWEIGHTED BASE 667 —WEIGHTED BASE 681 —Yes 9% —We have plans to develop one 10% —No 65% —No answer 15% —
Q12A. Do departments in the following areas offer any undergraduate courses on environmental issues: natural sciences?
2008 2001UNWEIGHTED BASE 667 —WEIGHTED BASE 681 —Yes 63% —No 20% —No answer 17% —
Q12B. Do departments in the following areas offer any undergraduate courses on environmental issues: physical sciences?
2008 2001UNWEIGHTED BASE 667 —WEIGHTED BASE 681 —Yes 48% —No 34% —No answer 19% —
Q12C. Do departments in the following areas offer any undergraduate courses on environmental issues: health sciences? 2008 2001UNWEIGHTED BASE 667 —WEIGHTED BASE 681 —Yes 23% —No 55% —No answer 23% —
Q12D. Do departments in the following areas offer any undergraduate courses on environmental issues: social sciences?
2008 2001UNWEIGHTED BASE 667 —WEIGHTED BASE 681 —Yes 36% —No 44% —No answer 20% —
Q12E. Do departments in the following areas offer any undergraduate courses on environmental issues: humanities?
2008 2001UNWEIGHTED BASE 667 —WEIGHTED BASE 681 —Yes 28% —No 52% —No answer 20% —
Q12F. Do departments in the following area offer any undergraduate courses on environmental issues: engineering?
2008 2001UNWEIGHTED BASE 667 —WEIGHTED BASE 681 —Yes 18% —No 56% —No answer 25% —
Q12G. Do departments in the following area offer any undergraduate courses on environmental issues: business ?
2008 2001UNWEIGHTED BASE 667 —WEIGHTED BASE 681 —Yes 22% —No 56% —No answer 22% —
Q12H. Do departments in the following area offer any undergraduate courses on environmental issues: teacher education?
2008 2001UNWEIGHTED BASE 667 —WEIGHTED BASE 681 —Yes 15% —No 61% —No answer 24% —
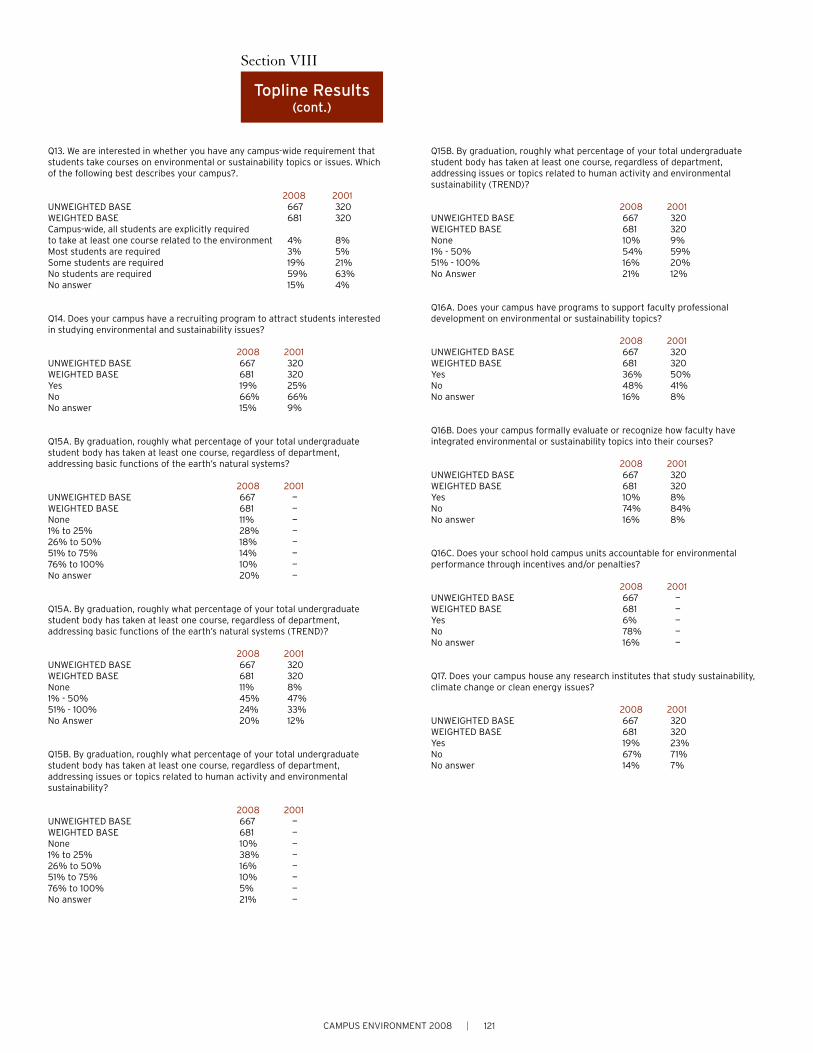
121CAMPUS ENVIRONMENT 2008
Section VIII
Topline Results (cont.)
Q13. We are interested in whether you have any campus-wide requirement that students take courses on environmental or sustainability topics or issues. Which of the following best describes your campus?.
2008 2001UNWEIGHTED BASE 667 320WEIGHTED BASE 681 320Campus-wide, all students are explicitly required to take at least one course related to the environment 4% 8%Most students are required 3% 5%Some students are required 19% 21%No students are required 59% 63%No answer 15% 4%
Q14. Does your campus have a recruiting program to attract students interested in studying environmental and sustainability issues?
2008 2001UNWEIGHTED BASE 667 320WEIGHTED BASE 681 320Yes 19% 25%No 66% 66%No answer 15% 9%
Q15A. By graduation, roughly what percentage of your total undergraduate student body has taken at least one course, regardless of department, addressing basic functions of the earth’s natural systems?
2008 2001UNWEIGHTED BASE 667 —WEIGHTED BASE 681 —None 11% —1% to 25% 28% —26% to 50% 18% —51% to 75% 14% —76% to 100% 10% —No answer 20% —
Q15A. By graduation, roughly what percentage of your total undergraduate student body has taken at least one course, regardless of department, addressing basic functions of the earth’s natural systems (TREND)?
2008 2001UNWEIGHTED BASE 667 320WEIGHTED BASE 681 320None 11% 8%1% - 50% 45% 47%51% - 100% 24% 33%No Answer 20% 12%
Q15B. By graduation, roughly what percentage of your total undergraduate student body has taken at least one course, regardless of department, addressing issues or topics related to human activity and environmental sustainability?
2008 2001UNWEIGHTED BASE 667 —WEIGHTED BASE 681 —None 10% —1% to 25% 38% —26% to 50% 16% —51% to 75% 10% —76% to 100% 5% —No answer 21% —
Q15B. By graduation, roughly what percentage of your total undergraduate student body has taken at least one course, regardless of department, addressing issues or topics related to human activity and environmental sustainability (TREND)?
2008 2001UNWEIGHTED BASE 667 320WEIGHTED BASE 681 320None 10% 9%1% - 50% 54% 59%51% - 100% 16% 20%No Answer 21% 12%
Q16A. Does your campus have programs to support faculty professional development on environmental or sustainability topics?
2008 2001UNWEIGHTED BASE 667 320WEIGHTED BASE 681 320Yes 36% 50%No 48% 41%No answer 16% 8%
Q16B. Does your campus formally evaluate or recognize how faculty have integrated environmental or sustainability topics into their courses?
2008 2001UNWEIGHTED BASE 667 320WEIGHTED BASE 681 320Yes 10% 8%No 74% 84%No answer 16% 8%
Q16C. Does your school hold campus units accountable for environmental performance through incentives and/or penalties?
2008 2001UNWEIGHTED BASE 667 —WEIGHTED BASE 681 —Yes 6% —No 78% —No answer 16% —
Q17. Does your campus house any research institutes that study sustainability, climate change or clean energy issues?
2008 2001UNWEIGHTED BASE 667 320WEIGHTED BASE 681 320Yes 19% 23%No 67% 71%No answer 14% 7%

122NATIONAL WILDLIFE FEDERATION CAMPUS ECOLOGY
Section VIII
Topline Results (cont.)
Q18AA. We have some questions about recycling and materials exchange. Does your campus collect higher grades of paper (e.g., office paper, computer printout) for recycling?
2008 2001UNWEIGHTED BASE 570 325WEIGHTED BASE 553 326Yes, campus-wide 70% 67%Yes, in some campus units 19% 17%No 10% 13%No answer 2% 3%
Q18BA. Do you have plans to do more as far as collecting higher grades of paper for recycling?
2008 2001UNWEIGHTED BASE 570 325WEIGHTED BASE 553 326Yes 56% 14%No/No Answer 44% 86%
Q18AB. Does your campus collect lower grades of paper (e.g., mixed paper, colored paper, junk mail, newspaper, boxboard, magazines, catalogs, filestock, envelopes, craft paper) for recycling?
2008 2001UNWEIGHTED BASE 570 325WEIGHTED BASE 553 326Yes, campus-wide 67% 57%Yes, in some campus units 18% 20%No 13% 21%No answer 2% 3%
Q18BB. Do you have plans to do more as far as collecting lower grades of paper for recycling?
2008 2001UNWEIGHTED BASE 570 325WEIGHTED BASE 553 326Yes 53% 12%No/No Answer 47% 88%
Q18AC. Does your campus collect corrugated cardboard for recycling?
2008 2001UNWEIGHTED BASE 570 325WEIGHTED BASE 553 326Yes, campus-wide 65% 64%Yes, in some campus units 18% 17%No 15% 17%No answer 2% 2%
Q18BC. Do you have plans to do more as far as collecting corrugated cardboard for recycling?
2008 2001UNWEIGHTED BASE 570 325WEIGHTED BASE 553 326Yes 47% 9%No/No Answer 53% 91%
Questions Asked of Vice Presidents of Administration or Facilities Chiefs (Q18-Q44)
Q18AD. Does your campus collect aluminum cans or containers for recycling?
2008 2001UNWEIGHTED BASE 570 325WEIGHTED BASE 553 326Yes, campus-wide 60% 61%Yes, in some campus units 22% 23%No 15% 13%No answer 3% 3%
Q18BD. Do you have plans to do more as far as collecting aluminum cans or containers for recycling?
2008 2001UNWEIGHTED BASE 570 325WEIGHTED BASE 553 326Yes 56% 10%No/No Answer 44% 90%
Q18AE. Does your campus collect glass bottles and jars (one or more colors) for recycling? 2008 2001UNWEIGHTED BASE 570 325WEIGHTED BASE 553 326Yes, campus-wide 40% 35%Yes, in some campus units 15% 15%No 42% 47%No answer 3% 4%
Q18BE. Do you have plans to do more as far as collecting glass bottles and jars (one or more colors) for recycling?
2008 2001UNWEIGHTED BASE 570 325WEIGHTED BASE 553 326Yes 44% 8%No/No Answer 56% 92%
Q18AF. Does your campus collect plastic bottles or jars (one or more grades) for recycling?
2008 2001UNWEIGHTED BASE 570 325WEIGHTED BASE 553 326Yes, campus-wide 50% 31%Yes, in some campus units 19% 15%No 28% 50%No answer 3% 3%
Q18BF. Do you have plans to do more as far as collecting plastic bottles or jars (one or more grades) for recycling?
2008 2001 UNWEIGHTED BASE 570 325WEIGHTED BASE 553 326Yes 53% 9%No/No Answer 47% 91%

123CAMPUS ENVIRONMENT 2008
Section VIII
Topline Results (cont.)
Q18AG. Does your campus collect food scraps or landscape trimmings for composting or mulching for recycling?
2008 2001UNWEIGHTED BASE 570 325WEIGHTED BASE 553 326Yes, campus-wide 25% 29%Yes, in some campus units 25% 20%No 47% 48%No answer 3% 4%
Q18BG. Do you have plans to do more as far as collecting food scraps or landscape trimmings for composting or mulching for recycling?
2008 2001UNWEIGHTED BASE 570 325WEIGHTED BASE 553 326Yes 45% 8%No/No Answer 55% 92%
Q18AH. Does your campus collect construction and demolition waste (scrap metal, wood, concrete, bricks or stone) for recycling?
2008 2001UNWEIGHTED BASE 570 325WEIGHTED BASE 553 326Yes, campus-wide 32% 25%Yes, in some campus units 28% 22%No 37% 51%No answer 4% 2%
Q18BH. Do you have plans to do more as far as collecting construction and demolition waste for recycling?
2008 2001UNWEIGHTED BASE 570 325WEIGHTED BASE 553 326Yes 48% 6%No/No Answer 52% 94%
Q18AI. Does your campus collect electronics for recycling?
2008 2001UNWEIGHTED BASE 570 —WEIGHTED BASE 553 —Yes, campus-wide 62% —Yes, in some campus units 22% —No 13% —No answer 3% —
Q18BI. Do you have plans to do more as far as collecting electronics for recycling?
2008 2001UNWEIGHTED BASE 570 —WEIGHTED BASE 553 —Yes 50% —No/No Answer 50% —
Q19A. Does your campus have a materials surplus, exchange or recovery program, for example, for computers, furniture, office supplies or lab equipment?
2008 2001UNWEIGHTED BASE 570 325WEIGHTED BASE 553 326Yes, campus-wide 58% 30%Yes, in some campus units 19% 24%No 21% 42%No answer 3% 4%
Q19B. Do you have plans to do more as far as a materials surplus, exchange or recovery program?
2008 2001UNWEIGHTED BASE 570 325WEIGHTED BASE 553 326Yes 47% 12%No/No Answer 53% 88%
Q20AA. Does your campus specify that office paper purchased must contain a minimum of 25% post-consumer waste?
2008 2001UNWEIGHTED BASE 570 325WEIGHTED BASE 553 326Yes, campus-wide 21% 16%Yes, in some campus units 15% 13%No 58% 63%No answer 6% 8%
Q20BA. Do you have plans to do more as far as specifying that office paper purchased must contain a minimum of 25% post-consumer waste?
2008 2001UNWEIGHTED BASE 570 325WEIGHTED BASE 553 326Yes 42% 9%No/No Answer 58% 91%
Q20AB. Does your campus specify any chlorine-free requirements for office paper?
2008 2001UNWEIGHTED BASE 570 325WEIGHTED BASE 553 326Yes, campus-wide 5% 3%Yes, in some campus units 5% 5%No 82% 84%No answer 7% 8%
Q20BB. Do you have plans to do more as far as specifying any chlorine-free requirements for office paper?
2008 2001UNWEIGHTED BASE 570 325WEIGHTED BASE 553 326Yes 25% 5%No/No Answer 75% 95%

124NATIONAL WILDLIFE FEDERATION CAMPUS ECOLOGY
Section VIII
Topline Results (cont.)
Q21A. Does your campus have any programs in place to encourage environmentally friendly or sustainable purchasing, for example, specifying that products must contain recycled content, be energy efficient or come from sustainably managed sources?
2008 2001UNWEIGHTED BASE 570 325WEIGHTED BASE 553 326Yes, campus-wide 24% 16%Yes, in some campus units 37% 33%No 33% 41%No answer 6% 11%
Q21B. Do you have plans to do more as far as any programs to encourage environmentally friendly or sustainable purchasing?
2008 2001UNWEIGHTED BASE 570 325WEIGHTED BASE 553 326Yes 65% 19%No/No Answer 35% 81%
Q22AA. Does your campus have any programs in place to reduce the need for paper hard copies?
2008 2001UNWEIGHTED BASE 570 325WEIGHTED BASE 553 326Yes, campus-wide 32% 32%Yes, in some campus units 36% 37%No 26% 21%No answer 6% 10%
Q22BA. Do you have plans to do more as far as programs to reduce the need for paper hard copies?
2008 2001UNWEIGHTED BASE 570 325WEIGHTED BASE 553 326Yes 67% 15%No/No Answer 33% 85%
Q22AB. Does your campus have any programs in place to encourage lab courses to implement microscale experiments that will consume milliliters rather than liters?
2008 2001UNWEIGHTED BASE 570 325WEIGHTED BASE 553 326Yes, campus-wide 14% 19%Yes, in some campus units 24% 24%No 46% 38%No answer 16% 19%
Q22BB. Do you have plans to do more as far as programs to encourage lab courses to implement microscale experiments that will consume milliliters rather than liters?
2008 2001UNWEIGHTED BASE 570 325WEIGHTED BASE 553 326Yes 35% 7%No/No Answer 65% 93%
Q23A. Thinking about the total municipal solid waste generated on campus (e.g., product packaging, grass clippings, furniture, clothing, bottles, food scraps, newspapers, appliances, paint, batteries), roughly how many short tons (2000 lbs/ton) were generated in 2006?
2008 2001UNWEIGHTED BASE 570 325WEIGHTED BASE 553 3261 - 50 15% 18%51 - 250 11% 11%251 - 1000 11% 9%More than 1000 15% 14%No Answer 48% 48%
Q23B. What percentage of these short tons of municipal solid waste was recycled or composted in 2006?
2008 2001UNWEIGHTED BASE 570 325WEIGHTED BASE 553 3260% 6% 4%1% - 10% 12% 11%11% - 20% 12% 9%21% - 30% 10% 13%31% - 40% 4% 11%41% - 50% 5% 5%51% - 60% 4% 4%61% - 70% 3% 3%71% - 80% 4% 2%81% - 90% 1% 2%91% - 100% 1% 1%No Answer 37% 35%
Q24AA. Has your campus implemented any habitat restoration (e.g., river, stream, prairie or meadow, wetland, forest) programs?
2008 2001UNWEIGHTED BASE 570 325WEIGHTED BASE 553 326Yes, campus-wide 12% 11%Yes, in some campus units 28% 25%No 48% 51%No answer 12% 13%
Q24BA. Do you have plans to do more as far as implementing any habitat restoration (e.g., river, stream, prairie or meadow, wetland, forest) programs?
2008 2001UNWEIGHTED BASE 570 325WEIGHTED BASE 553 326Yes 41% 11%No/No Answer 59% 89%
Q24AB. Has your campus implemented any landscaping using native plants or other low-maintenance vegetation (requiring less or no fertilizers, mowing or watering)?
2008 2001UNWEIGHTED BASE 570 325WEIGHTED BASE 553 326Yes, campus-wide 34% 21%Yes, in some campus units 38% 30%No 15% 37%No answer 12% 12%

125CAMPUS ENVIRONMENT 2008
Section VIII
Topline Results (cont.)
Q24BB. Do you have plans to do more as far as implementing any landscaping using native plants or other low-maintenance vegetation (requiring less or no fertilizers, mowing or watering)?
2008 2001UNWEIGHTED BASE 570 325WEIGHTED BASE 553 326Yes 69% 10%No/No Answer 31% 90%
Q24AC. Has your campus implemented any identification and removal of invasive exotic species?
2008 2001UNWEIGHTED BASE 570 325WEIGHTED BASE 553 326Yes, campus-wide 18% 13%Yes, in some campus units 20% 15%No 48% 61%No answer 15% 11%
Q24BC. Do you have plans to do more as far as implementing any identification and removal of invasive exotic species?
2008 2001UNWEIGHTED BASE 570 325WEIGHTED BASE 553 326Yes 38% 4%No/No Answer 62% 96%
Q24AD. Has your campus implemented any Integrated Pest Management (IPM)?
2008 2001UNWEIGHTED BASE 570 325WEIGHTED BASE 553 326Yes, campus-wide 42% 39%Yes, in some campus units 19% 21%No 24% 29%No answer 14% 11%
Q24BD. Do you have plans to do more as far as implementing any integrated pest management? 2008 2001UNWEIGHTED BASE 570 325WEIGHTED BASE 553 326Yes 45% 6%No/No Answer 55% 94%
Q24AE. Has your campus implemented any programs to provide food and shelter to attract wildlife (e.g., beneficial insects, birds, butterflies, amphibians)?
2008 2001UNWEIGHTED BASE 570 325WEIGHTED BASE 553 326Yes, campus-wide 15% 12%Yes, in some campus units 24% 25%No 47% 51%No answer 14% 12%
Q24BE. Do you have plans to do more as far as implementing any programs to provide food and shelter to attract wildlife (e.g., beneficial insects, birds, butterflies, amphibians)?
2008 2001UNWEIGHTED BASE 570 325WEIGHTED BASE 553 326Yes 36% 7%No/No Answer 64% 93%
Q24AF. Has your campus implemented any green roofs on buildings (roofs planted with vegetation)?
2008 2001UNWEIGHTED BASE 570 —WEIGHTED BASE 553 —Yes, campus-wide 1% —Yes, in some campus units 12% —No 75% —No answer 12% —
Q24BF. Do you have plans to do more as far as implementing any green roofs on buildings (roofs planted with vegetation)?
2008 2001UNWEIGHTED BASE 570 —WEIGHTED BASE 553 —Yes 28% —No/No Answer 72% —
Q25A. Thinking about your campus’s land area, about how many acres of land does your campus have?
2008 2001UNWEIGHTED BASE 570 325WEIGHTED BASE 553 3261 - 10 3% 6%11 - 25 5% 7%26 - 50 10% 8%51 -100 15% 15%101 - 200 20% 21%201 - 500 16% 15%501 - 1000 7% 7%1001 - 16000 5% 7%No Answer 19% 15%
Q25B. And what percentage of this acreage is natural area, such as forest, wetland, nonagricultural field or prairie?
2008 2001UNWEIGHTED BASE 570 —WEIGHTED BASE 553 —0% 14% —1% - 10% 18% —11% - 20% 10% —21% - 30% 10% —31% - 40% 8% —41% - 50% 4% —51% - 60% 7% —61% - 70% 5% —71% - 80% 5% —81% - 90% 2% —91% - 100% 1% —No Answer 17% —
Q26. Since 2001, the year of the last survey, has your campus implemented any significant new programs to curb CO
2 and other greenhouse gas emissions?
2008 2001UNWEIGHTED BASE 570 —WEIGHTED BASE 553 —Yes 45% —No 40% —No answer 15% —

126NATIONAL WILDLIFE FEDERATION CAMPUS ECOLOGY
Section VIII
Topline Results (cont.)
Q27AA. Of the total amount of electricity you generate on-campus, approximately what percentage comes from the following energy source: wind?
2008 2001UNWEIGHTED BASE 378 —WEIGHTED BASE 369 —0% 95% —1% - 10% 2% —11% - 20% 1% —21% - 30% 1% —31% - 40% — —41% - 50% * —51% - 60% — —61% - 70% — —71% - 80% — —81% - 90% — —91% - 100% * —No Answer — —
Q27AB. Of the total amount of electricity you generate on-campus, approximately what percentage comes from the following energy source: solar electric (photovoltaic)?
2008 2001UNWEIGHTED BASE 387 —WEIGHTED BASE 377 —0% 88% —1% - 10% 10% —11% - 20% — —21% - 30% — —31% - 40% — —41% - 50% * —51% - 60% — —61% - 70% — —71% - 80% — —81% - 90% — —91% - 100% 2% —No Answer — —
Q27AC. Of the total amount of electricity you generate on-campus, approximately what percentage comes from the following energy source: biomass?
2008 2001UNWEIGHTED BASE 370 —WEIGHTED BASE 361 —0% 98% —1% - 10% 2% —11% - 20% — —21% - 30% — —31% - 40% — —41% - 50% — —51% - 60% — —61% - 70% — —71% - 80% * —81% - 90% — —91% - 100% * —No Answer — —
Q27AD. Of the total amount of electricity you generate on-campus, approximately what percentage comes from the following energy sources: other clean sources, such as landfill gas, fuel cells, etc. (specify)?
2008 2001UNWEIGHTED BASE 373 —WEIGHTED BASE 364 —0% 95% —1% - 10% 3% —11% - 20% 1% —21% - 30% — —31% - 40% — —41% - 50% — —51% - 60% — —61% - 70% — —71% - 80% — —81% - 90% — —91% - 100% 1% —No Answer — —
Q27AE. Of the total amount of electricity you generate on-campus, approximately what percentage comes from each of the following energy sources: fossil fuels (coal, natural gas, fuel oil, etc.)?
2008 2001UNWEIGHTED BASE 408 —WEIGHTED BASE 395 —0% 69% —1% - 10% 1% —11% - 20% * —21% - 30% 1% —31% - 40% — —41% - 50% * —51% - 60% — —61% - 70% 1% —71% - 80% * —81% - 90% 1% —91% - 100% 27% —No Answer — —
Q27B. Approximately what percentage of on-campus heating and cooling is met using on-site ground-source (geothermal) heat pumps, direct-heat geothermal, solar, biomass, landfill gas, aquifer or lake-source thermal systems?
2008 2001UNWEIGHTED BASE 570 —WEIGHTED BASE 553 —0 63% —1 3% —2 * —3 * —4 * —5 2% —6 * —8 * —9 * —10 3% —12 * —13 * —15 * —20 1% —25 * —30 1% —40 * —50 * —70 * —75 * —80 * —90 * —100 1% —No Answer 23% —

127CAMPUS ENVIRONMENT 2008
Section VIII
Topline Results (cont.)
Q27C. What percentage of your energy comes from on-campus, cogenerated heat and electricity (combined heat and power, or CHP) produced by renewables or lower-carbon fuels (fuels other than coal)?
2008 2001UNWEIGHTED BASE 570 —WEIGHTED BASE 553 —0 66% —1 * —5 1% —10 * —13 * —20 * —25 * —27 * —30 * —33 * —35 * —40 * —45 * —50 1% —65 * —70 1% —75 * —85 * —88 * —89 * —95 1% —99 * —100 2% —No Answer 24% —
Q27D. Do you have plans to do more as far as meeting your campus’s electricity, heating and cooling demand by using on-campus renewable sources?
2008 2001UNWEIGHTED BASE 570 325WEIGHTED BASE 553 326Yes 36% 10%No Answer 64% 90%
Q28. Roughly what percentage of your campus’s total electricity demand is met by off-campus renewable energy sources, for example, solar electric (photovoltaic), solar thermal, wind, hydro, geothermal, biomass, landfill gas, or fuel cells (excluding nuclear), or purchasing renewable energy certificates (RECs)?
2008 2001UNWEIGHTED BASE 570 325WEIGHTED BASE 553 3260% 46% 63%1% - 10% 17% 11%11% - 20% 5% 3%21% - 30% 1% 2%31% - 40% 1% 2%41% - 50% * 1%51% - 60% 1% *61% - 70% * 1%71% - 80% * 1%81% - 90% * 1%91% - 100% 6% 1%No Answer 23% 14%
Q29AA. Has your campus implemented water efficiency upgrades (e.g., toilets, showerheads, faucets, recirculating fountains, chilled water)?
2008 2001UNWEIGHTED BASE 570 325WEIGHTED BASE 553 326Yes, campus-wide 37% 22%Yes, in some campus units 39% 51%No 7% 12%No answer 16% 15%
Q29BA. Do you have plans to do more as far as implementing water efficiency upgrades (e.g., toilets, showerheads, faucets, recirculating fountains, chilled water)?
2008 2001UNWEIGHTED BASE 570 325WEIGHTED BASE 553 326Yes 72% 19%No/No Answer 28% 81%
Q29AB. Has your campus implemented lighting efficiency upgrades (e.g., light fixtures, occupancy sensors, daylight sensors)?
2008 2001UNWEIGHTED BASE 570 325WEIGHTED BASE 553 326Yes, campus-wide 51% 34%Yes, in some campus units 30% 47%No 2% 4%No answer 17% 14%
Q29BB. Do you have plans to do more as far as implementing lighting efficiency upgrades (e.g., light fixtures, occupancy sensors, daylight sensors)?
2008 2001UNWEIGHTED BASE 570 325WEIGHTED BASE 553 326Yes 74% 21%No/No Answer 26% 79%
Q29AC. Has your campus implemented heating, ventilation and air conditioning (HVAC) upgrades (e.g., thermal insulation of buildings, downsizing of fans and pumps, occupancy or CO
2 sensors, variable-air-volume ventilation, air-side
economizers, direct digital controls, thermostat setbacks, capturing waste heat)?
2008 2001UNWEIGHTED BASE 570 325WEIGHTED BASE 553 326Yes, campus-wide 32% 20%Yes, in some campus units 41% 53%No 8% 11%No answer 18% 16%
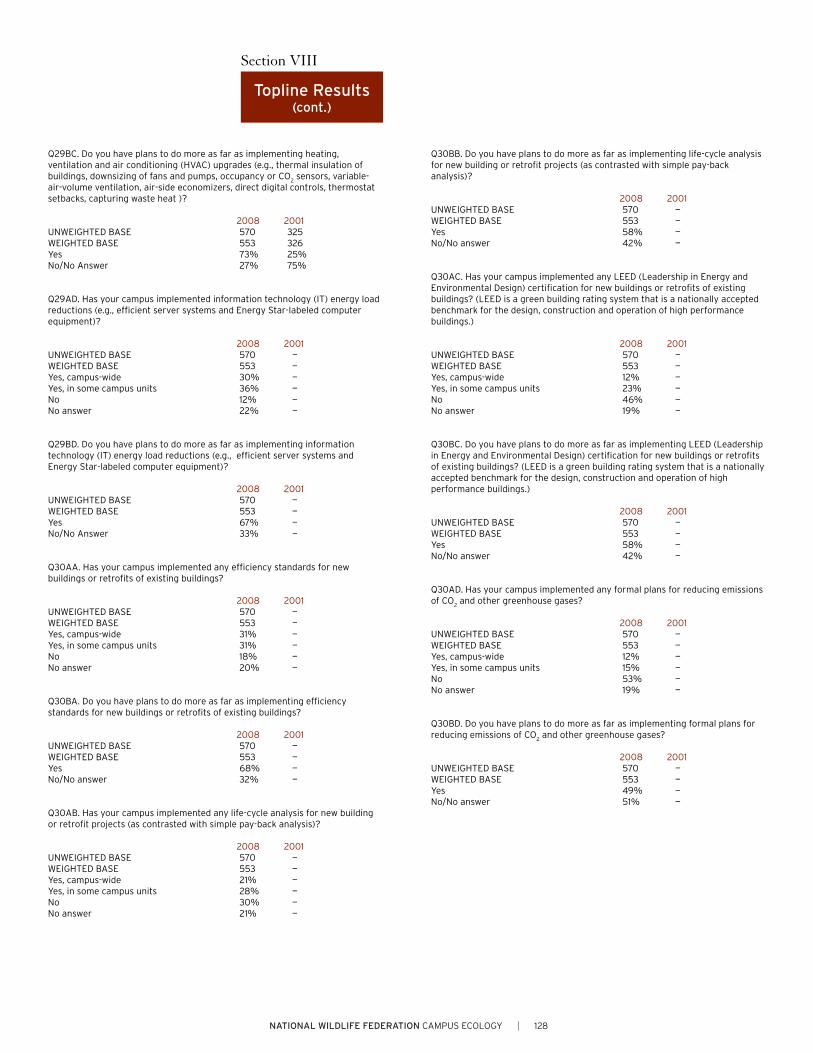
128NATIONAL WILDLIFE FEDERATION CAMPUS ECOLOGY
Section VIII
Topline Results (cont.)
Q29BC. Do you have plans to do more as far as implementing heating, ventilation and air conditioning (HVAC) upgrades (e.g., thermal insulation of buildings, downsizing of fans and pumps, occupancy or CO
2 sensors, variable-
air-volume ventilation, air-side economizers, direct digital controls, thermostat setbacks, capturing waste heat )?
2008 2001UNWEIGHTED BASE 570 325WEIGHTED BASE 553 326Yes 73% 25%No/No Answer 27% 75%
Q29AD. Has your campus implemented information technology (IT) energy load reductions (e.g., efficient server systems and Energy Star-labeled computer equipment)?
2008 2001UNWEIGHTED BASE 570 —WEIGHTED BASE 553 —Yes, campus-wide 30% —Yes, in some campus units 36% —No 12% —No answer 22% —
Q29BD. Do you have plans to do more as far as implementing information technology (IT) energy load reductions (e.g., efficient server systems and Energy Star-labeled computer equipment)?
2008 2001UNWEIGHTED BASE 570 —WEIGHTED BASE 553 —Yes 67% —No/No Answer 33% —
Q30AA. Has your campus implemented any efficiency standards for new buildings or retrofits of existing buildings?
2008 2001UNWEIGHTED BASE 570 —WEIGHTED BASE 553 —Yes, campus-wide 31% —Yes, in some campus units 31% —No 18% —No answer 20% —
Q30BA. Do you have plans to do more as far as implementing efficiency standards for new buildings or retrofits of existing buildings?
2008 2001UNWEIGHTED BASE 570 —WEIGHTED BASE 553 —Yes 68% —No/No answer 32% —
Q30AB. Has your campus implemented any life-cycle analysis for new building or retrofit projects (as contrasted with simple pay-back analysis)?
2008 2001UNWEIGHTED BASE 570 —WEIGHTED BASE 553 —Yes, campus-wide 21% —Yes, in some campus units 28% —No 30% —No answer 21% —
Q30BB. Do you have plans to do more as far as implementing life-cycle analysis for new building or retrofit projects (as contrasted with simple pay-back analysis)?
2008 2001UNWEIGHTED BASE 570 —WEIGHTED BASE 553 —Yes 58% —No/No answer 42% —
Q30AC. Has your campus implemented any LEED (Leadership in Energy and Environmental Design) certification for new buildings or retrofits of existing buildings? (LEED is a green building rating system that is a nationally accepted benchmark for the design, construction and operation of high performance buildings.)
2008 2001UNWEIGHTED BASE 570 —WEIGHTED BASE 553 —Yes, campus-wide 12% —Yes, in some campus units 23% —No 46% —No answer 19% —
Q30BC. Do you have plans to do more as far as implementing LEED (Leadership in Energy and Environmental Design) certification for new buildings or retrofits of existing buildings? (LEED is a green building rating system that is a nationally accepted benchmark for the design, construction and operation of high performance buildings.)
2008 2001UNWEIGHTED BASE 570 —WEIGHTED BASE 553 —Yes 58% —No/No answer 42% —
Q30AD. Has your campus implemented any formal plans for reducing emissions of CO
2 and other greenhouse gases?
2008 2001UNWEIGHTED BASE 570 —WEIGHTED BASE 553 —Yes, campus-wide 12% —Yes, in some campus units 15% —No 53% —No answer 19% —
Q30BD. Do you have plans to do more as far as implementing formal plans for reducing emissions of CO
2 and other greenhouse gases?
2008 2001UNWEIGHTED BASE 570 —WEIGHTED BASE 553 —Yes 49% —No/No answer 51% —

129CAMPUS ENVIRONMENT 2008
Section VIII
Topline Results (cont.)
Q31A. How many heating degree days, from base 65 degrees, does your campus have?
2008 2001UNWEIGHTED BASE 570 325WEIGHTED BASE 553 3260 2% —1 - 100 7% 7%101 - 200 14% 11%201 - 1000 5% 5%1001 - 5000 6% 9%5001 - 10000 10% 11%No Answer 55% 57%
Q31B. How many cooling degree days, from base 65 degrees, does your campus have?
2008 2001UNWEIGHTED BASE 570 325WEIGHTED BASE 553 3260 2% *1 - 100 6% 5%101 - 200 15% 10%201 - 1000 14% 15%1001 - 5000 7% 10%5001 - 10000 * —No Answer 57% 60%
Q32A. What is the approximate total gross square footage of the heated and/or air conditioned buildings on campus?
2008 2001UNWEIGHTED BASE 570 325WEIGHTED BASE 553 326Less than 200,000 sq ft 9% 13%200,000 to 399,999 sq ft 10% 14%400,000 to 599,999 sq ft 13% 11%600,000 to 999,999 sq ft 14% 9%1 million to less than 2 million sq ft 12% 12%2 million to less than 3 million sq ft 4% 3%3 million to less than 4 million sq ft 3% 2%4 million to less than 5 million sq ft 2% 1%More than 5 million sq ft 5% 6%No Answer 28% 29%
Q32B. Has this square footage increased, stayed about the same or decreased since 2002?
2008 2001UNWEIGHTED BASE 570 —WEIGHTED BASE 553 —Increased 57% —Stayed about the same 15% —Decreased 1% —No answer 27% —
Q33. In 2006, about how many kilowatt hours (kWh) of electricity did your campus consume? (Include both purchased and self-generated or cogenerated electricity.)
2008 2001UNWEIGHTED BASE 570 325WEIGHTED BASE 553 326Less than 1 million kWh 9% 4%1 million to less than 5 million kWh 11% 10%5 million to less than 10 million kWh 8% 7%10 million to less than 25 million kWh 11% 8%25 million to less than 50 million kWh 4% 3%50 million to less than 100 million kWh 3% 3%More than 100 million kWh 4% 5%No Answer 49% 61%
Q34. Thinking about the electricity your campus generated or cogenerated in 2006, about how many kilowatt hours (kWh) of electricity did you generate?
2008 2001UNWEIGHTED BASE 570 325WEIGHTED BASE 553 326None 51% 42%Less than 10,000 kWh 3% 1%10,000 to 99,999 kWh 1% —100,000 to 999,999 kWh 2% 1%1 million to less than 5 million kWh 1% 1%5 million to less than 10 million kWh 1% 1%10 million to less than 25 million kWh 1% —25 million to less than 50 million kWh 1% —50 million to less than 100 million kWh 1% *More than 100 million kWh 1% 1%No Answer 37% 53%
Q35. About what percentage of your buildings on campus have sub-meters or individual building meters to track energy consumption (electricity or heat) by building?
2008 2001UNWEIGHTED BASE 570 —WEIGHTED BASE 553 —None 12% —1% to 25% 18% —26% to 50% 9% —51% to 75% 9% —76% to 100% 20% —No answer 32% —
Q36AA. Does your campus offer free or discounted bus or public transit passes to students?
2008 2001UNWEIGHTED BASE 570 325WEIGHTED BASE 553 326Yes, campus-wide 26% 20%Yes, in some campus units 5% 4%No 41% 46%No answer 29% 31%
Q36BA. Do you have plans to do more as far as offering free or discounted bus or public transit passes to students?
2008 2001UNWEIGHTED BASE 570 325WEIGHTED BASE 553 326Yes 24% 2%No/No answer 76% 98%
Q36AB. Does your campus offer free or discounted bus or public transit passes to faculty and staff?
2008 2001UNWEIGHTED BASE 570 325WEIGHTED BASE 553 326Yes, campus-wide 20% 15%Yes, in some campus units 1% 3%No 50% 51%No answer 28% 30%

130NATIONAL WILDLIFE FEDERATION CAMPUS ECOLOGY
Section VIII
Topline Results (cont.)
Q36BB. Do you have plans to do more as far as offering free or discounted bus or public transit passes to faculty and staff?
2008 2001UNWEIGHTED BASE 570 325WEIGHTED BASE 553 326Yes 19% 2%No/No answer 81% 98%
Q36AC. Does your campus offer a carpooling or vanpooling program?
2008 2001UNWEIGHTED BASE 570 325WEIGHTED BASE 553 326Yes, campus-wide 13% 11%Yes, in some campus units 8% 5%No 50% 53%No answer 28% 31%
Q36BC. Do you have plans to do more as far as offering a carpooling or vanpooling program?
2008 2001UNWEIGHTED BASE 570 325WEIGHTED BASE 553 326Yes 22% 4%No/No answer 78% 96%
Q36AD. Does your campus offer incentives not to drive alone (e.g., emergency rides home, discounted carpool parking, parking cashout)?
2008 2001UNWEIGHTED BASE 570 325WEIGHTED BASE 553 326Yes, campus-wide 10% 10%Yes, in some campus units 3% 3%No 59% 57%No answer 28% 30%
Q36BD. Do you have plans to do more as far as offering incentives not to drive alone (e.g., emergency rides home, discounted carpool parking, parking cashout)?
2008 2001UNWEIGHTED BASE 570 325WEIGHTED BASE 553 326Yes 19% 2%No/No answer 81% 98%
Q36AE. Does your campus offer adequate and protected bicycle racks?
2008 2001UNWEIGHTED BASE 570 325WEIGHTED BASE 553 326Yes, campus-wide 31% 34%Yes, in some campus units 30% 25%No 12% 12%No answer 27% 30%
Q36BE. Do you have plans to do more as far as offering adequate and protected bicycle racks?
2008 2001UNWEIGHTED BASE 570 325WEIGHTED BASE 553 326Yes 43% 5%No/No answer 57% 95%
Q36AF. Does your campus offer bicycle lanes?
2008 2001UNWEIGHTED BASE 570 325WEIGHTED BASE 553 326Yes, campus-wide 5% 7%Yes, in some campus units 7% 6%No 59% 56%No answer 28% 31%
Q36BF. Do you have plans to do more as far as offering bicycle lanes?
2008 2001UNWEIGHTED BASE 570 325WEIGHTED BASE 553 326Yes 16% 3%No/No answer 84% 97%
Q37A. Approximately what percentage of your faculty and staff travel to campus by driving alone (one occupant in the vehicle)?
2008 2001UNWEIGHTED BASE 570 —WEIGHTED BASE 553 —None * —1% to 20% 1% —21% to 40% 3% —41% to 60% 5% —61% to 80% 17% —81% to 100% 40% —No answer 34% —
Q37B. Approximately what percentage of your students travel to campus or class by driving alone (one occupant in the vehicle)?
2008 2001UNWEIGHTED BASE 570 —WEIGHTED BASE 553 —None 1% —1% to 20% 9% —21% to 40% 7% —41% to 60% 10% —61% to 80% 17% —81% to 100% 22% —No answer 35% —
Q38. Thinking about where your campus’s students live, roughly what percentage live in university-owned residence halls on campus?
2008 2001UNWEIGHTED BASE 570 325WEIGHTED BASE 553 3260% 21% 40%1% - 10% 7% 22%11% - 20% 5% 1%21% - 30% 6% 2%31% - 40% 8% *41% - 50% 3% *51% - 60% 4% *61% - 70% 5% —71% - 80% 3% 1%81% - 90% 5% 1%91% - 100% 4% *No Answer 29% 32%

131CAMPUS ENVIRONMENT 2008
Section VIII
Topline Results (cont.)
Q39A. Thinking about students, faculty and staff together, roughly how many parking spaces does your campus provide for regular student, faculty or staff parking?
2008 2001UNWEIGHTED BASE 570 325WEIGHTED BASE 553 3260 * 1%1 - 500 16% 14%501 - 1000 12% 17%1001 - 2000 15% 12%2001 - 5000 9% 11%5001+ 8% 6%No Answer 41% 38%
Q39B. Thinking about students, faculty and staff together, for students, faculty and staff who do drive to campus, what is the average commute, in miles?
2008 2001UNWEIGHTED BASE 570 325WEIGHTED BASE 553 3265 or less 9% 7%6 - 10 14% 18%11 - 15 12% 12%16 - 20 9% 8%More than 20 7% 8%No Answer 49% 47%
Q40. Does your campus plan to increase the number of parking spaces, keep about the same number or decrease the number of parking spaces on campus?
2008 2001UNWEIGHTED BASE 570 —WEIGHTED BASE 553 —Increase 34% —Keep the same 32% —Decrease 4% —No answer 30% —
Q41. Thinking about the fleet vehicles on campus, roughly how many does the campus lease or own?
2008 2001UNWEIGHTED BASE 570 325WEIGHTED BASE 553 3265 or less 11% 13%6 - 10 12% 9%11 - 15 8% 10%16 - 25 9% 10%26 - 50 10% 9%51 - 200 9% 8%More than 200 4% 5%No Answer 35% 35%
Q42. About how many fleet vehicles on campus use alternative energy sources or fuels (e.g., electric, hybrid electric, propane, biodiesel, biofuels, etc.)?
2008 2001UNWEIGHTED BASE 570 325WEIGHTED BASE 553 3260% 40% 51%1% - 10% 14% 8%11% - 20% 5% 1%21% - 30% 3% 1%31% - 40% 1% *41% - 50% 1% 1%51% - 60% 1% —61% - 70% 1% —71% - 80% * *81% - 90% * *91% - 100% * 1%No Answer 33% 36%
Q43. Does your campus plan to add alternative-fuel vehicles to the campus fleet in the next two years?
2008 2001UNWEIGHTED BASE 570 —WEIGHTED BASE 553 —Yes 35% —No/No answer 65% —
Q44. How often does your campus purchase carbon credits or renewable energy certificates to offset campus greenhouse gas emissions (emissions resulting directly from campus operations, as well as indirectly from activities such as commuting, business travel, conferences and other goods and services)?
2008 2001UNWEIGHTED BASE 570 —WEIGHTED BASE 553 —All of the time 2% —Sometimes 6% —Never 61% —No answer 31% —
Questions Asked of all Respondents (Q1-Q17)
[OMITTED FROM TOPLINE: Q45. Please use the space below to provide additional information or comments.]
Q46. Thinking about all the questions, which best describes how they were answered?
2008 2001UNWEIGHTED BASE 1237 1116WEIGHTED BASE 1234 1118By one person 50% 61%By one person, after consulting with others 18% 17%By two or more people 6% 4%No answer 25% 18%
[OMITTED FROM TOPLINE: Q47. So we can take account of the different ways campuses are participating in this study, could you list the titles of the main people who answered the questions?]

132NATIONAL WILDLIFE FEDERATION CAMPUS ECOLOGY
Acknowledgments
On behalf of National Wildlife Federation and Princeton Survey Research Associates International, sincere appreciation is extended to the
individuals, organizations and institutions that provided substantive guidance and support during the development, testing and launch of
the survey. As with any major undertaking, there were many people involved — some of whom are unknown to the authors. We apologize
for omitting anyone from this list who contributed to the success of the project.
Survey Instrument Reviewers, Pilot Survey Respondents, and Report ReviewersJillian Buckholz, Sustainability Coordinator, California State University, Chico
Paul Chamberlin, Assistant Vice President, Energy & Campus Development,
University of New Hampshire
Sarah Hammond Creighton, Project Manager, Tufts Climate Initiative,
Tufts University
Lindsey Cromwell, Sustainability Coordinator, Environmental Studies Institute,
Santa Clara University
Julian Dautremont-Smith, Associate Director, Association for the
Advancement of Sustainability in Higher Education (AASHE)
Calvin DeWitt, Professor of Environmental Studies,
University of Wisconsin-Madison
Nathan Engstrom, Coordinator, Office of Environmental Sustainability,
Oberlin College
Rob Gogan, Supervisor of Waste Management, Harvard University
Gary Guitzkow, Power Plant Manager, University of Wisconsin-Madison
Rob Kennedy, TDM Manager, Transportation Services,
University of Wisconsin-Madison
Greg Keoleian, Professor and Co-Director, Center for Sustainable Systems,
University of Michigan
Bob Koester, Professor of Architecture and Director,
Center for Energy Research/Education/Service, Ball State University
Catherine Owen Koning, Professor of Environmental Science,
Franklin Pierce University
Terry Link, Director, Office of Campus Sustainability, Michigan State University
John Lund, Director of Geo-Heat Center, Oregon Institute of Technology
Jean MacGregor, Senior Scholar and Director, Curriculum for
the Bioregion Initiative, The Evergreen State College
Matthew B. Malten, Assistant Vice Chancellor for Campus Sustainability,
Washington University in St. Louis
Rick Martin, Sustainability Division, Syracuse University
Jim Minesky, Adjunct faculty in Biology, Pennsylvania State University
Glen Mowery, Director of Utilities & Energy Management, University of Iowa
Mike Nagel, Assistant Director for Energy Management,
University of Minnesota-Twin Cities
Brandi Nagle, Senior Analyst, Environmental Credit Corp.
(formerly at Pennsylvania State University)
Dave Newport, Director, Environmental Center,
University of Colorado at Boulder
Mark Nickel, Director of University Communications, Brown University
Brett Pasinella, Program Coordinator, Climate and Biodiversity Education,
Office of Sustainability, University of New Hampshire
Julia Person, Graduate student, Portland State University
Mike Prinkey, Energy Program Engineer, Office of Physical Plant,
Pennsylvania State University
Cindy Shea, Sustainability Coordinator,
University of North Carolina at Chapel Hill
Sarah Surak, Public Relations, Facilities Services Department,
University of Tennessee, Knoxville
Kurt Teichert, Environmental Coordinator, Brown University
Ed Terceiro, Executive Vice President, Mount Wachusett Community College
Peter Trainor, Vice President of Academic Affairs,
Mount Wachusett Community College
Gioia Thompson, Environmental Coordinator, University of Vermont
Press Tele-Conference, Report Release — August 21, 2008 ModeratorScott Carlson, Senior Reporter, Chronicle of Higher Education
SpeakersMary McIntosh, President,
Princeton Survey Research Associates International
Kevin Coyle, Vice President, Education and Training,
National Wildlife Federation
Ken Gaalswyk, Project Director,
Princeton Survey Research Associates International
Lee Pelton, President, Willamette University
Terry Calhoun, Director, Media Relations and Publications,
Society for College and University Planning
National Wildlife Federation Staff and Project TeamLarry J. Schweiger, President and Chief Executive Officer
Jaime Matyas, Chief Operating Officer
Jeremy Symons, Senior Vice President of Conservation and Education
Kevin Coyle, Vice President, Education and Training
Jennifer Jones, Vice President of Strategic Communications
Doug Inkley, Senior Wildlife Scientist
Laura Hickey, Senior Director, Global Warming Education
L. Julian Keniry, Senior Director, Campus and Community Leadership
Lisa Madry, Campus Field Director
Kristy M. Jones, Manager, Campus Climate Education and Action
Jennifer Fournelle, Campus Ecology Program Coordinator
Xarissa Holdaway, Campus Ecology E-news Coordinator
David J. Eagan, Campus Ecology writer,
based at the University of Wisconsin-Madison
Jolea Bryant, Campus Field Coordinator
Praween Dayananda, Campus Field Coordinator
Justin Schott, Campus Field Coordinator
Mary Burnette, Associate Director of Communications
Danielle Brigida, Grassroots Assistant
Amanda Cooke, Communications Intern
Craig Culp, Communications Manager
Bill Dion, Communications Manager, TV and Radio Production
Matthew Elder, Wildlife Outreach Intern
Sara Prohaska, Multi-Media Producer
Miles Grant, Communications Manager for State Outreach
Kristin Kranendonk, former Campus Ecology staff
Jordan Lubetkin, Regional Communications Manager,
Great Lakes Natural Resource Center
Aislinn Maestas, Communications Associate
Dustin McCarty, Campus Ecology Summer 2008 WorkStudy
Lacey McCormick, Communications Manager,
Gulf States National Resource Center
Tim Warman, Senior Director, Global Warming Program
Aileo Weinman, Communications Manager
Kurt Zwally, Manager of Global Warming Solutions

CA+BD
C
A-This report is a publication of the Campus
Ecology program of National Wildlife Federation.
Phone: (703) 438-6000 or (800) 822-9919
Email: [email protected]
Web: www.CampusEcology.org

CA+BD
C
A-
© 2008 National Wildlife Federation
Permission is granted to copy with attribution and
for noncommercial purposes only. Visit www.nwf.org
This report is a publication of the Campus
Ecology program of National Wildlife Federation.
Phone: (703) 438-6000 or (800) 822-9919
Email: [email protected]
Web: www.CampusEcology.org