CALIFORNIA ENERGY COMMISSIONseuc.senate.ca.gov/sites/seuc.senate.ca.gov/files/03-01-11CEC_Dec... ·...
32
STATE OF CALIFORNIA – NATURAL RESOURCES AGENCY ARNOLD SCHWARZENEGGER, Governor 1 CALIFORNIA ENERGY COMMISSION 1516 NINTH STREET, MS 39 SACRAMENTO, CA 95814-5512 www.energy.ca.gov December 2, 2010 Senator Alex Padilla, Chairman Senate Energy, Utilities and Communications Committee State Capitol, Room 4038 Attention: Jacqueline Kinney Dear Senator Padilla: Enclosed are responses to the Committee’s most recent questions pertaining to the ongoing review of the Public Interest Energy Research (PIER) program. The attachments address questions relating to revenue-expenditure details, documentation of ratepayer benefits, and historical documents discussing various administrative models for PIER. In addition, we wanted to let you know that on November 10, 2010, the Energy Commission hosted a meeting of the PIER Advisory Board. This distinguished panel of stakeholders has expertise in energy research, public policy, the environment, utility and clean tech industries. The November 10 th meeting reflected upon the current state of PIER, discussed the funding priorities for public interest energy research, and provided feedback on areas for improvement. We were pleased to learn that it was virtually unanimous that the PIER program is still perceived as successful and necessary. We also received valuable input on suggested program improvements from administration of the program, to ensuring the proper balance between cutting edge research and bringing projects to commercialization. As we prepare for the next Senate Energy hearing regarding PIER, we will synthesize the Advisory Board comments and recommendations and share them with you and the committee members. Please let us know if we can offer further assistance. We look forward to addressing you in January. Sincerely, MELISSA JONES Executive Director Enclosure cc: Members, Senate Energy, Utilities, and Communications Committee Wade Teasdale, Consultant, Senate Republican Caucus
Transcript of CALIFORNIA ENERGY COMMISSIONseuc.senate.ca.gov/sites/seuc.senate.ca.gov/files/03-01-11CEC_Dec... ·...

STATE OF CALIFORNIA – NATURAL RESOURCES AGENCY ARNOLD SCHWARZENEGGER, Governor
1
CALIFORNIA ENERGY COMMISSION 1516 NINTH STREET, MS 39 SACRAMENTO, CA 95814-5512 www.energy.ca.gov
December 2, 2010
Senator Alex Padilla, Chairman Senate Energy, Utilities and Communications Committee State Capitol, Room 4038 Attention: Jacqueline Kinney
Dear Senator Padilla: Enclosed are responses to the Committee’s most recent questions pertaining to the ongoing review of the Public Interest Energy Research (PIER) program. The attachments address questions relating to revenue-expenditure details, documentation of ratepayer benefits, and historical documents discussing various administrative models for PIER.
In addition, we wanted to let you know that on November 10, 2010, the Energy Commission hosted a meeting of the PIER Advisory Board. This distinguished panel of stakeholders has expertise in energy research, public policy, the environment, utility and clean tech industries. The November 10th meeting reflected upon the current state of PIER, discussed the funding priorities for public interest energy research, and provided feedback on areas for improvement. We were pleased to learn that it was virtually unanimous that the PIER program is still perceived as successful and necessary. We also received valuable input on suggested program improvements from administration of the program, to ensuring the proper balance between cutting edge research and bringing projects to commercialization. As we prepare for the next Senate Energy hearing regarding PIER, we will synthesize the Advisory Board comments and recommendations and share them with you and the committee members.
Please let us know if we can offer further assistance. We look forward to addressing you in January.
Sincerely,
MELISSA JONES Executive Director
Enclosure cc: Members, Senate Energy, Utilities, and Communications Committee
Wade Teasdale, Consultant, Senate Republican Caucus

California Energy Commission Response to the October 26, 2010 Memo from Senate Committee on Energy, Utilities and Communication
The bolded items below are the information requests taken verbatim from the October 16, 2010 memo, in Appendix A. The Energy Commission response follows.
1. Revenue-Expenditure spreadsheet – revision of the “PIER Electric Fund”
spreadsheet and notations to: [NOTE: All tables referenced for items 1 a-g are contained in Appendix B] (a) include in the “Utility Transfer” number only the amount collected
directly from ratepayers, with unspent balances or other amounts separated out and presented separately if available as revenue for expenditure;
The Revenue collected from ratepayers each fiscal year is identified in the “Utility Transfer” row of the PIER Electric Fund, Table B-2. Additional revenues for expenditure include royalties, Surplus Money Investment Fund (SMIF) interest, repayments from the General Fund, and prior year adjustments. The unencumbered balance available for future year expenditures is identified in the “Fund Balance” row of the PIER Electric Fund, Table B-2.
(b) specify as a separate item for each year the beginning carry-over balance
from the prior year;
The beginning carry-over balance for each fiscal year is the unencumbered funds from the prior fiscal year and is identified in the “Beginning Balance” row of the PIER Electric Fund, Table B-2.
(c) note whether the $10 million annual transfer to AB 118 is permanent or for
a specified period and what portion of AB 118 total funding the $10 million represents;
PIER funds are required to be transferred to the Alternative and Renewable Fuel and Vehicle Technology Fund (ARFVTF) as long as funding is available in the trust fund. Health and Safety Code Section 44273 states: 44273. (b) Notwithstanding any other provision of law, the sum of ten million dollars ($10,000,000) shall be transferred annually from the Public Interest Research, Development, and Demonstration Fund created by Section 384 of the Public Utilities Code to the Alternative and Renewable Fuel and Vehicle Technology Fund….
2
Current statute does not contain a sunset provision for the AB 118 program.
The ARFVTF includes monies collected for smog abatement, vehicle registration, vessel registration, and identification plate fees. The Energy Commission’s baseline budget for the AB 118 program is $108 million. The $10 million has been approximately 9.25 percent of the annual AB 118 baseline program budget. However, with the downturn in the economy, revenues from smog abatement, vehicle and vessel registration, and identification plate fees deposited into the ARFTVF have diminished. The AB 118 program budget for FY 2010-11 is projected to be approximately $88 million. As a result, the $10 million of PIER funds now represents 11.4 percent of the AB118 projected budget. Additionally, the $10 million represents 13 percent of the PIER electric baseline program budget ($10M/$75.4M).
(d) a separation of royalties to indicate the EC’s view that these funds are not revenue available for expenditure (note – doesn’t Section 384 of the PU Code allow for expending royalties??);
Royalty payments received and deposited into the PIER trust fund are available for expenditure. However, the Energy Commission receives annual baseline budget authority (as indicated by the Total Revenue in Table B-2) based on the total amount available in the fund and what is ultimately approved through the Budget Act. In order to spend beyond $62.5M, the Energy Commission would need to request additional spending authority through the Budget Change Proposal process, or request continuous budget appropriation through the Legislative Bill process. The Energy Commission’s authority to collect royalties comes from Public Resources Code Section 25620.4, and Public Utilities Code Section 384.
Public Utilities Code 384. (a) Funds transferred to the State Energy Resources Conservation and Development Commission pursuant to this article for purposes of public interest research, development, and demonstration shall be transferred to the Public Interest Research, Development, and Demonstration Fund, which is hereby created in the State Treasury. The fund is a trust fund and shall contain money from all interest, repayments, disencumbrances, royalties, and any other proceeds appropriated, transferred, or otherwise received for purposes pertaining to public interest research, development, and demonstration. Any appropriations that are made from the fund shall have an encumbrance period of not longer than two years, and a liquidation period of not longer than four years. (b) Funds deposited in the Public Interest Research, Development, and Demonstration Fund may be expended for projects that serve the
3

energy needs of both stationary and transportation purposes if the research provides an electricity ratepayer benefit.
(e) a more clear designation of the expense items that are considered
“overhead” so that there is a separate line with a total amount of “overhead” (individual items of overhead underneath) and a separate line of “RD&D Project Funding” – to coincide with verbal representations at last hearing of what is viewed as “overhead” versus actual dollars awarded to conduct research;
Overhead includes labor and associated benefits, and operating expenses. Staff overhead, as reported at the last hearing, is listed on Table B-2 in the row titled “Staff Support.” Over 15 years, staff support has averaged approximately 10 percent of program expenditures. Technical support contract expenses are identified separately in the PIER Electric fund, Table B-2. This category includes tasks such as hiring contractors to assist with reviewing and evaluating proposals, developing information management systems, developing websites, conference logistics, and other prescribed support functions.
(f) a notation to the “RD&D Project Funding” line to specify that the amount
for each year represents the total amount of individual research awards made that year and a reference to where the public can find the list of individual research awards for each year (i.e. – the annual report, or web site page – see #3 below); and
A footnote has been added to the “RD&D Project Funding” to delineate that this row identifies the annual funding for research project awards.
The Public Interest Energy Research Annual Reports identify the individual research awards that began in the year covered by the report. All annual reports are available on the Commission website at http://www.energy.ca.gov/research/annual_reports.html
(g) a separate Revenue-Expenditure presentation of the natural gas PIER
program with the same categories and with verification that there is no overlap or duplication of expenses charged to the electric PIER program and the natural gas PIER program.
Table B-3, PIER Natural Gas Fund, provides a separate revenue-expenditure presentation of the PIER Natural Gas program. Energy Commission contract and grant forms detail an award’s budget source (the CEC-94 for contracts and the CEC 270 for grants). The budget source breaks down the respective funding amounts from natural gas and electricity funds by fiscal year. Additionally, the Energy Commission accounts for the PIER electricity and
4
PIER natural gas programs expenditures separately through the state’s California State Accounting and Reporting System (CALSTARS). These measures ensure no overlap or duplication of expenses occur when charges are made to the PIER electric and natural gas programs.
2. IOU Rate Case Documents – copies of any letters the Energy Commission has submitted to the CPUC in connection with IOU requests for recovering R&D expenses in their General Rate Cases – either in support or opposition.
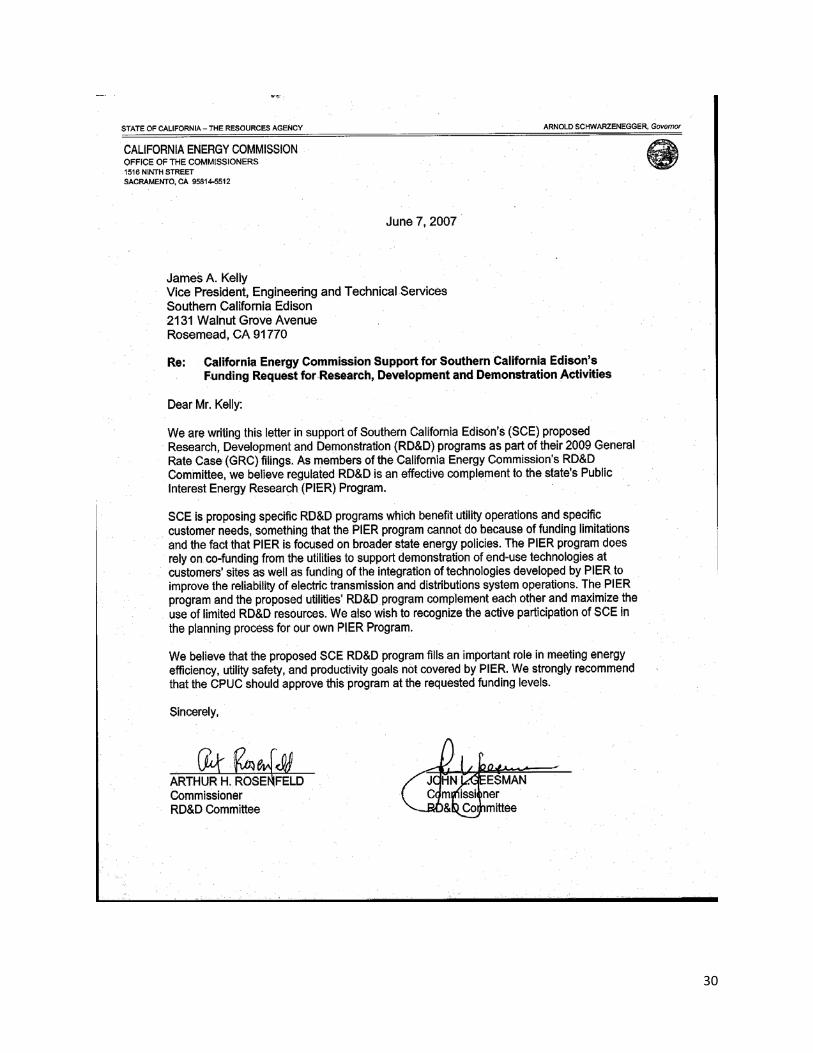
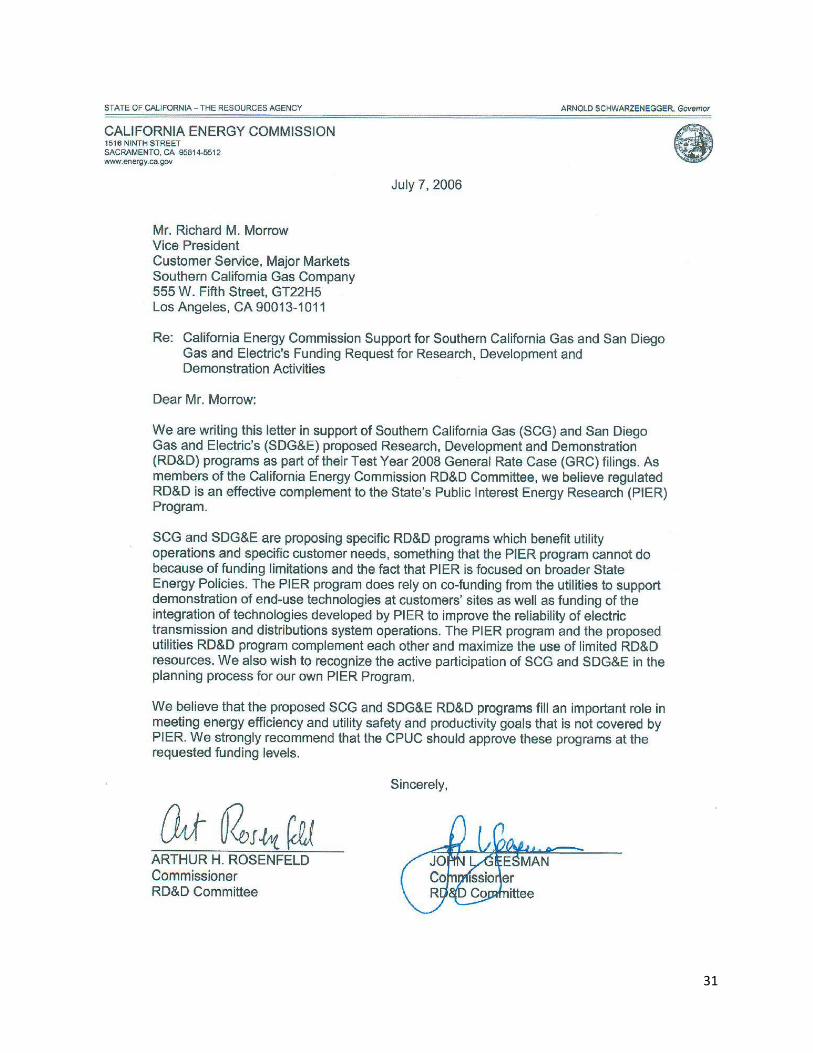
Appendix C contains copies of the following letters submitted to the California Public Utilities Commission by the Energy Commission, as requested from the Investor Owned Utilities in connection with their own R&D efforts: 1. July 7, 2006, addressed to Southern California Gas Company 2. June 7, 2007, addressed to Southern California Edison 3. July 7, 2010, addressed to Southern California Gas Company and San Diego
Gas and Electric
3. RD&D Project Funding – clarification that the dollar amounts for each year under this entry represents the total amount of individual awards for research (not administration or overhead); for example, ensure that this total amount does not include annual amounts for MR-001 – the amount provided to the CIEE for administration expenses -- or for any other awards that are purely for administration or overhead. NOTE: Please confirm that the list of individual research awards attached to the annual reports represent the universe of research awards made that year, and confirm that the list of awards starting on page 191 of the June responses represents the entire universe of individual research awards made from 2004 to 2009. The dollar amounts under “RD&D Project Funding”, Appendix B, Table B-2, are the total amounts for individual research project awards. All RD&D projects have an administrative component, usually identified in agreements as separate tasks, such as attending kickoff meetings, preparing progress and final reports, and obtaining and documenting match funds, as well as any needed permits. These administrative tasks are a necessary and valuable component of every research project. Therefore, the total research amount appropriately includes MR-001 (CIEE contract administrative expenses). MR-001 is not an individual award for specific research, but rather the sum of CIEE’s costs for all of the research activities under the prime contract 500-02-004. CIEE’s administrative component (MR-001) for contract 500-02-004 is in a separate work authorization rather than tasks. The list of individual research awards provided in the Annual Reports is a list of all research awards began that year. On page 191 of the spreadsheet provided
5
to your office in the June 15, 2010 response, PIER Electric Agreements: 2004-2009 Calendar Years, includes all PIER research and support awards from 2004 through 2009.
4. External Option – any and all documents or records of the Energy
Commission related to the request to develop an “external option” for administration of the PIER program (a JPA, a structure similar to NYSERDA, or other external option), including, but not limited to, memos discussing pros and cons of an external option, any documents in connection with the CPUC’s consideration of whether the Energy Commission or the UC should administer the natural gas PIER program, any legal opinions about a Energy Commission-University of California JPA.
Appendix D of this response includes the following documents that discuss options that were considered for the administration of the PIER Electric program and the CPUC’s consideration of who would administer the Natural Gas program. Documents Relevant to PIER Administrative Models 1. California Council on Science and Technology, California Public Interest
Energy Research-Independent PIER Review Panel Report, March 2004. 2. Kukulka, Ron et al. Public Interest Energy Research Program, Independent
Review Panel Response – Staff Report, California Energy Commission, July 20, 2004.
3. Abelson, David. Administration and Options Concerning California’s Public Interest Energy Research Programs, California Energy Commission, January 20, 2004.
4. Krebs, Martha et al. Public Interest Energy Research (PIER) Program: 2007-2011 Management and Staffing Plan. California Energy Commission, Research and Development Division. Publication number: CEC-500-2006-020-SF.
5. Weinberg, Carl and Linda Cohen. PIER Independent Review Panel letter to Energy Commission Chairman William J. Keese, 4 August 2004.
6. Therkelsen, Bob, former Energy Commission Executive Director. “PIER Program Evaluation.” PowerPoint presentation given to PIER Independent Review Panel Meeting in 2004.
Documents Relevant to CPUC Natural Gas Administration 7. California Public Utilities Commission, Order Instituting Rulemaking on the
Establishment of a Public Purpose Program Surcharge Pursuant to Assembly Bill (AB) 1002, Opinion Regarding Implementation of Assembly Bill 1002, Establishing a Natural Gas Surcharge, Decision 04-08-010, August 19, 2004.
8. California Public Utilities Commission. Testimony of Michael DeAngelis on Behalf of the California Energy Commission Concerning the Funding and Administration of a Natural Gas Public Interest R&D Program, Rulemaking 02-10-001, August 15, 2003.
6

5. Ratepayer Benefit – A presentation of the calculation and assumptions
showing how the Energy Commission reached its conclusion and supports its claim of ratepayer benefit from certain PIER-funded research, including, but not limited to:
(a) PIER research incorporated in to Title 24 Building Efficiency
Standards and Title 20 Appliance Efficiency Standards result in an “estimated annual cost savings of $970 million for California electric and natural gas ratepayers”. (page 40 of June responses); and
[NOTE: All references are listed at the end of the response to Question 5]
All ratepayer benefit calculations and assumptions are based upon the general guidance of Public Resources Code Section 25620.1:
25620.1. (b) The general goal of the program is to develop, and help bring to market, energy technologies that provide increased environmental benefits, greater system reliability, and lower system costs, and that provide tangible benefits to electric utility customers through the following investments:
(1) Advanced transportation technologies that reduce air pollution and greenhouse gas emissions beyond applicable standards, and that benefit electricity and natural gas ratepayers.
(2) Increased energy efficiency in buildings, appliances, lighting, and other applications beyond applicable standards, and that benefit electric utility customers.
(3) Advanced electricity generation technologies that exceed applicable standards to increase reductions in greenhouse gas emissions from electricity generation, and that benefit electric utility customers.
Specifically with regard to PIER research supporting Title 20 and 24, the annual cost savings to ratepayers was estimated based on five research projects. These estimates were not made by PIER program staff, but rather, the Energy Commission’s Building and Appliance Standards staff and others. They use assumptions and methods that were developed and used during the Energy Commission’s rulemaking process – part of the open and public standards adoption proceedings. In all cases, PIER-funded research provided the justification and support for state energy efficiency standards for appliances or buildings, and, in one case, the same standard was later adopted in federal standards.1 Table 1 lists the research projects that make up the estimated $970 million in savings, and the sections that follow provide detailed information on the assumptions and calculations used in estimating the energy and cost savings.
7

The original $970 million in estimated annual cost savings assumed an average electricity cost of $0.13/kWh. However, to be consistent with the cost effectiveness justifications used in the efficiency standards rulemaking, we are now using $0.14/kWh. As a result, the estimated energy cost savings have now been updated as shown in Table 1. The savings are considered conservative. First, they do not take into account cumulative impacts which would result in much larger savings for Californians. For instance, the estimated total cumulative savings from 2011 to 2023 for the television efficiency standards alone are over $8 billion.2
Secondly, for some of the measures, the savings are only for one year and do not account for the savings that continue to occur for the life of the measure (such as a cool roof, which may have a 15-20 year life). 3
Table 1 Building and Appliance Standards Cost Savings Resulting from PIER Research Research Estimated Annual Cost
Savings as Reported in June Response
($ million/yr)
Estimated Annual Cost Savings Updated for this Response with Updated
Electricity Costs ($ million/yr)
Television Energy Use* $873 $912 External Power Supply** $87 $90 Residential Furnace Fan Efficiency***
$5 $5
Cool Roofs for Residential*** $4 $4 Residential ACM Attic/Duct Model***
$1 $1
Total $970 $1,012 * Savings after all existing stock is replaced at the Tier 2 levels ** Savings after all existing stock is replaced at the Tier 2 levels *** Amounts represent annual cost savings
The detailed calculations and assumptions used to determine the energy cost savings identified in Table 1 are as follows:
1) Television Energy Use Savings A PIER-funded television study was used in the Energy Commission efficiency standards staff report and formed the analytical basis for the proposed television standards for low power settings and automatic dimming. This data was also used in PG&E’s Codes and Standards Enhancement (CASE) project to justify a new and updated standard for televisions and the Energy Commission Staff Report for the 2009 Appliance Efficiency Rulemaking.5 PIER data was also used in the development of proposed Tier I and Tier 2 standards. The standard was adopted in November 2009. The Tier 1 standards take effect on January 1, 2011. Tier 2 levels take effect on January 1, 2013. Table 2 compares the energy use for the base case of both Tier 1 and Tier 2.
8

Table 2 Comparison of Energy Use for Base Case, Tier 1 and Tier 26
Type Base Case (watts on “on mode”)
Tier 1 (watts on “on mode”)
Tier 2 (watts on “on mode”)
LCD 175.8 (a) 124.8 (a) 103.3 (b) Plasma 377.4 (c) 245.7 (c) 153.2 (c) (a) 37.6” screen size; (b) 39.1” screen size; (c) 50” screen size
The methodology used to determine the television energy savings are contained in the CASE Initiative. The following are the assumptions from the CASE Initiative: 7
• Assumed that 34 percent of the LCD and 5 percent of the plasma televisions already meet Tier 1 and that no televisions currently meet Tier 2. This means 66 percent of LCD and 95 percent of the plasma television’s are under the base case.
• Assumed market for LCD and plasma are indicated in Table 3. • Assumed annual television use is 1,907 hours. • Television life of 10 years — total savings of the regulations calculated
based on the reduced energy consumption for 10 years of sales. • Estimated annual television sales in 2011 = 4,360,000.
The formula for the savings calculations
• Tier 1 Power reduction for 2011=[4,360,000 x (175.8-124.8) x 0.66x0.88]+ [4,360,000 x (377.4-245.7) x 0.95x0.10] = 1.837 x 10^8 watts
• Tier 1 first year energy savings = 1.837 x 10^8 x1907/10^9 =350 GWh Table 3 shows the assumptions used for calculating statewide savings for an 11 year period. Table 4 shows the estimated California statewide energy savings. When all of the GWh savings are totaled, by the year 2022, the estimated savings is 6,516 GWh.8 Using an average electricity cost of $0.14/kWh, the estimated annual cost savings is $912 million.9 This amount is consistent with fact sheets and briefings prepared by the Natural Resources Defense Council which state, “California will save almost $1 billion/yr in the form of lower electric bills…."10
9
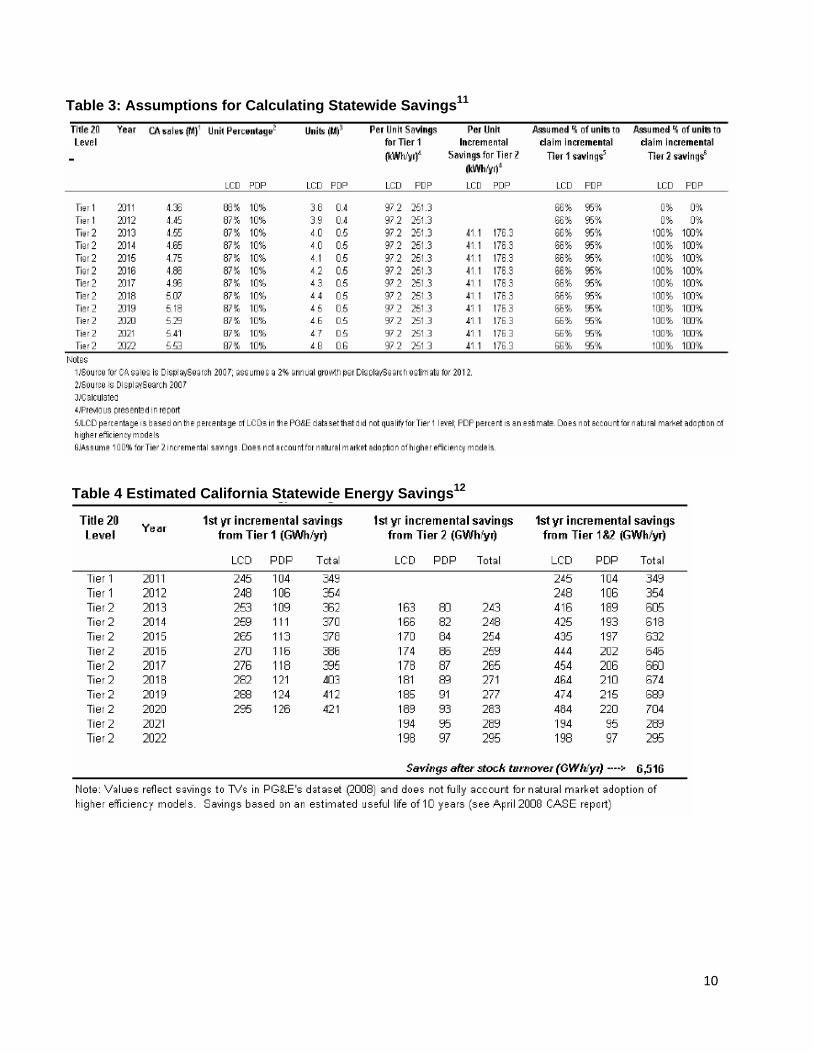
Table 3: Assumptions for Calculating Statewide Savings11
Table 4 Estimated California Statewide Energy Savings12
10

The cumulative energy cost savings to consumers for California is expected to be approximately $8.1 billion, covering a period of 12 years.13 The savings stream does not end in 2023 — it simply becomes the baseline for the next version of the standards. The estimated total value of the regulation is approximately $8.7 billion, which is the sum of energy cost savings from the proposed standards and savings in avoided construction cost of a $615 million natural gas power plant.14 2) External Power Supply In 2004, PIER funded a study on external power supply efficiencies. The study determined that some external power supplies are very inefficient—some as low as 20 percent. 15 There were over 2.5 billion power supplies in use in the United States and these power supplies consume at least 2 percent of all electricity produced.16 The PIER study showed that more efficient power supply designs could cut that usage in half saving energy and money for California consumers. This study provided the technical basis for the development and adoption of external power supply standards in California. These standards were adopted on December 15, 2005 and took effect on July 1, 2006 (Tier 1) and January 1, 2008 (Tier 2).17 The Energy Independence and Securities Act of 2007, passed by the U.S. Congress, includes the California External Power Supply standards. The federal standards took effect on July 1, 2008.18
The assumptions used to calculate the energy savings associated with using energy efficient power supplies are contained in the CASE Initiative and are listed as follows: 19 • Approximately 145.1 million external power supplies in California (2004) • Estimated annual energy use of 5,548 GWh (2004) • Efficiency standards adopted apply to both active mode and the no load
mode of external power supplies • Energy savings per unit calculated based on the estimated duty cycle and
efficiencies by power supply wattages as shown in Table 5:
Table 5 – Estimated Duty Cycles and Efficiencies by Power Supply Wattage20
• Energy savings calculated from the input wattages of power supplies with the same output wattage, but different efficiencies
11
• Savings are calculated on the average efficiency difference between the average compliant product and the average non-compliant product already measured
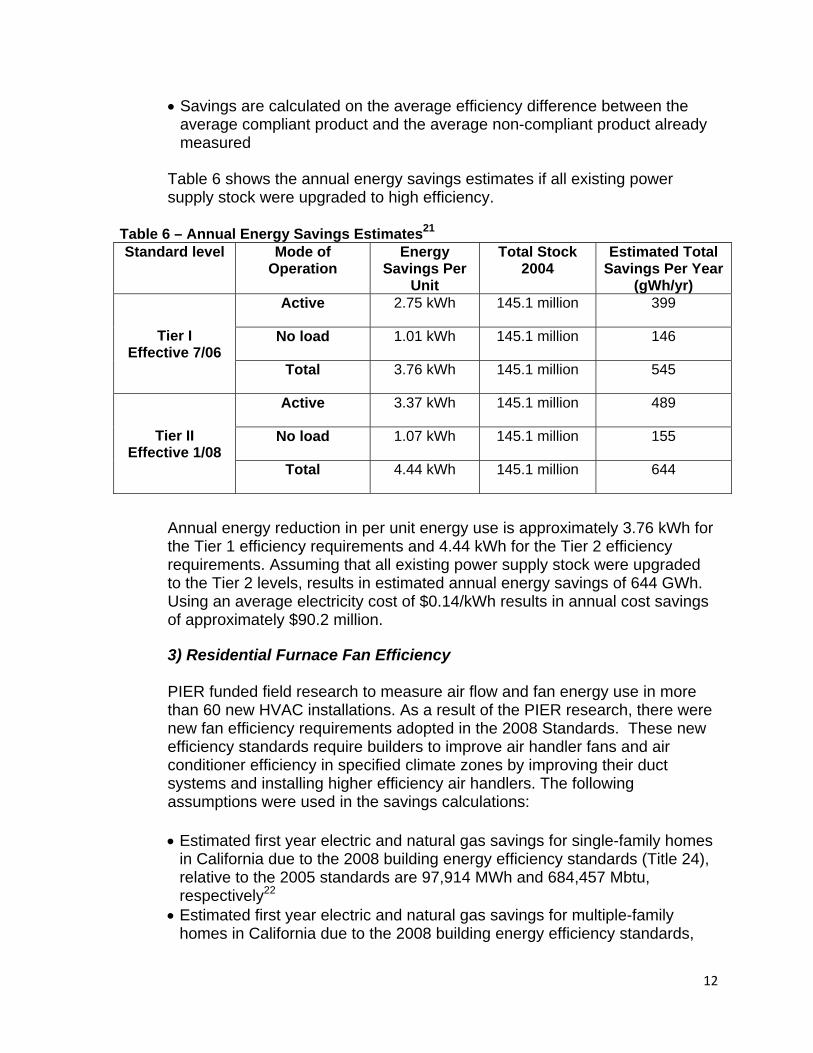
Table 6 shows the annual energy savings estimates if all existing power supply stock were upgraded to high efficiency.
Table 6 – Annual Energy Savings Estimates21
Standard level Mode of Operation
Energy Savings Per
Unit
Total Stock 2004
Estimated Total Savings Per Year
(gWh/yr)
Tier I Effective 7/06
Active 2.75 kWh 145.1 million 399
No load 1.01 kWh 145.1 million 146
Total 3.76 kWh 145.1 million 545
Tier II Effective 1/08
Active 3.37 kWh 145.1 million 489
No load 1.07 kWh 145.1 million 155
Total 4.44 kWh 145.1 million 644
Annual energy reduction in per unit energy use is approximately 3.76 kWh for the Tier 1 efficiency requirements and 4.44 kWh for the Tier 2 efficiency requirements. Assuming that all existing power supply stock were upgraded to the Tier 2 levels, results in estimated annual energy savings of 644 GWh. Using an average electricity cost of $0.14/kWh results in annual cost savings of approximately $90.2 million. 3) Residential Furnace Fan Efficiency PIER funded field research to measure air flow and fan energy use in more than 60 new HVAC installations. As a result of the PIER research, there were new fan efficiency requirements adopted in the 2008 Standards. These new efficiency standards require builders to improve air handler fans and air conditioner efficiency in specified climate zones by improving their duct systems and installing higher efficiency air handlers. The following assumptions were used in the savings calculations: • Estimated first year electric and natural gas savings for single-family homes
in California due to the 2008 building energy efficiency standards (Title 24), relative to the 2005 standards are 97,914 MWh and 684,457 Mbtu, respectively22
• Estimated first year electric and natural gas savings for multiple-family homes in California due to the 2008 building energy efficiency standards,
12

relative to the 2005 standards are 4,316 MWh and 64,986 Mbtu, respectively23
• Estimated first year electric and natural gas savings due to increase in furnace fan efficiency is 25 percent24
The formula for the estimated savings calculations:
• Annual electricity savings due to increase in furnace fan efficiency = (97914 + 4316) x .25 = 25558 MWh
• Annual natural gas savings due to increase in furnace fan efficiency = (684457+64986) x .25 = 187361 Mbtu = 1,873,608 therms
• An average electricity cost of $0.14/kWh and $0.98/therm was used to convert to estimated annual cost savings of approximately $5,414,185
4) Cool Roofs PIER research quantified the benefits associated with cool colored (including white) roofs for residential buildings. The 2008 Standards adopted a Performance Method compliance credit for residential projects that install a roofing product certified by the Cool Roofs Rating Council (www.coolroofs.org). The 2005 Standards already includes a compliance credit for nonresidential low slope (less than 2:12) roofs. The new language stemming from PIER research applies similar cool roofs credits to residential buildings. The following assumptions were used in the savings calculations:
• Estimated first year electric and natural gas savings for single-family homes
in California due to the 2008 building energy efficiency standards, relative to the 2005 standards are 97,914 MWh and 684,457 Mbtu, respectively25
• Estimated first year electric and natural gas savings for multiple-family homes in California due to the 2008 building energy efficiency standards relative to the 2005 standards are 4,316 MWh and 64,986 Mbtu, respectively26
• Estimated first year electric savings due to cool roofs for residential buildings is 30 percent27
The formula for the estimated savings calculations:
• Annual electricity savings due to cool roofs for residential buildings = (97914 + 4316) x .30 = 30669 MWh
• An average electricity cost of $0.14/kWh was used to convert to estimated annual cost savings of $4,293,660.
5) Residential Alternative Compliance Method Attic/Duct Model Attics with ducts are typical in California homes and energy efficiency depends on roof/attic/duct performance, particularly on peak days. PIER research developed an accurate attic model that evaluates all relevant compliance measures in combination for the purpose of standards development. The improved calculation method treats all compliance
13

measures equitably and was used for performance compliance of residential buildings in the 2008 Building Standards. The following assumptions were used in the savings calculations: • Estimated first year electric and natural gas savings for single-family homes
in California due to the 2008 building energy efficiency standards relative to the 2005 standards are 97,914 MWh and 684,457 Mbtu, respectively28
• Estimated first year electric and natural gas savings for multiple-family homes in California due to the 2008 building energy efficiency standards relative to the 2005 standards are 4,316 MWh and 64,986 Mbtu, respectively29
• Estimated first year electric and natural gas savings due to the attic/duct model is 5 percent30
The formula for the estimated savings calculations:
• Annual electricity savings due to the attic/duct model = (97914 + 4316) x .05 = 5112 MWh
• Annual natural gas savings due to the attic/duct model = (684457+64986) x .05 = 37,472 Mbtu = 374,722 therms
• An average electricity cost of $0.14/kWh and $0.98/therm was used to convert to estimated annual cost savings of $1,082,837.
All of the five measures above supported the state energy efficiency standards for appliances (Title 20) or buildings (Title 24). Table 7 summarizes the estimated energy and cost savings associated with each of these measures; the total estimate of savings exceeds $1 billion. Without the PIER research, the regulators would not have had the data to pursue standards that would increase the efficiency of homes and businesses in California. Additionally, these measures only account for those measures that have well documented calculations for estimates of savings that were the result of rulemakings. PIER has researched other energy efficiency measures, as identified in the next section (Part B), which have not yet become standards or fully commercialized. We did not include these savings as part of the estimated $970 million in savings provided in our June submittal.
14

Table 7 – Summary of Building and Appliance Standards Energy and Cost Savings Resulting from PIER Research
Research Measure Estimated Annual Energy Savings Estimated Annual Energy Cost Savings kWh (x 1000) Therms (x1000)
Television Energy Use* 6,516,000 0 $912,240,000 External Power Supply** 644,244 0 $90,194,160 Residential Furnace Fan Efficiency***
25,558 1,874 $5,414,185
Cool Roofs for Residential*** 30,669 0 $4,293,660 Residential Attic/Duct Model*** 5,112 374,722 $1,082,837 Total 7,221,583 376,596 $1,013,224,842 * Savings after all existing stock is replaced at the Tier 2 levels ** Savings after all existing stock is replaced at the Tier 2 levels *** Amounts represent annual cost savings
(b) Internal power supplies in products such as desktop and laptop
computers “developed through PIER that could save California consumers and businesses more than $800 million in energy costs over the next five years.” (Page 40 of June responses).
The $800 million in energy cost savings for PIER research on internal power supplies for desktop and laptop computers is an estimate of potential savings. Though these are not yet achieved savings, they represent a very promising avenue for significant savings from R&D, as shown in Table 8. PIER research to date has focused on desktop computers and how to increase the energy efficiency through internal power supplies and other component improvements. There are not, as yet, state energy efficiency standards resulting from the work. However, some of the results–such as the Energy Commission’s test protocols for internal power supplies–have been used by others. Additionally, PIER research on desktop computers has focused on improving various components that could result in annual energy savings of up to 284 kWh per computer. When extrapolated to the estimated number of computers in California, this energy savings has the potential to result in annual cost savings of up to $280 million per year. Over a five-year period, this savings calculation exceeds the $800 million in our June submittal. To clarify, these are not yet achieved savings– rather they represent a very promising avenue for significant future savings from recently completed R&D.
15
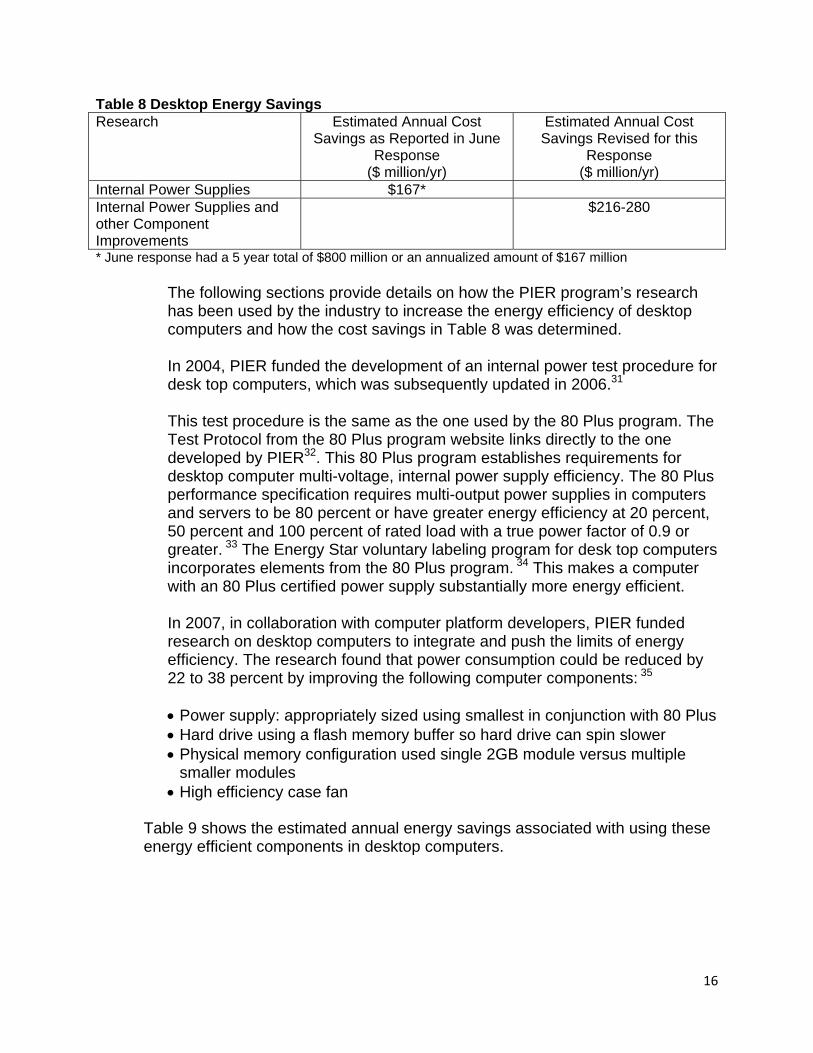
Table 8 Desktop Energy Savings Research Estimated Annual Cost
Savings as Reported in June Response
($ million/yr)
Estimated Annual Cost Savings Revised for this
Response ($ million/yr)
Internal Power Supplies $167* Internal Power Supplies and other Component Improvements
$216-280
* June response had a 5 year total of $800 million or an annualized amount of $167 million
The following sections provide details on how the PIER program’s research has been used by the industry to increase the energy efficiency of desktop computers and how the cost savings in Table 8 was determined. In 2004, PIER funded the development of an internal power test procedure for desk top computers, which was subsequently updated in 2006.31 This test procedure is the same as the one used by the 80 Plus program. The Test Protocol from the 80 Plus program website links directly to the one developed by PIER32. This 80 Plus program establishes requirements for desktop computer multi-voltage, internal power supply efficiency. The 80 Plus performance specification requires multi-output power supplies in computers and servers to be 80 percent or have greater energy efficiency at 20 percent, 50 percent and 100 percent of rated load with a true power factor of 0.9 or greater. 33 The Energy Star voluntary labeling program for desk top computers incorporates elements from the 80 Plus program. 34 This makes a computer with an 80 Plus certified power supply substantially more energy efficient. In 2007, in collaboration with computer platform developers, PIER funded research on desktop computers to integrate and push the limits of energy efficiency. The research found that power consumption could be reduced by 22 to 38 percent by improving the following computer components: 35
• Power supply: appropriately sized using smallest in conjunction with 80 Plus • Hard drive using a flash memory buffer so hard drive can spin slower • Physical memory configuration used single 2GB module versus multiple
smaller modules • High efficiency case fan
Table 9 shows the estimated annual energy savings associated with using these energy efficient components in desktop computers.
16

Table 9 Effects of Using Energy Efficient Components in Desktop Computers36
As part of the 2007 PIER research, a market-ready model and an ultra high efficiency unit were developed using these energy efficiency components and compared to the energy use of an Energy Star computer (Category B, 2006 year). Table 10 shows the comparison of energy use between these computers and the extrapolation of the savings to the estimated 7.08 million computers in California. 37
Table 10 – Estimated Annual Energy and Cost Savings with High Efficiency Desktop Computers Base Energy
Star Computer38 Market Ready
Computer Ultra High Efficiency Computer
Estimated Annual Energy Use (kWh/yr)
408 19039 12440
Estimated Annual Energy Savings per Unit Compared to Base (kWh/yr)
21841 28442
Estimated Desktop Computers in CA 7,080,000 7,080,000 Estimated Annual Energy Savings compared to Base (kWh/yr)
1,543,440 2,010,720
Estimated Annual Cost Savings compared to Base ($/yr)
$261,081,600 $281,500,800
Estimated Annual Cost Savings over 5 yrs compared to Base ($/yr)
$1,080,408,000 $1,407,504,000
The PIER-funded research on desktop computers has motivated the computer manufacturers to build high efficiency desktops and, assuming the industry implements the PIER-recommended efficiency measures for desktop computers, the high efficiency computers would result in estimated savings of more than $1 billion over 5 years. As desktop computers and other consumer electronics are one of the fastest growing energy loads in California, appliance and regulatory staff at the Energy Commission are contemplating future regulations in this area.
17
End Notes for Question 5
1 California External Power Supply Standard: http://www.energy.ca.gov/papers/2005‐03‐03_WILSON.PDF and Federal External Power Supply Standard: http://www1.eere.energy.gov/buildings/appliance_standards/residential/battery_external.html (note the State’s Standards adopted December 15, 2005 for external power supplies manufactured after January 1, 2008, are identical to the federal standards that took effect on July 1, 2008).
2 California Energy Commission, “2009 Appliance Efficiency Rulemaking, Staff Report,” CEC‐400‐2009‐024, September 2009, page v, 16, 30. http://www.energy.ca.gov/2009publications/CEC‐400‐2009‐024/CEC‐400‐2009‐024.PDF
3 Rosenfeld, Arthur, “Cool Roofs: From Cool Cities to a Cooler World, presentation at the Haagan Smit Symposium, June 3, 2009, page 21.
4 Pacific Gas and Electric Company, “Analysis Standards Options for Televisions,” Codes and Standards Enhancement (CASE) Initiative for PY 2008: Title 20 Standards Development, July 2008. http://www.energy.ca.gov/appliances/2008rulemaking/documents/2008‐07‐16_workshop/proposals/PGE_Revised_Television_Proposal.pdf
5 California Energy Commission, “2009 Appliance Efficiency Rulemaking, Staff Report,” CEC‐400‐2009‐024, September 2009. http://www.energy.ca.gov/2009publications/CEC‐400‐2009‐024/CEC‐400‐2009‐024.PDF
6 Pacific Gas and Electric Company, “Analysis Standards Options for Televisions,” Codes and Standards Enhancement (CASE) Initiative, page 15.
7 Ibid, page 15, 16 and 17 8 Ibid, pages 5, 17. 9 California Energy Commission, “2009 Appliance Efficiency Rulemaking, Staff Report,” CEC‐400‐
2009‐024, September 2009, page 15. http://www.energy.ca.gov/2009publications/CEC‐400‐2009‐024/CEC‐400‐2009‐024.PDF
10 Horowtiz, Noah, “Fact Sheet on California’s Proposed Energy Efficiency Standards for Televisions,”Natural Resources Defense Council. Undated. http://docs.nrdc.org/energy/files/ene_09091801b.pdf
11 Pacific Gas and Electric Company, “Analysis Standards Options for Televisions,” Codes and Standards Enhancement (CASE) Initiative, page 16.
12 Ibid, page 17 13 California Energy Commission, “2009 Appliance Efficiency Rulemaking, Staff Report,” CEC‐400‐
2009‐024, September 2009, page v, 16, 30. 14 Ibid 15 Calwell, Chris et al, “Active Mode Power Supply Efficiency: Key Issues Measured Data, and the
Design Competition Opportunity,” Presentation at APEC 2004, February 2004, page 5. 16 Ibid 17 California External Power Supply Standard: http://www.energy.ca.gov/papers/2005‐03‐
03_WILSON.PDF 18 Federal External Power Supply Standard:
http://www1.eere.energy.gov/buildings/appliance_standards/residential/battery_external.html 19 Pacific Gas and Electric Company, “Analysis of Standards Options for Single Voltage External AC
to DC Power Supplies,” Codes and Standards Enhancement (CASE) Initiative for PY 2004: Title 20 Standards Development, May 2004, page 9 http://www.energy.ca.gov/appliances/2003rulemaking/documents/case_studies/CASE_Power_Supplies.pdf
18
19
20 Ibid 21 Ibid, page 11 22 California Energy Commission, “Impact Analysis 2008 Update to the California Energy Efficiency
Standards for Residential and Nonresidential Buildings,” November 2007, page 14. http://www.energy.ca.gov/title24/2008standards/rulemaking/documents/2007‐11‐07_IMPACT_ANALYSIS.PDF
23 Ibid 24 Staff estimate from the High Performance Buildings and Standards Development Office,
California Energy Commission dated May 2010 25 California Energy Commission, “Impact Analysis 2008 Update to the California Energy Efficiency
Standards for Residential and Nonresidential Buildings,” November 2007, page 14. 26 Ibid 27 Staff estimate from the High Performance Buildings and Standards Development Office,
California Energy Commission dated May 2010 28 California Energy Commission, “Impact Analysis 2008 Update to the California Energy Efficiency
Standards for Residential and Nonresidential Buildings,” November 2007, page 14. 29 Ibid 30 Staff estimate from the High Performance Buildings and Standards Development Office,
California Energy Commission dated May 2010 31 Mansoor, Arshad, et al, “Generalized Test Protocol for Calculating the Energy Efficiency of
Internal AC‐DC and DC‐DC Power Supplies, Revision 6.5, July 7, 2010, page 4. http://efficientpowersupplies.epri.com/pages/Latest_Protocol/Generalized_Internal_Power_Supply_Efficiency_Test_Protocol_R6.5.pdf).
32 Information on the 80 Plus Program‐select test protocol and it links to endnote 31: http://www.plugloadsolutions.com/80PlusPowerSupplies.aspx
33 Ibid – Select 80 Plus buttons for efficiency 34 Ibid – Select 80 Plus buttons for Energy Star version 35 Ecos Consulting, “How Low Can We Go?”, page 2.
http://www.efficientproducts.org/reports/computers/EfficientComputer_Brochure_FINAL.pdf 36 Ibid 37 Nationwide estimate of desktop computers is 59 million (How Low Can We Go?‐endnote 35).
California is assumed to be 12% of the nation, hence 7.08 million computers 38 California Energy Commission, “How Low Can You Go?” A White Paper on Cutting Edge
Efficiency in Commercial Desktop Computers prepared by Ecos Consulting and EPRI, March 2008, page 14. http://www.efficientproducts.org/reports/computers/1337_EnergyEfficientComputerWhitePaper_FINAL_20Mar08.pdf
39 Ibid 40 Ibid 41 Ibid 42 Ibid, page 16. 43 Ibid, page 18.

Appendix A October 26, 2010 Letter from the Senate Committee on Energy, Utilities and
Communications
The following is the October 26, 2010 information request from the Senate Committee on Energy, Utilities and Communications requesting information on outstanding items in connection with the Committee’s review of the PIER program.
20

Memo To: Kellie Smith
From: Jackie Kinney
Date: October 26, 2010
Re: PIER Hearing
The following are outstanding items that the Senate Committee on Energy, Utilities and Communications has requested from the Energy Commission in connection with the committee’s review of the PIER program:
1. Revenue-Expenditure spreadsheet – revision of the “PIER Electric Fund” spreadsheet and notations to:
(a) include in the “Utility Transfer” number only the amount collected directly from
ratepayers, with unspent balances or other amounts separated out and presented separately if available as revenue for expenditure;
(b) specify as a separate item for each year the beginning carry-over balance from
the prior year; (c) note whether the $10 million annual transfer to AB 118 is permanent or for a
specified period and what portion of AB 118 total funding the $10 million represents;
(d) a separation of royalties to indicate the EC’s view that these funds are not
revenue available for expenditure (note – doesn’t Section 384 of the PU Code allow for expending royalties??);
(e) a more clear designation of the expense items that are considered “overhead”
so that there is a separate line with a total amount of “overhead” (individual items of overhead underneath) and a separate line of “RD&D Project Funding” – to coincide with verbal representations at last hearing of what is viewed as “overhead” versus actual dollars awarded to conduct research;
(f) a notation to the “RD&D Project Funding” line to specify that the amount for
each year represents the total amount of individual research awards made that year and a reference to where the public can find the list of individual research awards for each year (i.e. – the annual report, or web site page – see #3 below); and
21

22
(g) a separate Revenue-Expenditure presentation of the natural gas PIER program with the same categories and with verification that there is no overlap or duplication of expenses charged to the electric PIER program and the natural gas PIER program.
2. IOU Rate Case Documents – copies of any letters the Energy Commission has submitted to the CPUC in connection with IOU requests for recovering R&D expenses in their General Rate Cases – either in support or opposition.
3. RD&D Project Funding – clarification that the dollar amounts for each year under
this entry represents the total amount of individual awards for research (not administration or overhead); for example, ensure that this total amount does not include annual amounts for MR-001 – the amount provided to the CIEE for administration expenses -- or for any other awards that are purely for administration or overhead. NOTE: Please confirm that the list of individual research awards attached to the annual reports represent the universe of research awards made that year, and confirm that the list of awards starting on page 191 of the June responses represents the entire universe of individual research awards made from 2004 to 2009.
4. External Option – any and all documents or records of the Energy Commission
related to the request to develop an “external option” for administration of the PIER program (a JPA, a structure similar to NYSERDA, or other external option), including, but not limited to, memos discussing pros and cons of an external option, any documents in connection with the CPUC’s consideration of whether the Energy Commission or the UC should administer the natural gas PIER program, any legal opinions about a Energy Commission-University of California JPA.
5. Ratepayer Benefit – A presentation of the calculation and assumptions showing
how the Energy Commission reached its conclusion and supports its claim of ratepayer benefit from certain PIER-funded research, including, but not limited to:
(a) PIER research incorporated in to Title 24 Building Efficiency Standards
and Title 20 Appliance Efficiency Standards result in an “estimated annual cost savings of $970 million for California electric and natural gas ratepayers”. (page 40 of June responses); and
(b) Internal power supplies in products such as desktop and laptop
computers “developed through PIER that could save California consumers and businesses more than $800 million in energy costs over the next five years”. (page 40 of June responses).

Appendix B Response to Question 1 – Review Expenditure Spreadsheet
The following tables illuminate the responses to Question 1a-g: Table B-1, PIER Electric Fund spreadsheet, is the same table that was submitted with the October 7, 2010 response to the Senate Committee questions that arose after the August 10, 2010, Public Interest Energy Research (PIER) sunset review hearing. Table B-2, PIER Electric Fund is an expanded spreadsheet that adds explanations, definitions and assumptions to provide the expanded documentation requested. Table B-3, PIER Natural Gas Fund, presents the funding information requested on the PIER natural gas fund.
23

Table B-1: PIER Electric Fund as Submitted to the Senate Committee on 10-7-10 (In Millions) 1997 1998 1999 2000 2001 2002 2003 2004 2005 2006 2007 2008 2009 2010 2011
Revenue Utility Transfer1 37.08 55.66 61.86 61.86 61.86 63.25 63.26 64.41 65.28 66.60 68.00 69.03 69.62 70.80 35.40
Royalties - - - 0.01 0.02 0.50 0.00 0.08 1.04 0.24 0.41 2.27 0.19 0.19 0.19
SMIF Interest 0.51 2.69 5.33 8.06 5.70 3.79 2.93 4.44 7.93 10.90 10.19 5.55 1.79 1.80 0.90
Repayments from General Fund - - - - - - 20.00 - - - - - - - -
Total Revenue 37.59 70.20 90.19 117.27 105.07 121.41 114.63 92.48 111.00 146.98 161.39 189.22 170.56 177.27 78.41
Expenditures Transfer to AB 118 Fuels & Trans - - - - - - - - - - - 10.00 10.00 10.00 10.00
Transfer to Workforce Development - - - - - - - - - - - 12.50
Transfer to General Fund - - - - - 3.79 20.00 - - - - - - - -
Labor 0.47 1.70 1.68 2.76 2.87 3.51 2.32 3.24 3.64 3.87 5.52 4.17 5.26 5.71 5.71
Operating Expenses - 0.07 0.62 4.91 3.89 2.78 1.95 1.64 2.13 2.00 1.39 3.53 1.92 4.03 4.03
Support Contract Expenses 0.70 4.51 2.64 3.28 3.28 3.28 3.33 1.85 1.88 1.69 1.85 2.35 2.94 4.25 3.28
RD&D Project Funding 24.58 40.92 37.90 68.83 41.16 79.63 63.47 48.99 34.12 56.62 40.27 57.71 45.96 111.36 53.40
Total Expenses 25.75 47.20 42.84 79.77 51.20 92.98 91.07 55.73 41.77 64.18 49.02 90.26 66.07 135.34 76.41
Ending Balance 11.84 23.00 47.35 37.49 53.88 28.44 23.55 36.75 69.23 82.80 112.37 98.96 104.48 41.93 2.01
Explanations, Definitions, and AssumptionsAmounts for FY 2010 and 2011 are estimates. 1 Utility Transfer in 2002 includes a 14.1 million accrual.
24

Table B-2: PIER Electric Trust Fund Expanded as Requested in Response to 10/26/10 Questions (In Millions) Fiscal Year1 1997 1998 1999 2000 2001 2002 2003 2004 2005 2006 2007 2008 2009 2010 2011
Beginning Balance - 11.84 23.00 47.35 37.49 53.88 28.44 23.55 36.75 69.23 82.80 112.37 98.96 104.48 41.93
RevenueUtility Transfer 37.08 55.66 61.86 61.86 61.86 77.35 63.26 64.41 65.28 66.60 68.00 69.03 69.62 70.80 35.40 Utility Transfer Accrual Correction2 (14.10) Royalties - - - 0.01 0.02 0.50 0.00 0.08 1.04 0.24 0.41 2.27 0.19 0.19 0.19 SMIF Interest 0.51 2.69 5.33 8.06 5.70 3.79 2.93 4.44 7.93 10.90 10.19 5.55 1.79 1.80 0.90 Repayments from General Fund - - - - - - 20.00 - - - - - - - -
Total Revenue 37.59 70.20 90.19 117.27 105.07 121.41 114.63 92.48 111.00 146.98 161.39 189.22 170.56 177.27 78.41 Prior Year Adjustment3 - 0.05 1.62 0.45 1.62 (3.14) 2.17 10.48 5.42 6.74 3.09 4.67 7.99 - - Grand Total Revenue 37.59 70.24 91.81 117.72 106.70 118.27 116.80 102.95 116.43 153.72 164.48 193.89 178.55 177.27 78.41
ExpendituresTransfer to AB 118 Fuels & Trans4 - - - - - - - - - - - 10.00 10.00 10.00 10.00 Transfer to Workforce Development - - - - - - - - - - - 12.50 Transfer to General Fund - - - - - 3.79 20.00 - - - - - - - - Support5
Staff Support (Labor+Benefits and Operating Expenses) (a) 0.47 1.77 2.30 7.67 6.76 6.28 4.28 4.89 5.76 5.87 6.90 7.69 7.16 9.63 9.63 Technical Support Contract Expenses(b) 0.70 4.51 2.64 3.28 3.28 3.28 3.33 1.85 1.88 1.69 1.85 2.35 2.94 4.25 3.28
Support Total 1.17 6.28 4.95 10.94 10.04 9.56 7.60 6.73 7.64 7.56 8.75 10.04 10.10 13.88 12.90 State Operations6 - - - - - - - 0.00 0.01 0.00 0.00 0.01 0.01 0.10 0.10 RD&D Project Funding7 24.58 40.97 39.52 69.28 42.78 76.49 65.64 59.47 39.54 63.36 43.35 62.38 53.96 111.36 53.40
Total Expenditures 25.75 47.25 44.46 80.23 52.82 89.84 93.25 66.20 47.19 70.92 52.11 94.93 74.07 135.34 76.41
Fund Balance 11.84 23.00 47.35 37.49 53.88 28.44 23.55 36.75 69.23 82.80 112.37 98.96 104.48 41.93 2.01
Explanations, Definitions, and Assumptions:1 Amounts for FY 2010 and 2011 are estimates. Years listed reflect the beginning of the fiscal period as of July 1st and runs through June 30th of the next year.2 Utility Transfer Accrual Correction in 2002 includes a $14.1 million accrual error made by the State Controller's Office.
cancelled, closed with a remaining balance, or otherwise not executed.4 PIER funds transferred to the Alternative and Renewable Fuel and Vehicle Technology Fund is required by AB 118, Chapter 750, Statutes of 2007 and Health and Safety Code Section 44273 (b). 5 Support includes the following:
(a) Staff Support: Labor includes staff salaries and fringe benefits.Staff Support: Operating expenses include general expense, printing, mobile phones, travel in-state and out-of state, training, data processing, prorata, and indirect charges.
(b) Technical Support Contract Expenses include program and project support, audit support and students.6 State Operations include annual State Controller 21st Century charges and support of the Financial Information System for California funded directly out of the PIER fund.7 RD&D Project Funding includes research, development and demonstration project awards.
3 Prior Year Adjustment includes adjustments to RD&D Project Funding, such as unspent project PIER funds that will revert back to the PIER trust fund due to agreements that are
25

26
Table B-3: PIER Natural Gas Fund (in millions) Fiscal Year1
Beginning Balance - 11.08 10.55 3.29 12.28 18.81 19.47 Prior Year Adjustment - - - - - 0.00 - Adjustment Beginning Balance - 11.08 10.55 3.29 12.28 18.81 19.47
RevenueGas Consumption Surcharge Collections - Transferred to Energy Commission 12.00 15.00 3 - 18.00 21.00 24.00 23.30 4
CPUC Adjustments 0.20 2 - - - - - 0.70 4
SMIF Interest - - - 0.40 0.54 0.29 0.26 Total Revenue 12.20 26.08 10.55 21.70 33.82 43.10 43.73
ExpendituresLabor and Operating Expenditures 0.47 0.27 3 1.11 3 1.44 1.65 1.79 2.55 5
R&D Support Expenditures 0.65 1.13 0.61 - 0.50 - - 5
RD&D Project Funding - 14.13 5.55 7.98 12.87 21.83 39.69 5
Total Expenditures 1.12 15.53 7.26 9.41 15.02 23.63 42.24
Fund Balance 11.08 10.55 3.29 12.28 18.81 4 19.47 1.50
Explanations, Definitions, and Assumptions:1 Years listed reflect the beginning of the fiscal period as of July 1st and runs through June 30th of the next year.2 The PUC provided an additional $200k for support for FY 04/05 prior to the 2005 budget plan being approved by PUC.3 The $15 million in FY 05/06 was used over an 18 month period ending 6/30/2007 due to shifting from a
calendar year plan to a fiscal year plan. Therefore, the Commission had 18 months of labor and operating expenses.
5 FY 10/11 are estimates based on the approved Budget Act.4 In FY 08/09 there was $700,000 in unspent administrative support funding that was reallocated to FY 10/11.
2004 2005 2006 2007 2008 2009 2010

Appendix C Response to Question 2 – IOU Rate Case Documents
This appendix contains the following in response to Question 2:
1. July 7, 2010, addressed to Southern California Gas Company and San Diego
Gas and Electric 2. June 7, 2007, addressed to Southern California Edison 3. July 7, 2006, addressed to Southern California Gas Company
27

28

29
30
31

32