Energy Flow EQ: How does energy flow through living systems?
UCRL-ID-18991-99
California Energy Flow—1999
Gina V. Kaiper
May 2003
Approved for public release; further dissemination unlimited
DISCLAIMER This document was prepared as an account of work sponsored by an agency of the United States Government. Neither the United StatesGovernment nor the University of California nor any of their employees, makes any warranty, express or implied, or assumes any legal liability orresponsibility for the accuracy, completeness, or usefulness of any information, apparatus, product, or process disclosed, or represents that its usewould not infringe privately owned rights. Reference herein to any specific commercial product, process, or service by trade name, trademark,manufacturer, or otherwise, does not necessarily constitute or imply its endorsement, recommendation, or favoring by the United StatesGovernment or the University of California. The views and opinions of authors expressed herein do not necessarily state or reflect those of theUnited States Government or the University of California, and shall not be used for advertising or product endorsement purposes. This work was performed under the auspices of the U. S. Department of Energy by the University of California, Lawrence Livermore NationalLaboratory under Contract No. W-7405-Eng-48.
This report has been reproduced directly from the best available copy.
Available to DOE and DOE contractors from the
Office of Scientific and Technical Information P.O. Box 62, Oak Ridge, TN 37831
Prices available from (423) 576-8401 http://apollo.osti.gov/bridge/
Available to the public from the
National Technical Information Service U.S. Department of Commerce
5285 Port Royal Rd., Springfield, VA 22161 http://www.ntis.gov/
OR
Lawrence Livermore National Laboratory
Technical Information Department’s Digital Library http://www.llnl.gov/tid/Library.html
UCRL-ID-18991-99
California Energy Flow—1999
Gina V. Kaiper
May 2003
This work was performed under the auspices of the U.S. Department of Energy by the University of California,Lawrence Livermore National Laboratory under Contract No. W-7405-Eng-48.


ContentsPage
California Energy Flow: Background Information 1Background 1Data Sources 1Description of End-Use Sectors 4Energy Content 4Conversion Efficiency Factors 5Nonfuel Use 6
Notes on Electricity Generation and on Primary Resources 7Electricity Generation 7Coal 8Hydroelectric Power 9Natural Gas 9Nuclear Energy 9Other Renewables 10Petroleum and Natural Gas Plant Liquids (NGPL) 11
Comparison to Other States and the Nation 13
References 19
Appendix: Selected Tables 21

TablesPage
1. California natural gas supply and consumption, 1999 92. Renewable electric power industry net generation in 1999 113. Electric power generation from geothermal energy in 1999 114. Electric power generation from wind energy in 1999 115. Electric power generation from solar/photovoltaic energy in 1999 116. Energy consumption of five most populous states, 1999 137. Gross state/domestic product and energy consumption, 1999 14
Figures1. California Energy Flow Trends—1999 22. U.S. Energy Flow—1999 33. Electricity generated by other renewables in 1999 for (a) California and
(b) the United States as a whole 104. Percentage of in-state/domestic production and imports for 1999 energy
consumption for (a) California and (b) the United States 155. Total 1999 energy consumption by source for (a) California and (b) the
United States 166. (a) California electricity (net system power mix) and (b) U.S. electricity
generation by source, 1999 177. Energy consumption in 1999 by end-use sector for (a) California and (b) the
United States 18
California Energy Flow—1999 1
California Energy Flow: Background Information
BackgroundThe Figure 1 flow chart shows California energyconsumption in 1999. Lawrence Livermore NationalLaboratory (LLNL) has prepared similar flow charts ofU.S. and California energy consumption since the early1970s. However, this is the first California chart preparedby LLNL since 1994, and there have been somechanges—both in our approach and in the Californiaenergy picture—since 1994.
For this chart, we use the same overall methodology andassumptions as for the U.S. energy flow charts. Figure 2,the U.S. chart for 1999, is included for comparison. Thereport (Ref. 1) explaining the U.S. chart is available on theWeb at http://en-env.llnl.gov/flow/ .
The 1999 California chart follows the flow of individualfuels from production (or importation) throughconsumption by the major end-use sectors. The chart alsoshows in a general way the proportion of energy (i.e.,heat) that is lost because of conversion processes.
This chart compares the flow of fuels on the basis of acommon energy unit of trillion British thermal units (1012Btu), and the width of each colored bar across this chartis in proportion to the number of trillion Btu conveyed.(Exception: lines showing extremely small amounts have
been made wide enough to be clearly visible.) One Btu isthe quantity of heat needed to raise the temperature of1!pound of water by 1°F at or near 39.2°F. In metricterms, 1 Btu equals 1,055.056 joules.
In most cases, the numbers shown on this Californiachart have been rounded to the nearest trillion Btu,although the original data was published in hundredthsor thousandths of a trillion Btu. Because of independentrounding, summary numbers may not appear to be aprecise total of their various components.
Data SourcesThis chart is based upon production and end-use datacompiled by the U.S. Department of Energy’s EnergyInformation Administration (EIA) and by the CaliforniaEnergy Commission (CEC).
The backbone data for this chart is from the EIA’s StateEnergy Data Report 1999 (SEDR99), which talliesconsumption by the end-use sectors (Ref. 2, Tables 42–46,pp. 54–58). For ease of reference, some of the key tablesfrom the EIA report are included as an appendix to thisdocument. The entire report is available on the Web athttp://www.eia.doe.gov/emeu/sedr/contents.html .

May 2003Lawrence Livermore National Laboratoryhttp://en-env.llnl.gov/flow
Figure 1. California Energy Flow Trends– 1999Net Primary Resource Consumption ~8375 Trillion Btu (8.375 Quads)
Sources: U.S. Department of Energy's Energy Information Administration and California Energy Commission.*Electricity flowing into the California control areas: CAISO, LADWP, and IID. **Other renewable includes geothermal, wood and waste, solar, and wind.
Imported electricity* 579
Imported electricity* 579
377451
2,316
Lostenergy4,714
1,570Electrical
system energylosses
445
199710
Pac. SW 355
579
0.5
5
199
60 584
Hydro
Otherrenewable**
Natural gas2,765
Coal 292228
216
16
0.6
377451
2,316
Lostenergy4,714
1,570
1,802
Usefulenergy3,513
1,132
149317
37
2,876Petroleum and
NGPL 3,378
In-state 1,669
Electricalsystem energy
losses
1,196
2
Pac. NW 224
Pac. SW 355
445
728
828
In-state 442
Canada 774
Rockies &SW 1,548
Alaska 720
Foreign imports 990
63
Electricitysupplied
plus systemlosses2,371
Residential/Commercial
1,509
Industrial2,253
Non–fuel 149
Transpor-tation2,895
13
358358
710
373
Nuclear 279Nuclear 279
Distributedelectricity 801
900

March 2001Lawrence Livermore National Laboratory
Figure 2. U.S. Energy Flow – 1999Net Primary Resource Consumption 97 Quads
Source: Production and end-use data from Energy Information Administration, Annual Energy Review 1999*Biomass/other includes wood and waste, geothermal, solar, and wind.
3.24.6
4.5
20.7
Rejectedenergy
53.2
23.4 Electrical systemenergy losses
2.2
5.2
1.0
Net Imports3.5
Imports
3.2
3.2
0.06
Nuclear 7.7
Export1.5
0.7
0.1
0.8
0.5
0.1
7.5
11.0Hydro 3.2
Biomass/other* 4.0
Net electrical imports 0.1
Bal. no. 0.3
Natural gas19.3
Electricitygeneration
34.4
Bal. no. 0.7
0.2
Coal23.3
19.3
Non–fuel6.6
Transpor-tation25.9
Distributedelectricity 11.1
Residential/Commercial
18.3
Industrial22.3
Export2.0
Bal. no. 2.1
3.6
0.02
3.2
0.1
4.64.5
20.7
Rejectedenergy
53.2
23.4
17.9
Usefulenergy
36.8
13.7
5.93.62.1
25.2
U.S. petroleumand NGPL 15.1
Imports 22.5
Electrical systemenergy losses
8.09.5

California Energy Flow—1999 4
The EIA collects its data through a complex system ofsurveys. Some of these surveys focus on the suppliersand marketers of energy sources. Other surveys, gearedto consumption, gather information from the end-usersof energy. The EIA’s estimates for the SEDR generallycompare to the statistics in its Annual Energy Review. OurU.S. flow chart for 1999 was based primarily on EIA’sAnnual Energy Review 1999 (Ref. 3). (Note that there mayhave been revisions to EIA’s 1999 data since our U.S.chart was prepared.)
There are variations in the energy numbers published bythe EIA and the CEC. Some of these differences derivefrom how the information is categorized or defined orfrom when the information was published.
In general, for this California chart we have relied uponthe consumption totals developed by the EIA for theamounts of energy consumed by the end-use sectors, butwe have used the CEC’s proportions to show the originsof the energy sources consumed within California.
LLNL’s chart is one graphical way of looking at theoverall California energy picture and is intended to showtrends. We do not independently collect energy data. Thereader is referred to the original data for greaterprecision. (Some of the EIA and CEC estimates areincluded in the appendix to this document.)
Description of End-Use SectorsThe Residential/Commercial sector includes private andinstitutional residences; business establishments notengaged in transportation or manufacturing; commercialestablishments; religious and nonprofit organizations;health, social, and educational institutions; and federal,state, and local governments. Electricity used for publicstreet and highway lighting is also included. Althoughthe EIA maintains separate numbers for the residentialand the commercial sectors, we have combined these intoone sector.
The Industrial sector includes agriculture, manufacturingindustries, mining, construction, fisheries, and forestry.Establishments range from large manufacturingenterprises to small farms.
The Transportation sector includes all types of publicand private vehicles that transport people andcommodities. This sector also includes the energy used totransport natural gas in pipelines.
Energy ContentThe energy flow chart shows all energy streams in termsof a common energy unit: trillion Btu. The EIA typicallyuses conversion factors that represent the gross heatcontent of the fuel, which is the total amount of heatreleased when fuel is burned (i.e., the “higher heatingvalue”).

California Energy Flow—1999 5
Appendix C of SEDR99 (Ref. 2, pp. 469–486) gives thethermal conversion factors used in that report. The heatcontent that EIA lists depends on the source, type, year ofproduction, and the sector using the fuel. (For example,the average heat content of the coal consumed by the U.S.industrial sector in 1999 was 22.1 million Btu per shortton of coal, slightly higher than the 20.3 average listed forcoal consumed by U.S. electric utilities.)
Some general conversion factors, useful for roughestimation, include:
Fuel Energy content (Btu)Short ton of coal 21,400,000Barrel (42 gallons) of crude oil 5,800,000Cubic foot of natural gas (at standard conditions) 1,027Kilowatt-hour of electricity 3,412
Conversion Efficiency FactorsThe California chart for 1999 assumes the sameconversion efficiencies for the residential/commercial,industrial, and transportation sectors as for the U.S.chart. These conversion efficiencies are used to estimatethe proportion of “useful” energy to “lost” (or “rejected”)energy. The uncertainties in these conversion estimatesare large.
For electricity generation, the electrical system energylosses are assumed by the EIA to be about two-thirds ofthe energy consumed. LLNL’s California chart for 1999shows electrical system energy losses of 1570 trillion Btu,
which is the sum of the amounts shown for theindividual sectors in SEDR99 (Ref. 2, Tables 42–45, pp.54–57)—that is, 503.4 trillion Btu for residential, 640.2 forcommercial, 422.6 for industrial, and 3.6 fortransportation.
According to the EIA (Ref. 3, p. 240, Note 1), “Electricalsystem energy losses are estimated as the differencebetween total energy input at electric utilities and thetotal energy content of electricity sold to end-useconsumers. Most of these losses occur at steam-electricpower plants (conventional and nuclear) in theconversion of heat energy into mechanical energy to turnelectric generators. This loss is a thermodynamicallynecessary feature of the steam-electric cycle.”Transmission and distribution losses, which are notspelled out separately on this chart, are normallyestimated to be about 9% of the gross generation ofelectricity.
The conversion efficiency factors for theresidential/commercial and the industrial sectors arebased on engineer’s estimates for the conversionefficiency of devices such as process heaters and boilers.
For the residential/commercial sector, we assume anefficiency of 75%. This is a weighted average betweenspace heating at approximately 60% efficiency andmotors and other electrical uses at about 90% efficiency.
For the industrial sector, we assume a conversionefficiency of 80%.
California Energy Flow—1999 6
For transportation, we assume a generous 20% efficiency,which corresponds to the approximate average efficiencyof internal combustion engines as measured on FederalDriving Schedules (i.e., the amount of energy thatactually reaches the drive train of a vehicle, compared tothe amount of energy consumed. Note that the peakefficiencies of 33–35% for spark-ignited engines and41–45% for diesel engines are not representative ofconversion efficiencies over the Federal DrivingSchedules.)
Nonfuel UseIn the United States in 1999, “nonfuel” consumptionaccounted for 6.9% of the primary energy resources
consumed. Because these resources are not used forenergy purposes, however, LLNL’s flow chart does notassign “lost” and “useful” designations for thisconsumption.
SEDR99 does not specify the resources used for nonfuelpurposes. However, we have assigned the 135.1 trillionBtu of asphalt and road oil and the 13.5 trillion Btu oflubricants (SEDR99, Ref. 2, Table 44, p. 56) used by theindustrial sector to this nonfuel category. These amountshave been subtracted from the petroleum consumed bythe industrial end-use sector.
California Energy Flow—1999 7
Notes on Electricity Generation and on Primary Resources
Electricity GenerationThe electricity consumption numbers on this Californiachart came from the EIA’s SEDR99. This chart alsoassumes that the related “electrical system energy losses”represent energy resources consumed in California,although the heat loss from conversion may haveoccurred at a generating plant not physically within thestate.
California imports a large proportion of the electricityconsumed within the state, but the EIA and the CECdiffer in what constitutes “imported” electricity.
EIA considers all electricity generated beyond theborders of a state to be imported (more specifically, to be“net interstate flow” of electricity.) Thus SEDR99 (Ref. 2,Table 41, p. 53) shows 416,346 million kWh or 1,420.6trillion Btu flowing in from other states.
For this chart, however, we have relied upon the CEC’sdefinition of imported electricity, as indicated in Ref. 4,which counts only 67,290 million kWh as imported.(Note that Ref. 4 gives kilowatt hours of electricitygenerated, not consumed, and does not incorporatesystem losses; the 67,290 million kWh listed as importedrepresents 24.4% of the total of 275,805 million kWh.) InRef. 4, “import” is defined as the net flow into the threeCalifornia control areas: the California Independent
System Operator (CAISO), the Los Angeles Departmentof Water and Power (LADWP), and the ImperialIrrigation District (IID). Thus electricity generated byplants that are physically beyond the state borders butthat are within one of the three control areas is notconsidered imported.
For the components of electricity in this chart (that is,both the electricity consumed and the related electricalsystem losses), we used the same proportions forprimary resources and imported electricity that are givenin Ref. 4, except that we combined large and small hydro.Thus the proportions used in our chart are:
• Natural gas 30.71%• Hydro 15.09%• Nuclear 11.77%• Coal 9.60%• Other renewables 8.40%• Petroleum 0.02%• Imported electricity 24.40%
We have not defined the specific primary resources usedto generate the imported electricity. However, for 1994the CEC assumed that 80% of the electricity importedfrom the Pacific Northwest was from hydroelectricityand that the remaining 20% of imports from that regionwas generated from coal. (Ref. 5, p. 3) The CEC also
California Energy Flow—1999 8
assumed that 74% of the electricity imported from theSouthwest was generated from coal and 26% fromnatural gas. The CEC used those assumptions indetermining the 1999 California power mix (Ref. 5). Notethat, because we did not define the resources forimported electricity, the percentages shown above differfrom those in the 1999 California power mix, which liststhe following percentages:
• Natural gas 31.0%• Hydro, large 20.1%• Nuclear 16.2%• Coal 19.8%• Biomass & waste 2.0%• Geothermal 4.9%• Hydro, small 3.4%• Solar 0.4%• Wind 1.5%• Other 0.6%
The electricity numbers used on this chart are totals forthe power industry. With continuing deregulation of theelectric power industry, an increasing proportion of theelectricity generated in the United States—and especiallyin California—is now provided by what the EIAdesignates as “nonutility” power producers. Because ofderegulation, some utilities have sold their power plantsto nonutility owners, a process that in California beganbefore 1999. During 1999 California utilities divestedpower plants with 6,265 MW of capacity, mostly natural-gas-fired but also including a 1,224-MW geothermalplant (Ref. 6, p. 4).
EIA considers the nonutility power producers to include(1) cogenerators that provide both electricity and steamor heat for industrial or other purposes; (2) small powerproducers that use renewables for at least 75% of theiroutput; and (3) independent power producers that areunaffiliated with franchised utilities, do not possesstransmission facilities, and do not sell power in the retailservice area where they have a franchise.
CoalAlthough coal supplied 22.8% of the United States’energy in 1999, in California coal accounted for only 3.5%of the total energy consumption, and the majority of thatwas used to generate electricity.
In the United States in 1999, coal was burned to producemore than half of the nation’s electricity. Even inCalifornia, coal is used to generate a significantproportion of the electricity consumed within the state,although most of the coal-burning power plants arephysically located outside the state.
Our chart shows 228 trillion Btu of coal going to thegeneration of electricity, which represents 9.6% of thetotal electricity consumed in the state (including systemlosses.) Based on its assumptions relating to the resourcesused for “imported” electricity, the CEC said that in 1999the net system power mix included 19.8% from coal(Ref.!5, p. 4). On its “Power Content Label” Web page(Ref. 7), the Los Angeles Department of Water and Powerprojects that 51% of its power is generated from coal (no
California Energy Flow—1999 9
date given.) LADWP’s Intermountain Plant in Utah usescoal as its primary resource.
Hydroelectric PowerThis involves the production of power from falling waterthat turns a turbine generator. For this chart, we havegrouped together both “large” hydro and “small” hydro,which the CEC defines as less than 30 MW (Ref. 5, p. 4).
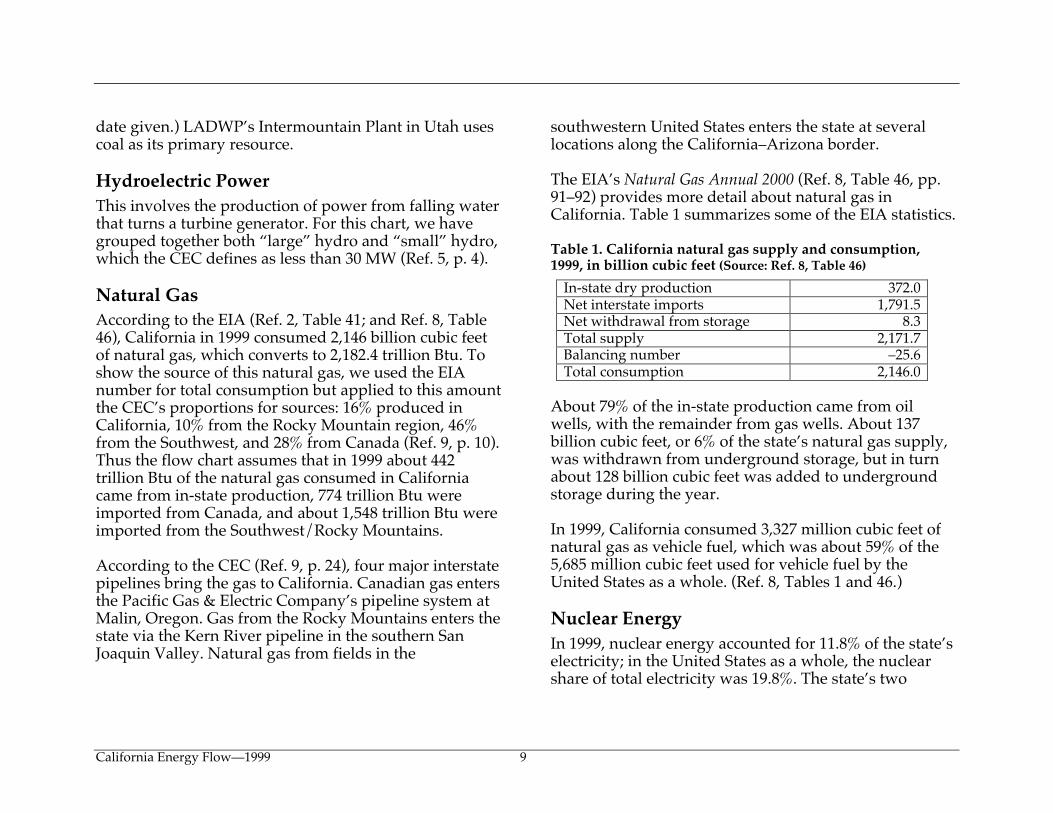
Natural GasAccording to the EIA (Ref. 2, Table 41; and Ref. 8, Table46), California in 1999 consumed 2,146 billion cubic feetof natural gas, which converts to 2,182.4 trillion Btu. Toshow the source of this natural gas, we used the EIAnumber for total consumption but applied to this amountthe CEC’s proportions for sources: 16% produced inCalifornia, 10% from the Rocky Mountain region, 46%from the Southwest, and 28% from Canada (Ref. 9, p. 10).Thus the flow chart assumes that in 1999 about 442trillion Btu of the natural gas consumed in Californiacame from in-state production, 774 trillion Btu wereimported from Canada, and about 1,548 trillion Btu wereimported from the Southwest/Rocky Mountains.
According to the CEC (Ref. 9, p. 24), four major interstatepipelines bring the gas to California. Canadian gas entersthe Pacific Gas & Electric Company’s pipeline system atMalin, Oregon. Gas from the Rocky Mountains enters thestate via the Kern River pipeline in the southern SanJoaquin Valley. Natural gas from fields in the
southwestern United States enters the state at severallocations along the California–Arizona border.
The EIA’s Natural Gas Annual 2000 (Ref. 8, Table 46, pp.91–92) provides more detail about natural gas inCalifornia. Table 1 summarizes some of the EIA statistics.
Table 1. California natural gas supply and consumption,1999, in billion cubic feet (Source: Ref. 8, Table 46)
In-state dry production 372.0Net interstate imports 1,791.5Net withdrawal from storage 8.3Total supply 2,171.7Balancing number –25.6Total consumption 2,146.0
About 79% of the in-state production came from oilwells, with the remainder from gas wells. About 137billion cubic feet, or 6% of the state’s natural gas supply,was withdrawn from underground storage, but in turnabout 128 billion cubic feet was added to undergroundstorage during the year.
In 1999, California consumed 3,327 million cubic feet ofnatural gas as vehicle fuel, which was about 59% of the5,685 million cubic feet used for vehicle fuel by theUnited States as a whole. (Ref. 8, Tables 1 and 46.)
Nuclear EnergyIn 1999, nuclear energy accounted for 11.8% of the state’selectricity; in the United States as a whole, the nuclearshare of total electricity was 19.8%. The state’s two

California Energy Flow—1999 10
largest power plants are both nuclear: Pacific Gas andElectric Company’s Diablo Canyon plant, with a netsummer capability of 2,160 MW, and Southern CaliforniaEdison Co.’s San Onofre plant, with a net summercapability of 2,150 MW. (Ref. 10, Table 2.)
Other RenewablesCalifornia’s 710 trillion Btu in the “Other Renewables”category (that is, “other” than hydroelectricity) accountsfor 17.7% of the “Other Renewables” energy consumedby the United States in 1999. This category includesbiomass material, wood and waste, and geothermal,wind, and solar energy. In California, the largest share of“other renewable” energy was consumed by theindustrial sector, but 199 trillion Btu was used togenerate electricity.
As Figure 3 shows, in California in 1999, geothermalenergy accounted for 60.4% of the electricity generatedby “Other Renewables,” with various forms of wood andwaste (including landfill gas) accounting for 23.1%, windfor 13.1%, and solar/photovoltaic (PV) for 3.4%. (Ref. 11,Table C7.)
By contrast, for the United States as a whole, wood andwaste accounted for 72.2% of the electricity generated by“Other Renewables,” geothermal for 21.1%, wind for5.6%, and solar/PV for 1.1.% (Ref. 11, Table C7)
Figure 3. Electricity generated by other renewables in 1999for (a) California and (b) the United States as a whole.
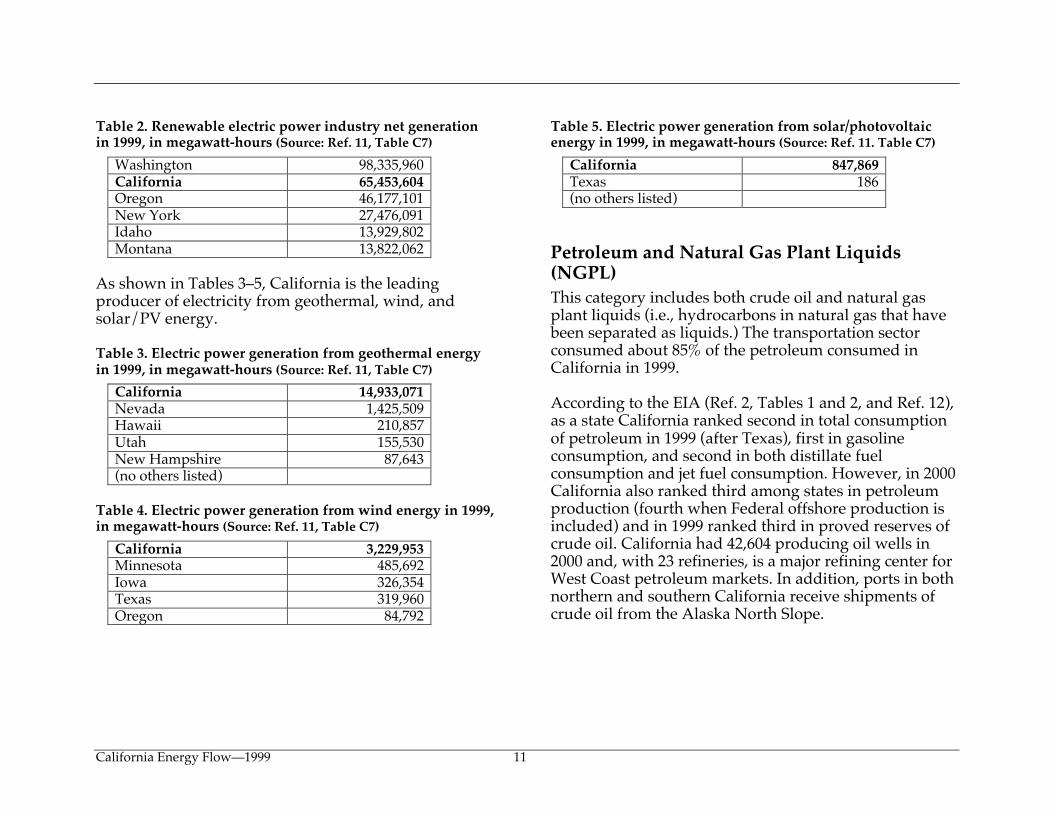
When hydro is not included, California accounts forabout 31% of the renewable-generated electricity in theUnited States. When hydro is included, Californiaaccounts for 16.4%. As shown in Table 2, California is thesecond-largest generator of renewable electricity in theUnited States, behind the state of Washington, which isrich in hydroelectric resources. Except for California, thestates shown in this table generate almost all their“renewable” electricity from hydro. (Ref. 11, Table C7)
California Energy Flow—1999 11
Table 2. Renewable electric power industry net generationin 1999, in megawatt-hours (Source: Ref. 11, Table C7)
Washington 98,335,960California 65,453,604Oregon 46,177,101New York 27,476,091Idaho 13,929,802Montana 13,822,062
As shown in Tables 3–5, California is the leadingproducer of electricity from geothermal, wind, andsolar/PV energy.
Table 3. Electric power generation from geothermal energyin 1999, in megawatt-hours (Source: Ref. 11, Table C7)
California 14,933,071Nevada 1,425,509Hawaii 210,857Utah 155,530New Hampshire 87,643(no others listed)
Table 4. Electric power generation from wind energy in 1999,in megawatt-hours (Source: Ref. 11, Table C7)
California 3,229,953Minnesota 485,692Iowa 326,354Texas 319,960Oregon 84,792
Table 5. Electric power generation from solar/photovoltaicenergy in 1999, in megawatt-hours (Source: Ref. 11. Table C7)
California 847,869Texas 186(no others listed)
Petroleum and Natural Gas Plant Liquids(NGPL)This category includes both crude oil and natural gasplant liquids (i.e., hydrocarbons in natural gas that havebeen separated as liquids.) The transportation sectorconsumed about 85% of the petroleum consumed inCalifornia in 1999.
According to the EIA (Ref. 2, Tables 1 and 2, and Ref. 12),as a state California ranked second in total consumptionof petroleum in 1999 (after Texas), first in gasolineconsumption, and second in both distillate fuelconsumption and jet fuel consumption. However, in 2000California also ranked third among states in petroleumproduction (fourth when Federal offshore production isincluded) and in 1999 ranked third in proved reserves ofcrude oil. California had 42,604 producing oil wells in2000 and, with 23 refineries, is a major refining center forWest Coast petroleum markets. In addition, ports in bothnorthern and southern California receive shipments ofcrude oil from the Alaska North Slope.
California Energy Flow—1999 12
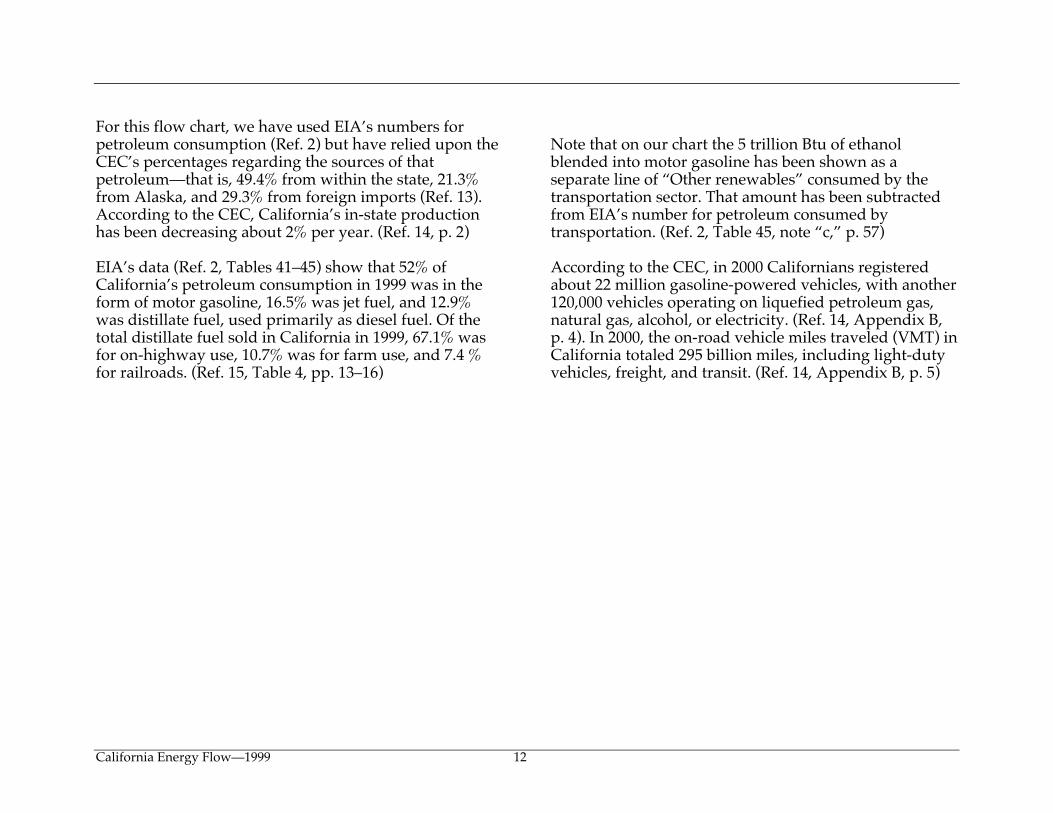
For this flow chart, we have used EIA’s numbers forpetroleum consumption (Ref. 2) but have relied upon theCEC’s percentages regarding the sources of thatpetroleum—that is, 49.4% from within the state, 21.3%from Alaska, and 29.3% from foreign imports (Ref. 13).According to the CEC, California’s in-state productionhas been decreasing about 2% per year. (Ref. 14, p. 2)
EIA’s data (Ref. 2, Tables 41–45) show that 52% ofCalifornia’s petroleum consumption in 1999 was in theform of motor gasoline, 16.5% was jet fuel, and 12.9%was distillate fuel, used primarily as diesel fuel. Of thetotal distillate fuel sold in California in 1999, 67.1% wasfor on-highway use, 10.7% was for farm use, and 7.4 %for railroads. (Ref. 15, Table 4, pp. 13–16)
Note that on our chart the 5 trillion Btu of ethanolblended into motor gasoline has been shown as aseparate line of “Other renewables” consumed by thetransportation sector. That amount has been subtractedfrom EIA’s number for petroleum consumed bytransportation. (Ref. 2, Table 45, note “c,” p. 57)
According to the CEC, in 2000 Californians registeredabout 22 million gasoline-powered vehicles, with another120,000 vehicles operating on liquefied petroleum gas,natural gas, alcohol, or electricity. (Ref. 14, Appendix B,p. 4). In 2000, the on-road vehicle miles traveled (VMT) inCalifornia totaled 295 billion miles, including light-dutyvehicles, freight, and transit. (Ref. 14, Appendix B, p. 5)
California Energy Flow—1999 13
Comparison to Other States and the Nation
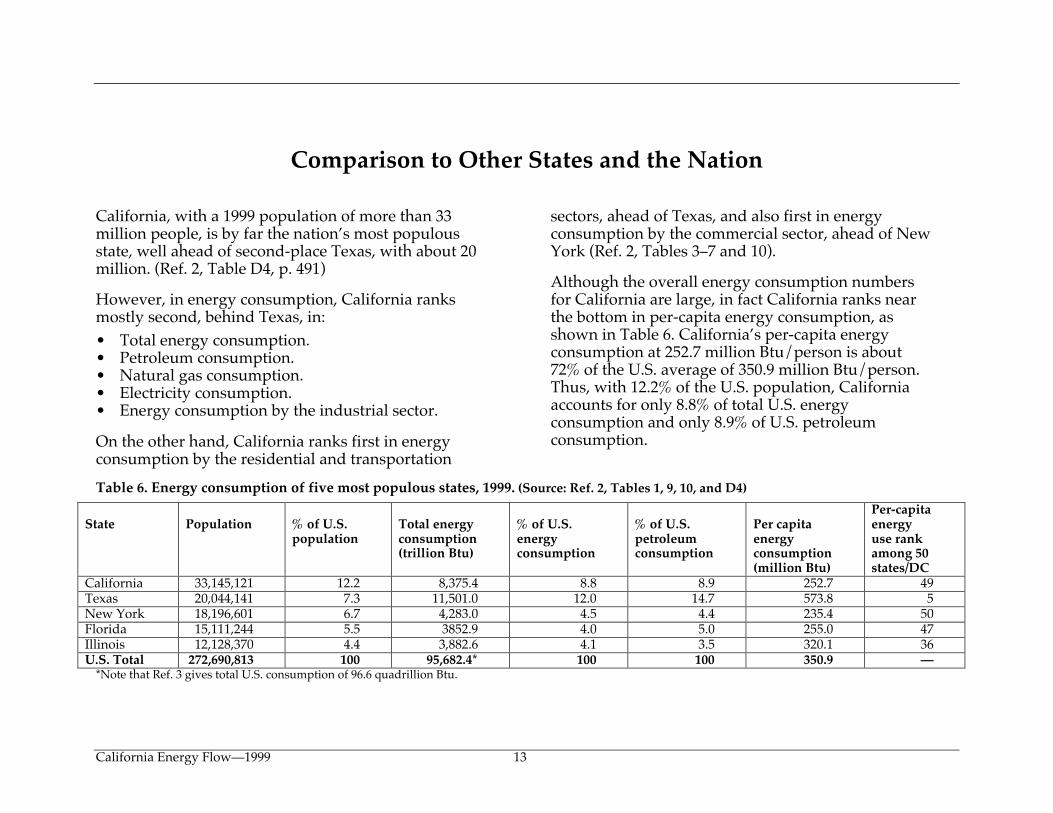
California, with a 1999 population of more than 33million people, is by far the nation’s most populousstate, well ahead of second-place Texas, with about 20million. (Ref. 2, Table D4, p. 491)
However, in energy consumption, California ranksmostly second, behind Texas, in:• Total energy consumption.• Petroleum consumption.• Natural gas consumption.• Electricity consumption.• Energy consumption by the industrial sector.
On the other hand, California ranks first in energyconsumption by the residential and transportation
sectors, ahead of Texas, and also first in energyconsumption by the commercial sector, ahead of NewYork (Ref. 2, Tables 3–7 and 10).
Although the overall energy consumption numbersfor California are large, in fact California ranks nearthe bottom in per-capita energy consumption, asshown in Table 6. California’s per-capita energyconsumption at 252.7 million Btu/person is about72% of the U.S. average of 350.9 million Btu/person.Thus, with 12.2% of the U.S. population, Californiaaccounts for only 8.8% of total U.S. energyconsumption and only 8.9% of U.S. petroleumconsumption.
Table 6. Energy consumption of five most populous states, 1999. (Source: Ref. 2, Tables 1, 9, 10, and D4)
State Population % of U.S.population
Total energyconsumption(trillion Btu)
% of U.S.energyconsumption
% of U.S.petroleumconsumption
Per capitaenergyconsumption(million Btu)
Per-capitaenergyuse rankamong 50states/DC
California 33,145,121 12.2 8,375.4 8.8 8.9 252.7 49Texas 20,044,141 7.3 11,501.0 12.0 14.7 573.8 5New York 18,196,601 6.7 4,283.0 4.5 4.4 235.4 50Florida 15,111,244 5.5 3852.9 4.0 5.0 255.0 47Illinois 12,128,370 4.4 3,882.6 4.1 3.5 320.1 36U.S. Total 272,690,813 100 95,682.4* 100 100 350.9 —
*Note that Ref. 3 gives total U.S. consumption of 96.6 quadrillion Btu.

California Energy Flow—1999 14
Energy consumption and the distribution of resourcesare affected by many factors, including populationgrowth, economic health, supply/demand (and cost)of resources, emphasis on conservation and efficiency,geography, weather, business practices, and publicpolicy. For example, economic fluctuationsparticularly impact energy use in the industrial andtransportation sectors. Weather conditions affectenergy use in the residential/commercial sector,affecting the amount of winter heating and summercooling required. Geography affects the availability ofprimary resources, vehicle miles traveled, and theconfiguration of pipelines and distribution systems.
Not only does California have a larger populationthan any other state, but it also has the largesteconomy. In 1999 California’s gross state product(GSP) was $1,185.636 Billion (in 1996 dollars), whichwas about 13.4% of that year’s U.S. gross domesticproduct (GDP) of $8,848.2 Billion (in chained 1996dollars) (Ref. 16, Table D.1, p. 58, and Ref. 3, Table 1.5,p. 13).
As Table 7 shows, however, California energyconsumption per dollar of GSP is about 65% that ofU.S. energy consumption per dollar of GDP.
Table 7. Gross state/domestic product and energyconsumption, 1999. (Source: Ref. 16, Table D.1, and Ref. 3,Table 1.5)
California United StatesGross state/domesticproduct (billionsof 1996 dollars)
1,185.636 8,848.2
Total energyconsumption(trillion Btu)
8,375 96,600
Btu per 1996 $ ofGSP/GDP
7,064 10,920
Grouping the numbers used on the California andU.S. energy flow charts and putting them into adifferent format, as the pie charts of Figure!4, makes itclear that California imports a far larger proportion(55%) of the energy consumed than does the UnitedStates as a whole (24.8%).
The state’s energy imports may not have the nationalsecurity implications of depending, for example, onpetroleum imports from the Middle East—in 1999,only about 29% of California’s petroleum came fromoutside the United States, while the United Statesimported more than 55% of its petroleum. Still, thatforeign oil represented about 12% of the state’s energyconsumption.

California Energy Flow—1999 15
Figure 4. Percentage of in-state/domestic production and imports for 1999 energy consumption for(a) California and (b) the United States.

California Energy Flow—1999 16
As Figure 5 shows, in 1999 California and the UnitedStates consumed about the same proportions ofpetroleum within the overall resources mix. However,California consumed a far smaller proportion of coal andmuch larger proportions of natural gas and renewable
energy. This has implications for the emissions of carbondioxide and other “greenhouse” gases, because thecombustion of coal emits more CO2 per unit of energythan does the combustion of natural gas.
Figure 5. Total 1999 energy consumption by source for (a) California and (b) the United States.
California Energy Flow—1999 17
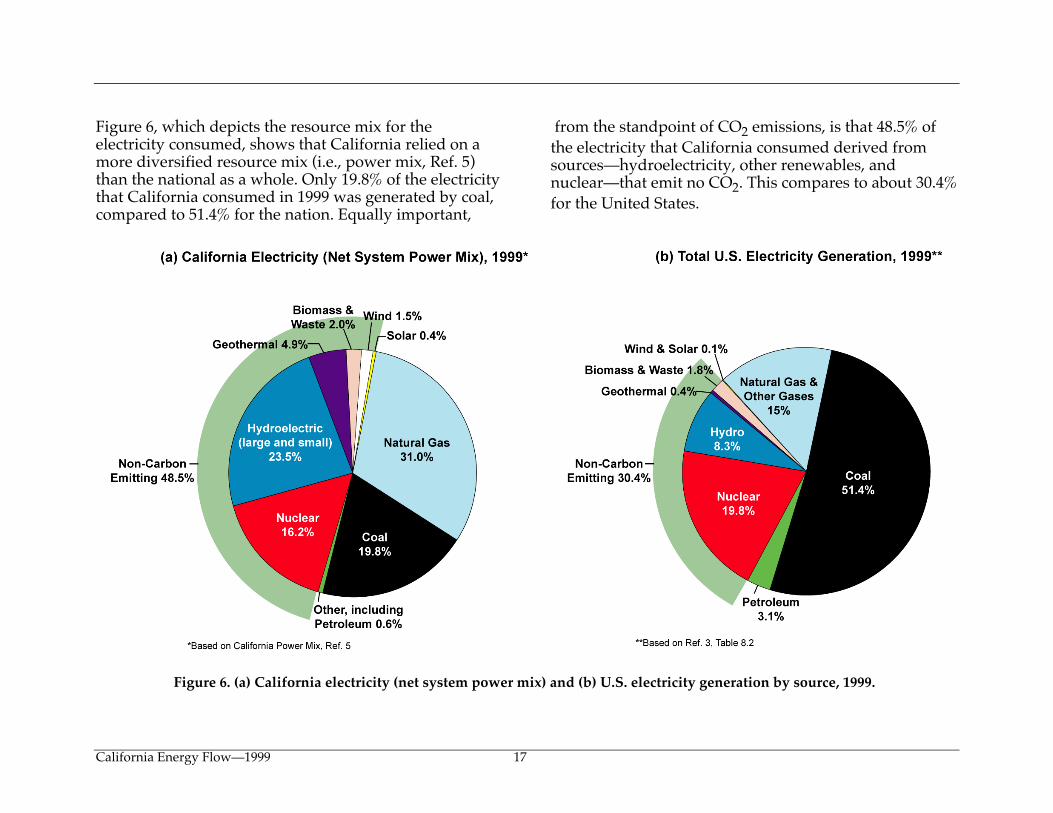
Figure 6, which depicts the resource mix for theelectricity consumed, shows that California relied on amore diversified resource mix (i.e., power mix, Ref. 5)than the national as a whole. Only 19.8% of the electricitythat California consumed in 1999 was generated by coal,compared to 51.4% for the nation. Equally important,
from the standpoint of CO2 emissions, is that 48.5% ofthe electricity that California consumed derived fromsources—hydroelectricity, other renewables, andnuclear—that emit no CO2. This compares to about 30.4%for the United States.
Figure 6. (a) California electricity (net system power mix) and (b) U.S. electricity generation by source, 1999.
California Energy Flow—1999 18
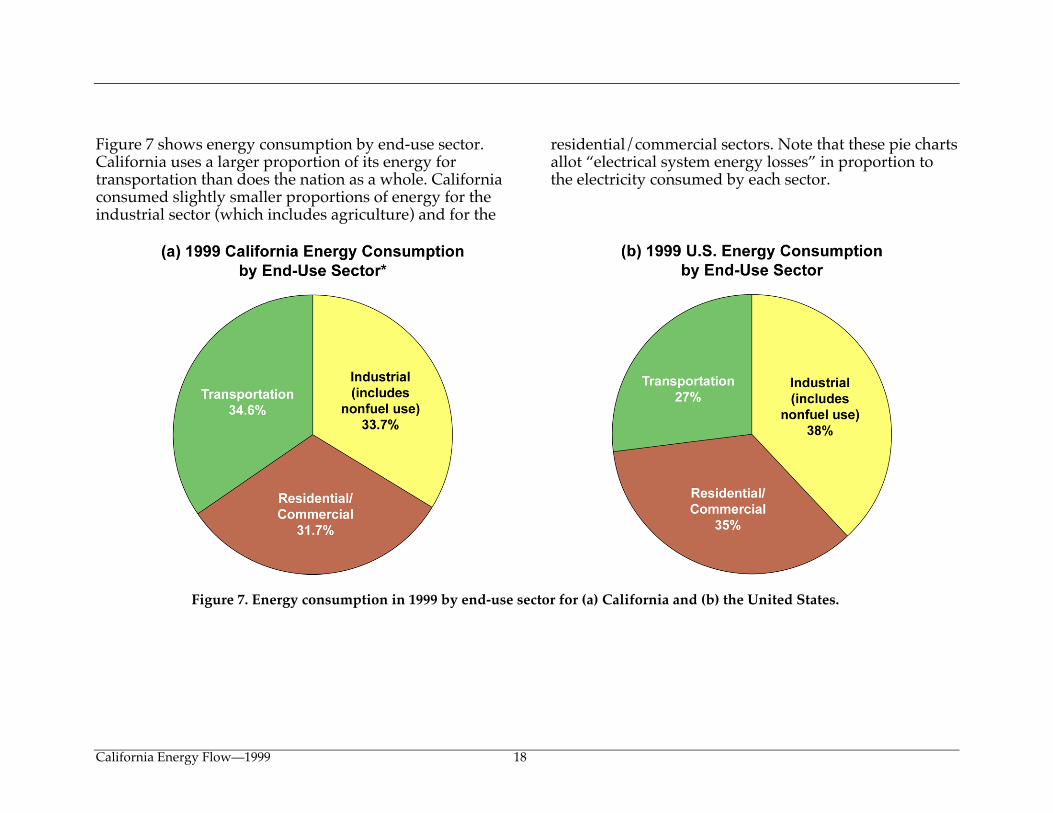
Figure 7 shows energy consumption by end-use sector.California uses a larger proportion of its energy fortransportation than does the nation as a whole. Californiaconsumed slightly smaller proportions of energy for theindustrial sector (which includes agriculture) and for the
residential/commercial sectors. Note that these pie chartsallot “electrical system energy losses” in proportion tothe electricity consumed by each sector.
Figure 7. Energy consumption in 1999 by end-use sector for (a) California and (b) the United States.
California Energy Flow—1999 19
References
1. Kaiper, G.V., U.S. Energy Flow—1999. Lawrence LivermoreNational Laboratory report no. UCRL-ID-129990-99.Livermore, CA: March 2001.
2. U.S. Department of Energy, Energy InformationAdministration, State Energy Data Report 1999: ConsumptionEstimates. DOE/EIA-0214(99), Washington, DC: May 2001.
3. U.S. Department of Energy, Energy InformationAdministration, Annual Energy Review 1999. DOE/EIA-0384(99), Washington, DC: July 2000.
4. California Energy Commission, “1999–2001 CaliforniaElectric Generation Ownership and Fuel Type Details.”Web page updated July 29, 2002. Accessed online onAugust 27, 2002 athttp://www.energy.ca.gov/electricity/generation_ownership.html
5. State of California, Energy Resources Conservation andDevelopment Commission, 1999 Net System PowerCalculation (1999 California Power Mix.) Adopted by theCommission April 5, 2000. Principal author: RonaldWetherall of the California Energy Commission’s EnergyInformation and Analysis Division.
6. U.S. Department of Energy, Energy InformationAdministration, Electric Power Annual 1999, v. I. DOE/EIA-0348(99)/1, Washington, DC: August 2000.
7. Los Angeles Department of Water and Power, “PowerContent Label,” Web page accessed online on August 26,2002, at http://www.ladwp.com/power/contentlabel.htm
8. U.S. Department of Energy, Energy InformationAdministration, Natural Gas Annual 2000. DOE/EIA-0131(00), Washington, DC: November 2001.
9. California Energy Commission, California Natural GasAnalysis and Issues. Staff Report. P200-00-006. Sacramento,CA: November 21, 2000.
10. U.S. Department of Energy, Energy InformationAdministration, “State Electricity Profiles—California,”pdf file downloaded on July 19, 2002, fromhttp://tonto.eia.doe.gov/FTPROOT/electricity/062901.pdf .
11. U.S. Department of Energy, Energy InformationAdministration, Renewable Energy Annual 2000 with Data for1999. DOE/EIA-0603(2000), Washington, DC: March 2001.
12. U.S. Department of Energy, Energy InformationAdministration, “Petroleum Profile: California,” accessedonline on August 13, 2002, athttp://tonto.eia.doe.gov/oog/info/state/california.htm
13. California Energy Commission, “California’s MajorSources of Energy,” Web page updated May 30, 2002, andaccessed on July 9, 2002, fromhttp://www.energy.ca.gov/html/energysources.html .
California Energy Flow—1999 20
14. California Energy Commission and California AirResources Board, Reducing California’s PetroleumDependence. Staff Draft Report P600-03-055. Sacramento,CA: May 2003. Including “Appendix B: Base Case Forecastof California Transportation Energy Demand(Task!2),”Final Staff Report P600-03-005A2, March 2003.
15. U.S. Department of Energy, Energy InformationAdministration, Fuel Oil and Kerosene Sales 1999.DOE/EIA-0535(99). Washington, DC: September 2000.
16. California Department of Finance, California StatisticalAbstract—2001, pdf file downloaded on October 1, 2001,from http://www.dof.ca.gov .

California Energy Flow—1999 21
AppendixSelected Tables
From the California Energy Commission• 1999–2001 Generation Ownership & Fuel Type Details (Web page)
From EIA’s State Energy Data Report 1999• Table 41. Energy Consumption Estimates by Source, Selected Years 1960–1999, California• Table 42. Residential Energy Consumption Estimates, Selected Years 1960–1999, California• Table 43. Commercial Energy Consumption Estimates, Selected Years 1960–1999, California• Table 44. Industrial Energy Consumption Estimates, Selected Years 1960–1999, California• Table 45. Transportation Energy Consumption Estimates, Selected Years 1960–1999, California

!
1999-2001 Generation Ownership & Fuel Type Details
1999-2001 California Electric Generation
Ownership and Fuel Type Details(Gigawatt hours)
1999 Fuel Type IOU MUNI Federal State Merchant QF/selfgen Import Total
Hydro, large 14,976 10,087 6,311 4,114 35,487
Nuclear 32,472 32,472
Coal 9,794 13,077 3,602 26,472
Oil 35 19 55
Natural Gas 5,056 9,939 30,958 38,752 84,705
Geothermal 1,543 635 3,651 7,422 13,251
Biomass 73 5,590 5,663
Wind 3 4 3,426 3,433
Solar 1 2 835 838
Hydro, small 2,048 2,878 78 101 1,035 6,140
Import, NW 26,051 26,051
Import, SW 41,239 41,239
Total 65,928 36,714 6,388 4,215 34,609 60,661 67,290 275,805
2000 Fuel Type IOU MUNI Federal State Merchant QF/selfgen Import Total
Hydro, large 13,701 10,421 5,483 4,518 34,123
Nuclear 33,718 33,718
Coal 10,769 13,185 3,183 27,137
Oil 78 79 293 449
Natural Gas 1,103 12,644 55,072 38,058 106,878
Geothermal 1,252 4,958 7,246 13,456
Biomass 34 6,052 6,086
Wind 7 3,597 3,604
Solar 0 2 857 860
Hydro, small 4,161 2,433 87 197 1,052 7,930
Import, NW 18,777 18,777
Import, SW 27,478 27,478
Total 63,530 40,056 5,570 4,716 60,323 60,046 46,255 280,496
6/4/03 10:31 AM1999-2001 Generation Ownership & Fuel Type Details
Page 1 of 2http://www.energy.ca.gov/electricity/generation_ownership.html

2001 Fuel Type IOU MUNI Federal State Merchant QF/selfgen Import Total
Hydro, large 9,332 5,054 4,423 2,321 21,129
Nuclear 33,294 33,294
Coal 10,285 13,391 3,960 27,636
Oil 315 66 453 495 1,328
Natural Gas 867 10,680 68,951 32,647 113,145
Geothermal 997 5,337 7,286 13,619
Biomass 0 6,185 6,185
Wind 7 3,235 3,242
Solar 3 834 837
Hydro, small 1,904 1,334 61 93 120 363 3,876
Import, NW 6,826 6,826
Import, SW 33,941 33,941
Total 55,996 31,531 4,484 2,414 74,861 55,005 40,768 265,059
Import is defined as the net flow into the three California control areas: CAISO, LADWP and IID.
| | | | | | |Commission Homepage Site Index Search Site Glossary Links Contact Us
Page Updated: September 26, 2002
6/4/03 10:31 AM1999-2001 Generation Ownership & Fuel Type Details
Page 2 of 2http://www.energy.ca.gov/electricity/generation_ownership.html
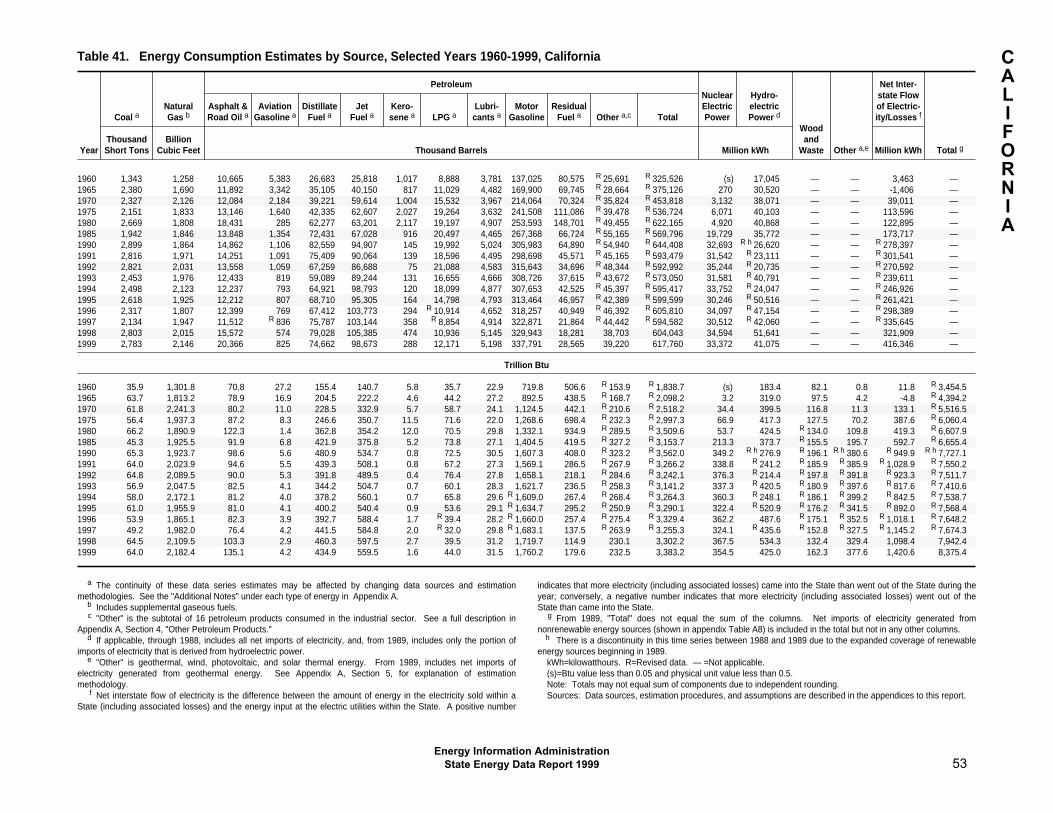
Table 41. Energy Consumption Estimates by Source, Selected Years 1960-1999, California
Year
Coal aNaturalGas b
PetroleumNuclearElectricPower
Hydro-electricPower d
Woodand
Waste Other a,e
Net Inter-state Flowof Electric-ity/Losses f
Total g
Asphalt &Road Oil a
AviationGasoline a
DistillateFuel a
JetFuel a
Kero-sene a LPG a
Lubri-cants a
MotorGasoline
ResidualFuel a Other a,c Total
ThousandShort Tons
BillionCubic Feet Thousand Barrels Million kWh Million kWh
1960 1,343 1,258 10,665 5,383 26,683 25,818 1,017 8,888 3,781 137,025 80,575 R 25,691 R 325,526 (s) 17,045 — — 3,463 —1965 2,380 1,690 11,892 3,342 35,105 40,150 817 11,029 4,482 169,900 69,745 R 28,664 R 375,126 270 30,520 — — -1,406 —1970 2,327 2,126 12,084 2,184 39,221 59,614 1,004 15,532 3,967 214,064 70,324 R 35,824 R 453,818 3,132 38,071 — — 39,011 —1975 2,151 1,833 13,146 1,640 42,335 62,607 2,027 19,264 3,632 241,508 111,086 R 39,478 R 536,724 6,071 40,103 — — 113,596 —1980 2,669 1,808 18,431 285 62,277 63,201 2,117 19,197 4,907 253,593 148,701 R 49,455 R 622,165 4,920 40,868 — — 122,895 —1985 1,942 1,846 13,848 1,354 72,431 67,028 916 20,497 4,465 267,368 66,724 R 55,165 R 569,796 19,729 35,772 — — 173,717 —1990 2,899 1,864 14,862 1,106 82,559 94,907 145 19,992 5,024 305,983 64,890 R 54,940 R 644,408 32,693 R h 26,620 — — R 278,397 —1991 2,816 1,971 14,251 1,091 75,409 90,064 139 18,596 4,495 298,698 45,571 R 45,165 R 593,479 31,542 R 23,111 — — R 301,541 —1992 2,821 2,031 13,558 1,059 67,259 86,688 75 21,088 4,583 315,643 34,696 R 48,344 R 592,992 35,244 R 20,735 — — R 270,592 —1993 2,453 1,976 12,433 819 59,089 89,244 131 16,655 4,666 308,726 37,615 R 43,672 R 573,050 31,581 R 40,791 — — R 239,611 —1994 2,498 2,123 12,237 793 64,921 98,793 120 18,099 4,877 307,653 42,525 R 45,397 R 595,417 33,752 R 24,047 — — R 246,926 —1995 2,618 1,925 12,212 807 68,710 95,305 164 14,798 4,793 313,464 46,957 R 42,389 R 599,599 30,246 R 50,516 — — R 261,421 —1996 2,317 1,807 12,399 769 67,412 103,773 294 R 10,914 4,652 318,257 40,949 R 46,392 R 605,810 34,097 R 47,154 — — R 298,389 —1997 2,134 1,947 11,512 R 836 75,787 103,144 358 R 8,854 4,914 322,871 21,864 R 44,442 R 594,582 30,512 R 42,060 — — R 335,645 —1998 2,803 2,015 15,572 574 79,028 105,385 474 10,936 5,145 329,943 18,281 38,703 604,043 34,594 51,641 — — 321,909 —1999 2,783 2,146 20,366 825 74,662 98,673 288 12,171 5,198 337,791 28,565 39,220 617,760 33,372 41,075 — — 416,346 —
Trillion Btu
1960 35.9 1,301.8 70.8 27.2 155.4 140.7 5.8 35.7 22.9 719.8 506.6 R 153.9 R 1,838.7 (s) 183.4 82.1 0.8 11.8 R 3,454.51965 63.7 1,813.2 78.9 16.9 204.5 222.2 4.6 44.2 27.2 892.5 438.5 R 168.7 R 2,098.2 3.2 319.0 97.5 4.2 -4.8 R 4,394.21970 61.8 2,241.3 80.2 11.0 228.5 332.9 5.7 58.7 24.1 1,124.5 442.1 R 210.6 R 2,518.2 34.4 399.5 116.8 11.3 133.1 R 5,516.51975 56.4 1,937.3 87.2 8.3 246.6 350.7 11.5 71.6 22.0 1,268.6 698.4 R 232.3 R 2,997.3 66.9 417.3 127.5 70.2 387.6 R 6,060.41980 66.2 1,890.9 122.3 1.4 362.8 354.2 12.0 70.5 29.8 1,332.1 934.9 R 289.5 R 3,509.6 53.7 424.5 R 134.0 109.8 419.3 R 6,607.91985 45.3 1,925.5 91.9 6.8 421.9 375.8 5.2 73.8 27.1 1,404.5 419.5 R 327.2 R 3,153.7 213.3 373.7 R 155.5 195.7 592.7 R 6,655.41990 65.3 1,923.7 98.6 5.6 480.9 534.7 0.8 72.5 30.5 1,607.3 408.0 R 323.2 R 3,562.0 349.2 R h 276.9 R 196.1 R h 380.6 R 949.9 R h 7,727.11991 64.0 2,023.9 94.6 5.5 439.3 508.1 0.8 67.2 27.3 1,569.1 286.5 R 267.9 R 3,266.2 338.8 R 241.2 R 185.9 R 385.9 R 1,028.9 R 7,550.21992 64.8 2,089.5 90.0 5.3 391.8 489.5 0.4 76.4 27.8 1,658.1 218.1 R 284.6 R 3,242.1 376.3 R 214.4 R 197.8 R 391.8 R 923.3 R 7,511.71993 56.9 2,047.5 82.5 4.1 344.2 504.7 0.7 60.1 28.3 1,621.7 236.5 R 258.3 R 3,141.2 337.3 R 420.5 R 180.9 R 397.6 R 817.6 R 7,410.61994 58.0 2,172.1 81.2 4.0 378.2 560.1 0.7 65.8 29.6 R 1,609.0 267.4 R 268.4 R 3,264.3 360.3 R 248.1 R 186.1 R 399.2 R 842.5 R 7,538.71995 61.0 1,955.9 81.0 4.1 400.2 540.4 0.9 53.6 29.1 R 1,634.7 295.2 R 250.9 R 3,290.1 322.4 R 520.9 R 176.2 R 341.5 R 892.0 R 7,568.41996 53.9 1,865.1 82.3 3.9 392.7 588.4 1.7 R 39.4 28.2 R 1,660.0 257.4 R 275.4 R 3,329.4 362.2 487.6 R 175.1 R 352.5 R 1,018.1 R 7,648.21997 49.2 1,982.0 76.4 4.2 441.5 584.8 2.0 R 32.0 29.8 R 1,683.1 137.5 R 263.9 R 3,255.3 324.1 R 435.6 R 152.8 R 327.5 R 1,145.2 R 7,674.31998 64.5 2,109.5 103.3 2.9 460.3 597.5 2.7 39.5 31.2 1,719.7 114.9 230.1 3,302.2 367.5 534.3 132.4 329.4 1,098.4 7,942.41999 64.0 2,182.4 135.1 4.2 434.9 559.5 1.6 44.0 31.5 1,760.2 179.6 232.5 3,383.2 354.5 425.0 162.3 377.6 1,420.6 8,375.4
a The continuity of these data series estimates may be affected by changing data sources and estimationmethodologies. See the "Additional Notes" under each type of energy in Appendix A.
b Includes supplemental gaseous fuels.c "Other" is the subtotal of 16 petroleum products consumed in the industrial sector. See a full description in
Appendix A, Section 4, "Other Petroleum Products."d If applicable, through 1988, includes all net imports of electricity, and, from 1989, includes only the portion of
imports of electricity that is derived from hydroelectric power.e "Other" is geothermal, wind, photovoltaic, and solar thermal energy. From 1989, includes net imports of
electricity generated from geothermal energy. See Appendix A, Section 5, for explanation of estimationmethodology.
f Net interstate flow of electricity is the difference between the amount of energy in the electricity sold within aState (including associated losses) and the energy input at the electric utilities within the State. A positive number
indicates that more electricity (including associated losses) came into the State than went out of the State during theyear; conversely, a negative number indicates that more electricity (including associated losses) went out of theState than came into the State.
g From 1989, "Total" does not equal the sum of the columns. Net imports of electricity generated fromnonrenewable energy sources (shown in appendix Table A8) is included in the total but not in any other columns.
h There is a discontinuity in this time series between 1988 and 1989 due to the expanded coverage of renewableenergy sources beginning in 1989.
kWh=kilowatthours. R=Revised data. — =Not applicable.(s)=Btu value less than 0.05 and physical unit value less than 0.5.Note: Totals may not equal sum of components due to independent rounding.Sources: Data sources, estimation procedures, and assumptions are described in the appendices to this report.
Energy Information Administration
State Energy Data Report 1999 53
CALIFORNIA
Table 42. Residential Energy Consumption Estimates, Selected Years 1960-1999, California
Year
CoalaNaturalGas b
Petroleum
Wood
Geothermal Solar c
Electricity a
NetEnergy
Electrical SystemEnergy Losses d
Total
DistillateFuel a Kerosene a LPG a Total
ThousandShort Tons
BillionCubic Feet Thousand Barrels
ThousandCords
MillionKilowatthours
MillionKilowatthours
1960 2 365 485 15 3,778 4,277 1,263 — — 14,975 — 37,248 — 1965 4 489 427 31 5,095 5,553 1,083 — — 23,800 — 56,824 — 1970 38 553 500 166 5,167 5,833 1,209 — — 35,777 — 86,700 — 1975 0 631 493 211 2,708 3,412 1,374 — — 44,257 — 106,754 — 1980 1 529 94 18 4,919 5,032 R 3,550 — — 52,011 — 126,473 — 1985 19 527 148 73 5,350 5,571 4,083 — — 57,501 — 135,093 — 1990 9 515 226 88 5,750 6,064 3,174 — — 66,575 — R 145,639 — 1991 16 509 199 80 6,952 7,231 3,344 — — 66,017 — R 143,516 — 1992 (s) 480 201 33 4,802 5,036 3,519 — — 68,121 — R 145,287 — 1993 50 501 155 67 5,035 5,257 2,983 — — 67,359 — R 142,272 — 1994 58 521 148 67 4,953 5,168 2,924 — — 68,866 — R 143,719 — 1995 46 477 129 81 4,884 5,094 3,246 — — 68,783 — R 143,408 — 1996 62 473 101 103 4,079 4,283 3,240 — — 71,396 — R 148,790 — 1997 38 479 125 135 R 3,686 R 3,945 R 1,883 — — 73,086 — R 152,027 — 1998 40 550 156 237 6,092 6,485 1,660 — — 74,792 — 154,505 — 1999 10 568 101 187 5,711 6,000 1,779 — — 75,303 — 147,542 —
Trillion Btu
1960 0.1 377.6 2.8 0.1 15.2 18.1 25.3 0.0 0.0 51.1 472.0 127.1 599.11965 0.1 524.9 2.5 0.2 20.4 23.1 21.7 0.0 0.0 81.2 650.9 193.9 844.81970 0.8 582.4 2.9 0.9 19.5 23.4 24.2 0.0 0.0 122.1 752.9 295.8 1,048.71975 0.0 666.7 2.9 1.2 10.1 14.1 27.5 0.0 0.0 151.0 859.3 364.2 1,223.61980 (s) 552.4 0.6 0.1 18.1 18.7 R 71.0 0.0 0.0 177.5 R 819.6 431.5 R 1,251.21985 0.4 547.8 0.9 0.4 19.3 20.6 81.7 0.0 0.0 196.2 846.6 460.9 1,307.61990 0.2 530.8 1.3 0.5 20.8 22.7 63.5 e 0.2 R e 18.4 227.2 R e 862.9 R 496.9 R e 1,359.81991 0.4 522.3 1.2 0.5 25.1 26.7 66.9 0.2 R 19.1 225.2 R 860.8 R 489.7 R 1,350.41992 (s) 492.7 1.2 0.2 17.4 18.8 70.4 0.2 R 19.6 232.4 R 834.1 R 495.7 R 1,329.81993 1.2 519.9 0.9 0.4 18.2 19.4 59.7 0.2 R 20.1 229.8 R 850.3 R 485.4 R 1,335.71994 1.4 531.7 0.9 0.4 18.0 19.2 58.5 0.2 R 20.4 235.0 R 866.3 R 490.4 R 1,356.71995 1.1 483.8 0.8 0.5 17.7 18.9 64.9 0.2 R 20.5 234.7 R 824.0 R 489.3 R 1,313.41996 1.4 489.1 0.6 0.6 14.7 15.9 64.8 0.2 R 20.5 243.6 R 835.5 R 507.7 R 1,343.21997 0.9 487.4 0.7 0.8 R 13.3 R 14.8 R 37.7 0.2 R 20.1 249.4 R 810.4 R 518.7 R 1,329.21998 0.9 578.3 0.9 1.3 22.0 24.3 33.2 0.2 19.7 255.2 911.8 527.2 1,439.01999 0.2 578.6 0.6 1.1 20.7 22.3 35.6 0.1 19.0 256.9 912.8 503.4 1,416.2
a The continuity of these data series estimates may be affected by changing data sources and estimationmethodologies. See the "Additional Notes" under each type of energy in Appendix A.
b Includes supplemental gaseous fuels.c Includes small amounts of solar thermal and photovoltaic energy consumed by the commercial sector that
cannot be separately identified. See Appendix A, Section 5, for explanation of estimation methodology.d Incurred in the generation, transmission, and distribution of electricity plus plant use and unaccounted for
electrical system energy losses.e There is a discontinuity in this time series between 1988 and 1989 due to the expanded coverage of
renewable energy sources beginning in 1989.R=Revised data. — =Not applicable.(s)=Btu value less than 0.05 and physical unit value less than 0.5.Note: Totals may not equal sum of components due to independent rounding.Sources: Data sources, estimation procedures, and assumptions are described in the appendices to this
report.
Energy Information Administration
54 State Energy Data Report 1999
CALIFORNIA

Table 43. Commercial Energy Consumption Estimates, Selected Years 1960-1999, California
Year
CoalaNaturalGas b
Petroleum
Wood
Geothermal
Electricity a
NetEnergy
Electrical SystemEnergy Losses c
Total d
DistillateFuel a Kerosene a LPG a
MotorGasoline
ResidualFuel a Total
ThousandShort Tons
BillionCubic Feet Thousand Barrels
ThousandCords
MillionKilowatthours
MillionKilowatthours
1960 4 109 637 46 667 1,406 7,284 10,040 24 — 22,039 — 54,819 —1965 7 164 560 95 899 1,309 6,200 9,064 20 — 29,917 — 71,430 —1970 71 210 657 510 912 1,482 8,631 12,192 23 — 40,634 — 98,471 —1975 0 240 647 650 478 1,622 4,377 7,774 26 — 57,846 — 139,532 —1980 3 258 3,225 222 868 1,795 6,811 12,921 85 — 63,465 — 154,326 —1985 34 205 3,513 353 944 1,759 35 6,604 R 109 — 73,592 — 172,897 —1990 16 285 4,588 19 1,015 1,928 895 8,444 R 202 — 88,311 — R 193,190 —1991 29 288 4,449 23 1,227 1,647 764 8,110 R 213 — 86,098 — R 187,170 —1992 (s) 285 1,994 20 847 1,485 43 4,390 R 229 — 87,849 — R 187,363 —1993 92 250 1,591 19 889 262 18 2,779 240 — 86,544 — R 182,795 —1994 108 262 1,505 12 874 226 8 2,625 245 — 84,529 — R 176,405 —1995 86 279 2,334 27 862 236 4 3,463 245 — 86,032 — R 179,371 —1996 115 235 1,743 69 720 231 12 2,775 R 266 — 88,605 — R 184,653 —1997 71 254 1,955 41 R 650 233 2 R 2,881 R 207 — 92,295 — R 191,984 —1998 75 282 2,451 63 1,075 250 63 3,901 207 — 92,228 — 190,524 —1999 18 245 1,624 29 1,008 236 0 2,897 249 — 95,771 — 187,645 —
Trillion Btu
1960 0.1 112.7 3.7 0.3 2.7 7.4 45.8 59.8 0.5 0.0 75.2 248.3 187.0 435.31965 0.2 175.5 3.3 0.5 3.6 6.9 39.0 53.3 0.4 0.0 102.1 331.4 243.7 575.11970 1.6 221.3 3.8 2.9 3.4 7.8 54.3 72.2 0.5 0.0 138.6 434.2 336.0 770.11975 0.0 253.7 3.8 3.7 1.8 8.5 27.5 45.3 0.5 0.0 197.4 496.8 476.1 972.91980 0.1 269.4 18.8 1.3 3.2 9.4 42.8 75.5 1.7 0.0 216.5 563.2 526.6 1,089.81985 0.8 212.9 20.5 2.0 3.4 9.2 0.2 35.3 R 2.2 0.0 251.1 R 502.3 589.9 R 1,092.31990 0.4 294.1 26.7 0.1 3.7 10.1 5.6 46.3 R 4.0 e 0.3 301.3 R e 646.4 R 659.2 R e 1,305.61991 0.7 295.3 25.9 0.1 4.4 8.7 4.8 43.9 R 4.3 0.3 293.8 R 638.2 R 638.6 R 1,276.91992 (s) 292.8 11.6 0.1 3.1 7.8 0.3 22.9 R 4.6 0.3 299.7 R 620.4 R 639.3 R 1,259.71993 2.1 259.8 9.3 0.1 3.2 1.4 0.1 14.1 4.8 0.3 295.3 576.4 R 623.7 R 1,200.11994 2.5 267.4 8.8 0.1 3.2 1.2 (s) 13.2 4.9 0.3 288.4 576.8 R 601.9 1,178.71995 2.0 282.4 13.6 0.2 3.1 1.2 (s) 18.1 4.9 0.4 293.5 601.4 R 612.0 R 1,213.41996 2.7 242.9 10.2 0.4 2.6 1.2 0.1 14.4 5.3 0.5 302.3 568.1 R 630.0 R 1,198.11997 1.6 258.4 11.4 0.2 R 2.4 1.2 (s) R 15.2 R 4.1 0.5 314.9 R 594.8 R 655.0 R 1,249.91998 1.7 296.7 14.3 0.4 3.9 1.3 0.4 20.2 4.1 0.7 314.7 638.1 650.1 1,288.21999 0.4 249.1 9.5 0.2 3.6 1.2 0.0 14.5 5.0 0.5 326.8 596.3 640.2 1,236.5
a The continuity of these data series estimates may be affected by changing data sources and estimationmethodologies. See the "Additional Notes" under each type of energy in Appendix A.
b Includes supplemental gaseous fuels.c Incurred in the generation, transmission, and distribution of electricity plus plant use and unaccounted for
electrical system energy losses.d Small amounts of solar thermal and photovoltaic energy consumed in the commercial sector cannot be
separately identified and are included in residential consumption.e There is a discontinuity in this time series between 1988 and 1989 due to the expanded coverage of
renewable energy sources beginning in 1989.R=Revised data. — =Not applicable.(s)=Btu value less than 0.05 and physical unit value less than 0.5.Note: Totals may not equal sum of components due to independent rounding.Sources: Data sources, estimation procedures, and assumptions are described in the appendices to this
report.
Energy Information Administration
State Energy Data Report 1999 55
CALIFORNIA

Table 44. Industrial Energy Consumption Estimates, Selected Years 1960-1999, California
Year
CoalNaturalGas a
PetroleumHydro-electricPower b
Woodand
Waste Other b,d
Electricity b
NetEnergy
ElectricalSystemEnergy
Losses e
Total
Asphalt andRoad Oil b
DistillateFuel b
Kero-sene b LPG b
Lubri-cants b
MotorGasoline
ResidualFuel b Other b,c Total
ThousandShort Tons
BillionCubic Feet Thousand Barrels
MillionkWh
MillionkWh
MillionkWh
1960 1,313 451 10,665 10,127 956 4,231 1,454 2,851 10,750 R 25,691 R 66,725 (s) — — 20,190 — 50,221 —1965 2,361 529 11,892 13,002 692 4,826 1,709 2,245 11,846 R 28,664 R 74,876 (s) — — 28,904 — 69,012 —1970 2,215 711 12,084 8,510 328 9,147 1,510 1,942 12,121 R 35,824 R 81,466 (s) — — 42,169 — 102,190 —1975 2,151 666 13,146 10,519 1,166 15,688 1,246 1,338 8,308 R 39,478 R 90,890 0 — — 46,053 — 111,086 —1980 2,665 486 18,431 15,576 1,877 12,887 2,103 1,698 12,554 R 49,455 R 114,581 0 — — 51,888 — 126,174 —1985 1,889 433 13,848 18,285 491 12,977 1,914 3,065 18,732 R 55,165 R 124,477 0 — — 52,972 — 124,454 —1990 2,874 588 14,862 19,138 38 12,304 2,153 3,163 1,864 R 54,940 R 108,462 R f 990 — — 55,892 — R 122,268 —1991 2,771 707 14,251 14,329 36 9,658 1,926 3,271 1,762 R 45,165 R 90,398 R 1,368 — — 56,191 — R 122,155 —1992 2,821 687 13,558 11,101 23 14,788 1,964 3,297 1,889 R 48,344 R 94,964 R 1,476 — — 57,090 — R 121,759 —1993 2,311 747 12,433 8,779 44 10,073 2,000 2,664 1,539 R 43,672 R 81,205 R 2,511 — — 56,189 — R 118,680 —1994 2,332 726 12,237 9,028 40 11,266 2,090 2,758 1,353 R 45,397 R 84,169 R 1,091 — — 59,864 — R 124,931 —1995 2,485 754 12,212 8,607 56 8,489 2,054 2,849 1,489 R 42,389 R 78,145 R 3,049 — — 57,367 — R 119,607 —1996 2,140 761 12,399 8,078 122 R 5,634 1,994 2,741 309 R 46,392 R 77,670 R 2,919 — — 57,683 — R 120,211 —1997 2,026 812 11,512 11,031 182 R 4,169 2,106 2,910 104 R 44,442 R 76,456 R 1,220 — — 62,017 — R 129,001 —1998 2,688 900 15,572 11,849 174 3,100 2,205 3,263 33 38,703 74,899 2,073 — — 58,856 — 121,584 —1999 2,755 1,175 20,366 8,737 73 5,068 2,228 1,922 684 39,220 78,298 1,508 — — 63,217 — 123,861 —
Trillion Btu
1960 35.2 466.3 70.8 59.0 5.4 17.0 8.8 15.0 67.6 R 153.9 R 397.5 (s) 56.3 0.0 68.9 R 1,024.2 171.4 R 1,195.51965 63.2 567.4 78.9 75.7 3.9 19.4 10.4 11.8 74.5 R 168.7 R 443.3 (s) 74.8 0.0 98.6 R 1,247.3 235.5 R 1,482.81970 59.3 749.1 80.2 49.6 1.9 34.6 9.2 10.2 76.2 R 210.6 R 472.3 (s) 91.7 0.0 143.9 R 1,516.4 348.7 R 1,865.01975 56.4 703.6 87.2 61.3 6.6 58.3 7.6 7.0 52.2 R 232.3 R 512.5 0.0 99.3 0.0 157.1 R 1,529.0 379.0 R 1,908.01980 66.1 507.4 122.3 90.7 10.6 47.3 12.8 8.9 78.9 R 289.5 R 661.2 0.0 R 61.1 0.0 177.0 R 1,472.7 430.5 R 1,903.31985 44.0 449.5 91.9 106.5 2.8 46.8 11.6 16.1 117.8 R 327.2 R 720.6 0.0 R 71.6 0.0 180.7 R 1,466.5 424.6 R 1,891.11990 64.7 606.5 98.6 111.5 0.2 44.6 13.1 16.6 11.7 R 323.2 R 619.5 R f 10.3 R 128.6 R f 172.5 190.7 R f 1,792.9 R 417.2 R f 2,210.11991 63.0 725.7 94.6 83.5 0.2 34.9 11.7 17.2 11.1 R 267.9 R 521.0 R 14.3 R 114.6 R 185.0 191.7 R 1,815.3 R 416.8 R 2,232.11992 64.8 705.7 90.0 64.7 0.1 53.6 11.9 17.3 11.9 R 284.6 R 534.1 R 15.3 R 122.8 R 187.4 194.8 R 1,824.7 R 415.4 R 2,240.21993 53.6 775.3 82.5 51.1 0.3 36.3 12.1 14.0 9.7 R 258.3 R 464.3 R 25.9 R 116.4 R 203.3 191.7 R 1,830.6 R 404.9 R 2,235.51994 54.2 741.4 81.2 52.6 0.2 41.0 12.7 R 14.4 8.5 R 268.4 R 478.9 R 11.3 R 122.7 R 212.7 204.3 R 1,825.3 R 426.3 2,251.61995 57.9 764.3 81.0 50.1 0.3 30.8 12.5 R 14.9 9.4 R 250.9 R 449.8 R 31.4 R 106.4 R 205.4 195.7 R 1,811.0 R 408.1 R 2,219.11996 49.8 786.7 82.3 47.1 0.7 R 20.4 12.1 R 14.3 1.9 R 275.4 R 454.1 R 30.2 R 104.5 R 211.9 196.8 R 1,834.0 R 410.2 R 2,244.11997 46.7 825.9 76.4 64.3 1.0 R 15.1 12.8 R 15.2 0.7 R 263.9 R 449.3 R 12.6 R 109.7 R 195.1 211.6 R 1,851.0 R 440.2 R 2,291.11998 61.8 946.7 103.3 69.0 1.0 11.2 13.4 17.0 0.2 230.1 445.2 21.4 93.8 202.3 200.8 1,972.1 414.8 2,387.01999 63.4 1,196.3 135.1 50.9 0.4 18.3 13.5 10.0 4.3 232.5 465.1 15.6 120.3 324.8 215.7 2,401.1 422.6 2,823.7
a Includes supplemental gaseous fuels.b The continuity of these data series estimates may be affected by changing data sources and estimation
methodologies. See the "Additional Notes" under each type of energy in Appendix A.c "Other" is the subtotal of 16 petroleum products. See a full description in Appendix A, Section 4, "Other
Petroleum Products."d "Other" is geothermal, wind, photovoltaic, and solar thermal energy. See Appendix A, Section 5, for
explanation of estimation methodology.e Incurred in the generation, transmission, and distribution of electricity plus plant use and unaccounted for
electrical system energy losses.
f There is a discontinuity in this time series between 1988 and 1989 due to the expanded coverage ofrenewable energy sources beginning in 1989.
R=Revised data.kWh=kilowatthours. — =Not applicable.(s)=Btu value less than 0.05 and physical unit value less than 0.5.Note: Totals may not equal sum of components due to independent rounding.Sources: Data sources, estimation procedures, and assumptions are described in the appendices to this
report.
Energy Information Administration
56 State Energy Data Report 1999
CALIFORNIA

Table 45. Transportation Energy Consumption Estimates, Selected Years 1960-1999, California
Year
Coal aNaturalGas b
Petroleum
Ethanol c Electricity a
NetEnergy
Electrical SystemEnergy Losses d
Total c
AviationGasoline a
DistillateFuel a
JetFuel a LPG a Lubricants a
MotorGasoline
ResidualFuel a Total
ThousandShort Tons
BillionCubic Feet Thousand Barrels
ThousandBarrels
MillionKilowatthours
MillionKilowatthours
1960 23 11 5,383 15,313 25,818 214 2,327 132,768 38,610 220,432 0 66 — 164 —1965 8 16 3,342 21,032 40,150 208 2,772 166,346 35,109 268,960 0 66 — 158 —1970 4 17 2,184 29,448 59,614 305 2,457 210,641 27,982 332,632 0 65 — 158 —1975 (s) 20 1,640 30,528 62,509 390 2,386 238,548 20,056 356,057 0 265 — 639 —1980 0 15 285 41,801 62,224 522 2,804 250,100 66,673 424,409 0 203 — 493 —1985 0 14 1,354 50,177 67,028 1,225 2,552 262,544 43,340 428,219 R e 429 266 — 625 —1990 0 20 1,106 58,418 94,907 923 2,871 300,893 54,963 514,080 R 1,133 315 — 690 —1991 0 19 1,091 56,328 90,064 760 2,568 293,780 42,113 486,703 R 1,424 345 — R 750 —1992 0 15 1,059 53,839 86,688 650 2,619 310,861 32,282 487,997 R 158 387 — R 826 —1993 0 12 819 48,455 89,244 658 2,666 305,800 32,831 480,474 R 575 408 — 861 —1994 0 13 793 54,137 98,793 1,006 2,787 304,669 38,310 500,495 R 810 425 — 887 —1995 0 20 807 57,540 95,305 564 2,739 310,379 44,729 512,062 R 2,523 423 — 882 —1996 0 20 769 57,352 103,773 R 481 2,658 315,285 39,644 R 519,961 R 2,128 429 — R 894 —1997 0 25 R 836 62,403 103,144 R 349 2,808 319,727 21,714 R 510,982 R 2,134 478 — R 994 —1998 0 11 574 64,305 105,385 670 2,940 326,430 18,176 518,480 1,610 521 — 1,076 —1999 0 13 825 64,078 98,673 384 2,971 335,633 27,881 530,446 1,395 540 — 1,058 —
Trillion Btu
1960 0.6 11.0 27.2 89.2 140.7 0.9 14.1 697.4 242.7 1,212.2 0.0 0.2 1,223.9 0.6 1,224.51965 0.2 16.8 16.9 122.5 222.2 0.8 16.8 873.8 220.7 1,473.8 0.0 0.2 1,491.0 0.5 1,491.51970 0.1 17.9 11.0 171.5 332.9 1.2 14.9 1,106.5 175.9 1,814.0 0.0 0.2 1,832.2 0.5 1,832.71975 (s) 21.4 8.3 177.8 350.2 1.5 14.5 1,253.1 126.1 1,931.4 0.0 0.9 1,953.7 2.2 1,955.91980 0.0 15.9 1.4 243.5 348.7 1.9 17.0 1,313.8 419.2 2,345.5 0.0 0.7 2,362.1 1.7 2,363.81985 0.0 15.0 6.8 292.3 375.8 4.4 15.5 1,379.1 272.5 2,346.5 R e 1.5 0.9 e 2,362.3 2.1 e 2,364.51990 0.0 20.8 5.6 340.3 534.7 3.3 17.4 1,580.6 345.6 2,827.4 R 4.0 1.1 2,849.3 2.4 2,851.61991 0.0 19.0 5.5 328.1 508.1 2.7 15.6 1,543.2 264.8 2,668.0 R 5.0 1.2 2,688.2 2.6 2,690.81992 0.0 15.2 5.3 313.6 489.5 2.4 15.9 1,633.0 203.0 2,662.7 R 0.6 1.3 2,679.2 2.8 2,682.01993 0.0 12.5 4.1 282.3 504.7 2.4 16.2 1,606.4 206.4 2,622.4 R 2.0 1.4 2,636.3 2.9 2,639.31994 0.0 12.9 4.0 315.3 560.1 3.7 16.9 R 1,593.4 240.9 R 2,734.3 R 2.9 1.5 R 2,748.7 3.0 R 2,751.71995 0.0 20.0 4.1 335.2 540.4 2.0 16.6 R 1,618.6 281.2 R 2,798.1 R 8.9 1.4 R 2,819.6 3.0 R 2,822.61996 0.0 20.2 3.9 334.1 588.4 R 1.7 16.1 R 1,644.5 249.2 R 2,838.0 R 7.5 1.5 R 2,859.6 3.0 R 2,862.71997 0.0 25.1 4.2 363.5 584.8 R 1.3 17.0 R 1,666.7 136.5 R 2,774.1 R 7.6 1.6 R 2,800.8 3.4 R 2,804.21998 0.0 11.9 2.9 374.6 597.5 2.4 17.8 1,701.4 114.3 2,810.9 5.7 1.8 2,824.6 3.7 2,828.21999 0.0 12.9 4.2 373.3 559.5 1.4 18.0 1,749.0 175.3 2,880.6 4.9 1.8 2,895.3 3.6 2,898.9
a The continuity of these data series estimates may be affected by changing data sources and estimationmethodologies. See the "Additional Notes" under each type of energy in Appendix A.
b Includes supplemental gaseous fuels. Transportation use of natural gas is gas consumed in the operationof pipelines, primarily in compressors, and, since 1990, is also gas consumed as vehicle fuel.
c Ethanol blended into motor gasoline, which is accounted for under motor gasoline, is shown separately hereto display the use of renewable energy by the transportation sector and is included only once in the total.
d Incurred in the generation, transmission, and distribution of electricity plus plant use and unaccounted forelectrical system energy losses.
e There is a discontinuity in this time series between 1980 and 1981 due to the expanded coverage ofrenewable energy sources beginning in 1981.
R=Revised data. — =Not applicable.(s)=Btu value less than 0.05 and physical unit value less than 0.5.Note: Totals may not equal sum of components due to independent rounding.Sources: Data sources, estimation procedures, and assumptions are described in the appendices to this
report.
Energy Information Administration
State Energy Data Report 1999 57
CALIFORNIA
California Energy Flow—1999 29
Credits and Web Locations
The energy flow charts prepared by Lawrence Livermore NationalLaboratory are available on the Web athttp://en-env.llnl.gov/flow/ .
The Energy Information Administration’s Website ishttp://www.eia.doe.gov/ .
The California Energy Commission’s Website ishttp://www.energy.ca.gov/ .
Graphic artist: Helen Magann