C NTERNATIONAL OMPASS MINERALS Worth our Salt€¦ · Overland Park, Kansas 66210 ... Diluted...
80
Worth our Salt 2005 Annual Report
Transcript of C NTERNATIONAL OMPASS MINERALS Worth our Salt€¦ · Overland Park, Kansas 66210 ... Diluted...
Worth our Salt2005 Annual Report
CO M PA S S MI N E R A L S
IN T E R N AT I O N A L, IN C.
9900 West 109th Street
Suite 600
Overland Park, Kansas 66210
913-344-9200
Worth our Salt
Compass MineralsInternational
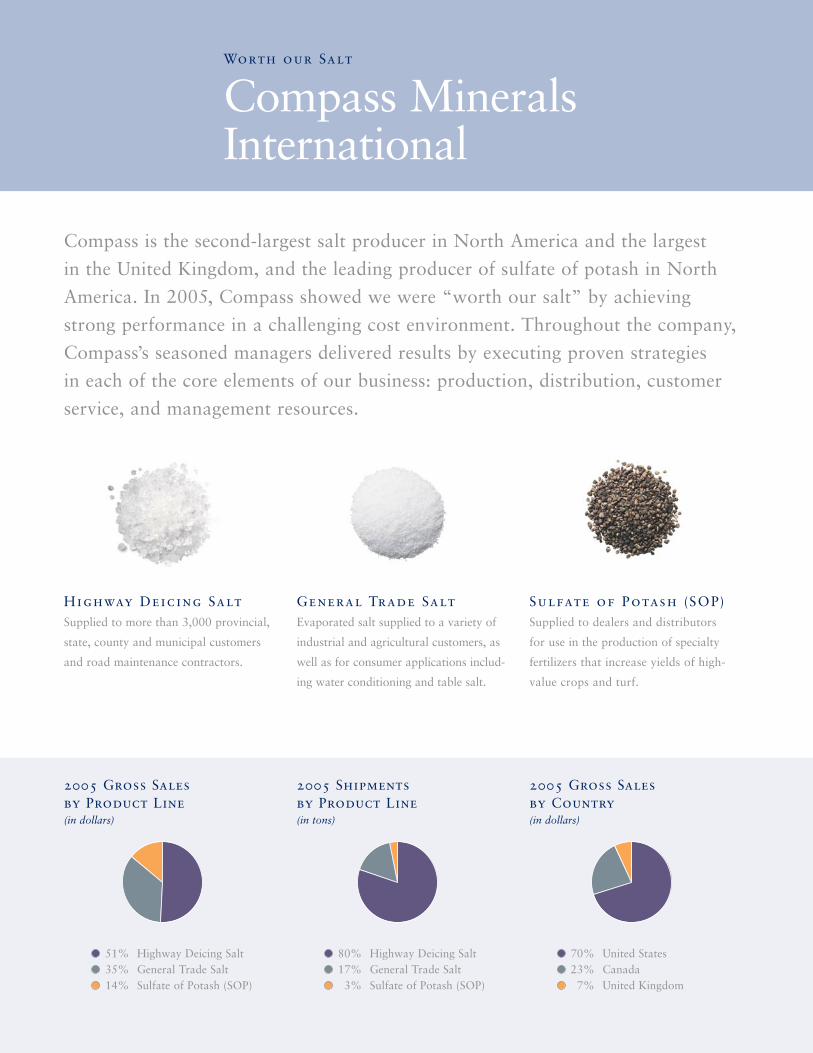
Compass is the second-largest salt producer in North America and the largest
in the United Kingdom, and the leading producer of sulfate of potash in North
America. In 2005, Compass showed we were “worth our salt” by achieving
strong performance in a challenging cost environment. Throughout the company,
Compass’s seasoned managers delivered results by executing proven strategies
in each of the core elements of our business: production, distribution, customer
service, and management resources.
2005 Gross Sales by Product Line(in dollars)
2005 Shipments by Product Line(in tons)
2005 Gross Sales by Country(in dollars)
51% Highway Deicing Salt35% General Trade Salt14% Sulfate of Potash (SOP)
80% Highway Deicing Salt17% General Trade Salt3% Sulfate of Potash (SOP)
70% United States23% Canada7% United Kingdom
Highway Deicing SaltSupplied to more than 3,000 provincial,
state, county and municipal customers
and road maintenance contractors.
General Trade SaltEvaporated salt supplied to a variety of
industrial and agricultural customers, as
well as for consumer applications includ-
ing water conditioning and table salt.
Sulfate of Potash (SOP)Supplied to dealers and distributors
for use in the production of specialty
fertilizers that increase yields of high-
value crops and turf.
Directors
Vernon G. Baker, II (3,4)
Senior Vice President and General Counsel ArvinMeritor, Inc.
Bradley J. Bell (1)*
Executive Vice President and Chief Financial Officer Nalco Company
David J. D’Antoni (2,3)
Retired Senior Vice President and Group Operating Officer Ashland, Inc.
Michael E. Ducey (3)
President and Chief Executive Officer Compass Minerals International, Inc.
Richard S. Grant (1,4)**
Retired Chief Executive Officer BOC Process Gas Solutions
Perry W. Premdas (1,2)*
Retired Chief Financial Officer Celanese AG
(1) Audit Committee member(2) Compensation Committee
member(3) Environment, Health &
Safety Committee member(4) Nominating/Corporate
Governance Committee member
* Audit Committee financialexpert
**Lead Director
Officers
Michael E. Ducey President and Chief Executive Officer
Ronald BryanVice President and GeneralManager, Sulfate of PotashVice President, Strategy and Development
Keith E. ClarkVice President and GeneralManager, General Trade
John FallisVice President and GeneralManager, Highway Deicing
David J. GoadbyVice President and ManagingDirector, Salt Union Limited
Victoria HeiderVice President, Human Resources
Timothy R. MertzVice President, Tax and Assistant Secretary
Gregory W. SheltonVice President, Supply Chain
Jerry A. SmithVice President, Chief Information Officer
Rodney L. UnderdownVice President, Chief FinancialOfficer and Secretary
Carol WoodTreasurer
Michael ZinkeVice President, Controller
ShareholderInformation
Address: Compass Minerals International, Inc.9900 West 109th StreetSuite 600Overland Park, Kansas 66210
Securities Listed: New York Stock ExchangeCommon Stock Symbol CMP
Transfer Agent: UMB Bank, n. a.Securities Transfer DivisionP.O. Box 410064Kansas City, MO 64141-0064816-860-7000
Web site: www.CompassMinerals.com
1
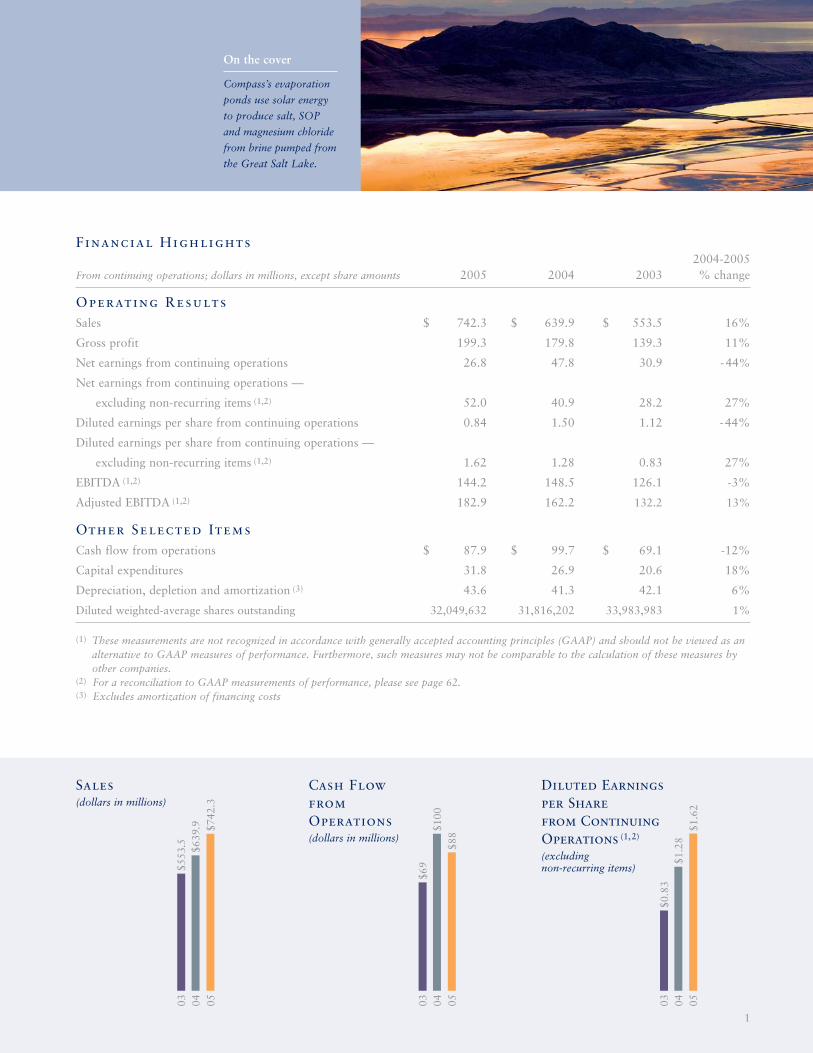
Financial Highlights2004-2005
From continuing operations; dollars in millions, except share amounts 2005 2004 2003 % change
Operating ResultsSales $ 742.3 $ 639.9 $ 553.5 16%
Gross profit 199.3 179.8 139.3 11%
Net earnings from continuing operations 26.8 47.8 30.9 -44%
Net earnings from continuing operations —
excluding non-recurring items (1,2) 52.0 40.9 28.2 27%
Diluted earnings per share from continuing operations 0.84 1.50 1.12 -44%
Diluted earnings per share from continuing operations —
excluding non-recurring items (1,2) 1.62 1.28 0.83 27%
EBITDA (1,2) 144.2 148.5 126.1 -3%
Adjusted EBITDA (1,2) 182.9 162.2 132.2 13%
Other Selected ItemsCash flow from operations $ 87.9 $ 99.7 $ 69.1 -12%
Capital expenditures 31.8 26.9 20.6 18%
Depreciation, depletion and amortization (3) 43.6 41.3 42.1 6%
Diluted weighted-average shares outstanding 32,049,632 31,816,202 33,983,983 1%
(1) These measurements are not recognized in accordance with generally accepted accounting principles (GAAP) and should not be viewed as analternative to GAAP measures of performance. Furthermore, such measures may not be comparable to the calculation of these measures byother companies.
(2) For a reconciliation to GAAP measurements of performance, please see page 62. (3) Excludes amortization of financing costs
Sales (dollars in millions)
Cash Flow from Operations(dollars in millions)
Diluted Earnings per Share from Continuing Operations (1,2)
(excluding non-recurring items)
03 04 05
$553
.5 $639
.9 $742
.3
03 04 05
$69
$100
$88
$1.6
2
03 04 05
$0.8
3$1
.28
On the cover
Compass’s evaporation
ponds use solar energy
to produce salt, SOP
and magnesium chloride
from brine pumped from
the Great Salt Lake.
2
At Compass Minerals, our strengths are as basic as salt. We sell products that are
essential to life, we work to maintain strong competitive positions, and we have
decades of experience that keep us focused on the things that really matter: generating
cash, strengthening the company and its balance sheet, and rewarding our owners.
Every day, we challenge ourselves to prove that Compass is worth its salt.
Compass Minerals had an outstanding year in 2005. We delivered strong financial results, made
continuing progress on our strategic and financial priorities, and returned value directly to share-
holders through an increase in our dividend.
2005 ResultsFor the year, revenues increased 16 percent to a record $742 million. Net earnings from continuing
operations, excluding special items*, increased 27 percent to $52 million. Earnings before interest,
taxes, depreciation, depletion and amortization (EBITDA)*, adjusted to remove the impact of non-
recurring costs, improved 13 percent to $183 million.
These very strong results include a significant boost from favorable winter weather, which we esti-
mate added $60 million to $70 million to our revenues. Of course, we cannot control the weather. But
we can control how we run our business, and I am pleased to say that, excluding the estimated impact
of more-severe-than-normal weather from our results in 2005 and 2004, we performed exceptionally
well, with double-digit growth in both revenues and operating earnings from continuing operations.
Focus on ExecutionOur strong “normal weather” performance is particularly gratifying because it was accomplished
despite significant increases in natural gas and fuel prices, and transportation shortages that intensified
in the wake of the Gulf Coast hurricanes.
Our ability to deliver these excellent results flows directly from our persistent focus on our
operating principles. You can see that focus in the productivity and cost improvements driven by
our Operational Excellence program. Over the past several years, many Operational Excellence
projects have targeted energy efficiency, which helped to moderate the impact of higher energy
costs. We also benefited from our natural gas hedging program, which protected us against sharp
increases in market rates for natural gas in 2005.
Our BusinessesOur highway deicing product line had an outstanding year, with weather-driven volume gains and
price increases that helped offset higher transportation costs. Our highway deicing customers rely
on us to get salt to them when they need it, and in 2005 our logistics team did a great job in the face
of sometimes severe logistical challenges. Our general trade product lines delivered solid top-line
growth with a continuing focus on higher-value products, such as water conditioning and premium
deicing products for the consumer market.
Dear Fellow Shareholders:
* These measurements are not recognized in accordance with generally accepted accounting principles (GAAP). Please see page 62 for reconciliations to GAAP measures of performance.
3
Sulfate of potash (SOP) had a record year, with revenue up 17 percent and increases in operating
earnings and margins, driven by significant price improvements and modest volume growth, which
was limited by our solar pond harvest. Pond expansions completed in early 2005 should improve
our SOP production for the 2007 selling season.
Employing Our CashAs in the past, we used the cash generated by our operations for three primary purposes: reducing
our debt, investing in capital projects that build the value of the company, and returning value to
shareholders through dividends.
Over the course of 2005, we made nearly $30 million of early payments on our pre-payable
debt. Then, in December, we executed a tender offer and a refinancing that replaced virtually all of
our 10-percent senior subordinated notes with a new bank credit facility, creating significant net
benefit to the company in lower interest costs and increased flexibility.
Also during the year we sold our United Kingdom general trade salt business to INEOS
Enterprises, the business’s largest customer, for $36.2 million. Put simply, changes in the British
chemical industry made the business a better strategic fit for INEOS than for Compass. We are
redeploying the bulk of the sale proceeds to general corporate purposes, including debt reduction.
Total capital spending for the year was about $32 million, with about $27 million in maintenance
of business and return on investment projects, and $5 million on the expansion of our magnesium
chloride production at the Great Salt Lake and a new mill at our Goderich plant, both of which will
be completed in 2006.
Finally, we continued to return value directly to shareholders, with the board declaring an
11 percent increase in our quarterly stock dividend in February 2006.
My RetirementIn November, I announced my intention to retire from Compass at the end of 2006. I am leaving at a
time when the company has strong operational momentum and managers who have the demonstrated
ability to continue to move Compass forward. I have assured the board that I will remain with the
company as long as necessary to ensure a seamless transition, and I will continue to serve Compass as
a consultant after that.
Worth Our SaltOur performance in 2005 once again proves that Compass is “worth its salt.” We are a company
with a simple, transparent business model and great clarity of purpose. It is a model whose success
depends upon the skill and commitment of all of our employees, and I know I speak for the board
of directors in saying that we are deeply grateful for their contributions. It is through their efforts
that we create value for our customers, our communities and our shareholders.
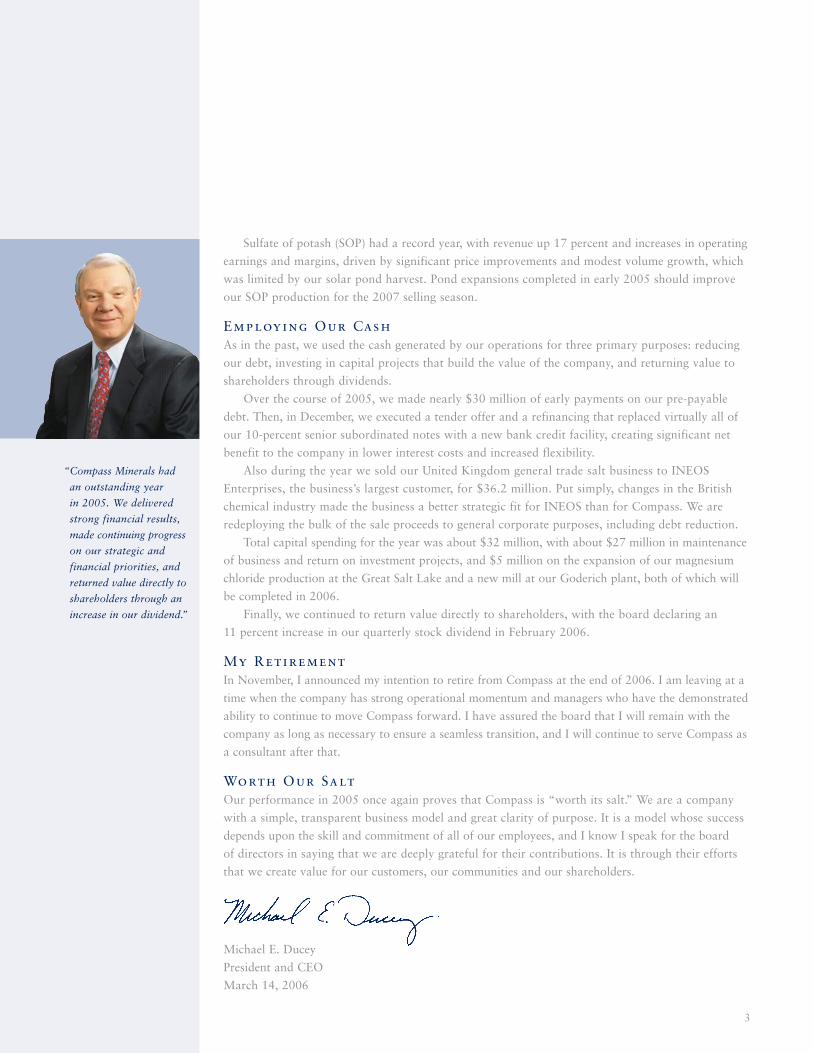
Michael E. Ducey
President and CEO
March 14, 2006
“Compass Minerals had
an outstanding year
in 2005. We delivered
strong financial results,
made continuing progress
on our strategic and
financial priorities, and
returned value directly to
shareholders through an
increase in our dividend.”
4
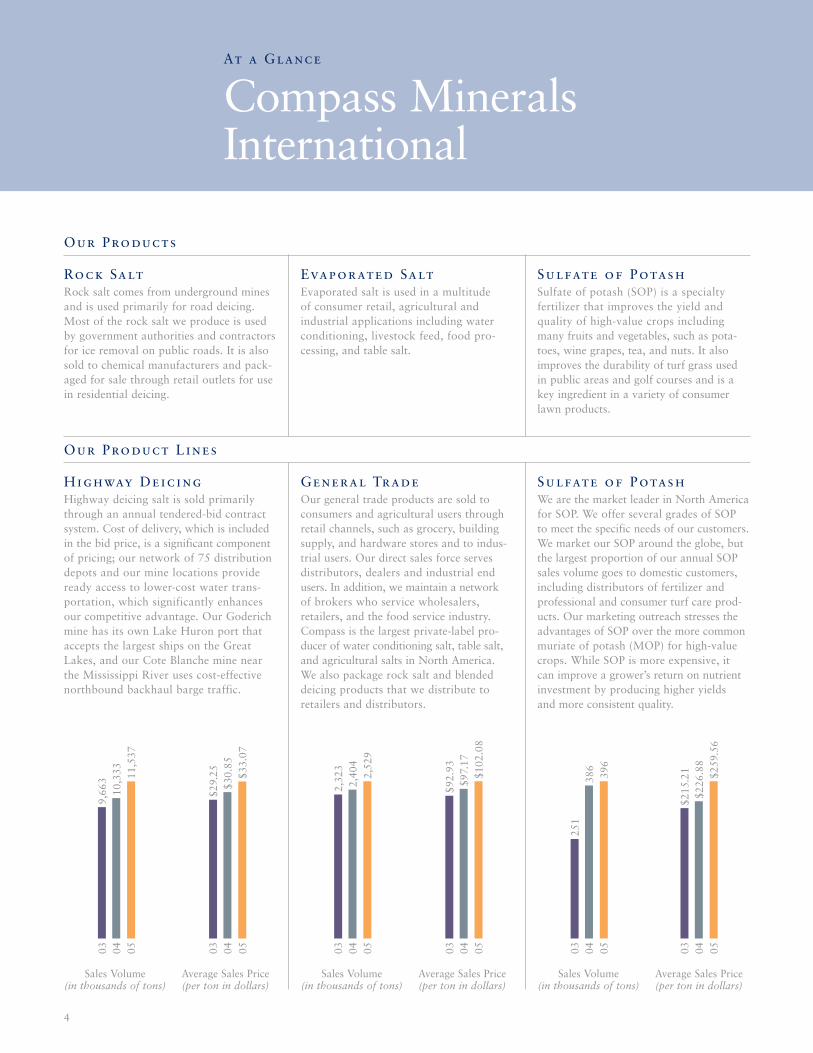
Sales Volume(in thousands of tons)
Average Sales Price(per ton in dollars)
Sales Volume(in thousands of tons)
Average Sales Price(per ton in dollars)
Highway DeicingHighway deicing salt is sold primarilythrough an annual tendered-bid contractsystem. Cost of delivery, which is includedin the bid price, is a significant componentof pricing; our network of 75 distributiondepots and our mine locations provideready access to lower-cost water trans-portation, which significantly enhancesour competitive advantage. Our Goderichmine has its own Lake Huron port thataccepts the largest ships on the GreatLakes, and our Cote Blanche mine nearthe Mississippi River uses cost-effectivenorthbound backhaul barge traffic.
General TradeOur general trade products are sold toconsumers and agricultural users throughretail channels, such as grocery, buildingsupply, and hardware stores and to indus-trial users. Our direct sales force servesdistributors, dealers and industrial endusers. In addition, we maintain a network of brokers who service wholesalers, retailers, and the food service industry.Compass is the largest private-label pro-ducer of water conditioning salt, table salt,and agricultural salts in North America.We also package rock salt and blendeddeicing products that we distribute toretailers and distributors.
Sulfate of PotashWe are the market leader in North Americafor SOP. We offer several grades of SOP to meet the specific needs of our customers.We market our SOP around the globe, butthe largest proportion of our annual SOPsales volume goes to domestic customers,including distributors of fertilizer and professional and consumer turf care prod-ucts. Our marketing outreach stresses theadvantages of SOP over the more commonmuriate of potash (MOP) for high-valuecrops. While SOP is more expensive, it can improve a grower’s return on nutrientinvestment by producing higher yields and more consistent quality.
Rock SaltRock salt comes from underground mines and is used primarily for road deicing. Most of the rock salt we produce is used by government authorities and contractors for ice removal on public roads. It is also sold to chemical manufacturers and pack-aged for sale through retail outlets for use in residential deicing.
Evaporated SaltEvaporated salt is used in a multitude of consumer retail, agricultural and industrial applications including waterconditioning, livestock feed, food pro-cessing, and table salt.
Sulfate of PotashSulfate of potash (SOP) is a specialty fertilizer that improves the yield and quality of high-value crops including many fruits and vegetables, such as pota-toes, wine grapes, tea, and nuts. It alsoimproves the durability of turf grass usedin public areas and golf courses and is akey ingredient in a variety of consumerlawn products.
Sales Volume(in thousands of tons)
Average Sales Price(per ton in dollars)
Our Products
Our Product Lines
03 04 05
9,66
310
,333 11
,537
03 04 05
$29.
25$3
0.85
$33.
07
03 04 05
2,32
32,
404
2,52
9
03 04 05
$92.
93$9
7.17
$102
.08
03 04 05
251
386
396
03 04 05
$215
.21
$226
.88
$259
.56
At a Glance
Compass MineralsInternational
5
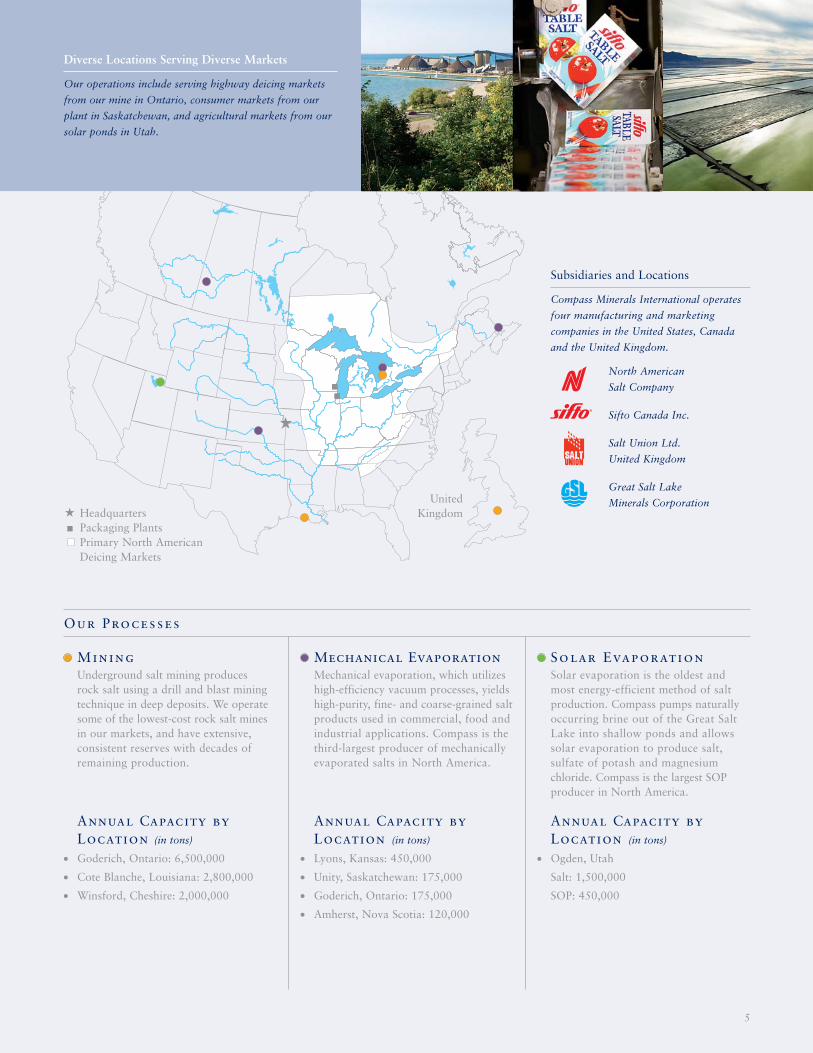
MiningUnderground salt mining produces rock salt using a drill and blast miningtechnique in deep deposits. We operatesome of the lowest-cost rock salt minesin our markets, and have extensive, consistent reserves with decades ofremaining production.
Annual Capacity by Location (in tons)
Goderich, Ontario: 6,500,000
Cote Blanche, Louisiana: 2,800,000
Winsford, Cheshire: 2,000,000
Mechanical EvaporationMechanical evaporation, which utilizeshigh-efficiency vacuum processes, yieldshigh-purity, fine- and coarse-grained saltproducts used in commercial, food andindustrial applications. Compass is thethird-largest producer of mechanicallyevaporated salts in North America.
Annual Capacity by Location (in tons)
Lyons, Kansas: 450,000
Unity, Saskatchewan: 175,000
Goderich, Ontario: 175,000
Amherst, Nova Scotia: 120,000
Solar EvaporationSolar evaporation is the oldest and most energy-efficient method of saltproduction. Compass pumps naturallyoccurring brine out of the Great SaltLake into shallow ponds and allowssolar evaporation to produce salt, sulfate of potash and magnesium chloride. Compass is the largest SOPproducer in North America.
Annual Capacity by Location (in tons)
Ogden, Utah
Salt: 1,500,000
SOP: 450,000
HeadquartersPackaging PlantsPrimary North American Deicing Markets
UnitedKingdom
Subsidiaries and Locations
Compass Minerals International operates
four manufacturing and marketing
companies in the United States, Canada
and the United Kingdom.
North American
Salt Company
Sifto Canada Inc.
Salt Union Ltd.
United Kingdom
Great Salt Lake
Minerals Corporation
Our Processes
Diverse Locations Serving Diverse Markets
Our operations include serving highway deicing markets
from our mine in Ontario, consumer markets from our
plant in Saskatchewan, and agricultural markets from our
solar ponds in Utah.
6
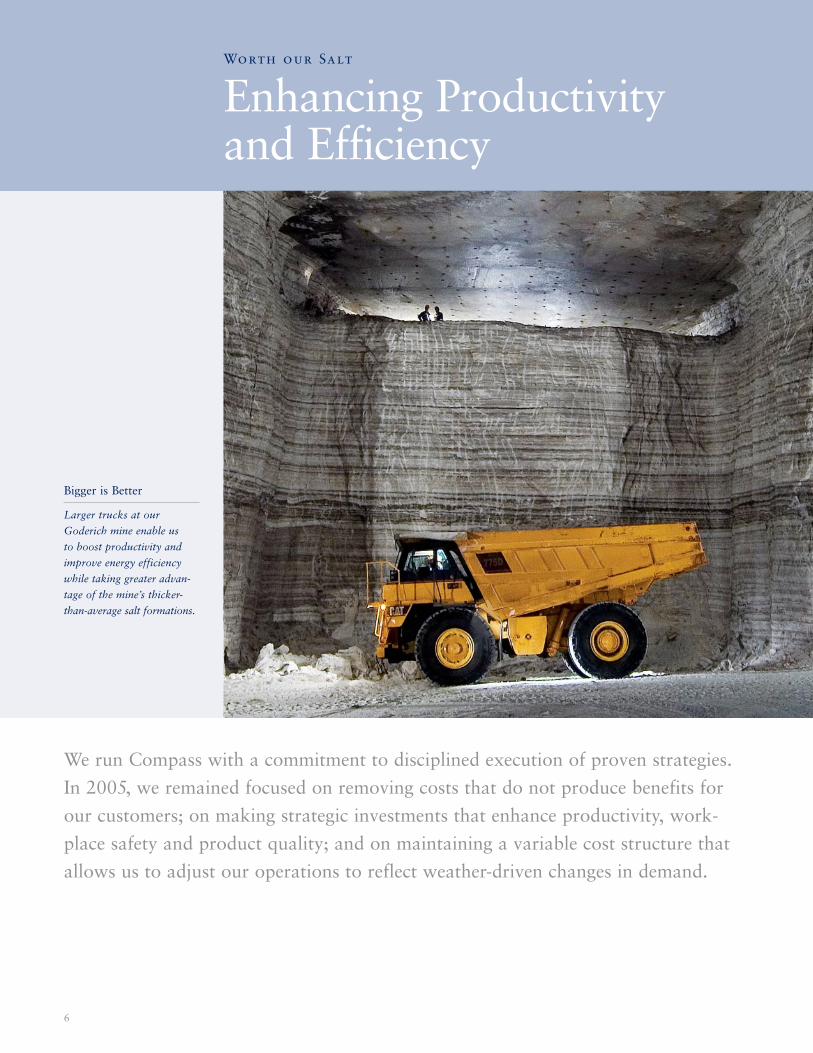
Worth our Salt
Enhancing Productivity and Efficiency
Bigger is Better
Larger trucks at our
Goderich mine enable us
to boost productivity and
improve energy efficiency
while taking greater advan-
tage of the mine’s thicker-
than-average salt formations.
We run Compass with a commitment to disciplined execution of proven strategies.
In 2005, we remained focused on removing costs that do not produce benefits for
our customers; on making strategic investments that enhance productivity, work-
place safety and product quality; and on maintaining a variable cost structure that
allows us to adjust our operations to reflect weather-driven changes in demand.
7
Harvesting Sulfate of Potash (SOP)
Solar evaporation
produces high-purity
SOP at our Great Salt
Lake facility.
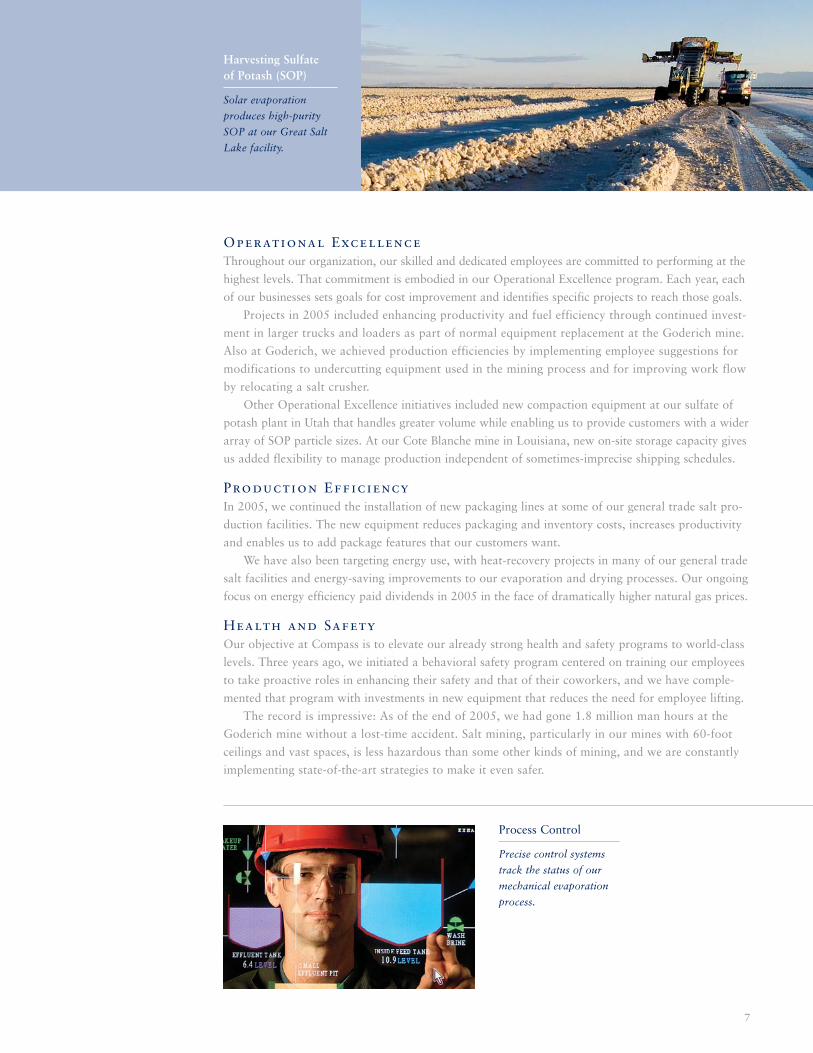
Process Control
Precise control systems
track the status of our
mechanical evaporation
process.
Operational Excellence Throughout our organization, our skilled and dedicated employees are committed to performing at the
highest levels. That commitment is embodied in our Operational Excellence program. Each year, each
of our businesses sets goals for cost improvement and identifies specific projects to reach those goals.
Projects in 2005 included enhancing productivity and fuel efficiency through continued invest-
ment in larger trucks and loaders as part of normal equipment replacement at the Goderich mine.
Also at Goderich, we achieved production efficiencies by implementing employee suggestions for
modifications to undercutting equipment used in the mining process and for improving work flow
by relocating a salt crusher.
Other Operational Excellence initiatives included new compaction equipment at our sulfate of
potash plant in Utah that handles greater volume while enabling us to provide customers with a wider
array of SOP particle sizes. At our Cote Blanche mine in Louisiana, new on-site storage capacity gives
us added flexibility to manage production independent of sometimes-imprecise shipping schedules.
Production EfficiencyIn 2005, we continued the installation of new packaging lines at some of our general trade salt pro-
duction facilities. The new equipment reduces packaging and inventory costs, increases productivity
and enables us to add package features that our customers want.
We have also been targeting energy use, with heat-recovery projects in many of our general trade
salt facilities and energy-saving improvements to our evaporation and drying processes. Our ongoing
focus on energy efficiency paid dividends in 2005 in the face of dramatically higher natural gas prices.
Health and SafetyOur objective at Compass is to elevate our already strong health and safety programs to world-class
levels. Three years ago, we initiated a behavioral safety program centered on training our employees
to take proactive roles in enhancing their safety and that of their coworkers, and we have comple-
mented that program with investments in new equipment that reduces the need for employee lifting.
The record is impressive: As of the end of 2005, we had gone 1.8 million man hours at the
Goderich mine without a lost-time accident. Salt mining, particularly in our mines with 60-foot
ceilings and vast spaces, is less hazardous than some other kinds of mining, and we are constantly
implementing state-of-the-art strategies to make it even safer.
8
Worth our Salt
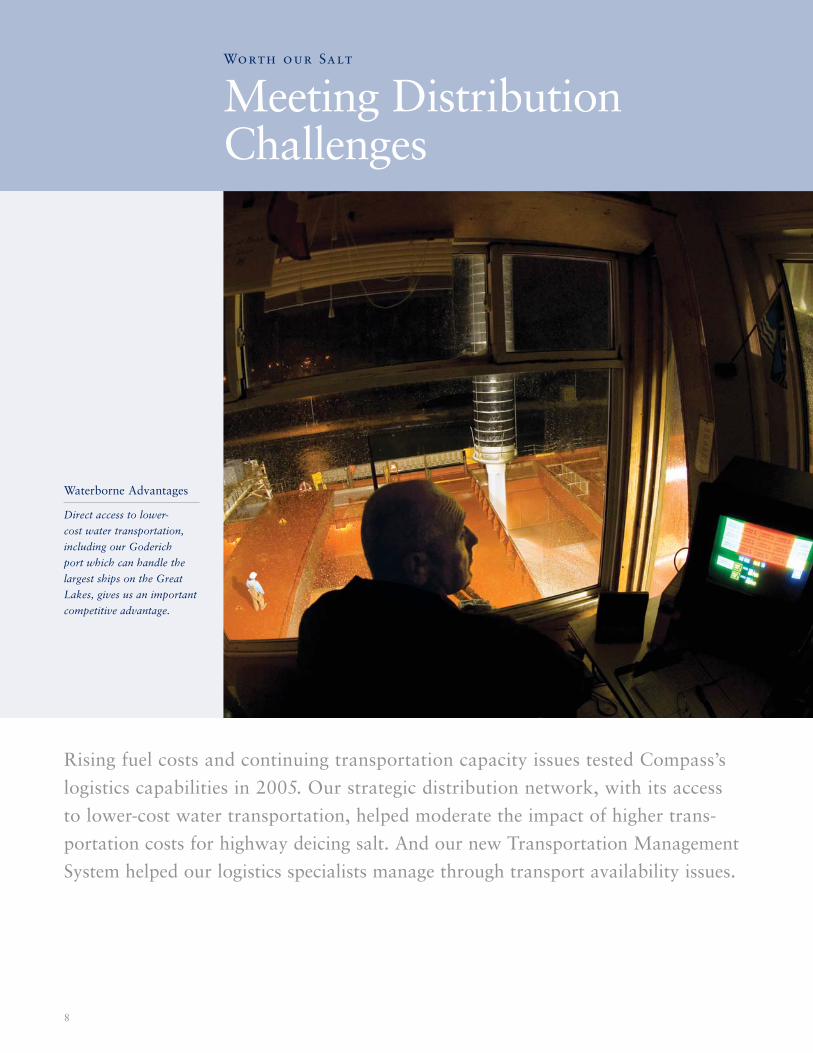
Meeting DistributionChallenges
Waterborne Advantages
Direct access to lower-
cost water transportation,
including our Goderich
port which can handle the
largest ships on the Great
Lakes, gives us an important
competitive advantage.
Rising fuel costs and continuing transportation capacity issues tested Compass’s
logistics capabilities in 2005. Our strategic distribution network, with its access
to lower-cost water transportation, helped moderate the impact of higher trans-
portation costs for highway deicing salt. And our new Transportation Management
System helped our logistics specialists manage through transport availability issues.
9
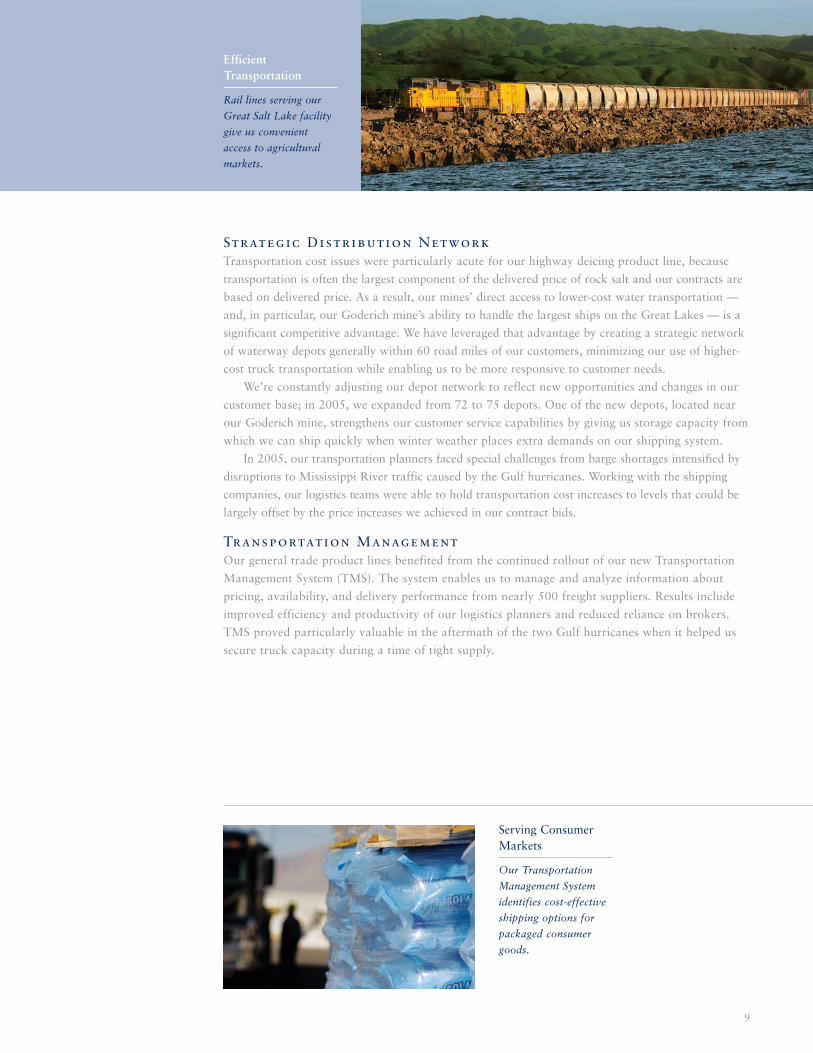
EfficientTransportation
Rail lines serving our
Great Salt Lake facility
give us convenient
access to agricultural
markets.
Serving ConsumerMarkets
Our Transportation
Management System
identifies cost-effective
shipping options for
packaged consumer
goods.
Strategic Distribution NetworkTransportation cost issues were particularly acute for our highway deicing product line, because
transportation is often the largest component of the delivered price of rock salt and our contracts are
based on delivered price. As a result, our mines’ direct access to lower-cost water transportation —
and, in particular, our Goderich mine’s ability to handle the largest ships on the Great Lakes — is a
significant competitive advantage. We have leveraged that advantage by creating a strategic network
of waterway depots generally within 60 road miles of our customers, minimizing our use of higher-
cost truck transportation while enabling us to be more responsive to customer needs.
We’re constantly adjusting our depot network to reflect new opportunities and changes in our
customer base; in 2005, we expanded from 72 to 75 depots. One of the new depots, located near
our Goderich mine, strengthens our customer service capabilities by giving us storage capacity from
which we can ship quickly when winter weather places extra demands on our shipping system.
In 2005, our transportation planners faced special challenges from barge shortages intensified by
disruptions to Mississippi River traffic caused by the Gulf hurricanes. Working with the shipping
companies, our logistics teams were able to hold transportation cost increases to levels that could be
largely offset by the price increases we achieved in our contract bids.
Transportation ManagementOur general trade product lines benefited from the continued rollout of our new Transportation
Management System (TMS). The system enables us to manage and analyze information about
pricing, availability, and delivery performance from nearly 500 freight suppliers. Results include
improved efficiency and productivity of our logistics planners and reduced reliance on brokers.
TMS proved particularly valuable in the aftermath of the two Gulf hurricanes when it helped us
secure truck capacity during a time of tight supply.
10
Worth our Salt
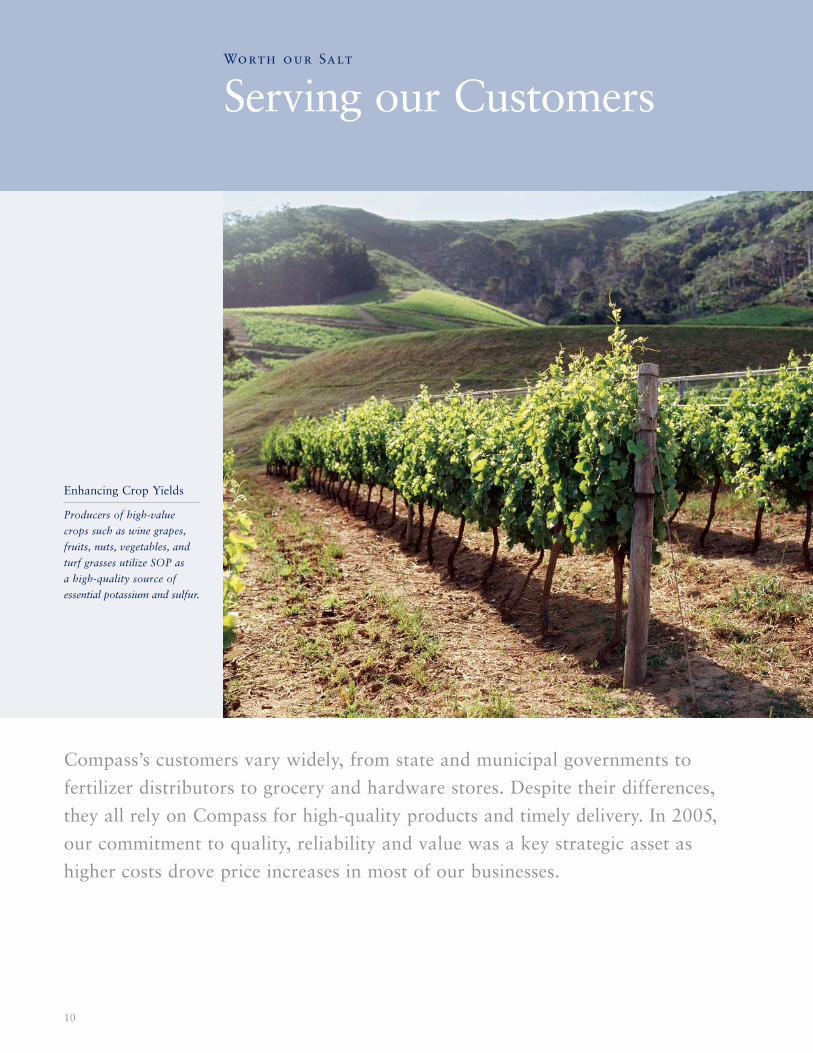
Serving our Customers
Enhancing Crop Yields
Producers of high-value
crops such as wine grapes,
fruits, nuts, vegetables, and
turf grasses utilize SOP as
a high-quality source of
essential potassium and sulfur.
Compass’s customers vary widely, from state and municipal governments to
fertilizer distributors to grocery and hardware stores. Despite their differences,
they all rely on Compass for high-quality products and timely delivery. In 2005,
our commitment to quality, reliability and value was a key strategic asset as
higher costs drove price increases in most of our businesses.
11
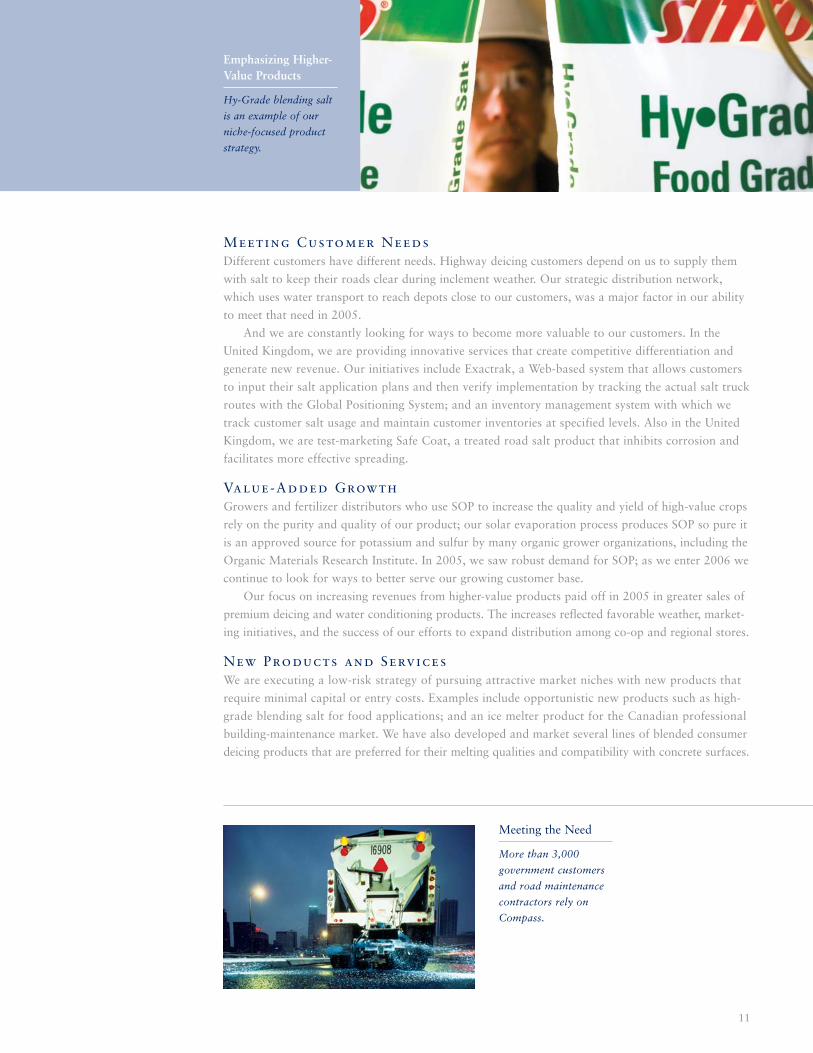
Emphasizing Higher-Value Products
Hy-Grade blending salt
is an example of our
niche-focused product
strategy.
Meeting the Need
More than 3,000
government customers
and road maintenance
contractors rely on
Compass.
Meeting Customer NeedsDifferent customers have different needs. Highway deicing customers depend on us to supply them
with salt to keep their roads clear during inclement weather. Our strategic distribution network,
which uses water transport to reach depots close to our customers, was a major factor in our ability
to meet that need in 2005.
And we are constantly looking for ways to become more valuable to our customers. In the
United Kingdom, we are providing innovative services that create competitive differentiation and
generate new revenue. Our initiatives include Exactrak, a Web-based system that allows customers
to input their salt application plans and then verify implementation by tracking the actual salt truck
routes with the Global Positioning System; and an inventory management system with which we
track customer salt usage and maintain customer inventories at specified levels. Also in the United
Kingdom, we are test-marketing Safe Coat, a treated road salt product that inhibits corrosion and
facilitates more effective spreading.
Value-Added GrowthGrowers and fertilizer distributors who use SOP to increase the quality and yield of high-value crops
rely on the purity and quality of our product; our solar evaporation process produces SOP so pure it
is an approved source for potassium and sulfur by many organic grower organizations, including the
Organic Materials Research Institute. In 2005, we saw robust demand for SOP; as we enter 2006 we
continue to look for ways to better serve our growing customer base.
Our focus on increasing revenues from higher-value products paid off in 2005 in greater sales of
premium deicing and water conditioning products. The increases reflected favorable weather, market-
ing initiatives, and the success of our efforts to expand distribution among co-op and regional stores.
New Products and ServicesWe are executing a low-risk strategy of pursuing attractive market niches with new products that
require minimal capital or entry costs. Examples include opportunistic new products such as high-
grade blending salt for food applications; and an ice melter product for the Canadian professional
building-maintenance market. We have also developed and market several lines of blended consumer
deicing products that are preferred for their melting qualities and compatibility with concrete surfaces.
12
Throughout our businesses, we make choices that embody our
commitment to steward shareholder capital. Our responsibility
to create value for shareholders guides our allocation of capital
to projects that strengthen and expand our business and shape
our operating, growth, and financial strategies.
Investing in Our FutureIn 2005, Compass invested in projects designed to increase the value of our business. One of
those investments is the construction of a new, high-capacity screening mill at our Goderich mine.
Scheduled for completion in the third quarter of 2006, the new underground mill can generate
savings through increased productivity and simplified maintenance. Investment in the new mill
will total approximately $7 million.
We are also making a significant investment in magnesium chloride production at the Great Salt
Lake. The project increases our production of both liquid and flake magnesium chloride and positions
us to expand our sales to the premium consumer deicing market. The project complements our
investment in new evaporation ponds for both magnesium chloride and SOP at the Great Salt Lake,
reflecting strong demand for both products.
Increasing Financial FlexibilityAlso in 2005, reflecting our continuing focus on strengthening our financial flexibility, we completed
a tender offer and refinancing that substantially replaced one of our high-interest bond issues with
debt which carries a lower interest rate and provides greater repayment flexibility.
Realizing Asset ValueSometimes, maximizing the value of our assets requires selling them. In December, we completed
the sale of our evaporated salt business in Weston Point, Cheshire, U.K. Because of changes in
the chemical industry, we recognized the business was a better strategic fit for the buyer, INEOS
Enterprises, than for us. The bulk of the $36.2 million in sale proceeds will be used for general
corporate purposes, such as debt reduction.
In the United Kingdom, our Minosus joint venture, which has created an underground
hazardous waste disposal facility in already mined sections of our salt mine, received its operating
license following an eight-year application process and has begun to accept waste. And DeepStore,
a Minosus initiative which offers secure storage of documents and other business records, continued
to experience strong demand.
Worth our Salt
Choices that Build Value
Reducing Production Costs
New solar evaporation
ponds at the Great Salt
Lake improve the yield
of SOP and magnesium
chloride.
Compass Minerals International
Form 10-K

C O M P A S S M I N E R A L S I N T E R N AT I O N A L , I N C . 2 0 0 5 F O R M 1 0 - K
FORM 10-KUnited States
Securities and Exchange CommissionWashington, D.C. 20549
(MARK ONE)¥ ANNUAL REPORT PURSUANT TO SECTION 13 OR 15(d) OF THE
SECURITIES EXCHANGE ACT OF 1934For the fiscal year ended December 31, 2005
OR
n TRANSITION REPORT PURSUANT TO SECTION 13 OR 15(d) OFTHE SECURITIES ACT OF 1934
For the transition period from to Commission File Number 1-31921
COMPASS MINERALS INTERNATIONAL, INC.(Exact name of Registrant as specified in its charter)
Delaware 36-3972986(State or other jurisdiction of incorporation or organization) (I.R.S. Employer Identification No.)
9900 West 109th Street, Suite 600 66210(Zip Code)Overland Park, Kansas
(Address of principal executive offices)
Registrant’s telephone number, including area code:
(913) 344-9200
Securities Registered Pursuant to Section 12(b) of the Act:
Title of each class Name of each exchange on which registered
Common stock, par value $0.01 per share New York Stock ExchangePreferred Stock Purchase Rights New York Stock Exchange
Securities Registered Pursuant to Section 12(g) of the Act: None
Indicate by check mark if the registrant is a well-known seasoned issuer, as defined in Rule 405 of the Securities Act.Yes n No ¥
Indicate by check mark if the registrant is not required to file reports pursuant to Section 13 or Section 15(d) of the Exchange Act.Yes n No ¥
Indicate by check mark whether the registrant (1) has filed all reports required to be filed by Section 13 or 15(d) of the SecuritiesExchange Act of 1934 during the preceding 12 months (or for such shorter period that the registrant was required to file suchreports), and (2) has been subject to such filing requirements for the past 90 days. Yes ¥ No n
Indicate by check mark if disclosure of delinquent filers pursuant to Item 405 of Regulation S-K is not contained herein, and willnot be contained, to the best of registrant’s knowledge, in definitive proxy or information statements incorporated by reference inPart III of this Form 10-K or any amendment to this Form 10-K. n
Indicate by check mark whether the registrant is a large accelerated filer, an accelerated filer, or a non-accelerated filer. Seedefinition of ‘‘accelerated filer and large accelerated filer’’ in Rule 12b-2 of the Exchange Act.
Large accelerated filer ¥ Accelerated filer n Non-accelerated filer n
Indicate by check mark whether the registrant is a shell company (as defined in Rule 12b-2 of the Exchange Act).Yes n No ¥
As of June 30, 2005, the aggregate market value of the registrant’s common stock held by non-affiliates of the registrant was$721,084,151, based on the closing sale price of $23.40 per share, as reported on the New York Stock Exchange.
The number of shares outstanding of the registrant’s $0.01 par value common stock at February 20, 2006 was 31,885,678 shares.
DOCUMENTS INCORPORATED BY REFERENCEDocument Parts into which Incorporated
Portions of the Proxy Statement for the Annual Meeting of Stockholders Part III, Items 10, 11, 12 and 13to be held May 11, 2006 (Proxy Statement)
C O M P A S S M I N E R A L S I N T E R N AT I O N A L , I N C . 2 0 0 5 F O R M 1 0 - K
TABLE OF CONTENTS
PART I Page No.
Item 1. Business 4Item 1A. Risk Factors 12Item 1B. Unresolved Staff Comments 18Item 2. Properties 18Item 3. Legal Proceedings 18Item 4. Submission of Matters to a Vote of Security Holders 19
PART II
Item 5. Market for the Registrant’s Common Equity, Related Stockholder Matters and Issuer Purchases of EquitySecurities 20
Item 6. Selected Financial Data 21Item 7. Management’s Discussion and Analysis of Financial Condition and Results of Operations 22Item 7A. Quantitative and Qualitative Disclosures About Market Risk 31Item 8. Financial Statements and Supplementary Data 32Item 9. Changes in and Disagreements with Accountants on Accounting and Financial Disclosures 54Item 9A. Controls and Procedures 55Item 9B. Other Information 56
PART III
Item 10. Directors and Executive Officers of the Registrant 57Item 11. Executive Compensation 57Item 12. Security Ownership and Certain Beneficial Owners and Management and Related Stockholder Matters 57Item 13. Certain Relationships and Related Transactions 57Item 14. Principal Accountant Fees and Services 57
PART IV
Item 15. Exhibits, Financial Statement Schedules and Reports on Form 8-K 58
SIGNATURES 61
2
C O M P A S S M I N E R A L S I N T E R N AT I O N A L , I N C . 2 0 0 5 F O R M 1 0 - K
PART I
CAUTIONARY NOTE REGARDING FORWARD-LOOKING STATEMENTS are generally based on historical sales volumes. Except whereotherwise noted, all references to tons refer to ‘‘short tons.’’
This annual report on Form 10-K (the ‘‘report’’) containsOne short ton equals 2,000 pounds.
forward-looking statements. These statements relate to futureevents or our future financial performance, and involve known WHERE YOU CAN FIND MORE INFORMATIONand unknown risks, uncertainties and other factors that may
We file annual, quarterly and current reports and othercause our actual results, levels of activity, performance or
information with the Securities and Exchange Commissionachievements to be materially different from any future
(‘‘SEC’’). Our SEC filings are available to the public over theresults, levels of activity, performance or achievements,
Internet at the SEC’s website at http://www.sec.gov. Pleaseexpressed or implied, by these forward-looking statements.
note that the SEC’s website is included in this report as anThese risks and other factors include, among other things,
active textual reference only. The information contained onthose listed under Item 1A, ‘‘Risk Factors’’ and elsewhere in
the SEC’s website is not incorporated by reference into thisthis report. In some cases, you can identify forward-looking
report and should not be considered a part of this report. Youstatements by terminology such as ‘‘may,’’ ‘‘will,’’ ‘‘should,’’
may also read and copy any document we file with the SEC at‘‘expects,’’ ‘‘intends,’’ ‘‘plans,’’ ‘‘anticipates,’’ ‘‘believes,’’ ‘‘esti-
the SEC’s public reference facility at 100 F Street, N.E.,mates,’’ ‘‘predicts,’’ ‘‘potential,’’ ‘‘continue’’ or the negative of
Washington, D.C. You may also obtain copies of the docu-these terms or other comparable terminology. These state-
ments at prescribed rates by writing to the Public Referencements are only predictions. Actual events or results may
Section of the SEC at 100 F Street, N.E., Washington, D.C.differ materially. In evaluating these statements, you should
20459. For further information on the operation of the publicspecifically consider various factors, including the risks out-
reference facility call the SEC at 1-900-SEC-0330.lined under Item 1A, ‘‘Risk Factors.’’ These factors may cause
You may request a copy of any of our filings, at no cost, byour actual results to differ materially from any forward-
writing or telephoning:looking statement.
Although we believe that the expectations reflected in the Investor Relationsforward-looking statements are reasonable, we cannot guaran- Compass Minerals International, Inc.tee future results, levels of activity, performance or achieve- 9900 West 109th Street, Suite 600ments. We are under no duty to update any of the forward- Overland Park, Kansas 66210looking statements after the date of this report.
For general inquiries concerning the Company please callMARKET AND INDUSTRY DATA AND FORECASTS (913) 344-9200.
This report includes market share and industry data and Alternatively, copies of these documents may be availableforecasts that we obtained from internal company surveys, on our website, www.compassminerals.com. The informationmarket research, consultant surveys, publicly available infor- on our website is not part of this report and is notmation and industry publications and surveys. Industry incorporated by reference into this report.surveys, publications, consultant surveys and forecasts gener-
Unless the context requires otherwise, references in thisally state that the information contained therein has been
annual report to the ‘‘Company,’’ ‘‘Compass,’’ ‘‘Compassobtained from sources believed to be reliable, but there can
Minerals,’’ ‘‘CMI,’’ ‘‘we,’’ ‘‘us’’ and ‘‘our’’ refer to Compassbe no assurance as to the accuracy and completeness of such
Minerals International, Inc. and its consolidated subsidi-information. We have not independently verified any of the
aries. Compass Minerals International, Inc. is compriseddata from third-party sources nor have we ascertained the
of its wholly-owned subsidiary, Compass Minerals Group,underlying economic assumptions relied upon therein. Simi-
Inc. and Compass Minerals Group, Inc.’s subsidiarieslarly, internal company surveys, industry forecasts and market
(‘‘Compass Minerals Group’’ or ‘‘CMG’’).research, which we believe to be reliable, based uponmanagement’s knowledge of the industry, have not beenverified by any independent sources. Except where otherwisenoted, references to North America include only the continen-tal United States and Canada, and statements as to ourposition relative to our competitors or as to market sharerefer to the most recent available data. Statements concerning(a) North America general trade salt are generally based onhistorical sales volumes, (b) North America highway deicingsalt are generally based on historical production capacity,(c) sulfate of potash are generally based on historical salesvolumes and (d) United Kingdom highway deicing salt sales
3

C O M P A S S M I N E R A L S I N T E R N AT I O N A L , I N C . 2 0 0 5 F O R M 1 0 - K
ITEM 1. BUSINESS high grade and among the most extensive in the world, andbecause we use effective mining techniques and efficient
COMPANY OVERVIEW production processes.Through our salt segment we mine, produce, process and
Based in the Kansas City metropolitan area, Compass is thedistribute salt in North America and the United Kingdom,
second-leading salt producer in North America and the largestincluding rock, evaporated and solar salt. Our products are
in the United Kingdom. We currently operate 10 productionmarketed primarily in the United States, Canada and the
and packaging facilities, including the largest rock salt mine inUnited Kingdom. Salt is used in a wide variety of applications,
the world in Goderich, Ontario and the largest salt mine inincluding as a deicer for both highway and consumer use
the United Kingdom in Winsford, Cheshire. Our product lines(rock salt), an ingredient in the production of chemicals for
include salt for highway deicing, consumer deicing, waterpaper bleaching, for water treatment and a variety of other
conditioning, consumer and industrial food preparation, agri-industrial uses, as a flavor enhancer and preservative in food,
culture and industrial applications. In addition, Compass isa nutrient and trace mineral delivery vehicle in animal feeds
North America’s leading producer of sulfate of potashand an essential component in both industrial and residential
(‘‘SOP’’), which is used in the production of specialtywater softeners. The demand for salt has historically remained
fertilizers for high-value crops and turf. Our North Americanrelatively stable during economic cycles due to its relatively
salt mines and SOP production facility are near either waterlow cost and high value with a diverse number of end uses.
or rail transport systems, which reduces our shipping andHowever, demand in the highway deicing market is
handling costs.affected by changes in winter weather conditions. On average,
Previously part of Mosaic Global Holdings Inc. (‘‘Mosaic’’),over the last five years, approximately 64% of our highway
formerly IMC Global, Inc., the Company became a stand-alonedeicing annual sales, net of shipping and handling costs, are
entity on November 28, 2001 through a leveraged recapitaliza-generated from December through March when the need for
tion (the ‘‘Recapitalization’’). Following the Recapitalization,highway deicing salt is at its peak.
Apollo Management V, L.P. (‘‘Apollo’’), co-investors andmanagement owned approximately 81% of our fully diluted Salt Industry Overviewoutstanding common stock and Mosaic owned The salt industry is characterized by stable demand andapproximately 19%. steady price increases across various grades. Salt is one of the
On December 17, 2003, Compass completed its initial most common and widely consumed minerals in the worldpublic offering (‘‘IPO’’) of 16,675,000 shares of our common due to its low relative cost and its utility in a variety ofstock, par value $0.01 per share, at $13.00 per share. The applications, including highway deicing, food processing,shares sold in the IPO were shares previously owned by water conditioning, industrial chemical processing, and nutri-stockholders, primarily Apollo and Mosaic, so the Company tional supplements for animal stock. We estimate that thedid not receive any of the IPO proceeds. Following the consumption of highway deicing salt in North America isoffering, Apollo and co-investors, management and directors, 25 million tons per year (20 million tons per year in theand Mosaic owned approximately 35%, 11% and 2%, respec- markets we serve), while the general trade market totalstively, of the fully diluted shares outstanding. 11 million tons per year. In the United Kingdom, we estimate
In July 2004, we completed a secondary offering of that the size of the highway deicing market is 1.9 million tons8,327,244 shares of common stock which were sold by Apollo, per year. According to the latest available U.S. GeologicalMosaic and certain members of management. Following the Survey (‘‘USGS’’), during the thirty-year period ending 2004,offering, Apollo and co-investors, management and directors, the production of salt used in highway deicing and for generaland Mosaic owned approximately 12%, 11% and 1%, respec- trade products in the United States has increased at antively, of the fully diluted shares outstanding. Compass did historical average of approximately 1% per year.not receive any proceeds from the sale of the shares. Salt prices vary according to purity from the lowest grade
Apollo, Mosaic and certain members of management sold (rock salt) at around $20 per ton to the highest-grade salt4,021,473 shares of common stock through another secondary (food grade salt) at about $400 per ton. The price differenceoffering which was completed in November 2004. Again, between rock and food grade salt reflects, among otherCompass did not receive any proceeds from the sale. Apollo things, the more elaborate refining and packaging processesand Mosaic each sold all of their remaining shares, reducing for higher-grade salt. Due to salt’s relatively low productiontheir ownership of our common stock to zero. cost, transportation and handling costs tend to be a significant
component of the total delivered cost making logisticsSALT SEGMENTmanagement and customer service key competitive factors in
Salt is indispensable and enormously versatile with more than the industry. The high relative cost associated with transpor-14,000 uses. In addition, there is an absence of cost-effective tation tends to favor the supply of salt by manufacturersalternatives. As a result, our cash flows are not materially located in close proximity to their customers. According toimpacted by economic cycles. We are among the lowest-cost the latest USGS data, during the thirty year period endingsalt producers in our markets because our salt deposits are
4
C O M P A S S M I N E R A L S I N T E R N AT I O N A L , I N C . 2 0 0 5 F O R M 1 0 - K
2004, prices for salt used in highway deicing and general Mississippi and Ohio Rivers, and agriculture customers in thetrade products in the United States have increased at a Southern and Midwestern United States. Our solar evapora-historical average of approximately 4% per year. tion facility located in Ogden, Utah is the largest solar salt
production site in the United States. This facility principallyProcessing Methods serves the Western United States general trade markets andWe have production capacity, including salt purchased under also provides salt for chemical applications and highwaylong-term contracts, of approximately 13.7 million tons of salt deicing, and provides magnesium chloride which is used inper year. Mining, other production activities and packaging deicing, dust control and soil stabilization applications. Pro-are currently conducted at 10 of our facilities and at two duction capacity of salt at our Ogden facility is currently onlyfacilities where finished product is purchased from Mosaic limited by demand. We also own and operate two saltunder contracts. packaging facilities in Illinois and Wisconsin, which serve
The three processing methods we use to produce salt are consumer deicing and water conditioning customers in thesummarized below. Central, Midwestern and parts of the Northeastern
United States.Underground Rock Salt Mining – We use a drill and blastmining technique at our underground rock salt mines. Mining Canada – Our salt is produced at five different locations inmachinery moves salt from the salt face to conveyor belts Canada. Mechanically evaporated salt is produced at threewhich transport the salt to the mill center where it is crushed facilities strategically located throughout Canada: Amherst,and screened. Salt is then hoisted to the surface where it is Nova Scotia in Eastern Canada; Goderich, Ontario in Centralloaded onto shipping vessels, railcars or trucks. At our Canada; and Unity, Saskatchewan in Western Canada. FromWinsford, U.K. facility, we also use a continuous miner the Goderich, Ontario rock salt mine, we serve the consumerprocess. The primary power sources for each of our rock salt and highway deicing markets in Canada and the Great Lakesmines are electricity and diesel fuel. Rock salt is primarily region of the United States. We also purchase salt and otherused in our highway and consumer deicing products. Under- products from Mosaic’s potash and salt facilities located inground rock salt mining represents approximately 82% of our Saskatchewan, which serve both the general trade and theannual salt production capacity. highway deicing markets.
Mechanical Evaporation – The mechanical evaporation United Kingdom – Our United Kingdom highway deicing cus-method involves subjecting salt-saturated brine to vacuum tomer base is served by the Winsford rock salt mine inpressure and heat, generated by natural gas or oil, to Northwest England. Through December 2005 we served generalprecipitate salt. The salt brine is obtained from underground trade customers through our mechanical evaporation plant insalt deposits through a series of brine wells. The resulting Cheshire, England. On December 30, 2005, we sold this business.product has both a high purity and uniform physical shape. This plant had an annual production capacity of 850,000 tonsEvaporated salt is primarily used in our general trade salt although it operated at approximately 70% of capacity.product lines. Mechanical evaporation represents approxi- The table below shows the capacity and type of saltmately 7% of our annual salt production capacity. produced at each of our owned or leased production locations:
Solar Evaporation – The solar evaporation method is used in Annual ProductionLocation Capacity (tons) Product Typeareas of the world where high-salinity brine is available and
where weather conditions provide for a high natural-evapora- North AmericaGoderich, Ontario Mine 6,500,000 Rocktion rate. The brine is pumped into a series of large openCote Blanche, Louisiana Mine 2,800,000 Rockponds where sun and wind evaporate the water and crystal-Ogden, Utah Plant 1,500,000 Solar
lize the salt, which is then mechanically harvested and Lyons, Kansas Plant 450,000 Evaporatedprocessed through washing, drying and screening. Solar salt is Unity, Saskatchewan Plant 175,000 Evaporatedused in both our general trade salt product lines and in Goderich, Ontario Plant 175,000 Evaporated
Amherst, Nova Scotia Plant 120,000 Evaporatedhighway deicing applications. Solar evaporation representsUnited Kingdomapproximately 11% of our annual salt production capacity.
Winsford, Cheshire Mine 2,000,000 Rock
Operations and Facilities Salt production at these facilities totaled an aggregate ofUnited States – Our Central and Midwestern United States 12.5 million tons, 12.2 million tons and 11.4 million tons for thegeneral trade customer base is served by our mechanical years ended December 31, 2005, 2004 and 2003, respectively.evaporation plant in Lyons, Kansas. Additionally, we serve Salt is found throughout the world and, where it isareas around the Great Lakes with evaporated salt purchased commercially produced, it is typically deposited in extremelyfrom Mosaic’s potash and salt facility in Michigan. The Cote large quantities. Our mines at Goderich, Cote Blanche andBlanche, Louisiana rock salt mine serves chemical customers Winsford, as well as at our other operating facilities, arein the Southern and Western United States, highway deicing proximate to vast mineral deposits. In most of our productioncustomers through a series of depots located along the locations, we estimate the recoverable salt to exceed
5
C O M P A S S M I N E R A L S I N T E R N AT I O N A L , I N C . 2 0 0 5 F O R M 1 0 - K
100 years of reserves at current production rates and We package salt product produced by us or others at twocapacities. Our rights to extract those minerals may currently additional facilities. The table below shows the packagingbe contractually limited by either geographic boundaries or capacity at each of these facilities:time. We believe that we will be able to continue to extend
Annual Packagingthese agreements, as we have in the past, at commercially Location Capacity (tons)reasonable terms, without incurring substantial costs or Kenosha, Wisconsin 125,000incurring material modifications to the existing lease terms Chicago, Illinois 100,000and conditions, thereby allowing us to extract the additional
We also have a long-term contract to purchase finished saltsalt necessary to fully develop our existing mineral rights.from Mosaic, which is produced as a co-product of their potashOur underground mines in Canada (Goderich, Ontario), theoperations. The table below shows the amount and type of saltUnited States (Cote Blanche, Louisiana) and the United King-purchased from each of these production facilities:dom (Winsford, Cheshire) make up over 80% of our salt
producing capacity. Each of these mines are operated withAnnual Purchasing
modern mining equipment and utilize subsurface improvements Location Capacity (tons) Product Type
such as vertical shaft lift systems, milling and crushing Esterhazy, Saskatchewan 200,000 Rockfacilities, maintenance and repair shops and extensive conveyor Hersey, Michigan 250,000 Evaporatedsystems. We believe that the properties and their operating
We divide our salt products into two separate productequipment are maintained in good working condition.lines: highway deicing salt (including chemical salt) andThe mine site at the Goderich mine is owned. We alsogeneral trade salt.maintain a mineral lease at Goderich with the provincial
government which grants us the right to mine salt. This lease Highway Deicing Salt Productsexpires in 2022 with the option to renew until 2043. Cote
Products and Sales – Highway deicing constituted approxi-Blanche is operated under land and mineral leases with a mately 54% of our gross sales of salt in 2005. Principalthird-party landowner who grants us the right to mine salt. customers are states, provinces, counties, municipalities andThe leases expire in 2060. The mine site and salt reserves at road maintenance contractors that purchase bulk salt for icethe Winsford mine are owned. control on public roadways. Highway deicing salt is sold
Our mines at Goderich, Cote Blanche and Winsford have primarily through an annual tendered bid contract system asbeen in operation for approximately 46, 40 and 160 years, well as through some longer-term contracts, with price,respectively. At current average rates of production, we product quality and delivery being the primary competitiveestimate that our remaining years of production for the market factors. Annual supply contracts generally arerecoverable minerals we presently own or lease to be 152, 81 awarded on the basis of tendered bids once the purchaser isand 30 years, respectively. Our mineral interests are amor- assured that the minimum requirements for purity, servicetized on an individual basis over estimated useful lives not to and delivery can be met. The locations of the salt sources andexceed 99 years using primarily the units-of-production distribution outlets also play a significant role in determiningmethod. Our estimates are based on, among other things, a supplier. We have an extensive network of over 70 depotsboth internal estimates and the results of reserve studies for storage and distribution of highway deicing salt in Northcompleted by a third-party engineering firm. The reserve America. The majority of these depots are located on theestimates are primarily a function of the area and volume Great Lakes and the Mississippi and Ohio River systemscovered by the mining rights and estimates of extraction rates where our Goderich, Ontario and Cote Blanche, Louisianautilized by us with the reasonable expectation of reliably mines are located to serve those markets. Salt and liquidoperating the mines on a long-term basis. Established criteria magnesium chloride from our Ogden, Utah facility is alsofor proven and probable reserves are primarily applicable to partially used for highway deicing.mining deposits of discontinuous metal, where both presence We produce highway deicing salt in the United Kingdom atof ore and its variable grade need to be precisely identified. our mining facility at Winsford, Cheshire, the largest rock saltHowever, the massive continuous nature of evaporative mine in the United Kingdom. We believe our superiordeposits, such as salts, require proportionately less data for production capability and favorable logistics enhance ourthe same degree of confidence in mineral reserves, both in ability to meet peak winter demands. Because of our strongterms of quantity and quality. Reserve studies performed by a position, we are recognized as a key strategic provider by thethird-party engineering firm suggest that our salt reserves United Kingdom’s Highway Agency. As such, in conjunctionmost closely resemble probable reserves and we have there- with the Highway Agency, we develop standards for deicingfore classified our reserves as probable reserves. inventory products and services that are provided to them
through their deicing application contractors. In the UnitedKingdom approximately 62% of our highway deicing businessis on multi-year contracts.
6
C O M P A S S M I N E R A L S I N T E R N AT I O N A L , I N C . 2 0 0 5 F O R M 1 0 - K
Winter weather variability is the most significant factor General Trade Salt Productsaffecting salt sales for deicing applications because mild Products and Sales – The general trade business accountedwinters reduce the need for salt used in ice and snow control. for approximately 40% of our 2005 gross sales of salt. We areOn average, over the last five years, our North American the third largest producer of general trade salt in Northhighway deicing product line has generated approximately America. This product line includes commercial and consumer64% of its annual sales, net of shipping and handling costs, applications, such as table salt, water conditioning, consumerfrom December through March when the need for highway ice control, food processing, agricultural applications, as welldeicing is at its peak. Lower than expected sales during this as a variety of industrial applications. We believe that we areperiod could have a material adverse effect on our results of the largest private-label producer of water conditioning andoperations. The vast majority of our North American deicing salt-based agricultural products in North America and sellsales are made in Canada and the Midwestern United States more than 60 private labels of table salt to major retailers.where frequent inclement weather during the winter months Our Sifto˛ brand is well recognized in the Canadian market.causes dangerous road conditions. In keeping with industry On December 30, 2005, we sold our Weston Point, Englandpractice, we stockpile quantities of salt to meet estimated evaporated-salt plant and related general trade business torequirements for the next winter season. See Item 1A, ‘‘Risk INEOS Enterprises Limited, a brine supplier to and largestFactors — The seasonal demand for our products and the customer of that plant. Gross sales from this business totaledvariations in our cash flows from quarter to quarter as a result $52.5 million, $55.2 million and $47.1 million in 2005, 2004of weather conditions may have an adverse effect on our and 2003, respectively.results of operations and the price of our common stock’’ and We have maintained a significant presence in the generalItem 7, ‘‘Management’s Discussion and Analysis of Financial trade business over recent years due to our strong focus on:Condition and Results of Operations — Seasonality.’’ (i) the Midwestern region of the United States; (ii) all of
Chemical customers accounted for approximately 6% of Canada; (iii) our distribution network to the grocery trade;our 2005 gross sales of salt. Principal customers are produc- and (iv) our relationships with large distributors of waterers of intermediate chemical products used in pulp bleaching, conditioning salt.water treatment and a variety of other industrial uses. Our The general trade market is driven by strong customercustomers do not have a captive source of brine. Distribution relationships. Sales in the general trade salt product line occurinto the chemical market is made primarily through multi-year through retail channels, such as grocery stores, building supply,supply agreements, which are negotiated privately. Price, hardware, mass merchants and feed suppliers. Distribution inservice, product quality and security of supply are the major the general trade salt product line is channeled through acompetitive market factors. direct sales force located in various parts of our service
The table below shows our shipments of highway deicing territories who sell products to distributors, dealers and endand chemical salt products to the following regions users. We also maintain a network of brokers who sell table(thousands of tons): salt, consumer deicing and water conditioning products. These
brokers service wholesalers, grocery chains and retailers, asYear ended December 31,
well as the food-service industry. During 2005, 2004 and 20032005 2004 2003
we shipped 2,529,000, 2,404,000 and 2,323,000 tons, respec-Tons % Tons % Tons %
tively of general trade salt in North America.North America 10,234 89 9,153 88 8,827 91Europe 1,303 11 1,180 12 836 9 Competition – In North America, other large nationally recog-
nized companies compete against our salt business in theTotal 11,537 100 10,333 100 9,663 100production and marketing of general trade salt products. Inaddition, there are several smaller regional producers of generalCompetition – We face strong competition in each of thetrade salt. There are several importers of salt into Northmarkets in which we operate. In North America, other large,America but they mostly impact the East Coast and West Coastnationally recognized companies compete against our highwayof the United States where we have minimal positions.deicing and chemical salt products. In addition, there are several
smaller regional producers of highway deicing salt. There are SPECIALTY POTASH SEGMENTseveral importers of salt into North America but these mostly
SOP is primarily used as a specialty fertilizer, providingimpact the Eastern seaboard where we have a minimal position.essential potassium to high-value, chloride-sensitive crops,In the United Kingdom, there are two other companies thatsuch as vegetables, fruits, tea, potatoes, grapes, nuts, tobaccoproduce highway deicing salt, one in Northern England and theand turf grass. We are the market leader in North America forother in Northern Ireland. There are no significant imports ofSOP and market SOP products both domestically and over-highway deicing salt into the United Kingdom.seas. We offer several grades of SOP, which are designed tobetter serve the special needs of our customers. Our sulfateof potash plant is the largest in North America and one of
7
C O M P A S S M I N E R A L S I N T E R N AT I O N A L , I N C . 2 0 0 5 F O R M 1 0 - K
only two all-natural solar SOP plants in the Western Hemi- terms and conditions, thereby allowing us to continuesphere. In 2005, the specialty potash segment accounted for extracting minerals and significantly extend the future recog-approximately 14% of our gross sales. nized economic life of the reserves.
The potassium bearing salts are mechanically harvestedPotash Industry Overview – The annual worldwide consump-
and refined to high purity SOP in our production facility thattion of all potash fertilizers approaches 50 million tons.
has been in operation since 1967. We believe that ourMuriate of potash, or potassium chloride, is the most common
property and operating equipment are maintained in goodsource of potassium and accounts for approximately 90% of
working condition.all potash consumed in fertilizer production. SOP representsapproximately 7% of potash consumption. The remainder is Products and Sales – Our domestic sales of SOP are concen-supplied in the forms of potassium magnesium sulfate, nitrate trated in the western and southeastern portions of the Unitedof potassium and, to a lesser extent, potassium thiosulfate States where the crops and soil conditions favor SOP. Weand monopotassium phosphate. All of these products contain generally export SOP through major trading companies.varying concentrations of potassium expressed as potassium International SOP sales volumes in 2005 were 27% of ouroxide (K2O) and different combinations of co-nutrients. annual SOP sales. Beginning in late 2001, we organized and
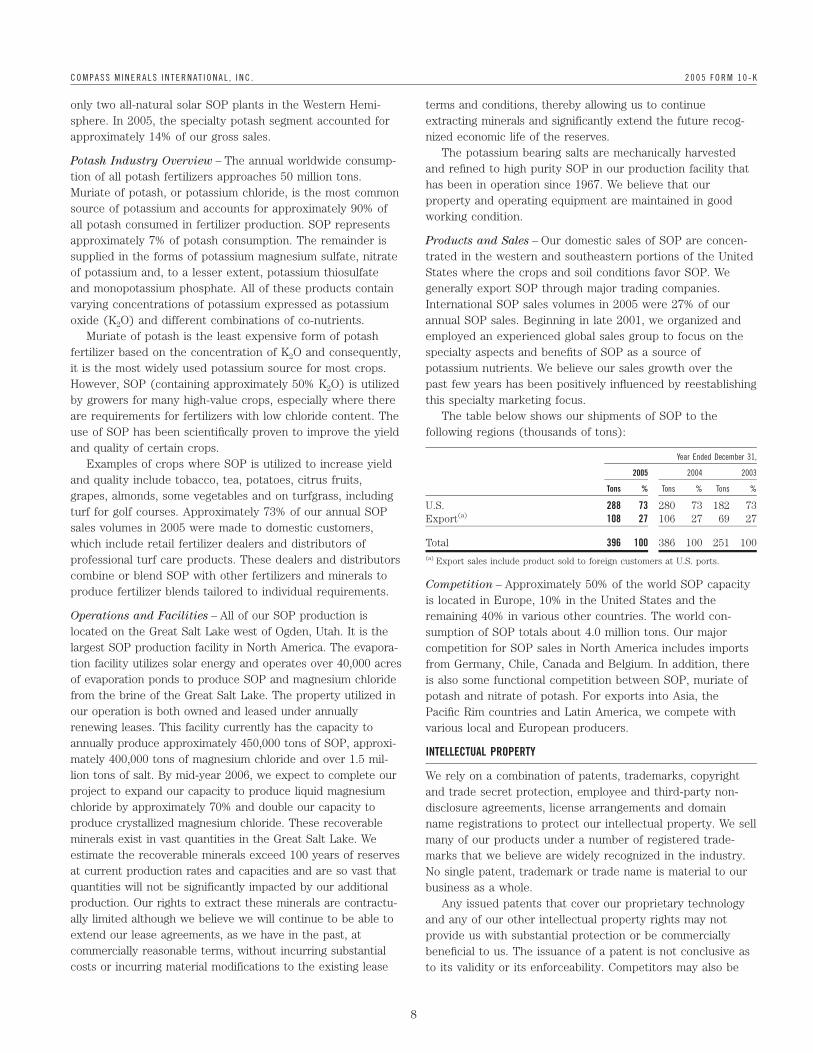
Muriate of potash is the least expensive form of potash employed an experienced global sales group to focus on thefertilizer based on the concentration of K2O and consequently, specialty aspects and benefits of SOP as a source ofit is the most widely used potassium source for most crops. potassium nutrients. We believe our sales growth over theHowever, SOP (containing approximately 50% K2O) is utilized past few years has been positively influenced by reestablishingby growers for many high-value crops, especially where there this specialty marketing focus.are requirements for fertilizers with low chloride content. The The table below shows our shipments of SOP to theuse of SOP has been scientifically proven to improve the yield following regions (thousands of tons):and quality of certain crops.
Year Ended December 31,Examples of crops where SOP is utilized to increase yield
2005 2004 2003and quality include tobacco, tea, potatoes, citrus fruits,
Tons % Tons % Tons %grapes, almonds, some vegetables and on turfgrass, including
U.S. 288 73 280 73 182 73turf for golf courses. Approximately 73% of our annual SOPExport(a) 108 27 106 27 69 27
sales volumes in 2005 were made to domestic customers,Total 396 100 386 100 251 100which include retail fertilizer dealers and distributors of
professional turf care products. These dealers and distributors (a) Export sales include product sold to foreign customers at U.S. ports.
combine or blend SOP with other fertilizers and minerals toCompetition – Approximately 50% of the world SOP capacity
produce fertilizer blends tailored to individual requirements.is located in Europe, 10% in the United States and the
Operations and Facilities – All of our SOP production is remaining 40% in various other countries. The world con-located on the Great Salt Lake west of Ogden, Utah. It is the sumption of SOP totals about 4.0 million tons. Our majorlargest SOP production facility in North America. The evapora- competition for SOP sales in North America includes importstion facility utilizes solar energy and operates over 40,000 acres from Germany, Chile, Canada and Belgium. In addition, thereof evaporation ponds to produce SOP and magnesium chloride is also some functional competition between SOP, muriate offrom the brine of the Great Salt Lake. The property utilized in potash and nitrate of potash. For exports into Asia, theour operation is both owned and leased under annually Pacific Rim countries and Latin America, we compete withrenewing leases. This facility currently has the capacity to various local and European producers.annually produce approximately 450,000 tons of SOP, approxi-
INTELLECTUAL PROPERTYmately 400,000 tons of magnesium chloride and over 1.5 mil-lion tons of salt. By mid-year 2006, we expect to complete our We rely on a combination of patents, trademarks, copyrightproject to expand our capacity to produce liquid magnesium and trade secret protection, employee and third-party non-chloride by approximately 70% and double our capacity to disclosure agreements, license arrangements and domainproduce crystallized magnesium chloride. These recoverable name registrations to protect our intellectual property. We sellminerals exist in vast quantities in the Great Salt Lake. We many of our products under a number of registered trade-estimate the recoverable minerals exceed 100 years of reserves marks that we believe are widely recognized in the industry.at current production rates and capacities and are so vast that No single patent, trademark or trade name is material to ourquantities will not be significantly impacted by our additional business as a whole.production. Our rights to extract these minerals are contractu- Any issued patents that cover our proprietary technologyally limited although we believe we will continue to be able to and any of our other intellectual property rights may notextend our lease agreements, as we have in the past, at provide us with substantial protection or be commerciallycommercially reasonable terms, without incurring substantial beneficial to us. The issuance of a patent is not conclusive ascosts or incurring material modifications to the existing lease to its validity or its enforceability. Competitors may also be
8
C O M P A S S M I N E R A L S I N T E R N AT I O N A L , I N C . 2 0 0 5 F O R M 1 0 - K
able to design around our patents. If we are unable to protect EMPLOYEESour patented technologies, our competitors could commercial-
As of December 31, 2005, we had 1,506 employees, of whichize our technologies.
746 are employed in the United States, 673 in Canada andWith respect to proprietary know-how, we rely on trade
87 in the United Kingdom. Approximately 35% of oursecret protection and confidentiality agreements. Monitoring the
U.S. workforce and 55% of our global workforce is repre-unauthorized use of our technology is difficult and the steps we
sented by labor unions. Of our nine material collectivehave taken may not prevent unauthorized use of our technology.
bargaining agreements, four will expire in 2006, three willThe disclosure or misappropriation of our intellectual property
expire in 2007 and two will expire in 2008. Additionally,could harm our ability to protect our rights and our competitive
approximately 6% of our workforce is employed in Europeposition. See Item 1A, ‘‘Risk Factors — Protection of proprietary
where trade union membership is common. We consider ourtechnology — Our intellectual property may be misappropriated
labor relations to be good.or subject to claims of infringement.’’
PROPERTIES
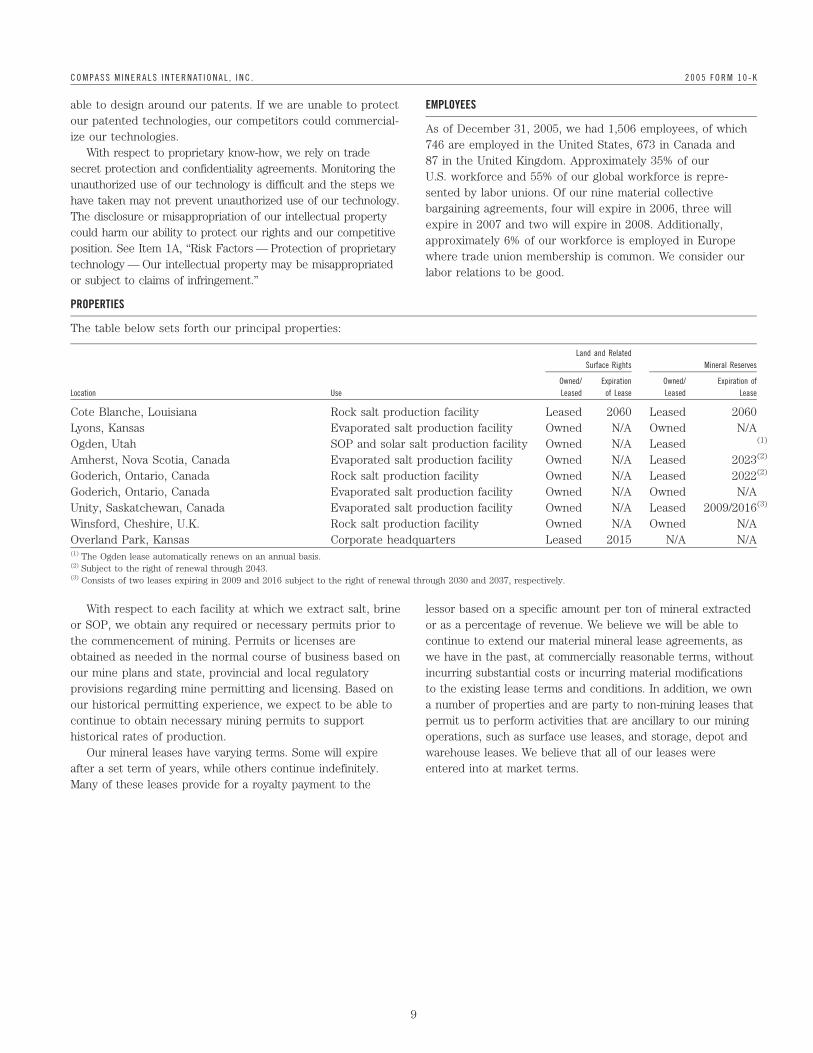
The table below sets forth our principal properties:
Land and RelatedSurface Rights Mineral Reserves
Owned/ Expiration Owned/ Expiration ofLocation Use Leased of Lease Leased Lease
Cote Blanche, Louisiana Rock salt production facility Leased 2060 Leased 2060Lyons, Kansas Evaporated salt production facility Owned N/A Owned N/AOgden, Utah SOP and solar salt production facility Owned N/A Leased (1)
Amherst, Nova Scotia, Canada Evaporated salt production facility Owned N/A Leased 2023(2)
Goderich, Ontario, Canada Rock salt production facility Owned N/A Leased 2022(2)
Goderich, Ontario, Canada Evaporated salt production facility Owned N/A Owned N/AUnity, Saskatchewan, Canada Evaporated salt production facility Owned N/A Leased 2009/2016(3)
Winsford, Cheshire, U.K. Rock salt production facility Owned N/A Owned N/AOverland Park, Kansas Corporate headquarters Leased 2015 N/A N/A(1) The Ogden lease automatically renews on an annual basis.(2) Subject to the right of renewal through 2043.(3) Consists of two leases expiring in 2009 and 2016 subject to the right of renewal through 2030 and 2037, respectively.
With respect to each facility at which we extract salt, brine lessor based on a specific amount per ton of mineral extractedor SOP, we obtain any required or necessary permits prior to or as a percentage of revenue. We believe we will be able tothe commencement of mining. Permits or licenses are continue to extend our material mineral lease agreements, asobtained as needed in the normal course of business based on we have in the past, at commercially reasonable terms, withoutour mine plans and state, provincial and local regulatory incurring substantial costs or incurring material modificationsprovisions regarding mine permitting and licensing. Based on to the existing lease terms and conditions. In addition, we ownour historical permitting experience, we expect to be able to a number of properties and are party to non-mining leases thatcontinue to obtain necessary mining permits to support permit us to perform activities that are ancillary to our mininghistorical rates of production. operations, such as surface use leases, and storage, depot and
Our mineral leases have varying terms. Some will expire warehouse leases. We believe that all of our leases wereafter a set term of years, while others continue indefinitely. entered into at market terms.Many of these leases provide for a royalty payment to the
9
C O M P A S S M I N E R A L S I N T E R N AT I O N A L , I N C . 2 0 0 5 F O R M 1 0 - K
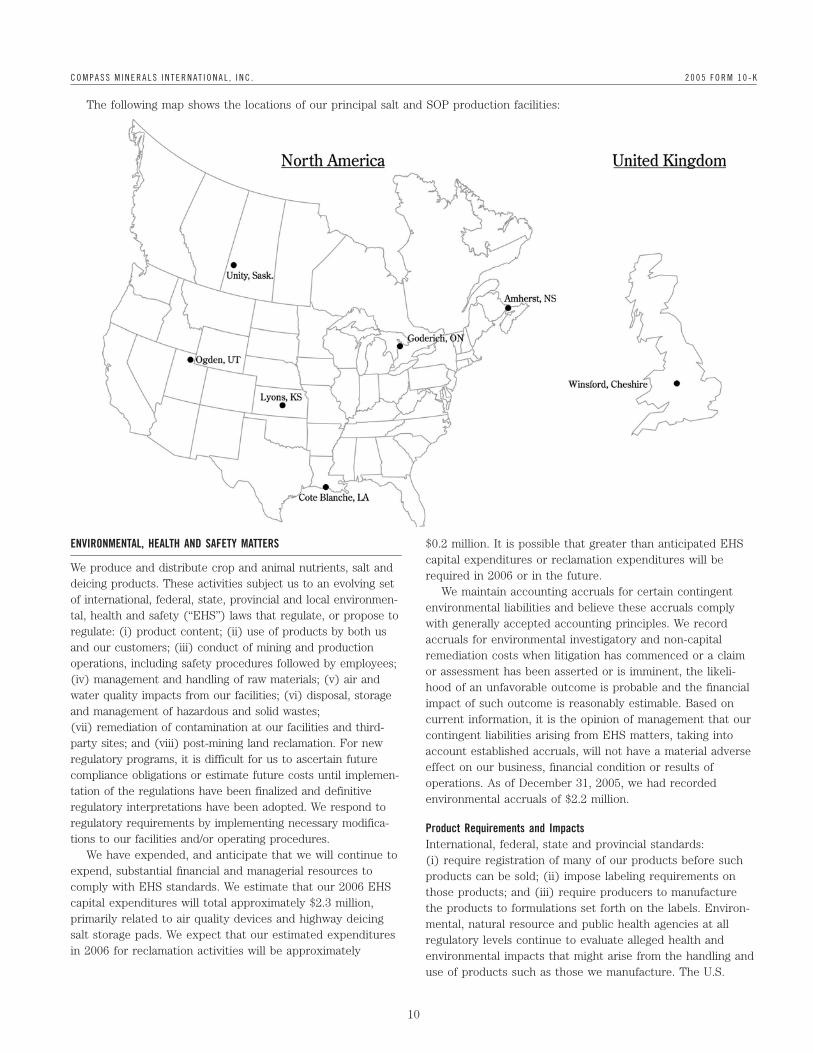
The following map shows the locations of our principal salt and SOP production facilities:
ENVIRONMENTAL, HEALTH AND SAFETY MATTERS $0.2 million. It is possible that greater than anticipated EHScapital expenditures or reclamation expenditures will be
We produce and distribute crop and animal nutrients, salt andrequired in 2006 or in the future.
deicing products. These activities subject us to an evolving setWe maintain accounting accruals for certain contingent
of international, federal, state, provincial and local environmen-environmental liabilities and believe these accruals comply
tal, health and safety (‘‘EHS’’) laws that regulate, or propose towith generally accepted accounting principles. We record
regulate: (i) product content; (ii) use of products by both usaccruals for environmental investigatory and non-capital
and our customers; (iii) conduct of mining and productionremediation costs when litigation has commenced or a claim
operations, including safety procedures followed by employees;or assessment has been asserted or is imminent, the likeli-
(iv) management and handling of raw materials; (v) air andhood of an unfavorable outcome is probable and the financial
water quality impacts from our facilities; (vi) disposal, storageimpact of such outcome is reasonably estimable. Based on
and management of hazardous and solid wastes;current information, it is the opinion of management that our
(vii) remediation of contamination at our facilities and third-contingent liabilities arising from EHS matters, taking into
party sites; and (viii) post-mining land reclamation. For newaccount established accruals, will not have a material adverse
regulatory programs, it is difficult for us to ascertain futureeffect on our business, financial condition or results of
compliance obligations or estimate future costs until implemen-operations. As of December 31, 2005, we had recorded
tation of the regulations have been finalized and definitiveenvironmental accruals of $2.2 million.
regulatory interpretations have been adopted. We respond toregulatory requirements by implementing necessary modifica- Product Requirements and Impactstions to our facilities and/or operating procedures. International, federal, state and provincial standards:
We have expended, and anticipate that we will continue to (i) require registration of many of our products before suchexpend, substantial financial and managerial resources to products can be sold; (ii) impose labeling requirements oncomply with EHS standards. We estimate that our 2006 EHS those products; and (iii) require producers to manufacturecapital expenditures will total approximately $2.3 million, the products to formulations set forth on the labels. Environ-primarily related to air quality devices and highway deicing mental, natural resource and public health agencies at allsalt storage pads. We expect that our estimated expenditures regulatory levels continue to evaluate alleged health andin 2006 for reclamation activities will be approximately environmental impacts that might arise from the handling and
use of products such as those we manufacture. The U.S.
10

C O M P A S S M I N E R A L S I N T E R N AT I O N A L , I N C . 2 0 0 5 F O R M 1 0 - K
Environmental Protection Agency, or the ‘‘EPA,’’ the State of road salts with a way to reduce harm to the environmentCalifornia and The Fertilizer Institute have each completed without jeopardizing road safety.’’ Since the dissemination ofindependent assessments of potential risks posed by crop the December 2001 report, we have endeavored to work morenutrient materials. These assessments concluded that, based closely with the national government as well as provinces andon the available data, crop nutrient materials generally do not municipalities to better manage the use, storage and releasepose harm to human health. It is unclear whether any further of our road salts. As a result, we believe it has become lessevaluations may result in additional standards or regulatory likely that road salts will be designated as a toxic substance.requirements for the producing industries, including us, or for We cannot predict whether the proposal to designate road saltour customers. At this stage, it is the opinion of management as a toxic substance will be finalized or the promulgation ofthat the potential impact of these standards on the market for any other future regulation. Standardized guidelines for theour products or on the expenditures that may be necessary to use and storage of road salt or any alternate deicing productsmeet new requirements will not have a material adverse effect may cause us to suffer reduced sales and incur substantialon our business, financial condition or results of operations. costs and expenses that could have a material adverse effect
In December 2001, the Canadian government released a on our business, financial condition and results of operations.Priority Substances List Assessment Report for road salt. This In addition, while we are not aware of any similar governmen-report found that road salts are entering the environment tal proposals for such designation of road salt in either theunder conditions that may have a harmful effect or constitute a United States or the United Kingdom, we cannot guaranteedanger to the environment. Based on this report, the Minister that such proposals will not arise.of Environment has proposed designating road salt as a ‘‘toxic’’
Operating Requirements and Impactssubstance pursuant to the Canadian Environmental ProtectionWe hold numerous environmental, mining and other permitsAct. Canada’s federal cabinet, which has ultimate responsibility,or approvals authorizing operations at each of our facilities.has not yet taken final action with respect to this proposal andOur operations are subject to permits for extraction of saltis not subject to any deadline to do so. This proposal wasand brine, discharges of process materials to air and surfacesubject to a public comment, during which individuals and thewater, and injection of brine and wastewater to subsurfacemunicipalities which comprise most of our customers expressedwells. Some of our proposed activities may require wastea variety of views, including noting the utility and cost-storage permits. A decision by a government agency to denyefficiency of salt as compared to other potential measures toor delay issuing a new or renewed permit or approval, or toreduce ice-related road hazards. At this point, Environmentrevoke or substantially modify an existing permit or approval,Canada has indicated that, whether or not road salts arecould have a material adverse effect on our ability to continuedeclared toxic, their preferred course of action is the establish-operations at the affected facility. In addition, changes toment of voluntary guidelines for users as opposed to any formenvironmental and mining regulations or permit requirementsof regulation. Environment Canada has been developing thesecould have a material adverse effect on our ability to continueguidelines based on consultation with a broad-based stakehold-operations at the affected facility. Expansion of our opera-ers group, which includes the salt industry. On April 3, 2004,tions also is predicated upon securing the necessary environ-Environment Canada published a Code of Practice to serve asmental or other permits or approvals.these guidelines. The Code of Practice requires large road salt
Pursuant to the Mine Safety and Health Act, new interimusers to develop salt management plans. We do not believe thatregulatory standards for diesel particulate matter becamethis will have a material direct effect on us, but the new salteffective in 2002 and final standards are expected to becomemanagement plans may lead our customers in Canada toeffective in 2006. In response to litigation regarding its finalrequire less road salt.rule on diesel particulate matter, the Mine Safety and HealthGiven the importance of road salt for traffic safety and theAdministration has initiated a new rule regarding certaincurrent lack of any practical substitute, we deem it unlikelyprovisions of the final standards. We are currently in compli-that any guidelines or regulations would result in a completeance with the interim standards that are in effect betweenban on the use of road salt. As noted in the December 20012002 and 2006. However, material expenditures may bereport, the use of road salt and other deicing agents ‘‘is anrequired to achieve compliance with the final standards at theimportant component of strategies to keep roadways openCote Blanche facility in Louisiana.and safe during the winter and minimize traffic crashes,
injuries and mortality under icy and snowy conditions.’’ TheRemedial Activitiesreport further stated that mitigation measures ‘‘must be basedRemediation at Our Facilities – Many of our formerly-ownedon optimization of winter road maintenance practices so asand current facilities have been in operation for a number ofnot to jeopardize road safety, while minimizing the potentialyears. Operations have historically involved the use andfor harm to the environment.’’ Environment Canada hashandling of regulated chemical substances, salt and by-productsconfirmed the high importance of road safety in its proposedor process tailings by us and predecessor operators which haveregulation of road salt. In its September 22, 2003 pressresulted in soil, surface water and groundwater contamination.release in connection with the proposed Code of Practice, it
indicated that the proposed code ‘‘will provide those who use
11
C O M P A S S M I N E R A L S I N T E R N AT I O N A L , I N C . 2 0 0 5 F O R M 1 0 - K
At many of these facilities, spills or other releases of party may potentially be required to bear more than itsregulated substances have occurred previously and potentially proportional share of cleanup costs at a site where it hascould occur in the future, possibly requiring us to undertake liability if payments cannot be obtained from other responsi-or fund cleanup efforts under the U.S. Comprehensive ble parties.Environmental Response, Compensation, and Liability Act, or We have entered into ‘‘de minimis’’ settlement agree-‘‘CERCLA,’’ or state and provincial or United Kingdom laws ments with the EPA with respect to several CERCLA sites,governing cleanup or disposal of hazardous substances. In pursuant to which we have made one-time cash payments andsome instances, we have agreed, pursuant to consent orders received statutory protection from future claims arising fromor agreements with the appropriate governmental agencies, to those sites. In some cases, however, such settlements haveundertake investigations, which currently are in progress, to included ‘‘reopeners,’’ which could result in additional liabilitydetermine whether remedial action may be required to at such sites in the event of newly discovered contaminationaddress such contamination. At other locations, we have or other circumstances.entered into consent orders or agreements with appropriate At other sites for which we have received notice ofgovernmental agencies to perform required remedial activities potential CERCLA liability, we have provided information tothat will address identified site conditions. At still other the EPA that we believe demonstrates that we are not liable,locations, we have undertaken voluntary remediation, and and the EPA has not asserted claims against us with respecthave removed formerly used underground storage tanks. to such sites. In some instances, we have agreed, pursuant toTaking into account established reserves, expenditures for orders from or agreements with appropriate governmentalthese known conditions currently are not expected, individu- agencies or agreements with private parties, to undertake orally or in the aggregate, to be material. However, material fund investigations, some of which currently are in progress,expenditures could be required in the future to remediate the to determine whether remedial action, under CERCLA orcontamination at these or at other current or former sites. In otherwise, may be required to address contamination. Ataddition, in connection with the Recapitalization, Mosaic has other locations, we have entered into consent orders oragreed to indemnify us against liabilities for certain known agreements with appropriate governmental agencies to per-and unknown conditions at existing and former sites. form required remedial activities that will address identified
The Wisconsin Department of Agriculture, Trade and site conditions.Consumer Protection (‘‘DATCP’’) reportedly has information At the present time, we are not aware of any additionalindicating that agricultural chemicals are present in the sites for which we expect to receive a notice from the EPA orgroundwater in the vicinity of the Kenosha, Wisconsin plant. any other party of potential CERCLA liability. However, basedDATCP has directed us to conduct an investigation into the on past operations, there is a potential that we may receivepossible presence of agricultural chemicals in soil and ground- notices in the future for sites of which we are currentlywater at the Kenosha plant. We have developed a plan which unaware or that our liability at currently known sites mayhas been approved by DATCP to investigate soils and increase. Taking into account established accruals, expendi-groundwater at the Kenosha site. Depending on the results of tures for our known environmental liabilities and site condi-the investigation, remedial efforts may be necessary. Although tions currently are not expected, individually or in thelittle is currently known about the possible source of such aggregate, to be material or have a material adverse effect oncontamination, or who should be responsible for it, we expect our business, financial condition, results of operations andDATCP will look to us to undertake those efforts. If required, cash flows.we intend to conduct all phases of the investigation and any
ITEM 1A. RISK FACTORSrequired remediation work under the Wisconsin AgriculturalChemical Cleanup Program, which will provide for reimburse- You should carefully consider the following risks and
ment of some of the costs. None of the identified contami- all of the information set forth in this annual report on
nants have been used in association with Compass Minerals Form 10-K. The risks described below are not the only
site operations. We expect to seek participation by, or cost ones facing our company. Additional risks and uncertain-
reimbursement from, other parties responsible for the pres- ties not currently known to us or that we currently deem
ence of any agricultural chemicals found in soils at this site. to be immaterial may also materially and adversely affect
our business, financial condition or results of operations.Remediation at Third-Party Facilities – Along withimpacting the sites at which we have operated, various third Risks Related to Our Businessparties have alleged that our historic operations have resulted
The seasonal demand for our products and the variations in ourin contamination to neighboring off-site areas or nearby third-
operations from quarter to quarter due to weather conditions may haveparty facilities. CERCLA imposes liability, without regard to
an adverse effect on our results of operations and the price of ourfault or to the legality of a party’s conduct, on certain
common stock.categories of persons who are considered to have contributed
Our highway deicing product line is seasonal, with operatingto the release of ‘‘hazardous substances’’ into the environ-
results varying from quarter to quarter as a result of weatherment. Under CERCLA, or its various state analogues, one
conditions and other factors. On average, over the last five
12
C O M P A S S M I N E R A L S I N T E R N AT I O N A L , I N C . 2 0 0 5 F O R M 1 0 - K
years, our North American highway deicing product line has Although our operations are conducted through our sub-generated over 64% of its annual sales, net of shipping and sidiaries, none of our subsidiaries is obligated to make fundshandling costs, during the months of December through March available to us for payment on our indebtedness or to paywhen the need for highway deicing is at its peak. We need to dividends on our capital stock. Accordingly, our ability tostockpile sufficient highway deicing salt in the last three fiscal make payments on our indebtedness and distribute dividendsquarters to meet estimated demand for the winter season. to our stockholders is dependent on the earnings and the
Weather conditions that impact our highway deicing product distribution of funds from our subsidiaries. The terms of ourline include temperature, levels of precipitation, number of senior secured credit facilities limit the transferability ofsnow days and duration and timing of snow fall in our relevant assets and the amount of dividends that our subsidiaries cangeographic markets. Lower than expected sales by us during distribute to us. The terms of our senior credit facilities alsothis period could have a material adverse effect on our results restrict our subsidiaries from paying dividends to us in orderof operations and the price of our common stock. to fund cash interest payments on the senior discount notes
Our SOP operating results are dependent in part upon and the senior subordinated discount notes if CMG does notconditions in the agriculture markets. The agricultural prod- comply with the provisions relating to the adjusted totalucts business can be affected by a number of factors, the leverage ratio and consolidated fixed charge coverage ratio, ormost important of which, for U.S. markets, are weather if a default or event of default has occurred and is continuingpatterns and field conditions (particularly during periods of under our senior secured credit facilities. We cannot assuretraditionally high crop nutrients consumption) and quantities you that we will remain in compliance with these ratios. Weof crop nutrients imported to and exported from North cannot assure you that the agreements governing the currentAmerica. Additionally, our ability to produce SOP at our solar and future indebtedness of our subsidiaries will permit ourevaporation ponds is dependent upon arid weather conditions. subsidiaries to provide us with sufficient dividends, distribu-Extended periods of precipitation or a prolonged lack of tions or loans to fund scheduled interest and principalsunshine would hinder our production levels resulting in payments on our indebtedness, when due. If we consummatelower sales volumes. an acquisition, our debt service requirements could increase.
We may need to refinance all or a portion of our indebtednessOur substantial indebtedness could adversely affect our financial
on or before maturity. We cannot assure you that we will becondition and impair our ability to operate our business.
able to refinance any of our indebtedness on commerciallyAs of December 31, 2005, we had $615.9 million of outstand-
reasonable terms or at all.ing indebtedness, including approximately $350.0 millionunder CMG’s senior secured term loan facility, $31.0 million We are a holding company with no operations of our own and dependunder the CMG senior secured revolving credit facility, on our subsidiaries for cash.$2.0 million of CMG senior subordinated notes, $97.1 million Although our operations are conducted through our subsidiar-of our senior discount notes, $135.8 million of our senior ies, none of our subsidiaries are obligated to make fundssubordinated discount notes, and a stockholders’ deficit of available to us for payment on our indebtedness or to pay$79.1 million. dividends on our capital stock. Accordingly, our ability to
This level of leverage could have important consequences, make payments on our indebtedness and distribute dividendsincluding the following: to our stockholders is dependent on the earnings and the
distribution of funds from our subsidiaries. The terms of the( it may limit our ability to borrow money or sell stock to
CMG senior secured credit facilities (including the term loanfund our working capital, capital expenditures and debtand revolving credit facility) include limitations on theservice requirements;amount of dividends and equity distributions our subsidiaries
( it may limit our flexibility in planning for, or reacting to,can pay to us, as discussed above. All of our subsidiaries arechanges in our business;guarantors of the CMG senior secured credit facilities.
( we may be more highly leveraged than some of ourWe cannot assure you that the agreements governing thecompetitors, which may place us at a competitive
current and future indebtedness of our subsidiaries willdisadvantage;permit our subsidiaries to provide us with sufficient dividends,
( it may make us more vulnerable to a downturn in ourdistributions or loans to fund scheduled interest and principalbusiness or the economy;payments on our indebtedness when due.
( it will require us to dedicate a substantial portion of ourcash flow from operations to the repayment of ourindebtedness, thereby reducing the availability of our cashflow for other purposes; and
( it may materially and adversely affect our business andfinancial condition if we are unable to service our indebt-edness or obtain additional financing, as needed.
13
C O M P A S S M I N E R A L S I N T E R N AT I O N A L , I N C . 2 0 0 5 F O R M 1 0 - K
Increasing interest rates would have an adverse affect on our interest Economic and other risks associated with international sales andexpense under our senior secured credit facilities. Additionally, the operations could adversely affect our business, including economic lossrestrictive covenants in the agreements governing our indebtedness and and a negative impact on earnings.the indebtedness of Compass Minerals Group may limit our ability to Since we manufacture and sell our products primarily in thepursue our business strategies or may require accelerated payments on United States, Canada and the United Kingdom, our businessour debt. is subject to risks associated with doing business internation-We pay variable interest on our senior secured credit facilities ally. Our sales outside the United States, as a percentage ofbased on LIBOR or ABR. As of December 31, 2005, our total sales, were 30% for the year ended December 31,approximately $250 million of our variable rate borrowings 2005. Accordingly, our future results could be adverselytotaling $381.0 million has been hedged through an interest affected by a variety of factors, including:rate swap agreement. Consequently, increases in interest
( changes in foreign currency exchange rates;rates will adversely affect our cost of debt for the portion that
( exchange controls;has not been hedged.
( tariffs, other trade protection measures and import orOur senior secured credit facilities and indebtedness limit export licensing requirements;
our ability and the ability of our subsidiaries, among other( potentially negative consequences from changes in tax laws;
things, to:( differing labor regulations;
( incur additional indebtedness or contingent obligations; ( requirements relating to withholding taxes on remittances( pay dividends or make distributions to our stockholders; and other payments by subsidiaries;( repurchase or redeem our stock; ( restrictions on our ability to own or operate subsidiaries, make( make investments; investments or acquire new businesses in these jurisdictions;( grant liens; ( restrictions on our ability to repatriate dividends from our( make capital expenditures; subsidiaries; and( sell assets; and ( unexpected changes in regulatory requirements.( acquire the assets of, or merge or consolidate with,
Fluctuations in the value of the U.S. dollar may adverselyother companies.
affect our results of operations. Because our consolidatedIn addition, our senior secured credit facilities require us financial results are reported in U.S. dollars, if we generate
to maintain financial ratios. These financial ratios include an sales or earnings in other currencies, the translation of thoseinterest coverage ratio and a total leverage ratio. Although we results into U.S. dollars can result in a significant increase orhave historically been able to maintain these financial ratios, decrease in the amount of those sales or earnings. In addition,we may not be able to maintain these ratios in the future. our debt service requirements are primarily in U.S. dollarsCovenants in our senior secured credit facilities may also even though a significant percentage of our cash flow isimpair our ability to finance future operations or capital needs generated in Canadian dollars and pounds sterling. Significantor to enter into acquisitions or joint ventures or engage in changes in the value of Canadian dollars and pounds sterlingother favorable business activities. relative to the U.S. dollar could have a material adverse effect
If we default under our senior secured credit facilities, the on our financial condition and our ability to meet interest andlenders could require immediate payment of the entire principal payments on U.S. dollar-denominated debt.principal amount. These circumstances include nonpayment of In addition to currency translation risks, we incur currencyprincipal, interest, fees or other amounts when due, a change transaction risk whenever we or one of our subsidiaries enterof control, default under agreements governing our other into either a purchase or a sales transaction using a currencyindebtedness, material judgments in excess of $15,000,000 or other than the local currency of the transacting entity. Giveninaccuracy of representations and warranties. Any default the volatility of exchange rates, we cannot assure you that weunder our senior secured credit facilities or agreements will be able to effectively manage our currency transactiongoverning our other indebtedness could lead to an accelera- and/or translation risks. It is possible that volatility intion of principal payments under our other debt instruments currency exchange rates will have a material adverse effect onthat contain cross-acceleration or cross-default provisions. If our financial condition or results of operations. We havethe lenders under our senior secured credit facilities require experienced and expect to experience economic loss and aimmediate repayment, we will not be able to repay them and negative impact on earnings from time to time as a result ofalso repay our other indebtedness in full. Our ability to foreign currency exchange rate fluctuations. See Manage-comply with these covenants and restrictions contained in our ment’s Discussion and Analysis of Financial Condition andsenior secured credit facilities and other agreements gov- Results of Operations — Effects of Currency Fluctuations anderning our other indebtedness may be affected by changes in Inflation and Management’s Discussion and Analysis of Finan-the economic or business conditions or other events beyond cial Condition and Results of Operations — Market Risk.our control.
14
C O M P A S S M I N E R A L S I N T E R N AT I O N A L , I N C . 2 0 0 5 F O R M 1 0 - K
Our overall success as a global business depends, in part, manufacturing, marketing, customer service and support andupon our ability to succeed in differing economic and political our distribution networks. We may have to adjust the pricesconditions. We cannot assure you that we will continue to of some of our products to stay competitive. We may not havesucceed in developing and implementing policies and strate- sufficient resources to continue to make such investments orgies that are effective in each location where we do business. maintain our competitive position. Some of our competitors
have greater financial and other resources than we do.Our operations are dependent on natural gas and a significant interruptionin the supply or increase in the price of natural gas could have a Environmental laws and regulation may subject us to significant liabilitymaterial adverse effect on our financial condition or results of operations. and require us to incur additional costs in the future.Energy costs, including primarily natural gas and electricity, We are subject to numerous environmental, health and safetyrepresented approximately 13% of our total production costs laws and regulations in the United States, Canada andin 2005. Natural gas is a primary fuel source used in the Europe, including laws and regulations relating to landevaporated salt production process. Our profitability is reclamation and remediation of hazardous substance releases,impacted by the price and availability of natural gas we and discharges to air and water. For example CERCLApurchase from third parties. We have a policy of hedging imposes liability, without regard to fault or to the legality of anatural gas prices through the use of swap agreements. We party’s conduct, on certain categories of persons (known ashave not entered into any long-term contracts for the ‘‘potentially responsible parties’’ (‘‘PRPs’’)) who are consid-purchase of natural gas. Our contractual arrangements for the ered to have contributed to the release of ‘‘hazardoussupply of natural gas do not specify quantities and are substances’’ into the environment. Although we are notautomatically renewed annually unless either party elects not currently incurring material liabilities pursuant to CERCLA,to do so. We do not have arrangements in place with back-up we may in the future incur material liabilities under CERCLAsuppliers. A significant increase in the price of natural gas and other environmental cleanup laws, with regard to ourthat is not recovered through an increase in the price of our current or former facilities, adjacent or nearby third-partyproducts or covered through our hedging arrangements, or an facilities, or off-site disposal locations. Under CERCLA, or itsextended interruption in the supply of natural gas to our various state analogues, one party may, under some circum-production facilities, could have a material adverse effect on stances, be required to bear more than its proportional shareour business, financial condition, results of operations and of cleanup costs at a site where it has liability if paymentscash flows. cannot be obtained from other responsible parties. Liability
under these laws involves inherent uncertainties. Violations ofIncreasing costs or a lack of availability of transportation services
environmental, health and safety laws are subject to civil, andcould have an adverse effect on our ability to deliver products at
in some cases, criminal sanctions.competitive prices.
We have received notices from governmental agencies thatBecause of salt’s relatively low production cost, transportation
we may be a PRP at certain sites under CERCLA or otherand handling costs tend to be a significant component of the
environmental cleanup laws. We have entered into ‘‘detotal delivered cost of sales. The high relative cost of
minimis’’ settlement agreements with the United States withtransportation tends to favor manufacturers located close to
respect to certain CERCLA sites, pursuant to which we havethe customer. We contract shipping, barge, trucking and rail
made one-time cash payments and received statutory protec-services to move salt from our production facilities to the
tion from future claims arising from those sites. At other sitesdistribution outlets and customers. A reduction in the availa-
for which we have received notice of potential CERCLAbility of transportation services or a significant increase in
liability, we have provided information to the EPA that wetransportation service rates could impair our ability to
believe demonstrates that we are not liable and the EPA haseconomically deliver salt to our markets.
not asserted claims against us with respect to such sites. InCompetition in our markets could limit our ability to attract and retain some instances, we have agreed, pursuant to consent orderscustomers, force us to continuously make capital investments and put or agreements with the appropriate governmental agencies, topressure on the prices we can charge for our products. undertake investigations which currently are in progress, toWe encounter competition in all areas of our business. determine whether remedial action may be required toCompetition in our product lines is based on a number of address such contamination. At other locations, we haveconsiderations, including product performance, transportation entered into consent orders or agreements with appropriatecosts in salt distribution, brand reputation, quality of client governmental agencies to perform remedial activities that willservice and support, and price. Additionally, customers for address identified site conditions.our products are attempting to reduce the number of vendors At the present time, we are not aware of any additionalfrom which they purchase in order to increase their effi- sites for which we expect to receive a notice from the EPA ofciency. Our customers increasingly demand a broad product potential CERCLA liability. However, based on past operationsrange and we must continue to develop our expertise in order there is a potential that we may receive such notices in theto manufacture and market these products successfully. To future for sites of which we are currently unaware. Takingremain competitive, we will need to invest continuously in into account established reserves, expenditures for our known
15
C O M P A S S M I N E R A L S I N T E R N AT I O N A L , I N C . 2 0 0 5 F O R M 1 0 - K
environmental liabilities and site conditions currently are not users to develop salt management plans. We do not believe thatexpected, individually or in the aggregate, to be material. this will have a material direct effect on us, but the new saltHowever, material expenditures could be required in the management plans may lead our customers in Canada tofuture to remediate the contamination at these or at other require less road salt.current or former sites. Given the importance of road salt for traffic safety and the
We have also developed alternative mine uses. For exam- current lack of any practical substitute, we deem it unlikelyple, we entered into a joint venture with a subsidiary of Veolia that any guidelines or regulations would result in a completeEnvironnement, a business with operations in the waste ban on the use of road salt. As noted in the December 2001management industry. The joint venture is permitted by the report, the use of road salt and other deicing agents ‘‘is anjurisdictional environmental agency to dispose of certain important component of strategies to keep roadways openstable types of hazardous waste in our salt mine in the and safe during the winter and minimize traffic crashes,United Kingdom. We believe that the mine is stable and injuries and mortality under icy and snowy conditions.’’ Theprovides a secure disposal location. However, we recognize report further stated that mitigation measures ‘‘must be basedthat any temporary or permanent storage of hazardous waste on optimization of winter road maintenance practices so asmay involve risks to the environment. Although we believe not to jeopardize road safety, while minimizing the potentialthat we have taken these risks into account as much as for harm to the environment.’’ Environment Canada recentlypossible in our planning process, it is possible that material confirmed the high importance of road safety in its proposedexpenditures could be required in the future to further regulation of road salt. In its September 22, 2003 pressreduce this risk, or to remediate any future contamination. release in connection with the proposed Code of Practice, it
Continued government and public emphasis on environ- indicated that the proposed code ‘‘will provide those who usemental issues can be expected to result in increased future road salts with a way to reduce harm to the environmentinvestments for environmental controls at ongoing operations, without jeopardizing road safety.’’ Since the dissemination ofwhich will be charged against income from future operations. the December 2001 report, we have endeavored to work morePresent and future environmental laws and regulations appli- closely with the national government as well as provinces andcable to our operations may require substantial capital municipalities to better manage the use, storage and releaseexpenditures and may have a material adverse effect on our of our road salts. As a result, we believe it has become lessbusiness, financial condition and results of operations. For likely that road salts will be designated as a toxic substance.more information, see Item 1, ‘‘Business — Environmental, We cannot predict whether the proposal to designate road saltHealth and Safety Matters.’’ as a toxic substance will be finalized or the promulgation of
any other future regulation. Standardized guidelines for theThe Canadian government’s proposal to designate road salt as a toxic
use and storage of road salt or any alternate deicing productssubstance could have a material adverse effect on our business, including
may cause us to suffer reduced sales and incur substantialreduced sales and the incurrence of substantial costs and expenditures.
costs and expenses that could have a material adverse effectIn December 2001, the Canadian government released a
on our business, financial condition and results of operations.Priority Substances List Assessment Report for road salt. This
In addition, while we are not aware of any similar governmen-report found that road salts are entering the environment
tal proposals for such designation of road salt in either theunder conditions that may have a harmful effect or constitute a
United States or the United Kingdom, we cannot guaranteedanger to the environment. Based on this report, the Minister
that such proposals will not arise.of Environment has proposed designating road salt as a ‘‘toxic’’substance pursuant to the Canadian Environmental Protection Our operations are dependent on our rights to mine our property and havingAct. Canada’s federal cabinet, which has ultimate responsibility, received the required permits and approvals from governmental authorities.has not yet taken final action with respect to this proposal and We hold numerous governmental, environmental, mining andis not subject to any deadline to do so. This proposal was other permits and approvals authorizing operations at each ofsubject to a public comment, during which individuals and the our facilities. A decision by a governmental agency to deny ormunicipalities which comprise most of our customers expressed delay issuing a new or renewed permit or approval, or toa variety of views, including noting the utility and cost- revoke or substantially modify an existing permit or approval,efficiency of salt as compared to other potential measures to could have a material adverse effect on our ability to continuereduce ice-related road hazards. At this point, Environment operations at the affected facility. Expansion of our existingCanada has indicated that, whether or not road salts are operations also is predicated upon securing the necessarydeclared toxic, their preferred course of action is the establish- environmental or other permits or approvals. We currently doment of voluntary guidelines for users as opposed to any form not have any material pending permits or approvals.of regulation. Environment Canada has been developing these In addition, we are aware of an aboriginal land claim filedguidelines based on consultation with a broad-based stakehold- by The Chippewas of Nawash and the Chippewas of Saugeeners group, which includes the salt industry. On April 3, 2004, (the ‘‘Chippewas’’) in the Ontario Superior Court against TheEnvironment Canada published a Code of Practice to serve as Attorney General of Canada and Her Majesty The Queen Inthese guidelines. The Code of Practice requires large road salt Right of Ontario. The Chippewas claim that a large part of the
16

C O M P A S S M I N E R A L S I N T E R N AT I O N A L , I N C . 2 0 0 5 F O R M 1 0 - K
land under Lake Huron was never conveyed by treaty and factors beyond our control, we cannot assure you that we willtherefore belongs to the Chippewas. The land claimed be successful in negotiating new collective bargaining agree-includes land under which our Goderich mine operates and ments, that such negotiations will not result in significanthas mining rights granted to it by the government of Ontario. increases in the cost of labor or that a breakdown in suchWe are not a party to this court action. negotiations will not result in the disruption of our operations.
Similar claims are pending with respect to other parts ofWe rely on independent distributors and the loss of a substantial
the Great Lakes by other aboriginal claimants. We have beennumber of these distributors may reduce our profits and sales.
informed by the Ministry of the Attorney General of OntarioIn addition to our own direct sales force, we depend on the
that ‘‘Canada takes the position that the common law doesservices of independent distributors to sell our products and
not recognize aboriginal title to the Great Lakes and itsprovide service and aftermarket support to our customers. In
connecting waterways.’’ We do not believe that this action will2005, 12% of our sales, net of shipping and handling costs,
result in a material adverse financial effect on the Company.were generated through these independent distributors. Many
Protection of proprietary technology — Our intellectual property may be of these independent distributors are not bound to us bymisappropriated or subject to claims of infringement. exclusive distribution contracts and may offer products of,We attempt to protect our intellectual property rights through and services to, businesses that compete with ours. Ina combination of patent, trademark, copyright and trade addition, the majority of the distribution contracts we havesecret protection, as well as licensing agreements and third- with these independent distributors are cancelable by theparty nondisclosure and assignment agreements. We cannot distributor after providing us with notice, which on average isassure you that any of our applications for protection of our six months prior to termination. The loss of a substantialintellectual property rights will be approved or that others number of these distributors or the decision by many of thesewill not infringe or challenge our intellectual property rights. distributors to offer competitors’ products to the end custom-The patents we currently have in place expire between 2009 ers could materially reduce our sales and profits.and 2018. We also rely on unpatented proprietary technology.
If we cannot successfully complete acquisitions or integrate acquiredIt is possible that others will independently develop the same
businesses, our growth may be limited and our financial conditionor similar technology or otherwise obtain access to our
adversely affected.unpatented technology. To protect our trade secrets and
Our business strategy includes supplementing internal growthother proprietary information, we require employees, consul-
by pursuing acquisitions of small complementary businesses.tants, advisors and collaborators to enter into confidentiality
We may be unable to complete acquisitions on acceptableagreements. Many of our important brand names are regis-
terms, identify suitable businesses to acquire or successfullytered as trademarks in the United States and foreign
integrate acquired businesses in the future. We compete withcountries. These registrations can be renewed if the trade-
other potential buyers for the acquisition of other smallmark remains in use. These agreements may not provide
complementary businesses. These competition and regulatorymeaningful protection for our trade secrets, know-how or
considerations may result in fewer acquisition opportunities. Ifother proprietary information in the event of any unautho-
we cannot complete acquisitions, our growth may be limitedrized use, misappropriation or disclosure. If we are unable to
and our financial condition may be adversely affected.maintain the proprietary nature of our technologies, we maylose the competitive advantage provided by our intellectual Our business is dependent upon highly skilled personnel, and the loss ofproperty. As a result, our results of operations may be key personnel may have a material adverse effect on our developmentadversely affected. and results of operations.
The success of our business is dependent on our ability toIf we are unsuccessful in negotiating new collective bargaining
attract and retain highly skilled managers and other person-agreements, we may experience significant increases in the cost of
nel. We cannot assure you that we will be able to attract andlabor or a disruption in our operations.
retain the personnel necessary for the development of ourAs of December 31, 2005, we had 1,506 employees, of which
business. The loss of the services of key personnel or the746 are employed in the United States, 673 in Canada and 87
failure to attract additional personnel as required could havein the United Kingdom. Approximately 35% of our U.S.
a material adverse effect on our development and results ofworkforce and 55% of our global workforce is represented by
operations. We do not currently maintain ‘‘key person’’ lifelabor unions. Of our nine material collective bargaining
insurance on any of our key employees.agreements, four will expire in 2006, three will expire in 2007
On November 4, 2005, our Chief Executive Officer,and two will expire in 2008. Additionally, approximately 6% of
Michael E. Ducey, announced plans to retire at the end ofour workforce is employed in Europe where trade union
2006. The Company’s board of directors has initiated a searchmembership is common. Although we believe that our
for his replacement although no successor has been named.relations with our employees are good, as a result of generaleconomic, financial, competitive, legislative, political and other
17
C O M P A S S M I N E R A L S I N T E R N AT I O N A L , I N C . 2 0 0 5 F O R M 1 0 - K
Risks Related to Our Common Stock This could also impair our ability to raise additional capitalthrough the sale of our equity securities. We are authorized to
Our common stock price may be volatile.issue up to 200,000,000 shares of common stock, of which
Our common stock price may fluctuate in response to a31,834,324 shares of common stock were outstanding and
number of events, including, but not limited to:786,519 shares of common stock were issuable upon the
( our quarterly operating results; exercise of outstanding stock options, issuance of earned( weather conditions that impact our highway deicing prod- deferred stock units, and vesting of restricted stock units as
uct line; of December 31, 2005. We cannot predict the size of future( future announcements concerning our business; issuances of our common stock or the effect, if any, that
future sales and issuances of shares of our common stock( changes in financial estimates and recommendations bywould have on the market price of our common stock.securities analysts;
( changes and developments affecting internal controls over ITEM 1B. UNRESOLVED STAFF COMMENTSfinancial reporting;
None.( actions of competitors;
ITEM 2. PROPERTIES( market and industry perception of our success, or lackthereof, in pursuing our growth strategy; Information regarding our plant and properties is included in
( changes in government and environmental regulation; Item 1, ‘‘Business,’’ of this report.( changes and developments affecting the salt industry;
ITEM 3. LEGAL PROCEEDINGS( general market, economic and political conditions; and
The Company from time to time is involved in various routine( natural disasters, terrorist attacks and acts of war.
legal proceedings. These primarily involve commercial claims,We may be restricted from paying cash dividends on our common stock product liability claims, personal injury claims and workers’in the future. compensation claims. We cannot predict the outcome of theseWe currently declare and pay regular quarterly cash dividends lawsuits, legal proceedings and claims with certainty. Never-on our common stock. Any payment of cash dividends will theless, we believe that the outcome of these proceedings,depend upon our financial condition, earnings, legal require- even if determined adversely, would not have a materialments, restrictions in our debt agreements and other factors adverse effect on our business, financial condition, results ofdeemed relevant by our board of directors. The terms of our operations and cash flows. In addition, Mosaic agreed tosenior secured credit facilities limit annual dividends to indemnify us against certain legal matters.$55 million plus 50% of preceding year net income, as We have become aware of an aboriginal land claim filed bydefined, and may restrict us from paying cash dividends on The Chippewas of Nawash and The Chippewas of Saugeenour common stock if CMG’s total leverage ratio exceeds 4.25 (the ‘‘Chippewas’’) in the Ontario Superior Court against Theor if a default or event of default has occurred and is Attorney General of Canada and Her Majesty The Queen Incontinuing under the facilities. The terms of our indentures Right of Ontario. The Chippewas claim that a large part of themay also restrict us from paying cash dividends on our land under Lake Huron was never conveyed by treaty andcommon stock. The payment of a cash dividend on our therefore belongs to the Chippewas. The land claimedcommon stock is considered a restricted payment under our includes land under which our Goderich mine operates andindentures and we are restricted from paying any cash has mining rights granted to it by the government of Ontario.dividend on our common stock unless we satisfy minimum We are not a party to this court action. Similar claims arerequirements with respect to our cumulative consolidated net pending with respect to other parts of the Great Lakes byincome (plus any additional cash proceeds received upon the other aboriginal claimants. We have been informed by theissuance of our common stock) and our fixed charge coverage Ministry of the Attorney General of Ontario that ‘‘Canadaratio. We cannot assure you that the agreements governing takes the position that the common law does not recognizeour current and future indebtedness, including our senior aboriginal title to the Great Lakes and its connectingsecured credit facilities, will permit us to pay dividends on waterways.’’ We do not believe that this action will result in aour common stock. material adverse financial effect on the Company.
Shares eligible for future sale may adversely affect our commonstock price.Sales of substantial amounts of our common stock in thepublic market, or the perception that these sales may occur,could cause the market price of our common stock to decline.
18
C O M P A S S M I N E R A L S I N T E R N AT I O N A L , I N C . 2 0 0 5 F O R M 1 0 - K
ITEM 4. SUBMISSION OF MATTERS TO A VOTE OF Keith E. Clark has served as the Vice President and GeneralSECURITY HOLDERS Manager, General Trade for CMI since August 2004. He has
served as the Vice President and General Manager of CMG’sNone.
General trade business unit since August 1997, when NorthExecutive Officers of the Registrant American Salt Company was under the management of Harris
Chemical Group. Prior to this position, Mr. Clark served asThe following table sets forth the name, age and position
Vice President, Operations for North American Salt for twoof each person who is an executive officer on the date of this
years, beginning in April 1995.annual report.
John Fallis was appointed Vice President and General ManagerName Age Position
of CMI’s Highway deicing business unit in January 2005.Michael E. Ducey 57 President, Chief Executive Officer and Mr. Fallis previously served as the Vice President, Mining of
DirectorCMG since 1994, when CMG was under the management of
Ronald Bryan 53 Vice President and General Manager, Harris Chemical Group.Sulfate of Potash
David J. Goadby was named as Vice President of CMI inKeith E. Clark 50 Vice President and General Manager,August 2004. He has served as Vice President of CMG sinceGeneral TradeFebruary 2002 and as the Managing Director of Salt UnionJohn Fallis 58 Vice President and General Manager,Ltd., our U.K. subsidiary, since April 1994, under theHighway Deicingmanagement of Harris Chemical Group.
David J. Goadby 51 Vice President of CMI and ManagingDirector, Salt Union Ltd Rodney L. Underdown was appointed Chief Financial Officer of
Rodney L. Underdown 39 Vice President, Chief Financial Officer CMI in December 2002, has served as a Vice President of CMIand Secretary since May 2002. Mr. Underdown has served as the Chief
Financial Officer of CMG since February 2002 and ViceSteven Wolf 60 Senior Vice President, Strategy andDevelopment President, Finance of CMG since November 2001. Prior to
that, he served as the Vice President, Finance of CMG’s saltMichael E. Ducey was appointed the President and Chief division since June 1998.Executive Officer of CMI in December 2002. Mr. Ducey joined
Steven Wolf was appointed Senior Vice President, Strategy andCMG as the President and Chief Executive Officer inDevelopment of CMI and Senior Vice President, Strategy ofApril 2002. Prior to joining CMG, Mr. Ducey worked approxi-CMG beginning January 1, 2005. He was named Vice Presi-mately 30 years for Borden Chemical, a diversified chemicaldent and General Manager, Highway Deicing for CMI incompany, in various positions including President and ChiefAugust 2004. Mr. Wolf previously served as the Vice PresidentExecutive Officer (December 1999 to March 2002) andand General Manager, Highway Deicing of CMG since 1994,Executive Vice President and Chief Operation Officer (Octo-when CMG was under the management of Harris Chemicalber 1997 to December 1999).Group. Mr. Wolf also served as the General Manager, SOP of
Ronald Bryan has served as the Vice President and General CMI from August 2003 to December 2004. Mr. Wolf retiredManager of CMI’s Sulfate of potash business unit since from his executive officer position effective January 1, 2006.January 2005. Mr. Bryan joined CMI in June 2003 as VicePresident — Sales and Marketing, Highway Deicing. Prior tohis career at CMI, Mr. Bryan was employed by BordenChemical and Plastics, where he most recently served asSenior Vice President — Commercial.
19
C O M P A S S M I N E R A L S I N T E R N AT I O N A L , I N C . 2 0 0 5 F O R M 1 0 - K
PART II
ITEM 5. MARKET FOR THE REGISTRANT’S COMMON EQUITY COMPENSATION PLAN INFORMATIONEQUITY, RELATED STOCKHOLDER MATTERS AND
The following table sets forth information at December 31,ISSUER PURCHASES OF EQUITY SECURITIES
2005 concerning our common stock authorized for issuanceunder our equity compensation plan:
PRICE RANGE OF COMMON STOCKNumber of
Our common stock, $0.01 par value, has been traded on the Number of Weighted-average securitiesNew York Stock Exchange under the symbol ‘‘CMP’’ since shares to exercise price of available for
be issued outstanding issuanceDecember 12, 2003. Prior to that time, there was no tradingPlan category upon exercise securities under plan
market for our common stock. The following table sets forthEquity compensation plans
the high and low closing prices per share for the four approved by stockholders:quarters ended December 31, 2005 and 2004: Stock options 757,901 $7.60
Restricted stock units 14,000First Second Third Fourth
Total securities under2005approved plans 771,901 7.60 3,168,100
Low $21.58 $22.20 $22.85 $21.81Equity compensation plans not
High 26.83 26.67 26.26 25.38 approved by stockholders(1):Deferred stock units 14,618 45,231
2004Total 786,519 $7.60 3,213,331Low 14.16 16.40 18.65 20.71
(1) Under the Compass Minerals International, Inc. Directors’ Deferred Compen-High 16.85 19.85 22.32 24.26sation Plan, adopted effective October 1, 2004, non-employee directors maydefer all or a portion of the fees payable for their service, which deferred
HOLDERS fees are converted into units equivalent to the value of the Company’scommon stock. Accumulated deferred fees are distributed in the form of
On February 20, 2006, the number of holders of record of our Company common stock.common stock was approximately 38.
DIVIDEND POLICY
We intend to pay quarterly cash dividends on our commonstock. The declaration and payment of future dividends toholders of our common stock will be at the discretion of ourboard of directors and will depend upon many factors,including our financial condition, earnings, legal requirements,restrictions in our debt agreements and other factors ourboard of directors deems relevant. The dividend limitationsimposed by our debt agreements are described in Note 8 tothe consolidated financial statements included in Item 8 ofthis report.
The Company paid quarterly dividends totaling $1.10 and$0.9375 per share in 2005 and 2004, respectively. On Febru-ary 9, 2006, our board of directors declared a quarterly cashdividend of $0.305 per share on our outstanding common stock.The dividend will be paid on March 15, 2006 to stockholders ofrecord as of the close of business on March 1, 2006.
20
C O M P A S S M I N E R A L S I N T E R N AT I O N A L , I N C . 2 0 0 5 F O R M 1 0 - K
ITEM 6. SELECTED FINANCIAL DATA
The information included in the following table should be read in conjunction with Management’s Discussion and Analysis ofFinancial Condition and Results of Operations and the consolidated financial statements and accompanying notes theretoincluded elsewhere in this annual report.
For the Year Ended December 31,
(Dollars in millions, except share data) 2005 2004 2003 2002 2001(8)
Statement of Operations Data(1):Sales $ 742.3 $ 639.9 $ 553.5 $ 459.0 $ 481.5Cost of sales — shipping and handling 227.2 182.5 159.2 131.8 138.5Cost of sales — products(2) 275.8 240.1 216.4 175.0 196.9Depreciation and amortization(3) 43.6 41.3 42.1 37.1 32.6Selling, general and administrative expenses 56.4 55.1 45.7 38.4 36.1Restructuring and other charges(4) — 5.9 2.4 7.7 27.0Operating earnings 142.9 118.8 91.2 72.1 53.4Interest expense 61.6 59.0 53.7 39.8 12.7Net earnings from continuing operations(5) 26.8 47.8 30.9 14.8 27.1Net earnings from discontinued operations(1) 4.1 2.0 1.4 2.2 1.4Dividends on preferred stock — — 1.2 10.6 0.8Gain on redemption of preferred stock — — (8.2) — —Net earnings available for common stock 30.9 49.8 39.3 6.4 27.7Per Share Data:Weighted-average common shares outstanding:
Basic 31,487,975 30,604,597 32,492,792 35,039,110 3,220,724Diluted 32,049,632 31,816,202 33,983,983 35,474,539 3,220,724
Net earnings from continuing operations per share:Basic $ 0.85 $ 1.56 $ 1.17 $ 0.12 $ 8.17Diluted 0.84 1.50 1.12 0.12 8.17
Cash dividends declared per share 1.10 0.9375 2.85 — 8.28Balance Sheet Data (at year end):Total cash and cash equivalents $ 47.1 $ 9.7 $ 2.6 $ 11.9 $ 15.9Total assets 750.3 723.9 695.1 644.1 655.6Series A redeemable preferred stock(6) — — — 19.1 74.6Total debt 615.9 583.1 603.3 507.8 526.5Other Financial Data:Ratio of earnings to fixed charges(7) 1.66x 1.84x 1.60x 1.64x 3.85x(1) On December 30, 2005, we sold our Weston Point, England evaporated salt business. Those results of operations have been reclassified as discontinued operations
for all periods presented. The 2005 earnings from discontinued operations includes a gain of $3.7 million ($4.6 million before tax) on the sale of those operations.(2) ‘‘Cost of sales — products’’ is presented exclusive of depreciation and amortization.(3) ‘‘Depreciation and amortization,’’ for purposes of this table, excludes amortization of deferred financing costs but includes expense related to discontinued
operations of $3.6 million, $3.8 million, $3.5 million, $3.1 million and $3.0 million for 2005, 2004, 2003, 2002 and 2001, respectively.(4) ‘‘Restructuring and other charges’’ — During 2001, we incurred $27.0 million of transaction and transition costs in connection with the Recapitalization. During
2002, we incurred $7.7 million of transition costs in connection with separating the Company from Mosaic. During 2003, we incurred $2.4 million of costs related tothe IPO. In November 2004, Apollo elected to terminate the amended management consulting agreement resulting in a final payment of approximately $4.5 millionin that same month. Additionally, during 2004, we incurred $1.4 million of costs directly related to the completion of two secondary offerings completed inJuly 2004 and November 2004. Essentially all of these costs had been paid as of December 31, 2004.
(5) Net earnings from continuing operations for 2005 includes $32.2 million of pre-tax expenses related to the early retirement of debt and income tax expense of$4.1 million resulting from the decision to repatriate $70 million of qualified foreign earnings pursuant to the American Jobs Creation Act.
(6) During 2003, we redeemed all of the outstanding shares of series A redeemable preferred stock. In December 2002, certain holders of the series A redeemablepreferred stock converted their preferred stock into subordinated discount notes, see Note 8 to our consolidated financial statements.
(7) For the purposes of computing the ratio of earnings to fixed charges, earnings consist of earnings from continuing operations before income taxes and fixedcharges. Fixed charges consist of interest expense excluding amounts allocated to discontinued operations, including the amortization of deferred debt issuancecosts and the interest component of our operating rents. The ratio of earnings to fixed charges prior to November 28, 2001 is not meaningful because weparticipated in a credit facility with Mosaic and its affiliates and the level of third-party debt was not comparable to the level of third-party debt in place uponconsummation of the Recapitalization and subsequent debt issuances.
(8) On November 28, 2001, Mosaic contributed the net assets of Compass Minerals Group to Salt Holdings Corporation. Accordingly, the 2001 Statement of Operationsdata is presented on a combined and consolidated basis.
21
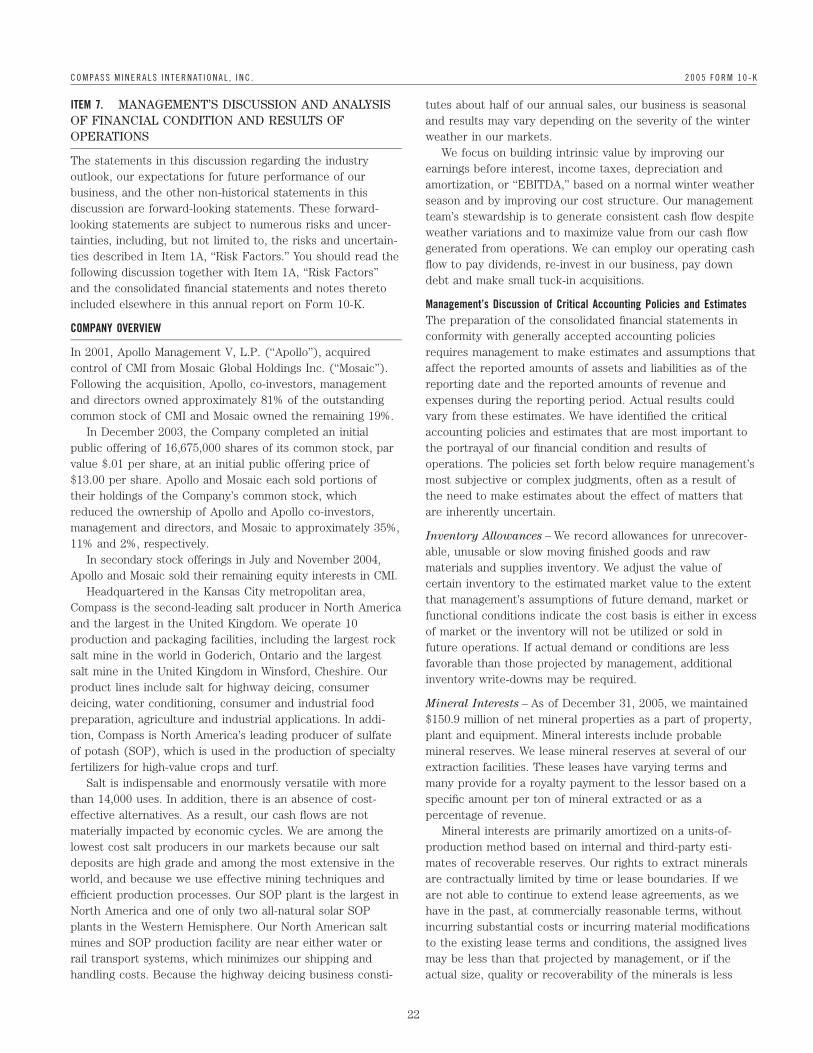
C O M P A S S M I N E R A L S I N T E R N AT I O N A L , I N C . 2 0 0 5 F O R M 1 0 - K
ITEM 7. MANAGEMENT’S DISCUSSION AND ANALYSIS tutes about half of our annual sales, our business is seasonalOF FINANCIAL CONDITION AND RESULTS OF and results may vary depending on the severity of the winterOPERATIONS weather in our markets.
We focus on building intrinsic value by improving ourThe statements in this discussion regarding the industry
earnings before interest, income taxes, depreciation andoutlook, our expectations for future performance of our
amortization, or ‘‘EBITDA,’’ based on a normal winter weatherbusiness, and the other non-historical statements in this
season and by improving our cost structure. Our managementdiscussion are forward-looking statements. These forward-
team’s stewardship is to generate consistent cash flow despitelooking statements are subject to numerous risks and uncer-
weather variations and to maximize value from our cash flowtainties, including, but not limited to, the risks and uncertain-
generated from operations. We can employ our operating cashties described in Item 1A, ‘‘Risk Factors.’’ You should read the
flow to pay dividends, re-invest in our business, pay downfollowing discussion together with Item 1A, ‘‘Risk Factors’’
debt and make small tuck-in acquisitions.and the consolidated financial statements and notes theretoincluded elsewhere in this annual report on Form 10-K. Management’s Discussion of Critical Accounting Policies and Estimates
The preparation of the consolidated financial statements inCOMPANY OVERVIEW
conformity with generally accepted accounting policiesIn 2001, Apollo Management V, L.P. (‘‘Apollo’’), acquired requires management to make estimates and assumptions thatcontrol of CMI from Mosaic Global Holdings Inc. (‘‘Mosaic’’). affect the reported amounts of assets and liabilities as of theFollowing the acquisition, Apollo, co-investors, management reporting date and the reported amounts of revenue andand directors owned approximately 81% of the outstanding expenses during the reporting period. Actual results couldcommon stock of CMI and Mosaic owned the remaining 19%. vary from these estimates. We have identified the critical
In December 2003, the Company completed an initial accounting policies and estimates that are most important topublic offering of 16,675,000 shares of its common stock, par the portrayal of our financial condition and results ofvalue $.01 per share, at an initial public offering price of operations. The policies set forth below require management’s$13.00 per share. Apollo and Mosaic each sold portions of most subjective or complex judgments, often as a result oftheir holdings of the Company’s common stock, which the need to make estimates about the effect of matters thatreduced the ownership of Apollo and Apollo co-investors, are inherently uncertain.management and directors, and Mosaic to approximately 35%,
Inventory Allowances – We record allowances for unrecover-11% and 2%, respectively.
able, unusable or slow moving finished goods and rawIn secondary stock offerings in July and November 2004,
materials and supplies inventory. We adjust the value ofApollo and Mosaic sold their remaining equity interests in CMI.
certain inventory to the estimated market value to the extentHeadquartered in the Kansas City metropolitan area,
that management’s assumptions of future demand, market orCompass is the second-leading salt producer in North America
functional conditions indicate the cost basis is either in excessand the largest in the United Kingdom. We operate 10
of market or the inventory will not be utilized or sold inproduction and packaging facilities, including the largest rock
future operations. If actual demand or conditions are lesssalt mine in the world in Goderich, Ontario and the largest
favorable than those projected by management, additionalsalt mine in the United Kingdom in Winsford, Cheshire. Our
inventory write-downs may be required.product lines include salt for highway deicing, consumerdeicing, water conditioning, consumer and industrial food Mineral Interests – As of December 31, 2005, we maintainedpreparation, agriculture and industrial applications. In addi- $150.9 million of net mineral properties as a part of property,tion, Compass is North America’s leading producer of sulfate plant and equipment. Mineral interests include probableof potash (SOP), which is used in the production of specialty mineral reserves. We lease mineral reserves at several of ourfertilizers for high-value crops and turf. extraction facilities. These leases have varying terms and
Salt is indispensable and enormously versatile with more many provide for a royalty payment to the lessor based on athan 14,000 uses. In addition, there is an absence of cost- specific amount per ton of mineral extracted or as aeffective alternatives. As a result, our cash flows are not percentage of revenue.materially impacted by economic cycles. We are among the Mineral interests are primarily amortized on a units-of-lowest cost salt producers in our markets because our salt production method based on internal and third-party esti-deposits are high grade and among the most extensive in the mates of recoverable reserves. Our rights to extract mineralsworld, and because we use effective mining techniques and are contractually limited by time or lease boundaries. If weefficient production processes. Our SOP plant is the largest in are not able to continue to extend lease agreements, as weNorth America and one of only two all-natural solar SOP have in the past, at commercially reasonable terms, withoutplants in the Western Hemisphere. Our North American salt incurring substantial costs or incurring material modificationsmines and SOP production facility are near either water or to the existing lease terms and conditions, the assigned livesrail transport systems, which minimizes our shipping and may be less than that projected by management, or if thehandling costs. Because the highway deicing business consti- actual size, quality or recoverability of the minerals is less
22
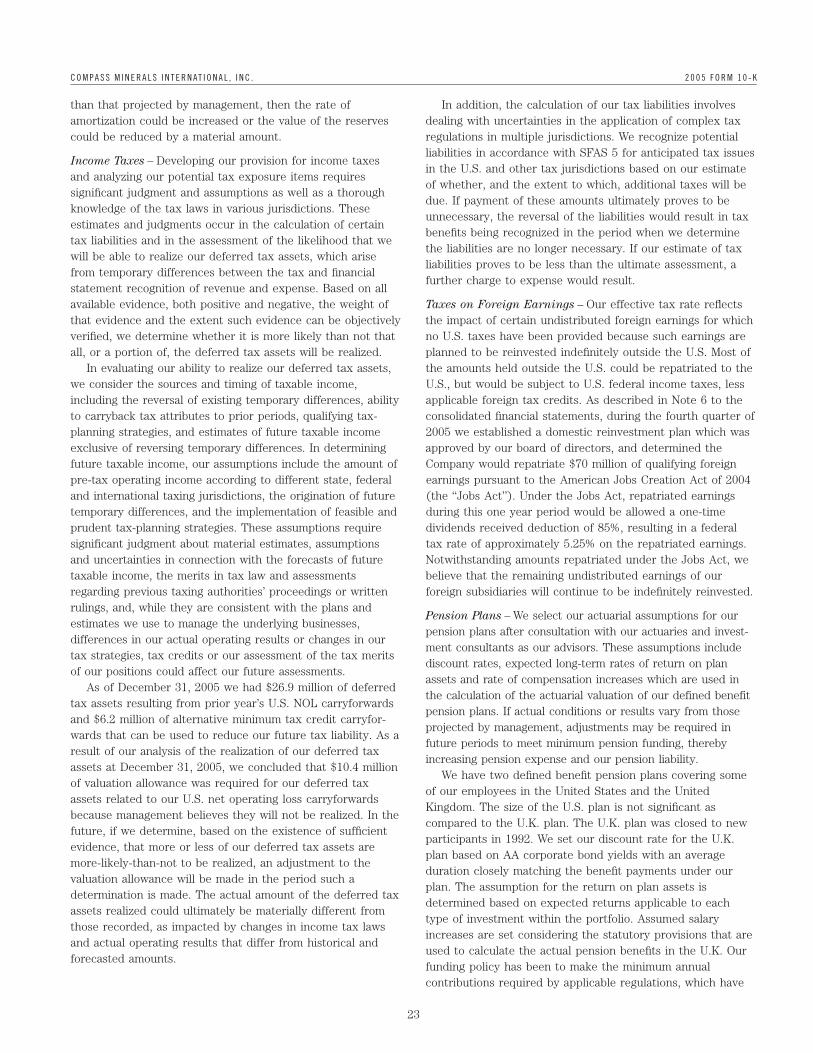
C O M P A S S M I N E R A L S I N T E R N AT I O N A L , I N C . 2 0 0 5 F O R M 1 0 - K
than that projected by management, then the rate of In addition, the calculation of our tax liabilities involvesamortization could be increased or the value of the reserves dealing with uncertainties in the application of complex taxcould be reduced by a material amount. regulations in multiple jurisdictions. We recognize potential
liabilities in accordance with SFAS 5 for anticipated tax issuesIncome Taxes – Developing our provision for income taxes
in the U.S. and other tax jurisdictions based on our estimateand analyzing our potential tax exposure items requires
of whether, and the extent to which, additional taxes will besignificant judgment and assumptions as well as a thorough
due. If payment of these amounts ultimately proves to beknowledge of the tax laws in various jurisdictions. These
unnecessary, the reversal of the liabilities would result in taxestimates and judgments occur in the calculation of certain
benefits being recognized in the period when we determinetax liabilities and in the assessment of the likelihood that we
the liabilities are no longer necessary. If our estimate of taxwill be able to realize our deferred tax assets, which arise
liabilities proves to be less than the ultimate assessment, afrom temporary differences between the tax and financial
further charge to expense would result.statement recognition of revenue and expense. Based on allavailable evidence, both positive and negative, the weight of Taxes on Foreign Earnings – Our effective tax rate reflectsthat evidence and the extent such evidence can be objectively the impact of certain undistributed foreign earnings for whichverified, we determine whether it is more likely than not that no U.S. taxes have been provided because such earnings areall, or a portion of, the deferred tax assets will be realized. planned to be reinvested indefinitely outside the U.S. Most of
In evaluating our ability to realize our deferred tax assets, the amounts held outside the U.S. could be repatriated to thewe consider the sources and timing of taxable income, U.S., but would be subject to U.S. federal income taxes, lessincluding the reversal of existing temporary differences, ability applicable foreign tax credits. As described in Note 6 to theto carryback tax attributes to prior periods, qualifying tax- consolidated financial statements, during the fourth quarter ofplanning strategies, and estimates of future taxable income 2005 we established a domestic reinvestment plan which wasexclusive of reversing temporary differences. In determining approved by our board of directors, and determined thefuture taxable income, our assumptions include the amount of Company would repatriate $70 million of qualifying foreignpre-tax operating income according to different state, federal earnings pursuant to the American Jobs Creation Act of 2004and international taxing jurisdictions, the origination of future (the ‘‘Jobs Act’’). Under the Jobs Act, repatriated earningstemporary differences, and the implementation of feasible and during this one year period would be allowed a one-timeprudent tax-planning strategies. These assumptions require dividends received deduction of 85%, resulting in a federalsignificant judgment about material estimates, assumptions tax rate of approximately 5.25% on the repatriated earnings.and uncertainties in connection with the forecasts of future Notwithstanding amounts repatriated under the Jobs Act, wetaxable income, the merits in tax law and assessments believe that the remaining undistributed earnings of ourregarding previous taxing authorities’ proceedings or written foreign subsidiaries will continue to be indefinitely reinvested.rulings, and, while they are consistent with the plans and
Pension Plans – We select our actuarial assumptions for ourestimates we use to manage the underlying businesses,
pension plans after consultation with our actuaries and invest-differences in our actual operating results or changes in our
ment consultants as our advisors. These assumptions includetax strategies, tax credits or our assessment of the tax merits
discount rates, expected long-term rates of return on planof our positions could affect our future assessments.
assets and rate of compensation increases which are used inAs of December 31, 2005 we had $26.9 million of deferred
the calculation of the actuarial valuation of our defined benefittax assets resulting from prior year’s U.S. NOL carryforwards
pension plans. If actual conditions or results vary from thoseand $6.2 million of alternative minimum tax credit carryfor-
projected by management, adjustments may be required inwards that can be used to reduce our future tax liability. As a
future periods to meet minimum pension funding, therebyresult of our analysis of the realization of our deferred tax
increasing pension expense and our pension liability.assets at December 31, 2005, we concluded that $10.4 million
We have two defined benefit pension plans covering someof valuation allowance was required for our deferred tax
of our employees in the United States and the Unitedassets related to our U.S. net operating loss carryforwards
Kingdom. The size of the U.S. plan is not significant asbecause management believes they will not be realized. In the
compared to the U.K. plan. The U.K. plan was closed to newfuture, if we determine, based on the existence of sufficient
participants in 1992. We set our discount rate for the U.K.evidence, that more or less of our deferred tax assets are
plan based on AA corporate bond yields with an averagemore-likely-than-not to be realized, an adjustment to the
duration closely matching the benefit payments under ourvaluation allowance will be made in the period such a
plan. The assumption for the return on plan assets isdetermination is made. The actual amount of the deferred tax
determined based on expected returns applicable to eachassets realized could ultimately be materially different from
type of investment within the portfolio. Assumed salarythose recorded, as impacted by changes in income tax laws
increases are set considering the statutory provisions that areand actual operating results that differ from historical and
used to calculate the actual pension benefits in the U.K. Ourforecasted amounts.
funding policy has been to make the minimum annualcontributions required by applicable regulations, which have
23
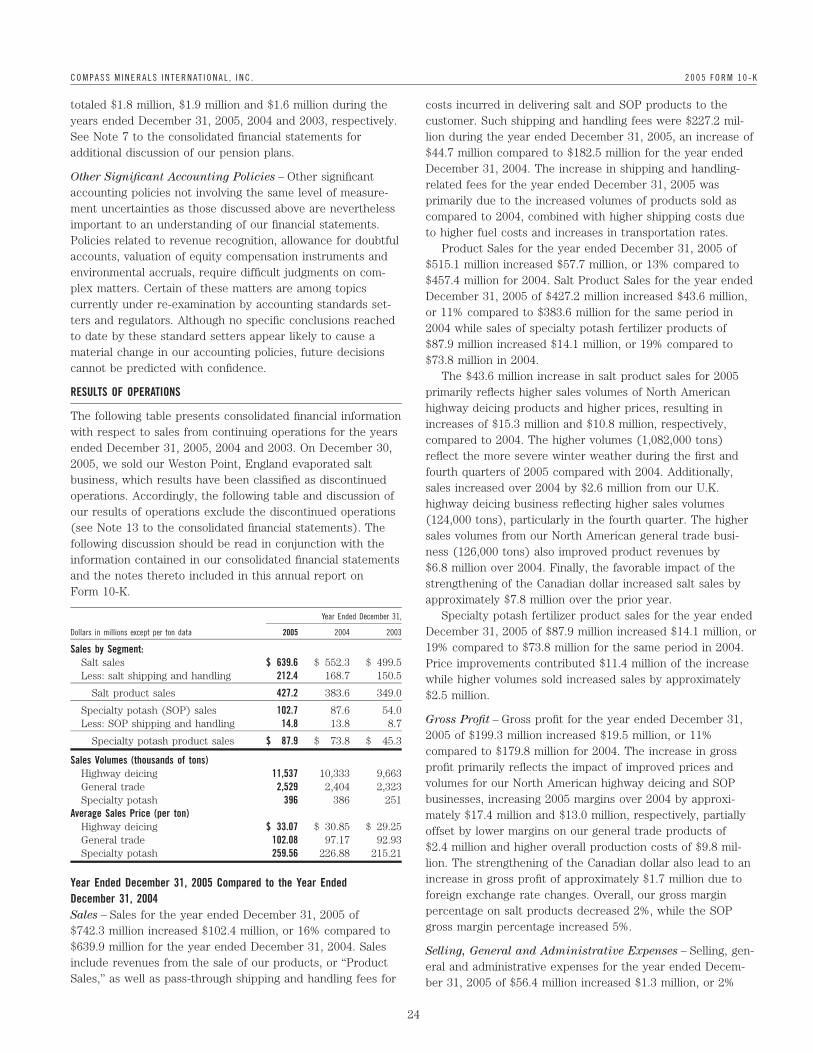
C O M P A S S M I N E R A L S I N T E R N AT I O N A L , I N C . 2 0 0 5 F O R M 1 0 - K
totaled $1.8 million, $1.9 million and $1.6 million during the costs incurred in delivering salt and SOP products to theyears ended December 31, 2005, 2004 and 2003, respectively. customer. Such shipping and handling fees were $227.2 mil-See Note 7 to the consolidated financial statements for lion during the year ended December 31, 2005, an increase ofadditional discussion of our pension plans. $44.7 million compared to $182.5 million for the year ended
December 31, 2004. The increase in shipping and handling-Other Significant Accounting Policies – Other significant
related fees for the year ended December 31, 2005 wasaccounting policies not involving the same level of measure-
primarily due to the increased volumes of products sold asment uncertainties as those discussed above are nevertheless
compared to 2004, combined with higher shipping costs dueimportant to an understanding of our financial statements.
to higher fuel costs and increases in transportation rates.Policies related to revenue recognition, allowance for doubtful
Product Sales for the year ended December 31, 2005 ofaccounts, valuation of equity compensation instruments and
$515.1 million increased $57.7 million, or 13% compared toenvironmental accruals, require difficult judgments on com-
$457.4 million for 2004. Salt Product Sales for the year endedplex matters. Certain of these matters are among topics
December 31, 2005 of $427.2 million increased $43.6 million,currently under re-examination by accounting standards set-
or 11% compared to $383.6 million for the same period inters and regulators. Although no specific conclusions reached
2004 while sales of specialty potash fertilizer products ofto date by these standard setters appear likely to cause a
$87.9 million increased $14.1 million, or 19% compared tomaterial change in our accounting policies, future decisions
$73.8 million in 2004.cannot be predicted with confidence.
The $43.6 million increase in salt product sales for 2005RESULTS OF OPERATIONS primarily reflects higher sales volumes of North American
highway deicing products and higher prices, resulting inThe following table presents consolidated financial information
increases of $15.3 million and $10.8 million, respectively,with respect to sales from continuing operations for the years
compared to 2004. The higher volumes (1,082,000 tons)ended December 31, 2005, 2004 and 2003. On December 30,
reflect the more severe winter weather during the first and2005, we sold our Weston Point, England evaporated salt
fourth quarters of 2005 compared with 2004. Additionally,business, which results have been classified as discontinued
sales increased over 2004 by $2.6 million from our U.K.operations. Accordingly, the following table and discussion of
highway deicing business reflecting higher sales volumesour results of operations exclude the discontinued operations
(124,000 tons), particularly in the fourth quarter. The higher(see Note 13 to the consolidated financial statements). The
sales volumes from our North American general trade busi-following discussion should be read in conjunction with the
ness (126,000 tons) also improved product revenues byinformation contained in our consolidated financial statements
$6.8 million over 2004. Finally, the favorable impact of theand the notes thereto included in this annual report on
strengthening of the Canadian dollar increased salt sales byForm 10-K.
approximately $7.8 million over the prior year.Year Ended December 31, Specialty potash fertilizer product sales for the year ended
Dollars in millions except per ton data 2005 2004 2003 December 31, 2005 of $87.9 million increased $14.1 million, or19% compared to $73.8 million for the same period in 2004.Sales by Segment:
Salt sales $ 639.6 $ 552.3 $ 499.5 Price improvements contributed $11.4 million of the increaseLess: salt shipping and handling 212.4 168.7 150.5 while higher volumes sold increased sales by approximately
Salt product sales 427.2 383.6 349.0 $2.5 million.Specialty potash (SOP) sales 102.7 87.6 54.0
Gross Profit – Gross profit for the year ended December 31,Less: SOP shipping and handling 14.8 13.8 8.72005 of $199.3 million increased $19.5 million, or 11%Specialty potash product sales $ 87.9 $ 73.8 $ 45.3compared to $179.8 million for 2004. The increase in gross
Sales Volumes (thousands of tons)profit primarily reflects the impact of improved prices and
Highway deicing 11,537 10,333 9,663volumes for our North American highway deicing and SOPGeneral trade 2,529 2,404 2,323businesses, increasing 2005 margins over 2004 by approxi-Specialty potash 396 386 251
Average Sales Price (per ton) mately $17.4 million and $13.0 million, respectively, partiallyHighway deicing $ 33.07 $ 30.85 $ 29.25 offset by lower margins on our general trade products ofGeneral trade 102.08 97.17 92.93
$2.4 million and higher overall production costs of $9.8 mil-Specialty potash 259.56 226.88 215.21
lion. The strengthening of the Canadian dollar also lead to anincrease in gross profit of approximately $1.7 million due toYear Ended December 31, 2005 Compared to the Year Endedforeign exchange rate changes. Overall, our gross marginDecember 31, 2004percentage on salt products decreased 2%, while the SOPSales – Sales for the year ended December 31, 2005 ofgross margin percentage increased 5%.$742.3 million increased $102.4 million, or 16% compared to
$639.9 million for the year ended December 31, 2004. Sales Selling, General and Administrative Expenses – Selling, gen-include revenues from the sale of our products, or ‘‘Product eral and administrative expenses for the year ended Decem-Sales,’’ as well as pass-through shipping and handling fees for ber 31, 2005 of $56.4 million increased $1.3 million, or 2%
24

C O M P A S S M I N E R A L S I N T E R N AT I O N A L , I N C . 2 0 0 5 F O R M 1 0 - K
compared to $55.1 million for the same period in 2004. The reduction in the valuation allowance against our deferred taxincrease primarily reflects higher professional services costs assets of $12.2 million. The reduction to the valuationand higher costs in terms of U.S. dollars due to the allowance in 2004 was primarily due to a change in the timingstrengthening of the Canadian dollar. of projected future taxable income, exclusive of reversals of
existing taxable temporary differences.Other Charges – During 2004, we incurred $1.4 million of costs
Excluding the impact of the specific items discussed above,directly related to the completion of two secondary offerings of
income tax expense decreased primarily due to lower incomeshares previously held by stockholders. We did not receive any
before income taxes in 2005. Our income tax provision differsproceeds from the sale of the shares. Consequently, the costs
from the U.S. statutory federal income tax rate primarily duerelated to these stock offerings were recorded as other operating
to U.S. statutory depletion, repatriation of foreign earnings,costs on our statement of operations.
foreign currency exchange gains recognized for tax purposesIn addition, Apollo elected to terminate the management
only (as discussed above), state income taxes (net of federalconsulting agreement during the fourth quarter of 2004
benefit), foreign income tax rate differentials, foreign miningresulting in a final payment of approximately $4.5 million.
taxes, changes in the expected utilization of previouslyInterest Expense – Interest expense for the year ended reserved NOLs and a portion of the interest expense onDecember 31, 2005 of $61.6 million increased $2.6 million discount notes being non-deductible for tax purposes.compared to $59.0 million for the same period in 2004. This
Year Ended December 31, 2004 Compared to the Year Endedincrease in interest expense primarily reflects the higher
December 31, 2003principal balances of the senior discount notes and senior
Sales – Sales for the year ended December 31, 2004 ofsubordinated discount notes due to interest accretion, as
$639.9 million increased $86.4 million, or 16% compared todiscussed in Note 8 to the consolidated financial statements.
$553.5 million for the year ended December 31, 2003. SalesOther, Net – Other net expenses of $38.7 million for the year include revenues from the sale of our products, or ‘‘Productended December 31, 2005 increased $30.9 million compared to Sales,’’ as well as pass-through shipping and handling fees forother expense of $7.8 million for the same period in 2004. In costs incurred in delivering salt and SOP products to thethe fourth quarter of 2005, we replaced our existing term loan customer. Such shipping and handling fees were $182.5 mil-and revolving credit facilities with a new senior secured credit lion during the year ended December 31, 2004, an increase ofagreements (‘‘Credit Agreement’’). In addition, we completed a $23.3 million compared to $159.2 million for the year endedtender offer and redeemed $323.0 million of our 10% Senior December 31, 2003. The increase in shipping and handling-Subordinated Notes. In connection with these transactions, we related fees for the year ended December 31, 2004 wasexpensed $26.5 million of tender premium and $6.7 million of primarily due to the increased volume of products sold asdeferred financing costs, net of unamortized issuance premium compared to 2003.as discussed in Note 8 to the consolidated financial statements. Product Sales for the year ended December 31, 2004 ofOther, net expense also includes foreign exchange losses of $457.4 million increased $63.1 million, or 16% compared to$6.1 million and $6.9 million for the years ended December 31, $394.3 million for the same period in 2003. Salt Product Sales2005 and 2004, respectively. for the year ended December 31, 2004 of $383.6 million
increased $34.6 million, or 10% compared to $349.0 million forIncome Tax Expense – Income tax expense for the year
the same period in 2003 primarily due to increased salesended December 31, 2005 of $15.8 million increased
volumes in our highway deicing product lines ($11.4 million)$11.6 million compared to $4.2 million for the same period in
and increased sales volumes in our general trade product line2004. As discussed in Note 6 to the consolidated financial
($6.2 million). The increased sales volumes in our highwaystatements, during 2005 we established a domestic reinvest-
deicing product line came from North America and the U.K.ment plan and determined we would repatriate $70 million of
(approximately 326,000 tons and 344,000 tons, respectively)qualified foreign earnings under the American Jobs Creation
and was primarily due to a combination of increased contractAct of 2004. Accordingly, we recorded additional U.S. income
bid volumes awarded in North America and slightly abovetax expense attributable to these earnings of approximately
average winter weather in the U.K. in the first quarter of 2004$4.1 million during the fourth quarter. Earlier in 2005 the
compared to an extremely mild first quarter in 2003. WinterCompany repatriated funds from its U.K. subsidiary through a
weather was also above average in North America in both 2004one-time repayment of a portion of a pound-sterling-denomi-
and 2003. The increased sales volumes in our North Americannated loan to a U.S. subsidiary resulting in a foreign currency
general trade product line of approximately 81,000 tons wasexchange gain for tax purposes only. Consequently, the
primarily due to strong consumer deicing sales in the firstCompany recorded a $5.4 million charge to income tax
quarter in areas where our consumer deicing products are sold.expense. Additionally, in 2005 we recorded a tax benefit of
Sales prices related to our general trade product lines in North$5.9 million for the reversal of previously recorded income tax
America, excluding foreign exchange effects, also improvedreserves related to matters previously determined to have an
approximately $2.6 million as compared to the same period inuncertain outcome, and expense for other income tax adjust-ments of $1.1 million. During 2004 we benefited from a
25
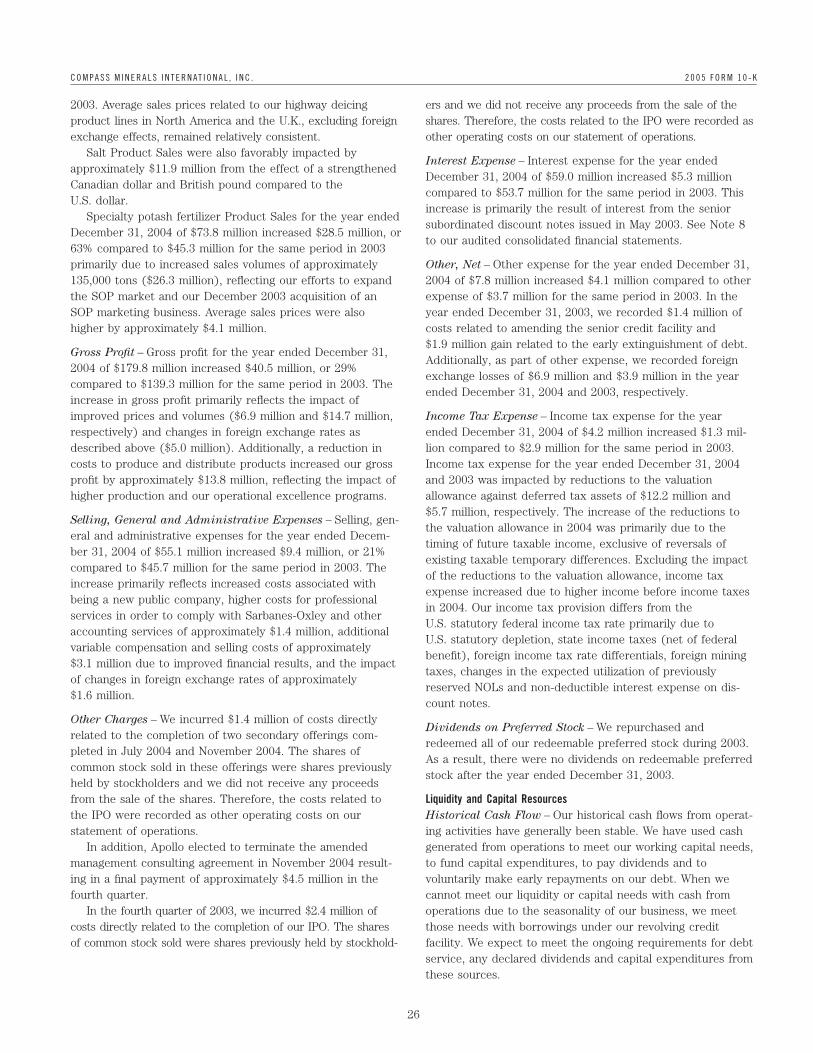
C O M P A S S M I N E R A L S I N T E R N AT I O N A L , I N C . 2 0 0 5 F O R M 1 0 - K
2003. Average sales prices related to our highway deicing ers and we did not receive any proceeds from the sale of theproduct lines in North America and the U.K., excluding foreign shares. Therefore, the costs related to the IPO were recorded asexchange effects, remained relatively consistent. other operating costs on our statement of operations.
Salt Product Sales were also favorably impacted byInterest Expense – Interest expense for the year ended
approximately $11.9 million from the effect of a strengthenedDecember 31, 2004 of $59.0 million increased $5.3 million
Canadian dollar and British pound compared to thecompared to $53.7 million for the same period in 2003. This
U.S. dollar.increase is primarily the result of interest from the senior
Specialty potash fertilizer Product Sales for the year endedsubordinated discount notes issued in May 2003. See Note 8
December 31, 2004 of $73.8 million increased $28.5 million, orto our audited consolidated financial statements.
63% compared to $45.3 million for the same period in 2003primarily due to increased sales volumes of approximately Other, Net – Other expense for the year ended December 31,135,000 tons ($26.3 million), reflecting our efforts to expand 2004 of $7.8 million increased $4.1 million compared to otherthe SOP market and our December 2003 acquisition of an expense of $3.7 million for the same period in 2003. In theSOP marketing business. Average sales prices were also year ended December 31, 2003, we recorded $1.4 million ofhigher by approximately $4.1 million. costs related to amending the senior credit facility and
$1.9 million gain related to the early extinguishment of debt.Gross Profit – Gross profit for the year ended December 31,
Additionally, as part of other expense, we recorded foreign2004 of $179.8 million increased $40.5 million, or 29%
exchange losses of $6.9 million and $3.9 million in the yearcompared to $139.3 million for the same period in 2003. The
ended December 31, 2004 and 2003, respectively.increase in gross profit primarily reflects the impact ofimproved prices and volumes ($6.9 million and $14.7 million, Income Tax Expense – Income tax expense for the yearrespectively) and changes in foreign exchange rates as ended December 31, 2004 of $4.2 million increased $1.3 mil-described above ($5.0 million). Additionally, a reduction in lion compared to $2.9 million for the same period in 2003.costs to produce and distribute products increased our gross Income tax expense for the year ended December 31, 2004profit by approximately $13.8 million, reflecting the impact of and 2003 was impacted by reductions to the valuationhigher production and our operational excellence programs. allowance against deferred tax assets of $12.2 million and
$5.7 million, respectively. The increase of the reductions toSelling, General and Administrative Expenses – Selling, gen-
the valuation allowance in 2004 was primarily due to theeral and administrative expenses for the year ended Decem-
timing of future taxable income, exclusive of reversals ofber 31, 2004 of $55.1 million increased $9.4 million, or 21%
existing taxable temporary differences. Excluding the impactcompared to $45.7 million for the same period in 2003. The
of the reductions to the valuation allowance, income taxincrease primarily reflects increased costs associated with
expense increased due to higher income before income taxesbeing a new public company, higher costs for professional
in 2004. Our income tax provision differs from theservices in order to comply with Sarbanes-Oxley and other
U.S. statutory federal income tax rate primarily due toaccounting services of approximately $1.4 million, additional
U.S. statutory depletion, state income taxes (net of federalvariable compensation and selling costs of approximately
benefit), foreign income tax rate differentials, foreign mining$3.1 million due to improved financial results, and the impact
taxes, changes in the expected utilization of previouslyof changes in foreign exchange rates of approximately
reserved NOLs and non-deductible interest expense on dis-$1.6 million.
count notes.Other Charges – We incurred $1.4 million of costs directly
Dividends on Preferred Stock – We repurchased andrelated to the completion of two secondary offerings com-
redeemed all of our redeemable preferred stock during 2003.pleted in July 2004 and November 2004. The shares of
As a result, there were no dividends on redeemable preferredcommon stock sold in these offerings were shares previously
stock after the year ended December 31, 2003.held by stockholders and we did not receive any proceedsfrom the sale of the shares. Therefore, the costs related to Liquidity and Capital Resourcesthe IPO were recorded as other operating costs on our Historical Cash Flow – Our historical cash flows from operat-statement of operations. ing activities have generally been stable. We have used cash
In addition, Apollo elected to terminate the amended generated from operations to meet our working capital needs,management consulting agreement in November 2004 result- to fund capital expenditures, to pay dividends and toing in a final payment of approximately $4.5 million in the voluntarily make early repayments on our debt. When wefourth quarter. cannot meet our liquidity or capital needs with cash from
In the fourth quarter of 2003, we incurred $2.4 million of operations due to the seasonality of our business, we meetcosts directly related to the completion of our IPO. The shares those needs with borrowings under our revolving creditof common stock sold were shares previously held by stockhold- facility. We expect to meet the ongoing requirements for debt
service, any declared dividends and capital expenditures fromthese sources.
26
C O M P A S S M I N E R A L S I N T E R N AT I O N A L , I N C . 2 0 0 5 F O R M 1 0 - K
For the year ended December 31, 2005 – Cash and cash in part by an increase in receivables of $23.9 million. Theseequivalents of $47.1 million as of December 31, 2005 changes were primarily related to increased sales in the fourthincreased $37.4 million over December 31, 2004. On Decem- quarter of 2004 as compared to the same period in 2003.ber 30, 2005 we sold our Weston Point, England evaporated Net cash flow used by investing activities for the yearsalt business in a cash transaction for approximately ended December 31, 2004 was $26.0 million. We had capital$36.2 million, subject to a working capital adjustment. We expenditures during 2004 of $22.9 million to maintain ourplan to use approximately $4 million of the proceeds to business and $4.0 million for cost reduction and newprovide additional funding to the U.K. pension plan and the opportunity projects.remaining proceeds will be used for general corporate Net cash flow used by financing activities was $71.2 millionmatters, including debt reduction. Historical cash flows gener- and was primarily due to $40.0 million in voluntary principalated from this business were not material. repayments that reduced the amount of long-term debt
Net cash flow generated by operating activities for the year outstanding under our term loan credit facility, $28.7 millionended December 31, 2005 was $87.9 million, a decrease of of dividends paid and a $3.0 million pay down of our revolving$11.8 million from the year ended December 31, 2004. The credit facility. These outflows were partially offset bydecrease results from $46.0 million of increased working $1.2 million of proceeds from stock option exercises.capital needs compared with 2004. Fourth quarter sales in
For the year ended December 31, 2003 – Net cash flow2005 increased $61.9 million over 2004, leading to $50.0 mil-
generated by operating activities for the year ended Decem-lion of higher accounts receivable balances and $13.0 million
ber 31, 2003 was $69.1 million. Operating cash flows includedof lower inventories. The redemption of our Senior Subordi-
$14.5 million used to fund increased working capital needs.nated Notes (discussed below) in December 2005 resulted in
The primary increase in working capital was an increase inan early payment of interest on those notes, contributing to a
receivables of $18.5 million, offset in part by decreases in$9.0 million reduction in current liabilities as compared to
inventories of $4.3 million and decreases in accounts payableDecember 31, 2004.
and accrued expenses of $0.3 million. These changes areNet cash generated by investing activities for the year
indicative of the seasonal nature of highway deicing productended December 31, 2005 was $0.8 million, as our capital
line sales with differences primarily related to changes in lateexpenditures nearly offset the proceeds received from the
December quarter sales versus the prior year.sale of our U.K. evaporated salt business. Our capital
Net cash flow used by investing activities for the yearexpenditures of $31.8 million included $26.8 million of routine
ended December 31, 2003 was $45.6 million. We had capitalreplacements to maintain our facilities and cost reduction
expenditures during 2003 of $18.6 million to maintain ourprojects, and $5.0 million of expenditures to begin the
business and $2.0 million for cost-reduction and new-opportu-expansion of our magnesium chloride facilities and to start
nity projects. We also spent $24.8 million related to ourconstruction of an underground rock salt mill in Canada. We
purchase of certain intangible assets related to Mosaic’sexpect to spend an additional $13 million to complete these
former SOP business.projects by mid-year 2006.
Net cash flow used by financing activities was $36.3 millionDuring 2005, we voluntarily made $37.7 million of early
and was primarily due to a $9.7 million repurchase ofpayments to repay the outstanding principal balance on our
common stock, a $30.0 million voluntary principal repaymentexisting term loan. During the fourth quarter of 2005, we
that reduced the amount of long-term debt outstanding underreplaced our existing credit facilities with the new $475 mil-
our term loan credit facility, $8.5 million related to thelion senior secured credit agreement (‘‘Credit Agreement’’) as
redemption of preferred stock, including accrued dividends,discussed in Note 8 to the consolidated financial statements.
and $5.0 million of deferred financing costs. These outflowsWe borrowed against our new Credit Agreement to complete
were partially offset by $14.0 million of borrowings under oura tender offer and redeem $323.0 million of our Senior
revolving credit facility and the receipt of $8.8 million fromSubordinated Notes. In connection with the redemption, we
Mosaic to pay income taxes for periods prior to theincurred $26.5 million in tender premium and related fees.
Recapitalization which were indemnified by Mosaic. Addition-The remaining $2.0 million of outstanding Senior Subordi-
ally, in 2003, we issued the subordinated discount notes andnated Notes are callable in August 2006. Additionally, during
used the proceeds of approximately $100.0 million to pay a2005, we made $34.7 million of dividend payments.
dividend on our common stock.For the year ended December 31, 2004 – Net cash flow
Capital Resources – Our primary sources of liquidity willgenerated by operating activities for the year ended Decem-
continue to be cash flow from operations and borrowingsber 31, 2004 was $99.7 million. Cash generated from operating
under our revolving credit facility. We expect that ongoingactivities includes $0.8 million provided by a decrease in
requirements for debt service and capital expenditures will beworking capital. The primary working capital reductions were
funded from these sources.increases in accounts payable and accrued expenses of
We have incurred substantial indebtedness in connection$22.8 million and decreases in inventories of $1.9 million, offset
with the Recapitalization. Our significant debt service obliga-tions could, under certain circumstances, materially affect our
27
C O M P A S S M I N E R A L S I N T E R N AT I O N A L , I N C . 2 0 0 5 F O R M 1 0 - K
financial condition and prevent us from fulfilling our debt of the Code. Generally, an ownership change occurs withobligations. See Item 1A, ‘‘Risk Factors — Our substantial respect to a corporation if the aggregate increase in theindebtedness could adversely affect our financial condition percentage of stock ownership by value of that corporation byand impair our ability to operate our business.’’ one or more 5% stockholders, including specified groups of
As discussed in Note 8 to the consolidated financial stockholders who in the aggregate own at least 5% of thatstatements, at December 31, 2005, we had $2.0 million corporation’s stock (including a group of public stockholders),remaining of 10% Senior Subordinated Notes due 2011. exceeds 50 percentage points over a three-year testingAdditionally, we had $123.5 million in aggregate principal period. The Company has incurred three ownership changes,amount at maturity of 123/4% Senior Discount Notes due 2012 placing annual limitations on the amount of each lossand $179.6 million in aggregate principal amount at maturity carryforward utilization. We cannot assure you that we will beof 12% Senior Subordinated Discount Notes due 2013. Under able to use all of the NOLs to offset future taxable income orour new $475 million Credit Agreement, we had $350.0 mil- that the NOLs will not become subject to additional limita-lion of borrowings outstanding under the Term Loan and tions due to future ownership changes. Due to the uncer-$31.0 million of borrowings outstanding the Revolving Credit tainty that these carryforwards will be utilized, a valuationFacilities. Letters of credit totaling $10.5 million reduced allowance of $10.4 million at December 31, 2005 has beenavailable borrowing capacity to $83.5 million. established against the deferred tax asset for the portion of
In the future, we may borrow additional amounts under the carryforward that we did not conclude was more likelythe Revolving Credit Facility to fund our working capital than not to be utilized.requirements and capital expenditures, and for other general We have two defined benefit pension plans for certain ofcorporate purposes. our U.K. and U.S. employees. Our cash funding policy is to
In connection with the Recapitalization, we received NOLs make the minimum annual contributions required by applica-and expect to realize cash tax savings if these NOLs are able ble regulations, although we expect to make a specialto be utilized. As of December 31, 2005, we had approxi- contribution of approximately $4 million in 2006 to fund themately $70.3 million of NOLs remaining that expire between portion of the past benefits related to employees of the2006 and 2022. These NOLs may be used to offset a portion discontinued evaporated salt business in the U.K. Since theof future taxable income, through the year 2022, and thereby plans’ accumulated benefit obligations are in excess of the fairreduce our U.S. federal income taxes otherwise payable. The value of the plans’ assets, we may be required to use cashInternal Revenue Code of 1986, as amended, or the ‘‘Code,’’ from operations above our historical levels to further fundimposes significant limitations on the utilization of NOLs in these plans in the future.the event of an ‘‘ownership change,’’ as defined in Section 382 At December 31, 2005, we had no off-balance sheet
arrangements that have or are likely to have a materialcurrent or future effect on our financial statements.
28
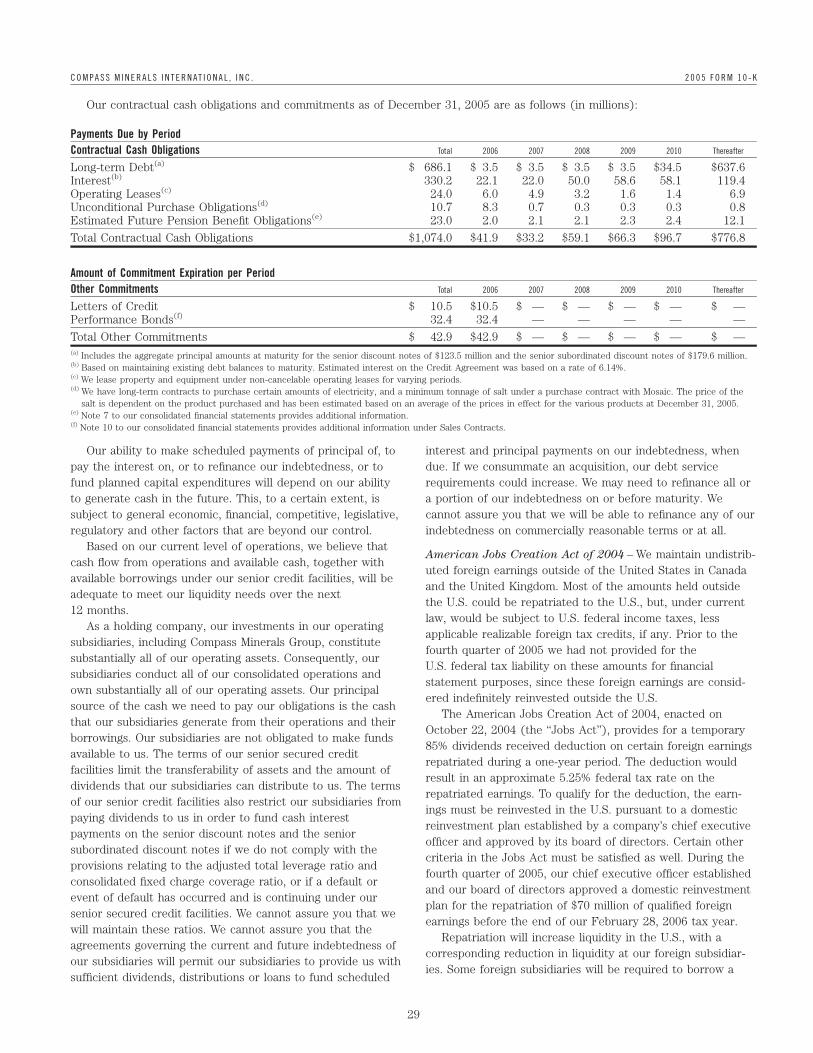
C O M P A S S M I N E R A L S I N T E R N AT I O N A L , I N C . 2 0 0 5 F O R M 1 0 - K
Our contractual cash obligations and commitments as of December 31, 2005 are as follows (in millions):
Payments Due by PeriodContractual Cash Obligations Total 2006 2007 2008 2009 2010 Thereafter
Long-term Debt(a) $ 686.1 $ 3.5 $ 3.5 $ 3.5 $ 3.5 $34.5 $637.6Interest(b) 330.2 22.1 22.0 50.0 58.6 58.1 119.4Operating Leases(c) 24.0 6.0 4.9 3.2 1.6 1.4 6.9Unconditional Purchase Obligations(d) 10.7 8.3 0.7 0.3 0.3 0.3 0.8Estimated Future Pension Benefit Obligations(e) 23.0 2.0 2.1 2.1 2.3 2.4 12.1
Total Contractual Cash Obligations $1,074.0 $41.9 $33.2 $59.1 $66.3 $96.7 $776.8
Amount of Commitment Expiration per PeriodOther Commitments Total 2006 2007 2008 2009 2010 Thereafter
Letters of Credit $ 10.5 $10.5 $ — $ — $ — $ — $ —Performance Bonds(f) 32.4 32.4 — — — — —
Total Other Commitments $ 42.9 $42.9 $ — $ — $ — $ — $ —(a) Includes the aggregate principal amounts at maturity for the senior discount notes of $123.5 million and the senior subordinated discount notes of $179.6 million.(b) Based on maintaining existing debt balances to maturity. Estimated interest on the Credit Agreement was based on a rate of 6.14%.(c) We lease property and equipment under non-cancelable operating leases for varying periods.(d) We have long-term contracts to purchase certain amounts of electricity, and a minimum tonnage of salt under a purchase contract with Mosaic. The price of the
salt is dependent on the product purchased and has been estimated based on an average of the prices in effect for the various products at December 31, 2005.(e) Note 7 to our consolidated financial statements provides additional information.(f) Note 10 to our consolidated financial statements provides additional information under Sales Contracts.
Our ability to make scheduled payments of principal of, to interest and principal payments on our indebtedness, whenpay the interest on, or to refinance our indebtedness, or to due. If we consummate an acquisition, our debt servicefund planned capital expenditures will depend on our ability requirements could increase. We may need to refinance all orto generate cash in the future. This, to a certain extent, is a portion of our indebtedness on or before maturity. Wesubject to general economic, financial, competitive, legislative, cannot assure you that we will be able to refinance any of ourregulatory and other factors that are beyond our control. indebtedness on commercially reasonable terms or at all.
Based on our current level of operations, we believe thatAmerican Jobs Creation Act of 2004 – We maintain undistrib-
cash flow from operations and available cash, together withuted foreign earnings outside of the United States in Canada
available borrowings under our senior credit facilities, will beand the United Kingdom. Most of the amounts held outside
adequate to meet our liquidity needs over the nextthe U.S. could be repatriated to the U.S., but, under current
12 months.law, would be subject to U.S. federal income taxes, less
As a holding company, our investments in our operatingapplicable realizable foreign tax credits, if any. Prior to the
subsidiaries, including Compass Minerals Group, constitutefourth quarter of 2005 we had not provided for the
substantially all of our operating assets. Consequently, ourU.S. federal tax liability on these amounts for financial
subsidiaries conduct all of our consolidated operations andstatement purposes, since these foreign earnings are consid-
own substantially all of our operating assets. Our principalered indefinitely reinvested outside the U.S.
source of the cash we need to pay our obligations is the cashThe American Jobs Creation Act of 2004, enacted on
that our subsidiaries generate from their operations and theirOctober 22, 2004 (the ‘‘Jobs Act’’), provides for a temporary
borrowings. Our subsidiaries are not obligated to make funds85% dividends received deduction on certain foreign earnings
available to us. The terms of our senior secured creditrepatriated during a one-year period. The deduction would
facilities limit the transferability of assets and the amount ofresult in an approximate 5.25% federal tax rate on the
dividends that our subsidiaries can distribute to us. The termsrepatriated earnings. To qualify for the deduction, the earn-
of our senior credit facilities also restrict our subsidiaries fromings must be reinvested in the U.S. pursuant to a domestic
paying dividends to us in order to fund cash interestreinvestment plan established by a company’s chief executive
payments on the senior discount notes and the seniorofficer and approved by its board of directors. Certain other
subordinated discount notes if we do not comply with thecriteria in the Jobs Act must be satisfied as well. During the
provisions relating to the adjusted total leverage ratio andfourth quarter of 2005, our chief executive officer established
consolidated fixed charge coverage ratio, or if a default orand our board of directors approved a domestic reinvestment
event of default has occurred and is continuing under ourplan for the repatriation of $70 million of qualified foreign
senior secured credit facilities. We cannot assure you that weearnings before the end of our February 28, 2006 tax year.
will maintain these ratios. We cannot assure you that theRepatriation will increase liquidity in the U.S., with a
agreements governing the current and future indebtedness ofcorresponding reduction in liquidity at our foreign subsidiar-
our subsidiaries will permit our subsidiaries to provide us withies. Some foreign subsidiaries will be required to borrow a
sufficient dividends, distributions or loans to fund scheduled
29
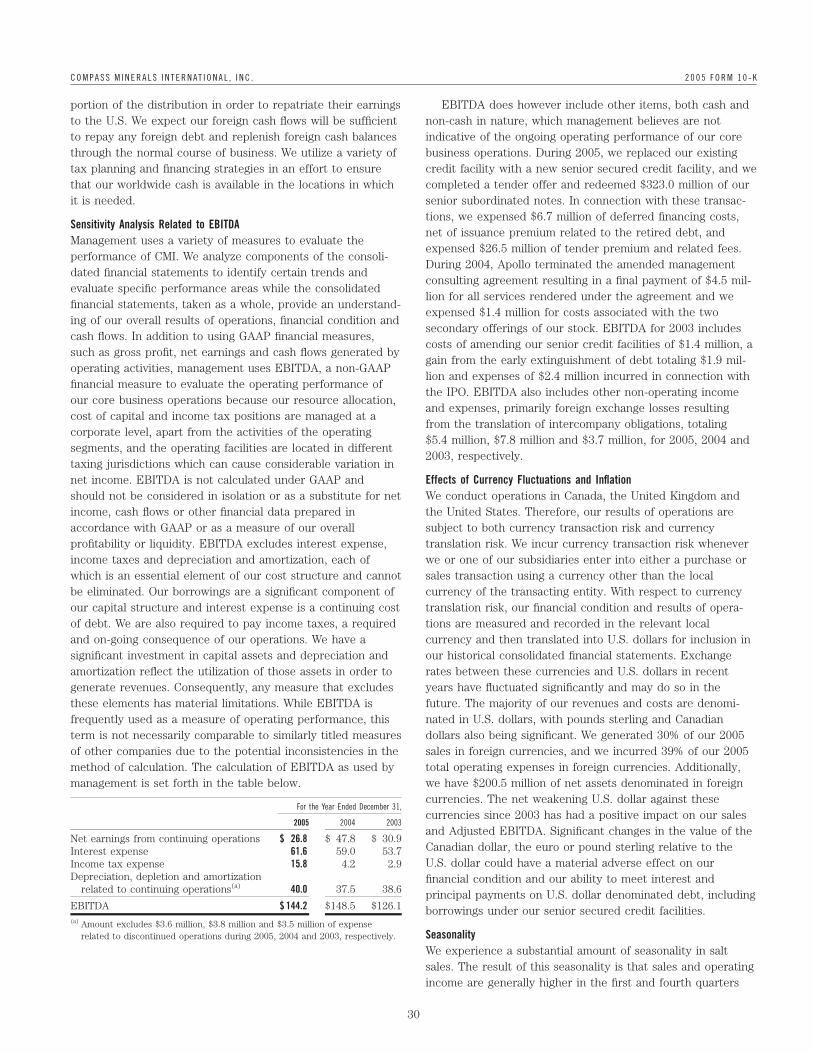
C O M P A S S M I N E R A L S I N T E R N AT I O N A L , I N C . 2 0 0 5 F O R M 1 0 - K
portion of the distribution in order to repatriate their earnings EBITDA does however include other items, both cash andto the U.S. We expect our foreign cash flows will be sufficient non-cash in nature, which management believes are notto repay any foreign debt and replenish foreign cash balances indicative of the ongoing operating performance of our corethrough the normal course of business. We utilize a variety of business operations. During 2005, we replaced our existingtax planning and financing strategies in an effort to ensure credit facility with a new senior secured credit facility, and wethat our worldwide cash is available in the locations in which completed a tender offer and redeemed $323.0 million of ourit is needed. senior subordinated notes. In connection with these transac-
tions, we expensed $6.7 million of deferred financing costs,Sensitivity Analysis Related to EBITDA
net of issuance premium related to the retired debt, andManagement uses a variety of measures to evaluate the
expensed $26.5 million of tender premium and related fees.performance of CMI. We analyze components of the consoli-
During 2004, Apollo terminated the amended managementdated financial statements to identify certain trends and
consulting agreement resulting in a final payment of $4.5 mil-evaluate specific performance areas while the consolidated
lion for all services rendered under the agreement and wefinancial statements, taken as a whole, provide an understand-
expensed $1.4 million for costs associated with the twoing of our overall results of operations, financial condition and
secondary offerings of our stock. EBITDA for 2003 includescash flows. In addition to using GAAP financial measures,
costs of amending our senior credit facilities of $1.4 million, asuch as gross profit, net earnings and cash flows generated by
gain from the early extinguishment of debt totaling $1.9 mil-operating activities, management uses EBITDA, a non-GAAP
lion and expenses of $2.4 million incurred in connection withfinancial measure to evaluate the operating performance of
the IPO. EBITDA also includes other non-operating incomeour core business operations because our resource allocation,
and expenses, primarily foreign exchange losses resultingcost of capital and income tax positions are managed at a
from the translation of intercompany obligations, totalingcorporate level, apart from the activities of the operating
$5.4 million, $7.8 million and $3.7 million, for 2005, 2004 andsegments, and the operating facilities are located in different
2003, respectively.taxing jurisdictions which can cause considerable variation innet income. EBITDA is not calculated under GAAP and Effects of Currency Fluctuations and Inflationshould not be considered in isolation or as a substitute for net We conduct operations in Canada, the United Kingdom andincome, cash flows or other financial data prepared in the United States. Therefore, our results of operations areaccordance with GAAP or as a measure of our overall subject to both currency transaction risk and currencyprofitability or liquidity. EBITDA excludes interest expense, translation risk. We incur currency transaction risk wheneverincome taxes and depreciation and amortization, each of we or one of our subsidiaries enter into either a purchase orwhich is an essential element of our cost structure and cannot sales transaction using a currency other than the localbe eliminated. Our borrowings are a significant component of currency of the transacting entity. With respect to currencyour capital structure and interest expense is a continuing cost translation risk, our financial condition and results of opera-of debt. We are also required to pay income taxes, a required tions are measured and recorded in the relevant localand on-going consequence of our operations. We have a currency and then translated into U.S. dollars for inclusion insignificant investment in capital assets and depreciation and our historical consolidated financial statements. Exchangeamortization reflect the utilization of those assets in order to rates between these currencies and U.S. dollars in recentgenerate revenues. Consequently, any measure that excludes years have fluctuated significantly and may do so in thethese elements has material limitations. While EBITDA is future. The majority of our revenues and costs are denomi-frequently used as a measure of operating performance, this nated in U.S. dollars, with pounds sterling and Canadianterm is not necessarily comparable to similarly titled measures dollars also being significant. We generated 30% of our 2005of other companies due to the potential inconsistencies in the sales in foreign currencies, and we incurred 39% of our 2005method of calculation. The calculation of EBITDA as used by total operating expenses in foreign currencies. Additionally,management is set forth in the table below. we have $200.5 million of net assets denominated in foreign
currencies. The net weakening U.S. dollar against theseFor the Year Ended December 31,
currencies since 2003 has had a positive impact on our sales2005 2004 2003
and Adjusted EBITDA. Significant changes in the value of theNet earnings from continuing operations $ 26.8 $ 47.8 $ 30.9
Canadian dollar, the euro or pound sterling relative to theInterest expense 61.6 59.0 53.7U.S. dollar could have a material adverse effect on ourIncome tax expense 15.8 4.2 2.9
Depreciation, depletion and amortization financial condition and our ability to meet interest andrelated to continuing operations(a) 40.0 37.5 38.6 principal payments on U.S. dollar denominated debt, including
EBITDA $ 144.2 $148.5 $126.1 borrowings under our senior secured credit facilities.(a) Amount excludes $3.6 million, $3.8 million and $3.5 million of expense
Seasonalityrelated to discontinued operations during 2005, 2004 and 2003, respectively.
We experience a substantial amount of seasonality in saltsales. The result of this seasonality is that sales and operatingincome are generally higher in the first and fourth quarters
30
C O M P A S S M I N E R A L S I N T E R N AT I O N A L , I N C . 2 0 0 5 F O R M 1 0 - K
and lower during the second and third quarters of each year. In March 2005, the SEC staff issued additional guidance onIn particular, sales of highway and consumer deicing salt SFAS 123(R) in the form of Staff Accounting Bulletin (‘‘SAB’’)products are seasonal as they vary based on the severity of No. 107. SAB 107 was issued to assist preparers by simplify-the winter conditions in areas where the product is used. ing some of the implementation challenges of FAS 123(R)Following industry practice in North America, we stockpile while enhancing the information that investors receive.sufficient quantities of deicing salt in the second, third and SAB 107 creates a framework that is premised on twofourth quarters to meet the estimated requirements for the themes: (a) considerable judgment will be required bywinter season. preparers to successfully implement FAS 123(R), specifically
when valuing employee stock options; and (b) reasonableRecent Accounting Pronouncements
individuals, acting in good faith, may conclude differently onIn November 2004, the FASB issued SFAS No. 151, ‘‘Inventory
the fair value of employee stock options. Key topics coveredCosts — an amendment of ARB No. 43, Chapter 4,’’ that is
by SAB 107 include: (a) valuation models — SAB 107 rein-effective for the Company beginning in the first quarter of
forces the flexibility allowed by FAS 123(R) to choose an2006. This Statement amends the guidance in Accounting
option-pricing model that meets the standard’s fair valueResearch Bulletin (‘‘ARB’’) No. 43, Chapter 4, ‘‘Inventory
measurement objective; (b) expected volatility — the SABPricing,’’ to clarify the accounting for abnormal amounts of
provides guidance on when it would be appropriate to relyidle facility expense, freight, handling costs, and wasted
exclusively on either historical or implied volatility in estimat-material (spoilage). Paragraph 5 of ARB 43, Chapter 4,
ing expected volatility; and (c) expected term — the newpreviously stated that ‘‘...under some circumstances, items
guidance includes examples and some simplified approachessuch as idle facility expense, excessive spoilage, double
to determining the expected term under certain circum-freight, and rehandling costs may be so abnormal as to
stances. The Company will apply the principles of SAB 107 inrequire treatment as current period charges... .’’ This State-
conjunction with its adoption of SFAS 123(R).ment requires that those items be recognized as current-period charges regardless of whether they meet the criterion ITEM 7A. QUANTITATIVE AND QUALITATIVE DISCLOSURESof ‘‘so abnormal.’’ In addition, this Statement requires that ABOUT MARKET RISKallocation of fixed production overheads to the costs of
Our business is subject to various types of market risks thatconversion be based on the normal capacity of the production
include, but are not limited to, interest rate risk, foreignfacilities. The adoption of SFAS No. 151 is not expected to
currency translation risk and commodity pricing risk. Manage-have a material impact on the Company’s financial position,
ment may take actions that would mitigate our exposure toresults of operations or cash flows.
these types of risks including entering into forward purchaseIn December 2004, the FASB issued SFAS No. 123(R),
contracts and other financial instruments. However, there can‘‘Share-Based Payment’’. SFAS 123(R) is a revision of SFAS
be no assurance that our hedging activities will eliminate orNo. 123, ‘‘Accounting for Stock Based Compensation,’’ and
substantially reduce these risks. We do not enter into anysupersedes Accounting Principles Board Opinion No. 25
financial instrument arrangements for speculative purposes.(‘‘APB 25’’), ‘‘Accounting for Stock Issued to Employees.’’Among other items SFAS 123(R) eliminates the use of Interest Rate Risk – As of December 31, 2005, we hadAPB 25 and the intrinsic value method of accounting, and $350.0 million of debt outstanding under the Term Loan andrequires companies to follow guidance previously set forth in $31.0 million outstanding under our Revolving Credit Facility,SFAS 123 and recognize the cost of employee services each bearing interest at variable rates. Additionally, asreceived in exchange for awards of equity instruments, based described in Note 9 to the consolidated financial statements,on the grant-date fair value of those awards, in the financial during the fourth quarter of 2005 we entered into an intereststatements. Additionally, SFAS 123(R) requires any actual tax rate swap agreement to hedge the variability in interest ratesbenefits realized in excess of the benefit related to accrued relative to $250 million notional amount of our new Termcompensation expense to be classified as a financing cash flow Loan. Accordingly, our earnings and cash flows will bein the statement of cash flows. The Company has recognized affected by changes in interest rates to the extent thecompensation expense for the fair value of stock-based principal balance is unhedged. Assuming no change in thecompensation in its financial statements in accordance with amount of Term Loan outstanding and an average level ofthe fair value method SFAS 123 for all periods presented, Revolving Credit Facility, a one hundred basis point increasealthough we have historically included excess tax benefits as in the average interest rate under these borrowings wouldan operating cash flow. The Company will adopt SFAS 123(R) increase the interest expense related to the unhedged portionin the first quarter of 2006, using the modified prospective of our variable rate debt by approximately $1.0 million. Actualmethod. The adoption of SFAS 123(R) is not expected to results may vary due to changes in the amount of variablehave a material impact on the Company’s financial position or rate debt outstanding and actual changes in interest rates.results of operations.
31
C O M P A S S M I N E R A L S I N T E R N AT I O N A L , I N C . 2 0 0 5 F O R M 1 0 - K
Foreign Currency Risk – We conduct our business primarily Commodity Pricing Risk: Commodity Derivative
in Canada and the United Kingdom as well as the United Instruments and Hedging Activities – We have a hedgingStates. Our operations may, therefore, be subject to volatility policy to mitigate the impact of fluctuations in the price ofbecause of currency fluctuations, inflation changes and natural gas. The notional volumes hedged are based on achanges in political and economic conditions in these coun- combination of factors including estimated natural gas usage,tries. Sales and expenses are frequently denominated in local current market prices and historical market prices. We entercurrencies and results of operations may be affected adversely into contractual gas price swaps to effectively fix theas currency fluctuations affect our product prices and operat- purchase price of our natural gas requirements up toing costs or those of our competitors. We may engage in 36 months in advance of the physical purchase of the naturalhedging operations, including forward foreign exchange con- gas and hedge up to approximately 80% of our expectedtracts, to reduce the exposure of our cash flows to fluctua- natural gas usage. We have determined that these financialtions in foreign currency rates. We will not engage in hedging instruments qualify as cash flow hedges under SFAS No. 133,for speculative investment reasons. Our historical results do ‘‘Accounting for Derivative Instruments and Hedging Activity,’’not reflect any foreign exchange hedging activity. There can as amended. The notional amount of natural gas derivativebe no assurance that any hedging operations will eliminate or contracts outstanding at December 31, 2005 expiring withinsubstantially reduce risks associated with fluctuating curren- one year and those expiring in greater than one year totalcies. See Item 1A, ‘‘Risk Factors — Economic and other risks 1.9 million and 1.3 million British thermal units, respectively.associated with international sales and operations could Excluding natural gas hedged with derivative instruments,adversely affect our business, including economic loss and a a hypothetical 10% adverse change in our natural gas pricesnegative impact on earnings.’’ during the year ended December 31, 2005 would have
Considering our foreign earnings, a hypothetical 10% increased our cost of sales by approximately $0.7 million.unfavorable change in the exchange rates compared to the Actual results will vary due to actual changes in market pricesU.S. dollar would have an estimated $1.9 million impact on and consumption.operating earnings for the year ended December 31, 2005.
ITEM 8. FINANCIAL STATEMENTS ANDActual changes in market prices or rates will differ from
SUPPLEMENTARY DATAhypothetical changes.
Description Page
Report of Independent Registered Public Accounting Firms 33Consolidated Balance Sheets as of December 31, 2005
and 2004 36Consolidated Statements of Operations for the three years
ended December 31, 2005 37Consolidated Statements of Stockholders’ Equity (Deficit)
for the three years ended December 31, 2005 38Consolidated Statements of Cash Flows for the three years
ended December 31, 2005 39Notes to Consolidated Financial Statements 40
32
C O M P A S S M I N E R A L S I N T E R N AT I O N A L , I N C . 2 0 0 5 F O R M 1 0 - K
Report of Independent Registered Public Accounting FirmThe Board of Directors and Stockholders of Compass Minerals International, Inc.
We have audited the accompanying consolidated balance sheet of Compass Minerals International, Inc. as of December 31, 2005and the related consolidated statements of operations, stockholders’ equity (deficit), and cash flows for the year endedDecember 31, 2005. Our audit also included the financial statement schedule listed at Item 15(a)(2). These financial statementsand schedule are the responsibility of the Company’s management. Our responsibility is to express an opinion on these financialstatements and schedule based on our audit.
We conducted our audit in accordance with the standards of the Public Company Accounting Oversight Board (UnitedStates). Those standards require that we plan and perform the audit to obtain reasonable assurance about whether the financialstatements are free of material misstatement. An audit includes examining, on a test basis, evidence supporting the amounts anddisclosures in the financial statements. An audit also includes assessing the accounting principles used and significant estimatesmade by management, as well as evaluating the overall financial statement presentation. We believe that our audit provides areasonable basis for our opinion.
In our opinion, the financial statements referred to above present fairly, in all material respects, the consolidated financialposition of Compass Minerals International, Inc. at December 31, 2005, and the consolidated results of its operations and its cashflows for the year ended December 31, 2005, in conformity with U.S. generally accepted accounting principles. Also, in ouropinion, the related financial statement schedule, when considered in relation to the basic financial statements taken as a whole,presents fairly in all material respects the information set forth therein.
We also have audited, in accordance with the standards of the Public Company Accounting Oversight Board (United States),the effectiveness of Compass Minerals International, Inc.’s internal control over financial reporting as of December 31, 2005,based on criteria established in Internal Control-Integrated Framework issued by the Committee of Sponsoring Organizations ofthe Treadway Commission and our report dated February 23, 2006 expressed an unqualified opinion thereon.
/s / Ernst & Young LLPKansas City, MissouriFebruary 23, 2006
33

C O M P A S S M I N E R A L S I N T E R N AT I O N A L , I N C . 2 0 0 5 F O R M 1 0 - K
Report of Independent Registered Public Accounting FirmThe Board of Directors and Stockholders of Compass Minerals International, Inc.
We have audited management’s assessment, included in the accompanying Management’s Report on Internal Control overFinancial Reporting, that Compass Minerals International, Inc. maintained effective internal control over financial reporting as ofDecember 31, 2005, based on criteria established in Internal Control — Integrated Framework issued by the Committee ofSponsoring Organizations of the Treadway Commission (the COSO criteria). Compass Minerals International, Inc.’s managementis responsible for maintaining effective internal control over financial reporting and for its assessment of the effectiveness ofinternal control over financial reporting. Our responsibility is to express an opinion on management’s assessment and an opinionon the effectiveness of the company’s internal control over financial reporting based on our audit.
We conducted our audit in accordance with the standards of the Public Company Accounting Oversight Board (UnitedStates). Those standards require that we plan and perform the audit to obtain reasonable assurance about whether effectiveinternal control over financial reporting was maintained in all material respects. Our audit included obtaining an understanding ofinternal control over financial reporting, evaluating management’s assessment, testing and evaluating the design and operatingeffectiveness of internal control, and performing such other procedures as we considered necessary in the circumstances. Webelieve that our audit provides a reasonable basis for our opinion.
A company’s internal control over financial reporting is a process designed to provide reasonable assurance regarding thereliability of financial reporting and the preparation of financial statements for external purposes in accordance with generallyaccepted accounting principles. A company’s internal control over financial reporting includes those policies and procedures that(1) pertain to the maintenance of records that, in reasonable detail, accurately and fairly reflect the transactions and dispositionsof the assets of the company; (2) provide reasonable assurance that transactions are recorded as necessary to permitpreparation of financial statements in accordance with generally accepted accounting principles, and that receipts andexpenditures of the company are being made only in accordance with authorizations of management and directors of thecompany; and (3) provide reasonable assurance regarding prevention or timely detection of unauthorized acquisition, use, ordisposition of the company’s assets that could have a material effect on the financial statements.
Because of its inherent limitations, internal control over financial reporting may not prevent or detect misstatements. Also,projections of any evaluation of effectiveness to future periods are subject to the risk that controls may become inadequatebecause of changes in conditions, or that the degree of compliance with the policies or procedures may deteriorate.
In our opinion, management’s assessment that Compass Minerals International, Inc. maintained effective internal control overfinancial reporting as of December 31, 2005, is fairly stated, in all material respects, based on the COSO criteria. Also, in ouropinion, Compass Minerals International, Inc. maintained, in all material respects, effective internal control over financialreporting as of December 31, 2005, based on the COSO criteria.
We also have audited, in accordance with the standards of the Public Company Accounting Oversight Board (United States),the consolidated balance sheet of Compass Minerals International, Inc. as of December 31, 2005, and the related consolidatedstatements of operations, stockholders’ equity (deficit), and cash flows for the year ended December 31, 2005 of CompassMinerals International, Inc. and our report dated February 23, 2006 expressed an unqualified opinion thereon.
/s / Ernst & Young LLPKansas City, MissouriFebruary 23, 2006
34
C O M P A S S M I N E R A L S I N T E R N AT I O N A L , I N C . 2 0 0 5 F O R M 1 0 - K
Report of Independent Registered Public Accounting FirmTo the Board of Directors and Stockholders of Compass Minerals International, Inc.:
In our opinion, the consolidated balance sheet as of December 31, 2004 and the related consolidated statements of operations, ofstockholders’ equity (deficit) and of cash flows present fairly, in all material respects, the financial position of Compass MineralsInternational, Inc. and its subsidiaries at December 31, 2004, and the results of their operations and their cash flows for each ofthe two years in the period ended December 31, 2004, in conformity with accounting principles generally accepted in the UnitedStates of America. In addition, in our opinion, the 2004 and 2003 information included in the financial statement schedule listedin the index appearing under Item 15(a)(2) presents fairly, in all material respects, the information set forth therein when readin conjunction with the related consolidated financial statements. These financial statements and financial statement scheduleinformation are the responsibility of the Company’s management. Our responsibility is to express an opinion on these financialstatements and financial statement schedule information based on our audits. We conducted our audits of these statements inaccordance with the standards of the Public Company Accounting Oversight Board (United States). Those standards require thatwe plan and perform the audit to obtain reasonable assurance about whether the financial statements are free of materialmisstatement. An audit includes examining, on a test basis, evidence supporting the amounts and disclosures in the financialstatements, assessing the accounting principles used and significant estimates made by management, and evaluating the overallfinancial statement presentation. We believe that our audits provide a reasonable basis for our opinion.
PricewaterhouseCoopers LLPKansas City, MissouriMarch 15, 2005, except for the reclassifications to the 2004 and 2003 financial statements relating to the effects of thediscontinued operation described in Note 13, as to which the date is February 23, 2006
35
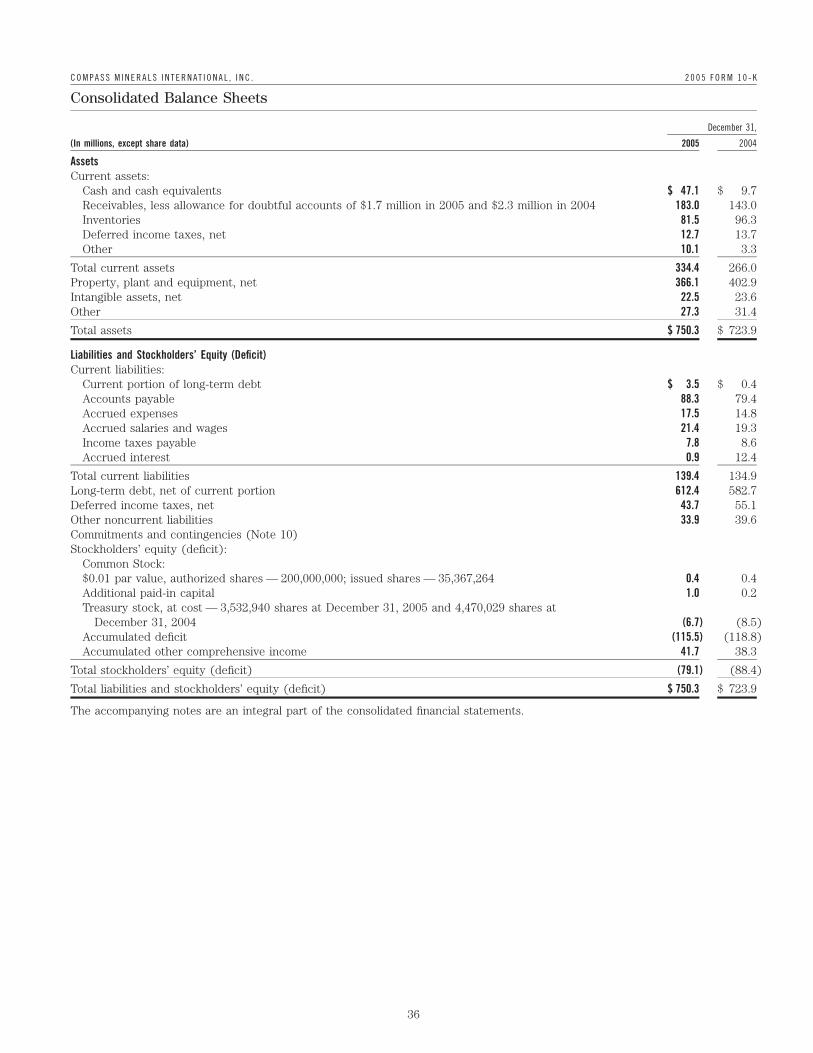
C O M P A S S M I N E R A L S I N T E R N AT I O N A L , I N C . 2 0 0 5 F O R M 1 0 - K
Consolidated Balance Sheets
December 31,
(In millions, except share data) 2005 2004
AssetsCurrent assets:
Cash and cash equivalents $ 47.1 $ 9.7Receivables, less allowance for doubtful accounts of $1.7 million in 2005 and $2.3 million in 2004 183.0 143.0Inventories 81.5 96.3Deferred income taxes, net 12.7 13.7Other 10.1 3.3
Total current assets 334.4 266.0Property, plant and equipment, net 366.1 402.9Intangible assets, net 22.5 23.6Other 27.3 31.4
Total assets $ 750.3 $ 723.9
Liabilities and Stockholders’ Equity (Deficit)Current liabilities:
Current portion of long-term debt $ 3.5 $ 0.4Accounts payable 88.3 79.4Accrued expenses 17.5 14.8Accrued salaries and wages 21.4 19.3Income taxes payable 7.8 8.6Accrued interest 0.9 12.4
Total current liabilities 139.4 134.9Long-term debt, net of current portion 612.4 582.7Deferred income taxes, net 43.7 55.1Other noncurrent liabilities 33.9 39.6Commitments and contingencies (Note 10)Stockholders’ equity (deficit):
Common Stock:$0.01 par value, authorized shares — 200,000,000; issued shares — 35,367,264 0.4 0.4Additional paid-in capital 1.0 0.2Treasury stock, at cost — 3,532,940 shares at December 31, 2005 and 4,470,029 shares at
December 31, 2004 (6.7) (8.5)Accumulated deficit (115.5) (118.8)Accumulated other comprehensive income 41.7 38.3
Total stockholders’ equity (deficit) (79.1) (88.4)
Total liabilities and stockholders’ equity (deficit) $ 750.3 $ 723.9
The accompanying notes are an integral part of the consolidated financial statements.
36
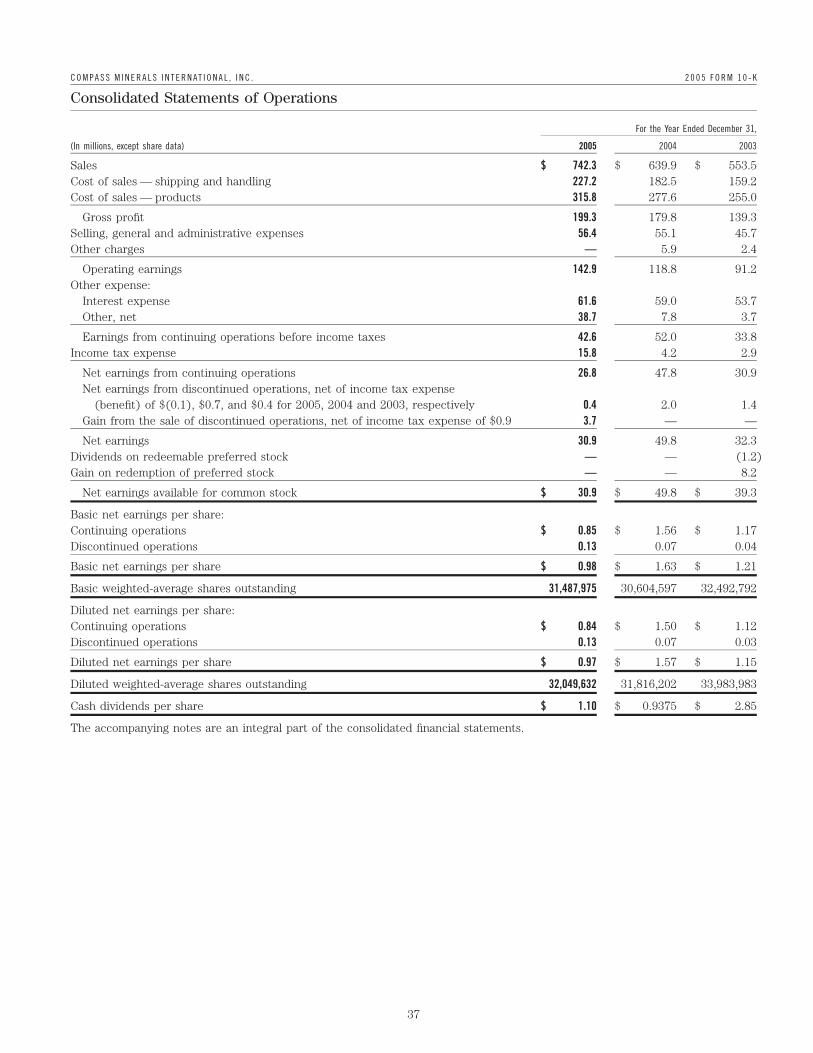
C O M P A S S M I N E R A L S I N T E R N AT I O N A L , I N C . 2 0 0 5 F O R M 1 0 - K
Consolidated Statements of Operations
For the Year Ended December 31,
(In millions, except share data) 2005 2004 2003
Sales $ 742.3 $ 639.9 $ 553.5Cost of sales — shipping and handling 227.2 182.5 159.2Cost of sales — products 315.8 277.6 255.0
Gross profit 199.3 179.8 139.3Selling, general and administrative expenses 56.4 55.1 45.7Other charges — 5.9 2.4
Operating earnings 142.9 118.8 91.2Other expense:
Interest expense 61.6 59.0 53.7Other, net 38.7 7.8 3.7
Earnings from continuing operations before income taxes 42.6 52.0 33.8Income tax expense 15.8 4.2 2.9
Net earnings from continuing operations 26.8 47.8 30.9Net earnings from discontinued operations, net of income tax expense
(benefit) of $(0.1), $0.7, and $0.4 for 2005, 2004 and 2003, respectively 0.4 2.0 1.4Gain from the sale of discontinued operations, net of income tax expense of $0.9 3.7 — —
Net earnings 30.9 49.8 32.3Dividends on redeemable preferred stock — — (1.2)Gain on redemption of preferred stock — — 8.2
Net earnings available for common stock $ 30.9 $ 49.8 $ 39.3
Basic net earnings per share:Continuing operations $ 0.85 $ 1.56 $ 1.17Discontinued operations 0.13 0.07 0.04
Basic net earnings per share $ 0.98 $ 1.63 $ 1.21
Basic weighted-average shares outstanding 31,487,975 30,604,597 32,492,792
Diluted net earnings per share:Continuing operations $ 0.84 $ 1.50 $ 1.12Discontinued operations 0.13 0.07 0.03
Diluted net earnings per share $ 0.97 $ 1.57 $ 1.15
Diluted weighted-average shares outstanding 32,049,632 31,816,202 33,983,983
Cash dividends per share $ 1.10 $ 0.9375 $ 2.85
The accompanying notes are an integral part of the consolidated financial statements.
37
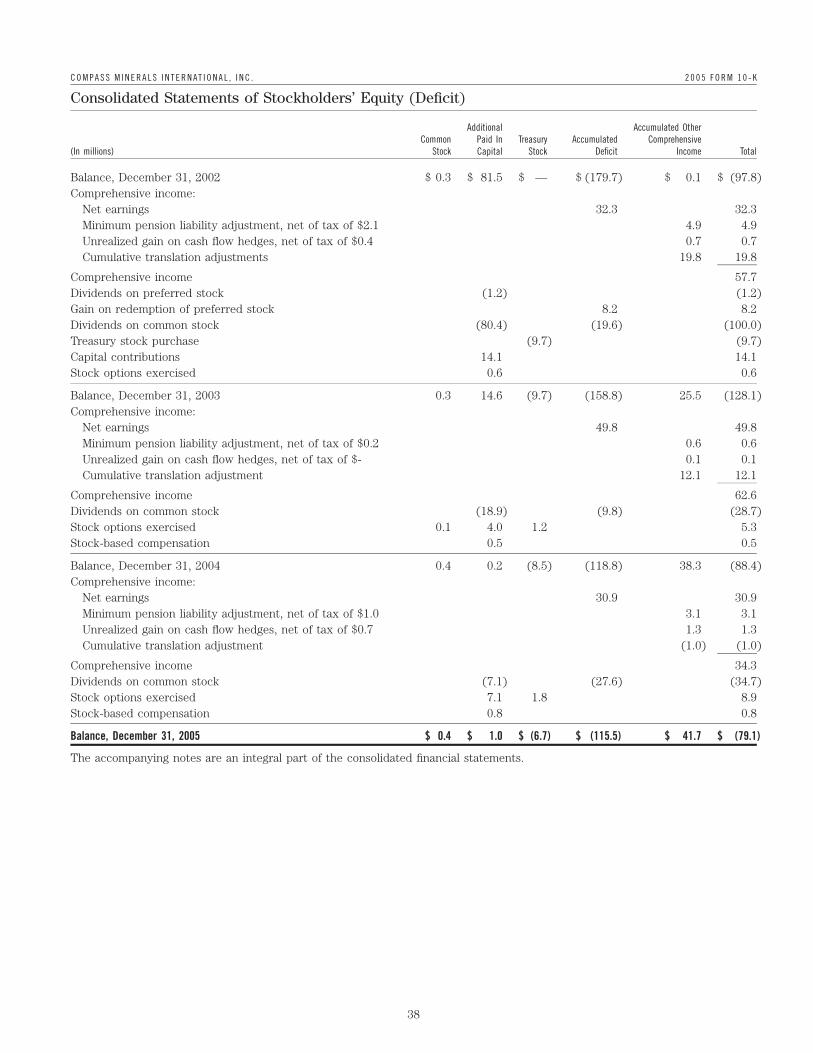
C O M P A S S M I N E R A L S I N T E R N AT I O N A L , I N C . 2 0 0 5 F O R M 1 0 - K
Consolidated Statements of Stockholders’ Equity (Deficit)
Additional Accumulated OtherCommon Paid In Treasury Accumulated Comprehensive
(In millions) Stock Capital Stock Deficit Income Total
Balance, December 31, 2002 $ 0.3 $ 81.5 $ — $ (179.7) $ 0.1 $ (97.8)Comprehensive income:
Net earnings 32.3 32.3Minimum pension liability adjustment, net of tax of $2.1 4.9 4.9Unrealized gain on cash flow hedges, net of tax of $0.4 0.7 0.7Cumulative translation adjustments 19.8 19.8
Comprehensive income 57.7Dividends on preferred stock (1.2) (1.2)Gain on redemption of preferred stock 8.2 8.2Dividends on common stock (80.4) (19.6) (100.0)Treasury stock purchase (9.7) (9.7)Capital contributions 14.1 14.1Stock options exercised 0.6 0.6
Balance, December 31, 2003 0.3 14.6 (9.7) (158.8) 25.5 (128.1)Comprehensive income:
Net earnings 49.8 49.8Minimum pension liability adjustment, net of tax of $0.2 0.6 0.6Unrealized gain on cash flow hedges, net of tax of $- 0.1 0.1Cumulative translation adjustment 12.1 12.1
Comprehensive income 62.6Dividends on common stock (18.9) (9.8) (28.7)Stock options exercised 0.1 4.0 1.2 5.3Stock-based compensation 0.5 0.5
Balance, December 31, 2004 0.4 0.2 (8.5) (118.8) 38.3 (88.4)Comprehensive income:
Net earnings 30.9 30.9Minimum pension liability adjustment, net of tax of $1.0 3.1 3.1Unrealized gain on cash flow hedges, net of tax of $0.7 1.3 1.3Cumulative translation adjustment (1.0) (1.0)
Comprehensive income 34.3Dividends on common stock (7.1) (27.6) (34.7)Stock options exercised 7.1 1.8 8.9Stock-based compensation 0.8 0.8
Balance, December 31, 2005 $ 0.4 $ 1.0 $ (6.7) $ (115.5) $ 41.7 $ (79.1)
The accompanying notes are an integral part of the consolidated financial statements.
38
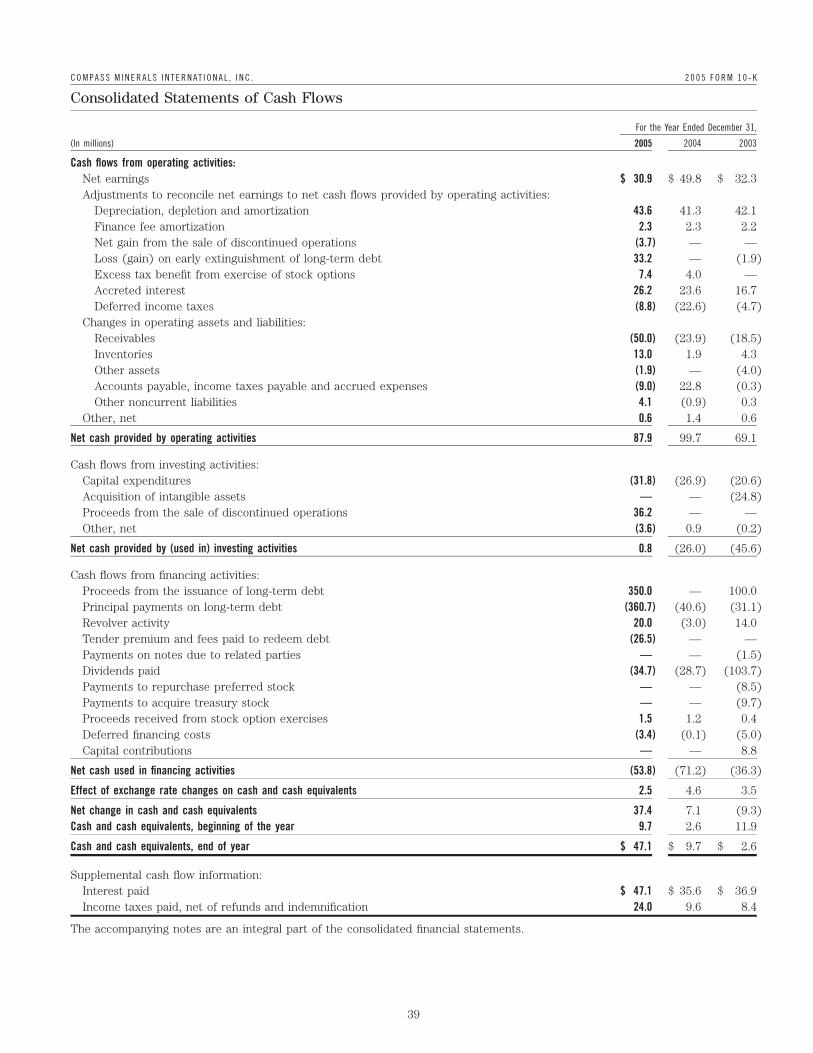
C O M P A S S M I N E R A L S I N T E R N AT I O N A L , I N C . 2 0 0 5 F O R M 1 0 - K
Consolidated Statements of Cash Flows
For the Year Ended December 31,
(In millions) 2005 2004 2003
Cash flows from operating activities:Net earnings $ 30.9 $ 49.8 $ 32.3Adjustments to reconcile net earnings to net cash flows provided by operating activities:
Depreciation, depletion and amortization 43.6 41.3 42.1Finance fee amortization 2.3 2.3 2.2Net gain from the sale of discontinued operations (3.7) — —Loss (gain) on early extinguishment of long-term debt 33.2 — (1.9)Excess tax benefit from exercise of stock options 7.4 4.0 —Accreted interest 26.2 23.6 16.7Deferred income taxes (8.8) (22.6) (4.7)
Changes in operating assets and liabilities:Receivables (50.0) (23.9) (18.5)Inventories 13.0 1.9 4.3Other assets (1.9) — (4.0)Accounts payable, income taxes payable and accrued expenses (9.0) 22.8 (0.3)Other noncurrent liabilities 4.1 (0.9) 0.3
Other, net 0.6 1.4 0.6
Net cash provided by operating activities 87.9 99.7 69.1
Cash flows from investing activities:Capital expenditures (31.8) (26.9) (20.6)Acquisition of intangible assets — — (24.8)Proceeds from the sale of discontinued operations 36.2 — —Other, net (3.6) 0.9 (0.2)
Net cash provided by (used in) investing activities 0.8 (26.0) (45.6)
Cash flows from financing activities:Proceeds from the issuance of long-term debt 350.0 — 100.0Principal payments on long-term debt (360.7) (40.6) (31.1)Revolver activity 20.0 (3.0) 14.0Tender premium and fees paid to redeem debt (26.5) — —Payments on notes due to related parties — — (1.5)Dividends paid (34.7) (28.7) (103.7)Payments to repurchase preferred stock — — (8.5)Payments to acquire treasury stock — — (9.7)Proceeds received from stock option exercises 1.5 1.2 0.4Deferred financing costs (3.4) (0.1) (5.0)Capital contributions — — 8.8
Net cash used in financing activities (53.8) (71.2) (36.3)
Effect of exchange rate changes on cash and cash equivalents 2.5 4.6 3.5
Net change in cash and cash equivalents 37.4 7.1 (9.3)Cash and cash equivalents, beginning of the year 9.7 2.6 11.9
Cash and cash equivalents, end of year $ 47.1 $ 9.7 $ 2.6
Supplemental cash flow information:Interest paid $ 47.1 $ 35.6 $ 36.9Income taxes paid, net of refunds and indemnification 24.0 9.6 8.4
The accompanying notes are an integral part of the consolidated financial statements.
39
C O M P A S S M I N E R A L S I N T E R N AT I O N A L , I N C . 2 0 0 5 F O R M 1 0 - K
Notes to Consolidated Financial Statements
1. ORGANIZATION AND FORMATION c. Discontinued Operations – On December 30, 2005, Com-pass sold its evaporated salt business in the U.K. Accordingly,
Compass Minerals International, Inc. (‘‘CMI,’’ ‘‘Compass’’ orthe results of operations from this business have been
the ‘‘Company’’), is a producer and marketer of inorganicreclassified to discontinued operations in the Consolidated
mineral products with manufacturing sites in North AmericaStatements of Operations and related notes for all periods
and Europe. Its principal products are salt and sulfate ofpresented. Interest from the portion of debt carried to
potash (‘‘SOP’’). CMI serves a variety of markets, includingsupport the operations of the Company has been allocated to
highway deicing, agriculture, food processing, chemicaldiscontinued operations based on its proportionate amount of
processing and water conditioning. The consolidated financialnet assets available to service that debt. While the net assets
statements include the accounts of CMI, formerly Saltof this business are not included on the Consolidated Balance
Holdings Corporation, and its wholly owned subsidiary, Com-Sheet as of December 31, 2005, the amounts reported at
pass Minerals Group, Inc. (‘‘CMG’’) and the consolidatedDecember 31, 2004 and related notes include the net assets
results of CMG’s wholly owned subsidiaries. CMG’s primaryof the business. See Note 13 for further discussion, including
operating subsidiaries include those entities listed below:disclosure of the carrying amounts of assets and liabilities
( North American Salt Company (‘‘NASC’’) included in the Consolidated Balance Sheet and related notes( Carey Salt Company at December 31, 2004.( Sifto Canada Corp. (‘‘Sifto’’)
d. Foreign Currency Translation – Assets and liabilities are( Great Salt Lake Minerals Corporation
translated into U.S. dollars at end of period exchange rates.( Salt Union Limited U.K. (‘‘SUL’’) and subsidiaries
Revenues and expenses are translated using the average ratesOn November 28, 2001, Apollo Management V, L.P. of exchange for the year. Adjustments resulting from the
(‘‘Apollo’’), through its subsidiary YBR Holdings LLC (‘‘YBR translation of foreign-currency financial statements into theHoldings’’), acquired control of CMI from Mosaic Global reporting currency, U.S. dollars, are included in accumulatedHoldings Inc. (‘‘Mosaic’’), formerly IMC Global, Inc., pursuant other comprehensive income. Aggregate exchange (gains) lossesto a recapitalization transaction (‘‘Recapitalization’’) with from transactions denominated in a currency other than theassets and liabilities of CMG retaining their historical value. company’s functional currency included in other expense forFollowing the Recapitalization, Apollo, co-investors and man- the years ended December 31, 2005, 2004 and 2003, wereagement owned approximately 81% of the outstanding com- $6.1 million, $6.9 million and $3.9 million, respectively.mon stock of CMI and Mosaic owned approximately 19% of
e. Revenue Recognition – The Company sells mineral prod-the outstanding common stock of CMI.ucts, primarily salt and SOP. Revenue is recognized by theIn December 2003, the Company completed an initial publicCompany at the time of shipment to the customer, whichoffering of 16,675,000 shares of its common stock, par valuecoincides with the transfer of title and risk of ownership to$.01 per share, at an initial public offering price of $13.00 perthe customer. Sales represent billings to customers net ofshare. Apollo and Mosaic each sold portions of their holdings ofsales taxes charged for the sale of the product. Sales includethe Company’s common stock, which reduced the ownership ofshipping and handling costs which are expensed when theApollo and Apollo co-investors, management, and Mosaic torelated product is sold.approximately 35%, 11% and 2%, respectively.
In July and November 2004, Apollo and Mosaic sold their f. Cash and Cash Equivalents – The Company considers allremaining equity interests in CMI in two separate secondary investments with original maturities of three months or less tostock offerings. be cash equivalents. The Company maintains the majority of
its cash in bank deposit accounts with several commercial2. SUMMARY OF SIGNIFICANT ACCOUNTING POLICIESbanks with high credit ratings in the U.S., Canada and
a. Management Estimates – The preparation of financial Europe. The Company does not believe it is exposed to anystatements in conformity with generally accepted accounting significant credit risk on cash and cash equivalents.principles, or ‘‘GAAP,’’ requires management to make esti-
g. Accounts Receivable and Allowance for Doubtfulmates and assumptions that affect the amounts reported inAccounts – Receivables consist almost entirely of tradethe consolidated financial statements and accompanyingaccounts receivables. Trade accounts receivable are recordednotes. Actual results could differ from those estimates.at the invoiced amount and do not bear interest. The
b. Basis of Consolidation – The Company’s consolidated allowance for doubtful accounts is our best estimate of thefinancial statements include the accounts of the Company, amount of probable credit losses in our existing accountswhich include its wholly-owned domestic and foreign subsidi- receivable. We determine the allowance based on historicalaries. All significant intercompany balances and transactions write-off experience by business line. We review our allow-have been eliminated. ance for doubtful accounts periodically and significant bal-
ances past due are reviewed for collectibility. Account
40
C O M P A S S M I N E R A L S I N T E R N AT I O N A L , I N C . 2 0 0 5 F O R M 1 0 - K
balances are charged off against the allowance when the The Company’s other fixed assets are amortized on aCompany believes it is probable that the receivable will not be straight-line basis over their respective lives. The followingrecovered. We do not have off-balance-sheet credit exposure table summarizes the estimated useful lives of our property,related to our customers. plant and equipment:
h. Inventories – Inventories are stated at the lower of cost or Land improvements 10 to 20 yearsmarket. Finished goods and raw material and supply costs are Buildings and structures 20 to 40 yearsvalued using the average cost method. Raw materials and Leasehold and building improvements 10 to 20 yearssupplies primarily consist of raw materials purchased to aid in Machinery and equipment — vehicles 3 to 10 yearsthe production of our mineral products, maintenance materi-
Machinery and equipment — other mining andals and packaging materials. Finished goods are comprised of production 10 to 15 yearssalt and SOP products readily available for sale. All costs Furniture and fixtures 3 to 10 yearsassociated with the production of salt and SOP at our
Mineral interests 20 to 99 yearsproducing locations are captured as inventory costs. Addition-ally, since our products are often stored at third-party The Company recognizes and measures obligations relatedwarehousing locations, we include in the cost of inventory the to the retirement of tangible long-lived assets in accordancefreight and handling costs necessary to move the product to with Statement of Financial Accounting Standardsstorage until the product is sold to a customer. (SFAS) No. 143, ‘‘Accounting for Obligations Associated with
the Retirement of Long-Lived Assets.’’ Retirement obligationsi. Property, Plant and Equipment – Property, plant and
are not material to the Company’s financial position, results ofequipment are stated at cost and include interest on fundsoperations or cash flows.borrowed to finance construction. The costs of replacements
To review for possible impairments, the Company usesor renewals which improve or extend the life of existingmethodology prescribed in SFAS No. 144, ‘‘Accounting for theproperty are capitalized. Maintenance and repairs areImpairment or Disposal of Long-Lived Assets.’’ The Companyexpensed as incurred. Upon retirement or disposition of anreviews long-lived assets and the related intangible assets forasset, any resulting gain or loss is included in operations.impairment whenever events or changes in circumstancesProperty, plant and equipment also includes mineralindicate the carrying amounts of such assets may not beinterests. The Company leases probable mineral reserves atrecoverable. If an indication of a potential impairment exists,several of its extraction facilities. These leases have varyingrecoverability of the respective assets is determined byterms, and many provide for a royalty payment to the lessorcomparing the forecasted undiscounted net cash flows of thebased on a specific amount per ton of mineral extracted or asoperation to which the assets relate, to the carrying amount,a percentage of revenue. The Company’s rights to extractincluding associated intangible assets, of such operation. Ifminerals are contractually limited by time. However, thethe operation is determined to be unable to recover theCompany believes it will be able to continue to extend leasecarrying amount of its assets, then intangible assets areagreements as it has in the past, at commercially reasonablewritten down first, followed by the other long-lived assets ofterms, without incurring substantial costs or material modifi-the operation, to fair value. Fair value is determined based oncations to the existing lease terms and conditions, anddiscounted cash flows or appraised values, depending upontherefore, believes that assigned lives are appropriate. Thethe nature of the assets.Company’s leased mineral interests are primarily amortized on
a units-of-production basis over the respective estimated lives j. Other Intangible Assets – The Company follows the rulesof mineral deposits not to exceed 99 years. The weighted on accounting for intangible assets as set forth inaverage amortization period for these probable mineral SFAS No. 142. Under these rules, intangible assets deemed toreserves is 91 years as of December 31, 2005. The Company have indefinite lives are not amortized but are subject toalso owns other mineral properties. The weighted average life annual impairment tests in accordance with the Statements.for these probable owned mineral reserves is 55 years as of The Company’s other intangible assets are amortized overDecember 31, 2005. their estimated useful lives that range from 5 to 25 years.
Buildings and structures are depreciated on a straight linek. Other Noncurrent Assets – Other noncurrent assets includebasis over lives generally ranging from 20 to 40 years.deferred financing costs of $11.0 million and $24.0 million netPortable buildings generally have shorter lives than perma-of accumulated amortization of $2.2 million and $6.8 millionnent structures. Leasehold and building improvements haveas of December 31, 2005 and 2004, respectively. Deferredshorter estimated lives of 10 to 20 years or lower based onfinancing costs are being amortized to interest expense on athe life of the lease to which the improvement relates.straight-line basis over the terms of the debt to which thecosts relate.
41

C O M P A S S M I N E R A L S I N T E R N AT I O N A L , I N C . 2 0 0 5 F O R M 1 0 - K
Certain inventories of spare parts and related inventory of n. Equity Compensation Plans – CMI has equity compensa-approximately $8.4 million and $9.1 million at December 31, tion plans administered by the board of directors of CMI,2005 and 2004, respectively, which will be utilized with whereby stock options and restricted stock units are availablerespect to long-lived assets, have been classified in the for grant to employees of, consultants to, or directors of CMI.consolidated balance sheets as other noncurrent assets. CMI adopted the fair value recognition method of accounting
for its equity-based awards pursuant to SFAS 123, ‘‘Account-l. Income Taxes – The Company accounts for income taxes
ing for Stock-Based Compensation’’ effective January 1, 2003.using the liability method in accordance with the provisions of
Under that method, the fair value of an award is recognized inSFAS No. 109, ‘‘Accounting for Income Taxes.’’ Under the
earnings over the vesting period. The fair value is determinedliability method, deferred taxes are determined based on the
on the day of grant using the Black Scholes option-pricingdifferences between the financial statement and the tax basis
model. The Company recorded approximately $0.2 million,of assets and liabilities using enacted tax rates in effect in the
$0.3 million and $0.2 million of compensation expense net ofyears in which the differences are expected to reverse. The
income taxes, during 2005, 2004 and 2003, respectively, forCompany’s foreign subsidiaries file separate company returns
stock options and restricted stock units. See Note 11 forin their respective jurisdictions.
additional discussion.In evaluating our ability to realize our deferred tax assets,
we consider the sources and timing of taxable income, o. Earnings per Share – Basic and diluted earnings per shareincluding the reversal of existing temporary differences, the are presented for net earnings available for common stock.ability to carryback tax attributes to prior periods, qualifying Basic earnings per share is computed by dividing net earningstax-planning strategies, and estimates of future taxable available for common stock by the weighted-average numberincome exclusive of reversing temporary differences. In of outstanding common shares during the period includingdetermining future taxable income, our assumptions include participating securities with distribution rights equal to com-the amount of pre-tax operating income according to different mon stockholders. Diluted earnings per share reflects thestate, federal and international taxing jurisdictions, the origi- potential dilution that could occur under the treasury stocknation of future temporary differences, and the implementa- method of calculating the weighted-average number of out-tion of feasible and prudent tax-planning strategies. standing common shares (i.e. assuming proceeds from the
If we determine that a portion of our deferred tax assets potential exercise of employee stock options are used towill not be realized, a valuation allowance is recorded in the repurchase common stock).period that such determination is made. In the future, if we
p. Derivatives – The Company accounts for derivative finan-determine, based on the existence of sufficient evidence, that
cial instruments in accordance with SFAS No. 133, ‘‘Account-more or less of our deferred tax assets are more-likely-than-
ing for Derivative Instruments and Hedging Activities,’’ asnot to be realized, an adjustment to the valuation allowance
amended, which requires companies to record derivativewill be made in the period such a determination is made.
financial instruments as assets or liabilities measured at fairWe recognize potential liabilities in accordance with
value. Accounting for the changes in the fair value of aSFAS 5 for anticipated tax issues in the U.S. and other tax
derivative depends on its designation and effectiveness.jurisdictions based on our estimate of whether, and the extent
Derivatives qualify for treatment as hedges when there is ato which, additional taxes will be due. If payment of these
high correlation between the change in fair value of theamounts ultimately proves to be unnecessary, the reversal of
derivative instrument and the related change in value of thethe liabilities would result in tax benefits being recognized in
underlying hedged item. For qualifying hedges, the effectivethe period when we determine the liabilities are no longer
portion of the change in fair value is recognized throughnecessary. If our estimate of tax liabilities proves to be less
earnings when the underlying transaction being hedgedthan the ultimate assessment, a further charge to expense
affects earnings, allowing a derivative’s gains and losses towould result.
offset related results from the hedged item on the incomem. Environmental Costs – Environmental costs, other than statement. For derivative instruments that are not accountedthose of a capital nature, are accrued at the time the for as hedges, or for the ineffective portions of qualifyingexposure becomes known and costs can be reasonably hedges, the change in fair value is recorded through earningsestimated. Costs are accrued based upon management’s in the period of change. Companies must formally document,estimates of all direct costs, after taking into account designate, and assess the effectiveness of transactions thatreimbursement by third parties. The Company does not receive hedge accounting initially and on an on-going basis.accrue liabilities for unasserted claims that are not probable The Company does not engage in trading activities with itsof assertion. The Company’s environmental accrual was financial instruments.$2.2 million and $2.3 million as of December 31, 2005 and The Company is exposed to the impact of fluctuations in2004, respectively. the purchase price of natural gas consumed in operations.
The Company hedges its risk of changes in natural gas pricesthrough the use of swap agreements. The Company also usesan interest rate swap agreement to hedge the variability of a
42
C O M P A S S M I N E R A L S I N T E R N AT I O N A L , I N C . 2 0 0 5 F O R M 1 0 - K
portion of its future interest payments on its variable rate in the statement of cash flows. The Company has recognizeddebt. All of these derivative instruments held by the Company compensation expense for the fair value of stock-basedas of December 31, 2005 and 2004 qualify as cash flow hedges compensation in its financial statements in accordance withand accordingly, the change in fair value of the swaps, net of the fair value method SFAS 123 for all periods presented,applicable taxes, is recorded to other comprehensive income although we have historically included excess tax benefits asuntil the underlying transaction affects earnings. an operating cash flow. The Company will adopt SFAS 123(R)
in the first quarter of 2006, using the modified prospectiveq. Concentration of Credit Risk – The Company sells its salt
method. The adoption of SFAS 123(R) is not expected toproducts to various governmental agencies, manufacturers,
have a material impact on the Company’s financial position ordistributors and retailers primarily in the Midwestern United
results of operations.States, and throughout Canada and the United Kingdom. The
In March 2005, the SEC staff issued additional guidance onCompany’s potash products are sold across North America
SFAS 123(R) in the form of Staff Accounting Bulletin (‘‘SAB’’)and internationally. No single customer or group of affiliated
No. 107. SAB 107 was issued to assist preparers by simplify-customers accounted for more than 10% of the Company’s
ing some of the implementation challenges of FAS 123(R)sales in any year during the three year period ended
while enhancing the information that investors receive.December 31, 2005, or for more than 10% of accounts
SAB 107 creates a framework that is premised on tworeceivable at December 31, 2005 or 2004.
themes: (a) considerable judgment will be required byr. Recent Accounting Pronouncements – In November 2004, preparers to successfully implement FAS 123(R), specificallythe FASB issued SFAS No. 151, ‘‘Inventory Costs — an amend- when valuing employee stock options; and (b) reasonablement of ARB No. 43, Chapter 4,’’ that is effective for the individuals, acting in good faith, may conclude differently onCompany beginning in the first quarter of 2006. This Statement the fair value of employee stock options. Key topics coveredamends the guidance in Accounting Research Bulletin (‘‘ARB’’) by SAB 107 include: (a) valuation models — SAB 107 rein-No. 43, Chapter 4, ‘‘Inventory Pricing,’’ to clarify the account- forces the flexibility allowed by FAS 123(R) to choose aning for abnormal amounts of idle facility expense, freight, option-pricing model that meets the standard’s fair valuehandling costs, and wasted material (spoilage). Paragraph 5 of measurement objective; (b) expected volatility — the SABARB 43, Chapter 4, previously stated that ‘‘...under some provides guidance on when it would be appropriate to relycircumstances, items such as idle facility expense, excessive exclusively on either historical or implied volatility in estimat-spoilage, double freight, and rehandling costs may be so ing expected volatility; and (c) expected term — the newabnormal as to require treatment as current period charges... .’’ guidance includes examples and some simplified approachesThis Statement requires that those items be recognized as to determining the expected term under certain circum-current-period charges regardless of whether they meet the stances. The Company will apply the principles of SAB 107 incriterion of ‘‘so abnormal.’’ In addition, this Statement requires conjunction with its adoption of SFAS 123(R).that allocation of fixed production overheads to the costs of
3. INVENTORIES conversion be based on the normal capacity of the productionfacilities. The adoption of SFAS No. 151 is not expected to Inventories consist of the following at December 31have a material impact on the Company’s financial position, (in millions):results of operations or cash flows.
2005 2004In December 2004, the FASB issued SFAS No. 123(R),Finished goods $67.7 $83.4‘‘Share-Based Payment’’. SFAS 123(R) is a revision of SFASRaw materials and supplies 13.8 12.9No. 123, ‘‘Accounting for Stock Based Compensation,’’ and
supersedes Accounting Principles Board Opinion No. 25 Total inventories $81.5 $96.3
(‘‘APB 25’’), ‘‘Accounting for Stock Issued to Employees.’’4. PROPERTY PLANT AND EQUIPMENTAmong other items SFAS 123(R) eliminates the use of APB
25 and the intrinsic value method of accounting, and requires At December 31, 2005, mineral interests include leasedcompanies to follow guidance previously set forth in SFAS 123 probable mineral reserves and owned mineral properties ofand recognize the cost of employee services received in approximately $152.2 million and $25.8 million, respectively,exchange for awards of equity instruments, based on the with accumulated depletion of $11.9 million and $15.2 million,grant date fair value of those awards, in the financial respectively. At December 31, 2004, mineral interests totaledstatements. Additionally, SFAS 123(R) requires any actual tax approximately $180.1 million with accumulated depletion ofbenefits realized in excess of the benefit related to accrued $25.9 million.compensation expense to be classified as a financing cash flow
43
C O M P A S S M I N E R A L S I N T E R N AT I O N A L , I N C . 2 0 0 5 F O R M 1 0 - K
Property, plant and equipment consists of the following at The following table summarizes components of incomeDecember 31 (in millions): from continuing operations before taxes and the effects of
significant adjustments to tax computed at the federal2005 2004
statutory rate for the years ended December 31 (in millions):Land and Buildings $ 137.6 $143.6Machinery and equipment 403.8 436.8 2005 2004 2003Furniture and fixtures 13.3 11.5 Domestic income $ 0.5 $22.1 $17.9Mineral interests 178.0 180.1 Foreign income 42.1 29.9 15.9Construction in progress 12.6 5.0
Income from continuing operations745.3 777.0 before tax $ 42.6 $52.0 $33.8
Less accumulated depreciation and depletion (379.2) (374.1)Computed tax at the federal statutory
Property, plant and equipment, net $ 366.1 $402.9 rate of 35% $ 14.9 $18.2 $11.8Foreign income, mining, and withholding
5. INTANGIBLE ASSETS taxes 0.5 1.5 3.7Percentage depletion in excess of basis (6.2) (6.1) (5.1)
In June 2003, the Company purchased, for $24.8 million, Reversal of previously recorded incomeintangible assets related to Mosaic’s SOP marketing business tax reserves (5.9) — —
Foreign currency exchange gain 5.4 — —including customer lists related to its Carlsbad, New MexicoRepatriation of foreign earnings 4.1 — —SOP product line and rights to produce SOP at Mosaic’sState income taxes, net of federal incomeCarlsbad, New Mexico facility as discussed in Note 16. The
tax benefit 0.3 (0.1) (3.1)Company allocated approximately $0.5 million to a long-term Change in valuation allowance on deferredcustomer contract and the remaining $24.3 million to the tax assets (2.2) (12.2) (5.7)
Non-deductible interest expense 1.4 1.2 0.8rights to produce SOP at Mosaic’s Carlsbad facility. EachOther 3.5 1.7 0.5intangible asset is amortized on a straight-line basis over its
respective life, five years (through 2008) for the long-term Provision for income taxes $ 15.8 $ 4.2 $ 2.9
sales contract and 25 years (through 2028) for the rights toEffective tax rate 37% 8% 9%
produce SOP at Mosaic’s facility. Neither asset has a residualvalue. Under SFAS No. 109 deferred tax assets and liabilities are
The accumulated amortization of the intangible assets for recognized for the estimated future tax effects, based onthe years ended December 31, 2005 and 2004 was approxi- enacted tax law, of temporary differences between the valuesmately $2.3 million and $1.2 million, respectively. Amortiza- of assets and liabilities recorded for financial reporting and fortion expense of approximately $1.1 million was recorded tax purposes and of net operating loss and other carryfor-during each of the years ended December 31, 2005 and 2004 wards. Significant components of the Company’s deferred taxand $0.1 million was recorded during the year ended assets and liabilities were as follows at December 31December 31, 2003. Amortization expense for fiscal 2006 (in millions):through fiscal 2008 is estimated to be approximately $1.1 mil-
2005 2004lion annually and $1.0 million annually thereafter.Current deferred taxes:
6. INCOME TAXES Deferred tax assets:Net operating loss carryforwards $ 5.3 $ 3.0
The following table summarizes the Company’s income tax Accrued expenses 3.2 5.2provision related to earnings from continuing operations for Other assets 4.2 5.5the years ended December 31 (in millions):
Current deferred tax assets $ 12.7 $13.7
2005 2004 2003 Non-current deferred taxes:Property, plant and equipment $ 83.4 $89.5Current:
Federal $ 13.8 $ 8.6 $ 1.5 Total deferred tax liabilities 83.4 89.5State 1.5 1.4 0.3
Deferred tax assets:Foreign 9.3 16.8 5.8Net operating loss carryforwards 21.6 29.3
Total current 24.6 26.8 7.6 Alternative minimum tax credit carryforwards 6.2 4.9Deferred: Interest on discount notes 21.2 7.5
Federal (5.7) (16.5) (4.8) Purchase agreement (Note 10) 1.4 1.8State (0.4) (1.4) (3.2) Other assets, net (0.3) 3.5Foreign (2.7) (4.7) 3.3
Subtotal 50.1 47.0Total deferred (8.8) (22.6) (4.7) Valuation allowance (10.4) (12.6)
Total provision for income taxes $ 15.8 $ 4.2 $ 2.9 Total deferred tax assets 39.7 34.4
Net non-current deferred tax liabilities $ 43.7 $55.1
44
C O M P A S S M I N E R A L S I N T E R N AT I O N A L , I N C . 2 0 0 5 F O R M 1 0 - K
At December 31, 2005, the Company has net operating loss of these amounts ultimately proves to be unnecessary, thecarryforwards of approximately $70.3 million. The Company is a reversal of the liabilities would result in tax benefits beingloss corporation as defined in Section 382 of the Internal recognized in the period when the Company determines theRevenue Code. The Company has previously incurred three liabilities are no longer necessary. If the Company’s estimateownership changes placing annual limitations on the utilization of of tax liabilities proves to be less than the ultimate assess-each loss carryforward. If not utilized, these carryforwards expire ment, a further charge to expense would result.between 2006 and 2022. The Company also has a U.S. federal In 2003, in accordance with the merger agreement relatedalternative minimum tax credit carryforward at December 31, to the Recapitalization, Mosaic indemnified the Company for2005 of approximately $6.2 million. This credit carryforward may approximately $14.1 million for income taxes related tobe carried forward indefinitely to offset any excess of regular tax periods prior to the Recapitalization. The Company hadliability over alternative minimum tax liability. previously recognized income tax expense for these items.
The Company has recorded a valuation allowance for a The Company recorded the indemnification as a reduction toportion of its deferred tax asset relating to net operating loss income taxes provided for in prior years and an increase tocarryforwards that it does not believe will, more likely than additional paid in capital. The Company received $8.8 millionnot, be realized. As of December 31, 2005 and 2004, the from Mosaic in 2003 and used the cash to pay income taxesCompany’s valuation allowance was $10.4 million and for periods prior to Recapitalization.$12.6 million, respectively. The $2.2 million reduction in the
American Jobs Creation Act of 2004 — Repatriation ofvaluation allowance in 2005 was primarily due to our ability to
Foreign Earnings – The Company maintains undistributedutilize more net operating loss carryforwards annually and the
foreign earnings outside of the United States in Canada andprojected timing of future taxable income, exclusive of
the United Kingdom. Most of the amounts held outside thereversals of taxable temporary differences. In the future, if
U.S. could be repatriated to the U.S., but, under current law,the Company determines, based on existence of sufficient
would be subject to U.S. federal income taxes, less applicableevidence, that it should realize more or less of its deferred
realizable foreign tax credits, if any. Prior to the fourthtax assets, an adjustment to the valuation allowance will be
quarter of 2005, the Company had not provided for the U.S.made in the period such a determination is made.
federal tax liability on these amounts for financial statementDuring 2005, the Internal Revenue Service and Canada
purposes, since these foreign earnings were consideredRevenue Agency developed a framework to minimize the
indefinitely reinvested outside the U.S.inconsistent treatment of tax matters involving the two taxing
The American Jobs Creation Act of 2004, enacted onauthorities. The event resulted in a change in certain tax
October 22, 2004 (the ‘‘Jobs Act’’), provides for a temporaryestimates by management. Accordingly, in 2005, the Company
85% dividends received deduction on certain foreign earningsreversed previously recorded income tax reserves of $5.9 mil-
repatriated during a one-year period. The deduction wouldlion related to matters previously determined to have an
result in an approximate 5.25% federal tax rate on theuncertain outcome.
repatriated earnings. To qualify for the deduction, the earn-Also in 2005, the Company repatriated funds from its U.K.
ings must be reinvested in the U.S. pursuant to a domesticsubsidiary through a one-time repayment of a portion of a
reinvestment plan established by a company’s chief executivepound-sterling-denominated loan to a U.S. subsidiary. The
officer and approved by its board of directors. Certain otherrepayment resulted in a foreign exchange gain for tax
criteria in the Jobs Act must be satisfied as well. During thepurposes only, which is taxable in the U.S. and for which the
fourth quarter of 2005 the Company’s Chief Executive OfficerCompany recorded a $5.4 million charge to income tax
established a domestic reinvestment plan which was approvedexpense. The previously unrealized foreign exchange gain was
by the board of directors, and management determined therecorded as a component of accumulated other comprehen-
Company would repatriate $70 million of qualifying foreignsive income in stockholders’ equity in previous periods and
earnings before the end of its February 28, 2006 tax year.does not appear in the consolidated statements of operations.
Accordingly, during the fourth quarter of 2005, the CompanyDuring 2004, management determined a valuation allow-
recorded income tax expense of approximately $4.1 millionance against deferred tax assets, in the amount of $12.2 mil-
for this repatriation. Use of the funds will be governed by alion, was no longer necessary based on an assessment of
domestic reinvestment plan, as required by the Jobs Act.potential sources of future taxable income other than future
The distribution was funded in January 2006 with cash onreversals of existing taxable temporary differences. As a
hand and short-term borrowings against the global revolvingresult, the Company reduced its valuation allowance resulting
credit facility. The Company expects its foreign cash flowsin a decrease in income tax expense during 2004.
will be sufficient to repay the foreign debt and replenishThe calculation of the Company’s tax liabilities involves
foreign cash balances through the normal course of business.dealing with uncertainties in the application of complex tax
The Company utilizes a variety of tax planning and financingregulations in multiple jurisdictions. The Company recognizes
strategies in an effort to ensure that the Company’s world-potential liabilities for anticipated tax issues in the U.S. and
wide cash is available in the locations in which it is needed.other tax jurisdictions based on its estimate of whether, andthe extent to which, additional taxes will be due. If payment
45
C O M P A S S M I N E R A L S I N T E R N AT I O N A L , I N C . 2 0 0 5 F O R M 1 0 - K
Excluding the Jobs Act repatriation, the Company esti- duration closely matching the benefit payments under ourmates that its remaining indefinitely reinvested earnings for plan. Assumed salary increases are set considering thewhich no U.S. federal tax liability has been recognized is statutory provisions that are used to calculate the actualapproximately $50.0 million at December 31, 2005. pension benefits in the U.K.
The following benefit payments, which reflect expected7. PENSION PLANS AND OTHER BENEFITS
future service, as appropriate, are expected to be paidThe Company has two defined benefit pension plans for (in millions):certain of its U.K. and U.S. employees. The size of the
Future ExpectedU.S. plan is not significant as compared to the U.K. plan. The Calendar Year Benefit PaymentsU.K. plan was closed to new participants in 1992. Benefits of 2006 $2.0the U.K. plan are based on a combination of years of service 2007 2.1and compensation levels. 2008 2.1
2009 2.3The Company’s funding policy is to make the minimum2010 2.4annual contributions required by applicable regulations. Man-2011 — 2015 12.1
agement expects total contributions during 2006 will beapproximately $5.6 million, including a special contribution of The following table sets forth pension obligations and planapproximately $4.0 million to fund the portion of the assets for the Company’s defined benefit plans, based on aU.K. plan for past benefits expected to be paid to the former November 30 measurement date, as of December 31employees of the U.K. evaporated salt business that was sold (in millions):on December 30, 2005. During the years ended December 31,
2005 20042005, 2004 and 2003, contributions to the plans totaledChange in benefit obligation:approximately $1.8 million, $1.9 million and $1.6 million,
Benefit obligation as of January 1 $ 70.8 $ 61.8respectively.Service cost 1.3 1.2
The pension plan assets are managed by external invest- Interest cost 3.6 3.3ment managers. The investment strategy is to maximize Actuarial loss 3.9 2.1return on investments while minimizing risk. This is accom- Benefits paid (2.1) (1.8)
Currency fluctuation adjustment (7.1) 4.1plished by investing in high-grade equity and debt securities.Other 0.5 0.1Policy requires that equity securities comprise approximately
Benefit obligation as of December 31 $ 70.9 $ 70.875% of the total portfolio, and that approximately 25% beinvested in debt securities. The weighted-average asset
Change in plan assets:allocations by asset category are as follows:
Fair value as of January 1 $ 54.6 $ 46.0Actual return 9.2 5.4Plan Assets at December 31,Company contributions 1.8 1.7Asset Category 2005 2004Currency fluctuation adjustment (5.6) 3.1
Cash and cash equivalents 3% 3%Benefits paid (2.1) (1.8)
Equity Securities 72 72Other 0.3 0.2
Debt Securities 25 25Fair value as of December 31 $ 58.2 $ 54.6
Total 100% 100%
Funded status of the plans $ (12.7) $(16.2)The assumptions used in determining pension information Unrecognized net (gain) loss 9.9 13.5
Unrecognized prior service cost 0.2 —for the plans for the years ended December 31 were asUnrecognized transition liability 0.2 0.5follows:
Net amount recognized $ (2.4) $ (2.2)2005 2004 2003
Discount rate 5.25% 5.25% 5.25% Amounts recognized in the balance sheet:Expected return on plan assets 6.70 6.25 6.25 Accrued benefit liability $ (7.7) $(11.7)Rate of compensation increase 2.75 2.75 2.75 Other noncurrent assets 0.4 0.5
Accumulated other comprehensive loss 4.9 9.0
The overall expected long-term rate of return on assets is Net amount recognized $ (2.4) $ (2.2)a weighted-average expectation for the return on plan assetsbased on the targeted and expected portfolio composition. The accumulated benefit obligations for the defined benefitThe Company considers historical performance and current pension plans were $66.0 million and $66.1 million, as ofbenchmarks to arrive at expected long-term rates of return in December 31, 2005 and 2004, respectively. The accumulatedeach asset category. We set our discount rate for the benefit obligations are in excess of the plans’ assets.U.K. plan based on AA corporate bond yields with an average
46
C O M P A S S M I N E R A L S I N T E R N AT I O N A L , I N C . 2 0 0 5 F O R M 1 0 - K
The components of net pension expense were as follows Company incurs participation fees related to its outstandingfor the years ended December 31 (in millions): letters of credit and commitment fees on its available
borrowing capacity. The rates vary depending on CMG’s2005 2004 2003
leverage ratio. Bank fees are not material.Service cost for benefits earned during the year $ 1.3 $1.2 $1.4 In December 2005, CMI completed a tender offer andInterest cost on projected benefit obligation 3.6 3.3 2.9
redeemed $323.0 million of its 10% Senior SubordinatedReturn on plan assets (3.5) (2.9) (2.2)Notes (‘‘Senior Subordinated Notes’’) due 2011, incurring aNet amortization and deferral 0.7 0.6 1.1
Other 0.1 — — tender premium and related fees totaling $26.5 million.Additionally, we expensed $6.7 million of deferred financingNet pension expense $ 2.2 $2.2 $3.2fees, net of the unamortized issuance premium, associatedwith these notes and the old credit facility. The $33.2 millionThe Company has defined contribution and pre-tax savingsof loss on early extinguishment of debt is classified in Other,plans (Savings Plans) for certain of its employees. Under eachnet in the Consolidated Statements of Operations. Theof the Savings Plans, participants are permitted to defer aremaining $2 million of Senior Subordinated Notes are callableportion of their compensation. Company contributions to thein August 2006.Savings Plans are based on a percentage of employee
The Company’s Senior Discount Notes due 2012 (‘‘Seniorcontributions. Additionally, certain of the Company’s SavingsDiscount Notes’’) accrete non-cash interest at an annual ratePlans have a profit sharing feature for salaried and non-unionof 12 3/4% through December 15, 2007, thereby increasing thehourly employees. The Company contribution to the profit-aggregate principal balance of the notes to $123.5 million bysharing feature is based on the employee’s age and pay andDecember 15, 2007. The Senior Discount Notes may bethe Company’s financial performance. Expense attributable toredeemed in whole or in part from time to time, on or afterthese Savings Plans was $5.5 million, $5.1 million andDecember 15, 2007, at specified redemption prices. Cash$4.1 million for the years ended December 31, 2005, 2004 andinterest will accrue on the Senior Discount Notes at a rate of2003, respectively.12 3/4% per annum, beginning December 15, 2007. As of
8. LONG TERM DEBTDecember 31, 2005, the book value of the Senior DiscountNotes was $97.1 million.During the fourth quarter of 2005, CMG entered into a new
On May 22, 2003, CMI issued $179.6 million in aggregate$475 million senior secured credit agreement (‘‘Credit Agree-principal amount at maturity ($100.0 million in gross pro-ment’’) with a syndicate of financial institutions, amendingceeds) of 12% senior subordinated discount notes due 2013and restating the existing credit facilities. The new Credit(‘‘Subordinated Discount Notes’’) in a private placement.Agreement consists of a $350 million term loan (‘‘Term Loan’’)These notes accrete non-cash interest at an annual rate 12%and a $125 million revolving credit facility (‘‘Revolving Creditthrough June 1, 2008, thereby increasing the aggregateFacility’’), of which $40 million may be drawn in Canadianprincipal balance of the notes to $179.6 million by June 1,dollars and $10 million may be drawn in British pounds2008. Cash interest will accrue on the Subordinated Discountsterling. Additionally, the revolver includes a sub-limit forNotes at a rate of 12% per annum, beginning June 1, 2008short-term letters of credit in an amount not to exceedthrough maturity. The proceeds from the sale of the Subordi-$50 million. Interest on the Credit Agreement is variable,nated Discount Notes were distributed to the Company’sbased on either the Eurodollar Rate (LIBOR) or a Base Ratestockholders in the form of a common stock dividend. As of(defined as the greater of a specified U.S. or Canadian primeDecember 31, 2005, the book value of the Subordinatedlending rate or the federal funds effective rate, increased byDiscount Notes was $135.8 million.0.5%) plus a margin which is dependent on upon CMG’s
The Credit Agreement and the indentures governing theleverage ratio. As of December 31, 2005, the weightedSenior Discount Notes and Subordinated Discount Notes limitaverage interest rate on the Credit Agreement was 6.14%.the Company’s ability, among other things, to: incur additionalThe Term Loan is due in quarterly installments of principalindebtedness or contingent obligations; pay dividends or makeand interest beginning March 31, 2006 and matures indistributions to stockholders; repurchase or redeem stock;September 2012. The scheduled principal reductions totalmake investments; grant liens; make capital expenditures;$3.5 million annually but the loan may be prepaid at any timeenter into transactions with stockholders and affiliates; sellwithout penalty. The Revolving Credit Facility matures inassets; and acquire the assets of, or merge or consolidateDecember 2010.with, other companies. The Credit Agreement is secured byThe Company has also entered into an interest rate swapall existing and future assets of CMG subsidiaries. Addition-agreement in 2005 to effectively fix the interest rate onally, it requires CMG to maintain certain financial ratios$250 million of the outstanding balance of the Term Loan.including a minimum interest coverage ratio and a maximumThis swap is discussed further in Note 9.total leverage ratio. As of December 31, 2005, the CompanyAs of December 31, 2005, CMG had outstanding letters ofwas in compliance with each of its covenants.credit totaling $10.5 million that reduced our availability
under the Revolving Credit Facility to $83.5 million. The
47
C O M P A S S M I N E R A L S I N T E R N AT I O N A L , I N C . 2 0 0 5 F O R M 1 0 - K
The notes in the table below are listed in order of its interest rate on $250 million of debt at 4.87%. Thesubordination with all notes subordinate to the Credit Agree- notional amount of the swap decreases by $50 million eachment borrowings. Third-party long-term debt consists of the year beginning in March 2007 through March 2011. As offollowing at December 31 (in millions): December 31, 2005, a derivative liability of $0.7 million was
included in accrued expenses on the Consolidated Balance2005 2004
Sheets with the corresponding unrealized loss included in10% Senior Subordinated Notes due 2011 $ 2.0 $325.0 other comprehensive income, net of tax.123/4% Senior Discount Notes due 2012 97.1 85.8
Cash and cash equivalents, accounts receivable (net of12% Subordinated Discount Notes due 2013 135.8 120.9reserve for bad debts) and payables are carried at cost, whichTerm Loan due 2012 350.0 37.7
Revolving Credit Facility due 2010 31.0 11.0 approximates fair value due to the short-term nature of theinstruments. As of December 31, 2005, the estimated fair615.9 580.4
Plus premium on Senior Subordinated Notes, net — 2.7 values of the fixed-rate notes payable, based on availableLess current portion (3.5) (0.4) trading information, totaled $269.4 million compared with
their aggregate principal amounts at maturity of $305.1 mil-Long-term debt $ 612.4 $582.7lion. The estimated fair values at December 31, 2005 of
Future maturities of long-term debt, including the aggre- amounts outstanding under the Credit Agreement approxi-gate principal amounts at maturity for the Senior Discount mated carrying value.Notes of $123.5 million and Subordinated Discount Notes of
10. COMMITMENTS AND CONTINGENCIES$179.6 million, for the years ending December 31, are asfollows (in millions): Contingent Obligations
The Company is involved in legal and administrative proceedingsDebt Maturity
and claims of various types from normal Company activities.2006 $ 3.5
The Company is aware of an aboriginal land claim filed by2007 3.5
The Chippewas of Nawash and The Chippewas of Saugeen2008 3.5(the ‘‘Chippewas’’) in the Ontario Superior Court against The2009 3.5
2010 34.5 Attorney General of Canada and Her Majesty The Queen InThereafter 637.6 Right of Ontario. The Chippewas claim that a large part of the
$686.1 land under Lake Huron was never conveyed by treaty andtherefore belongs to the Chippewas. The land claimed
9. DERIVATIVES AND FAIR VALUES OF FINANCIAL INSTRUMENTS includes land under which the Company’s Goderich mineoperates and has mining rights granted to it by the govern-The Company enters into natural gas swap agreements toment of Ontario. The Company is not a party to this courthedge its risk of natural gas commodity price changes. Duringaction. Similar claims are pending with respect to other parts2005, the Company also entered into an interest rate swap toof the Great Lakes by other aboriginal claimants. Thehedge its risk of changing interest rates relative to its variableCompany has been informed by the Ministry of the Attorneyrate debt. All derivative instruments held by the Company asGeneral of Ontario that ‘‘Canada takes the position that theof December 31, 2005 and 2004 qualified as cash flow hedgescommon law does not recognize aboriginal title to the Greatand any ineffectiveness related to these hedges was notLakes and its connecting waterways.’’material for any of the years presented. The Company does not
The Wisconsin Department of Agriculture, Trade andengage in trading activities with these financial instruments.Consumer Protection (‘‘DATCP’’) reportedly has informationAs of December 31, 2005, the Company had natural gasindicating that agricultural chemicals are present in theswap agreements outstanding to hedge a portion of its naturalgroundwater in the vicinity of the Kenosha, Wisconsin plant.gas purchase requirements through December 2008. As ofDATCP has directed the Company to conduct an investigationDecember 31, 2005 and 2004, agreements with notionalinto the possible presence of agricultural chemicals in soil andamounts totaling 3.2 and 2.3 millions of British thermal units,groundwater at the Kenosha plant. The Company has devel-respectively, resulted in unrealized gains of $4.0 million andoped a plan which has been approved by DATCP to$1.3 million for each respective year. The derivative assetsinvestigate soils and groundwater at the Kenosha site.were included in other current assets on the ConsolidatedDepending on the results of the investigation, remedial effortsBalance Sheets with the corresponding unrealized gain includedmay be necessary. Although little is currently known aboutin other comprehensive income, net of tax. During 2005 andthe possible source of such contamination, or who should be2004, $3.9 million and $2.1 million of gains were recognizedresponsible for it, the Company expects DATCP will look tothrough cost of sales related to natural gas swap agreements.the Company to undertake those efforts. If required, theTo hedge the variability of future interest payments on theCompany intends to conduct all phases of the investigationCredit Agreement (discussed in Note 8), during the fourthand any required remediation work under the Wisconsinquarter of 2005 the Company entered into an interest rateAgricultural Chemical Cleanup Program, which will provideswap agreement to effectively fix the LIBOR-based portion offor reimbursement of some of the costs. None of the
48
C O M P A S S M I N E R A L S I N T E R N AT I O N A L , I N C . 2 0 0 5 F O R M 1 0 - K
identified contaminants have been used in association with Purchase Commitments – In connection with the operations ofthe Company’s site operations. The Company expects to seek the Company’s facilities, the Company purchases electricity,participation by, or cost reimbursement from, other parties other raw materials and services from third parties underresponsible for the presence of any agricultural chemicals contracts, extending, in some cases, for multiple years.found in soils at this site. Purchases under these contracts are generally based on prevail-
The Company does not believe that these actions will have ing market prices. The Company’s future minimum long-terma material adverse financial effect on the Company. Further- purchase commitments are approximately $0.7 million annuallymore, while any litigation contains an element of uncertainty, in 2006 and 2007, and $0.3 million annually from 2008 throughmanagement presently believes that the outcome of each such 2010 and approximately $0.8 million in total, thereafter.proceeding or claim which is pending or known to be
Purchase Agreement – As of December 31, 2005, the Com-threatened, or all of them combined, will not have a material
pany had approximately $3.6 million of deferred gain remain-adverse effect on the Company’s results of operations, cash
ing from an amendment to an agreement with a supplierflows or financial position.
related to the purchase of salt from the supplier’s chemicalApproximately 35% of our U.S. workforce and 55% of our
production facility in Tennessee. During 2002 the Companyglobal workforce is represented by labor unions. Of our nine
received a one-time cash payment of $8.0 million related tomaterial collective bargaining agreements, four will expire in
the amendment. The gain is being amortized ratably through2006, three will expire in 2007 and two will expire in 2008.
December 2010, as certain conditions are met by theAdditionally, approximately 6% of our workforce is employed
Company and supplier. During 2005, 2004 and 2003, thein Europe where trade union membership is common. We
Company recorded a reduction to cost of sales of approxi-consider our labor relations to be good.
mately $0.9 million each year as the ratable portions of thegain were realized. If the Company were to elect to resumeCommitmentspurchasing salt from the supplier’s facility, the Company
Leases – The Company leases certain property and equipmentwould repay a ratable portion of the cash received.under non-cancelable operating leases for varying periods.
The aggregate future minimum annual rentals under lease 11. STOCKHOLDERS’ EQUITY AND EQUITY INSTRUMENTSarrangements as of December 31, 2005 are as follows
As of January 1, 2003, the Company’s common stock was(in millions):owned by Apollo, Mosaic, co-investors and members of
Operating Leases management, including 600,612 shares issued to an employee2006 $ 6.0 trust to secure the Company’s obligations to issue common2007 4.9 stock under an employee deferred compensation plan. At that2008 3.2 time, the Company had class A and class B common stock,2009 1.6
which were identical in all respects and had the same powers,2010 1.4preferences and rights, except class B shares were non-votingThereafter 6.9securities and each class A share was entitled to one vote.
$24.0 In May 2003, proceeds from the issuance of the Subordi-nated Discount Notes in the amount of $100.0 million were
Rental expense, net of sublease income, was $9.3 million,used to pay a dividend on the Company’s common stock.
$9.3 million and $8.2 million for the years ended Decem-In June 2003, the Company repurchased 5,175,117 shares of
ber 31, 2005, 2004 and 2003, respectively.common stock from Mosaic and recorded treasury stock at a
Royalties – The Company has various private, state and cost of $9.7 million (see Note 16, Related Party Transactions).Canadian provincial leases associated with the salt and Also in 2003, the Company repurchased 28,010 shares ofspecialty potash businesses. Royalty expense related to these common stock and recorded treasury stock at a cost of lessleases was $6.7 million, $6.4 million and $5.8 million for the than $0.1 million, and reissued 11,890 shares of treasuryyears ended December 31, 2004, 2003 and 2002, respectively. stock, of which 6,077 shares were issued in connection with
certain employee exercises of stock options, which areSales Contracts – The Company has various salt and other
discussed below.deicing-product sales contracts that include performance
On November 5, 2003, the Company’s board of directorsprovisions governing delivery and product quality. These sales
approved the IPO of the Company’s common stock. Oncontracts either require the Company to maintain perform-
November 21, 2003, the Company’s board of directorsance bonds for stipulated amounts or contain contractual
approved a recapitalization of the Company’s capital stockpenalty provisions in the event of non-performance. For the
whereby each share of the Company’s class B common stockthree years ended December 31, 2005, the Company has had
was converted into one share of class A common stock and allno material penalties related to these sales contracts. At
outstanding shares of class A common stock were exchangedDecember 31, 2005, the Company had approximately
for one share of a newly designated single class of common$32.4 million of outstanding performance bonds.
stock. The Company’s board of directors also approved an
49
C O M P A S S M I N E R A L S I N T E R N AT I O N A L , I N C . 2 0 0 5 F O R M 1 0 - K
approximately 4.982-for-one stock split of the Company’s individual option agreements. The other one-half of thecommon stock, which was effected by means of reclassifica- options granted to employees were performance options andtion. The stock split became effective on December 11, 2003. vested upon completion of the IPO in December 2003. OptionsHistorical periods presented have been restated to show the granted following the IPO are entirely service-vesting. Optionseffect of the stock split. granted to members of the board of directors of the Company
In December 2003, the Company amended and restated its vest at the time of grant. Options expire on the thirtieth daycertificate of incorporation upon registration of its new immediately following the eighth anniversary of issuance.corporate name, Compass Minerals International, Inc. The In 2005, Compass adopted a new equity compensation planamended and restated certificate of incorporation of CMI (the 2005 Plan) for its employees and directors allowingauthorized 200,000,000 shares of common stock, par value grants of equity instruments including restricted stock units$0.01 per share. (‘‘RSUs’’) and stock options with respect to up to 3,240,000
On December 17, 2003, the Company completed an IPO of shares of CMI common stock. The right to make awards16,675,000 shares of its common stock. The shares were sold expires in 10 years. In November 2005, the Board approved,by certain stockholders of the Company, primarily Apollo and and Compass granted 14,000 RSUs and 57,900 stock options.Mosaic, and the Company did not receive any proceeds from The closing stock price on the day of grant, which is used tothe sale of the shares. set the exercise price for the stock options and the fair value
In July 2004, the Company completed a secondary offering for the RSUs, was $23.47. The grants of RSUs vest after threeof 8,327,244 shares of common stock. These shares were sold years of service and the holders will be entitled to one shareby Apollo, Mosaic and certain members of management, so of common stock for each vested RSU. The RSUs do not havethe Company did not receive any proceeds from the sale of voting rights but each RSU is entitled to receive non-the shares. forfeitable dividends or other distributions that may be
In November 2004, the Company completed another declared on the Company’s common stock equal to, and atsecondary offering of 4,021,473 shares of common stock. The the same time as, the per share dividend declared.shares were also sold Apollo, Mosaic and certain members of Stock options granted under the 2005 Plan vest ratably, inmanagement so the Company did not receive any proceeds tranches, over a four-year service period. Unexercised optionsfrom the sale of the shares. This sale reduced Apollo’s and expire after seven years. Upon vesting, each option can beMosaic’s holdings to zero. exercised to purchase one share of the Company’s common
The Company paid dividends of $1.10 per share in 2005 stock at a price equal to the closing market price of theand intends to continue paying quarterly cash dividends. The Company’s common stock on the day of grant. Holders ofdeclaration and payment of future dividends to holders of the each option are entitled to receive non-forfeitable dividendsCompany’s common stock will be at the discretion of its board or other distributions declared on the Company’s commonof directors and will depend upon many factors, including the stock equal to, and at the same time as, the per shareCompany’s financial condition, earnings, legal requirements, dividend declared.restrictions in its debt agreements (see Note 8) and other The following table sets forth information with regard tofactors its board of directors deems relevant. both plans about the fair value of each option grant on the
date of grant using the Black Scholes option — pricing model,Stock Options
and the weighted — average assumptions used for such grantsOn November 28, 2001, CMI adopted a stock option plan
for each of the years ended December 31:(the 2001 Plan). Options were granted in amounts and atsuch times and to such eligible persons as determined by the 2005 2004 2003(2)
board of directors of CMI pursuant to which options with Fair value of options granted $ 7.73 $ 2.37 $10.98Expected term (years) 5.5 1.9 7.8respect to a total of 2,783,283 shares of CMI’s common stockExpected volatility 24.5% 24.0% —were available for grant to employees of, consultants to, orDividend yield(1) 0.0% 4.7% —directors of CMI. No further option grants can be made underRisk-free interest rates 4.4% 3.1% 3.4%
this plan. Options granted under the plan were all non- (1) The 2005 assumed yield reflects the non-forfeiting dividend feature.qualified stock options. (2) The Company used the minimum value method before the IPO in December
2003, which excludes volatility.For those options granted prior to the IPO, one-half of theoptions granted to employees under the 2001 Plan vestratably, in tranches, over one to four years, depending on the
50

C O M P A S S M I N E R A L S I N T E R N AT I O N A L , I N C . 2 0 0 5 F O R M 1 0 - K
The following is a summary of CMI’s stock option activity 12. OPERATING SEGMENTSand related information for the following periods:
The Company’s reportable segments are strategic businessWeighted- units that offer different products and services. They are
average managed separately because each business requires differentNumber of options exercise price
technology and marketing strategies. The Company has twoOutstanding at December 31, 2002 1,739,476 $2.08 reportable segments: Salt and Potash. The salt segment
Exercised (23,053) 2.01produces salt for use in road deicing, food processing, waterCancelled/Expired (6,592) 2.01softeners, and agricultural and industrial applications. PotashOutstanding at May 22, 2003 1,709,831 2.08crop nutrients and industrial grade potash are produced andOutstanding at May 23, 2003 after
amendment to the 2001 Plan(a) 2,455,943 1.45 marketed through the Potash segment.Granted 50,311 7.04 The accounting policies of the segments are the same asExercised(b) (246,458) 1.41 those described in the summary of significant accountingCancelled/Expired (42,832) 1.40
policies. All intersegment sales prices are market-based. TheOutstanding at December 31, 2003 2,216,964 1.58 Company evaluates performance based on operating earnings
Granted 167,367 21.58of the respective segments. The notes to the consolidatedExercised(c) (721,208) 1.74financial statements include detail related to special chargesCancelled/Expired (11,308) 1.40and should be referred to when viewing the segmentOutstanding at December 31, 2004 1,651,815 3.54
Granted 57,900 23.47 information herein.Exercised(c) (936,938) 1.52 As discussed in Note 13 below, on December 30, 2005, theCancelled/Expired (14,876) 1.40 Company sold its evaporated salt business in the U.K. Those
Outstanding at December 31, 2005 757,901 $7.60 operations have been reclassified to net earnings fromdiscontinued operations in the Consolidated Statements of(a) In connection with CMI’s $100.0 million dividend payment on its common
stock in May 2003, the number of CMI stock options and their exercise Operations and accordingly, those operations are not includedprices were adjusted to preserve the intrinsic value of the stock options that
in the segment information below except as indicted in theexisted prior to the dividend. This was accomplished by decreasing thetable. Segment information as of and for the years endedexercise price of outstanding options and increasing the number of
outstanding options by a factor of 1.436 to one. December 31, is as follows (in millions):(b) Exercised options include 6,077 shares of common stock that were issued
from treasury stock.2005 Salt Potash Other(e) Total(c) Common stock issued for exercised options were all issued from treasury
stock. Sales to external customers $639.6 $102.7 $ — $742.3Intersegment sales — 11.0 (11.0) —
The following table summarizes information about options Cost of sales — shipping andoutstanding and exercisable at December 31, 2005: handling 212.4 14.8 — 227.2
Operating earnings (loss) 138.0 30.2 (25.3) 142.9Depreciation, depletion andWeighted-average Weighted-average Weighted-average
remaining exercise price exercise price amortization(a) 35.2 8.4 — 43.6Options contractual life of options Options of exercisable Total assets 585.9 134.4 30.0 750.3
Range of exercise prices outstanding (years) outstanding exercisable options Capital expenditures(b) 22.7 9.1 — 31.8$ 1.40 518,875 4.1 $1.40 518,875 $1.40$ 3.23 - $ 5.17 13,759 5.4 4.75 8,708 4.97
2004 Salt Potash Other(e) Total$16.66 - $23.47 225,267 6.8 22.07 80,700 20.06Sales to external customers $552.3 $ 87.6 $ — $639.9Totals 757,901 5.0 $7.60 608,283 $3.93Intersegment sales — 11.3 (11.3) —Cost of sales — shipping and
Options exercisable at December 31, 2004 numbered handling 168.7 13.8 — 182.51,283,870. Operating earnings (loss)(c) 123.5 20.7 (25.4) 118.8
Depreciation, depletion andAccumulated Other Comprehensive Income amortization(a) 33.2 8.1 — 41.3
Total assets 555.1 134.9 33.9 723.9The components of accumulated other comprehensive income,Capital expenditures(b) 21.7 5.2 — 26.9net of related taxes, are summarized as follows:
December 31, 2005 2004 2003
Minimum pension liability adjustment $ (3.3) $(6.4) $(7.0)Unrealized gain on cash flow hedges 2.2 0.9 0.8Cumulative foreign currency translation
adjustment 42.8 43.8 31.7
Accumulated other comprehensive income $ 41.7 $38.3 $25.5
See Note 9 for a discussion of the Company’s cash flow hedges.
51

C O M P A S S M I N E R A L S I N T E R N AT I O N A L , I N C . 2 0 0 5 F O R M 1 0 - K
2003 Salt Potash Other(e) Total provisions (in the case of most warranties, subject to aSales to external customers $499.5 $ 54.0 $ — $553.5 combined limit of £3 million, or approximately $5.2 million).Intersegment sales — 9.4 (9.4) — No amounts have been accrued for such warranties. ThisCost of sales — shipping and
business had been part of the salt segment with historicalhandling 150.5 8.7 — 159.2operating results as follows:Operating earnings (loss)(d) 104.4 7.5 (20.7) 91.2
Depreciation, depletion andYear ended December 31, 2005 2004 2003amortization(a) 34.2 7.9 — 42.1
Total assets 522.6 141.5 31.0 695.1 Sales $ 52.5 $55.2 $47.1Capital expenditures(b) 17.7 2.9 — 20.6 Pretax earnings(1) 4.9 2.7 1.8(a) Includes $3.6 million, $3.8 million and $3.5 million of expense related to Income tax expense(2) (0.8) (0.7) (0.4)
discontinued operations for 2005, 2004 and 2003, respectively, in the saltNet earnings from discontinued operations $ 4.1 $ 2.0 $ 1.4segment.
(b) Includes $1.1 million, $1.7 million and $1.2 million of expenditures (1) Pretax earnings in 2005 include the pretax gain of $4.6 million from the saleassociated with discontinued operations for 2005, 2004 and 2003, respec- of the business.tively, in the salt segment. (2) Income tax expense in 2005 includes tax expense of $0.9 million from the
(c) Includes $1.4 million related to other public offering costs and $4.5 million gain on the sale of the business.related to Apollo’s cancellation of their management consulting agreement.
(d) Includes $2.4 million related to IPO costs. Debt has been maintained at the corporate level to support(e) Other includes corporate entities and eliminations. the operating businesses; therefore a portion of the interest
expense incurred on that debt has been allocated to discon-Financial information relating to the Company’s operationstinued operations based on its proportion of net assetsby geographic area for the years ended December 31 is asavailable to service that debt. Interest of $2.4 million,follows (in millions):$2.6 million and $2.6 million has been allocated to discontin-
Sales 2005 2004 2003 ued operations for the years ended December 31, 2005, 2004United States $ 521.0 $ 444.2 $394.5 and 2003, respectively.Canada 168.0 148.1 128.7 The following table shows the carrying values of each of theUnited Kingdom 53.3 47.6 30.3 major classes of assets and liabilities of the disposed business
Total sales $ 742.3 $ 639.9 $553.5 as of the December 30, 2005 disposal date and, for compara-tive purposes, the book values as of December 31, 2004
Financial information relating to the Company’s long-lived (in millions):assets, including deferred financing costs and other long-lived
December 30, December 31,assets, by geographic area as of December 31 (in millions):2005 2004
Accounts receivable, net $ 9.0 $ 12.2Long-Lived Assets 2005 2004Inventories 2.5 3.0
United States $ 248.6 $256.0Other current assets 0.1 0.5
Canada 121.7 127.4Property, plant and equipment, net 22.2 26.2
United Kingdom 45.6 74.5Total assets $33.8 $ 41.9
Total assets $ 415.9 $457.9
Accounts payable and accrued liabilities $ 3.7 $ 5.113. DISCONTINUED OPERATIONS
14. EARNINGS PER SHAREIn November of 2005, Compass began exclusive discussions
As discussed in Note 11, during the fourth quarter of 2005with INEOS Enterprises Limited for the sale of its Westonthe Company issued 57,900 stock options and 14,000Point, England evaporated salt business. On December 30,restricted stock units which are entitled to receive non-2005, the transaction was completed. The business was soldforfeitable dividends. Because these securities have dividendfor approximately $36.2 million in cash, subject to a workingand/or distribution rights equal to those of our commoncapital adjustment, and resulted in a pre-tax gain of approxi-stockholders, the securities have been included in themately $4.6 million. The agreement includes customarycalculation of basic earnings per share.representations, warranties, covenants and indemnification
52
C O M P A S S M I N E R A L S I N T E R N AT I O N A L , I N C . 2 0 0 5 F O R M 1 0 - K
The following table sets forth the computation of basic and through the year ended December 31, 2003. Transactions withdiluted earnings per common share (in millions, except for Apollo and its subsidiaries (‘‘Apollo affiliates’’) are consideredshare and per share data): related party transactions through 2004, when Apollo sold its
remaining shares of CMI. The Company believes that all of theYear ended December 31, 2005 2004 2003 related party transactions approximate terms which wouldNumerator: otherwise have been negotiated by the Company with unre-Net earnings from lated third parties.
continuing operations $26.8 $47.8 $30.9Net earnings from Capitalization and Financing Activities – In May 2003, pro-
discontinued operations 4.1 2.0 1.4 ceeds from the issuance of the Subordinated Discount Notes inDividends on redeemable the amount of $100.0 million were used to pay dividends on the
preferred stock — — (1.2)Company’s common stock. Also in May 2003, all accretedGain on redemption ofdividends on the Company’s preferred stock, approximatelypreferred stock — — 8.2$3.7 million, were paid current in order for the Company to payNet earnings available for
common stock $30.9 $49.8 $39.3 dividends on its common stock. At that time, shareholdersconsisted of Apollo affiliates, management and Mosaic.Denominator:
In June 2003, the Company repaid the balance of its notesAverage common sharesoutstanding, shares for payable to Mosaic, including accrued interest, and repur-basic earnings per share 31,487,975 30,604,597 32,492,792 chased from Mosaic 14,704 shares of its preferred stock,
Average stock options5,175,117 shares of its common stock and approximately
outstanding 561,657 1,211,605 1,491,191$18.0 million of cash held in escrow for approximately
Shares for diluted earnings$36.0 million. The purchase price of the individual securitiesper share 32,049,632 31,816,202 33,983,983was allocated ratably according to their estimated fair values.
Net earnings fromThe redemption of preferred stock resulted in a gain ofcontinuing operations perapproximately $8.2 million recorded as a reduction of theshare, basic $0.85 $1.56 $1.17
Net earnings from accumulated deficit. The repurchase of common stock wasdiscontinued operations treated as treasury stock and recorded at a cost of approxi-per share, basic 0.13 0.07 0.04 mately $9.7 million. The retirement of the notes payable
Net earnings per share, basic $0.98 $1.63 $1.21 resulted in a gain of approximately $1.9 million recorded asNet earnings from other income.
continuing operations per On September 29, 2003, the CMI Senior Executives’share, diluted $0.84 $1.50 $1.12 Deferred Compensation Plan was terminated and the CMI
Net earnings fromcapital stock held in the deferred compensation plan wasdiscontinued operationssubsequently distributed to the participants with no impact toper share, diluted 0.13 0.07 0.03the Company.Net earnings per share, diluted $0.97 $1.57 $1.15
In December 2003, the Company repurchased andredeemed all of its remaining 1,749 shares of preferred stock15. OTHER CHARGESat its accreted value. These shares were owned by Apollo
2004 – We incurred $1.4 million in costs directly related to affiliates and management.the completion of two secondary stock offerings completed in The Company recorded $0.1 million of interest expenseJuly 2004 and November 2004. In addition, Apollo elected to related to debt obligations with Mosaic affiliates for the yearterminate the amended management consulting agreement in ended December 31, 2003.November 2004 resulting in a charge of $4.5 million for all
Operational Activities – The Company recorded purchases ofservices rendered under the agreement.$25.6 million from Mosaic affiliates for the year ended
2003 – In the fourth quarter of 2003, we incurred $2.4 million December 31, 2003.of costs directly related to the completion of the Company’s In 2003 the Company had an agreement with MosaicIPO. whereby we marketed SOP produced by Mosaic at their New
Mexico facility as an agent. The Company recognized approxi-16. RELATED PARTY TRANSACTIONSmately $0.7 million in fees from Mosaic for the year ended
The following related party transactions are in addition to December 31, 2003 pursuant to this agreement.those disclosed elsewhere in the notes to the consolidated In June 2003, the Company purchased, for $24.5 million,financial statements. intangible assets related to Mosaic’s SOP marketing business
Upon completion of the IPO in December 2003, Mosaic’s including customer lists related to its Carlsbad, New Mexicoownership in the Company was reduced to less than 3%. SOP product line and rights to produce SOP at Mosaic’sAccordingly, transactions with Mosaic and its subsidiaries Carlsbad, New Mexico facility. We also incurred approximately(‘‘Mosaic affiliates’’) are considered related party transactions $0.3 million of related transaction costs. As part of the
53
C O M P A S S M I N E R A L S I N T E R N AT I O N A L , I N C . 2 0 0 5 F O R M 1 0 - K
transaction, the agreement under which the Company, as mately $1.0 million for its management services and adviceagent, marketed SOP produced by Mosaic at their Carlsbad, through 2011. During the years ended December 31, 2004 andNew Mexico facility terminated on November 30, 2003. For 2003, the Company recorded management fee charges ofthe year ended December 31, 2003, the Company had $0.7 million and $1.0 million, respectively, from Apollo.purchased approximately $3.9 million of SOP finished goods Upon completion of the IPO, the Company amended theinventory from Mosaic. management consulting agreement with Apollo, whereby
The Company subleased railcars from affiliates of Mosaic that Apollo had the right to terminate the amended managementare used by us to transport products. The lease amounts expensed consulting agreement at any time upon prior written notice tototaled $0.5 million for the year ended December 31, 2003. the Company. Apollo elected to terminate the amended
During 2003 and 2004, the Company was a party to a management consulting agreement in November 2004. Themanagement agreement with Apollo. The agreement allowed Company paid Apollo approximately $4.5 million as a finalthe Company and any of its affiliates to utilize Apollo’s payment for all services rendered under the agreement. Uponexpertise in areas such as financial transactions, acquisitions termination of the agreement by Apollo, any future obligationsand other matters that related to its business, administration of Apollo under the agreement effectively terminated. Theand policies. Apollo was to receive an annual fee of approxi- payment was expensed as other charges to operating earnings.
17. QUARTERLY RESULTS (Unaudited) (In millions, except share data)
Quarter First Second Third Fourth
2005Sales $ 254.0 $ 97.7 $ 107.5 $ 283.1Gross profit 71.5 21.1 24.2 82.5Net earnings (loss) available for common stock(a) 22.6 (0.7) (4.4) 13.4
Net earnings (loss) per share, basic(a) $ 0.73 $ (0.03) $ (0.14) $ 0.42Net earnings (loss) per share, diluted(a) 0.70 (0.03) (0.14) 0.42Basic weighted-average shares outstanding 31,140,713 31,430,900 31,593,768 31,786,518Diluted weighted-average shares outstanding 32,323,129 31,430,900 31,593,768 32,180,463
2004Sales $ 236.1 $ 84.1 $ 98.5 $ 221.2Gross profit 69.9 18.7 23.4 67.8Net earnings (loss) available for common stock(b) 30.3 (5.9) 5.5 19.9
Net earnings (loss) per share, basic(b) $ 1.00 $ (0.19) $ 0.18 $ 0.65Net earnings (loss) per share, diluted(b) 0.94 (0.19) 0.17 0.62Basic weighted-average shares outstanding 30,241,662 30,516,370 30,785,285 30,875,070Diluted weighted-average shares outstanding 32,174,309 30,516,370 32,273,436 32,300,692
(a) Fourth quarter net earnings available for common stock includes a net gain of $3.7 million from the sale of discontinued operations (Note 13), $33.2 million ofexpense related to debt refinancings (approximately $20.5 million after tax — Note 8) and income tax expense of $4.1 resulting from a repatriation of foreignearnings pursuant to the American Jobs Creation Act of 2004 (Note 6).
(b) See Note 15 for detail related to special charges during 2004.
18. SUBSEQUENT EVENTS The reports of PwC on the Company’s financial statementsfor each of the years ended December 31, 2003 and
Stock-based compensation awards – In January 2006, theDecember 31, 2004 did not contain an adverse opinion or
board approved and the Company granted 143,800 optionsdisclaimer of opinion and were not qualified or modified as to
and 32,400 RSUs under the 2005 Plan.uncertainty, audit scope, or accounting principles.
Dividend declared – On February 9, 2006, the board declared During the two most recent fiscal years and througha quarterly cash dividend of $0.305 per share on its May 18, 2005, the date of dismissal, there were no disagree-outstanding common stock. The dividend will be paid on ments with PwC on any matter of accounting principles orMarch 15, 2006 to stockholders of record as of the close of practices, financial statement disclosure, or auditing scope orbusiness on March 1, 2006. procedure, which disagreements, if not resolved to the
satisfaction of PwC, would have caused them to makeITEM 9. CHANGES IN AND DISAGREEMENTS WITH
reference thereto in their reports on the financial statementsACCOUNTANTS ON ACCOUNTING AND FINANCIAL
for such years.DISCLOSURE
During the two most recent fiscal years and throughOn May 18, 2005, the ‘‘Company’’ dismissed Price- May 18, 2005, there were no reportable events (as defined inwaterhouseCoopers LLP (‘‘PwC’’) as its independent registered Regulation S-K Item 304(a)(1)(v) and referred to herein aspublic accounting firm. The decision to dismiss PwC was ‘‘Reportable Events’’), except as follows. In accordance withapproved by the Audit Committee of the Board of Directors. section 404 of the Sarbanes-Oxley Act, the Company com-
54
C O M P A S S M I N E R A L S I N T E R N AT I O N A L , I N C . 2 0 0 5 F O R M 1 0 - K
pleted its assessment of the effectiveness of its internal reasonable assurance level. As discussed below and reportedcontrol over financial reporting and concluded that the in the Annual Report on Form 10-K for the year endedCompany’s internal control over financial reporting was not December 31, 2004, because of the material weakness ineffective as of December 31, 2004 due to material weaknesses existence as of December 31, 2004, management concludedin its internal control over the valuation and completeness of that the Company’s disclosure controls and procedures wereits income taxes payable, deferred income tax assets and not effective. Consequently, during 2005, as discussed below,liabilities (including the associated valuation allowance) and management implemented procedures and took other actionsthe income tax provision because it did not have accounting to improve the effectiveness of its disclosure controls andpersonnel with sufficient knowledge of generally accepted procedures. In connection with this Annual Report onaccounting principles related to income tax accounting and Form 10-K for the year ended December 31, 2005, anreporting. PwC issued an adverse opinion on the effectiveness evaluation was performed of the effectiveness of the designof internal control over financial reporting as of December 31, and operation of the Company’s disclosure controls and2004. More details on the material weakness in internal procedures as of December 31, 2005. Based on that evalua-control over financial reporting and management’s actions to tion, the Company’s CEO and CFO concluded that theremediate this weakness are discussed in Item 9A below. disclosure controls and procedures were effective as of
The Company engaged Ernst & Young LLP (‘‘E&Y’’) as its December 31, 2005 at the reasonable assurance level.new independent registered public accounting firm on
Management’s Report on Internal Control over Financial ReportingMay 18, 2005. The retention of E&Y was approved by theManagement of the Company is responsible for establishingAudit Committee of the Board of Directors. During the priorand maintaining adequate internal control over financialtwo most recent fiscal years and through May 18, 2005, thereporting, as defined in Rule 13a-15(f) under the ExchangeCompany did not consult with E&Y regarding (i) theAct. The Company’s internal control over financial reporting isapplication of accounting principles to a specified transaction,a process designed to provide reasonable assurance regardingeither completed or proposed, or the type of audit opinionthe reliability of financial reporting and the preparation ofthat might be rendered on the Company’s financial state-financial statements for external purposes in accordance withments, or (ii) any Reportable Event. There were no disagree-generally accepted accounting principles. Because of itsments with the independent accountants during the yearinherent limitations, internal control over financial reportingended December 31, 2005.may not prevent or detect misstatements. Also, projections of
ITEM 9A. CONTROLS AND PROCEDURES any evaluation of effectiveness to future periods are subjectto the risk that controls may become inadequate because ofDisclosure Controls and Procedureschanges in conditions, or that the degree of compliance withThe Company maintains disclosure controls and proceduresthe policies or procedures may deteriorate.that are designed to ensure that information required to be
Management conducts an evaluation and assesses thedisclosed in the Company’s reports under the Securitieseffectiveness of the Company’s internal control over financialExchange Act of 1934, as amended (the ‘‘Exchange Act’’), isreporting as of the reporting date. In making its assessment ofrecorded, processed, summarized and reported within theinternal control over financial reporting, management uses thetime periods specified in the SEC’s rules and forms and thatcriteria set forth by the Committee of Sponsoring Organiza-such information is accumulated and communicated to man-tions of the Treadway Commission (COSO) in Internalagement, including the Company’s Chief Executive OfficerControl-Integrated Framework.(CEO) and Chief Financial Officer (CFO), as appropriate, to
A material weakness is a control deficiency, or combinationallow timely decisions regarding required disclosure. Inof control deficiencies, that result in more than a remotedesigning and evaluating the disclosure controls and proce-likelihood that a material misstatement of the annual ordures, management recognizes that any controls and proce-interim financial statements will not be prevented or detected.dures, no matter how well designed and operated, canAs of December 31, 2004, the Company did not maintainprovide only reasonable assurance of achieving the desiredeffective controls over the valuation and completeness of itscontrol objectives and management necessarily was requiredincome taxes payable, deferred income tax assets andto apply its judgment in evaluating the cost-benefit relation-liabilities (including the associated valuation allowance) andship of possible controls and procedures.the income tax provision because it did not have accountingIn connection with the preparation of the Annual Reportpersonnel with sufficient knowledge of generally acceptedon Form 10-K, an evaluation is performed under the supervi-accounting principles related to income tax accounting andsion and with the participation of the Company’s manage-reporting. Specifically, the Company’s processes, proceduresment, including the CEO and CFO, of the effectiveness of theand controls related to the preparation and review of thedesign and operation of the Company’s disclosure controlsliability for income taxes payable were not effective to ensureand procedures (as defined in Rule 13a-15(e) under thethat the additions to the liability were complete and accurate.Exchange Act). Based on that evaluation, the Company’s CEOAlso, the Company did not have effective controls over theand CFO conclude whether the Company’s disclosure controlspreparation and review of the valuation allowance related toand procedures are effective as of the reporting date at the
55
C O M P A S S M I N E R A L S I N T E R N AT I O N A L , I N C . 2 0 0 5 F O R M 1 0 - K
deferred tax assets. This control deficiency resulted in the In order to remediate this matter, the Company identifiedrestatement of the Company’s consolidated financial state- and implemented actions to improve the effectiveness of itsments for 2003, 2002, and 2001, for each of the quarters for disclosure controls and procedures and internal control overthe two years in the period ended December 31, 2003 and for financial reporting related to its income tax accounting. Inthe first and second quarters for 2004 as well as audit connection with this ongoing effort, (a) the Company has andadjustments to the fourth quarter 2004 consolidated financial continues to strengthen the resources in the income taxstatements. Accordingly, management determined that this accounting function, (b) the Company has and continues tocontrol deficiency constituted a material weakness and con- adopt more rigorous policies and procedures with respect tocluded that the Company did not maintain effective internal the income tax account balance sheet review process,control over financial reporting as of December 31, 2004, including the income taxes payable and deferred tax assetbased on criteria in Internal Control-Integrated Framework. valuation allowance accounts, (c) the Company has and
As noted below, throughout 2005 management imple- continues to implement a standardized tax accountingmented procedures and took various actions to improve the software package to assist in the SFAS No. 109 accountingeffectiveness of its internal controls over financial reporting process, (d) the Company has hired a Vice President ofrelated to its income tax accounting. As of December 31, Income Tax and implemented greater senior level financial2005, management conducted an evaluation and assessed the officer review of the income tax balance sheet accounts andeffectiveness of the Company’s internal control over financial the related journal entries, and (e) the Company engaged areporting. Based on its evaluation, management concluded third party specialist to assist the Company’s personnelthat the Company’s internal control over financial reporting conducting comprehensive and detailed reviews of the Com-was effective as of December 31, 2005. Management’s assess- pany’s tax reporting and accounting, in particular with respectment of the effectiveness of the Company’s internal control to developing more effective processes for establishing andover financial reporting as of December 31, 2005 has been monitoring deferred income taxes, valuation allowances andaudited by Ernst & Young LLP, an independent registered the Company’s annual effective tax rate. As a result, uponpublic accounting firm, as stated in their report which appears completion of its evaluation of internal control over financialherein. reporting, management determined its internal control over
financial reporting was effective as of December 31, 2005.Changes in Internal Control Over Financial Reporting to Remediate theMaterial Weakness Reported as of December 31, 2004 Changes in Internal Control Over Financial ReportingIn November 2004, the Company reported a material weak- Except as otherwise discussed herein, there have been noness in internal control over financial reporting related to the changes in the Company’s internal control over financial report-Company’s accounting for income taxes in connection with ing during the most recently completed fiscal quarter that havefiling its restated Annual Report on Form 10-K/A for the year materially affected, or are reasonably likely to materially affect,ended December 31, 2003 and its Quarterly Report on the Company’s internal control over financial reporting.Form 10-Q for the period ended September 30, 2004.
ITEM 9B. OTHER INFORMATION
None.
56
C O M P A S S M I N E R A L S I N T E R N AT I O N A L , I N C . 2 0 0 5 F O R M 1 0 - K
PART III
ITEM 10. DIRECTORS AND EXECUTIVE OFFICERS OF ITEM 11. EXECUTIVE COMPENSATIONTHE REGISTRANT
The information required by Item 11 of Form 10-K isInformation regarding executive officers is included in Part I incorporated herein by reference to the ‘‘Executive Compen-to this Form 10-K under the caption ‘‘Executive Officers of sation Table’’ included in the 2006 Proxy Statement.Registrant’’.
ITEM 12. SECURITY OWNERSHIP AND CERTAIN BENE-The information required by Item 10 of Form 10-K is
FICIAL OWNERS, AND MANAGEMENT AND RELATEDincorporated herein by reference to sections (a) ‘‘Director’s
STOCKHOLDER MATTERSand Executive Officers of the Registrant’’, (b) ‘‘Proposal 1 —Election of Directors’’, (c) ‘‘Information Regarding Board of The information required by Item 12 of Form 10-K isDirectors and Committees’’ and (d) ‘‘Corporate Governance incorporated herein by reference to ‘‘Stock Ownership’’Guidelines’’ of the definitive proxy statement filed pursuant to included in the 2006 Proxy Statement.Regulation 14A for the 2006 annual meeting of stockholders
ITEM 13. CERTAIN RELATIONSHIPS AND RELATED(‘‘2006 Proxy Statement’’). Additionally, ‘‘Section 16(a) Bene-
TRANSACTIONSficial Ownership Reporting Compliance’’ is also incorporatedherein by reference to the 2006 Proxy Statement. Information required by Item 13 of Form 10-K is incorporated
herein by reference to the disclosure under ‘‘Certain RelationshipsCode of Ethics
and Related Transactions’’ included in the 2006 Proxy Statement.We have adopted a code of ethics for our executive andsenior financial officers, violations of which are required to ITEM 14. PRINCIPAL ACCOUNTANT FEES ANDbe reported to the audit committee. The code of ethics is SERVICESincluded as Exhibit 14 to this Form 10-K and posted on our
The information required by Item 14 of Form 10-K iswebsite at www.compassminerals.com.
incorporated herein by reference to ‘‘Proposal 2 — Ratificationof Appointment of Independent Auditors’’ included in the2006 Proxy Statement.
57
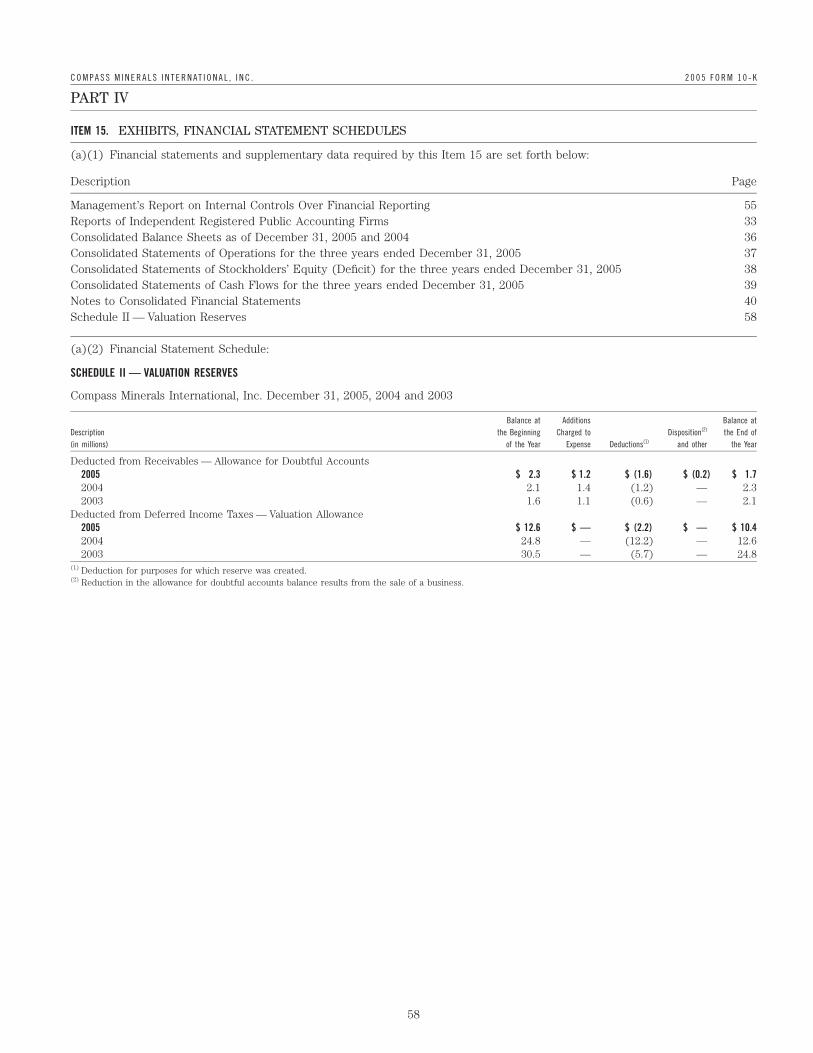
C O M P A S S M I N E R A L S I N T E R N AT I O N A L , I N C . 2 0 0 5 F O R M 1 0 - K
PART IV
ITEM 15. EXHIBITS, FINANCIAL STATEMENT SCHEDULES
(a)(1) Financial statements and supplementary data required by this Item 15 are set forth below:
Description Page
Management’s Report on Internal Controls Over Financial Reporting 55Reports of Independent Registered Public Accounting Firms 33Consolidated Balance Sheets as of December 31, 2005 and 2004 36Consolidated Statements of Operations for the three years ended December 31, 2005 37Consolidated Statements of Stockholders’ Equity (Deficit) for the three years ended December 31, 2005 38Consolidated Statements of Cash Flows for the three years ended December 31, 2005 39Notes to Consolidated Financial Statements 40Schedule II — Valuation Reserves 58
(a)(2) Financial Statement Schedule:
SCHEDULE II — VALUATION RESERVES
Compass Minerals International, Inc. December 31, 2005, 2004 and 2003
Balance at Additions Balance atDescription the Beginning Charged to Disposition(2) the End of(in millions) of the Year Expense Deductions(1) and other the Year
Deducted from Receivables — Allowance for Doubtful Accounts2005 $ 2.3 $ 1.2 $ (1.6) $ (0.2) $ 1.72004 2.1 1.4 (1.2) — 2.32003 1.6 1.1 (0.6) — 2.1
Deducted from Deferred Income Taxes — Valuation Allowance2005 $ 12.6 $ — $ (2.2) $ — $ 10.42004 24.8 — (12.2) — 12.62003 30.5 — (5.7) — 24.8
(1) Deduction for purposes for which reserve was created.(2) Reduction in the allowance for doubtful accounts balance results from the sale of a business.
58
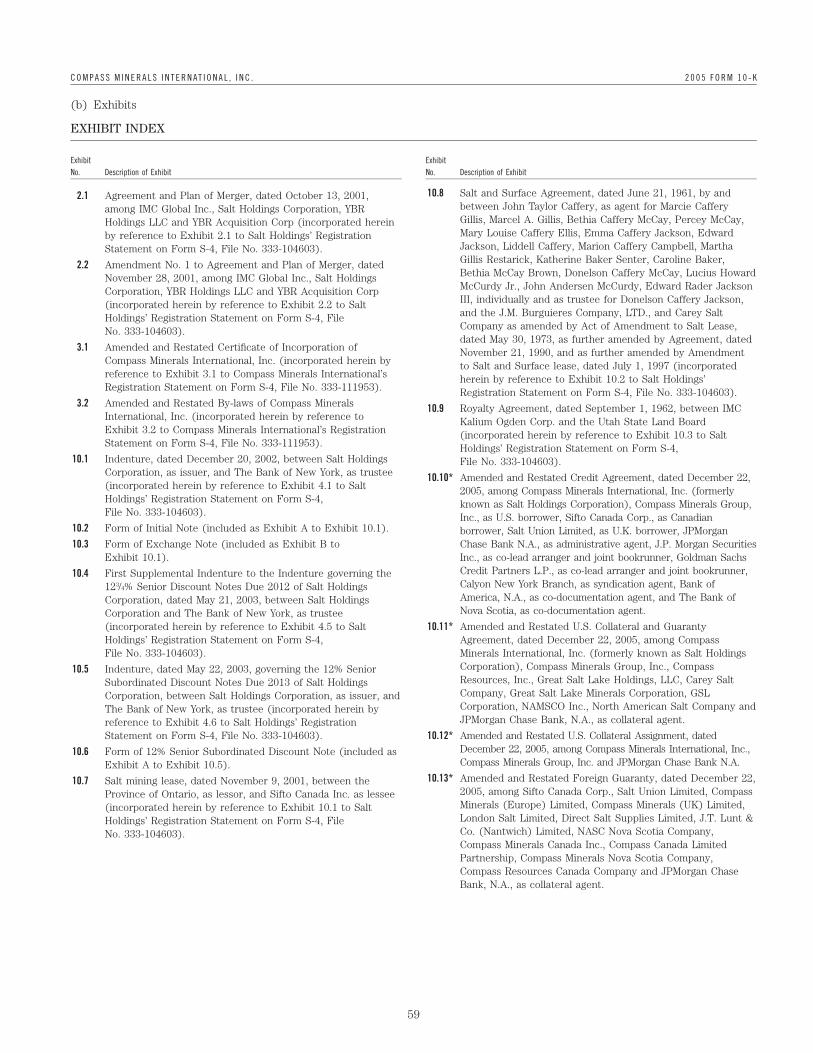
C O M P A S S M I N E R A L S I N T E R N AT I O N A L , I N C . 2 0 0 5 F O R M 1 0 - K
(b) Exhibits
EXHIBIT INDEX
Exhibit ExhibitNo. Description of Exhibit No. Description of Exhibit
10.8 Salt and Surface Agreement, dated June 21, 1961, by and2.1 Agreement and Plan of Merger, dated October 13, 2001,between John Taylor Caffery, as agent for Marcie Cafferyamong IMC Global Inc., Salt Holdings Corporation, YBRGillis, Marcel A. Gillis, Bethia Caffery McCay, Percey McCay,Holdings LLC and YBR Acquisition Corp (incorporated hereinMary Louise Caffery Ellis, Emma Caffery Jackson, Edwardby reference to Exhibit 2.1 to Salt Holdings’ RegistrationJackson, Liddell Caffery, Marion Caffery Campbell, MarthaStatement on Form S-4, File No. 333-104603).Gillis Restarick, Katherine Baker Senter, Caroline Baker,2.2 Amendment No. 1 to Agreement and Plan of Merger, datedBethia McCay Brown, Donelson Caffery McCay, Lucius HowardNovember 28, 2001, among IMC Global Inc., Salt HoldingsMcCurdy Jr., John Andersen McCurdy, Edward Rader JacksonCorporation, YBR Holdings LLC and YBR Acquisition CorpIII, individually and as trustee for Donelson Caffery Jackson,(incorporated herein by reference to Exhibit 2.2 to Saltand the J.M. Burguieres Company, LTD., and Carey SaltHoldings’ Registration Statement on Form S-4, FileCompany as amended by Act of Amendment to Salt Lease,No. 333-104603).dated May 30, 1973, as further amended by Agreement, dated
3.1 Amended and Restated Certificate of Incorporation of November 21, 1990, and as further amended by AmendmentCompass Minerals International, Inc. (incorporated herein by to Salt and Surface lease, dated July 1, 1997 (incorporatedreference to Exhibit 3.1 to Compass Minerals International’s herein by reference to Exhibit 10.2 to Salt Holdings’Registration Statement on Form S-4, File No. 333-111953). Registration Statement on Form S-4, File No. 333-104603).
3.2 Amended and Restated By-laws of Compass Minerals 10.9 Royalty Agreement, dated September 1, 1962, between IMCInternational, Inc. (incorporated herein by reference to Kalium Ogden Corp. and the Utah State Land BoardExhibit 3.2 to Compass Minerals International’s Registration (incorporated herein by reference to Exhibit 10.3 to SaltStatement on Form S-4, File No. 333-111953). Holdings’ Registration Statement on Form S-4,
10.1 Indenture, dated December 20, 2002, between Salt Holdings File No. 333-104603).Corporation, as issuer, and The Bank of New York, as trustee 10.10* Amended and Restated Credit Agreement, dated December 22,(incorporated herein by reference to Exhibit 4.1 to Salt 2005, among Compass Minerals International, Inc. (formerlyHoldings’ Registration Statement on Form S-4, known as Salt Holdings Corporation), Compass Minerals Group,File No. 333-104603). Inc., as U.S. borrower, Sifto Canada Corp., as Canadian
10.2 Form of Initial Note (included as Exhibit A to Exhibit 10.1). borrower, Salt Union Limited, as U.K. borrower, JPMorgan10.3 Form of Exchange Note (included as Exhibit B to Chase Bank N.A., as administrative agent, J.P. Morgan Securities
Exhibit 10.1). Inc., as co-lead arranger and joint bookrunner, Goldman SachsCredit Partners L.P., as co-lead arranger and joint bookrunner,10.4 First Supplemental Indenture to the Indenture governing theCalyon New York Branch, as syndication agent, Bank of123/4% Senior Discount Notes Due 2012 of Salt HoldingsAmerica, N.A., as co-documentation agent, and The Bank ofCorporation, dated May 21, 2003, between Salt HoldingsNova Scotia, as co-documentation agent.Corporation and The Bank of New York, as trustee
(incorporated herein by reference to Exhibit 4.5 to Salt 10.11* Amended and Restated U.S. Collateral and GuarantyHoldings’ Registration Statement on Form S-4, Agreement, dated December 22, 2005, among CompassFile No. 333-104603). Minerals International, Inc. (formerly known as Salt Holdings
Corporation), Compass Minerals Group, Inc., Compass10.5 Indenture, dated May 22, 2003, governing the 12% SeniorResources, Inc., Great Salt Lake Holdings, LLC, Carey SaltSubordinated Discount Notes Due 2013 of Salt HoldingsCompany, Great Salt Lake Minerals Corporation, GSLCorporation, between Salt Holdings Corporation, as issuer, andCorporation, NAMSCO Inc., North American Salt Company andThe Bank of New York, as trustee (incorporated herein byJPMorgan Chase Bank, N.A., as collateral agent.reference to Exhibit 4.6 to Salt Holdings’ Registration
Statement on Form S-4, File No. 333-104603). 10.12* Amended and Restated U.S. Collateral Assignment, datedDecember 22, 2005, among Compass Minerals International, Inc.,10.6 Form of 12% Senior Subordinated Discount Note (included asCompass Minerals Group, Inc. and JPMorgan Chase Bank N.A.Exhibit A to Exhibit 10.5).
10.13* Amended and Restated Foreign Guaranty, dated December 22,10.7 Salt mining lease, dated November 9, 2001, between the2005, among Sifto Canada Corp., Salt Union Limited, CompassProvince of Ontario, as lessor, and Sifto Canada Inc. as lesseeMinerals (Europe) Limited, Compass Minerals (UK) Limited,(incorporated herein by reference to Exhibit 10.1 to SaltLondon Salt Limited, Direct Salt Supplies Limited, J.T. Lunt &Holdings’ Registration Statement on Form S-4, FileCo. (Nantwich) Limited, NASC Nova Scotia Company,No. 333-104603).Compass Minerals Canada Inc., Compass Canada LimitedPartnership, Compass Minerals Nova Scotia Company,Compass Resources Canada Company and JPMorgan ChaseBank, N.A., as collateral agent.
59
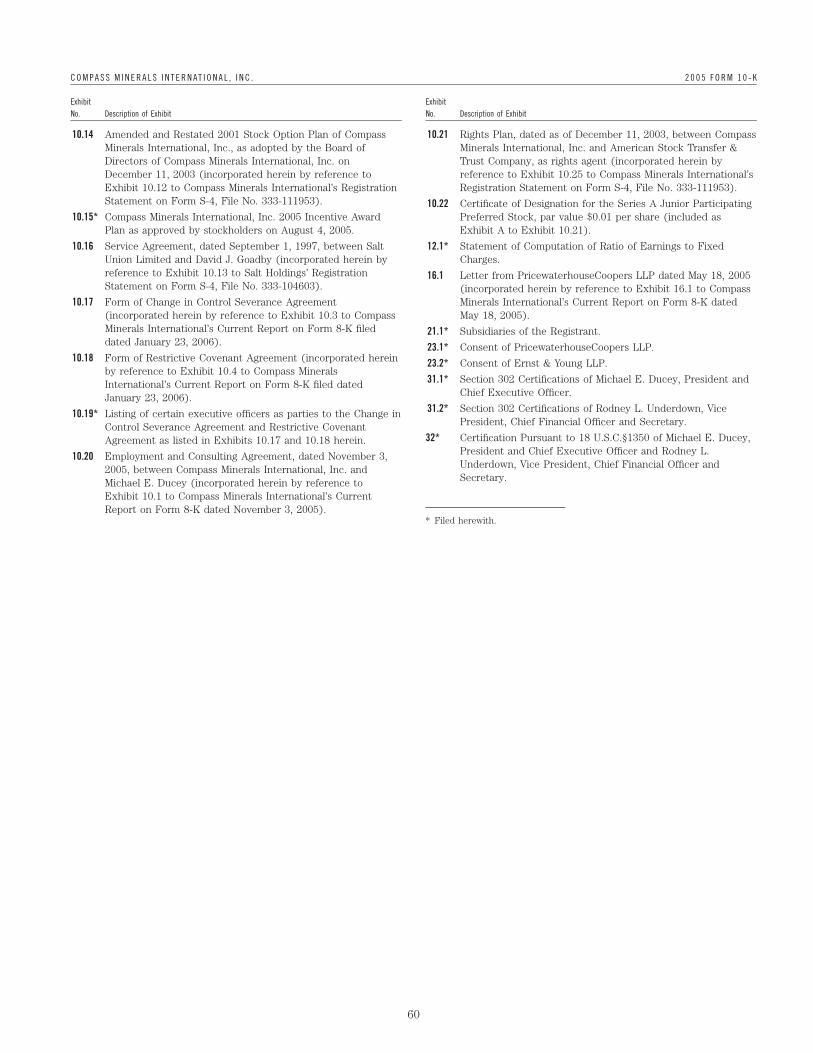
C O M P A S S M I N E R A L S I N T E R N AT I O N A L , I N C . 2 0 0 5 F O R M 1 0 - K
Exhibit ExhibitNo. Description of Exhibit No. Description of Exhibit
10.14 Amended and Restated 2001 Stock Option Plan of Compass 10.21 Rights Plan, dated as of December 11, 2003, between CompassMinerals International, Inc., as adopted by the Board of Minerals International, Inc. and American Stock Transfer &Directors of Compass Minerals International, Inc. on Trust Company, as rights agent (incorporated herein byDecember 11, 2003 (incorporated herein by reference to reference to Exhibit 10.25 to Compass Minerals International’sExhibit 10.12 to Compass Minerals International’s Registration Registration Statement on Form S-4, File No. 333-111953).Statement on Form S-4, File No. 333-111953). 10.22 Certificate of Designation for the Series A Junior Participating
10.15* Compass Minerals International, Inc. 2005 Incentive Award Preferred Stock, par value $0.01 per share (included asPlan as approved by stockholders on August 4, 2005. Exhibit A to Exhibit 10.21).
10.16 Service Agreement, dated September 1, 1997, between Salt 12.1* Statement of Computation of Ratio of Earnings to FixedUnion Limited and David J. Goadby (incorporated herein by Charges.reference to Exhibit 10.13 to Salt Holdings’ Registration 16.1 Letter from PricewaterhouseCoopers LLP dated May 18, 2005Statement on Form S-4, File No. 333-104603). (incorporated herein by reference to Exhibit 16.1 to Compass
10.17 Form of Change in Control Severance Agreement Minerals International’s Current Report on Form 8-K dated(incorporated herein by reference to Exhibit 10.3 to Compass May 18, 2005).Minerals International’s Current Report on Form 8-K filed 21.1* Subsidiaries of the Registrant.dated January 23, 2006). 23.1* Consent of PricewaterhouseCoopers LLP.
10.18 Form of Restrictive Covenant Agreement (incorporated herein 23.2* Consent of Ernst & Young LLP.by reference to Exhibit 10.4 to Compass Minerals
31.1* Section 302 Certifications of Michael E. Ducey, President andInternational’s Current Report on Form 8-K filed datedChief Executive Officer.January 23, 2006).
31.2* Section 302 Certifications of Rodney L. Underdown, Vice10.19* Listing of certain executive officers as parties to the Change inPresident, Chief Financial Officer and Secretary.Control Severance Agreement and Restrictive Covenant
32* Certification Pursuant to 18 U.S.C.§1350 of Michael E. Ducey,Agreement as listed in Exhibits 10.17 and 10.18 herein.President and Chief Executive Officer and Rodney L.10.20 Employment and Consulting Agreement, dated November 3,Underdown, Vice President, Chief Financial Officer and2005, between Compass Minerals International, Inc. andSecretary.Michael E. Ducey (incorporated herein by reference to
Exhibit 10.1 to Compass Minerals International’s CurrentReport on Form 8-K dated November 3, 2005).
* Filed herewith.
60
C O M P A S S M I N E R A L S I N T E R N AT I O N A L , I N C . 2 0 0 5 F O R M 1 0 - K
SIGNATURES
Pursuant to the requirements of Section 13 or 15(d) of the Securities Exchange Act of 1934, the Registrant has duly caused thisreport to be signed on its behalf by the undersigned, thereunto duly authorized.
COMPASS MINERALS INTERNATIONAL, INC.
/s / MICHAEL E. DUCEY
Michael E. DuceyPresident and Chief Executive Officer
Date: February 24, 2006
/s/ RODNEY L. UNDERDOWN
Rodney L. UnderdownVice President, Chief Financial Officer and Secretary
Date: February 24, 2006
Pursuant to the requirements of the Securities Exchange Act of 1934, this report has been signed below by the followingpersons on behalf of Compass Minerals International, Inc. and in the capacities indicated on February 24, 2006.
Signature Capacity
/s / MICHAEL E. DUCEY President, Chief Executive Officerand Director (Principal Executive Officer)Michael E. Ducey
/s/ RODNEY L. UNDERDOWN Vice President, Chief Financial Officer and Secretary(Principal Financial and Accounting Officer)Rodney L. Underdown
/s/ VERNON G. BAKER, II DirectorVernon G. Baker, II
/s / BRADLEY J. BELL DirectorBradley J. Bell
/s / DAVID J. D’ANTONI DirectorDavid J. D’Antoni
/s / RICHARD S. GRANT DirectorRichard S. Grant
/s/ PERRY W. PREMDAS DirectorPerry W. Premdas
61
62
Reconciliation for EBITDA and Adjusted EBITDA from Continuing Operations
For the year ended December 31,
(in millions) 2005 2004 2003
Net earnings from continuing operations $ 26.8 $ 47.8 $ 30.9Income tax expense (benefit) 15.8 4.2 2.9Interest expense 61.6 59.0 53.7Depreciation, depletion and amortization (1) 40.0 37.5 38.6
EBITDA $ 144.2 $ 148.5 $ 126.1
Adjustments to income from operations:Other charges (2) — 5.9 2.4Other (income) expense, net (3) 38.7 7.8 3.7
Adjusted EBITDA $ 182.9 $ 162.2 $ 132.2
(1) Amount excludes $3.6 million, $3.8 million and $3.5 million of expense related to discontinued operations during 2005, 2004 and 2003, respectively.(2) Costs in 2004 for secondary offerings of our common stock by stockholders filed with the SEC and for Apollo Management LP’s termination of a manage-
ment consulting agreement. Costs in 2003 are related to the completion of our IPO.(3) Costs in 2005 related to our tender for our 10-percent senior subordinated notes, costs in 2003 related to amending our senior credit facilities and gain
related to the early extinguishment of debt, and interest income and foreign exchange gains and losses in all periods.
Reconciliation for Net Earnings from Continuing Operations, Excluding Special Items
For the year ended December 31,
(in millions) 2005 2004 2003
Net earnings from continuing operations $ 26.8 $ 47.8 $ 30.9Plus (less) special items:
Tender costs for senior subordinated notes, net of tax (1) 20.5 — —Release of tax reserve, net of other tax adjustments (2) (4.8) (11.1) (5.1)Charge to income tax expense for repatriation of funds (3) 9.5 — —Termination of management consulting agreement, net of tax (4) — 2.8 —Stock offering costs, net of tax (5) — 1.4 2.4
Net earnings from continuing operations, excluding special items $ 52.0 $ 40.9 $ 28.2
Diluted earnings per share from continuing operations, excluding special items 1.62 1.28 0.83Diluted weighted-average shares outstanding 32,049,632 31,816,202 33,983,983
(1) In 2005, we recorded costs of $33.2 million, pre-tax, associated with the tender of $323.0 million principal amount of the company’s 10-percent seniorsubordinated notes.
(2) In 2005, taxing authorities developed a framework to treat cross-border transactions between the U.S. and Canada more consistently, so we reversed previously recorded income tax reserves. For the years 2004 and 2003, the company recorded non-cash changes to the valuation allowance for deferredtax assets due to the timing of future reversals of existing taxable temporary differences.
(3) We recorded a $4.1 million charge to income tax expense for a planned repatriation of foreign funds in accordance with the American Jobs Creation Act of 2004. We also recorded a $5.4 million charge to income tax expense due to a one-time repatriation of funds from the U.K.
(4) Pre-tax costs of $4.5 million were incurred when Apollo Management LP terminated its management consulting agreement with the company.(5) We incurred costs of $1.4 million in 2004 for secondary offerings of our common. In 2003, the company incurred costs of $2.4 million for its initial
public offering. The shares sold in all public offerings were previously held by stockholders and the company received no proceeds from the sales.
For management’s discussion of EBITDA, see page 30. Adjusted EBITDA excludes cash and non-cash items which manage-ment believes are not indicative of the ongoing operating performance of our core business operations. While EBITDA andadjusted EBITDA are frequently used as measures of operating performance, they exclude certain costs that are required forthe conduct of business. These terms are not necessarily comparable to similarly titled measures of other companies due topotential inconsistencies in the methods of calculation.
Management believes that excluding special items from net earnings from continuing operations and diluted earnings pershare from continuing operations is meaningful to investors because it provides insight with respect to ongoing operatingresults of the company.
In 2005, Compass Minerals International, Inc. submitted a Section 12(a) chief executive officer certification to the New YorkStock Exchange and filed with the Securities and Exchange Commission the chief executive officer/chief financial officercertification required under Section 302 of the Sarbanes-Oxley Act.
Worth our Salt
Compass MineralsInternational
Compass is the second-largest salt producer in North America and the largest
in the United Kingdom, and the leading producer of sulfate of potash in North
America. In 2005, Compass showed we were “worth our salt” by achieving
strong performance in a challenging cost environment. Throughout the company,
Compass’s seasoned managers delivered results by executing proven strategies
in each of the core elements of our business: production, distribution, customer
service, and management resources.
2005 Gross Sales by Product Line(in dollars)
2005 Shipments by Product Line(in tons)
2005 Gross Sales by Country(in dollars)
51% Highway Deicing Salt35% General Trade Salt14% Sulfate of Potash (SOP)
80% Highway Deicing Salt17% General Trade Salt3% Sulfate of Potash (SOP)
70% United States23% Canada7% United Kingdom
Highway Deicing SaltSupplied to more than 3,000 provincial,
state, county and municipal customers
and road maintenance contractors.
General Trade SaltEvaporated salt supplied to a variety of
industrial and agricultural customers, as
well as for consumer applications includ-
ing water conditioning and table salt.
Sulfate of Potash (SOP)Supplied to dealers and distributors
for use in the production of specialty
fertilizers that increase yields of high-
value crops and turf.
Directors
Vernon G. Baker, II (3,4)
Senior Vice President and General Counsel ArvinMeritor, Inc.
Bradley J. Bell (1)*
Executive Vice President and Chief Financial Officer Nalco Company
David J. D’Antoni (2,3)
Retired Senior Vice President and Group Operating Officer Ashland, Inc.
Michael E. Ducey (3)
President and Chief Executive Officer Compass Minerals International, Inc.
Richard S. Grant (1,4)**
Retired Chief Executive Officer BOC Process Gas Solutions
Perry W. Premdas (1,2)*
Retired Chief Financial Officer Celanese AG
(1) Audit Committee member(2) Compensation Committee
member(3) Environment, Health &
Safety Committee member(4) Nominating/Corporate
Governance Committee member
* Audit Committee financialexpert
**Lead Director
Officers
Michael E. Ducey President and Chief Executive Officer
Ronald BryanVice President and GeneralManager, Sulfate of PotashVice President, Strategy and Development
Keith E. ClarkVice President and GeneralManager, General Trade
John FallisVice President and GeneralManager, Highway Deicing
David J. GoadbyVice President and ManagingDirector, Salt Union Limited
Victoria HeiderVice President, Human Resources
Timothy R. MertzVice President, Tax and Assistant Secretary
Gregory W. SheltonVice President, Supply Chain
Jerry A. SmithVice President, Chief Information Officer
Rodney L. UnderdownVice President, Chief FinancialOfficer and Secretary
Carol WoodTreasurer
Michael ZinkeVice President, Controller
ShareholderInformation
Address: Compass Minerals International, Inc.9900 West 109th StreetSuite 600Overland Park, Kansas 66210
Securities Listed: New York Stock ExchangeCommon Stock Symbol CMP
Transfer Agent: UMB Bank, n. a.Securities Transfer DivisionP.O. Box 410064Kansas City, MO 64141-0064816-860-7000
Web site: www.CompassMinerals.com
Worth our Salt2005 Annual Report
CO M PA S S MI N E R A L S
IN T E R N AT I O N A L, IN C.
9900 West 109th Street
Suite 600
Overland Park, Kansas 66210
913-344-9200