by the U.S. Oil and Natural Gas Industry/media/Files/Publications/... · The U.S. oil and natural...
30
Environmental Expenditures by the U.S. Oil and Natural Gas Industry 1990–2016
Transcript of by the U.S. Oil and Natural Gas Industry/media/Files/Publications/... · The U.S. oil and natural...

Environmental Expenditures by the U.S. Oil and Natural Gas Industry
1990–2016

Copyright 2018 – API, all rights reserved. 1
Environmental ExpendituresThe U.S. oil and natural gas industry has invested an estimated $339 billion since 1990 toward improving the environmental performance of its products, facilities and operations — $1,045 for every man, woman and child in the United States.1 In 2016 alone, API estimates that approximately $17.1 billion was spent on the environment; $15.3 billion was spent implementing new technologies, creating cleaner fuels and funding ongoing environmental initiatives. An additional $1.7 billion went toward research and development, corporate environmental programs and spill remediation efforts.
• 30% of the industry’s environmental expenditures in 2016 targeted air pollution abatement; meeting or surpassing the requirements of the 1990 Clean Air Act.
• Refineries across the nation implemented new processes designed to dramatically reduce the presence of sulfur in gasoline and diesel — years ahead of federal requirement to do so.
$0
$5
$10
$15
$20
$25
$30
$35
R&D and Corporate Programs
Marketing
Re�ning
Transportation
Exploration and production
2007 2008 2009 2010 2011 2012 2013 2014 2015 2016
R&D and Corporate ProgramsMarketing
Refining
Transportation
Exploration and Production
* Remediation & Spills expenditures are included in the
sector numbers and are reported data only. 2010 data is
unusually high due to an outlier event. The remaining sector
expenditures are estimated for the entire industry.
1 Based on 2016 U.S. population estimate of 324 million by
U.S. Census Bureau.
Figure 1U.S. Environmental Expenditures 2007-2016 by (by sector*)
About This ReportExpenditures covered in this report are those related to the prevention, control, abatement, or elimination of environmental pollution by the U.S. oil and natural gas industry in the United States and its territories. API sends questionnaires to a sample of companies that are representative of the industry. To ensure accurate and comparable responses, API includes detailed guidelines and definitions for completing the survey. After checking for consistency, API uses this sample to estimate the industry’s overall environmental expenditures.
The industry has spent $1,045 on the
environment for every man, woman and child
in the United States.
Bill
ions

Copyright 2018 – API, all rights reserved. 2
Investment Priorities by Industry SectorThe U.S. oil and natural gas industry’s business operations are divided into four major sectors: exploration and production, refining, transportation, and marketing. Following is a brief overview of how environmental expenditures have been allocated across these sectors:
Exploration and Production: The U.S. is the number one producer of oil and natural gas in the world, with approximately 888,7522 producing oil and natural gas wells operating onshore and approximately 3,6713 oil and natural gas platforms operating offshore in U.S. state and federal waters. These wells produce approximately 12.4 billion4 barrels of oil and almost 32.6 trillion5 cubic feet of natural gas annually.
Refining: The nation’s 141 refineries, which process more than 18 million6 barrels of crude oil every day, are constantly upgrading their operations to produce ever-cleaner fuels and meet the growing variety of state and local mandates for fuel formulation.
Transportation: Petroleum products move from well to refinery to market through a network of tanker ships, pipelines, barges, and tanker trucks. Among the industry’s key environmental investments in this segment: By 2016, all tankers and barges operating in U.S. waters will feature double hulls, which help to contain cargo and prevent spills in the event of a collision or grounding.
Marketing: According to the National Association of Convenience Stores (NACS), there are more than 120 thousand convenience stores selling motor fuels across the United States. In recent years, the petroleum industry has made a major investment to upgrade underground storage tanks and install leak detection devices, helping to protect communities and groundwater supplies.
Other: Non-sector specific corporate programs such as planting trees or junking old cars. Also includes Research & Development expenditures to reduce pollution and emissions.
2 Website link: http://info.drillinginfo.com
3 Bureau of Ocean Management - https://www.data.boem.gov/Leasing/OffshoreStatsbyWD/Default.aspx
4 U.S. EIA, Monthly Energy Review October 2017, Table 3.1
5 U.S. EIA, Monthly Energy Review October 2017, Table 4.1
6 U.S. EIA, Number and Capacity of Petroleum Refineries - https://www.eia.gov/dnav/pet/pet_pnp_cap1_a_(na)_8D0_BpCD_a.htm

Copyright 2018 – API, all rights reserved. 3
R&D and Corporate Programs
Marketing
Re�ning
Transportation
Exploration and production
Figure 22016 Environmental Expenditures by Sector7
(in billions of dollars) Total Expenditures = $17.1 billion
7 Remediation & Spills expenditures are included in the sector numbers and are reported data only. The remaining sector expenditures are estimated for the entire industry.
Figure 3Spending on the Environment per Business Sector since19908 (in billions of dollars)
1990-2016: Total Expenditures = $338.8 billion
8 Remediation & Spills expenditures are included in the sector numbers and are reported data only. The remaining sector expenditures are estimated for the entire industry.
Exploration and Production: 30% | $102.5
R&D and Corporate Programs: 3% | $10.6
Transportation: 11% | $37.9
Refining: 49% | $166.1
Other
Marketing
Re�ning
Transportation
Exploration and production
Transportation: 18% | $3.01
Exploration and Production: 40% | $6.91
Marketing: 3% | $0.43 Other: 4% | $0.74
Refining: 35% | $5.97
Marketing: 7% | $21.6

Copyright 2018 – API, all rights reserved. 4
Other
Remediation & Spills
Air
water
Waste
Figure 42016 Environmental Expenditures by Medium9
(in billions of dollars) Total Expenditures = $17.1 billion
9 Remediation & Spills expenditures are included in the sector numbers and are reported data only. The remaining sector expenditures are estimated for the entire industry.
Wastes: 10% | $1.6
Other: 28% | $4.8
Air: 30% | $5.1
Water:26% | $4.5
Remediation and Spills:6% | $1.0
Historically, a majority of the investments
have focused on achieving reductions in
airborne emissions.
Investment Priorities by Emissions MediumThe following charts illustrate how the U.S. oil and natural gas industry’s environmental expenditures have been targeted toward reducing emissions by air, water, and land. Historically, a majority of the investments have focused on achieving reductions in airborne emissions.
• The emphasis on air pollution control is driven by the requirements of the 1990 Clean Air Act Amendments and subsequent regulations to reduce emissions from so-called “stationary sources” (industrial facilities such as refineries) and “mobile sources” (cars, trucks, etc.).
• Federal and state environmental programs aimed at reducing carbon monoxide, smog, and air toxics require the sale of oxygenated, reformulated, and low-volatility (evaporates more slowly) gasolines in certain parts of the country. The exact formulations required vary from one jurisdiction to the next, so the petroleum industry must modify its processes accordingly. These reformulated fuels often cost more to produce than conventional gasoline.

Copyright 2018 – API, all rights reserved. 5
Other
Remediation & Spills
Air
water
Waste
Figure 6U.S. Gasoline Requirements
Note: This map is not intended to provide legal advice or to be used as guidance for state and/or federal fuel requirements, including but not limited to oxy fuel or RFG compliance requirements. API makes no representations or warranties, express or otherwise, as to the accuracy or completeness of this map.
ExxonMobil As of June 2015
Figure 51990-2016 Environmental Expenditures by Medium10
(in billions of dollars) Total Expenditures = $338.8 billion
10 Remediation & Spills expenditures are included in the sector numbers and are reported data only. The remaining sector expenditures are estimated for the entire industry.
Remediation and Spills:13% | $44.3
Wastes: 8% | $25.5
Air: 41% | $138.7
Water: 21% | $72.8
Other:17% | $57.5

Copyright 2018 – API, all rights reserved. 6
Table 1Total U.S. Environmental Expenditures: 2007-2016*
(in millions of dollars)
YearOngoing Activities
Research and Development
Corporate Programs Subtotal
Remediation and Spills Total
2007 11,988 78 267 12,333 1,623 13,956
2008 17,383 115 385 17,882 1,490 19,372
2009 12,412 145 365 12,922 1,670 14,592
2010 15,454 135 302 15,891 14,634 30,525
2011 11,037 114 337 11,487 1,427 12,914
2012 13,152 94 218 13,464 1,483 14,947
2013** 14,622 61 242 14,926 1,372 16,298
2014 16,106 204 243 16,553 1,379 17,931
2015 17,879 326 204 18,408 1,288 19,696
2016 15,320 509 206 16,034 1,025 17,060
10-Year Total 145,353 1,780 2,768 149,900 27,392 177,292
* All expenditures are estimated except for remediation and spills. In 2010, Remediation and spills are unusually high because of an outlier event.
* * Pre 2013 Exploration and Production expenditures were partly estimated using the annual NGL wellhead price. Effective January 2013 the wellhead price was discontinued.
Post 2012 Exploration and Production expenditures were partly estimated using the Henry Hub spot price.

Copyright 2018 – API, all rights reserved. 7
Table 3Summary of Estimated U.S. Environmental Expenditures: 2007-2016 (in millions of dollars)
Sector 2007 2008 2009 2010 2011 2012 2013* 2014 2015 2016 10-Year
Exploration and production:
Capital 1,252 1,904 1,222 1,068 1,276 2,820 3,063 4,583 3,195 2,642 23,025
O & M1 1,962 2,511 1,642 2,086 2,597 2,269 3,401 3,641 6,087 3,989 30,186
Subtotal 3,214 4,415 2,864 3,154 3,873 5,089 6,464 8,224 9,282 6,631 53,210
Transportation:
Capital 327 310 441 450 975 1,046 1,565 1,271 1,259 818 8,462
O & M1 348 691 228 698 1,145 1,344 1,273 1,424 1,729 1,977 10,857
Subtotal 675 1,002 669 1,148 2,120 2,390 2,839 2,694 2,988 2,796 19,320
Refining
Capital 3,529 6,696 4,502 7,385 2,016 2,234 1,546 1,727 1,940 2,295 33,869
O & M1 4,373 4,884 4,229 3,634 2,918 3,298 3,535 3,282 3,491 3,409 37,053
Subtotal 7,902 11,580 8,731 11,019 4,934 5,532 5,081 5,009 5,431 5,704 70,922
Marketing
Capital 116 284 83 35 51 45 115 84 83 78 975
O & M1 81 102 65 98 58 96 124 95 96 111 926
Subtotal 197 386 149 133 109 141 239 179 179 190 1,901
Other
Research and development 78 115 145 135 114 94 61 204 326 509 1,780
Corporate Programs 267 385 365 302 337 218 242 243 204 206 2,768
Grand Total 12,333 17,882 12,922 15,891 11,487 13,464 14,926 16,553 18,408 16,034 149,900 1 Operations, maintenance, and administration. * In 2010, Remediation and Spills are unusually high because of an outlier event.
Table 2Summary of U.S. Environmental Expenditures by Medium: 2007-2016 (in millions of dollars)
Year Air Water Wastes Other Subtotal1 Remediation2 Spills2 Total
2007 7,019 2,177 947 2,189 12,333 1,481 142 13,956
2008 10,711 3,033 1,288 2,849 17,882 1,321 170 19,372
2009 7,526 2,380 905 2,111 12,922 1,342 328 14,592
2010 9,699 2,672 948 2,573 15,891 1,906 12,728 30,525
2011 4,522 2,611 1,018 3,336 11,487 1,118 309 12,914
2012 4,766 3,763 1,194 3,740 13,464 1,197 286 14,947
2013* 4,623 4,054 1,547 4,702 14,926 1,079 294 16,298
2014 5,136 4,655 1,717 5,044 16,553 999 379 17,931
2015 4,929 5,098 2,044 6,337 18,408 961 326 19,696
2016 5,094 4,513 1,642 4,786 16,034 852 173 17,060
10-Year Total 64,026 34,957 13,250 37,666 149,900 12,257 15,135 177,292
1 Includes expenditures for ongoing activities, research & development, and corporate programs
2 Aggregate of amounts reported by participants in API’s survey. In 2010, remediation & rpills are unusually high because of an outlier event
* Pre 2013 Exploration and Production expenditures were partly estimated using the annual NGL wellhead price. Effective January 2013 the wellhead price was discontinued. Post 2012 Exploration and
Production expenditures were partly estimated using the Henry Hub spot price.

Copyright 2018 – API, all rights reserved. 8
Table 4‘Summary of Reported U.S. Environmental Expenditures on Remediation and Spills by Sector: 2007-2016 (in millions of dollars)
Sector 2007 2008 2009 2010* 2011 2012 2013* 2014 2015 2016 10-Year
Exploration and Production:
Remediation 646 481 566 1,096 223 273 276 246 212 169 4,188
Spills 63 75 87 12,641 111 199 150 299 181 107 13,914
Subtotal 710 556 653 13,737 334 472 425 545 393 277 18,101
Transportation
Remediation 50 67 68 101 66 141 153 128 162 170 1,106
Spills 22 42 56 51 164 53 111 54 123 47 721
Subtotal 72 109 124 153 229 194 264 182 284 217 1,827
Refining
Remediation 314 283 213 279 278 416 359 326 304 253 3,025
Spills 49 43 177 32 23 29 28 22 18 14 436
Subtotal 363 326 390 311 301 446 387 348 322 267 3,462
Marketing
Remediation 422 430 413 363 472 333 278 282 258 240 3,491
Spills 6 8 2 2 1 1 3 4 4 3 33
Subtotal 428 437 415 365 473 333 281 287 262 243 3,524
Research and Development
Remediation 50 60 82 67 79 34 13 17 25 20 447
Spills 2 2 6 2 10 4 3 1 1 1 31
Subtotal 52 62 88 68 89 38 16 18 26 21 477
Grand Total 1,623 1,490 1,670 14,634 1,427 1,483 1,372 1,379 1,288 1,025 27,392
* In 2010, Remediation and Spills are unusually high because of an outlier event
* Pre 2013 Exploration and Production expenditures were partly estimated using the annual NGL wellhead price. Effective January 2013 the wellhead price was discontinued. Post 2012 Exploration and
Production expenditures were partly estimated using the Henry Hub spot price.
Copyright 2018 – API, all rights reserved. 9
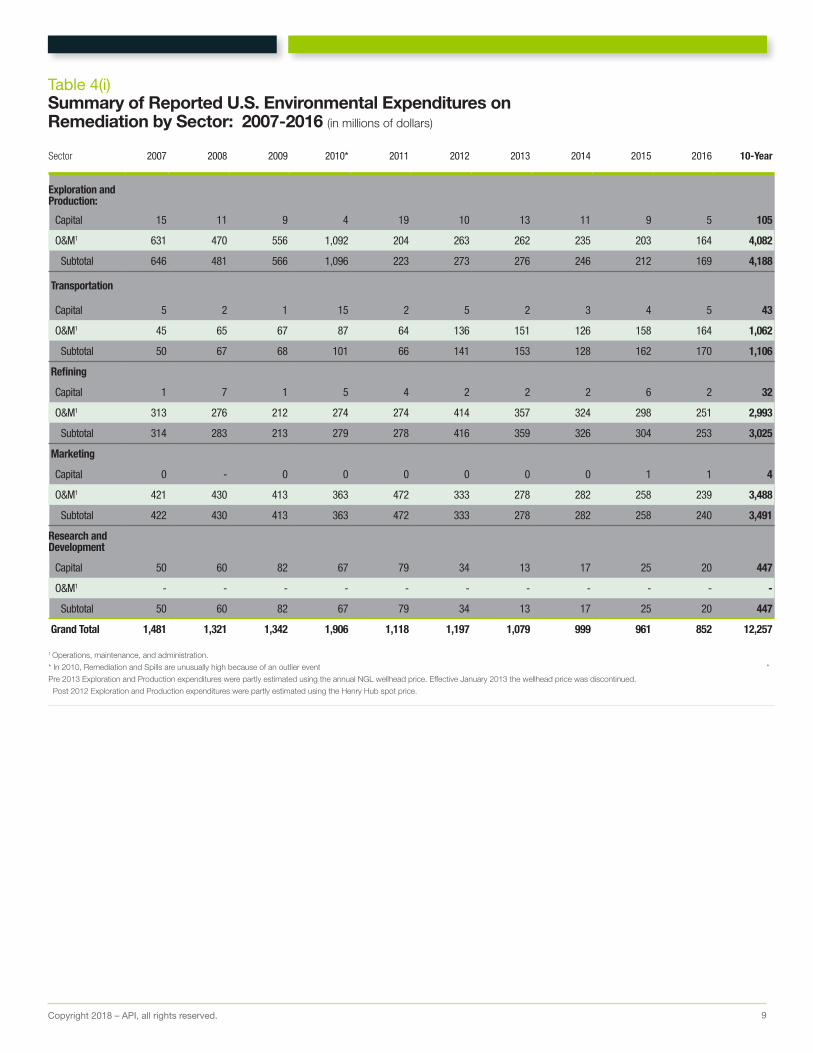
Table 4(i)Summary of Reported U.S. Environmental Expenditures on Remediation by Sector: 2007-2016 (in millions of dollars)
Sector 2007 2008 2009 2010* 2011 2012 2013 2014 2015 2016 10-Year
Exploration and Production:
Capital 15 11 9 4 19 10 13 11 9 5 105
O&M1 631 470 556 1,092 204 263 262 235 203 164 4,082
Subtotal 646 481 566 1,096 223 273 276 246 212 169 4,188
Transportation
Capital 5 2 1 15 2 5 2 3 4 5 43
O&M1 45 65 67 87 64 136 151 126 158 164 1,062
Subtotal 50 67 68 101 66 141 153 128 162 170 1,106
Refining
Capital 1 7 1 5 4 2 2 2 6 2 32
O&M1 313 276 212 274 274 414 357 324 298 251 2,993
Subtotal 314 283 213 279 278 416 359 326 304 253 3,025
Marketing
Capital 0 - 0 0 0 0 0 0 1 1 4
O&M1 421 430 413 363 472 333 278 282 258 239 3,488
Subtotal 422 430 413 363 472 333 278 282 258 240 3,491
Research and Development
Capital 50 60 82 67 79 34 13 17 25 20 447
O&M1 - - - - - - - - - - -
Subtotal 50 60 82 67 79 34 13 17 25 20 447
Grand Total 1,481 1,321 1,342 1,906 1,118 1,197 1,079 999 961 852 12,257 1 Operations, maintenance, and administration.
* In 2010, Remediation and Spills are unusually high because of an outlier event *
Pre 2013 Exploration and Production expenditures were partly estimated using the annual NGL wellhead price. Effective January 2013 the wellhead price was discontinued.
Post 2012 Exploration and Production expenditures were partly estimated using the Henry Hub spot price.

Copyright 2018 – API, all rights reserved. 10
Table 4(ii)Summary of Reported U.S. Environmental Expenditures on Spills by Sector: 2007-2016 (in millions of dollars)
Sector 2007 2008 2009 2010* 2011 2012 2013 2014 2015 2016 10-Year
Exploration and Production:
Capital 6 19 39 13 54 142 99 221 92 62 747
O&M1 57 56 49 12,628 58 57 51 78 89 45 13,167
Subtotal 63 75 87 12,641 111 199 150 299 181 107 13,914
Transportation
Capital 2 13 1 7 11 7 6 5 5 3 62
O&M1 20 29 55 44 152 45 105 49 117 44 660
Subtotal 22 42 56 51 164 53 111 54 123 47 721
Refining
Capital 6 11 25 12 7 12 15 10 10 5 113
O&M1 44 33 152 21 17 17 12 12 9 9 324
Subtotal 49 43 177 32 23 29 28 22 18 14 436
Marketing
Capital 0 0 0 0 0 0 2 2 1 1 6
O&M1 6 7 2 1 1 1 1 3 2 3 26
Subtotal 6 8 2 2 1 1 3 4 4 3 33
Research and Development
Capital 2 2 6 2 10 4 3 1 1 1 31
O&M1 - - - - - - - - - - -
Subtotal 2 2 6 2 10 4 3 1 1 1 31
Grand Total 142 170 328 12,728 309 286 294 379 326 173 15,135 1 Operations, maintenance, and administration.
* In 2010, Remediation and Spills are unusually high because of an outlier event
* Pre 2013 Exploration and Production expenditures were partly estimated using the annual NGL wellhead price. Effective January 2013 the wellhead price was discontinued.
Post 2012 Exploration and Production expenditures were partly estimated using the Henry Hub spot price.

Copyright 2018 – API, all rights reserved. 11
Table 5U.S. Market Share of Survey Participants: 2007-2016
Sector
YearExploration and Production1
Upstream Revenues (dollars)Transportation2
Trunkline Miles (barrel miles)Refining3
Refinery Capacity (b/cd)Marketing4
Gasoline Sales Volumes (gallons)
2007 46% 31% 56% 51%
2008 37% 23% 58% 51%
2009 52% 44% 57% 45%
2010 37% 55% 61% 60%
2011 36% 50% 66% 55%
2012 29% 49% 54% 51%
2013 35% 44% 56% 57%
2014 27% 48% 57% 59%
2015 34% 44% 53% 61%
2016 35% 67% 53% 63%
1Estimate based on API surveys and U.S. Department of Energy, Energy Information Administration, “Petroleum Supply Annual.” 2Oil and Gas Journal, “Pipeline Economics.” 3U.S. Department of Energy, Energy Information Administration, “Petroleum Supply Annual.” 4U.S. Department of Transportation, Federal Highway Administration, “Monthly Motor Fuel Reported by States.”

Copyright 2018 – API, all rights reserved. 12
YearExploration
and Production Transportation Refining MarketingR&D and
Corporate Programs Total
2007:Estimate 3,214 675 7,902 197 345 12,333 Margin of error ± 39.2% ± 13.1% ± 4.2% ± 12.9% ± 53.3% ± 10.7%
2008:Estimate 4,415 1,002 11,580 386 499 17,882 Margin of error ± 21.9% ± 32.6% ± 9.1% ± 7.3% ± .0% ± 8.2%
2009:Estimate 2,864 669 8,731 149 510 12,922 Margin of error ± 4.9% ± 21.6% ± 3.0% ± 11.7% ± .0% ± 2.6%
2010:Estimate 3,154 1,148 11,019 133 437 15,891 Margin of error ± 4.1% ± 10.0% ± 3.8% ± 13.5% ± .0% ± 2.9%
2011:Estimate 3,873 2,120 4,934 109 450 11,487 Margin of error ± 13.4% ± 14.8% ± 13.3% ± 7.3% ± .0% ± 7.8%
2012:Estimate 5,089 2,390 5,532 141 312 13,464 Margin of error ± 7.3% ± 14.1% ± 6.6% ± 15.6% ± .0% ± 4.6%
2013:Estimate 6,464 2,839 5,081 239 304 14,926 Margin of error ± 5.6% ± 23.0% ± 10.4% ± 12.4% ± .0% ± 6.1%
2014:Estimate 8,224 2,694 5,009 179 447 16,553 Margin of error ± 7.8% ± 23.3% ± 11.1% ± 17.7% ± .0% ± 6.4%
2015:Estimate 9,282 2,988 5,431 179 529 18,408 Margin of error ± 13.0% ± 23.7% ± 9.5% ± 18.8% ± .0% ± 8.1%
2016:Estimate 6,631 2,796 5,704 190 715 16,034 Margin of error ± 18.2% ± 23.9% ± 9.6% ± 16.9% ± .0% ± 9.2%
Table 6 Margins of Error in API Estimates: 2007-2016 (estimates in millions of dollars)

Copyright 2018 – API, all rights reserved. 13
Table 8Estimated U.S. Environmental Expenditures by Medium: 1991 (in millions of dollars)
Sector Air Water Wastes Other Total
Exploration & ProductionCapital 176 425 76 52 729O&M1 106 380 121 217 824
Subtotal 282 805 197 269 1,553 Transportation
Capital 59 179 4 49 291O&M1 79 215 32 120 446
Subtotal 138 394 36 169 737 Refining
Capital 1,240 467 65 37 1,809O&M1 1,002 601 335 371 2,309
Subtotal 2,242 1,068 400 408 4,118 Marketing
Capital 66 189 28 46 329O&M1 28 101 92 96 317
Subtotal 94 290 120 142 646 Other
R&D 157 37 27 6 227Corporate Programs 49 18 5 49 121
Grand Total 2,962 2,612 785 1,043 7,402
1 Operations, Maintenance and Administration.
Table 7Estimated U.S. Environmental Expenditures by Medium: 1990 (in millions of dollars)
Sector Air Water Wastes Other Total
Exploration & ProductionCapital 109 424 74 46 653O&M1 101 540 92 139 872
Subtotal 210 964 166 185 1,525 Transportation
Capital 46 149 8 74 277O&M1 43 181 15 150 389
Subtotal 89 330 23 224 666 Refining
Capital 601 569 100 16 1,286O&M1 1,217 620 279 308 2,424
Subtotal 1,818 1,189 379 324 3,710 Marketing
Capital 27 163 17 22 229O&M1 26 76 80 29 211
Subtotal 53 239 97 51 440 Other
R&D 102 39 26 8 175Corporate Programs 2 3 1 141 147
Grand Total 2,274 2,764 692 933 6,663
1 Operations, Maintenance and Administration.

Copyright 2018 – API, all rights reserved. 14
Table 10Estimated U.S. Environmental Expenditures by Medium: 1993 (in millions of dollars)
Table 9Estimated U.S. Environmental Expenditures by Medium: 1992 (in millions of dollars)
Sector Air Water Wastes Other Total
Exploration & ProductionCapital 173 430 99 41 743O&M1 70 393 175 185 823
Subtotal 243 823 274 226 1,566Transportation
Capital 81 232 5 47 365O&M1 84 294 25 198 601
Subtotal 165 526 30 245 966Refining
Capital 2,533 573 153 23 3,282O&M1 1,087 528 333 578 2,526
Subtotal 3,620 1,101 486 601 5,808Marketing
Capital 77 232 45 12 366O&M1 35 92 85 63 275
Subtotal 112 324 130 75 641Other
R&D 137 26 24 27 214Corporate Programs 8 13 8 49 78
Grand Total 4,285 2,813 952 1,223 9,273
1 Operations, Maintenance and Administration.
Sector Air Water Wastes Other Total
Exploration & ProductionCapital 174 496 114 75 859O&M1 86 288 118 212 704
Subtotal 259 785 232 287 1,563Transportation
Capital 106 228 10 30 374O&M1 71 267 28 232 598
Subtotal 177 496 38 261 972Refining
Capital 2,500 567 130 19 3,215O&M1 1,212 457 279 536 2,483
Subtotal 3,712 1,023 409 554 5,698Marketing
Capital 167 161 46 21 395O&M1 65 79 100 104 347
Subtotal 232 239 146 125 742Other
R&D 127 30 25 46 227Corporate Programs 31 49 53 113 246
Grand Total 4,539 2,622 902 1,385 9,448
1 Operations, Maintenance and Administration.

Copyright 2018 – API, all rights reserved. 15
Table 11Estimated U.S. Environmental Expenditures by Medium: 1994 (in millions of dollars)
Table 12Estimated U.S. Environmental Expenditures by Medium: 1995 (in millions of dollars)
Sector Air Water Wastes Other Total
Exploration & ProductionCapital 166 474 129 58 828O&M1 102 289 128 212 731
Subtotal 268 763 257 270 1,559 Transportation
Capital 98 121 6 62 288O&M1 65 197 28 294 584
Subtotal 163 318 35 356 872 Refining
Capital 2,481 481 143 12 3,118O&M1 1,564 586 264 402 2,815
Subtotal 4,045 1,068 407 414 5,933 Marketing
Capital 187 160 34 13 393O&M1 96 75 90 77 339
Subtotal 283 235 124 90 732 Other
R&D 95 26 20 35 175Corporate Programs 13 15 12 154 194
Grand Total 4,868 2,423 854 1,320 9,465
1 Operations, Maintenance and Administration.
Sector Air Water Wastes Other Total
Exploration & ProductionCapital 73 379 90 54 596O&M1 103 262 128 233 726
Subtotal 176 641 218 287 1,322 Transportation
Capital 123 80 3 40 246O&M1 58 195 36 275 563
Subtotal 181 275 38 315 809 Refining
Capital 1,795 271 74 19 2,158O&M1 2,173 543 273 362 3,351
Subtotal 3,968 814 346 381 5,509 Marketing
Capital 61 108 24 17 211O&M1 73 40 62 122 297
Subtotal 134 148 86 140 508 Other
R&D 81 21 16 38 156Corporate Programs 24 16 17 84 141
Grand Total 4,564 1,915 720 1,245 8,445
1 Operations, Maintenance and Administration.

Copyright 2018 – API, all rights reserved. 16
Table 13Estimated U.S. Environmental Expenditures by Medium: 1996 (in millions of dollars)
Table 14Estimated U.S. Environmental Expenditures by Medium: 1997 (in millions of dollars)
Sector Air Water Wastes Other Total
Exploration & ProductionCapital 118 474 95 74 762O&M1 104 323 113 280 820
Subtotal 222 797 209 354 1,582 Transportation
Capital 98 129 12 18 257O&M1 97 231 36 393 757
Subtotal 195 360 48 410 1,013 Refining
Capital 614 159 34 21 826O&M1 2,398 431 207 95 3,132
Subtotal 3,012 590 241 116 3,958 Marketing
Capital 36 101 12 15 165O&M1 96 48 70 53 267
Subtotal 133 149 83 68 432 Other
R&D 41 17 11 33 103Corporate Programs 25 40 17 104 187
Grand Total 3,628 1,953 608 1,086 7,276
1 Operations, Maintenance and Administration.
Sector Air Water Wastes Other Total
Exploration & ProductionCapital 161 557 131 79 928O&M1 107 319 131 219 776
Subtotal 268 876 263 298 1,705 Transportation
Capital 62 181 4 11 258O&M1 37 110 31 210 388
Subtotal 99 291 35 221 645 Refining
Capital 342 144 25 8 519O&M1 2,748 530 262 97 3,637
Subtotal 3,090 674 287 105 4,156 Marketing
Capital 21 174 33 21 249O&M1 100 70 51 76 297
Subtotal 121 244 84 97 545 Other
R&D 27 14 11 38 90Corporate Programs 23 24 20 116 183
Grand Total 3,628 2,122 700 875 7,324
1 Operations, Maintenance and Administration.

Copyright 2018 – API, all rights reserved. 17
Table 15Estimated U.S. Environmental Expenditures by Medium: 1998 (in millions of dollars)
Table 16Estimated U.S. Environmental Expenditures by Medium: 1999 (in millions of dollars)
Sector Air Water Wastes Other Total
Exploration & ProductionCapital 164 382 154 72 772O&M1 123 315 126 240 805
Subtotal 287 697 280 313 1,577 Transportation
Capital 12 410 5 41 468O&M1 25 122 25 176 347
Subtotal 37 531 30 217 815 Refining
Capital 915 112 41 10 1,078O&M1 2,152 549 297 364 3,361
Subtotal 3,067 661 337 374 4,439 Marketing
Capital 61 271 6 47 384O&M1 60 96 70 31 256
Subtotal 120 366 76 78 640 Other
R&D 45 16 7 34 102Corporate Programs 17 5 4 144 170
Grand Total 3,573 2,277 734 1,159 7,743
1 Operations, Maintenance and Administration.
Sector Air Water Wastes Other Total
Exploration & ProductionCapital 117 339 145 58 658O&M1 123 385 284 343 1,135
Subtotal 239 724 430 400 1,793 Transportation
Capital 11 464 8 1 484O&M1 29 144 19 179 371
Subtotal 40 607 27 181 855 Refining
Capital 467 91 32 7 597O&M1 2,130 459 178 202 2,970
Subtotal 2,597 550 210 209 3,567 Marketing
Capital 19 95 2 13 130O&M1 143 65 23 74 305
Subtotal 162 161 25 87 435 Other
R&D 35 12 3 29 79Corporate Programs 12 8 4 94 118
Grand Total 3,085 2,062 699 1,001 6,846
1 Operations, Maintenance and Administration.

Copyright 2018 – API, all rights reserved. 18
Table 17Estimated U.S. Environmental Expenditures by Medium: 2000 (in millions of dollars)
Table 18Estimated U.S. Environmental Expenditures by Medium: 2001 (in millions of dollars)
Sector Air Water Wastes Other Total
Exploration & ProductionCapital 148 598 131 108 984O&M1 123 295 94 232 744
Subtotal 270 893 225 339 1,728 Transportation
Capital 35 254 19 15 324O&M1 73 336 82 307 798
Subtotal 108 591 101 322 1,122 Refining
Capital 572 182 28 82 864O&M1 2,384 408 202 82 3,077
Subtotal 2,957 590 230 164 3,941 Marketing
Capital 18 67 0 7 91O&M1 22 56 27 44 148
Subtotal 40 123 27 50 239 Other
R&D2 91 13 7 9 120Corporate Programs 9 7 2 36 54
Grand Total 3,474 2,216 593 921 7,205
1 Operations, Maintenance and Administration.
Sector Air Water Wastes Other Total
Exploration & ProductionCapital 93 508 125 129 855O&M1 157 393 145 225 920
Subtotal 250 901 270 355 1,776 Transportation
Capital 31 255 23 2 311O&M1 54 385 56 143 638
Subtotal 85 639 79 145 948 Refining
Capital 977 106 24 48 1,156O&M1 2,576 443 272 139 3,430
Subtotal 3,553 549 296 187 4,586 Marketing
Capital 25 161 0 14 200O&M1 23 53 37 47 160
Subtotal 48 214 37 62 360 Other
R&D 111 29 7 15 162Corporate Programs 7 5 1 30 43
Grand Total 4,054 2,337 690 794 7,875
1 Operations, Maintenance and Administration.

Copyright 2018 – API, all rights reserved. 19
Table 19Estimated U.S. Environmental Expenditures by Medium: 2002 (in millions of dollars)
Table 20Estimated U.S. Environmental Expenditures by Medium: 2003 (in millions of dollars)
Sector Air Water Wastes Other Total
Exploration & ProductionCapital 110 369 95 96 670O&M1 74 209 77 257 617
Subtotal 184 578 172 353 1,287 Transportation
Capital 83 173 4 33 293O&M1 58 187 60 403 708
Subtotal 141 360 64 436 1,001 Refining
Capital 2,092 157 12 114 2,376O&M1 1,881 579 279 99 2,838
Subtotal 3,973 736 291 214 5,214 Marketing
Capital 47 116 — 61 224O&M1 46 61 28 20 154
Subtotal 93 177 28 81 378 Other
R&D 172 33 6 14 225Corporate Programs 7 3 1 193 203
Grand Total 4,570 1,886 561 1,290 8,308
1 Operations, Maintenance and Administration.
Sector Air Water Wastes Other Total
Exploration & ProductionCapital 96 593 188 89 967O&M1 49 223 69 273 614
Subtotal 145 816 257 362 1,580 Transportation
Capital 91 206 27 21 345O&M1 109 203 64 261 637
Subtotal 200 409 91 282 982 Refining
Capital 3,100 103 16 24 3,243O&M1 1,978 458 273 115 2,824
Subtotal 5,078 561 289 140 6,068 Marketing
Capital 11 41 — 58 110O&M1 34 50 24 45 153
Subtotal 45 91 24 103 263 Other
R&D 121 38 6 18 184Corporate Programs 6 1 0 115 122
Grand Total 5,595 1,917 667 1,020 9,199
1 Operations, Maintenance and Administration.
Copyright 2018 – API, all rights reserved. 20
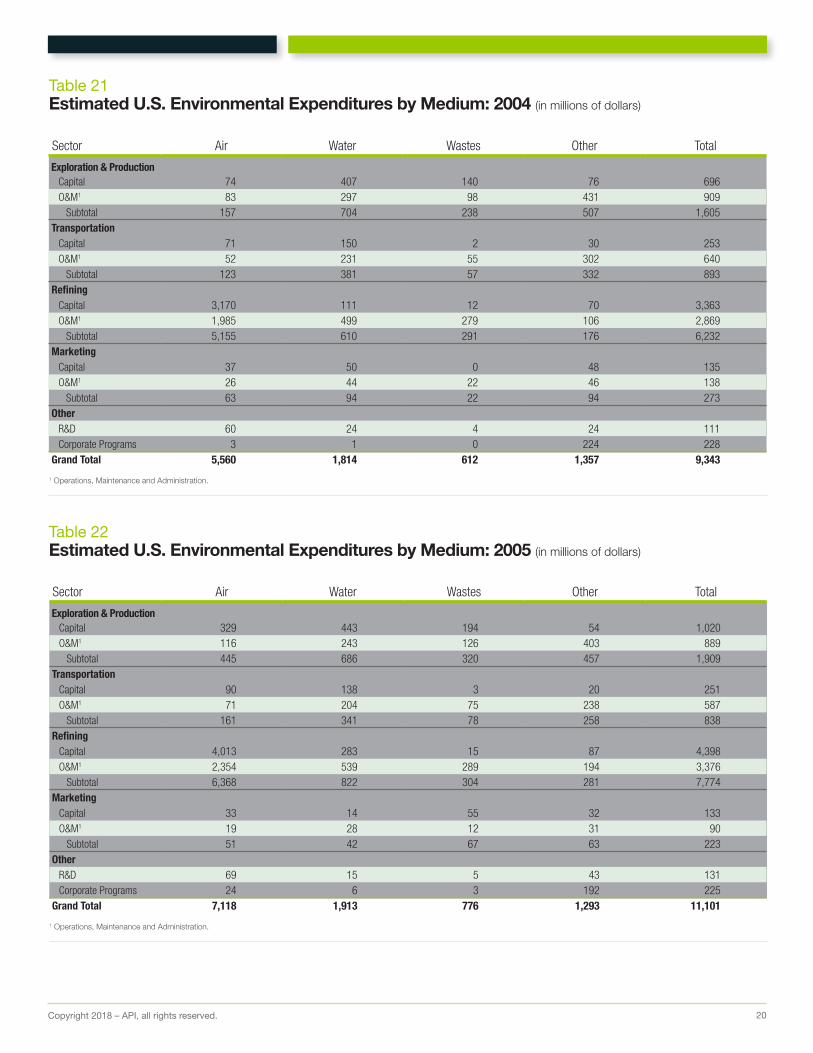
Table 21Estimated U.S. Environmental Expenditures by Medium: 2004 (in millions of dollars)
Table 22Estimated U.S. Environmental Expenditures by Medium: 2005 (in millions of dollars)
Sector Air Water Wastes Other Total
Exploration & ProductionCapital 74 407 140 76 696O&M1 83 297 98 431 909
Subtotal 157 704 238 507 1,605 Transportation
Capital 71 150 2 30 253O&M1 52 231 55 302 640
Subtotal 123 381 57 332 893 Refining
Capital 3,170 111 12 70 3,363O&M1 1,985 499 279 106 2,869
Subtotal 5,155 610 291 176 6,232 Marketing
Capital 37 50 0 48 135O&M1 26 44 22 46 138
Subtotal 63 94 22 94 273 Other
R&D 60 24 4 24 111Corporate Programs 3 1 0 224 228
Grand Total 5,560 1,814 612 1,357 9,343
1 Operations, Maintenance and Administration.
Sector Air Water Wastes Other Total
Exploration & ProductionCapital 329 443 194 54 1,020O&M1 116 243 126 403 889
Subtotal 445 686 320 457 1,909 Transportation
Capital 90 138 3 20 251O&M1 71 204 75 238 587
Subtotal 161 341 78 258 838 Refining
Capital 4,013 283 15 87 4,398O&M1 2,354 539 289 194 3,376
Subtotal 6,368 822 304 281 7,774 Marketing
Capital 33 14 55 32 133O&M1 19 28 12 31 90
Subtotal 51 42 67 63 223 Other
R&D 69 15 5 43 131Corporate Programs 24 6 3 192 225
Grand Total 7,118 1,913 776 1,293 11,101
1 Operations, Maintenance and Administration.

Copyright 2018 – API, all rights reserved. 21
Table 23Estimated U.S. Environmental Expenditures by Medium: 2006 (in millions of dollars)
Table 24Estimated U.S. Environmental Expenditures by Medium: 2007 (in millions of dollars)
Sector Air Water Wastes Other Total
Exploration & ProductionCapital 411 580 164 143 1,298O&M1 111 275 155 736 1,276
Subtotal 522 854 319 880 2,574 Transportation
Capital 208 176 2 42 429O&M1 59 226 37 305 626
Subtotal 267 402 39 347 1,055 Refining
Capital 3,142 310 28 31 3,511O&M1 2,891 519 278 324 4,012
Subtotal 6,033 829 306 356 7,524 Marketing
Capital 13 44 2 43 102O&M1 10 24 12 30 76
Subtotal 23 68 14 73 178 Other
R&D 67 12 6 18 103Corporate Programs 10 2 1 224 237
Grand Total 6,921 2,168 685 1,897 11,671
1 Operations, Maintenance and Administration.
Sector Air Water Wastes Other Total
Exploration & ProductionCapital 336 520 295 101 1,252O&M1 181 248 182 1,350 1,962
Subtotal 518 768 477 1,451 3,214 Transportation
Capital 146 145 3 33 327O&M1 35 104 27 182 348
Subtotal 181 249 30 214 675 Refining
Capital 3,138 306 33 53 3,529O&M1 3,083 734 390 166 4,373
Subtotal 6,221 1,040 422 219 7,902 Marketing
Capital 30 73 0 13 116O&M1 14 32 12 23 81
Subtotal 44 105 12 36 197 Other
R&D 49 13 4 11 78Corporate Programs 7 2 1 257 267
Grand Total 7,019 2,177 947 2,189 12,333
1 Operations, Maintenance and Administration.

Copyright 2018 – API, all rights reserved. 22
Table 25Estimated U.S. Environmental Expenditures by Medium: 2008 (in millions of dollars)
Table 26Estimated U.S. Environmental Expenditures by Medium: 2009 (in millions of dollars)
Sector Air Water Wastes Other Total
Exploration & ProductionCapital 400 865 475 165 1,904O&M1 256 313 290 1,651 2,511
Subtotal 656 1,178 765 1,816 4,415 Transportation
Capital 95 184 4 27 310O&M1 62 261 59 309 691
Subtotal 157 445 64 336 1,002 Refining
Capital 6,038 551 38 70 6,696O&M1 3,581 732 395 176 4,884
Subtotal 9,619 1,283 432 246 11,580 Marketing
Capital 167 88 0 30 284O&M1 20 28 23 31 102
Subtotal 187 116 23 60 386 Other
R&D 85 11 4 15 115Corporate Programs 8 1 0 375 385
Grand Total 10,711 3,033 1,288 2,849 17,882
1 Operations, Maintenance and Administration.
Sector Air Water Wastes Other Total
Exploration & ProductionCapital 271 561 254 136 1,222O&M1 113 210 187 1,132 1,642
Subtotal 384 771 441 1,268 2,864 Transportation
Capital 172 229 3 37 441O&M1 25 87 18 99 228
Subtotal 197 316 21 136 669 Refining
Capital 3,913 467 43 79 4,502O&M1 2,883 747 383 216 4,229
Subtotal 6,796 1,214 426 296 8,731 Marketing
Capital 26 41 0 15 83O&M1 12 18 11 24 65
Subtotal 39 59 11 39 149 Other
R&D 105 19 5 16 145Corporate Programs 6 1 1 356 365
Grand Total 7,526 2,380 905 2,111 12,922
1 Operations, Maintenance and Administration.

Copyright 2018 – API, all rights reserved. 23
Table 27Estimated U.S. Environmental Expenditures by Medium: 2010 (in millions of dollars)
Table 28Estimated U.S. Environmental Expenditures by Medium: 2011 (in millions of dollars)
Sector Air Water Wastes Other Total
Exploration & ProductionCapital 235 512 215 105 1,068O&M1 187 293 252 1,354 2,086
Subtotal 423 805 467 1,460 3,154 Transportation
Capital 95 159 9 187 450O&M1 36 348 52 262 698
Subtotal 131 507 61 449 1,148 Refining
Capital 6,537 665 56 127 7,385O&M1 2,504 624 337 169 3,634
Subtotal 9,041 1,289 393 296 11,019 Marketing
Capital 10 24 0 1 35O&M1 13 19 18 47 98
Subtotal 23 43 18 49 133 Other
R&D 76 28 7 24 135Corporate Programs 5 1 1 296 302
Grand Total 9,699 2,672 948 2,573 15,891
1 Operations, Maintenance and Administration.
Sector Air Water Wastes Other Total
Exploration & ProductionCapital 286 580 206 204 1,276O&M1 236 336 396 1,629 2,597
Subtotal 521 916 603 1,833 3,873 Transportation
Capital 178 332 18 447 975O&M1 59 547 82 458 1,145
Subtotal 236 879 100 905 2,120 Refining
Capital 1,666 266 19 65 2,016O&M1 2,025 474 283 137 2,918
Subtotal 3,691 739 302 202 4,934 Marketing
Capital 8 35 - 8 51O&M1 6 11 7 33 58
Subtotal 14 47 7 41 109 Other
R&D 54 26 5 28 114Corporate Programs 5 3 1 327 337
Grand Total 4,522 2,611 1,018 3,336 11,487
1 Operations, Maintenance and Administration.

Copyright 2018 – API, all rights reserved. 24
Table 29Estimated U.S. Environmental Expenditures by Medium: 2012 (in millions of dollars)
Table 30Estimated U.S. Environmental Expenditures by Medium: 2013 (in millions of dollars)
Sector Air Water Wastes Other Total
Exploration & ProductionCapital 516 1,547 328 429 2,820O&M1 153 317 417 1,383 2,269
Subtotal 669 1,864 745 1,811 5,089 Transportation
Capital 138 278 9 622 1,046O&M1 85 666 89 504 1,344
Subtotal 222 944 98 1,125 2,390 Refining
Capital 1,667 332 21 215 2,234O&M1 2,163 550 319 266 3,298
Subtotal 3,829 882 340 481 5,532 Marketing
Capital 7 31 - 6 45O&M1 1 8 4 83 96
Subtotal 9 39 4 89 141 Other
R&D 27 28 6 33 94Corporate Programs 10 6 1 201 218
Grand Total 4,766 3,763 1,194 3,740 13,464
1 Operations, Maintenance and Administration.
Sector Air Water Wastes Other Total
Exploration & ProductionCapital 521 1,587 372 583 3,063 O&M1 348 422 692 1,939 3,401
Subtotal 869 2,009 1,064 2,522 6,464 Transportation
Capital 204 441 6 915 1,565 O&M1 71 606 102 494 1,273
Subtotal 276 1,046 108 1,409 2,839 Refining
Capital 1,072 266 37 170 1,546 O&M1 2,351 616 328 241 3,535
Subtotal 3,422 882 365 412 5,081 Marketing
Capital 10 87 - 19 115 O&M1 5 9 5 106 124
Subtotal 14 95 5 124 239 Other
R&D 23 14 3 21 61 Corporate Programs 18 9 2 214 242
Grand Total 4,623 4,054 1,547 4,702 14,926 1 Operations, Maintenance and Administration.
* Pre 2013 Exploration and Production expenditures were partly estimated using the annual NGL wellhead price. Effective January 2013 the wellhead price was discontinued. 2013 Exploration and Production
expenditures were partly estimated using the Henry Hub spot price.

Copyright 2018 – API, all rights reserved. 25
Table 32Estimated U.S. Environmental Expenditures by Medium: 2015 (in millions of dollars)
Sector Air Water Wastes Other Total
Exploration & ProductionCapital 572 1,519 498 606 3,195 O&M1 337 1,491 996 3,263 6,087
Subtotal 909 3,009 1,494 3,869 9,282 Transportation
Capital 72 226 3 958 1,259 O&M1 122 879 139 589 1,729
Subtotal 194 1,105 141 1,547 2,988 Refining
Capital 1,449 227 17 247 1,940 O&M1 2,318 646 378 150 3,491
Subtotal 3,767 872 395 397 5,431 Marketing
Capital 4 63 0 16 83 O&M1 4 6 4 82 96
Subtotal 8 69 4 98 179 Other
R&D 31 31 7 257 326 Corporate Programs 21 10 3 169 204
Grand Total 4,929 5,098 2,044 6,337 18,408
1 Operations, Maintenance and Administration.
* Pre 2013 Exploration and Production expenditures were partly estimated using the annual NGL wellhead price. Effective January 2013 the wellhead price was discontinued. 2013 Exploration and Production
expenditures were partly estimated using the Henry Hub spot price.
Table 31Estimated U.S. Environmental Expenditures by Medium: 2014 (in millions of dollars)
Sector Air Water Wastes Other Total
Exploration & ProductionCapital 930 2,230 512 911 4,583 O&M1 280 593 741 2,028 3,641
Subtotal 1,209 2,823 1,254 2,938 8,224 Transportation
Capital 159 287 6 819 1,271 O&M1 80 714 108 522 1,424
Subtotal 239 1,001 113 1,341 2,694 Refining
Capital 1,337 158 28 204 1,727 O&M1 2,287 553 307 135 3,282
Subtotal 3,624 711 335 339 5,009 Marketing
Capital 3 70 0 11 84 O&M1 4 8 5 78 95
Subtotal 6 78 5 89 179 Other
R&D 31 30 7 136 204 Corporate Programs 27 12 3 200 243
Grand Total 5,136 4,655 1,717 5,044 16,553
1 Operations, Maintenance and Administration.

Copyright 2018 – API, all rights reserved. 26
Table 33Estimated U.S. Environmental Expenditures by Medium: 2016 (in millions of dollars)
Sector Air Water Wastes Other Total
Exploration & ProductionCapital 473 1,256 411 501 2,642 O&M1 221 977 653 2,139 3,989
Subtotal 694 2,233 1,064 2,640 6,631 Transportation
Capital 157 299 3 359 818 O&M1 183 945 133 716 1,977
Subtotal 340 1,244 136 1,076 2,796 Refining
Capital 1,722 319 20 234 2,295 O&M1 2,260 611 408 130 3,409
Subtotal 3,982 930 428 364 5,704 Marketing
Capital 7 57 0 15 78 O&M1 6 6 4 95 111
Subtotal 13 63 4 109 190 Other
R&D 42 34 6 427 509 Corporate Programs 22 10 3 170 206
Grand Total 5,094 4,513 1,642 4,786 16,034
1 Operations, Maintenance and Administration.

Copyright 2018 – API, all rights reserved. 27
Technical NotesAPI’s environmental expenditures survey is sent to a stratified sample of the industry: all large and mid-size companies, plus a randomly selected group of smaller companies. Each year since 1990, the survey has been mailed to about 800 companies. In 2016, the data used to complete the survey represent a large share – from 35 percent to 67 percent – of the variables used to estimate expenditures for the entire industry (see Table 5).
To estimate expenditures for the industry as a whole, API used regression and ratio analysis. Different variables were used for different parts of the industry: upstream revenues for exploration and production, trunkline miles for transportation, refinery capacity for refining, and gasoline sales for marketing. To estimate industry-wide expenditures for research and development and corporate programs, API used a combination of these variables.
API’s estimates may differ from the results that would have been obtained if the entire industry, or a different group of companies, had participated in the survey. Table 6 gives the margin of error representing the 95-percent confidence interval for API’s estimates – the range in which the actual value almost certainly lies. Thus, there is a 95 percent probability that the true amount for the industry is within that range.
API estimated that -- excluding remediation and spills -- the entire industry’s environmental expenditures were $16.0 billion in 2016 (the remaining portion of the $17.1 billion – remediation and spills expenditures – is not an industry estimate but only the amounts reported by the survey respondents). The margin of error for this estimate is plus or minus 9.2 percent. This means that API estimates with 95-percent certainty that expenditures were between $14.6 billion and $17.5 billion.
The model used to estimate these expenditures and margins of error assumes perfect accuracy in company responses. However, as with any survey, practical difficulties can also influence results and introduce errors. Many companies do not track environmental spending separately. Others categorize environmental spending differently from the survey. Consequently, some companies are only able to provide a best estimate of what they spend. As a result, although API’s estimates are based on imperfect data, they are the most extensive data available to the public.

Copyright 2018 – API, all rights reserved. 28
DefinitionsAir pollution: Substances emitted into open air that are targeted for reduction by the Clean Air Act and other environmental laws—for example, carbon monoxide, hydrocarbons, lead, nitrogen oxides, particulates, and sulfur dioxide.
Capital expenditures: Costs incurred by ongoing activities to comply with environmental regulations and to minimize or treat output streams. Examples include wastewater treatment plants, stack scrubbers, modifications or additions to plants due to existing or pending laws or regulations, smoke control, groundwater recovery control, dust suppression systems, or other factors that positively influence the environment.
Corporate programs: Activities of company environmental departments. Also, voluntary efforts to improve environmental quality such as supporting environmental education programs; collecting used oil; buying and destroying older, high-polluting cars; and providing free engine tune-ups.
Environmental expenditures: Costs incurred that relate to the prevention, control, abatement, or elimination of environmental pollution. Expenditures are the incremental costs reported by a unit in a facility that would not have been incurred if environmental issues had not been considered.
Low-sulfur gasoline: A specially formulated gasoline that enables the use of advanced catalytic emissions controls on gasoline-powered vehicles, primarily to reduce hydrocarbon, particulate, and nitrogen oxides emissions.
Low-sulfur / Ultra-low-sulfur diesel fuel: A specially formulated diesel fuel that enables the use of advanced catalytic emissions controls, primarily to reduce particulate and nitrogen oxides emissions from diesel-powered engines.
Ongoing activities: Capital, operating, maintenance, and administrative expenses associated with routine operating practices in each sector (E&P, Refining, Transportation, and Marketing) of the industry.
Other media: Recurring activities that are not reported under air, water, or wastes—for example, removing abandoned production platforms, and supporting oil spill cooperatives.
Reformulated gasoline (RFG): A specially blended, cleaner-burning gasoline designed to improve air quality by reducing urban smog. It reduces carbon monoxide and toxic emissions as well as smog-forming emissions. It has less benzene and no heavy metals. RFG is available in all octane grades, and its use is currently required in about one-quarter of the nation (see Figure 8).
Remediation: Cleaning up soil and groundwater contamination. Such contamination is caused by leaks from storage tanks, pipelines, pits, settlement ponds, or underground piping. Contamination may also have resulted from practices allowed in the past, but no longer permitted. Remediation costs, because of their unique nature, cannot be extrapolated to the entire industry. Remediation costs shown in this report are only those reported by survey respondents.
Research and development: Investigating new technologies to limit or reduce emissions or pollution from products and operations— for example, research leading to the development and continuing improvement in reformulated gasoline and diesel fuel.
Spills: Sudden releases of crude oil or petroleum products caused by malfunctions or accidents. Spills costs shown in this report are only those reported by survey respondents, do not include fines and penalties, and are not extrapolated to the entire industry.
Waste management: Collecting, treating, recycling, and disposing of solid or contained wastes. It includes efforts to prevent pollution by reducing waste at the source.
Water pollution: Substances discharged into bodies of water targeted by the Clean Water Act and other environmental laws—for example, oils, metals, solids, and toxic chemicals.

1220 L Street, NW Washington, DC 20005-4070 Phone: 202-682-8528Email: [email protected] www.api.org
Copyright 2018 - American Petroleum Institute,all rights reserved. API and the API logo are either trademarks or registered trademarks of API in the United States and/or other countries.
API Digital Media: 2018-001 | 1.17 | PDF