Oil & Natural Gas Technology - netl.doe.gov
29
1 DOE Award No.: DE-FE0010406 DUNS No.: 170230239 Quarterly Research Performance Progress Report (Period ending 6/30/2013) CONTROLS ON METHANE EXPULSION DURING MELTING OF NATURAL GAS HYDRATE SYSTEMS: TOPIC AREA 2 Project Period (10/1/2012 to 9/30/2015) Submitted by: Peter B. Flemings _________________________ Signature The University of Texas at Austin 101 East 27th Street, Suite 4.300 Austin, TX 78712-1500 e-mail: [email protected] Phone number: 512-475-9520 Prepared for: United States Department of Energy National Energy Technology Laboratory July 29, 2013 Oil & Natural Gas Technology Office of Fossil Energy
Transcript of Oil & Natural Gas Technology - netl.doe.gov
1
DOE Award No.: DE-FE0010406
DOE Award No.: DE-FE0010406
DUNS No.: 170230239
Quarterly Research Performance Progress Report
(Period ending 6/30/2013)
CONTROLS ON METHANE EXPULSION DURING MELTING OF NATURAL GAS HYDRATE SYSTEMS:
TOPIC AREA 2 Project Period (10/1/2012 to 9/30/2015)
Submitted by:
Peter B. Flemings
_________________________ Signature
The University of Texas at Austin 101 East 27th Street, Suite 4.300
Austin, TX 78712-1500 e-mail: [email protected]
Phone number: 512-475-9520
Prepared for: United States Department of Energy
National Energy Technology Laboratory
July 29, 2013
Oil & Natural Gas Technology
Office of Fossil Energy

DOE Award No.: DE-FE0010406 DUNS No.: 170230239 Quarterly Research Performance Progress Report (Period ending 6/30/2012) CONTROLS ON METHANE EXPULSION DURING MELTING OF NATURAL GAS HYDRATE SYSTEMS: TOPIC AREA 2
Page | 1
1 ACCOMPLISHMENTS:
1.1 What are the major goals of the project? The project goal is to predict, given characteristic climate‐induced temperature change scenarios, the conditions under which gas will be expelled from existing accumulations of gas hydrate into the shallow ocean or directly to the atmosphere. When those conditions are met, the fraction of the gas accumulation that escapes and the rate of escape shall be quantified. The predictions shall be applicable in Arctic regions and in gas hydrate systems at the up dip limit of the stability zone on continental margins. The behavior shall be explored in response to two warming scenarios: longer term change due to sea level rise (e.g. 20 thousand years) and shorter term due to atmospheric warming by anthropogenic forcing (decadal time scale).
Milestone Description Planned Completion
Actual Completion
Verification Method
Comments (progress toward achieving milestone, explanation of deviation from plan, etc.)
1.A 1-D simulation of gas hydrate dissociation in natural systems.
9/30/2013 Report
We have simulated hydrate dissociation due to temperature change with a fully coupled model and we are currently further exploring this behavior.
1.B 1-D Simulation of gas hydrate dissociation in laboratory controlled conditions.
3/31/2014 Report
We have performed numerical simulations to guide and design our experimental work to be performed in July and August, 2013.
1.C Model-based determination of conditions required for gas not to reach seafloor/atmosphere from dissociating hydrate accumulation.
3/31/2014 Quarterly Report
We have not yet begun to address this issue.
1.D Determination of what hydrate reservoirs are at three-phase equilibrium.
12/30/2013 Report
We have developed an approach to characterize the in situ stability of hydrate reservoirs. We are applying approach to known reservoirs. See comments below
1.E Demonstrate ability to create and dissociate methane hydrate within sediment columns under conditions analogous to natural systems.
9/30/2013 Report We have developed thermistor strings for use in experimental device. We have developed an experimental plan for our experiments in summer 2013. The experimental design has been modified slightly from that originally proposed. This is because it was decided to first demonstrate the ability to create and dissociate hydrate three phase stability without

DOE Award No.: DE-FE0010406 DUNS No.: 170230239 Quarterly Research Performance Progress Report (Period ending 6/30/2012) CONTROLS ON METHANE EXPULSION DURING MELTING OF NATURAL GAS HYDRATE SYSTEMS: TOPIC AREA 2
Page | 2
adding the additional complexity of cooling from above or below.
2.A 1-D simulation of gas expulsion into hydrate stability zone.
9/29/2014
Report Preliminary simulations produced
2.B Determination of conditions for which gas expulsion into hydrate-stability zone is self-limiting.
12/29/2014
Report
2.C Demonstration of reaction transport experiment where gas invades hydrate stability zone and creates three phase stability.
9/30/2014
Quarterly Report
Currently developing/refining remote sensing technologies. Refining experimental design based on numerical simulation
2.D Demonstrate a 2D simulation of hydrate dissociation and gas expulsion.
3/31/2015
Report
1.2 What was accomplished under these goals?
1.2.1 Task 1: Project Management and Planning: In the last quarter, we on-boarded one post-doctoral scientist and one additional graduate student. We now have 2 students and one post-doctoral scientist working full time on the project, in addition to PI’s Flemings and Bryant, Subcontractor Kneafsey, and lab scientists Peter Polito and Donnie Brooks. We have continued to have bi-monthly meetings with LBNL and between the Department of Geological Sciences and the Dept. of Petroleum and Geosystems Engineering. Our focus has been to design our experimental plans for pursuit in summer 2013.
1.2.2 Task 2: Conceptual and Numerical Model Development -1D: Subtask 2.1 - Dissociation of 1D vertical hydrate accumulation Subtask 2.2 - Apply 1D model to laboratory experiment Subtask 2.3 - 1D models of natural examples Subtask 2.3.1 Hydrate accumulations below permafrost Subtask 2.3.2 - 1D model application to deposits near up-dip limit of stability zone on continental margins
Our progress under Task 2 is described below. We have developed a fully coupled 1D hydrate model. Our specific results are two-fold. First, we have been working to modify our boundary condition at the seafloor to more effectively model the interaction between the sedimentary section and the seafloor. Second, we have performed simulations described in Subtask 2.1, 2.2, 2.3 and 2.3.2. These are described below and in the experimental section.
1.2.2.1 Modification to the boundary condition at the seafloor (Subtask 2.3, 2.3.2) We have initially modeled the boundary condition at the seafloor for the multiphase fluid-flow system of equations governing methane hydrate formation in sediment as physically representing a stream of fluid

DOE Award No.: DE-FE0010406 DUNS No.: 170230239 Quarterly Research Performance Progress Report (Period ending 6/30/2012) CONTROLS ON METHANE EXPULSION DURING MELTING OF NATURAL GAS HYDRATE SYSTEMS: TOPIC AREA 2
Page | 3
that is driven out of the sediment by pressure gradients. We then assume that this effluent enters into the ocean in a well-mixed reservoir of constant temperature and salinity. This is not truly the case. The effluent leaving our porous media impacts the outside reservoir and has the potential then to influence the resulting dynamics within our system. The questions to consider in applying a boundary condition at the seafloor are twofold, 1) Under what conditions will the effluent become quickly mixed into the exterior reservoir? and 2) If not well-mixed in less than our timestep, what is the fate of the effluent? We attribute the diffusion of salt in our system to molecular diffusion as described by Fick’s law. This is an appropriate description because the water masses do not quickly advect in any direction, and thus are allowed to slowly interact by this diffusive process. At the seafloor, horizontal currents, which have been approximated as 5–20 cm/s (Fer and Haugan, 2003), advect the mass of water directly above our theoretical vent making Fickian diffusion impossible. Instead, possible mixing occurs directly from the turbulence caused by these horizontal water currents. The currents induce a shear stress on the seafloor moving the effluent away from the seafloor horizontally and, simultaneously moving it vertically through the water column. If this is an efficient process, then the salinity and temperature directly above the vent can be approximated as homogeneous seawater. The controlling factor on this mixing is based on a competition between potential energy (i.e. gravity) and kinetic energy (i.e. velocity of water current). In the case we are concerned with, a convenient dimensionless parameter is often invoked, called the Richardson number, Ri. When Ri << 1 mixing is very efficient, and when Ri > 1/4 mixing is shut-down entirely and instead there is stable stratification. The generic Ri is described below as Equation 1.
(1) where u is the horizontal velocity and N is described by the equation below, and the velocity gradient is measured over the height, h, of the bottom boundary layer (BBL) where the shear acts.
where g is the acceleration of gravity, ρ is the density of the ambient fluid in the reservoir. I base my analysis of the hot, saline fluid exiting our system after the analysis of Fer and Haugan (2003) and the prevailing literature concerning density stratification (see Turner (1973) also). In Fer and Haugan (2003), effluent escapes a deep sea reservoir and has the potential to mix with the ocean reservoir in much the same way as our hot, saline effluent. Thus, I adopt a few of their definitions. For instance, I define h = 50 m and du/dz = ( 0.1 m/s ) / ( 50 m ) = 2 × 10⁻³ s−1. I also use g = 9.8 m/s2 and the density = 1035 kg/m3. This allows me to solve for the density gradient that would shut down mixing. I will assume that the gradient occurs over a small range of depth, like the grid size in our simulations, 5 − 10m. This leaves

DOE Award No.: DE-FE0010406 DUNS No.: 170230239 Quarterly Research Performance Progress Report (Period ending 6/30/2012) CONTROLS ON METHANE EXPULSION DURING MELTING OF NATURAL GAS HYDRATE SYSTEMS: TOPIC AREA 2
Page | 4
only a very small density difference, less than 1%, that can be easily mixed. Density differences greater than 1% will surely not be well-mixed. Effluent that is highly dense will quickly lose some of its heat due to thermal diffusion, but will only become more dense by this process. Thus, the fate of this effluent depends on an entirely different physical process. The effluent is now dense enough to act as a mobile density current. Such density currents have been studied quite extensively and have even been used as proxies for turbidity currents. Many authors in the context of submarine seeps have discussed the movement of hot, saline density currents. Discussion of saline density currents can be found in Sangster (2002), Turner and Gustafson (1978), and McDougall (1984). These authors describe the velocities of a potential density current and the fate of an evolving brine pool with a constant flux of effluent. The main requirement for transport of the density current is residence on a slope exceeding 4%. It seems invalid to model the boundary condition at the seafloor as the equivalent of a well-mixed reservoir of standard seawater. Instead, when the effluent leaving the vent is on a relatively flat seafloor, there should be a steady accumulation of brine. The more complicated dynamics resulting from cooling of that brine and then further outflow of less dense effluent may produce interesting, nonlinear behavior. A completely valid solution to this boundary condition is to actually model a small portion of the ocean reservoir and maintain a constant mass flux of salt across the boundary.
1.2.2.2 1-D Warming simulations (Subtask 2.1, 2.3, 2.3.2) A recent study published in Nature in 2012 (Phrampus and Hornbach, 2012) hypothesizes that the Gulf Stream has recently shifted closer to the North American Atlantic Coast and is currently destabilizing methane hydrate. This finding is evidenced by seismic data and coupled numerical simulations. The basic argument is that hydrate, as inferred from the presence of a bottom-simulating reflector (BSR) in seismic data, exists below warm Gulf Stream waters. Thermodynamic models suggest this hydrate below the Gulf Stream is not stable, and should be dissociating. However, those same models predict that the hydrate would still be stable if instead of Gulf Stream waters, the hydrate was below colder Atlantic Ocean waters. Phrampus and Hornbach (2012) then simulate the effect an instantaneous shift in the seafloor temperature has on a hydrate deposit. The simulation increases the temperature of the seafloor to match the observed Gulf Stream thermocline; this increase is 2-8 Celsius. The authors find that a temperature increase this substantial would still take on the order of 500 years to fully dissociate a hydrate deposit due to the slow diffusion of heat through the sediment column. We consider this problem with our 1-d multiphase, fluid flow model of methane hydrate formation/dissociation. Our working hypothesis is that the model of Phrampus and Hornbach (2012) is missing essential physics of the dissociation process and thus, may incorrectly approximate the time-scale for dissociation of the methane hydrate deposit. We repeat the basic simulation of Phrampus and Hornbach (2012), but include effects from salinity changes, fluid flow, modification to thermal diffusivity, and the incorporation of latent heat, all of which are absent from the model of Phrampus and Hornbach (2012). We simulate a hydrate deposit by applying our model to a system with water depth of 800 m and a seafloor temperature of 5 Celsius. The base of the hydrate stability zone is 110 mbsf and we accumulate hydrate at this depth until hydrate saturation is 34%. The 34% is arbitrary, but matches the value used in Liu and Flemings, 2009 to simulate the hydrate dissociation in the Atlantic Ocean due to a worldwide sea level drop. The starting case for the 'warming simulation' is presented below as Figure 1.

DOE Award No.: DE-FE0010406 DUNS No.: 170230239 Quarterly Research Performance Progress Report (Period ending 6/30/2012) CONTROLS ON METHANE EXPULSION DURING MELTING OF NATURAL GAS HYDRATE SYSTEMS: TOPIC AREA 2
Page | 5
Figure 1: Initial conditions for 1-D warming simulations. The plots from left to right are Depth vs. Water Pressure, vs. Temperature, vs. Salinity, vs. Gas&Hydrate Saturation, vs. Dissolved methane concentration. We then perturb this system by applying an instantaneous increase in the seafloor temperature of 5 Celsius, so the seafloor is now 10 Celsius. This should dissociate all of the hydrate given sufficient time. We investigate five cases, where each case has a different set of included physics or initial conditions. The five cases are, 1) All physics are included and the salinity profile is exactly as shown in Figure 1; 2) All physics are included, but the salinity profile is everywhere set to seawater salinity (3.5%) at the start of the temperature perturbation; 3) The fluid flow physics are present, but thermodynamics do not include latent heat and the salinity does not evolve; 4) Same as 3, except the salinity profile is reset to be seawater salinity everywhere; 5) Same as 1, except the temperature perturbation is not instantaneous, but a linear increase over a 100 yr period.

DOE Award No.: DE-FE0010406 DUNS No.: 170230239 Quarterly Research Performance Progress Report (Period ending 6/30/2012) CONTROLS ON METHANE EXPULSION DURING MELTING OF NATURAL GAS HYDRATE SYSTEMS: TOPIC AREA 2
Page | 6
Figure 2: Time for complete hydrate dissociation. We present five cases numbered as above. We plot the result of the five cases above as Figure 2. Our model with all relevant physics is most closely related to Case 1, while the results of Phamprus and Hornbach are most closely related to Case 4. The different physics accounts for a 400 yr disparity on the timing of the complete hydrate dissociation. In this particular case, the dramatic disparity is a near-doubling. We might expect similarly strong disparities all over the region studied by Phrampus and Hornbach (2012). Further investigation is being performed to determine if the timing disparity is a function of the temperature perturbation.
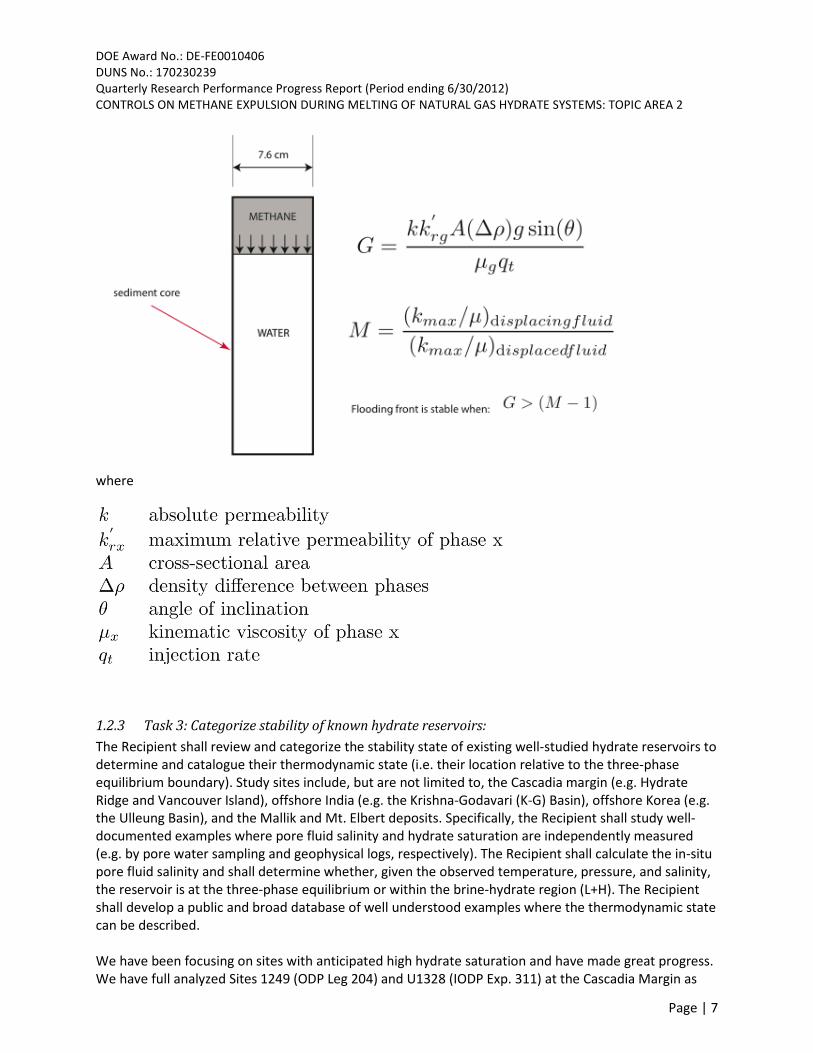
1.2.2.3 1-D Model of Gas Flooding in Core (Subtask 2.2) The preliminary step for experiments of core-scale hydrate production is to produce a gas-saturated sediment core. This gas-saturated core is produced by first water-saturating the sediment core and then injecting gas at a steady rate to produce a stable, continuous gas front that floods the core. We plan to perform this gas saturation in a circular core composed of F110 Sand with permeability 8.4x10⁻¹³ m2 and with cross-sectional area, 45 cm2. The flooding will be performed from the top of a vertically oriented core. We consider this gas flooding as an immiscible displacement of water by gas and make use of the Buckley-Leverett equations. Under the Buckley-Leverett equations, it is assumed that a steady shock front separating the two phases propagates through the core. This front is susceptible to viscous fingering at high injection rates. The injection rate can be reduced to prevent this viscous fingering and to provide a continuous stable front. The critical injection rate is set by the Buckley-Leverett analysis and describes the competition between the viscous mobility of the phases and the stabilizing effects of gravity. For the geometries and physical properties described, we can ensure stability with injection rates below ~1.45 mL/min.
DOE Award No.: DE-FE0010406 DUNS No.: 170230239 Quarterly Research Performance Progress Report (Period ending 6/30/2012) CONTROLS ON METHANE EXPULSION DURING MELTING OF NATURAL GAS HYDRATE SYSTEMS: TOPIC AREA 2
Page | 7
where
1.2.3 Task 3: Categorize stability of known hydrate reservoirs: The Recipient shall review and categorize the stability state of existing well-studied hydrate reservoirs to determine and catalogue their thermodynamic state (i.e. their location relative to the three-phase equilibrium boundary). Study sites include, but are not limited to, the Cascadia margin (e.g. Hydrate Ridge and Vancouver Island), offshore India (e.g. the Krishna-Godavari (K-G) Basin), offshore Korea (e.g. the Ulleung Basin), and the Mallik and Mt. Elbert deposits. Specifically, the Recipient shall study well-documented examples where pore fluid salinity and hydrate saturation are independently measured (e.g. by pore water sampling and geophysical logs, respectively). The Recipient shall calculate the in-situ pore fluid salinity and shall determine whether, given the observed temperature, pressure, and salinity, the reservoir is at the three-phase equilibrium or within the brine-hydrate region (L+H). The Recipient shall develop a public and broad database of well understood examples where the thermodynamic state can be described. We have been focusing on sites with anticipated high hydrate saturation and have made great progress. We have full analyzed Sites 1249 (ODP Leg 204) and U1328 (IODP Exp. 311) at the Cascadia Margin as

DOE Award No.: DE-FE0010406 DUNS No.: 170230239 Quarterly Research Performance Progress Report (Period ending 6/30/2012) CONTROLS ON METHANE EXPULSION DURING MELTING OF NATURAL GAS HYDRATE SYSTEMS: TOPIC AREA 2
Page | 8
well as Indian National Gas Hydrate Project (NGHP) Site 01-10 in the Krishna-Godavari Basin, and are in the process of analyzing the data from the Mallik 5L-38 gas hydrate production well in the Mackenzie Delta. We have compiled the data for the Mt. Elbert deposits and are awaiting the publication of the results from the 2nd Ulleung Basin Gas Hydrates (UBGH-2) Project. We have developed an approach for defining hydrate saturation and salinity from resistivity logs, using Archie's Law, and core measured salinity. A fundamental challenge to the approach is the challenge of using resistivity logs to predict hydrate saturation when fractures may be present (Cook, 2010). We are carefully comparing our approach to locations where in situ hydrate saturation and salinity can be directly measured (e.g. where Pressure Core Sampler data are available) to explore this challenge. We are also working to further improve the method of determining hydrate saturation by accounting for the effect of fine grained sediments on the output of Archie's Law (Simandoux, 1963) and the effect of hydrate on the site-specific Archie's parameters (Spangenberg, 2001).
1.2.4 Task 4: Laboratory Evaluation of Hydrate Dissociation: Subtask 4.1 - Freezing to 3 phase stability conditions, followed by melting from above Subtask 4.2 - Freezing to L+H condition, warming from above Subtask 4.3 - Freezing to L+H condition, warming from below
Our experimental work has been focused on four fronts: i) a literature review of previous work that is similar to the work we wish to pursue; ii) completion of development of a thermistor string at U.T. to be used in the experimental work; iii) finalization of our experimental set-up for our first experiments to be run in the next quarter, and iv) model simulations to define the experimental analyses we wish to pursue. We report on each of these below.
1.2.4.1 Literature review Laboratory studies on methane hydrates formation from brine with different salinities mainly focus on three topics: the salinity effect on phase equilibrium, the amount and distribution of the hydrates formed, and the gas production from methane hydrates. The occurrence of methane hydrates in the binary system of CH4-H2O has been studied extensively [de Roo et al., 1983]. The experimental works were summarized in Sun and Duan [2005]. The pioneer work to study the phase behavior of the ternary system CH4-H2O-NaCl is de Roo et al. [1983]. The experiments were carried out in Cailletet tubes under isobaric conditions. The temperatures at which hydrates disappear were measured for the pressure range of 2 to 11 MPa and salinity range of 0 to 0.089 mol%. An empirical equation was provided to describe the three phase (Liquid-Gas-Hydrate) equilibrium pressure as a function of temperature and salinity for a CH4-H2O-NaCl system. Subsequently, more experimental work was conducted to investigate the salinity effect on three phase equilibrium conditions of methane hydrates for larger pressure and salinity ranges in cells without porous media. Example works include Maekawa et al. [1995], Mei et al. [1996], Kang et al. [1998], Maekawa and Imai [2000], Jager and Sloan [2001], Kharrat and Dalmazzone [2003], Eichholz et al. [2004], Atik et al. [2006], Mohammadi et al. [2008], and Saw et al. [2012]. Besides electrolytes, the presence of various concentrations of organic hydrate inhibitors (methanol and ethylene glycol) or their mixtures with salts were also widely studied for their influence on the three phase equilibrium conditions of methane hydrates in cells [Bishnoi and Dholabhai, 1999; Dholabhai et al., 1997; Eichholz et al., 2004; Jager et al., 2002; Masoudi et al., 2005; Mohammadi and Richon, 2009; 2010; Najibi et al., 2009; Ng and Robinson, 1985].
DOE Award No.: DE-FE0010406 DUNS No.: 170230239 Quarterly Research Performance Progress Report (Period ending 6/30/2012) CONTROLS ON METHANE EXPULSION DURING MELTING OF NATURAL GAS HYDRATE SYSTEMS: TOPIC AREA 2
Page | 9
Few studies have been conducted in porous media to investigate the phase equilibrium of methane hydrates in the presence of salts. Østergaard et al. [2002] recorded the pressure-temperature (P-T) histories in methane hydrate dissociation for 3.5 wt% methanol aqueous solutions in confined silica glass pores of narrow distribution (30.6, 15.8 and 9.2 nm mean diameters) to investigate the methane hydrate stability suppression by capillary effects. The initial ratios of liquid volumes to pore volumes are 100% (termed saturated), 105% (termed supersaturated) and 115% (termed supersaturated), respectively. During the experiment, cell temperature was lowered until methane hydrates formation began. After hydrates formation, hydrate dissociation was initiated by raising the temperature step by step back to the initial conditions. At the end of their study, they correlated the inhibition of pore sizes to that of NaCl solutions with different mass fractions at the pressure of 10 MPa. Liu et al. [2013] investigated the effects of different types of salts with various concentrations on the P-T stability conditions of methane hydrates in both silica sands with different grain sizes and in marine sediments sampled from South China Sea. The same conclusions as previous studies conducted in cells were reached: the presence of salts shifts the P-T curves to the left (toward higher pressure and lower temperature), and the larger the concentration, the bigger the shift. Only a few studies experimentally examined the hydrates amount and distribution formed from brine solutions. Yousif and Sloan [1991] and Yousif et al. [1991] designed experimental procedures for methane hydrates formation from 1.5 wt% NaCl solution in three different Berea sandstone cores A, B and C with different dimensions and permeabilities (8.388×10⁻¹⁴, 9.869×10⁻¹⁴ and 3.947×10⁻¹³ m2, respectively). During hydrate formation, the bath temperature was maintained at 273.7 K at a pressure always higher than the equilibrium value for a period of 4 to 34 hours. Hydrate formation was assumed to have ceased when no change in the pressure and electric resistance was observed. After equilibrium conditions were reached, one or more cycles of annealing process were performed to eliminate the pressure drop during hydrate formation and to ensure more uniform hydrate distribution along the core. After hydrate formation, hydrate dissociation was initiated by decreasing the pressure at the inlets of the cores. Three runs were conducted in core A with initial water saturation of 51.5%, 53.7% and 58.9%, respectively. Another three runs were conducted in core B with initial water saturation of 34.4%, 36.3% and 55.0%, respectively. Only one run was conducted in core C with initial water saturation of 34.5%. Yousif and Sloan [1991] focused on discussing the factors that influence the amount of hydrates formed and the distribution of the hydrates across the cores, including the process of annealing, the initial permeability of the cores and the initial water saturation. However, the salinity effect was not investigated. Later, Husebø et al. [2009] conducted laboratory experiments to form methane hydrates in several sandstone cores with different geometries. The cores were all partially saturated with brine of different salinities with methane occupying the other phase. The temperature, pressure and the amount of methane injected were monitored throughout the entire experiments. They then analyzed the effect of salinity on the fill fraction, the amount of methane per available structural site in hydrates. They found that salinities lower than the regular sea water composition had negligible impact on the fill fraction of methane hydrates. However, when the salinity was higher than the sea water composition, the fill fraction significantly dropped. Chen et al. [2009] experimentally studied the salting out phenomenon of six kinds of ions after methane hydrates formation in porous media. They found that all kinds of ionic concentrations were increased, and Ca2+ concentration was most significantly increased after hydrate formation. In recent years, several laboratory experiments have been conducted to study the gas production behaviors by methane hydrates dissociation in saline water. Li et al. [2011] conducted laboratory experiments to generate methane hydrates from synthetic brine with 2.0 wt% NaCl in natural marine

DOE Award No.: DE-FE0010406 DUNS No.: 170230239 Quarterly Research Performance Progress Report (Period ending 6/30/2012) CONTROLS ON METHANE EXPULSION DURING MELTING OF NATURAL GAS HYDRATE SYSTEMS: TOPIC AREA 2
Page | 10
sand in a closed system. After hydrates formation stopped, the dissociation was initiated by injecting hot brines. The decomposition rates of hydrates and the energy efficiencies were investigated by changing the temperature of the injected hot brine, the injection rates and time. Researchers in China University of Petroleum, Beijing and Chinese Academy of Science, Guangzhou have also conducted several laboratory experiments to investigate the methane hydrates formation in sand columns with different brine salinities, and hydrate dissociation by hot water injections, inhibitor injections and depressurization [Tang et al., 2005; Yang et al., 2010; Yang et al., 2012; Yuan et al., 2011; Yuan et al., 2013].
1.2.4.2 Thermistor string Construction of the thermistor string is complete. It has been delivered to Dr. Kneafsey at LBNL and awaits use in upcoming experiments. The only remaining task is adapting the thermistor string data acquisition system to the Keithley DAQ used in Dr. Kneafsey’s lab. This task does not pose any issues.
1.2.4.3 Experimental set-up The initial hydrate stability experiments will take place in a 2.0” diameter by 5.0” long core holder. The experiment (Figure 3) consists of a temperature controlled sleeve encasing the pressure controlled cell. Within the pressure controlled cell is the confining fluid, a Viton sleeve (housing the sample), a thermistor attached to the outside of the Viton sleeve, end caps, the necessary plumbing components, and two electrodes mounted to a narrow piece of garolite. The electrode wires are passed through a 1/16” OD stainless steel tube and swaged to an outer connector. In this configuration, the 1/16” tube housing the electrode wires lies within the pore fluid plumbing but remains sealed from the outside environment, this allowing for conductivity data acquisition without opening the system to atmospheric conditions. We will use US Silica F-110 sand mixed with a 3.5% saline solution by combining to ultimately obtain a saturation of ~50%. We will increase the pore fluid (methane) pressure in 50-100 psi increments, while maintaining 50 psi effective pressure, up to 1050 psig to check for leaks. We will then cool the sample into the hydrate stability field (~3 degrees C) and form hydrate. We will allow gas to enter as hydrate forms.

DOE Award No.: DE-FE0010406 DUNS No.: 170230239 Quarterly Research Performance Progress Report (Period ending 6/30/2012) CONTROLS ON METHANE EXPULSION DURING MELTING OF NATURAL GAS HYDRATE SYSTEMS: TOPIC AREA 2
Page | 11
Figure 3. Experimental hydrate stability system. The pertinent components of this system are the a) pore pressure inlet, b) pore pressure outlet, c) resistivity array, d) thermocouple, e) pore pressure sensor, f) Viton sleeve (encasing the sample), g) end caps, and h) cell pressure inlet/outlet.

DOE Award No.: DE-FE0010406 DUNS No.: 170230239 Quarterly Research Performance Progress Report (Period ending 6/30/2012) CONTROLS ON METHANE EXPULSION DURING MELTING OF NATURAL GAS HYDRATE SYSTEMS: TOPIC AREA 2
Page | 12
1.2.4.4 Calculation for experimental design We have used a box model to predict the experimental response. We consider the case of sand partially saturated with water and flooded with methane. The sand is then pressurized to approximately 1000 psi with methane gas. The sand is then cooled to within the hydrate stability zone with gas pressure held constant. We consider two cases: in Case 1, the pore water is initially saline (seawater) and in Case 2, it is fresh water. Case 1: Saline water: Initially, the water pressure and temperature in the system is Pi and Ti, respectively. The core has an initial water saturation of Sw,i and gas saturation of Sg,i. The initial mass fraction of salt in brine solution is Xs
w,i. Hydrate formation starts when the temperature in the core is suddenly decreased to the final temperature Tf. During hydrate formation, methane gas is allowed to freely flow into the core. We use a box model to calculate the final water saturation Sw,f, gas saturation Sg,f and hydrate saturation Sh,f at three phase equilibrium condition, and the total volume of methane gas required to flow into the core
migV ,∆ in order to keep a specific final water pressure Pf (Figure 4).
Figure 4. Schematic diagram for the box model.
Since there is no water flow into or out of the box during hydrate formation, the total mass of the salt initially in the box should equal that at final three phase equilibrium condition. Therefore, one has
sewfwfwtot
siwiwiwtot XSVXSV ,,,,,, ρρ = , (1)
where Vtot is the total volume of the box; iw,ρ and fw,ρ are the initial and final brine density in the box, which can be calculated from Pi and Ti, Pf and Tf, respectively; Xs
w,e is the mass fraction of salt in brine solution at final three phase equilibrium condition, which can be calculated from Pf and Tf. Reorganize Eq. (1), one can obtain the final water saturation
sewfw
siwiwiw
fw XXS
S,,
,,,, ρ
ρ= . (2)
The final hydrate saturation can be calculated from the mass conservation of the fresh water in the box. The initial mass of the fresh water in the brine should equal the final mass of the fresh water in the brine plus that in the hydrate, therefore, one has
( ) ( ) wh
fhtotsew
mfwfwfwtot
siw
miwiwiwtot NM
VSV
XXSVXXSV ,,,,,,,,, 11 +−−=−− ρρ , (3)

DOE Award No.: DE-FE0010406 DUNS No.: 170230239 Quarterly Research Performance Progress Report (Period ending 6/30/2012) CONTROLS ON METHANE EXPULSION DURING MELTING OF NATURAL GAS HYDRATE SYSTEMS: TOPIC AREA 2
Page | 13
where Xmw,i and Xm
w,f are the initial and final mass fraction of methane in the brine, which can be calculated from Pi and Ti, Pf and Tf, respectively; hV is the molar volume of hydrate, which is 1.31×10⁻⁴ m3 mol-1; Mw is the molar weight of water, which is 1.8×10⁻² kg mol-1 ; N is the stoichiometric hydration number, which is assumed to be constant and equal to 5.75. Reorganize Eq. (3), one can obtain the final hydrate saturation
( ) ( )h
w
sew
mfwfwfw
siw
miwiwiw
fh VNM
XXSXXSS ,,,,,,,,
,
11 −−−−−=
ρρ. (4)
The final gas saturation can be written as
fhfwfg SSS ,,, 1 −−= . (5) The mass conservation of methane is used to calculate the volume of methane gas required to flow into the box in order to keep the constant final pressure Pf in the box. Initially, the methane is distributed in water and gas phase. At final three phase equilibrium condition, the methane can be distributed in water, gas and hydrate phase, therefore, one has
( ) igm
igm
iwm
fhm
fgm
fwm
ig VnnnnnV ,,,,,,, −−++=∆ , (6) where m
fwn , , mfgn , , m
fhn , are the molar amount of methane in the final water, gas and hydrate phase,
respectively; miwn , and m
ign , are the molar amount of methane in the initial water and gas phase,
respectively; igV , is the molar volume of the gas phase at the initial temperature Ti and pressure Pi
condition, which can be calculated by ig
mig
MV,
, ρ= ; Mm is the molar weight of methane, which is
1.6×10⁻² kg mol-1.
m
mfwfwfwtotm
fw MXSV
n ,,,,
ρ= , (7)
fg
fgtotmfg V
SVn
,
,, = , (8)
h
fhtotmfh V
SVn ,
, = , (9)
m
miwiwiwtotm
iw MXSV
n ,,,,
ρ= , (10)
ig
igtotmig V
SVn
,
,, = , (11)

DOE Award No.: DE-FE0010406 DUNS No.: 170230239 Quarterly Research Performance Progress Report (Period ending 6/30/2012) CONTROLS ON METHANE EXPULSION DURING MELTING OF NATURAL GAS HYDRATE SYSTEMS: TOPIC AREA 2
Page | 14
where fgV , is the molar volume of the gas phase at the final temperature Tf and pressure Pf condition,
which can be calculated by fg
mfg
MV,
, ρ= . Substitute Eqs. (7)-(11) into Eq. (6), one can obtain the
volume of methane gas required to flow into the box at the initial temperature Ti and pressure Pi condition. An example calculation is given in Figure 5, which presents the final water, gas and hydrate saturation, and the volume of methane gas required to flow into the box as a function of the initial water saturation. Specific values for the results are given for the initial water saturation of 20%, 35%, 50% and 60%. The initial pressure and temperature in Figure 5 is 7 MPa and 20 °C, respectively. The final equilibrium pressure and temperature is 7 MPa and 3 °C, respectively. According to Figure 5, the final hydrate saturation increases linearly with the initial water saturation, because the hydrate formation in our experiment is water limited. Point A in Figure 5 represents the maximum initial water saturation allowed in the core (approximately 83%) when there is no water flow out of the system during the hydrate formation process. If the initial water saturation is higher than this value, the volume expansion during hydrate formation will drive the excess water to flow out of the core.
Figure 5. Changes of the final water, gas and hydrate saturation, and the volume of methane gas required to flow into the core at the initial pressure and temperature condition (the dimension here is m3 per pore volume) as a function of the initial water saturation. Specific values of results are given for the initial water saturation of 20%, 35%, 50% and 60%.
Case 2: Fresh water: If the experiment is conducted using fresh water, at the final equilibrium pressure and temperature condition for saline water Pf and Tf, the phase condition for fresh water should be in liquid and hydrate stability zone. However, since the methane gas is allowed to freely flow into the core, and water is limited for this case, theoretically, all the water initially in the core should be converted to hydrate. Therefore, one has
0, =fwS . (12) According to the mass conservation of water in the box, one has
0 0.1 0.2 0.3 0.4 0.5 0.6 0.7 0.8 0.9 1
-0.20
0.20.40.60.8
11.21.41.61.8
2
Sw,i
Satu
ratio
n
Pi=7 MPa, Ti=20 0C, Pf=7 MPa, Tf=3 0C
Sh,fSg,fSw,f
∆Vmg,i
Zero
A
0.475
0.051
0.188
0.755
1.034
0.128
1.221
0.565
0.1540.090
0.3300.4700.401
0.5810.760
0.281
DOE Award No.: DE-FE0010406 DUNS No.: 170230239 Quarterly Research Performance Progress Report (Period ending 6/30/2012) CONTROLS ON METHANE EXPULSION DURING MELTING OF NATURAL GAS HYDRATE SYSTEMS: TOPIC AREA 2
Page | 15
( ) wh
fhtotmiwiwiwtot NM
VSV
XSV ,,,, 1 =−ρ . (13)
Reorganize Eq. (13), one obtains the final hydrate saturation for the case of using fresh water
( )h
w
miwiwiwtot
fh VNM
XSVS ,,,
,1−
=ρ
. (14)
The final gas saturation is calculated by Eq. (5). According to the mass conservation of methane, one can calculate the volume of gas required to flow into the box at the initial pressure Pi and temperature Ti condition as follows
( ) igm
igm
iwm
fhm
fgm
ig VnnnnV ,,,,,, −−+=∆ . (15) m
fgn , , mfhn , , m
iwn , and mign , can be calculated by Eqs. (8)-(11), respectively.
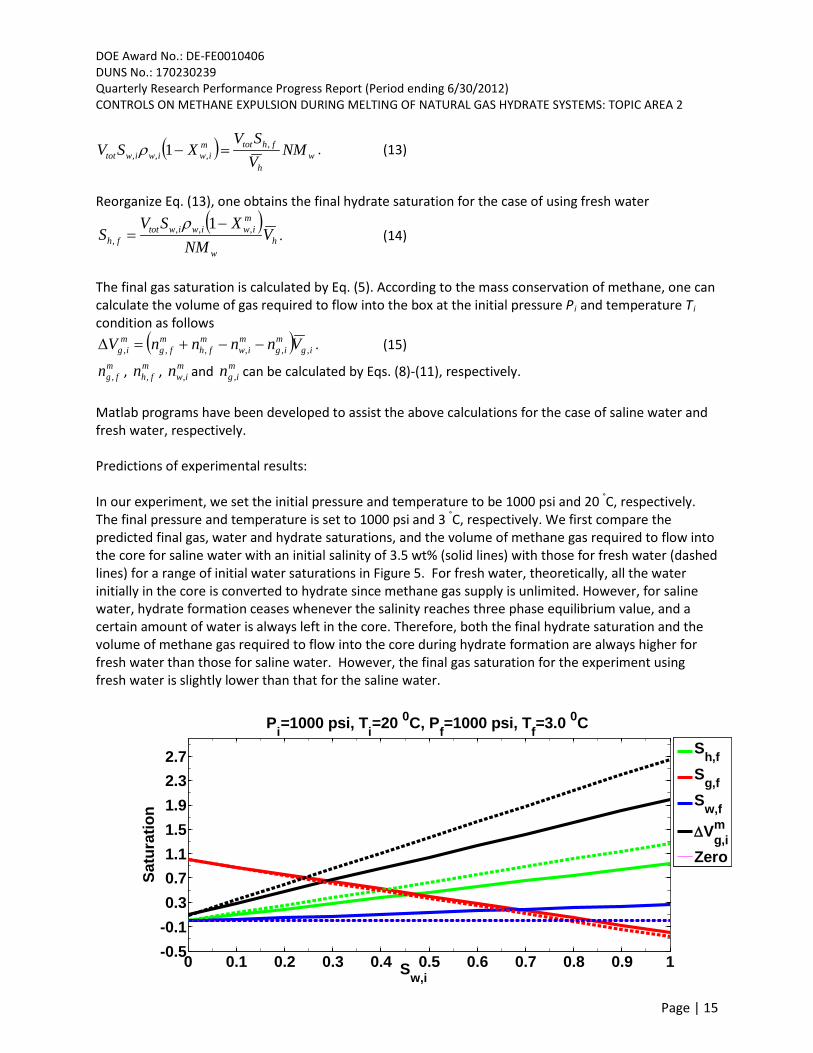
Matlab programs have been developed to assist the above calculations for the case of saline water and fresh water, respectively. Predictions of experimental results: In our experiment, we set the initial pressure and temperature to be 1000 psi and 20 °C, respectively. The final pressure and temperature is set to 1000 psi and 3 °C, respectively. We first compare the predicted final gas, water and hydrate saturations, and the volume of methane gas required to flow into the core for saline water with an initial salinity of 3.5 wt% (solid lines) with those for fresh water (dashed lines) for a range of initial water saturations in Figure 5. For fresh water, theoretically, all the water initially in the core is converted to hydrate since methane gas supply is unlimited. However, for saline water, hydrate formation ceases whenever the salinity reaches three phase equilibrium value, and a certain amount of water is always left in the core. Therefore, both the final hydrate saturation and the volume of methane gas required to flow into the core during hydrate formation are always higher for fresh water than those for saline water. However, the final gas saturation for the experiment using fresh water is slightly lower than that for the saline water.
0 0.1 0.2 0.3 0.4 0.5 0.6 0.7 0.8 0.9 1-0.5
-0.10.30.71.11.51.92.32.7
Sw,i
Satu
ratio
n
Pi=1000 psi, Ti=20 0C, Pf=1000 psi, Tf=3.0 0C
Sh,fSg,fSw,f
∆Vmg,i
Zero

DOE Award No.: DE-FE0010406 DUNS No.: 170230239 Quarterly Research Performance Progress Report (Period ending 6/30/2012) CONTROLS ON METHANE EXPULSION DURING MELTING OF NATURAL GAS HYDRATE SYSTEMS: TOPIC AREA 2
Page | 16
Figure 5 Comparison of the predicted final gas, water and hydrate saturations, and the volume of methane gas required to flow into the core for brine solution with an initial salinity of 3.5 wt% with those for fresh water. The solid lines are the results for brine solution while the dashed lines are the results for fresh water.
The initial water saturation in the core is 0.5, with a salinity of 3.5 wt% in our experiment. We summarize the initial and final conditions and the predicted results for our experiment in Table 1 for saline water and in Table 2 for fresh water.
Table 1: the initial and final conditions and the predicted results for saline water.
Initial Conditions Pi (psi) Ti (°C) Xs
w,i (wt%) Sw,i Sg,i Sh,i 1000 20 3.5 0.5 0.5 0.0
Final Conditions Pf (psi) Tf (°C) Xs
w,e (wt%) Sw,f Sg,f Sh,f 1000 3 12.4 0.131 0.402 0.468
totm
ig VV ,∆ 1.047
Table 2: the initial and final conditions and the predicted results for fresh water.
Initial Conditions Pi (psi) Ti (°C) Xs
w,i (wt%) Sw,i Sg,i Sh,i 1000 20 0 0.5 0.5 0.0
Final Conditions Pf (psi) Tf (°C) Xs
w,e (wt%) Sw,f Sg,f Sh,f 1000 3 0 0 0.368 0.632
totm
ig VV ,∆ 1.396
Nomenclature Mm molar weight of methane (kg mol-1) Mw molar weight of water (kg mol-1) N stoichiometric hydration number (dimensionless)
mfgn , molar amount of methane in the final gas phase (mol)
mfhn , molar amount of methane in the final hydrate phase (mol)
mfwn , molar amount of methane in the final liquid phase (mol)
mign , molar amount of methane in the initial gas phase (mol)
miwn , molar amount of methane in the initial liquid phase (mol)
Pf final water pressure (Pa) Pi initial water pressure (Pa) Tf final temperature (K) Ti initial temperature (K) Sg,i initial gas saturation (dimensionless) Sg,f final gas saturation (dimensionless)

DOE Award No.: DE-FE0010406 DUNS No.: 170230239 Quarterly Research Performance Progress Report (Period ending 6/30/2012) CONTROLS ON METHANE EXPULSION DURING MELTING OF NATURAL GAS HYDRATE SYSTEMS: TOPIC AREA 2
Page | 17
Sh,f final hydrate saturation (dimensionless) Sw,i initial water saturation (dimensionless) Sw,f final water saturation (dimensionless)
fgV , molar volume of the gas phase at the final temperature and pressure condition (m3 mol-1)
igV , molar volume of the gas phase at the initial temperature and pressure condition (m3 mol-1)
hV molar volume of the hydrate (m3 mol-1) Vtot total volume of the box (m3) Xm
w,f final mass fraction of methane in brine solution (dimensionless) Xm
w,i initial mass fraction of methane in brine solution (dimensionless) Xs
w,e equilibrium mass fraction of salt in brine solution (dimensionless) Xs
w,i initial mass fraction of salt in brine solution (dimensionless)
fw,ρ initial brine density (kg m-3)
iw,ρ final brine density (kg m-3) m
igV ,∆ volume of gas required to flow into the core in order to keep a specific final water pressure Pf (m3)
1.3 What opportunities for training and professional development has the project provided? There has been strong interaction between UT and LBNL over this past quarter. Our graduate students and our post-doctoral scientist are now fully working with both institutions. There is continuous interaction between petroleum engineering and geosciences as we address this problem.
1.4 How have the results been disseminated to communities of interest? An abstract titled, In situ gas hydrate saturation and salinity of hydrate-bearing sediments through well log analysis, was presented to the Society of Petrophysicists and Well Log Analysts (SPWLA) conference during June 2013.
1.5 What do you plan to do during the next reporting period to accomplish the goals?
1.5.1 Task 1: Project Management and Planning: We will continue with bi-monthly conference calls with Berkeley. We will continue to interact directly on experimental work. We will manage travel for visitations to Berkeley. We are completing reports for the contract.
1.5.2 Task 2: Conceptual and Numerical Model Development -1D: Subtask 2.1 - Dissociation of 1D vertical hydrate accumulation Subtask 2.2 - Apply 1D model to laboratory experiment Subtask 2.3 - 1D models of natural examples Subtask 2.3.1 Hydrate accumulations below permafrost Subtask 2.3.2 - 1D model application to deposits near up-dip limit of stability zone on continental margins
Continue model development.

DOE Award No.: DE-FE0010406 DUNS No.: 170230239 Quarterly Research Performance Progress Report (Period ending 6/30/2012) CONTROLS ON METHANE EXPULSION DURING MELTING OF NATURAL GAS HYDRATE SYSTEMS: TOPIC AREA 2
Page | 18
We will continue addressing subtasks 2.1, 2.2, 2.3. We intend to complete all but Subtask 2.3.2 over the next 6 months.
1.5.3 Task 3: Categorize stability of known hydrate reservoirs: Over the next three months we will complete analysis of the Mallik locations and the Mt. Elbert locations if the data are proficient. We will complete a report on these results in the next quarter. We will continue to improve the method used to process these sites and determine the thermodynamic state at each other them. Possible improvements include: Implementing the Simandoux Equation to take into account the volume of shale present in the formation, investigating the use of acoustic logs to determine hydrate saturations, and improving the estimations of Archie’s parameters. Any changes to the method will be applied to all past and future sites. Finally, related to the previous improvement, we will continue our research into the quantification of the saturation exponent through the use of other, natural cements as analogies.
1.5.4 Task 4: Laboratory Evaluation of Hydrate Dissociation: Subtask 4.1 - Freezing to 3 phase stability conditions, followed by melting from above Subtask 4.2 - Freezing to L+H condition, warming from above Subtask 4.3 - Freezing to L+H condition, warming from below
Over the next quarter we will complete our first laboratory experiments at Berkeley. We describe our experimental plan below. After experimental planning and theoretical modeling over the last quarter, we decided that the most important first step in the modeling would be to 1) demonstrate the ability to create three phase conditions in the laboratory and 2) show the effects of perturbation on this material. . After establishing this capability, we would then demonstrate the effects of thermal perturbation from above or below. Our approach is described below.
1.6 Experiment plan: Our experimental set up is described in detail under accomplishments of the previous quarter. We will use US Silica F-110 sand mixed with either a 3.5% saline solution, or distilled water, by combining to ultimately obtain a saturation of ~50%. We will increase the pore fluid (methane) pressure in 50-100 psi increments, while maintaining 50 psi effective pressure, up to 1050 psig to check for leaks. We will then cool the sample into the hydrate stability field (~3 degrees C) and form hydrate. We will allow gas to enter as hydrate forms. We have already modeled the predicted behavior and described this above. However, we summarize here the predicted results. As initial conditions, we will establish a system with 50% water saturation, with methane as the gas phase at a pressure of 1000 psi and a temperature of 20 °C. We will then drop the temperature to 3 °C while maintaining pressure at 1000 psi. We will run this experiment with both an initial salinity of 3.5% and with distilled water. The freshwater and saline water cases are compared below.

DOE Award No.: DE-FE0010406 DUNS No.: 170230239 Quarterly Research Performance Progress Report (Period ending 6/30/2012) CONTROLS ON METHANE EXPULSION DURING MELTING OF NATURAL GAS HYDRATE SYSTEMS: TOPIC AREA 2
Page | 19
Figure 6. Predicted hydrate saturation, gas saturation, salinity, and the amount of gas added for initial experiment. The initial water saturation is 50% and the remaining pore space is filled with methane. The pressure is held constant at 1000 psi, and the temperature is dropped from 20 to 3 degrees C. Two cases are considered: the ‘freshwater’ case no salinity, whereas the ‘saline’ case has an initial 3.5% salinity. For fresh water, theoretically, all the water initially in the core is converted to hydrate since methane gas supply is unlimited. However, for saline water, hydrate formation ceases whenever the salinity reaches three phase equilibrium value, and a certain amount of water is always left in the core. Therefore, both the final hydrate saturation and the volume of methane gas required to flow into the core during hydrate formation are always higher for fresh water than those for saline water. However, the final gas saturation for the experiment using fresh water is slightly lower than that for the saline water.
2 PRODUCTS:
2.1 What has the project produced? We have now produced a one dimensional, coupled, hydrate formation code that simulates the thermo-chemical response of a hydrate system to perturbation.

DOE Award No.: DE-FE0010406 DUNS No.: 170230239 Quarterly Research Performance Progress Report (Period ending 6/30/2012) CONTROLS ON METHANE EXPULSION DURING MELTING OF NATURAL GAS HYDRATE SYSTEMS: TOPIC AREA 2
Page | 20
3 PARTICIPANTS & OTHER COLLABORATING ORGANIZATIONS:
3.1 What individuals have worked on the project? Provide the following information for: (1) principal investigator(s)/project director(s) (PIs/PDs); and (2) each person who has worked at least one person month per year on the project during the reporting period, regardless of the source of compensation (a person month equals approximately 160 hours of effort). Name Peter Flemings Steve Bryant Tim Kneafsey Dylan Meyer Donnie Brooks Project Role Principal
Investigator Co-Principal Investigator
Co-Principal Investigator
Graduate Student
Laboratory Assistant
Nearest person month worked
.25 .25 .25 1 1
Contribution Advised graduate student Meyer, managed project, and recruited students. Worked with technicians for thermistor development.
Advised graduate student Meyer on analysis of models of pore space alteration due to hydrate growth and its effect on saturation exponent.
Participated in conference calls on experimental design. Ran experimental tests.
Performed analysis of thermodynamic state of 3 locations.
Built a prototype thermistor string.
Funding Support The University of Texas
The University of Texas
Lawrence Berkeley National Lab
UTIG Fellowship The University of Texas
Collaborated with individual in foreign country
No No No No No
Name Peter Polito Kris Darnell Kehua You Tessa Green Project Role Laboratory
Manager Graduate Student
Post Doc Project Coordinator
Nearest person month worked
1 1 1 1
Contribution Participated in conference calls on experimental design. Ran experimental tests.
Performed literature review and theoretical calculation to prepare for laboratory experiments
Performed literature review and theoretical calculation to prepare for laboratory experiments
Coordinate meeting logistics, archive documents, and manage financials.
Funding Support The University of Texas
The University of Texas
The University of Texas
The University of Texas
Collaborated with individual in foreign country
No No No No

DOE Award No.: DE-FE0010406 DUNS No.: 170230239 Quarterly Research Performance Progress Report (Period ending 6/30/2012) CONTROLS ON METHANE EXPULSION DURING MELTING OF NATURAL GAS HYDRATE SYSTEMS: TOPIC AREA 2
Page | 21
3.2 What other organizations have been involved as partners? Organization Name: Lawrence Berkeley National Lab Location of Organization: Berkeley, CA Partner’s contribution to the project (identify one or more)
• In-kind support (e.g., partner makes software, computers, equipment, etc., available to project staff);
• Facilities (e.g., project staff use the partner’s facilities for project activities); • Collaborative research (e.g., partner’s staff work with project staff on the project); and
3.3 Have other collaborators or contacts been involved? No
4 IMPACT:
4.1 What is the impact on the development of the principal discipline(s) of the project? Geological models of gas transport and hydrate melting and solidification have suggested that free gas cannot migrate through the hydrate stability zone during melting. In contrast, we suggest that free gas can migrate through the hydrate stability zone by altering the conditions of hydrate stability to a state of three-phase equilibrium through the elevation of salinity and possibly temperature. This results in fundamentally different macro-scale behavior during melting and may result in greater gas venting than has been previously demonstrated. If this hypothesis is correct, it may engender a new generation of field and laboratory investigations to document this behavior in both the field of geosciences and petroleum engineering. Second, the project links theoretical development with laboratory modeling because the concepts can be applied at the laboratory scale as well as the field scale. The laboratory experiments to be conducted will enable validation of the mechanisms incorporated in the models. These laboratory experiments will play a key role in demonstrating the processes.
4.2 What is the impact on other disciplines? A likely outcome of our work is a more quantitative prediction of the magnitude of methane flux from the earth to the atmosphere over human (decadal) timescales and geological timescales (10,000 years). These will serve as boundary conditions for atmospheric climate models. In turn, these results may guide policy decisions.
4.3 What is the impact on the development of human resources? We are working at the interface of geosciences and engineering. We are coupling theory and laboratory experiments to address macro-scale geologic problems. This is training a new generation of geoscientists and engineers to think with a systems-based approach that links observation with theory. The results are being applied in the classroom and the support is training several graduate students.

DOE Award No.: DE-FE0010406 DUNS No.: 170230239 Quarterly Research Performance Progress Report (Period ending 6/30/2012) CONTROLS ON METHANE EXPULSION DURING MELTING OF NATURAL GAS HYDRATE SYSTEMS: TOPIC AREA 2
Page | 22
4.4 What is the impact on physical, institutional, and information resources that form infrastructure?
The project is strengthening the experimental efforts and capability at UT as it is our drop to develop sensor equipment. The project is strengthening development at LBNL where primary experimental work is occurring.
4.5 What is the impact on technology transfer? We are presenting our research to approximately 100 industry members at our GeoFluids consortium and we will be presenting at a range of national and international meetings.
4.6 What is the impact on society beyond science and technology? A likely outcome of our work is a more quantitative prediction of the magnitude of methane flux from the earth to the atmosphere over human (decadal) timescales and geological timescales (10,000 years). These will serve as boundary conditions for atmospheric climate models. In turn, these results may guide policy decisions.
4.7 What dollar amount of the award’s budget is being spent in foreign country(ies)? Zero percent of the award’s budget is being spent in foreign countries.
5 CHANGES/PROBLEMS:
5.1 Changes in approach and reasons for change We have made some changes in our specific experimental approaches. The original experimental tasks were described as follows: Task 4: Laboratory Evaluation of Hydrate Dissociation: Subtask 4.1 - Freezing to 3 phase stability conditions, followed by melting from above Subtask 4.2 - Freezing to L+H condition, warming from above Subtask 4.3 - Freezing to L+H condition, warming from below However, after experimental planning and theoretical modeling over the last quarter, we decided that the most important first step in the modeling would be to 1) demonstrate the ability to create three phase conditions in the laboratory and 2) show the effects of perturbation on this material. . After establishing this capability, we would then demonstrate the effects of thermal perturbation from above or below. We will still be able to meet our Milestone 1.E, ‘ Demonstrate ability to create and dissociate methane hydrate within sediment columns under conditions analogous to natural systems.’ There are no other changes in approach to report for this reporting period.
5.2 Actual or anticipated problems or delays and actions or plans to resolve them No problems or delays to report for this reporting period.
5.3 Changes that have a significant impact on expenditures No changes in approach to report for this reporting period.

DOE Award No.: DE-FE0010406 DUNS No.: 170230239 Quarterly Research Performance Progress Report (Period ending 6/30/2012) CONTROLS ON METHANE EXPULSION DURING MELTING OF NATURAL GAS HYDRATE SYSTEMS: TOPIC AREA 2
Page | 23
5.4 Significant changes in use or care of human subjects, vertebrate animals, and/or Biohazards
Nothing to report
5.5 Change of primary performance site location from that originally proposed Nothing to report

DOE Award No.: DE-FE0010406 DUNS No.: 170230239 Quarterly Research Performance Progress Report (Period ending 6/30/2012) CONTROLS ON METHANE EXPULSION DURING MELTING OF NATURAL GAS HYDRATE SYSTEMS: TOPIC AREA 2
Page | 24
6 BUDGETARY INFORMATION:
Q1
Cum
ulat
ive
Tota
lQ
2Cu
mul
ativ
e To
tal
Q3
Cum
ulat
ive
Tota
lQ
4Cu
mul
ativ
e To
tal
Base
line
Cost
Pla
nFe
dera
l Sha
re13
6,11
1.50
$
136,
111.
50$
17
5,00
0.50
$
311,
112.
00$
17
5,00
0.50
$
486,
112.
50$
175,
000.
50$
66
1,11
3.00
$
No
n-Fe
dera
l Sha
re43
,568
.75
$
43
,568
.75
$
43
,568
.75
$
87
,137
.50
$
43
,568
.75
$
13
0,70
6.25
$
43
,568
.75
$
17
4,27
5.00
$
To
tal P
lann
ed17
9,68
0.25
$
179,
680.
25$
21
8,56
9.25
$
398,
249.
50$
21
8,56
9.25
$
616,
818.
75$
218,
569.
25$
83
5,38
8.00
$
Ac
tual
Incu
rred
Cos
tFe
dera
l Sha
re45
,506
.00
$
45
,506
.00
$
54
,469
.00
$
99
,975
.00
$
-
$
99
,975
.00
$
-$
99,9
75.0
0$
No
n-Fe
dera
l Sha
re-
$
-
$
53
,337
.00
$
53
,337
.00
$
-
$
53
,337
.00
$
-$
53,3
37.0
0$
To
tal I
ncur
red
Cost
45,5
06.0
0$
45,5
06.0
0$
107,
806.
00$
15
3,31
2.00
$
-$
153,
312.
00$
-$
153,
312.
00$
Vari
ance
Fede
ral S
hare
(90,
605.
50)
$
(90,
605.
50)
$
(120
,531
.50)
$ (2
11,1
37.0
0)$
(175
,000
.50)
$ (3
86,1
37.5
0)$
(175
,000
.50)
$ (5
61,1
38.0
0)$
Non-
Fede
ral S
hare
(43,
568.
75)
$
(43,
568.
75)
$
9,76
8.25
$
(3
3,80
0.50
)$
(4
3,56
8.75
)$
(7
7,36
9.25
)$
(43,
568.
75)
$
(120
,938
.00)
$
To
tal V
aria
nces
(134
,174
.25)
$ (1
34,1
74.2
5)$
(110
,763
.25)
$ (2
44,9
37.5
0)$
(218
,569
.25)
$ (4
63,5
06.7
5)$
(218
,569
.25)
$ (6
82,0
76.0
0)$
Q1
Cum
ulat
ive
Tota
lQ
2Cu
mul
ativ
e To
tal
Q3
Cum
ulat
ive
Tota
lQ
4Cu
mul
ativ
e To
tal
Base
line
Cost
Pla
nFe
dera
l Sha
re12
7,42
2.00
$
661,
113.
00$
12
7,42
2.00
$
788,
535.
00$
12
7,42
2.00
$
915,
957.
00$
127,
422.
00$
1,
043,
379.
00$
No
n-Fe
dera
l Sha
re34
,048
.50
$
17
4,27
5.00
$
34,0
48.5
0$
208,
323.
50$
34
,048
.50
$
24
2,37
2.00
$
34
,048
.50
$
27
6,42
0.50
$
To
tal P
lann
ed16
1,47
0.50
$
835,
388.
00$
16
1,47
0.50
$
996,
858.
50$
16
1,47
0.50
$
1,15
8,32
9.00
$
161,
470.
50$
1,
319,
799.
50$
Ac
tual
Incu
rred
Cos
tFe
dera
l Sha
re-
$
99
,975
.00
$
-
$
99
,975
.00
$
-
$
99
,975
.00
$
-$
99,9
75.0
0$
No
n-Fe
dera
l Sha
re-
$
53
,337
.00
$
-
$
53
,337
.00
$
-
$
53
,337
.00
$
-$
53,3
37.0
0$
To
tal I
ncur
red
Cost
-$
153,
312.
00$
-
$
15
3,31
2.00
$
-$
153,
312.
00$
-$
153,
312.
00$
Vari
ance
Fede
ral S
hare
(127
,422
.00)
$ (5
61,1
38.0
0)$
(127
,422
.00)
$ (6
88,5
60.0
0)$
(127
,422
.00)
$ (8
15,9
82.0
0)$
(127
,422
.00)
$ (9
43,4
04.0
0)$
Non-
Fede
ral S
hare
(34,
048.
50)
$
(120
,938
.00)
$ (3
4,04
8.50
)$
(1
54,9
86.5
0)$
(34,
048.
50)
$
(189
,035
.00)
$
(3
4,04
8.50
)$
(2
23,0
83.5
0)$
Tota
l Var
ianc
es(1
61,4
70.5
0)$
(682
,076
.00)
$ (1
61,4
70.5
0)$
(843
,546
.50)
$ (1
61,4
70.5
0)$
(1,0
05,0
17.0
0)$
(1
61,4
70.5
0)$
(1,1
66,4
87.5
0)$
Budg
et P
erio
d 2
Q1
Q2
Q3
Q4
4/1/
2014
-8/1
5/20
148/
16/2
014-
12/3
1/20
141/
1/20
15-5
/15/
2015
5/16
/201
5-9/
30/2
015
Base
line
Repo
rtin
g (1
0/1/
12 -
6/30
/13)
Budg
et P
erio
d 1
Q1
Q2
Q3
Q4
10/1
/12
- 2/1
5/13
2/16
/13-
6/30
/201
37/
1/20
13-1
1/15
/201
311
/16/
2013
-3/3
1/20
14

DOE Award No.: DE-FE0010406 DUNS No.: 170230239 Quarterly Research Performance Progress Report (Period ending 6/30/2012) CONTROLS ON METHANE EXPULSION DURING MELTING OF NATURAL GAS HYDRATE SYSTEMS: TOPIC AREA 2
Page | 25
7 References Atik, Z., C. Windmeier, and L. R. Oellrich (2006), Experimental Gas Hydrate Dissociation Pressures for
Pure Methane in Aqueous Solutions of MgCl2 and CaCl2 and for a (Methane + Ethane) Gas Mixture in an Aqueous Solution of (NaCl + MgCl2), Journal of Chemical & Engineering Data, 51(5), 1862-1867.
Bishnoi, P. R., and P. D. Dholabhai (1999), Equilibrium conditions for hydrate formation for a ternary mixture of methane, propane and carbon dioxide, and a natural gas mixture in the presence of electrolytes and methanol, Fluid Phase Equilibria, 158–160(0), 821-827.
Chen, Q., C. Liu, and Y. Ye (2009), Experimental study on geochemical characteristic of methane hydrate formed in porous media, Journal of Natural Gas Chemistry, 18(2), 217-221.
Cook, A.E., Anderson, B.I., Malinverno, A., Mrozemski, S., and Goldberg, D.S., 2010, Electrical anisotropy due to gas hydrate-filled fractures: Geophysics, v. 75, p. 13
de Roo, J. L., C. J. Peters, R. N. Lichtenthaler, and G. A. M. Diepen (1983), Occurrence of methane hydrate in saturated and unsaturated solutions of sodium chloride and water in dependence of temperature and pressure, AIChE Journal, 29(4), 651-657.
Dholabhai, P. D., J. Scott Parent, and P. Raj Bishnoi (1997), Equilibrium conditions for hydrate formation from binary mixtures of methane and carbon dioxide in the presence of electrolytes, methanol and ethylene glycol, Fluid Phase Equilibria, 141(1–2), 235-246.
Eichholz, C., A. Majumdar, M. A. Clarke, L. R. Oellrich, and P. R. Bishnoi (2004), Experimental investigation and calculation of methane hydrate formation conditions in the presence of ethylene glycol and sodium chloride, Journal of Chemical & Engineering Data, 49(4), 847-851.
Fer, I. and Haugan, P. M. (2003). Dissolution from a liquid co2 lake disposed in the deep ocean. Limnology and Oceanography, 48:872–883.
Husebø, J., G. Ersland, A. Graue, and B. Kvamme (2009), Effects of salinity on hydrate stability and implications for storage of CO2 in natural gas hydrate reservoirs, Energy Procedia, 1(1), 3731-3738.
Jager, M. D., and E. D. Sloan (2001), The effect of pressure on methane hydration in pure water and sodium chloride solutions, Fluid Phase Equilibria, 185(1–2), 89-99.
Jager, M. D., C. J. Peters, and E. D. Sloan (2002), Experimental determination of methane hydrate stability in methanol and electrolyte solutions, Fluid Phase Equilibria, 193(1–2), 17-28.
Kang, S.-P., M.-K. Chun, and H. Lee (1998), Phase equilibria of methane and carbon dioxide hydrates in the aqueous MgCl2 solutions, Fluid Phase Equilibria, 147(1–2), 229-238.
Kharrat, M., and D. Dalmazzone (2003), Experimental determination of stability conditions of methane hydrate in aqueous calcium chloride solutions using high pressure differential scanning calorimetry, The Journal of Chemical Thermodynamics, 35(9), 1489-1505.
Li, S., Y. Chen, and Y. Hao (2011), Experimental study of influence factors of hot-brine stimulation for dissociation of NGH in porous media, paper presented at 7th International Conference on Gas Hydrates (ICGH 2011), Edinburgh, Scotland, United Kingdom.
Liu, C., Y. Ye, S. Sun, Q. Chen, Q. Meng, and G. Hu (2013), Experimental studies on the P-T stability conditions and influencing factors of gas hydrate in different systems, Sci. China Earth Sci., 56(4), 594-600.
Maekawa, T., and N. Imai (2000), Equilibrium conditions of methane and ethane hydrates in aqueous electrolyte solutions, Annals of the New York Academy of Sciences, 912(1), 932-939.
Maekawa, T., S. Iton, S. Sakata, S.-I. Igari, and N. Imai (1995), Pressure and temperature conditions for methane hydrate dissociation in sodium chloride solutions, Geochemical Journal, 29, 325-329.
Masoudi, R., B. Tohidi, A. Danesh, A. C. Todd, R. Anderson, R. W. Burgass, and J. Yang (2005), Measurement and prediction of gas hydrate and hydrated salt equilibria in aqueous ethylene glycol and electrolyte solutions, Chemical Engineering Science, 60(15), 4213-4224.

DOE Award No.: DE-FE0010406 DUNS No.: 170230239 Quarterly Research Performance Progress Report (Period ending 6/30/2012) CONTROLS ON METHANE EXPULSION DURING MELTING OF NATURAL GAS HYDRATE SYSTEMS: TOPIC AREA 2
Page | 26
McDougall, T. J. (1984). Convective processes caused by a dense, hot saline source flowing into a submarine depression from above. Deep-Sea Research, 31:1287–1309.
Mei, D.-H., J. Liao, J.-T. Yang, and T.-M. Guo (1996), Experimental and modeling studies on the hydrate formation of a methane + nitrogen gas mixture in the presence of aqueous electrolyte solutions, Industrial & Engineering Chemistry Research, 35(11), 4342-4347.
Mohammadi, A. H., and D. Richon (2009), Methane hydrate phase equilibrium in the presence of salt (NaCl, KCl, or CaCl2) +ethylene glycol or salt (NaCl, KCl, or CaCl2)+ methanol aqueous solution: Experimental determination of dissociation condition, The Journal of Chemical Thermodynamics, 41(12), 1374-1377.
Mohammadi, A. H., and D. Richon (2010), Gas hydrate phase equilibrium in the presence of ethylene glycol or methanol aqueous solution, Industrial & Engineering Chemistry Research, 49(18), 8865-8869.
Mohammadi, A. H., W. Afzal, and D. Richon (2008), Gas hydrates of methane, ethane, propane, and carbon dioxide in the presence of single NaCl, KCl, and CaCl2 aqueous solutions: Experimental measurements and predictions of dissociation conditions, The Journal of Chemical Thermodynamics, 40(12), 1693-1697.
Najibi, H., A. Chapoy, H. Haghighi, and B. Tohidi (2009), Experimental determination and prediction of methane hydrate stability in alcohols and electrolyte solutions, Fluid Phase Equilibria, 275(2), 127-131.
Ng, H.-J., and D. B. Robinson (1985), Hydrate formation in systems containing methane, ethane, propane, carbon dioxide or hydrogen sulfide in the presence of methanol, Fluid Phase Equilibria, 21(1–2), 145-155.
Østergaard, K. K., R. Anderson, M. Llamedo, and B. Tohidi (2002), Hydrate phase equilibria in porous media: effect of pore size and salinity, Terra Nova, 14(5), 307-312.
Phrampus, B. J. and Matthew J. Hornbach (2012), Recent changes to the Gulf Stream causing widespread gas hydrate destabilization, Nature, 490, 527-531.
Sangster, D. F. (2002). The role of dense brines in the formation of vent-distal sedimentary- exhalative (sedex) lead-zinc deposits: field and laboratory evidence. Mineralium Deposita, 37:149–157.
Saw, V. K., I. Ahmad, A. Mandal, G. Udayabhanu, and S. Laik (2012), Methane hydrate formation and dissociation in synthetic seawater, Journal of Natural Gas Chemistry, 21(6), 625-632.
Simandoux, P., 1963, Dielectric measurements in porous media and application to shaly formation: Revue de L'Institut Francais du Petrole, v. 1B, p. 13.
Spangenberg, E., 2001, Modeling of the influence of gas hydrate content on the electrical properties of porous sediments: Journal of Geophysical Research, v. 106, p. 14.
Sun, R., and Z. Duan (2005), Prediction of CH4 and CO2 hydrate phase equilibrium and cage occupancy from ab initio intermolecular potentials, Geochimica et Cosmochimica Acta, 69(18), 4411-4424.
Tang, L. G., R. Xiao, C. Huang, Z. P. Feng, and S. S. Fan (2005), Experimental investigation of production behavior of gas hydrate under thermal stimulation in unconsolidated sediment, Energy & Fuels, 19(6), 2402-2407.
Turner, J. S. (1973). Buoyancy effects in fluids. Cambridge Univ. Press. Turner, J. S. and Gustafson, L. (1978). The flow of hot saline solutions from vents in the sea floor - some
implications for exhalative massive sulfide and other ore deposits. Economic Geology, 73:1082–1100.
Yang, X., C.-Y. Sun, K.-H. Su, Q. Yuan, Q.-P. Li, and G.-J. Chen (2012), A three-dimensional study on the formation and dissociation of methane hydrate in porous sediment by depressurization, Energy Conversion and Management, 56(0), 1-7.
Yang, X., C.-Y. Sun, Q. Yuan, P.-C. Ma, and G.-J. Chen (2010), Experimental study on gas production from methane hydrate-bearing sand by hot-water cyclic injection, Energy & Fuels, 24(11), 5912-5920.
DOE Award No.: DE-FE0010406 DUNS No.: 170230239 Quarterly Research Performance Progress Report (Period ending 6/30/2012) CONTROLS ON METHANE EXPULSION DURING MELTING OF NATURAL GAS HYDRATE SYSTEMS: TOPIC AREA 2
Page | 27
Yousif, M. H., and E. D. Sloan (1991), Experimental investigation of hydrate formation and dissociation in consolidated porous media, SPE Reservoir Engineering, 6(4), 452-458.
Yousif, M. H., M. S. Selim, and E. D. Sloan (1991), Experimental and theoretical investigation of methane-gas-hydrate dissociation in porous media, SPE Reservoir Engineering, 6(1), 69-76.
Yuan, Q., C.-Y. Sun, X. Yang, P.-C. Ma, Z.-W. Ma, Q.-P. Li, and G.-J. Chen (2011), Gas production from methane-hydrate-bearing sands by ethylene glycol injection using a three-dimensional reactor, Energy & Fuels, 25(7), 3108-3115.
Yuan, Q., C.-Y. Sun, X.-H. Wang, X.-Y. Zeng, X. Yang, B. Liu, Z.-W. Ma, Q.-P. Li, L. Feng, and G.-J. Chen (2013), Experimental study of gas production from hydrate dissociation with continuous injection mode using a three-dimensional quiescent reactor, Fuel, 106(0), 417-424.

National Energy Technology Laboratory 626 Cochrans Mill Road P.O. Box 10940 Pittsburgh, PA 15236-0940 3610 Collins Ferry Road P.O. Box 880 Morgantown, WV 26507-0880 13131 Dairy Ashford Road, Suite 225 Sugar Land, TX 77478 1450 Queen Avenue SW Albany, OR 97321-2198 Arctic Energy Office 420 L Street, Suite 305 Anchorage, AK 99501 Visit the NETL website at: www.netl.doe.gov Customer Service Line: 1-800-553-7681