By JOLENE ELISE MWENGI - Dissertations & Theses · by Jolene Elise Mwengi, M.S. Washington State...
69
FABA BEAN GROWTH RESPONSE TO SOIL TEMPERATURE AND NITROGEN By JOLENE ELISE MWENGI A thesis submitted in partial fulfillment of the requirements for the degree of MASTER OF SCIENCE IN SOIL SCIENCE WASHINGTON STATE UNIVERSITY Department of Crop and Soil Sciences May 2011
-
Upload
nguyenhanh -
Category
Documents
-
view
219 -
download
0
Transcript of By JOLENE ELISE MWENGI - Dissertations & Theses · by Jolene Elise Mwengi, M.S. Washington State...
FABA BEAN GROWTH RESPONSE TO SOIL TEMPERATURE
AND NITROGEN
By
JOLENE ELISE MWENGI
A thesis submitted in partial fulfillment of the requirements for the degree of
MASTER OF SCIENCE IN SOIL SCIENCE
WASHINGTON STATE UNIVERSITY Department of Crop and Soil Sciences
May 2011

ii
To the Faculty of Washington State University: The members of the Committee appointed to examine the thesis of JOLENE ELISE
MWENGI find it satisfactory and recommend that it be accepted.
___________________________________ William L. Pan, Ph.D., Chair ___________________________________
Clarice J. Coyne, Ph. D. ___________________________________ Jinguo Hu, Ph.D.
___________________________________ Lynne Carpenter-Boggs, Ph.D.

iii
ACKNOWLEDGMENTS
Funding for this project was provided by a USDA Horticulture Crops Evaluation award,
USDA ARS CRIS Project 5348-21 000-026-00D, Washington State University
Agricultural Research Center Project 0373, and Washington State University Department
of Crop and Soil Sciences. Assistance from Landon Charlo, Wayne Olson, Kurt Tetrick,
Anne Kennedy, and Ron Bolton were greatly appreciated.

iv
FABA BEAN GROWTH RESPONSE TO SOIL TEMPERATURE
AND NITROGEN
Abstract
by Jolene Elise Mwengi, M.S.
Washington State University
May 2011
Chair: William L. Pan
The Palouse is known for dryland wheat production. Limited rainfall combined
with a Mediterranean distribution pattern limit what can be grown successfully. Fall
planted faba bean is grown commercially in Mediterranean climates where cold
temperatures are not limiting as well as in colder regions of Northern Europe where
excess moisture is more limiting than drought. A variety trial for fall planted faba beans
including 43 genotypes from the National Plant Germplasm System and 12 cultivars and
breeding lines previously identified as winter-hardy in European trials identified 13
genotypes as winter-hardy with high yield potential
Frost resistance in leaf tissue was found to correlate significantly to both plant
survival and seed yield, but low R2 values indicated winter-hardiness required additional
stress tolerances. Comparative soil temperature minimums between site-years were found
to better correlate to plant survival than ambient temperature minimums frost resistance
in root tissue may be an important genetic factor contributing to winter-hardiness.
Faba beans are known to have a high capacity to fix nitrogen (N) over a wide
range of climates and growing conditions. Tolerance to available soil nitrate may play a
v
role in greater rates of N2 fixation. A growth chamber investigation of nodulation
response to nitrate-N revealed that while pea (Pisum sativum) showed a negative
response in nodule number to increasing soil nitrate-N up to 132ppm at planting, faba
bean (Vicia faba L.) did not. At low levels of soil nitrate-N, less than 15 ppm, nodules for
both pea and faba bean appeared greater in size and pink in color when compared to
nodules formed at soil nitrate-N above 45ppm. Further work comparing tolerance to
nitrate-N for overall N2 fixation should target nodule growth and active fixation subjected
to soil nitrate-N ranging from 10 to 50 ppm with growing conditions supporting long
term nodule growth. This research supports that nodulation in faba bean does show
superior tolerance to soil nitrate-N.

vi
TABLE OF CONTENTS
Page
ACKNOWLEDGEMENTS ............................................................................................... iii
ABSTRACT .................................................................................................................... iv-v
LIST OF TABLES ........................................................................................................... viii
LIST OF FIGURES ........................................................................................................... ix
CHAPTER 1: Fall planted faba bean, a potential rotation for cropping systems in the
Palouse
1. AGRICULTURAL SYSTEMS ON THE PALOUSE ..........................................1
2. LEGUMES IN CROP ROTATIONS ...................................................................3
3. FABA BEAN ........................................................................................................4
LITERATURE CITED ......................................................................................................10
CHAPTER 2: Winter-Hardiness and Yield Potential of Faba Bean (Vicia faba L.)
Subjected to Subfreezing Temperatures
1. INTRODUCTION ........................................................................................................ 14
2. MATERIALS AND METHODS .................................................................................. 16
3. RESULTS AND DISCUSSION ................................................................................... 18
4. CONCLUSIONS ........................................................................................................... 26
LITERATURE CITED......................................................................................................41
CHAPTER 3: Nodulation Response to Available Soil Nitrate in Faba bean and Pea
1. INTRODUCTION................................................................................................43
2. MATERIALS AND METHODS …...................................................................46
3. RESULTS AND DISCUSSION………...………………………………………48
4. CONCLUSIONS………………………………………………………………..51
vii
LITERATURE CITED…………………………………………..………………………55
CHAPTER 4: Summary and Conclusions………………………………………………58

viii
LIST OF TABLES
1. Genotypes Included in Field Trial .................................................................................28
2. Comparative Plant Survival Among Site-years .............................................................29
3. Comparative Exposure to Sub-Freezing Temperatures .................................................30
4. Winter-hardy, High Yielding Genotypes Identified ......................................................37
5. Frost Resistance - Plant Survival/Growth Characteristics Correlation ..........................38
6. Comparative Plant Survival/Growth Characteristics by Country of Origin ..................40
7. Specific Nodulation .......................................................................................................52

ix
LIST OF FIGURES
1. Comparative Plant Survival Between Site-years ...........................................................29
2. Minimum Daily Ambient Temperature .........................................................................31
3. Minimum Soil Temperature: Surface ............................................................................32
4. Minimum Soil Temperature: 15cm ................................................................................32
5. Average Soil Moisture: 15cm .......................................................................................33
6. Field Conditions 2-Feb CF 09-10 ..................................................................................33
7. Comparative Plant Survival by Genotype......................................................................34
8. Genotypes Identified with Superior Winter-hardiness ..................................................35
9. Genotypes Identified with High Yield Potential ...........................................................36
10. Comparative Frost Resistance between years ..............................................................39
11. Root Length: Manual vs. Computer Image Analysis...................................................52
12. Nodulation Response to Soil Nitrate............................................................................53
13. Nitrate Affect on Timing of Nodulation ......................................................................53
14. Comparative Nodule Size and Color ...........................................................................53
1
CHAPTER ONE
Fall planted faba bean, a potential rotation for cropping systems in the Palouse
Agricultural systems on the Palouse
The Palouse region of eastern Washington and northern Idaho is known for its cereal and
cool season legume production in a dryland environment. In the high rainfall areas, 46 to 60 cm
annual rainfall, crop rotations are dominated by 2 and 3 year rotations of winter wheat, spring
cereals, and grain legumes. Winter wheat is the main cash crop, planted in rotation with spring
crops of barley or wheat, and a spring legume such as pea, lentil, or chickpea (Schillinger, 2006).
The climate is Mediterranean, receiving 60%-70% of precipitation between November and April,
but with the high elevations, 20% of that is snowfall (Schillinger et al., 2006). Average
temperatures for December and January are about 0°C, but will get down to -10°C and lower and
soils can freeze to depths of 41 cm (Schillinger et al., 2006). The landscape is made up of rolling
loessial hills with cultivation occurring on slopes as steep as 30% (Schillinger et al., 2006).
Cropping systems changed drastically over the last 60 years, becoming less reliant on
diversified rotations and more reliant on chemical fertilizers, herbicides, and pesticides
(Granatstein, 1992). The release of shorter wheat varieties meant yield response to added N was
no longer inhibited by induced lodging. The yield potential for wheat doubled (Khush, 1999;
Jennings, 1990). Inexpensive, readily available N fertilizers eliminated the dependence on
biological dinitrogen fixation (BNF) via legume rotations. It became more profitable to increase
the percentage of land planted into wheat and apply heavy rates of synthetic N fertilizers. High
residual levels in the area indicate a tendency to over-fertilize basing rates on maximum rather
than average yields despite the inability to predict growing conditions (Granatstein, 1992).

2
High input, industrial farming has led to soil degradation, but advances in new crop
varieties and improved technologies have hidden the negative impacts of these practices on soil
(McCool et al., 2001). Declining soil organic matter, increasing soil acidity and a reduction in
both biological activity and diversity are some of the environmental costs that threaten long term
productivity of the land (McCool et al., 2001). Soil pH has declined in proportion the
accumulated N fertilizer (Granatstein, 1992).
Increasing our reliance on legumes in cropping systems to add fixed N to the soil system
and/or food via proteins in harvested grains will have a positive impact on the sustainability of
cropping systems of this region. Sustaining food production requires management practices that
will not deplete and ultimately destroy requisite resources needed for the task such as soil, water,
and nonrenewable energy (Bohlool et al., 1992). From an energy standpoint BNF may be a more
sustainable source of N than fertilizer N with energy coming from the sun via photosynthesis
rather than non-renewable fossil fuel energy sources used in industrial production of fertilizer
NH3 (Crews and Peoples, 2004). Adding complexity and flexibility in cropping systems can
reduce weed and disease pressure resulting in decreased dependence on pesticide inputs as well
as increase nutrient and water use efficiency (Hanson et al., 2007).
There is interest in finding alternative rotation crops that provide agronomic advantages
(e.g., weed and disease control) and economic returns, increased sustainability, and flexibility.
Schillinger et al. (2006) listed alternative rotation crops that could be used instead of spring
cereals as an advance for dryland farming while at the same time calling for more field testing of
crops to create a greater diversity. A winter hardy legume capable of fixing high amounts of N
would make a good rotation crop for the Palouse. High N2-fixing legumes such as faba bean are
gaining attention as N fertilizer costs rise.

3
Legumes in crop rotations
Crop rotations increase wheat yields. A recent review found yield increases averaged
around 14% for wheat following a rotation crop vs. continuous wheat (Kirkegaard et al., 2008).
Legumes in rotation provide a source of N and other ecosystem services that enhance production
of subsequent crops (Peoples et al., 2009). Legumes in rotation increase yields beyond what can
be accounted for with added N. Stevenson and van Kessel (1996) found 92% of the 43% yield
advantage of wheat following pea vs. wheat was from non-N rotation benefits. Legumes provide
many ecosystem services including improved soil structure, increased soil porosity, recycling of
nutrients, increased biodiversity, and breaks in disease, weed, and pest cycles. The taproot root
structure of legumes improves soil structure by breaking up hardpans. Rochester et al. (2001)
attributed lower soil strength following legume rotations to increased root health and
development in cotton which ultimately resulted in higher lint yields. Legumes also improve soil
structure by improving soil aggregation and encourage greater biological activity (Jenson and
Hauggaard-Nielson, 2003). Disease and pest cycles in cereal crops are often reduced (Jenson and
Hauggard-Nielson, 2003; Peoples et al., 2009). In addition legumes have been found to enhance
P availability in wheat crops (Nuruzzaman et al., 2005).
Although legumes are often included in crop rotations for additions biologically fixed N,
it cannot be assumed that fixed N will be greater than the N that is removed. This is especially
true with grain legumes where the plant N removed with harvested grain ranges from 40 to 75%
(van Kessel and Hartley). With so much N removed, a net gain in soil N requires a sizable
amount of N2 fixed. The percentage of plant N derived from air (%Ndfa) and total plant biomass
are the factors that determine total fixed N. Legume crops utilize N from a combination of
sources that can include mineralized soil N, N derived from the atmosphere, and fertilizer N

4
(Salvagiotti, 2008). The extent to which legumes rely on BNF, and therefore the percentage of
plant N derived from air (%Ndfa) varies depending on species, variety, climate, soil properties,
and management practices as does overall plant growth (Beck, 1991; Peoples et al., 2009, van
Kessel and Hartly, 2000). Out of 505 published data sets reporting N2 fixation in soybean, 316 of
which did not involve fertilizer application, %Ndfa ranged from 0 to 98% (Salvagiotti et al.,
2008). Peoples et al. (2009) reviewed published studies on N2 fixation for difference species
around the world and found averages for species across environments ranged from 39% Ndfa for
common bean (Phaseoulus vulgaris) to 75%Ndfa for faba beans (Vicia faba). Soils high in
mineral N have a negative impact on N2 fixation (Salvagiotti, 2008), the extent of which is
species dependent (van Kessel and Hartley, 2000). An analysis of 637 published data sets on
soybeans showed that low ratios of fixed-N:N-uptake occurred with high nitrate soils, high
acidity, ineffective strains of Bradyrhizobium, and water deficits (Salvagiotti et al., 2008).
Faba Bean
Faba bean is a cool season grain legume grown in many regions of the world. In colder
regions faba bean is more often planted as a spring crop while in warm-temperate and
subtropical climates it is planted into the winter (Duc, 1997). There are three botanical types that
can roughly be distinguished by seed size: V. faba major with 1000 seed weights greater than
1kg; V. faba minor with 1000 seed weights less that 500g, and V. faba equina with 1000 seed
weights (Duc, 1997). Small seeded varieties tend to be more winter-hardy than the larger types,
but breeding efforts have been successful in transferring hardiness to equina types (Bond,1999).
Faba bean has proven to be a superior rotational crop for dryland wheat production under
limited rainfall. The results of a long term study carried out in Spain showed faba bean had the
greatest rotation effect on wheat yields as compared to chickpea, sunflower, fallow, and

5
continuous wheat. As in the Palouse, steep slopes and a Mediterranean climate make water and
N the most limiting to wheat yield. Further study showed significantly higher soil water content
at planting for wheat crops preceded by faba bean and fallow than preceded by chickpea, wheat,
or sunflower (Lopez-Bellido, 2007a). For additions of N fertilizer in wheat up to 150 kg∙ha-1
, the
faba-wheat rotation had higher wheat yields than all other rotations and maximum wheat yield
was obtained with less fertilizer N for the faba-wheat rotation than all other rotations (Lopez-
Bellido, 2007b). Within the same study, a two year field experiment was conducted to find the
contribution to the N balance of the cropping system. The mean residual N following faba bean
was18.3 kg N ha-1
with values as high as 40 kg N ha-1
. These values did not include the N
contribution from plant roots (Lopez-Bellido et al., 2006).
Residual N derived from legume crops are often underestimated because below-ground
N (BGN) is not considered. Khan et al. (2003) found BGN constituted 24% of total plant N for
faba bean and 68% for chickpea. The allocation of nutrients as well as the root:shoot ratio is
dependent on soil properties and environmental conditions. Averages from published studies for
BGN of faba bean and chickpea were 34% and 56% respectively (Khan et al., 2003).
Faba bean has a high capacity for N fixation when compared to other grain legumes.
Compiling published experimental data and reviews that include a wide range of agronomic,
environmental, and experimental factors, Herridge and Peoples (2008), found average %Ndfa in
faba bean to be higher than other legumes: faba bean averaged 75% while chickpea, lentil and
pea averaged 68%. Compiling data from > 800 farmers‟ fields, faba bean averaged 68%Ndfa
while chickpea, lentil, and pea averaged 65%Ndfa (Herridge and Peoples, 2008). A review of the
role of legumes in supplying N to cropping systems around the world showed faba bean fixed
high amounts of N across geographic regions (Peoples, 2009).

6
Faba beans and chickpeas are often used in rotation with wheat in dryland cropping
regions of Australia which like the Palouse have a Mediterranean rainfall pattern. A survey
evaluating N contributions of commercially grown faba beans and chickpeas showed a wide
variation in both N fixation and net N contributions. The use of faba beans usually resulted in a
net gain to the plant-soil system while net N balance under chickpeas showed both positive and
negative with an average of zero (Schwenke et al., 1998). The N contribution in chickpea
appeared to be more susceptible to drought (Schwenke et al, 1998).
Typical pulse crops used in rotation with cereals in the Northern Great Plains region are
similar to those grown in the Palouse. They include field pea (Pisum sativum L.), lentil (Lens
culinaris Medik.), chickpea (Cicer arietinum L.), and faba bean (Vicia faba L.). Walley et al.
(2007) prepared a meta-analysis of published studies in the region to evaluate and compare net N
contributions from the different pulse species. Comparing N contributions within each species
showed variable results among the studies due in large part to high variation in %Ndfa.
Comparing between species, faba bean contributed more N than pea or lentil and chickpea
contributed little to no N (Walley et al., 2007).
Biological N fixation is the product of the symbiotic relationship between legume and
rhizobium species. Mineral N has a negative impact on the BNF over multiple stages of the
symbiosis including nodulation, nodule growth, and N2 fixation activity. All stages play in role
in determining total biologically fixed N. The relative sensitivities of each stage to concentration
and form of N change with increasing N (Streeter, 1998). At high enough concentrations, all
forms of mineral N will inhibit N fixation (Guo, 1992). At low concentrations, nitrate has a
greater effect on both nodulation and nodule growth than ammonium (Bollman and Vessey,
2006). Over a certain range of soil nitrate, nodulation is less sensitive than nodule growth
7
(Steeter, 1988). At a N concentration of 5 mM combined N, soybeans showed no difference in
nodule number, but the nodules were much smaller and lacking in visible leghaemoglobin
(Cassman, 1980).
It has been reported that faba bean is more tolerant to mineral N than other legume
species. Through extrapolation Schwenke et al. (1998) estimated that faba beans could maintain
a net zero N balance with soil nitrate levels as high as 280 kg/ha while chickpea could only
maintain a net zero N balance with soil nitrate levels less than 43 kg/ha. Turpin et al.( 2002)
found that for soil nitrate levels between 71 and 86 Kg·ha-1
faba bean maintained a %Ndfa of
45% while chickpea maintained only 12%. A nutrient solution containing 18 mM Nitrate- N was
required to completely inhibit nodulation in faba bean while it took a concentration of only 7mM
inhibit nodulation in French bean (Chalifour and Nelson, 1988).
Chalifour and Nelson (1987) showed superior tolerance to mineral N by faba bean over
pea in a controlled experiment comparing N fixation response of the legume-rhizobium
symbiosis to increasing rates of nitrate - N. While the %Ndfa decreased for both species, the
suppression of N2 fixation with increasing nitrate was much larger for pea. The highest nitrate
treatment, 15 mM, resulted in zero Ndfa for pea while faba bean maintained 15.4 %Ndfa. Further
investigation showed that nitrate present at planting had a much larger impact on N fixation in
pea than later applications. This was not the case for faba bean leading to the conclusion that the
tolerance of the faba bean –rhizobium symbiosis to soil nitrate must be due in large part to its
ability to form effective nodules in the presence of high combined N (Chalifour and Nelson,
1988).
Winter crops have potential yield advantages over their spring counterparts depending on
varietal adaptation to climate. A field trial conducted across 3 locations in Syria and Lebanon
8
resulted in winter yields 70% higher than spring yields for chickpea (Singh, 1997). Chen et al.
(2006) found significantly higher yields for winter pea and lentil over spring pea and lentil
grown in the Palouse region of the Pacific Northwest, but no yield advantage for winter pea over
spring pea in the Northern Great Plains. Reasons cited for the advantage of winter pea in the
Palouse was milder winter temperatures and the winter concentrated precipitation distribution
(Chen et al., 2006). Wet springs with soils high in clay can delay planting of spring crops in the
Palouse which in turn shortens the growing season.
Winter varieties of faba beans have shown to produce higher yields than their spring
counterparts. Two series of field trials conducted between 1981 and 1988 for three locations in
Germany found winter yields to be 14% higher than spring yields (Herzog and Geisler, 1991).
More recent trials in the UK found winter yields were 47% higher than spring yields when
averaged over 3 locations (Link et al., 2010). It is likely that autumn sown faba beans would
show a yield advantage in the Palouse. Autumn sown winter varieties tend to mature before
spring types, which makes them suitable for a Mediterranean environment where they can take
full advantage of spring moisture and better avoid drought conditions (Duc, 1997, Link et al.,
2010).
As an added economic advantage, fall seeded faba beans require a lower seeding rate due
to their ability to develop more than one stem (Herzog, 1989). Winter cultivars have 4-6 stems
per plant while spring cultivars have 1-2 (Duc, 1997). First and second tiller have an equivalent
yield potential (Herzog, 1989). Roughly et al. (1983) found that autumn sowing faba beans can
have a positive impact N fixation. Field trials revealed that faba beans will start fixing N before
temperatures get below freezing and will fix a substantial amount of N in early spring before
spring planting.

9
The results of a field trial involving 29 faba bean varieties planted in fall across 5
European locations showed that frost tolerance was a contributing factor to plant survival and
yield, but varietal adaptation to site-specific biotic and climate stresses played a role as well. One
experimental line, identified as F7-29, had the highest yield for a single site-year, but did not
yield well across environments. Bulldog/1 was identified as one of five varieties that showed
better plant survival across all environments, but did not have a high frost tolerance. Authors
credited winter-hardiness for Bulldog/1 to good adaptation (Arbaoui et al., 2008).
Fall planted faba bean has potential to fit cropping systems in the Palouse. Although
susceptible to drought, fall planted faba bean yields well in Mediterranean environments.
Commercial production of fall planted faba bean has been successful in colder regions such as
UK and France. Breeding efforts for increased winter-hardiness are ongoing to expand
overwintering of faba beans into colder regions. A high capacity for N2 fixation along with a
high tolerance for residual N could mean an advantage over legume crops currently used in
rotation. An added alternative crop to wheat rotations would allow greater diversity in cropping
systems.
10
References
Arbaoui, M., C. Balko, and W. Link. 2008. Study of faba bean (Vicia faba L.) winter-hardiness
and development of screening methods. Field Crops Res. 106: 60 – 67.
Beck, D.P., J. Wery, M.C. Saxena, and A. Ayadi. 1991. Dinitrogen Fixation and Nitrogen
Balance in Cool-Season Food Legumes. Agron. J. 83: 334 – 341.
Bohlool, B.B., J.K. Ladha, D.P. Garrity and T. George. 1992. Biological nitrogen fixation for
sustainable agriculture: A perspective. Plant Soil 141: 1 – 11
Bond, D.A., Crofton, G.R.A., 1999. History of winter beans (Vicia faba) in the UK. J. R.
Agric. Soc. Engl. 160, 200–209.
Cassman, K.G., A.S. Whitney, and K.R. Stockinger. 1980. Root Growth and Dry Matter
Distribution of Soybean as Affected by Phosphorus Stress, Nodulation, and Nitrogen Source.
Crop Sci. 20: 239 – 244.
Chalifour, F. P. and L. M. Nelson. 1987. Effects of continuous combined nitrogen supply on
symbiotic dinitrogen fixation of faba bean and pea inoculated with different rhizobial isolates.
Can. J. Bot. 65: 2542 – 2548.
Chen, C., P. Miller, F. Muehlbauer, K. Neill, D. Wichman, and K. McPhee. 2006. Winter Pea
and Lentil Response to Seeding Date and Micro- and Macro-Environments. Agron. J. 98: 1655 –
1663.
Crews, T.E., and M.B. Peoples. 2004. Legume versus fertilizer sources of nitrogen: ecological
tradeoffs and human needs. Agric. Ecosyst. Environ. 102: 279 – 297.
Duc, G. 1997. Faba bean (Vicia faba L.). Field Crops Res. 53: 99 – 109.
Granatstein, D. 1992. Dryland Farming in the Northwestern United States:
A Nontechnical Overview. MISC0162, Washington State University Cooperative Extension,
Pullman. 31 pp.
Guo, R., James H. Silsbury, and R. D. Graham. 1992. Effect of four nitrogen compounds on
nodulation and nitrogen fixation in faba bean, white lupin, and medic plants. J. Plant Physiol. 19:
501 - 508.
Hanson, J.D., M.A Liebig, S.D. Merrill, D.L. Tanaka, J.M. Krupinsky, and D. E. Stott. 2007.
Dynamic cropping systems: Increasing adaptability amid an uncertain future. Agron. J. 99: 939 –
943.
Herridge, D. F., M. B. Peoples. 2008. Global inputs of biological nitrogen fixation in agricultural
systems. Plant Soil. 311: 1 – 18.

11
Herzog, H. 1989. Development and yield formation of autumn- and sping-sown faba beans in
northern germany as affected by seasons, sowing dates and varieties. J. Agron. Crop Sci. 163:
181 – 189.
Herzog, H. and G. Geisler. 1991. Yield structure of winter faba beans grown in northern
Germany in dependence of different environments, seed rates, and sowing rates, and genotypes.
J. Agron. Crop Sci. 167: 145 – 154.
Jennings, MD., B.C. Miller, D.F. Bezdicek, and D. Granatstein. 1990. Sustainability of dryland
cropping in the Palouse: An historical view. J. Soil Water Conserv. 45(1): 75 - 80.
Jensen, E.S. and H. Hauggaard-Nielsen. 2003. How can increased use of biological N2 fixation in
agriculture benefit the environment? Plant Soil. 252: 177 – 186.
Jensen, E.S., Mark B. Peoples, and Henrik Hauggaard-Nielson. 2010. Faba bean in cropping
systems. Field Crops Res. 115: 203 – 216.
Kage, H. 1997. Is low rooting density of faba beans a cause of high residual nitrate content of
soil at harvest? Plant Soil. 190: 47 – 60.
Khan D. F., M. B. Peoples, G. D. Schwenke, W. L. Felton, D. Chen, and D. F. Herridge. 2003.
Effects of below-ground nitrogen on N balances of field-grown fababean, chickpea, and barley.
Aust. J. of Agric. Res. 54: 333 – 340.
Kirkegaard, J., O. Christen, J. Krupinsky, and D. Layzell. 2008. Break crop benefits in temperate
wheat production. Field Crops Res. 107: 185 – 195.
Khush, G. S. 1999. Green revolution: preparing for the 21st century. Genome 42: 646 – 655.
Link, W., C. Balko, F.L. Stoddard. 2010. Winter hardiness in faba bean: Physiology and
breeding. Field Crops Res. 115: 287 – 296.
Lopez-Bellido, L., M. Fuentes, J.E. Castillo, F.J. Lopez-Garrido, and E.J. Fernandez. 1996.
Long-term tillage, crop rotation, and nitrogen fertilizer effects on wheat yield under rainfed
Mediterranean conditions. Agron. J. 88: 783 – 791.
Lopez-Bellido, Luis, Rafael J. Lopez-Bellido, Romon Redondo, and Jorge Benitez. 2006. Faba
bean nitrogen fixation in a wheat-based rotation under rainfed Mediterranean conditions: Effect
of tillage system. Field Crops Res. 98:253 – 260.
Lopez-Bellido, Rafael J., Luis Lopez-Bellido, Jorge Benitez-Vega, and Francisco J. Lopez-
Bellido. 2007a. Tillage system, preceding crop, and nitrogen fertilizer in wheat crop: I. Soil
water content. Agron. J. 99: 59 – 65.
Lopez-Bellido, Rafael J., Luis Lopez-Bellido, Jorge Benitez-Vega, and Francisco J. Lopez-
Bellido. 2007b. Tillage system, preceding crop, and nitrogen fertilizer in wheat crop: II. Water
utilization. Agron. J. 99: 66 – 72.
12
McCool, D.K., D.R. Huggins, K.E. Saxton, and A.C. Kennedy. 2001. Factors affecting
agricultural sustainability in the Pacific Northwest, USA: An overview. p. 255 – 260. In D.E.
Stott, R.H. Mohtar and G.C. Steinhardt (eds.) Sustaining the Global Farm.
Nuruzzaman, M., H. Lambers, M. D.A. Bolland and E. Veneklass. 2005. Phosphorus benefits on
different legume crops to subsequent wheat grown in different soils of Western Australia. Plant
Soil 271: 175 – 187.
Peoples, M.B., J. Brockwell, D.F. Herridge, I.J. Rochester, B.J.R. Alves, S. Urquiaga, R. M.
Boddey, F.D. Dakora, S. Bhattarai, S.L. Maskey, C. Sampet, B. Rerkasem, D.F. Khan, H.
Hauggaard-Nielsen, and E.S. Jensen. 2009. The contributions of nitrogen-fixing crop legumes to
the productivity of agricultural systems. Symbiosis 48: 1 – 17.
Peoples, M. B., H. Hauggaard-Nielsen, and E. S. Jensen. 2009. The potential environmental
benefits and risks derived from legumes in rotations. In: Emerich, D.W., Krishnan, H.B. (Eds.),
Nitrogen Fixation in Crop Production, ASA, CSSA, SSSA (2009).
Rochester I.J., M.B. Peoples, N.R. Hulugalle, R.R. Gault, and G.A. Constable. 2001. Using
legumes to enhance soil condition in cotton cropping systems. Field Crops Res. 70: 27 – 41.
Roughley, R.J., J.I. Sprent, and J. M. Day. 1983. Nitrogen Fixation. In: P.D. Hebblethwaite,
Editor, The Faba Bean (Vicia Faba L.), Butterworths, London (1983), 233 – 260.
Salvagiotti, F., K.G. Cassman, J.E. Specht, D.T. Walters, A. Weiss, A. Dobermann. 2008.
Nitrogen uptake, fixation and response to fertilizer N in soybeans: A review. Field Crops Res.
108: 1 – 13.
Schillinger, W.F., Robert I. Papendick, Stephen O. Guy, Paul E. Rasmussen, and Chris van
Kessel. 2006. Dryland cropping in the western united states. In: Peterson, G.A., Unger P.W.,
Payne, W.A. (Eds.) Dryland Agriculture, Agronomy Monograph No. 23. 2nd
ed. ASA, CSSA,
and SSSA, Madison, WI, pp. 365 -393.
Schwenke, GD, MB Peoples, GL Turner, and DF Herridge. 1998. Does nitrogen fixation of
commercial, dryland chickpea and faba bean crops in north-west New South Wales maintain or
enhance soil nitrogen? Aust. J. Exp. Agric. 38(1): 61 – 70.
Singh, K. B., R. S. Malhotra, M. C. Saxena, and G. Bejiga. 1997. Superiority of Winter Sowing
over Traditional Spring Sowing of chickpea in the Mediterranean Region. Agron. J. 89: 112 –
118.
Smith, S.C., D.F. Bezdicek, R.F. Turco, and H.H. Cheng. 1987. Seasonal N2 fixation by cool-
season pulses based on several 15
N methods. Plant Soil. 97: 3 – 13.
Stevenson, F.C. and C. van Kessel. The nitrogen and non-nitrogen rotation benefits of pea to
succeeding corps. Can. J. Plant Sci. 76: 735 – 745.
Streeter, J. 1988. Inhibition of legume nodule formation and N2 fixation by nitrate. Crit. Rev.
Plant Sci. 7(1): 1 – 23.

13
Turpin, J.E., D.F. Herridge, and M.J. Robertson. 2002. Nitrogen fixation and soil nitrate
interactions in field-grown chickpea (Cicer arietinum) and fababean (Vicia faba). Aust. J. Agric.
Res. 53: 599 – 608.
Van Kessel, C. and C. Hartley. 2000. Agricultural management of grain legumes: has it led to an
increase in nitrogen fixation? Field Crops Res. 65: 165 – 181.
Walley, F. L., G. W. Clayton, P. R. Miller, P. M. Carr, and G. P. Lafond. 2007. Nitrogen
Economy of Pulse Crop Production in the Northern Great Plains. Agron. J. 99: 1710 – 1718.
14
CHAPTER TWO
Winter-Hardiness and Yield Potential of Faba Bean (Vicia faba L.) Subjected to Sub-
Freezing Temperatures
Introduction
The rolling hills of the Palouse are located in Eastern Washington and Idaho and are
known for cereal and cool season legume production in a dryland environment. The Cascade
mountain range induces a rain shadow effect resulting in limited precipitation ranging from
15cm to 61cm increasing from west to east ( Schillinger et al., 2006). The pattern of precipitation
is Mediterranean, receiving 60%-70% of precipitation between November and April, but with the
high elevations, 20% of that is snowfall (Schillinger et al., 2006). Winter temperatures are cool
with average temperatures for December and January near 0°C and occasionally reaching -10°C
or lower. Soils can freeze to depths of 41 cm (Schillinger et al., 2006).
Faba bean (Vicia faba L.) is a cool season legume grown for its high nutritional value and
agronomic benefits. Faba bean is a good source of protein for both humans and animals with
protein content ranging from 27 to 34% (Duc, 1997; Bond et al., 1985). In cropping systems,
faba beans are used for breaking pest, weed, and disease cycles (Jenson and Hauggard-Nielson,
2003; Peoples et al., 2009). The cost of producing high-protein foods and the need to increase
diversity in agricultural systems continue to draw interest in introducing and or increasing faba
beans into cropping systems (Bond, 1985).
Traditionally autumn sowing of faba beans in a Mediterranean environment precedes
mild winter conditions followed by low moisture conditions that can limit yield (Lopez-Bellido,
2005). Autumn sowing allows crops to gain a longer growing season by establishing a stand
using fall-available water and subsequently take advantage of early spring moisture. Fall planting
is advantageous when wet, cool spring soil conditions can delay spring planting. In addition,
15
winter faba beans mature earlier than spring types potentially allowing them to avoid drought
conditions that occur in late spring and summer months (Link et al., 2010). The timing for
available moisture can be critical to faba bean production as they are susceptible to drought,
especially at flowering (Duc, 1997). Temperatures do not usually drop below -6°C in the
Mediterranean region which means chilling and freezing stresses are not often critical (Link et al.
2010). Non-hardened faba beans including both winter and spring types can tolerate
temperatures as low as -5°C without an impact on plant survival or yield (Herzog, 1987).
Faba beans grown in colder regions are normally planted as a spring crop. There is a
higher yield potential for winter genotypes, but most lack the necessary winter-hardiness to be
planted in the fall and survive through the winter (Arbaoui and Link 2008, Annicchiarico 2007).
Winter-hardiness describes overall resistance to multiple stresses present during the winter as
measured by plant survival. Low temperatures and excessive moisture are cited as most limiting
to winter faba bean production in Northern Europe (Lopez-Bellido, 2005). Trials in Germany
carried out in 3 locations over 7 years showed an average yield increase of 14% for winter faba
beans (Herzog and Geisler, 1991). In the UK, a trial taking place in 3 locations within a single
year showed a 47% increase (Link et al., 2010). Breeding efforts are taking place in France,
Germany and the UK to improve winter-hardiness which in turn will improve yield stability and
expand the region in which autumn sown faba beans can be grown (Link et al., 2010).
Winter-hardiness can correlate to a variety of stress tolerances depending on regional
climate and site specific growing conditions. Low temperature, duration of freezing, soil
moisture, soil type, freeze-thaw cycles, disease, and pests can influence plant survival over the
winter (Badaruddin and Meyer, 2001). For faba bean, resistance to freezing temperatures has
been identified as a key component of winter hardiness (Arbaoui et al., 2007, Link et al., 2010).

16
Because leaves are directly exposed to freezing temperatures and leaf injury can hinder crop
growth, visual scoring of leaf injury in controlled frost tests has been used as a method to
measure frost tolerance (Arbaoui et al., 2008).Cultivars identified as showing high frost
resistance include Cote d‟ Or (-16C), and Hiverna (-15C) (Link et al., 2010 referencing Herzog
1987). In the field, Cote d‟Or had 60% plant survival at -25°C without snow cover and often
cited for superior frost-resistance and winter-hardiness (Duc, 1997; Link et al., 2010).
The objectives of this study were to identify winter-hardy germplasm for autumn-sown faba
beans in the Palouse and to identify plant characteristics associated with higher yield potential.
Materials and Methods
A replicated field trial was conducted at 2 locations (Central Ferry and Pullman, WA)
over 2 years. Central Ferry (46°43‟52”N 117°39‟52”W; soil series, a fine-silty, mixed, mesic
Natrixerall) was drip irrigated, while Pullman (46°43‟28”N 117°08‟07”W; soil series, a fine-
silty, mixed, mesic Pachic Ultic Haploxerall) was rainfed. Forty-three faba bean accessions from
the National Plan Germplasm System (NPGS) were used, 40 of which were common to all four
site-years (Table 1). These accessions were collected from Afghanistan, Bulgaria, China,
Finland, Hungary, and Poland, and maintained by the USDA-ARS Western Regional Plant
Introduction Station in Pullman, WA. Twelve additional cultivars and breeding lines that were
identified as winter hardy were obtained from Professor W. Link, Department of Crop Sciences,
Georg-August University, Germany. The cultivars originated from UK, France, and Germany.
They were included in three of the four site-years: Central Ferry 08-09, Central Ferry 09-10, and
Pullman 09-10.
For both site-years, seeds were inoculated with Rhizobium leguminosarum biovar viceae
(N-Dure, INTX Microbials, LLC, Kentland, IN) and treated with Mo, fungicides and insecticide
17
dye prior to planting. Pre-plant Treflan was used for weed control. Planting was done using a
Hedge drill (Wintersteiger AG, Niederlassung, Germany).
The 2008-2009 field trials were planted using a randomized complete block design with
two replications. Two winter-pea varieties of known tolerance to winter conditions for the
Palouse were used as controls: Melrose, most cold-hardy pea in Palouse and Whistler,
moderately cold-hardy pea in Palouse. Plots were single rows approximately 1.5m long with
1.5m between each plot. Faba bean was seeded at 20 seeds∙m-1
and peas were seeded at 40
seeds·m-1
with a planting depth of 5 cm. Planting dates for Pullman and Central Ferry were
September 29, 2008 and October 8, 2008 respectively. Plots were harvested at 80% maturity. A
representative sample of five plants was taken for each plot for analyses below. The remaining
plot was harvested for total seed weight.
The 2009-2010 field trials were planted using a randomized complete block design with
three replications. Two commercially available varieties of bell beans (small-seeded V. faba)
were used as controls: variety name (SC) and variety name (PV). Plots were single rows
approximately 4.6m long with 1.5m between each plot. Faba bean was seeded at 10 seeds∙m-1
.
Planting dates for Pullman and Central Ferry were September 15, 2009 and September 16, 2009
respectively. Plots were harvested at 95% maturity. Whole plot samples were taken for each plot
for analyses below.
Samples from field plots were collected upon harvest for each site-year and brought back
to the lab for processing. In the field plants were dug up whole, collecting as much root as
possible. Above and below ground biomass were separated and placed into bags. In the lab all
samples were rinsed and placed in a dryer at 80°C for 48 hours. After drying, seeds and pods
18
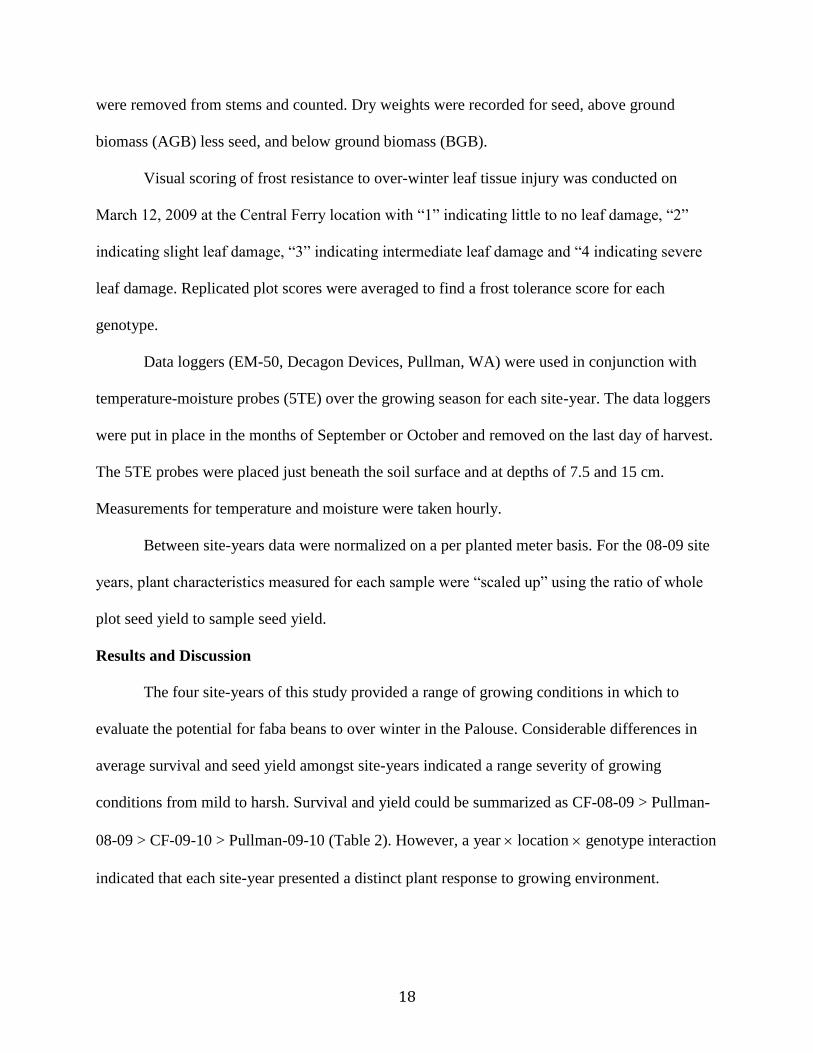
were removed from stems and counted. Dry weights were recorded for seed, above ground
biomass (AGB) less seed, and below ground biomass (BGB).
Visual scoring of frost resistance to over-winter leaf tissue injury was conducted on
March 12, 2009 at the Central Ferry location with “1” indicating little to no leaf damage, “2”
indicating slight leaf damage, “3” indicating intermediate leaf damage and “4 indicating severe
leaf damage. Replicated plot scores were averaged to find a frost tolerance score for each
genotype.
Data loggers (EM-50, Decagon Devices, Pullman, WA) were used in conjunction with
temperature-moisture probes (5TE) over the growing season for each site-year. The data loggers
were put in place in the months of September or October and removed on the last day of harvest.
The 5TE probes were placed just beneath the soil surface and at depths of 7.5 and 15 cm.
Measurements for temperature and moisture were taken hourly.
Between site-years data were normalized on a per planted meter basis. For the 08-09 site
years, plant characteristics measured for each sample were “scaled up” using the ratio of whole
plot seed yield to sample seed yield.
Results and Discussion
The four site-years of this study provided a range of growing conditions in which to
evaluate the potential for faba beans to over winter in the Palouse. Considerable differences in
average survival and seed yield amongst site-years indicated a range severity of growing
conditions from mild to harsh. Survival and yield could be summarized as CF-08-09 > Pullman-
08-09 > CF-09-10 > Pullman-09-10 (Table 2). However, a year location genotype interaction
indicated that each site-year presented a distinct plant response to growing environment.

19
Significant variation in plant survival within each site-year made it possible to distinguish
winter-hardy genotypes within each environment (Figure 1).
Some genotypes varied in their response to environmental conditions of each site-year
evidenced by large changes in rank for plant survival among site-years. For example, W6 12026
ranked only in the 41st percentile for CF-08-09 with 48% survival, but in the harsher conditions
of Pullman 08-09 ranked in the 98th
percentile with 83% survival. Accession W6 12026 showed
no survival for CF-09-10 (Figure 1). Genes can vary greatly in phenotypic expression depending
on stresses present (Stoddard et al., 2006). Environmental preferences indicate different stresses
playing critical roles in plant survival for the different site-years.
Five-plant samples for the 08-09 site-years proved to be insufficient to adequately
represent the diversity within genotypes. The number of plants harvested, which is used to report
plant survival, was calculated from a five-plant sample using the proportion of sample seed
weight to whole plot seed weight. CF-08-09 had 26 out of 104 plots with the number of plants
harvested greater than the number of seed planted resulting in plant survival greater than 100%.
Herzog (1989a) reported a similar problem when taking 5 plant samples to study freezing
resistance in faba bean populations. He found a representative sample should include at least 20
plants. The five plants selected for sampling were visually representative of each plot suggesting
that calculated values, although subject to error, are still useful for comparative purposes.
Resistance to freezing temperature is a recognized component of winter-hardiness.
Ambient temperatures for all site-years included harsh freezing conditions in terms of
temperature minimums and/or duration of freezing. Lab experiments have shown that maximum
frost resistance, the temperature at which exposure results in 50% tissue injury, occurs around
15°C for faba bean (Herzog, 1989a). The cultivar Cote d‟Or is often cited as the best source of

20
frost resistance in faba bean breeding because it showed 60% survival at -25°C (Picard et al.,
1985). Link et al. (2010) attributed a less than 1% survival to a long duration of harsh frost, five
consecutive nights of temperatures below -10°C with daytime temperatures remaining below
freezing, rather than a -16°C temperature minimum. One hundred percent survival was observed
the following year with a lower minimum over a shorter duration, -17°C for a single night. All
site-years for this study had minimum temperatures that were at or below -14° C with at least 5
consecutive nights of harsh frost (Table 3). The number of consecutive days that temperatures
stayed below zero ranged from 7 to 14 (Table 3). The ambient temperature of Pullman 08-09
reached a temperature minimum of -22.2 with 11 consecutive nights of harsh frost (Table 3).
Ambient temperature, temperature at the soil surface, and temperature 15cm beneath the
soil surface show different patterns in terms of comparative daily low temperatures among site-
years over the growing season (Figures 2 – 4). Pullman 08-09 had the lowest ambient
temperature as well as the lowest soil surface temperature in magnitude and duration, yet there
was greater plant survival than both CF-09-10 and Pullman-09-10. At the 15cm depth, Pullman-
09-10 had the lowest temperatures followed by CF-09-10, Pullman-08-09 and CF-08-09. The
ranking of site-years by decreasing temperature lower in the soil profile correlates to the ranking
of site-years by decreasing plant survival while the ranking of site-years based on minimum
ambient and soil surface temperatures do not (Figures 2 – 4).
Tests for frost resistance are conducted on stem and leaf plant tissue measuring chemical
and/or physical responses to freezing temperatures. Arbaoui and Link (2008) exposed hardened
potted plants grown in a controlled environment to natural sub-zero temperatures. Herzog (1987)
exposed leaf samples taken from potted plants grown under controlled conditions to controlled
freezing temperatures. Herzog (1989) exposed leaf samples taken from the field to controlled

21
freezing temperatures. Arbaoui et al. (2008) cites freezing injury of leaves due to direct exposure
to freezing and low non-freezing temperatures and subsequent retardation in crop development
as rationale for using leaves to test plant frost resistance. Roots of overwintering plants can also
be subjected to below freezing temperatures and are much more sensitive to cold than above
ground leaf tissue (Chen et al., 1983). Chen et al. (1983) found that while frost resistance in
above ground tissue changed with hardening for winter rye and wheat, frost resistance in roots
stayed the same. The results of the present field trial suggest that cold and frost resistance in
roots and whole plant response to cold temperatures may offer additional insight into winter-
hardiness. There may also be implications for using potted plants in controlled experiments on
frost resistance as soil temperatures would not be buffered as they would a field situation.
Plant survival for Pullman 09-10 was 0% (Figure 1). Low soil temperatures were
present, but soil moisture may have also played a role in total plant loss for this site-year. Soil
moisture as measured by volumetric water content was much higher than the other three site-
years during the winter months (Figure 5). The coldest temperatures occur between Dec 1 and
Jan 15. Pictures taken on Feb 4, 2010, show limited plant survival in the form of new shoot
growth suggesting that the winter temperature regime for that site-year was not the root cause for
total plant loss (Figure 7). Soil moisture stayed high throughout the month of February and into
March. Field conditions at this moisture level show saturated field conditions with evidence of
field erosion (Figure 6). It is possible that plants survived cold temperatures in December, but
could not tolerate the long durations of water-logging in the months of January and February
(Figure 5). The problem of excessive moisture for overwintering faba bean is common to
Northern Europe (Lopez-Bellido, 2005).

22
Central Ferry is irrigated therefore both site-years planted at the Central Ferry location
avoided moisture related stresses. Pullman 08-09 had soil moistures much lower than Central
Ferry 09-10 most of the growing season but had a higher rate of plant survival indicating that
drought was not the most limiting factor for plant survival or yield. Drought conditions may have
contributed to increased freezing resistance. Herzog (1987) found low soil moisture can increase
freezing resistance in leaves. Badaruddin and Meyer, (2001) found that the relationship between
soil moisture and freezing resistance was dependant on soil type. For clay soils, plant survival
was higher at 1/3 field capacity while for loam soil plant survival higher at field capacity.
Including a variety of landscape positions in future trials could provide more insight as to how
soil moisture contributes to winter-hardiness. Due to steep terrain in the Palouse region, there are
differences in soil moisture across the landscapes that become relevant for management
decisions.
Winter-hardy genotypes were identified as those that survived Pullman 08-09 and/or CF
09-10 with survival quantified by the percentage of plants harvested out of the number of seeds
planted. Thirty-four out of the 43 genotypes obtained from the NPGS for this evaluation showed
some survival in one or both site-years with 23 showing survival in Pullman-08-09 alone (figure
7C), two showing survival in CF-09-10 alone (figure 7D) and nine showing survival in both
(Figure 7B). Genotypes obtained from W. Link and PI 430725 from the NPGS were not included
for Pullman 08-09 because seed was not available at the time of planting. With the exception of
one, Bulldog/1, all cultivars and breeding lines from W. Link showed survival for CF 09-10
many of which had significantly higher survival than those from the NPGS (figure 7A).
Winter-hardy genotypes could be distinguished further by those that showed plant
survival significantly greater than zero in either of the Pullman 08-09 and CF 09-10 site-years

23
(figure 8). Those originating from Bulgaria proved to be more winter-hardy than others obtained
from the NPGS. The genotype with the highest ranking plant survival for Pullman 08-09 was
Bulgarian W612024 with no statistical differences found between it and other Bulgarian
genotypes, W6 12023, W6 12025, W6 12026, W6 12027, and W6 12028. All genotypes except
W6 12026 had some survival for CF 09-10. Three of the six Bulgarian genotypes had survival
significantly greater than zero in both environments (Fig 8B).
Six out of the 12 genotypes obtained from W. Link showed plant survival
significantly higher than zero for CF 09-10 (figure 8a). Go-wibo-pop proved to be the most
winter-hardy with the percentage of plant survival significantly higher than all other
genotypes. Bulldog 1-4 and PI 430725 did not survive Central Ferry 09-10, but should be
included in future trials for Pullman to fully assess winter-hardiness. Overall CF 09-10 was
a harsher growing environment than Pullman 08-09, but plant performance for CF 09-10 is
not a good indicator for plant performance for Pullman 08-09. Bulgarian W612026 and
Chinese PI 577721also did not survive CF-09-10, but were among the most winter-hardy
for Pullman 08-09.
Genotypes identified with high yield potential were those that showed significant yield
for Pullman 08-09 and/or CF 09-10 (Figure 9). With the exception of one, all genotypes with
high yield potentials also showed superior winter-hardiness. The reverse was not true. Three out
of the 16 genotypes showing superior winter-hardiness were not identified with high yield
potential. Wibo/1 had a significant yield, but was not identified with superior winter-hardiness.
Cultivars and breeding lines from W. Link were not planted for Pullman 08-09 and
therefore could not be fully evaluated for yield potential. Some genotypes had yields
significantly higher than zero for CF 09-10 and therefore can be considered high yielding while
24
others did not. One breeding line, Bulldog/1 had no yield for CF 09-10 due to its lack for
survival. As with winter-hardiness, from our data we cannot predict how these cultivars and
breeding lines would have performed if planted for Pullman 08-09. Table 4 shows 14 genotypes
identified with superior winter-hardiness and potential to be high yielding along with genotypes
that need to undergo further evaluation for winter-hardiness and yield potential.
Nine out of the 14 genotypes that showed both superior winter-hardiness and high yield
potential were among the highest yielding for the milder environment of CF-08-09 with seed
yields not significantly different from the top yielding genotype. There are three genotypes
within the highest yielding for CF-08-09 were neither winter-hardy or high yielding.The
genotype showing the highest yield for CF 08-09 did not show winter-hardiness or seed yield
potential that was statistically different from zero for Pullman 08-09 and did not survive CF-09-
10.The seed yield is based on a single replicate, Rep1, due to the loss of whole plot plant yield
data. Sample seed weights for Rep1 and Rep2 were 79.86 and 41.3 respectively. It is probable
that the reported seed yield is exaggerated from a representative mean. The other two genotypes,
Bulldog/1-4 and Clipper, were not tested for the Pullman-08-09 site-year.
Freezing temperatures for CF-08-09 were suitable for differentiating frost resistance
among genotypes. Leaf-tissue damage ranged from little or none to severe. No significant
correlation was found between frost resistance and winter-hardiness for the CF-08-09 site-year;
however, a significant correlation between frost resistance and seed yield suggests that the
temperature regime was harsh enough play a role in growth set-backs that affect yield (Table 5).
Highly significant correlations to frost resistance were found for both plant survival and
seed yield for Pullman-08-09 and CF-09-10 (Table 5). Frost resistance was not assessed for the
Pullman-08-09 and CF-09-10 site-years. Herzog (1989b) found that frost resistance in faba bean
25
does vary between environments, but ranking by genotype remains roughly the same. Freezing
resistance appeared to differ between site years with greater leaf damage occurring for CF-09-10
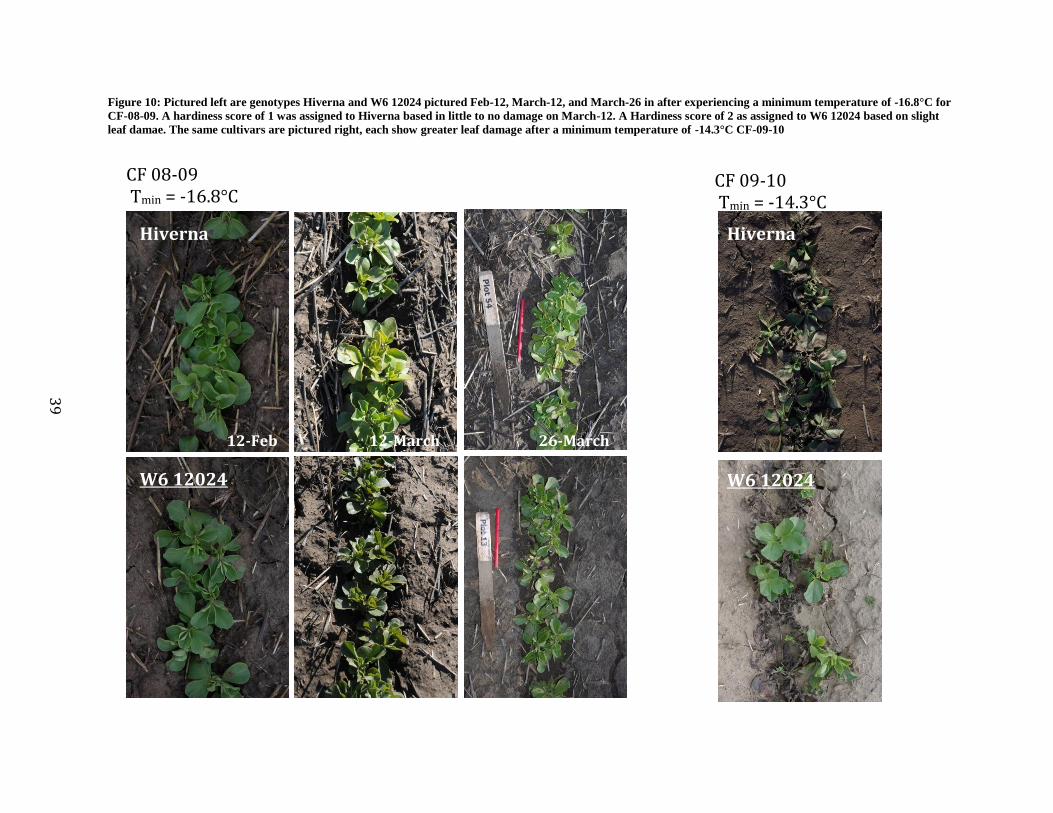
(Tmin -14.3°C) than for CF-08-09 (Tmin -16.8°C) (figure 10). This is consistent with Herzog
(1988) who found maximum freezing resistance varied between -12°C and -15°C for different
years when testing field-grown faba beans in Germany. Further investigation showed that the
plant growth stage during hardening had an effect on maximum frost resistance that could be
attained. Leaves that developed during hardening showed greater maximum frost resistance with
whole-plant characteristics being more correlated to frost resistance in the first leaf (Herzog,
1988). Frost resistance increased with a shorter time for pre-hardening conditions (Herzog,
1989b). Planting in 08-09 for Pullman and CF occurred 2 and 3 weeks later than in 09-10. It is
possible the later planting date induced a greater frost tolerance for the 08-09 site-years.
The low R2 value for CF-09-10 indicates that winter-hardiness involves resistance to
multiple stresses beyond frost resistance. Go-wibo-pop had a seed yield significantly higher than
all other genotypes for CF-09-10 yet a moderate frost tolerance score of 2.5. Field trials
conducted in Gottingen, Germany identified Bulldog/1 as having superior winter-hardiness along
with genotype Hiverna (included in this study), but artificial and natural frost tests showed it had
low frost resistance (Arbaoui et al., 2008).
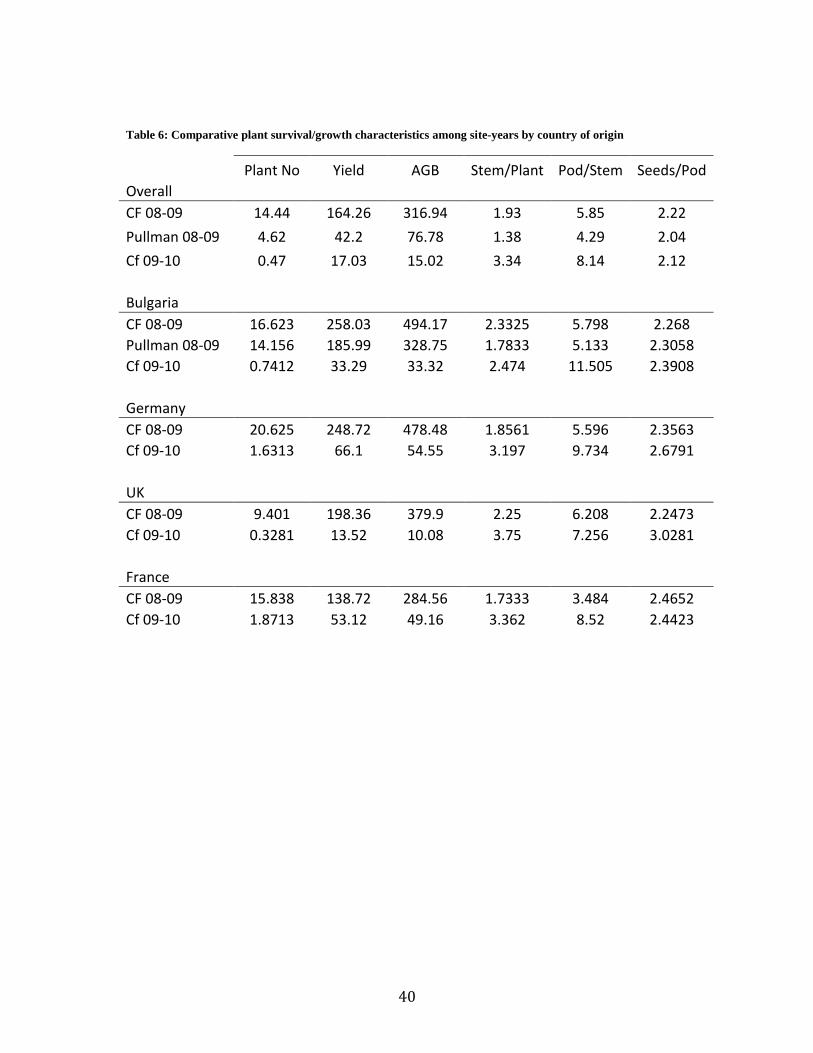
Yield components of genotypes averaged over site-years showed differences in stems per
plant and pods per stem for CF-09-10 (Table 7). These two yield components play a major role
in compensatory response to decreased plant density (Lopez-Bellido, 2005). The seeding rate for
CF-09-10 was half that of CF-08-09 and Pullman 08-09. Turk and Tawaha (2002) investigated
the response of autumn-sown faba bean variety „Minor‟ to seeding rate and found increases in
both the number of stems per plant and the number of pods per stem with decreased seeding rate,
26
but this was in an environment that did not include temperatures below zero. In environments
that include sub-freezing temperatures, plant density and tiller number are also influenced by
winter kill and tissue injury. Herzog and Geisler (1991) found with seeding rates averaging 30
plants m-2
, plant densities ranged from 8 to 28 plants m-2
largely due to winter kill.
The average number of seeds per pod was not different among site years, which is
consistent with past findings that the number of seeds per pod is dependent on genotype, but
relatively stable ranging from about two to eight (Knott, 1990). Herzog and Geisler (1991) found
the same to be true in harsh, sub-freezing climates.
Conclusion
The Pullman and Central Ferry locations proved useful in evaluating fall planted faba
beans over a range of environments. Sixteen genotypes were identified as showing superior
winter-hardiness and 13 of those also showed significant yield. Six of the thirteen winter-hardy,
higher yielding genotypes were those cultivars and breeding lines previously identified as winter-
hardy in European trials originating from UK, France and Germany. The other seven were from
the NPGS with all but one genotype originating from Bulgaria. Full field trials are needed to
fully evaluate yield potential.
Low ambient and soil temperatures appear to be limiting to plant survival and yield.
Ambient temperatures are often used to communicate winter severity and to evaluate cold/frost
resistance in above ground plant tissue. This research suggests that soil temperature may play a
role in plant survival that is independent of ambient temperature and should be monitored to
better understand environmental factors that impact winter-hardiness. Root tissue should be
included in evaluations for cold/frost resistance.

27
The next step in this research should be additional field trials that vary planting density,
seeding date, and landscape position to better understand these variables in faba bean production
in a cool Mediterranean environment with limited rainfall. Sampling and plot size should be
increased to account for variability within each genotype.

28
Table 1: Genotypes for this study were obtained from the National Plant Germplasm System (NPGS). Cultivars and
breeding lines identified as winter-hardy were sent from Professor W. Link, Department of Crop Sciences, Georg-
August University, Germany.
*was not planted CF-09-10
**was not planted Pullman-08-09
Genotypes obtained from NPGS Genotypes obtained from NPGS cont.
Genotype Country of Origin Genotype Country of Origin
PI221516 Afghanistan PI577744 China PI221517 Afghanistan PI577745 China PI222128 Afghanistan PI577746* China PI222129 Afghanistan PI577747 China PI222216 Afghanistan PI577748 China PI223302 Afghanistan PI577749 China PI223303 Afghanistan W612023 Bulgaria PI223304 Afghanistan W612024 Bulgaria PI254005 Afghanistan W612025 Bulgaria PI254006 Afghanistan W612026 Bulgaria PI268477 Afghanistan W612027 Bulgaria PI284344* Afghanistan W612028 Bulgaria PI306699 Poland PI317499 Afghanistan PI317500 Afghanistan PI343831 Afghanistan PI415056 Nepal
PI415057 Nepal Genotypes obtained from W. Link
PI415058 China Genotype Country of Origin
PI415059 China Bulldog/1-4 Germany PI415060 China Clipper UK PI415061 China Cote d'Or/2-3 France PI430725** Hungary Go-Wibo-Pop Germany PI430726 Hungary Hiverna Germany PI458603 Finland Hiverna/2-5EP1 Germany PI458604 Finland I3 Diva Germany PI499959 China I3 Karl/2-3 France PI577721 China Irena France PI577722 China Scout Germany PI577740 Nepal Striker UK PI577741 Nepal Wibo/1 Germany
29
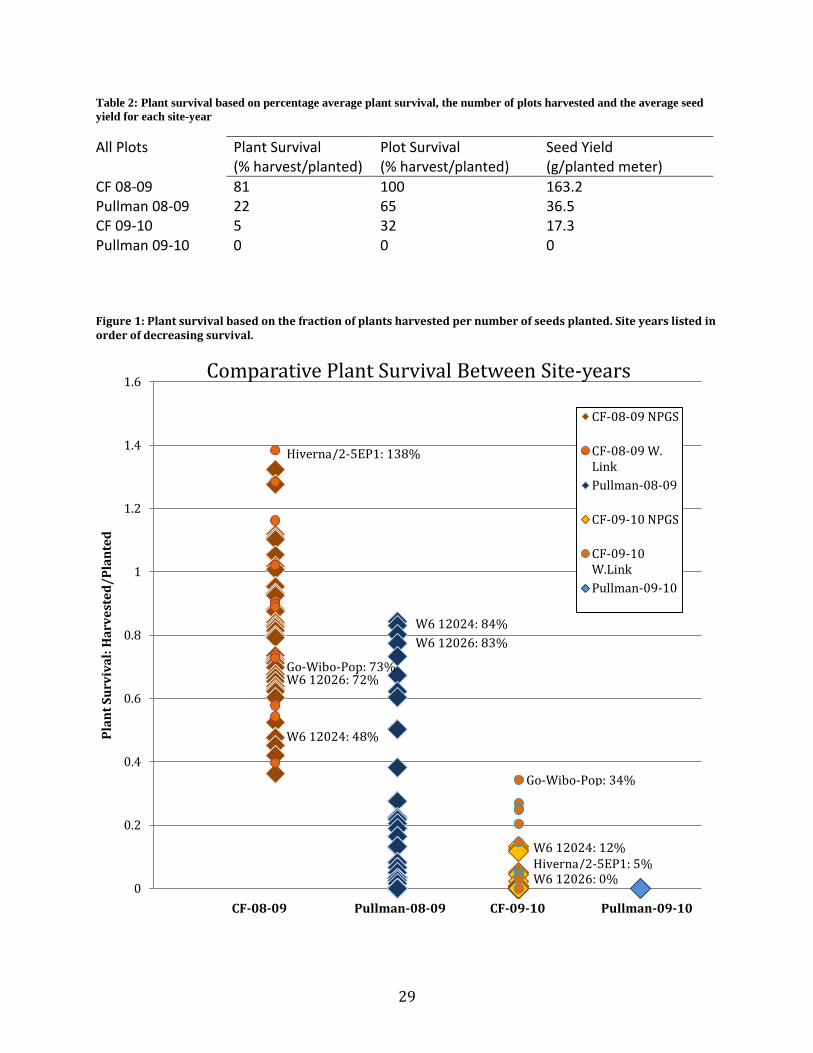
Figure 1: Plant survival based on the fraction of plants harvested per number of seeds planted. Site years listed in order of decreasing survival.
0
0.2
0.4
0.6
0.8
1
1.2
1.4
1.6
Pla
nt
Su
rviv
al:
Ha
rve
ste
d/
Pla
nte
d
CF-08-09 Pullman-08-09 CF-09-10 Pullman-09-10
Comparative Plant Survival Between Site-years
CF-08-09 NPGS
CF-08-09 W. Link
Pullman-08-09
CF-09-10 NPGS
CF-09-10 W.Link
Pullman-09-10
Table 2: Plant survival based on percentage average plant survival, the number of plots harvested and the average seed
yield for each site-year
All Plots Plant Survival (% harvest/planted)
Plot Survival (% harvest/planted)
Seed Yield (g/planted meter)
CF 08-09 81 100 163.2 Pullman 08-09 22 65 36.5 CF 09-10 5 32 17.3 Pullman 09-10 0 0 0
Hiverna/2-5EP1: 5% W6 12026: 0%
W6 12024: 12%
Go-Wibo-Pop: 34%
W6 12024: 84%
W6 12026: 83%
Hiverna/2-5EP1: 138%
W6 12026: 72%
W6 12024: 48%
Go-Wibo-Pop: 73%

30
Table 3: Comparative exposure to sub-freezing temperatures between site-years in terms of duration and absolute
minimum.
CF 08-09 Pullman 08-09 CF 09-10 Pullman 09-10
Minimum Daily Temperature
Ambient air -16.8 -22.2 -14.3 -18.9 Soil 0cm -9.7 -14.6 -11.9 -14 Soil 15cm -0.02 -3.3 -3.7 -7.7
Exposure to harsh frost conditions (temp < -10°C)
Consecutive nights 5 11 5 5 Number of frost periods
3 5 1 5
Duration of exposure to freezing temperatures
Days below 0˚C 19 29 13 16 Consecutive days < 0˚C 10 14 7 11
31
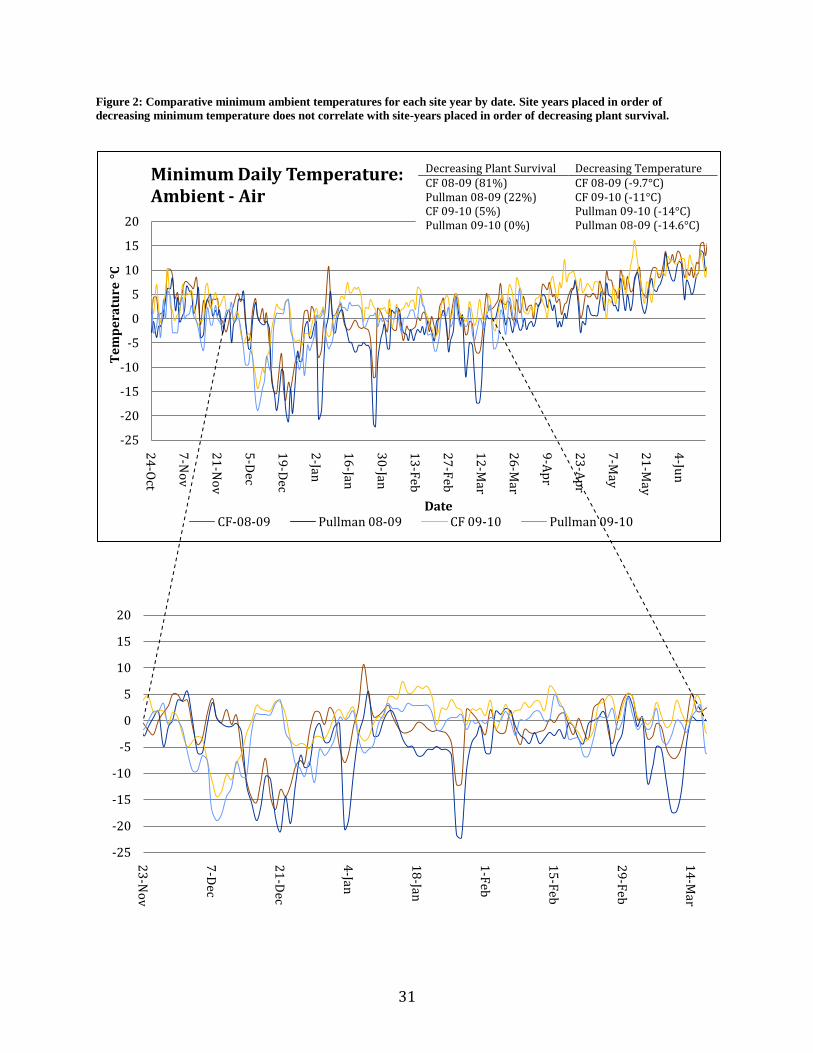
Figure 2: Comparative minimum ambient temperatures for each site year by date. Site years placed in order of
decreasing minimum temperature does not correlate with site-years placed in order of decreasing plant survival.
-25
-20
-15
-10
-5
0
5
10
15
20
23
-No
v
7-D
ec
21
-Dec
4-Jan
18
-Jan
1-F
eb
15
-Feb
29
-Feb
14
-Mar
-25
-20
-15
-10
-5
0
5
10
15
20
24
-Oct
7-N
ov
21
-No
v
5-D
ec
19
-Dec
2-Jan
16
-Jan
30
-Jan
13
-Feb
27
-Feb
12
-Mar
26
-Mar
9-A
pr
23
-Ap
r
7-M
ay
21
-May
4-Ju
n
Te
mp
era
ture
°C
Date
Minimum Daily Temperature:Ambient - Air
CF-08-09 Pullman 08-09 CF 09-10 Pullman 09-10
Decreasing Plant Survival Decreasing Temperature CF 08-09 (81%) CF 08-09 (-9.7°C) Pullman 08-09 (22%) CF 09-10 (-11°C) CF 09-10 (5%) Pullman 09-10 (-14°C) Pullman 09-10 (0%) Pullman 08-09 (-14.6°C)
32
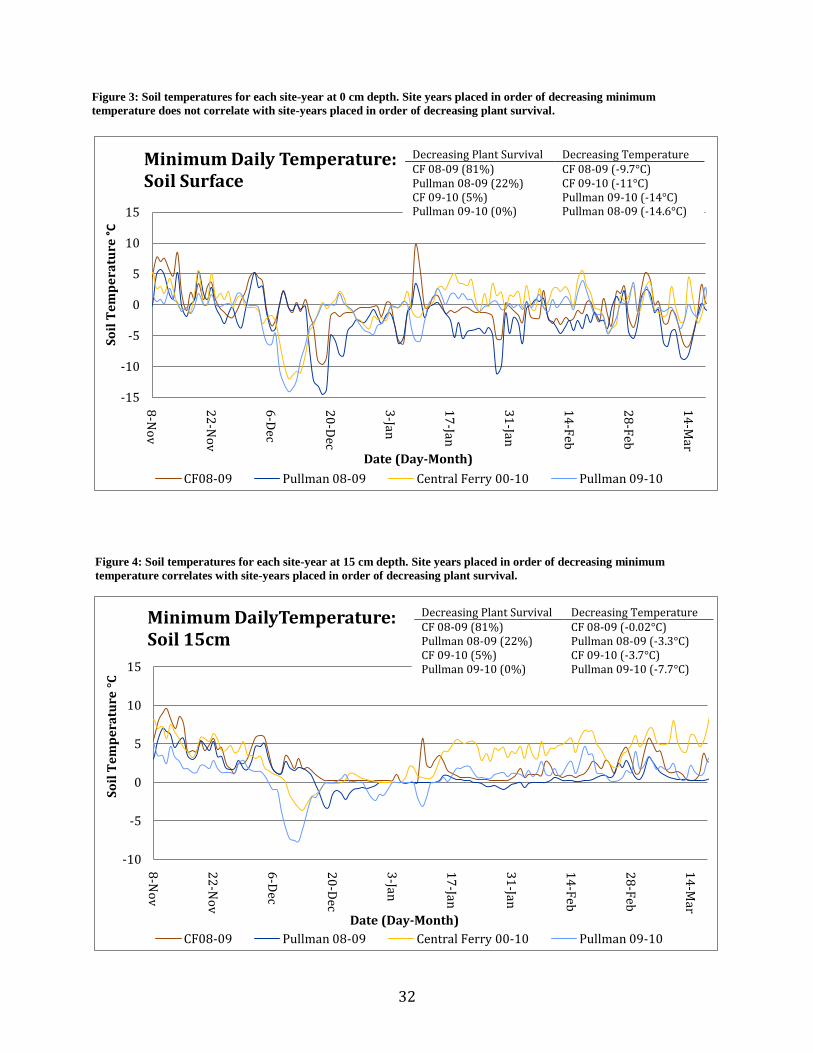
Figure 3: Soil temperatures for each site-year at 0 cm depth. Site years placed in order of decreasing minimum
temperature does not correlate with site-years placed in order of decreasing plant survival.
Figure 4: Soil temperatures for each site-year at 15 cm depth. Site years placed in order of decreasing minimum
temperature correlates with site-years placed in order of decreasing plant survival.
-15
-10
-5
0
5
10
15
8-N
ov
22
-No
v
6-D
ec
20
-Dec
3-Jan
17
-Jan
31
-Jan
14
-Feb
28
-Feb
14
-Mar
So
il T
em
pe
ratu
re °
C
Date (Day-Month)
Minimum Daily Temperature: Soil Surface
CF08-09 Pullman 08-09 Central Ferry 00-10 Pullman 09-10
-10
-5
0
5
10
158
-No
v
22
-No
v
6-D
ec
20
-Dec
3-Jan
17
-Jan
31
-Jan
14
-Feb
28
-Feb
14
-Mar
So
il T
em
pe
ratu
re °
C
Date (Day-Month)
Minimum DailyTemperature: Soil 15cm
CF08-09 Pullman 08-09 Central Ferry 00-10 Pullman 09-10
Decreasing Plant Survival Decreasing Temperature CF 08-09 (81%) CF 08-09 (-9.7°C) Pullman 08-09 (22%) CF 09-10 (-11°C) CF 09-10 (5%) Pullman 09-10 (-14°C) Pullman 09-10 (0%) Pullman 08-09 (-14.6°C)
Decreasing Plant Survival Decreasing Temperature CF 08-09 (81%) CF 08-09 (-0.02°C) Pullman 08-09 (22%) Pullman 08-09 (-3.3°C) CF 09-10 (5%) CF 09-10 (-3.7°C) Pullman 09-10 (0%) Pullman 09-10 (-7.7°C)

33
0
0.05
0.1
0.15
0.2
0.25
0.3
0.35
0.4
0.45
24
-Oct
7-N
ov
21
-No
v
5-D
ec
19
-Dec
2-Jan
16
-Jan
30
-Jan
13
-Feb
27
-Feb
13
-Mar
27
-Mar
10
-Ap
r
24
-Ap
r
8-M
ay
22
-May
5-Ju
nV
olu
me
tric
Wa
ter
Co
nte
nt
m3
/m
3
Date (Day-Month)_
Average Soil Moisture 15cm
Central Ferry 08-09 Pullman 08-09 Central Ferry 09-10 Pullman 09-10
Figure 5: Average soil moisture for each site-year.
Figure 6: Pictures taken 4-Feb 2010 for Pullman 09-10 show saturated field conditions and sever erosion through the
plots. Few plots showed survival with new shoots.

34
0 0.5 1 1.5
PI 458604
PI 317500
PI 222216
PI 284344
PI 577749
PI 415059
PI 317499
PI 223304
PI 306699
PI 223303
PI 577745
PI 343831
PI 268477
PI 577746
PI 577740
PI 577747
PI 415057
PI 415056
PI 415060
PI 577741
PI 577744
PI 415061
PI 415058
PI 577721
W6 12026
PI 577748
PI 577722
PI 430726
W6 12023
PI 254006
W6 12027
W6 12024
W6 12025
W6 12028
PI 430725
Bulldog/1-4
Clipper
Striker
Irena
Hiverna/2-5EP1
Wibo/1
Hiverna
Scout
I3 Karl/2-3
I3 Diva
Cote d'Or/2-3
Go-Wibo-Pop
Plant Survival (harvested/planted)
Ge
no
typ
es
Ide
nti
fie
d a
s W
inte
r-h
ard
y
Winter-hardy: Comparative Plant Survival
CF 08-09
CF 09-10
Pullman 08-09
Figure 7A: Genotypes not planted for Pullman 08-09 listed in order of decreasing survival for CF-09-10; Figure 7B:
Genotypes that survived all three site-years listed in order of decreasing survival for CF-09-10; Figure 7C: Genotypes
that survived Pullman 08-09 but did not survive CF 09-10 listed in order of decreasing survival for Pullman 08-09; Figure
7D: Genotypes that survived CF 09-10 but did not survive Pullman 08-09 listed in order of decreasing survival for CF 09-
10
Fig 7A
Fig 7B
Fig 7C
Fig 7D
LSD (harvested/planted)
CF 08-09: 0.12
Pullman 08-09: 0.072
CF 09-10: 0.01

35
Figure 8: Genotypes identified as showing superior winter-hardiness. Fig 8A lists those with plant survival significantly
greater than zero for CF 09-10. These genotypes were not evaluated for Pullman 008-09; Fig 8B lists those with plant
survival significantly greater than zero for both Pullman 08-09 and CF 09-10. Fig 8C lists those with plant survival
significantly greater than zero for Pullman 08-09 only.
BCDE
ABCD
ABC
AB
AB
A
A
A
ABC
A
H
H
H
H
H
H
H
FG
F
F
EF
DE
BCD
BC
BC
A
0 0.2 0.4 0.6 0.8 1 1.2 1.4
PI 430726
W6 12023
PI 415061
W6 12027
PI 415058
PI 577721
W6 12026
W6 12024
W6 12025
W6 12028
Hiverna
Scout
I3 Karl/2-3
I3 Diva
Cote d'Or/2-3
Go-Wibo-Pop
Plant Survival (harvested/planted)
Ge
no
typ
s
Winter-hardy Genotypes
CF-09-10
Pullman-08-09
CF-08-09

36
Figure 9: Genotypes identified as showing superior yield.
A
CD
A
BC
A
B
B
H
GH
GH
FGH
DEFG
CD
CD
DEFG
DEF
DEF
CD
BC
B
A
0 150 300 450
W6 12026
PI 430726
W6 12027
W6 12023
W6 12028
W6 12025
W6 12024
Wibo/1
Hiverna
Cote d'Or/2-3
I3 Diva
I3 Karl/2-3
Scout
Go-Wibo-Pop
Seed Yield (g /planted m)
Ge
no
typ
es
High Yielding Potential
CF 09-10
Pullman 08-09
CF 08-09
Fig 11A
Fig 11B
Fig 11C
LSD (g)
CF 08-09: 85.6
Pullman 08-09: 54.7
CF 09-10: 37.1

37
Table 4: Genotypes identified with superior winter-hardiness and high yield potential based on plant survival and yield
for Pullman 08-09 and/or CF 09-10. Genotypes showing superior winter-hardiness that did not show high yield potential
for CF 09-10 but were not evaluated For Pullman 08-09, are also listed.
* Wibo/1 was not identified with superior winter-hardiness, but did have significant yield for CF 09-10.
Genotypes identified with superior winter-hardiness and high yield potential
-----------------Seed Yield (g m-1)-----------------
Genotype CF 08-09 Pullman 08-09 CF 09-10
PI 430726 175.74 65.04 6.18 W6 12023 242.43 115.34 21.11 W6 12024 253.44 126.76 69.61 W6 12025 200.91 135.81 60.8 W6 12026 304.44 241.54 0 W6 12027 293.21 243.18 8.59 W6 12028 251.45 253.31 39.63 Cote d'Or/2-3 75.16 Not planted 53.05 Go-Wibo-Pop 282.18 Not planted 163.01 Hiverna 281.79 Not planted 52.8 I3 Diva 245.98 Not planted 66.92 I3 Karl/2-3 217.65 Not planted 93.58 Scout 208.34 Not planted 115.54
Genotypes with winter-hardiness and yield potential pending further evaluation
-----------------Seed Yield (g m-1)-----------------
Genotype CF 08-09 Pullman 08-09 CF 09-10
PI 430725 178.16 Not planted . Bulldog/1-4 268.2 Not planted . Clipper 253.23 Not planted 10.21 Hiverna/2-5EP1 207.34 Not planted 23.64 Irena 123.36 Not planted 12.71 Striker 143.49 Not planted 16.82 Webo/1* 247.19 Not planted 39.63

38
Table 5: Regression analysis between frost resistance scores and plant survival/growth characteristics.
Mean R2 P <
Hardiness (harvested/ planted)
CF 08-09 0.81 0.01 0.36
Pullman 08-09 0.22 0.42 0.0001
CF 09-10 0.05 0.21 0.0001
Yield (g·planted m-1)
CF 08-09 161.41 0.19 0.0001
Pullman 08-09 37.79 0.45 0.0001
CF 09-10 17.26 0.16 0.0001
AGB (g·planted m-1)
CF 08-09 309.34 0.29 0.0001
Pullman 08-09 68.66 0.46 0.0001
CF 09-10 15.17 0.15 0.0001
Stem/Plant
CF 08-09 1.96 0.05 0.0001
Pullman 08-09 1.48 0.15 0.0001
CF 09-10 3.02 0 0.8
Pod/Stem
CF 08-09 5.3 0.06 0.0001
Pullman 08-09 3.74 0 0.89
CF 09-10 9.47 0 0.95
39
Figure 10: Pictured left are genotypes Hiverna and W6 12024 pictured Feb-12, March-12, and March-26 in after experiencing a minimum temperature of -16.8°C for
CF-08-09. A hardiness score of 1 was assigned to Hiverna based in little to no damage on March-12. A Hardiness score of 2 as assigned to W6 12024 based on slight
leaf damae. The same cultivars are pictured right, each show greater leaf damage after a minimum temperature of -14.3°C CF-09-10
CF 08-09 Tmin = -16.8°C
CF 09-10 Tmin = -14.3°C
Hiverna
W6 12024
12-Feb 12-March 26-March
Hiverna
W6 12024
40
Table 6: Comparative plant survival/growth characteristics among site-years by country of origin
Plant No Yield AGB Stem/Plant Pod/Stem Seeds/Pod
Overall CF 08-09 14.44 164.26 316.94 1.93 5.85 2.22
Pullman 08-09 4.62 42.2 76.78 1.38 4.29 2.04
Cf 09-10 0.47 17.03 15.02 3.34 8.14 2.12
Bulgaria CF 08-09 16.623 258.03 494.17 2.3325 5.798 2.268
Pullman 08-09 14.156 185.99 328.75 1.7833 5.133 2.3058
Cf 09-10 0.7412 33.29 33.32 2.474 11.505 2.3908
Germany CF 08-09 20.625 248.72 478.48 1.8561 5.596 2.3563
Cf 09-10 1.6313 66.1 54.55 3.197 9.734 2.6791
UK CF 08-09 9.401 198.36 379.9 2.25 6.208 2.2473
Cf 09-10 0.3281 13.52 10.08 3.75 7.256 3.0281
France CF 08-09 15.838 138.72 284.56 1.7333 3.484 2.4652
Cf 09-10 1.8713 53.12 49.16 3.362 8.52 2.4423
41
References
Annicchiarico, P. and A. Iannucci. 2007. Winter survival of pea, faba bean and white
lupin cultivars in contrasting Italian locations and sowing times, and implications for
selection. J. Agric. Sci. 145: 611 – 622.
Arbaoui, M., C. Balko and W. Link. 2008. Study of faba bean (Vicia faba L.) winter-
hardiness and development of screening methods. Field Crops Res. 106: 60 – 67.
Badaruddin, M. and D.W. Meyer. 2001. Factors modifying frost tolerance of legume
species. Crop Sci. 41: 1911 – 1916.
Bond, D.A., D.A. Lawes, G.C. Hawtin, M.C. Saxena and J.H. Stephens. 1985. Faba bean
(Vicia faba L.) p. 199 – 265. In R.J. Summerfield and E.H. Roberts (ed.) Grain Legume
Crops. Collins Professional and Technical Books. London, England.
Chen, T.H., L.V. Gusta, and D.B. Fowler. 1983. Freezing injury and root development in
winter cereals. Plant Physiol. 73: 773 – 777.
Duc, G. 1997. Faba bean (Vicia faba L.). Field Crops Res. 53: 99 – 109.
Herzog, H. 1997. Freezing resistance and development of faba beans as affected by
ambient temperature, soil moisture and variety. J. Agron. Crop Sci. 159: 90 – 100.
Herzog, H. 1988. Winter hardiness in faba beans: varietal differences and interrelations
among selection criteria. Plant Breed. 101: 269 – 276.
Herzog, H. 1989a. Freezing resistance and performance of faba bean populations during
winter seasons in northern Germany. J. Agron. Crop Sci. 162: 225 – 235.
Herzog, H. 1989b. Influence on pre-hardening duration and dehardening temperatures on
vaietal freezing resistance in faba beans (Vicia faba L.). Agronomie 9: 55 – 61.
Herzog, H. and G. Geisler. 1991. Yield structure of winter faba bean grown in northern
Germany in dependence of different environments, seed rates, sowing rates and genotyps.
J. Agron. Crop Sci. 167: 145 – 154.
Jensen, E.S. and H. Hauggaard-Nielsen. 2003. How can increased use of biological N2
fixation in agriculture benefit the environment? Plant Soil 252: 177 – 186.
Knott, M.C. 1990. A key for stages of development of the faba bean (Vicia faba). Ann.
Appl. Biol. 116: 391 – 404.
Link, W., C. Balko, F.L. Stoddard. 2010. Winter hardiness in faba bean: Physiology and
breeding. Field Crops Res. 115: 287 – 296.
Lopez-Bellido, F.J., L. Lopez-Bellido, and R.J. Lopez-Bellido. 2005. Competition,
growth, and yield of faba bean (Vicia faba L.). Europ. J. Agron. 23: 359 – 378.
42
Peoples, M.B., J. Brockwell, D.F. Herridge, I.J. Rochester, B.J.R. Alves, S. Urquiaga, R.
M. Boddey, F.D. Dakora, S. Bhattarai, S.L. Maskey, C. Sampet, B. Rerkasem, D.F.
Khan, H. Hauggaard-Nielsen, and E.S. Jensen. 2009. The contributions of nitrogen-fixing
crop legumes to the productivity of agricultural systems. Symbiosis. 48: 1 – 17.
Picard, J., G. Duc, and R. Pelletier. 1985. “Cote d‟Or”, a highly frost resistant population
of Vicia faba. Fabis Newslett 13:11-12.
Stoddard, F.L., C. Balko, W. Erskine, H.R. Khan, W. Link and A. Sarker. 2006.
Screening techniques and sources of resistance to abiotic stresses in cool-season food
legumes. Euphytica 147: 167 – 186.
Turk, M.A. and Abdel-Rahman M. Tawaha. 2002. Impact of seeding rate, seeding date,
rate and method of phosphorus application in faba bean (Vicia faba L. Minor) in the
absence of moisture stress. Biotechnol. Agron. Soc. Environ. 6(3): 171 – 178.

43
CHAPTER THREE
Nodulation Response to Available Soil Nitrate in Faba Bean and Pea
Introduction
Legumes are often included as a rotation crop for a N benefit. Biological nitrogen
fixation (BNF), the process by which N from the air is converted to a plant usable form,
is the result of a symbiotic relationship between legumes and soil bacteria of the genus
Rhizobium. Nodules develop on the roots that house the fixation process and will appear
pink when active due to the presence of leghaemoglobin (Roughley et al., 1983). In
addition to N derived from the atmosphere (Ndfa), legumes utilize N from a combination
of sources that can also include residual soil N and added fertilizer N (Salvagiotti, 2008).
The extent to which they rely on Ndfa and therefore the extent of the N benefit is
dependent on species, climate, and management practices (Roughley et al., 1983). Soil N
has a negative impact on N2 fixation, i.e. fertilizer N or residual N can inhibit nodulation
and N2 fixation (Streeter, 1988).
Faba bean (Vicia Faba L.) is known to have a high capacity for N fixation when
compared to other grain legumes. The percentage of N derived from air (%Ndfa) in faba
bean is generally reported to be higher than other legumes. Herridge and Peoples (2008)
found that reported %Ndfa of fababean averaged 75% while chickpea (Cicer arietinum),
lentil (Lens culinaris) and pea (Pisum sativum) averaged 68%. Rennie and Dubetz (1986)
compared N fixation in cool season grain legumes and found faba bean had 85% Ndfa
while chickpea, lentil, and pea had 82, 67, and 79 %Ndfa respecitively.
It has been suggested that a contributing factor to higher N fixation by faba bean
is a greater tolerance to soil N by the faba-rhizobium symbiosis. In a field experiment,

44
Schwenke et al. (1998) found the negative effects of soil nitrate on N fixation were
greater for chickpea than faba bean. At soil nitrate levels of 65 kg∙ha-1
, faba bean
maintained 48% Ndfa while chickpea had only 24% Ndfa. Turpin et al. (2002) found
similar results whereby at a soil nitrate levels of 78 kgN/ha faba bean maintained 45%
Ndfa while chickpea maintain only 12% Ndfa.
Chalifour and Nelson (1987) used a controlled experiment to compare the N
fixation response of the legume-rhizobium symbiosis of faba bean and pea to increasing
rates of nitrate - N. While the %Ndfa decreased for both species, the suppression of N2
fixation with increasing nitrate was much larger for pea. The highest nitrate treatment, 15
mol·m-3
, resulted in zero Ndfa for pea while faba bean maintained 15.4% Ndfa. Further
investigation showed that nitrate present at planting had a much larger impact on N
fixation in pea than later applications. This was not the case for faba bean leading to the
conclusion that the tolerance of the faba bean –rhizobium symbiosis to soil nitrate must
be due in large part to its ability to form effective nodules in the presence of high
combined N (Chalifour and Nelson, 1988).
Inorganic soil N affects nodules over multiple stages of the legume-rhizobial
symbiosis including nodulation, nodule growth, and N2 fixation activity (Streeter, 1998).
The extent to which each stage is affected is dependent on both N form and
concentration. At lower levels, NH4 is less inhibitory to the legume-rhizobia symbiosis
than NO3 and can even have a stimulating effect on nodulation (Steeter, 1988; Gulden
and Vessey, 2006). When both forms of mineral N are present, the effects of nitrate are
dominant (Bollman and Vessey, 2006). Nodulation is less sensitive to available soil
nitrate than nodule growth or N fixation (Streeter, 1988). Cassman (1980) found that N
45
concentration of 5 mM combined N had no impact on nodule number, but the nodules
were much smaller and lacking in visible leghaemoglobin (Cassman, 1980).
Nodule growth and fixation activity depressed by the presence of excess mineral
N will recover with the decrease in available soil nitrate. Fujikake et al. (2002) exposed
soybean plants to a 5mM nitrate solution resulting in decreased nodule size and fixation
activity. Both nodule growth and fixation activity recovered when transferred to a N free
growing solution without observation of new nodulation. Conversely, infection of root
hairs resulting in nodulation occurs soon after they emerge. Older cells have shown to be
resistant to infection (Bhuvaneswari et al., 1980; Pueppke, 1986; Tricot et al., 1997).
Nitrogen concentrations high enough to inhibit nodulation could be critical to overall N
fixation due to the limited window in root development in which infections will occur.
Hydroponic systems are used for non-destructive observation of root and nodule
development, but studies have shown that growing medium can impact the legume-
rhizobium symbiosis. Pueppke (1986) found changes in number and distribution of
nodules with a greater percentage of nodules found on lateral roots when grown in soil as
opposed to hydroponics. To observe nodulation patterns in the soil growing medium,
plants were removed from growing containers, roots were carefully rinsed, and nodule
infections were located and counted. The same process was carried out for plants in the
hydroponic medium. The soil also influenced the rank order for legume genotype –
rhizobium strain parings with a 95% reduction in nodulation for one of the parings
(Pueppke, 1986). Van Heerden et al. (2007) found that while no difference was observed
in shoot growth using sand, fine vermiculite, course vermiculite, and potting soil mixture,

46
nodulation and N fixation differed. Nodule numbers were higher in sand and potting soil
while fixation activity was higher in vermiculite.
The objectives of this study were to compare the nodulation response of faba bean
(Vicia faba L.) with pea (Pisum sativum), a legume currently used in rotations on the
Palouse, to varying levels of available soil nitrate at planting and evaluate the use of a
high resolution scanner for non-destructive observation of nodulation and nodule growth
in a soil growing medium. A difference in tolerance to soil nitrate in terms of capacity to
fix N could offer farmers more precision and flexibility for rotation decisions made
between and even within farms in the Palouse region.
Materials and Methods
A randomized complete block design with four replicates was used to compare
the effect of nitrate on nodulation and nodule growth between faba bean and pea. Soil
was collected from the Lester and Pat Boyd Farm near Pullman, WA, managed by WSU.
The soil type is a Palouse silt loam (Fine-silty, mixed, superactive, mesic Pachic Ultic
Haploxerolls. The soil was passed through a 19 mm sieve and large organic matter was
removed by hand. Water was added until soil moisture reached approximately 23%. Wet
soil (13.8 kg dry soil equivalent) was weighed for each growing container. Nitrate
treatments were added to the soil and mixed thoroughly by hand followed by the addition
of inoculum, also mixed thoroughly by hand
A range of soil nitrate levels was achieved by adding were prepared by adding 0g,
2.91g, 5.82g, and 8.74g of Ca(NO3)24·H2O to 25ml of distilled water. This equates to
additions of 0, 25, 50, and 75 ppm soil nitrate-N. A peat based inoculum of Rhizobium
leguminosarum (N-dure, INTX Microbials, Kentland, IN) was used to inoculate the soil

47
using 110g for each growing container. With observation possible on only a portion of
the root, soil inoculation was preferred to ensure placement of inoculums didn‟t affect
nodulation patterns. Inoculating the seed results in the majority of nodules being close to
the root crown as rhizobia are limited in their movement through soil (Kyei-Boahen et al.,
2002; Madsen and Alexander, 1982).
Growing containers for in situ high resolution imaging of nodulation and root
growth were assembled according to Hammac et al. (2010). Two Canon® LiDE 600 F
flatbed scanners were placed on each side of a 36 34 23.5cm Rubbermaid ® plastic
containers at a slight angle. Each plastic container houses a single replicate for one nitrate
treatment with pea and faba planted along opposite scanners as the split plot. Treated soil
was added to the container and left overnight to equilibrate before planting.
Soil samples were taken for each container to determine available soil nitrate on
the day of planting. Four soil cores taken down the middle of the containers and
composited for testing. Holes created by removed soil were filled with perlite to aid in
watering. Two plants were seeded across each scanner face. For replications one and two,
two seeds were sown at each position and later thinned to one plant. In replications three
and four, one seed was sown in each position. The surface was covered with perlite to
decrease water loss via soil evaporation.
Plants were grown in a growth chamber under a 14-hour photoperiod with three
sodium vapor and two metal halides, each 400 watts. The temperature control was set at
21°C. Scans were taken daily at a resolution of 1200 dots per inch (dpi) for 35 days.
Above and below ground biomass were separated and weighed. Nodule senescence did
not allow for whole plant nodule weights and nodule counts.

48
Scans that had more than a quarter of the primary roots missing from view were
removed from the analysis. Images were analyzed using Adobe® Photoshop CS5
Extended for root length, nodule count, and timing of nodulation. For replications one
and two, root lengths were measured manually summing up straight length measurements
along each root using the Photoshop “measure” tool. Computerized image analysis was
used to quantify root length for replications three and four according to Pan and Bolton
(1991). The soil background in the scanned images made it necessary to adjust the
computer output. Transform equations were found for pea and faba separately by plotting
daily root lengths measured manually against daily measurements found through
computer image analysis using scans for medium treatment replication 1 (figure 11).
Absolute root lengths determined by image analysis were much greater than manual
lengths due to inclusion of root hair lengths and other non-linear growth patterns not
measured manually. All nodules visible by day 28 were identified and labeled for nodule
counts. The timing of nodulation was qualified as the day the nodule became visible.
Regression analysis was done using an ANOVA procedure of SAS for the
relationship between measured soil nitrate and nodulation.
Results and Discussion
Available soil nitrate levels from 12.5 ppm to 132 ppm N, were not enough to
completely inhibit nodulation in either pea or faba bean. However, there was a
significant negative relationship between available soil nitrate-N and nodulation (nodule
number) in pea (p < .01) (Figure 12). Nodulation decreased between nitrate levels of 55
and 84 ppm for pea. Further investigation within that range could help to identify critical
levels of available soil nitrate for nodulation in pea. Nodulation in faba bean showed no

49
response to increased available soil nitrate indicating a higher tolerance for available soil
nitrate than pea. This supports the conclusion of Chalifour and Nelson (1988) that early
stages of the rhizobium-legume symbiosis in pea are less tolerant to nitrate than faba
bean. The conclusion was based on observations that delaying exposure of nitrate-N
decreased inhibition of N2 fixation in pea, but not in faba bean with nitrate concentrations
in a hydroponic solution ranging from 0 to 15mM. Direct comparison between nitrate
concentrations of a hydroponic growing medium and a soil solution are not possible, but
with beginning soil nitrate ranging from 12.5 to 132.2 ppm and a soil moisture of 23%,
nitrate concentrations in the soil solution would range roughly from 3.87 mM to 41 mM.
There were no significant relationships between increasing available soil nitrate
and timing of first nodulation for pea or faba bean (Figure 13). These findings are
inconsistent with Guo et al. (1992), who reported that increasing N concentrations (0mM,
5mM, and 10mM) delayed nodule initiation in faba bean, white lupin, and medic.
However, nodule counts taken 15, 25, and 35 DAP were limited to nodules that were
identified as active by pink color. Nitrogen fixation is more sensitive to available nitrate
than nodulation (Steeter, 1988; Cassman, 1980). Without counts of non-active nodules
they were more likely observing a delay was in nodule development and/or fixation
activity. Delays in both due to increasing available nitrate have been observed for pea in
lab and field experiments (Bollman and Vessey, 2006; Voisin et al., 2002).
Nodules on both pea and faba bean showed a distinct pink color, possibly
indicative of active N2 fixation, when available soil nitrate levels were less than 15 ppm
at planting (Figure 14). For available soil nitrate levels higher than 45ppm, no pink color
was observed for faba bean or pea. Chalifour and Nelson (1987) observed greater % Ndfa
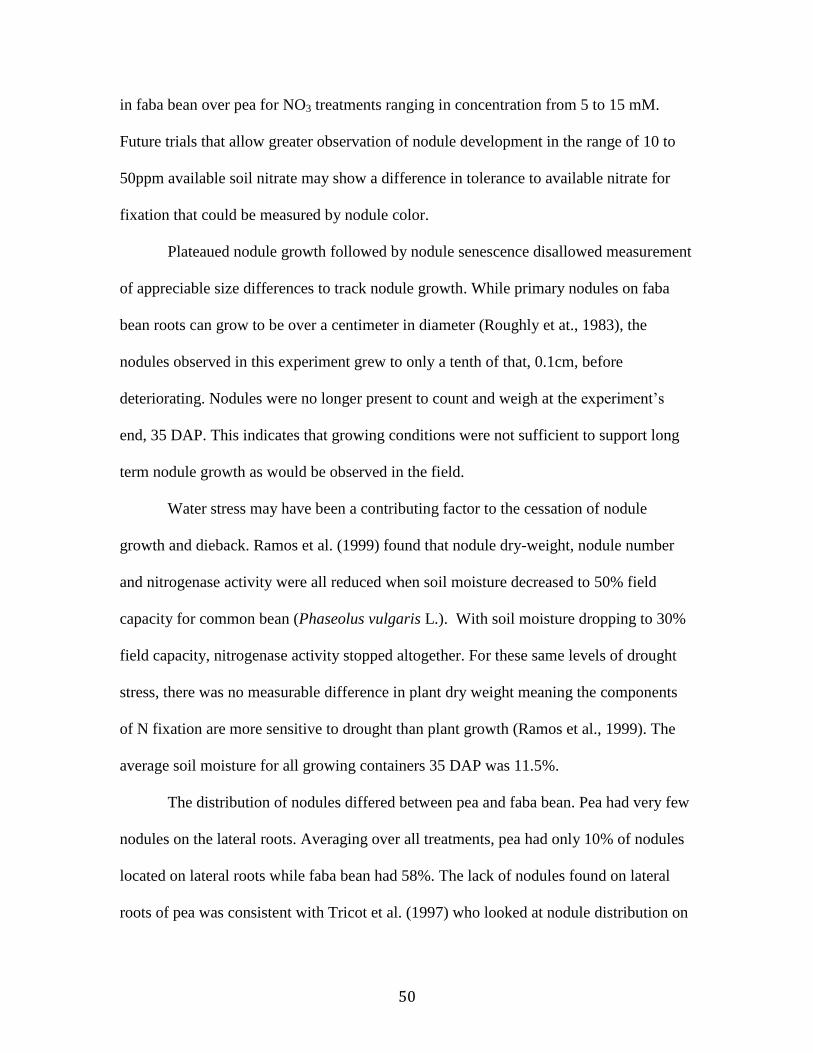
50
in faba bean over pea for NO3 treatments ranging in concentration from 5 to 15 mM.
Future trials that allow greater observation of nodule development in the range of 10 to
50ppm available soil nitrate may show a difference in tolerance to available nitrate for
fixation that could be measured by nodule color.
Plateaued nodule growth followed by nodule senescence disallowed measurement
of appreciable size differences to track nodule growth. While primary nodules on faba
bean roots can grow to be over a centimeter in diameter (Roughly et at., 1983), the
nodules observed in this experiment grew to only a tenth of that, 0.1cm, before
deteriorating. Nodules were no longer present to count and weigh at the experiment‟s
end, 35 DAP. This indicates that growing conditions were not sufficient to support long
term nodule growth as would be observed in the field.
Water stress may have been a contributing factor to the cessation of nodule
growth and dieback. Ramos et al. (1999) found that nodule dry-weight, nodule number
and nitrogenase activity were all reduced when soil moisture decreased to 50% field
capacity for common bean (Phaseolus vulgaris L.). With soil moisture dropping to 30%
field capacity, nitrogenase activity stopped altogether. For these same levels of drought
stress, there was no measurable difference in plant dry weight meaning the components
of N fixation are more sensitive to drought than plant growth (Ramos et al., 1999). The
average soil moisture for all growing containers 35 DAP was 11.5%.
The distribution of nodules differed between pea and faba bean. Pea had very few
nodules on the lateral roots. Averaging over all treatments, pea had only 10% of nodules
located on lateral roots while faba bean had 58%. The lack of nodules found on lateral
roots of pea was consistent with Tricot et al. (1997) who looked at nodule distribution on

51
pea roots using a hydroponic growing medium. Roughly et al. (1983) reported that a
single faba plant can develop upwards of 1000 nodules with a larger number of small
lateral nodules becoming as, if not more, significant to overall N fixation than nodules
found on the primary root. It is possible that nodule distribution could impact capacity for
N fixation in that lateral roots would be more susceptible to root hair infection both in
time and space.
Conclusion
The use of high resolution scanners offers a solution for non-destructive observation of
nodule distribution, growth, and development. Nodulation in faba bean was more tolerant
to available soil nitrate than for pea. This could have implications for adding flexibility in
rotation choice to growers with high residual N looking to achieve a N benefit from a
legume rotation. Soil nitrate did not impact timing of nodulation. Further study with
growing conditions that allow for long term plant growth are needed to investigate the
impact of available N on nodule growth. Color identification of N fixation activity will
require a correlation between quantified values for nodule color and active N fixation
activity.

52
Nitrate-N at Planting (mg N/kg Soil)
Nodules·cm-1 visible root
----Faba---- ----Pea----
12.5 0.05 0.09
13.1 0.12 0.10
48.1 0.03 .
54.6 0.08 0.11
83.7 . 0.02
91.8 0.04 0.02
99.7 0.04 0.02
111.3 0.11 .
111.4 0.26 0.03
114.7 0.05 0.03
122.1 0.03 0.04
132.3 0.10 0.04
0
20
40
60
80
100
120
140
160
180
200
0 250 500 750 1000
Ma
nu
al M
ea
sure
me
nt
(cm
)
Root LAW measurement (cm)
Root Length: Manual vs. Computerized Image Analysis
Faba bean Pea
Peay = 0.39x - 60.2R2 = 0.885
Fabay = 0.29 x- 112.2R2 = 0.984
Figure 11: Root length found using computerized image analysis plotted against measured root length using straight line
approximation to find a transform equation.
Table 7: Specific nodulation, nodules per visible root length, for faba and pea for varying levels of nitrate-N at planting

53
0.00
0.05
0.10
0.15
0.20
0.25
0.30
0.00 20.00 40.00 60.00 80.00 100.00 120.00 140.00
No
du
les
pe
r v
isib
le r
oo
t (N
od
ule
s p
er
cm)
Nitrate ppm
Nodulation Response to Soil Nitrate
Faba
Pea
Figure 13: Linear regression of nodulation timing response to available soil nitrate showed no significant relationship
exists for faba bean or pea.
0
2
4
6
8
10
12
14
0.00 20.00 40.00 60.00 80.00 100.00 120.00 140.00
Da
y o
f N
od
ula
tio
n
Soil Nitrate (ppm)
Nitrate effect on timing of nodulation
Faba
Pea
Figure 12: Linear Regression for nodulation response to increasing soil nitrate. There was a significant negative
relationship found for pea (R2 = 0.59, P < .01), while no relationship was found for faba bean.
54
Figure 14: Nodules observed with 13.07 ppm nitrate-N at planting (left) appear larger and pink in color compared to
nodules observed with 111.43 ppm nitrate-N at planting (right)

55
References
Bhuvaneswari, T.V., B.G. Turgeon, and W.D. Bauer. 1980. Early events in the infection
of soybean (Glycine max L. Merr) by Rhixobium japonicum. I. Location of infectible root
cells. Plant Physiol. 66: 1027 – 1031.
Chalifour, F. P. and L. M. Nelson. 1987. Effects of continuous combined nitrogen supply
on symbiotic dinitrogen fixation of faba bean and pea inoculated with different rhizobial
isolates. Can. J. Bot. 65: 2542 – 2548.
Chalifour, F.P., and L. M. Nelson. 1988. Effects of time of nitrate application on nitrate
reductase activity, nitrate uptake, and symbiotic dinitrogen fixation in faba bean and pea.
Can. J. Bot. 66: 1646 – 1652.
Daur, I., H. Sepetoglu, K. B. Marwat, G. Hassan, and I. A. Khan. 2008. Effect of
Different Levels of Nitrogen on Dry Matter and Grain Yield of Faba bean (Vicia Faba
L.). Pakistan Journal of Botany. 40(6): 2453 – 2459.
Day, J.M. 1980. Nodulation and nitrogen fixation by the field bean (Vicia faba). In
Rothamsted Experimental Station Annual Report for 1979, Pt 1, p191 – 192.
Fijikake, H., H. Yashima, T. Sato, N. Ohtake, K. Sueyoshi and T. Ohyama. 2002. Rapid
and reversible nitrate inhibition of nodule growth and N2 fixation activity in soybean
(Glycine max (L.) Merr.). Soil Sci. Plant Nutri. 48(2): 211 - 217.
Gan, Y., I. Stulen, H. vanKeulen, and P. Kuiper. 2004. Low concentrations of nitrate and
ammonium stimulate nodulation and N2 fixation while inhibiting specific nodulation
(nodulation DW g-1
root dry weight) and specific N2 fixation (N2 fixed g-1
root dry
weight) in soybean. Plant Soil 258: 281 – 292.
Guo, R., J.H. Silsbury, and R.D. Graham. 1992. Effect of four nitrogen compounds on
nodulation and nitrogen fixation in faba bean, white lupin, and medic plants. Aust. J.
Plant Physiol. 19: 501 – 508.
Herridge, D. F., M. B. Peoples. 2008. Global inputs of biological nitrogen fixation in
agricultural systems. Plant Soil 311: 1 – 18.
Hammac, W. A., Pan, W., Bolton, R., and Koenig, R. 2010. High resolution imaging to
assess oilseed species‟ root hair response to soil water stress. Plant Soil 339: 125 – 135.
Hill, Cottionham, D.G. and C.P. Lloyd-Jones. 1980. The influence of nitrate supply on
nitrogen fixation during growth of the field bean, Vicia faba in sand. Physiol Plant. 48:
116 – 120.
Kyei-Boahen, S., A. E. Slinkard, and F. L. Walley. 2002. Evalulation of Rhizobial
Inoculation Methods for Chickpea. Agron. J. 94: 851 – 859.
56
Madsen, E. L., and M. Alexander. 1982. Transport of Rhizobium and Pseudomonas
through soil. Soil Sci. Soc. Am. J. 46: 557 – 560.
Pan, W.L., R.P. Bolton. 1991. Root quantification by edge discrimination using desktop
scanner. Agron. J. 83: 1047 – 1052.
Peoples, M.B., J. Brockwell, D.F. Herridge, I.J. Rochester, B.J.R. Alves, S. Urquiaga, R.
M. Boddey, F.D. Dakora, S. Bhattarai, S.L. Maskey, C. Sampet, B. Rerkasem, D.F.
Khan, H. Hauggaard-Nielsen, and E.S. Jensen. 2009. The contributions of nitrogen-fixing
crop legumes to the productivity of agricultural systems. Symbiosis. 48: 1 – 17.
Peoples, M.B., J.K. Ladha, and D.F. Herridge. 1995. Enhancing legume N2 fixation
through plant and soil management. Plant Soil 174: 83 – 101.
Pueppke, S.G. 1986. Nodule distribution on legume roots: specificity and response to the
presence of soil. Soil Biol. Biochem. 18(6): 601 – 606.
Ramos, M.L.G., A.J. Gordon, F.R. Minchin, J.I. Sprent, and R. Parsons. 1999. Effect of
water stress on nodule physiology and biochemistry of a drought tolerant cultivar of
common bean (Phaseolus vulgaris L.). Ann. of Bot. 83: 57 – 63.
Rennie, R.J. and S. Dubetz. 1986. Nitrogen-15-Determined Nitrogen Fixation in Field-
Grown Chickpea, Lentil, Faba bean, and Field Pea. Agron. J. 78: 654 – 660.
Roughley, R.J., J.I. Sprent, and J. M. Day. 1983. Nitrogen Fixation. In: P.D.
Hebblethwaite, Editor, The Faba Bean (Vicia Faba L.), Butterworths, London (1983),
233 – 260.
Salvagiotti, F., K.G. Cassman, J.E. Specht, D.T. Walters, A. Weiss, A. Dobermann. 2008. Nitrogen uptake, fixation and response to fertilizer N in soybeans: A review. Field Crops Res. 108: 1 – 13.
Streeter, J. and P. P. Wong. 1988. Inhibition of legume nodule formation and N2 fixation
by nitrate. Crit. Rev. Plant Sci. 7:1 1 – 23.
Tricot, F., Y. Crozat, and S. Pellerin. 1997. Root system growth and nodule
extablishment on pea (Pisum sativum L.). Journal of Exp. Bot. 48: 1935 – 1941.
Turpin, J.E., D.F. Herridge, and M. J. Robertson. 2002. Nitrogen fixation and soil nitrate
interactions in field-grown chickpea (Cicer arietinum) and fababean (Vicia faba). Aust. J.
Agric. Res. 53: 599 – 608.
Van Heerden, P.D.R., M. De Beer, D.J. Mellet, H.S. Maphike, and W. Foit. 2007.
Growth media effects on shoot physiology, nodule numbers and symbiotic nitrogen
fixation in soybean. S. Afr. J. Bot. 73: 600 – 605.

57
Van Kessel, C. and C. Hartley. 2000. Agricultural management of grain legumes: has it
led to an increase in nitrogen fixation? Field Crops Res. 65: 165 – 181.
Voisin, A., C. Salon, N.G. Munier-Jolain, and B. Ney. 2002. Quantitative effects of soil
nitrate, growth potential and phenology on symbiotic fixation of pea (Pisum sativum
L.). Plant Soil 243: 31 – 42.

58
CHAPTER FOUR
Conclusion
Cool season grain legumes such as pea (Pisum sativum), chickpea (Cicer
arietinum), and lentil (Lens culinaris), are commonly used rotation crops for dryland
wheat production in the Palouse region. Faba bean (Vicia faba L.) is a cool season grain
legume that is most commonly overwintered in Mediterranean regions, but is increasingly
overwintered in colder regions due to efforts in plant breeding to increase cold and frost
tolance. It is well known that faba bean has a high capacity for N fixation across a wide
range of environments. A rotation crop that can overwinter and fix large quantities of N
could be a good addition to current cropping systems.
A variety trial was conducted field testing 43 genotypes housed in the National
Plant Germplasm System (NPGS) along with 12 cultivars and breeding lines previously
identified as winter-hardy in European trials. All genotypes were fall planted and
harvested in June or July. Sixteen of the 55 genotypes tested were identified with superior
winter-hardiness and 13 of those showed potential to be high yielding. Interestingly, all
winter-hardy genotypes that showed high yield potential out of the NPGS were collected
from Bulgaria with the exception of one that originated in Hungary.
Significant correlations were found between frost resistance and both winter-
hardiness and yield potential. Low R2 values emphasized that winter-hardiness requires
stress tolerances in addition to cold and freezing temperatures. Frost resistance varied
between years at the Central Ferry location, but greater leaf damage in 09-10 didn‟t
reflect increased minimum temperature and shorter durations of below freezing
temperatures. Frost resistance will fluctuate depending pre-harding/hardening conditions

59
during plant development. Later planting in 08-09 may have contributed to increased
frost resistance.
Winter conditions for site-years could be ranked from mild to harsh based
variation in plant survival. Looking at comparative temperature minimums among site-
years for air and soil at depths of zero and 15 centimeters, the correlation between site-
years ranked by decreasing survival and decreasing temperature improved moving down
the soil profile. Reporting minimum ambient temperature is a common way to
communicate winter severity. Exposure of leaf tissue to sub-freezing temperatures is
often studied to better understand frost resistance, a characteristic linked to winter-
hardiness. Monitoring soil temperatures and including root tissue in investigations of
frost resistance may prove useful for furthering our understanding of winter-hardiness.
Nodulation in faba bean is more tolerant to soil nitrate than pea. Regression
analysis showed that for available soil nitrate-N up to 132ppm, there was no relationship
between N concentration and nodulation in faba bean. For pea there was a significant
negative relationship with a considerable drop in nodulation between 55 and 85 ppm soil
nitrate-N. Both species appeared to show responses to available soil nitrate in terms of
nodule growth and active fixation. Nodules for both pea and faba bean appeared larger
and pink in color for soil nitrate-N 13ppm than at soil nitrate-N levels greater than 48
ppm.
Nodulation, nodule growth, and fixation activity are all important components of
total N fixation. While differences in tolerance to soil nitrate in terms of nodulation have
been identified between faba bean and pea, further study at nitrate concentrations less
than 48 ppm soil nitrate-N are needed to evaluate differences in tolerance in terms of
60
nodule growth and active fixation. Quantifying nodule growth will require growing
conditions that support long term plant growth. Decreasing soil moisture appeared to
affect nodule growth and survival.
The use of high resolution scanners may be a solution for non-destructive
observation of root and nodule development in a soil growing medium. Finding a way to
maintain soil moisture without affecting the soil scanner interface proves to be the next
challenge for observing long term growth. Computer image analysis using Root LAW
was effective for finding root length measurements. Some manual measurement is
required to find transform equations to correct for overestimation for each species.
Further investigation is needed to find the cause for over-estimation of root length.
Genotypes of faba bean were identified that survive and yield in the Palouse. Faba
bean shows a high tolerance to residual soil nitrate which could contribute to a greater
capacity to fix N. The results of these studies support continuing investigation of faba
bean as a potential crop rotation for the Palouse.