But … What About Tomorrow? Presentation to September 8 Leadership Summit Tom Stinson Tom Gillaspy...
30
But … What About Tomorrow? Presentation to September 8 Leadership Summit Tom Stinson Tom Gillaspy September, 2009
-
Upload
herbert-blake -
Category
Documents
-
view
216 -
download
0
Transcript of But … What About Tomorrow? Presentation to September 8 Leadership Summit Tom Stinson Tom Gillaspy...

But … What About Tomorrow?
Presentation toSeptember 8 Leadership Summit
Tom StinsonTom GillaspySeptember, 2009

Minnesota Has Been Very Successful
(Especially For A Cold Weather State at the End of the Road)
• Our economic growth rate has exceeded the national average
• Our population growth rate leads the frost belt
• We rank with the leaders on many social and economic indicators
• Education has been a key contributor to the state’s success

Past PerformanceDoes Not EnsureFuture Results
Minnesota Is Facing Significant Long-Term Budget Problems

This Recession Is Much More Severe Than Those of 1990-91 and 2001

Minnesota’s Recovery Will Be Slower than After Recent Downturns
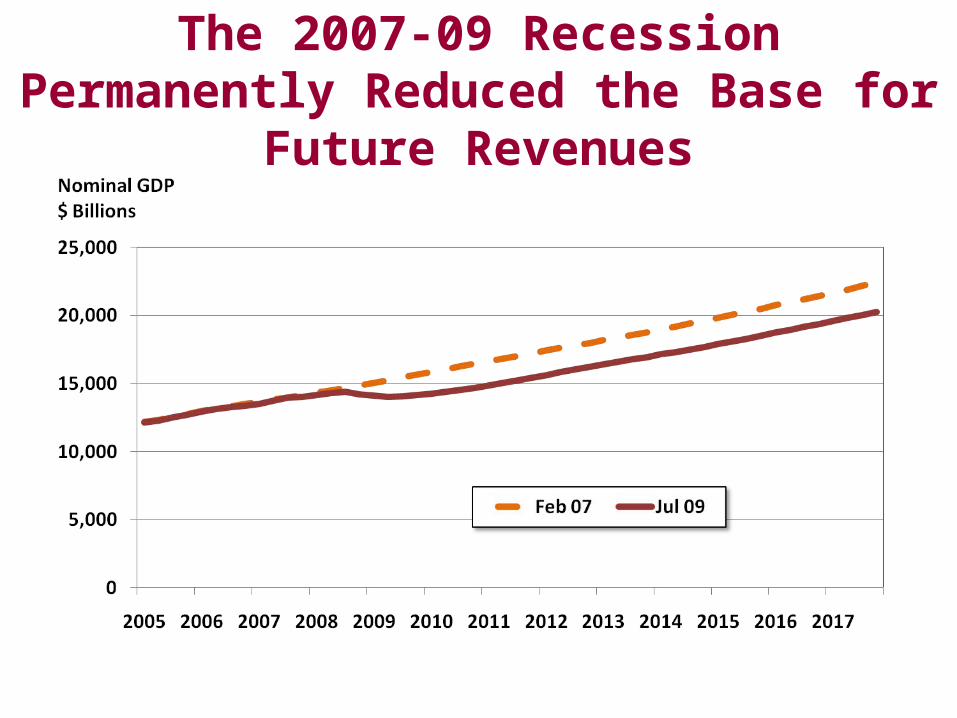
The 2007-09 Recession Permanently Reduced the Base for Future Revenues

The Economic/Demographic Environment Has Changed for as
Far as We Can Forecast
Short run economic cycle has merged with long run demographic cycle
We have entered the Age of Entitlement—economic growth in the next 25 years will be about half what it was in the past 25.
State revenue growth will slow while spending pressures will accelerate
This is a national/global issue

Minnesota Saw a 30 Percent Jump in Workers Turning Age 62 in 2008
0
10,000
20,000
30,000
40,000
50,000
60,000
7/05 to7/06
7/06 to7/07
7/07 to7/08
7/08 to7/09
7/09 to7/10
7/10 to7/11
7/11 to7/12
Year Turning Age 62
Wo
rke
d W
ith
in P
as
t 5
ye
ars
2005 ACS

Budget Pressures Will Change More 65+ Than School Age by 2020
0
200,000
400,000
600,000
800,000
1,000,000
1,200,000
1,400,000
1950 1960 1970 1980 1990 2000 2010 2020 2030
18-24
65+
5-17
Census counts & State Demographer projection, revised 2007
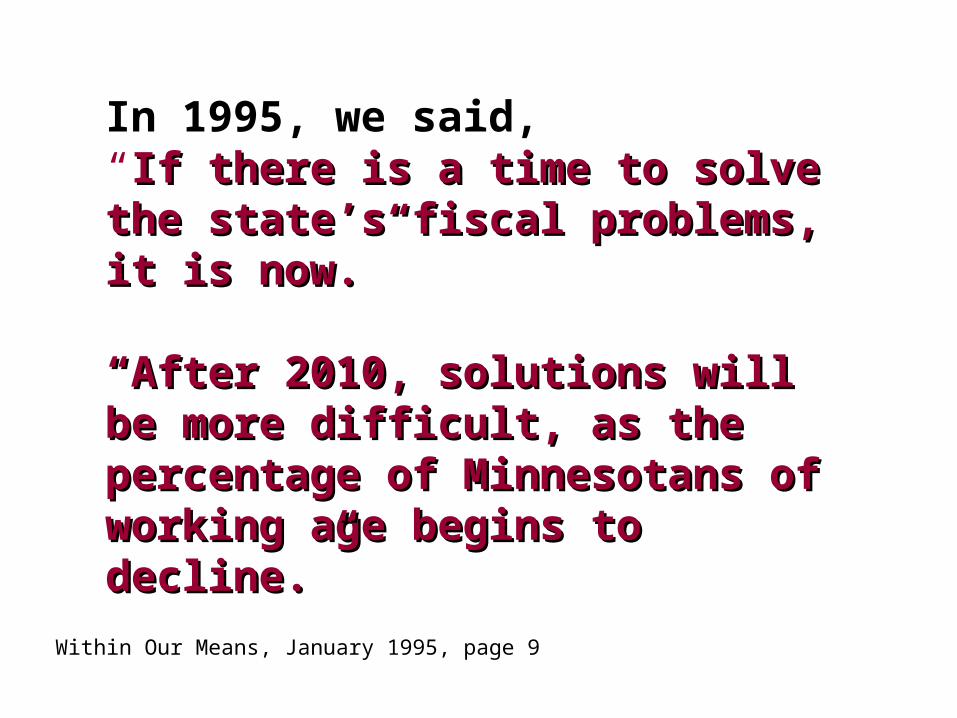
In 1995, we said,“If there is a time to solve the state’s If there is a time to solve the state’s fiscal problems, it is now.”fiscal problems, it is now.”
““After 2010, solutions will be more After 2010, solutions will be more difficult, as the percentage of difficult, as the percentage of Minnesotans of working age begins Minnesotans of working age begins to decline.”to decline.”
Within Our Means, January 1995, page 9

Labor Force Growth Is About To Slow Sharply
1.52%
1.12%
0.75%
0.43%
0.10% 0.13%
0.27%
0.0%
0.2%
0.4%
0.6%
0.8%
1.0%
1.2%
1.4%
1.6%
1990-2000
2005-10 2010-15 2015-20 2020-25 2025-30 2030-35
Ave
An
nu
al C
han
ge

Minnesota Faces a Fiscal Trap1. The issue is a long run, structural one—
short run solutions will not solve the problem
2. Trend growth alone will not be sufficient. Fundamental changes are necessary
3. Revenue growth will slow. Efforts to increase it will be met with resistance
4. Spending pressures will increase driven largely by issues of aging and health
5. State spending will shift its focus from education, infrastructure and higher education to care and support of the aging

Revenue Growth Will Slow5 Year Compound Growth Rates
for Total State Revenues
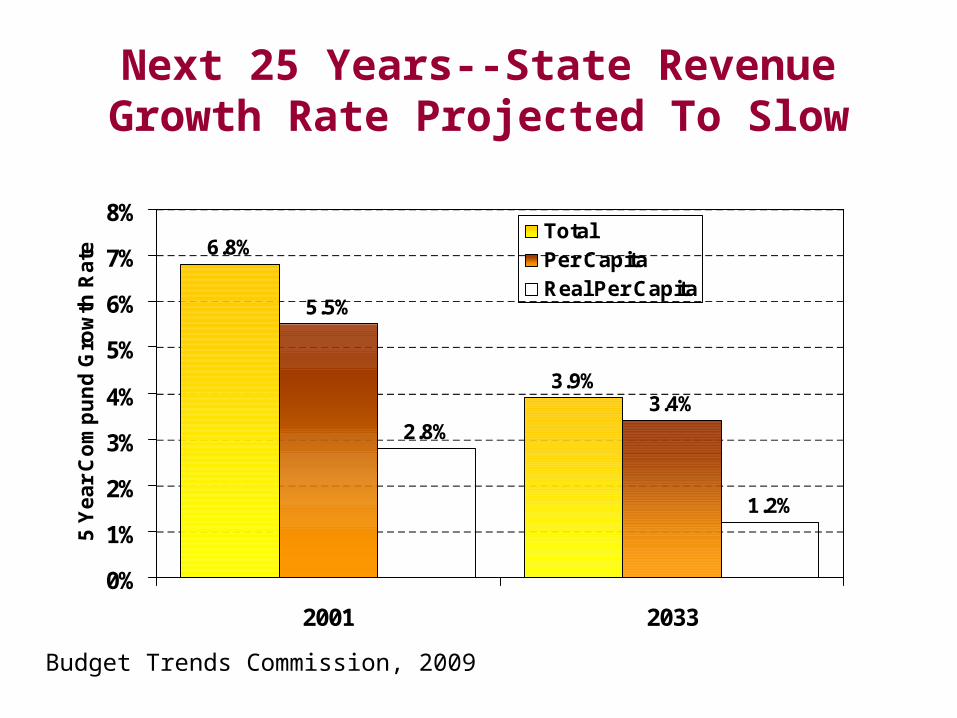
Next 25 Years--State Revenue Growth Rate Projected To Slow
6.8%
3.9%
5.5%
3.4%2.8%
1.2%
0%
1%
2%
3%
4%
5%
6%
7%
8%
2001 2033
5 Y
ea
r C
om
pu
nd
Gro
wth
Ra
te
TotalPer CapitaReal Per Capita
Budget Trends Commission, 2009

From 2010 to 2020, Minnesota Will
See Large Increases Age 50s and 60s
20,15036,190
47,3305,050
-30,680-9,980
47,95061,920
-2,680-63,650
-42,31054,240
102,960112,540
91,37041,400
8,44016,500
0-45-9
10-1415-1920-2425-2930-3435-3940-4445-4950-5455-5960-6465-6970-7475-7980-84
85+
Source: Minnesota State Demographic Center, rev 2007Numbers are rounded

Health Care Spending Jumps After 55U.S. Health Care Spending By Age, 2004
$1,855$1,074 $1,445
$2,165$2,747
$3,496
$6,694
$9,017$9,914
$3,571
$0
$2,000
$4,000
$6,000
$8,000
$10,000
$12,000
<55-
14
15-2
4
25-3
4
35-4
4
45-5
4
55-6
4
65-7
475
+
Avera
ge
Source: Agency for HealthCare Research and Quality, Medical Expenditure Panel Survey,data for per capita spending by age group in the Midwest. Excludes spending for long-term care institutions.

If State Health Care Costs Continue Their Current Trend, State Spending On Other Services Can’t
Grow
3.9%
8.5%
0.2%0%
1%
2%
3%
4%
5%
6%
7%
8%
9%
Revenue Health Care Education & AllOther
An
nu
al
Av
e G
row
th 2
00
8-2
03
3
General Fund Spending Outlook, presentation to the Budget Trends Commission,August 2008, Dybdal, Reitan and Broat

The Political Economy Has Changed In Fundamental Ways
Minnesota had strong per capita economic growth since WWII
The global economic environment has changed.
The political economy is also changing
Aging means slower economic growth and rising government expenditures
Aging means more tax resistance

Phases in the Household Life Cycle

State/Local Government’s Share of Personal Income Has Declined
15.5%
16.5%15.9%
17.4%
15.4%
17.9%
10%
15%
20%
1990 1992 1994 1996 1998 2000 2002 2004 2006 2008
Calendar Year
Price of Government
Mn Dept of Finance

How Do We Get Out Of This Fiscal Trap?
Revenue growth will depend increasingly on per capita economic growth
Future economic growth will depend increasingly on increasing productivity and less on labor force size
This plays to Minnesota’s historic strength

Productivity Remains The Key To Quality of Life In Minnesota
Economic Growth = Labor Force Growth + Productivity Growth
Productivity growth comes fromPrivate investment -- machines & processesSkills & abilities of workersPublic investment -- roads, bridges, etcTechnology from research, public & private

Productivity Is Not Just Producing at a Lower Cost
Increasing the Value of Products Produced Also Increases
Productivity

The Fiscal Catch-22
If we don’t make the necessary public investments in human capital, research and infrastructure, then we won’t have the productivity gains needed to provide the resources to make those investments.
We must avoid the California spiral

The Tale of Two EconomiesPer Capita Personal Income, 1960-2008
% of US Average

Education Is The Key To Productivity
Minnesota High School Graduation Ratio
57%
85%
60% 62%
89%85%
0%
10%
20%
30%
40%
50%
60%
70%
80%
90%
100%
AmericanIndian
Asian Hispanic Black White Total
2 Y
r A
ve R
ate
2004-05 through 2005-06 graduates. Based on 10th grade enrollment three years earlier.

Tough Decisions Must Be Made
• What is state government well positioned to do?
Some issues are national in scope
Some are local
Some are inherently private
• What activities are central to state government’s role?
Big Opportunities
• The challenge--building the foundation for future successEconomic prosperity
Environmental quality
Social justice
Quality of life
• The current situation is not sustainable

“If something can't go on forever, it will stop.”
Herbert Stein, chair President Nixon’sCouncil of Economic Advisors