Business Analytics - PRIMAVERA BSS · The fastest and surest route to decision-making Business...
16
Your business as you have never seen it before! Business Analytics
Transcript of Business Analytics - PRIMAVERA BSS · The fastest and surest route to decision-making Business...

Your business as you have never seen it before!
Business Analytics

Business Analytics Your business as you have never seen it before!
2 primavera bss

Keep pace with the market and stay ahead of trends with Business Analytics
The real challenge facing BI tools is not only their capacity to gather and analyse large amounts of information from a variety of data sources. While this is an essential feature, it is one which is common to all solutions of this nature. What makes Business Analytics different is that it associates this extensive capacity for gathering data from various information sources and technologies with the incorporation of business logic, thereby maximising the organisation’s knowledge, enhancing the ease with which it can be analysed and widening the scope of the results. This solution stands out for its ease of use, which in itself is a totally unique feature in the world of analytical tools. Also worthy of note is the provision of a varied range of pre-configured dashboards, which bring together information about the areas of Finance and Accounts, Sales and Marketing, Materials Management, Operations and Production, and Human Resources. A range of panels are presented through a varied, appealing and highly intuitive viewing spectrum, allowing analyses to be made about these areas from a perspective of what has already happened, what is currently happening and what could happen in the future. The analysis perspectives provided are structured in line with meticulous standards and international good management practices, allowing the effectiveness of management processes to be improved as relationships are established between the data and as innovative perspectives are implemented.As regards scenarios and forecasts, Business Analytics enables forecasting data or predictive algorithms to be input into the system, allowing decision-making to be brought forward and competitive intelligence to be used as an added feature in running the business. Consequently, this technical platform allows you to combine in-depth knowledge of the business with your experience and management philosophy, generating huge potential for surpassing the business’s established goals.
Innovative technology transforms complex data into valuable, easy-to-manage information.
Business Analytics features high quality architecture, resulting in exceptional solidity and excellent responses throughout the entire process, from the initial gathering of information all the way through to the presentation of organised, structured information that is of genuine value to the business. This entire, highly complex process is supported by innovative, cutting-edge technology that automates operations to such an extent that the user is unaware of its complexity.
The solution’s powerful data-gathering capacity is compatible with a vast array of technologies and sources, including SQL Server, MySQL, IBM DB2, Oracle, Excel spreadsheets, XML files, text files, Web Services, a variety of sources compatible with OleDB and many more. Encompassed in a powerful data infrastructure and supported by innovative concepts, the information provided by the solution can be complemented by data input directly into the analytical system, such as goals, indicator readings, forecasts and others, with no need for the customary development of specific, purpose-built mechanisms, thereby guaranteeing high levels of security. This feature gives Business Analytics a strong competitive edge over other BI solutions available on the market.
The technology incorporated also makes it possible to create analysis models that respond to the specific needs of each user and, thanks to the possibility of generating implementation scenarios, guarantees totally flexibility during the stages of design, prototyping, conception, tests, entry into service and maintenance of the entire system.
Analytical solutions help decision-makers be more confident in their choices by providing them with a series of analysis models that foster good practices and raise management standards.
Introduction
Discover how you can make strategic, tactical and operational decisions confidently
Organisations gather vast amounts of data about their various operating areas, using different information systems and technologies to do so, and this can, at first glance, constitute a critical factor for their business. However, this abundance of information gives organisations that adopt Business Intelligence (BI) solutions an important competitive edge because these analytical information systems gather, structure and correlate data from a variety of sources, converting them into information of huge added value for decision-making purposes.
Fruit of PRIMAVERA’s vast experience in management support tools, our BI solution – Business Analytics – is a powerful analytical tool that connects data islands scattered across various systems, integrating them into a central database containing innovative information about the business and providing managers with valuable input on which to base their decisions.
3 Business Analytics

The fastest and surest route to decision-making
Business Analytics goes much further than simply producing traditional reports. In addition to the possibility of configuring analyses in line with each user’s preferences, the solution features a series of ready-to-use dashboards which afford an in-depth view of the various areas in the company and the influence they exert on each other. The various panels making up these dashboards ensure that every department in the organisation has fast access to information essential for its activity. This means that the solution is more than capable of responding to the various information requirements within any organisation, from providing detailed information to simplified and automated management of indicators and culminating in the management of key performance indicators and the organisation’s strategic alignment. The analytical information provided allows the organisation’s overall performance to be monitored, from top-level management all the way through to operational details. The use of shared dashboards means that new analysis perspectives which staff may have created can be made available to everyone, as well as allowing the actual organisation to structure and distribute updated analysis panels in accordance with its specific business dynamics. In this way, the foundations are laid for a high level of coherence in the decision-making process, resulting in organisational alignment based on corporate analyses and structured departments which create analysis standards and disseminate good management practices throughout the entire organisation.
A high level of coherence in the decision-making process leads to organisational alignment based on structured corporate and departmental analyses that create analysis standards and disseminate good management practices throughout the entire organisation.
For companies which already use PRIMAVERA’s ERP, the competitive benefits are even more obvious. The fact that data-gathering models pre-configured for PRIMAVERA databases are available eliminates costs for configuration and maintenance of ERP data integration.
The various analyses provided constitute a fundamental aid in preparing diagnoses, staying ahead of the trends and formulating prognoses, providing a grounding for preventative action targeting critical success factors.
Better decisions without huge investment
The low total cost of ownership (TCO) is one of the strong points of Business Analytics. The standard analytical content established and made available means that a series of generic analyses and indicators can be distributed from the outset, opening the way for economy of scale and disseminating good practices that will raise management standards for the majority of companies.
The analysis scenarios contained in the solution lead to system functionalities being implemented automatically, in addition to updating and the creation of new models in line with each organisation’s specific needs.
The cutting edge technology used in Business Analytics also allows data to be written in the analytical systems, thus ensuring the smooth inputting of goals, indicator readings, forecasts, details of transactions not processed by information systems and more. Consequently, implementation costs are 25% lower when compared to the typical BI tools available on the market.
4 primavera bss

Nowadays, when the business context requires that organisations act and react quickly to a variety of situations, it is absolutely essential that the information provided by BI tools can be accessed from outside the office.
Since it is Internet-supported, Business Analytics can be accessed from anywhere using a computer with an Internet connection. This means that the executives, managers or heads of specific departments who may be out of the office for several days at a time can access the information and keep abreast of the business’s performance regardless of where they happen to be.
Indeed, mobility and easy access to information are now vital features for the majority of companies, in light of increasing expansion into international markets and the streamlining of work facilities.
Information available anywhere
Response to increasing overseas expansion and streamlining of work facilities.
5 Business Analytics

Business Analytics comes with a series of standardised analytical models that systematise information fundamental to the various functions in an organisation, from top-level management to the heads of departments such as Finance and Accounts, Sales and Marketing, Materials Management, Operations and Production, and Human Resources. The analyses provided about these business areas foster an unprecedented knowledge of the business, enhancing alignment with the company’s global strategy.
Sales and Marketing
Sometimes, business opportunities are hidden away in organisations’ data islands. When analysed from a variety of perspectives, Sales and Marketing information can dictate how successful an organisation’s overall performance will be, since this is where the driving force of the business lies. The information that Business Analytics provides in this scope fosters the alignment of a company’s strategy and its commercial operations, supporting planning, management, operationalisation and assessment of performance, in accordance with the strategies outlined for the various product or business areas and also taking into account variables such as geographical location.
Sales PerformanceThe information provided in this dashboard gives Financial and Commercial Directors an overall view of sales performance. Thus, it is possible to view a series of indicators such as: total net and gross sales, cost of sales, margin and profit (checking if they are in line with the established goals, whether overall, by market, by geographical area, etc.). A more detailed analysis is also available, making it possible to monitor progress by time period and see how each market or geographical area has contributed to the overall results.
Discover the business opportunities hiding behind the numbers.
Areas of operation
Consequently, top-level management, the heads of the financial and commercial departments, the Financial Director and the sales managers will all be able to find suitable answers to questions such as:
— Are my sales in line with the established goals?
– Which market is the most influential in the overall sales figures?
– In which geographical area is a particular product obtaining the best results?
– What are the sales figures for each employee?
– Are we selling more or less now than we did during comparable periods in the past?
Sales ManagementThe solution also features more detailed
information on commercial activity. Intended for use by the Commercial Director, the Sales Management dashboard presents information in the form of rankings and ABC analyses that make it possible to quickly find out which customers are the best buyers, which items are selling best and which salesperson is performing best. It is also possible to view the month-on-month or year-on-year variation in sales of a product on a particular market.
This dashboard provides quick answers to questions such as:
— Who is my top seller? – Who is not meeting their targets?– What is the weight of each brand in our
sales turnover? – What is the weight of each model in our
total sales figure?– What is our top-selling item? – Are the top-selling items this year the
same ones as last year?– Who is our best customer? – Did our turnover result from
transactions with lots of customers or only a few?
Sales AnalysisThe dashboard for the Sales and Marketing area provides access to detailed information that is extremely useful to the commercial department. The data provided includes details about customer portfolios, sales figures per customer, per item and per vendor, along with their profiles and the progress they have made. This information provides the answers to the following questions:
– What item does a particular customer buy most?
– How have sales by customer and by item progressed?
– Is a particular item sold mostly to just a few customers or to many customers?
– Is there frequent fluctuation in my sales team rankings?
– To which customers does a particular vendor sell most?
– Etc.
primavera bss6

Sales analysis dashboard
enabling results and their
progress over various
periods to be assessed,
as well as deviation from
established goals and
performance forecasts.
7 Business Analytics

Accounts and Finance
The Finance and Accounts areas can be optimised with Business Analytics, which groups together a series of information about payments and receipts, treasury management, accounts and fixed asset management. The information included affords a transparent view of payment records, the evolution of available funds and bank responsibilities, the worth of your company’s assets and many other analyses.
Payments In/OutAs far as managing payments made and received is concerned, this is an extremely valuable tool for Financial Directors and Controllers. This dashboard makes it possible to monitor the average time spans for receipts and payments, as well as the distribution of balances. As a result, fast answers can be found to the following questions:
– How long has it been taking on average to receive payments and what progress has been made in this respect?
– Who are the most problematic customers?
– Has the average payment time remained stable within the established targets?
– Etc.
Various disruptive analyses of payments and receipts, treasury, accounts and assets will give you a transparent, overall view of your company’s accounts and finances, providing the grounding for confident decision-making.
This dashboard makes it possible to monitor the average
time spans for receipts and payments, as well as the
distribution of balances.
Areas of operation
8 primavera bss
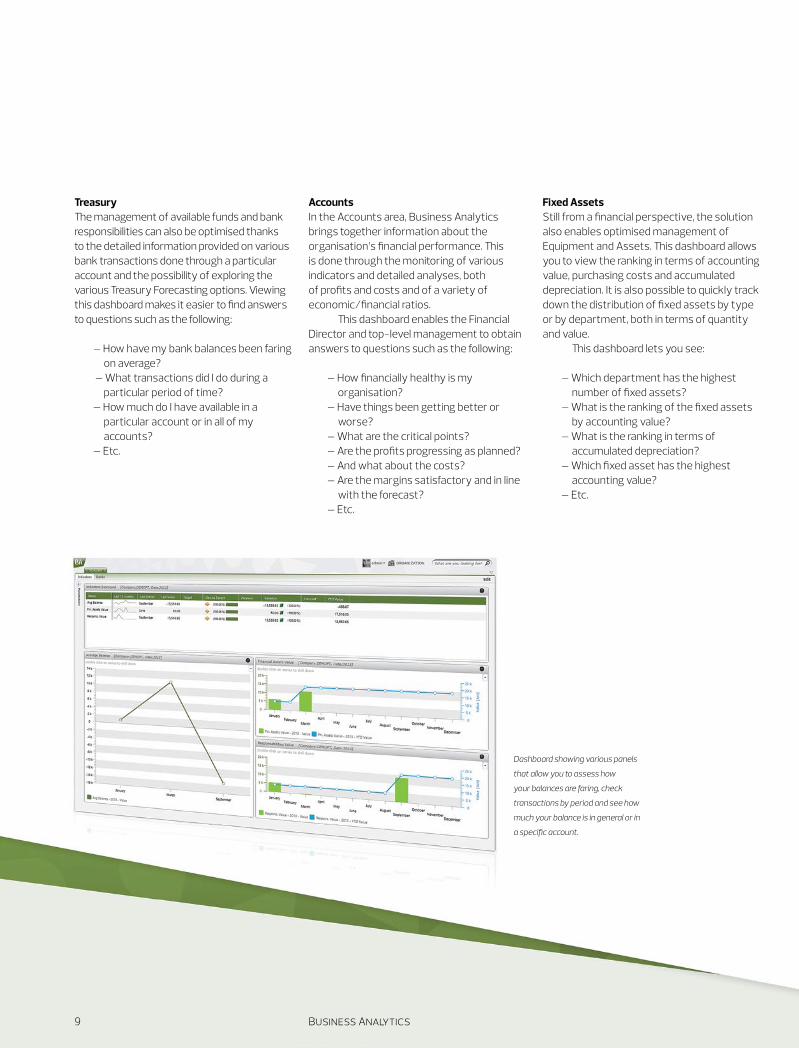
TreasuryThe management of available funds and bank responsibilities can also be optimised thanks to the detailed information provided on various bank transactions done through a particular account and the possibility of exploring the various Treasury Forecasting options. Viewing this dashboard makes it easier to find answers to questions such as the following:
– How have my bank balances been faring on average?
– What transactions did I do during a particular period of time?
– How much do I have available in a particular account or in all of my accounts?
– Etc.
Dashboard showing various panels
that allow you to assess how
your balances are faring, check
transactions by period and see how
much your balance is in general or in
a specific account.
AccountsIn the Accounts area, Business Analytics brings together information about the organisation’s financial performance. This is done through the monitoring of various indicators and detailed analyses, both of profits and costs and of a variety of economic/financial ratios.
This dashboard enables the Financial Director and top-level management to obtain answers to questions such as the following:
– How financially healthy is my organisation?
– Have things been getting better or worse?
– What are the critical points?– Are the profits progressing as planned?– And what about the costs?– Are the margins satisfactory and in line
with the forecast?– Etc.
Fixed AssetsStill from a financial perspective, the solution also enables optimised management of Equipment and Assets. This dashboard allows you to view the ranking in terms of accounting value, purchasing costs and accumulated depreciation. It is also possible to quickly track down the distribution of fixed assets by type or by department, both in terms of quantity and value.
This dashboard lets you see:
– Which department has the highest number of fixed assets?
– What is the ranking of the fixed assets by accounting value?
– What is the ranking in terms of accumulated depreciation?
– Which fixed asset has the highest accounting value?
– Etc.
9 Business Analytics

Materials Management
Purchasing, inventory management (stocks) and logistics processes become crystal clear thanks to the information provided in the Materials Management area. This area comprises several dashboards which provide pertinent information about a variety of areas, presented in a very transparent manner and from a perspective of deliveries made to customers.
PurchasesFrom now on, assessing your suppliers’ performance, compliance with delivery deadlines, items ordered, received and returned, and a range of other assessment options covering your company’s purchases will be a very straightforward process. Thanks to this information, the head of purchasing or the person in charge of an industrial unit’s production department will easily be able to see if their suppliers are efficient or if they need to adopt improvement measures. This area of the solution lets you see:
– Are the suppliers meeting the agreed delivery deadlines?
– Are they delivering the full amounts ordered?
– Which supplier has the highest returns figure?
– Which items do we purchase most of?– How much do we buy from each
supplier?– Etc.
InventoriesThis solution is also intended for warehouse managers, providing them with a clear view as to the value and quantities of their stock, information which is equally pertinent for the managers in charge of purchasing, sales and production. The responses displayed on this dashboard are of huge added value for the day-to-day duties of these professionals. For example:
– What do I have in stock at the moment? – How much is it worth?– How is distributed by warehouse and
type of item?– Which items are running low or are out
of stock? – How long on average does stock remain
in the warehouse? – What is my stock turnover?– Etc.
LogisticsThe analyses provided about Logistics complement the previous ones insofar as they present different perspectives on items being received and dispatched. This allows progress to be monitored and trends to be pinpointed, as well as making it possible to determine the items for which demand is low or is on the increase. Thanks to these and other analyses, it is possible to keep abreast of the company’s performance. The data displayed in the various panels can be used to optimise business performance by providing the answers to important questions such as:
– Are our customers’ orders being delivered on time?
– Are the full amounts ordered being delivered?
– How long on average do deliveries take?– Which items have the fastest turnover? – Which items do we receive most orders
for?– Which items do we deliver fastest?– Etc.
Areas of operation
10 primavera bss

Do not let logistical issues delay or hamper your major projects. Always have information about your suppliers’ performance at your fingertips and keep abreast of the most important details of your company’s logistics.
The inventory dashboard affords a clear view about the value
and quantities of stock, the average time items remain in
the warehouse and stock turnover, as well as distribution by
warehouse and type of item.
11 Business Analytics

Human Resources
An organisation’s greatest asset is its human capital. The business’s overall performance depends on its human capital which is why tools that assist with the process of managing and enhancing human resources produce results whose effects are felt throughout the entire organisation. With this in mind, Business Analytics features a series of data about human resource management, Training and Occupational Hygiene and Safety, and information relating to payroll, absenteeism and other indicators that help managers working in this area to be fully acquainted with every member of the organisation.
Become fully acquainted with your company’s human capital and find out how to get the best possible results from your human resource management strategy.
Human CapitalThe human capital dashboard provides information on performance, academic qualifications, gender, distribution by department, age, salary distribution, staff leaving the company and new arrivals, training requirements and sessions attended, industrial accidents and resulting costs for the organisation, as well as other pertinent and essential data for the efficient management of the organisation’s human capital. Answers to questions such as the following can be found from the information displayed in the various panels:
– Is our staff retention rate on target? – Are the employees fulfilling their training
requirements?– Is the cost of the training courses
conducted within budget?– Which department has the highest
number of industrial accidents? – What type of industrial accident is the
most frequent?– How does each type of accident rate in
terms of days of sick leave?– Has there been an increase or a drop in
the frequency and severity of industrial accidents?
– How much are industrial accidents costing the company?
– In what way have my organisation’s staff numbers been changing?
– Have more new employees been taken on than those who have left?
– What is the trend by department?– Which age bracket do the majority of
employees fall into? – Etc.
SalariesSalaries are analysed in depth by the solution in order to provide important input for top-level management, Financial Directors, the Director and staff of the human resources division and the Directors of the various other departments in the company. The information shown in the various panels allows the variations in the different indicators relating to staff salaries and absenteeism to be monitored, such as: salary ratios, absenteeism rates, the average number of overtime hours worked per employee and the average expenditure per employee. Detailed analyses on salaries, absences, overtime and staff costs can also be consulted from a wide range of perspectives. This dashboard provides the answers to the following questions:
– Is the salary ratio within the limits established for the period?
– How has the average salary per employee evolved?
– Have there been changes in the absenteeism rate? Is it within the established limits?
– What is the average number of absences per employee? And overtime hours?
– Have living allowances increased or decreased?
– How are salaries distributed over the various departments? Which department accounts for the largest slice?
– What is the commonest type of absence? How are absences distributed over the various departments? How much are they costing the organisation?
– What does a particular employee’s absence record look like? And overtime hours?
– Etc.
Areas of operation
12 primavera bss

Production and Operations
For organisations working in the industrial sector, analytical tools are considered to be absolutely fundamental. This type of solution lets you see which production processes or sub-processes have the greatest flaws and cause the most severe stoppages, which ones have the fastest production times and which ones best meet the required quality criteria. It also tells you the items for which your team’s productivity is highest and lowest, etc.
The Production ProcessThis dashboard allows top-level management and the Production Director to monitor the evolution of the production area’s performance by means of a series of indicators such as: productivity, defect rate and deviations in quantity, time, cost and stoppages. It also affords a detailed view of productivity by work centre, operation and operator, and even to the extent of manufacturing order.
This dashboard allows you to compare amounts produced against amounts planned and ordered, and to understand the evolution of the defect rate and the breakdown of defects by types. Other analyses can also be made including estimated costs compared to actual costs and stoppages by type of breakdown and by work centre. This information will help you see:
– Is productivity on target? Has it been improving?
– Are the deviations in cost and time within the defined parameters?
– What changes have been seen in the defect rate?
– Which items are we producing the most of?
– What is productivity like by work centre? And by operator?
– Which of the items produced has the highest defect rate? What type of defect recurs most often? Has it been increasing or decreasing in frequency?
– Which of the items produced shows the greatest deviation from the forecast cost?
– What changes have been seen in my monthly costs?
– Which work centre has the highest number of hours of downtime?
– Which type of breakdown causes the highest number of hours of downtime?
– Are there systematic deviations between the estimated start and end dates and the actual dates for the manufacturing orders for a particular customer?
– In terms of work centres, which one has the greatest deviations between estimated and actual dates for the operations conducted there?
– Etc.
Project ControlThe information provided in the Production and Operations area also comprises a Project Control dashboard which allows the turnover and profitability of each project to be assessed. These data provide the basis for decision-making by both top-level
management and Operations and Project Directors, since they show the organisation’s performance in real time, making it possible to take preventative action to strengthen a strategy that is starting to show good results and to take immediate corrective measures for projects that can be seen to be unprofitable.
The various financial performance indicators also make it possible to access a ranking of projects by turnover, profitability and customer. And analyses can also be made on costs, income and profitability for each project, comparing budgeted and actual figures. This makes it easier to answer questions such as:
– Are the turnover and profitability figures for each project on target?
– Which customer had the most ongoing projects during a particular period? And which of those projects were the most profitable?
– Which project generated the highest turnover during a particular period of time?
– What changes have been seen in deviations in costs for the projects?
– Did the estimated profits for a particular project stay on target as budgeted?
– Etc.
Optimise your company’s production strategy by using data that lets you turn around your weak points and emphasise your strong points, making your business even more competitive.
13 Business Analytics

Immediate access to disruptive information about your business
Business Analytics features standardised analytical models thanks to the availability of a wide range of standard, ready-to-use analyses covering the areas of Finance and Accounts, Sales and Marketing, Human Resources, Materials Management and Production and Operations.
Increased return on investments made in information systems
This solution ensures a return on the investment already made in information systems. Using the data stored in existing systems, users of Business Analytics can gain unprecedented knowledge about the business, with data islands being converted into business information of high added value for decision-makers.
Support for strategic, tactical and operational decisions
The various levels of detail in the analyses provided by the solution respond to the needs of different management profiles. From macro indicators to detailed analyses offering a variety of approaches from different perspectives, the solution provides top-level management and the heads of various departments with the best tools to support them in their decision-making.
Top-of-the-range technology with a low Total Cost of Ownership (TCO).
Easy to install using automatic mechanisms, and offering a wide range of ready-to-use dashboards, this is a highly competitive solution in comparison to every other Business Intelligence solution available on the market. And better still, it uses technologies that ensure streamlined implementation and a sharp reduction in the need to create specific tools normally associated with the implementation of traditional Business Intelligence tools.
Adoption of advanced management and monitoring practices in respect of organisational performance.
Business Analytics gives companies greater access to top-of-the-range analytical tools that foster the widespread adoption of advanced management and monitoring practices in respect of organisational performance. This solution creates analysis standards that boost organisational alignment by defining structured corporate and departmental analyses which are shared by the entire organisation.
The Solutions’s Advantages
14 primavera bss

Business Analytics15

primavera Business Software Solutions
www.primaverabss.com
Portugal
BragaEdifício PRIMAVERALamaçães 4719-006 Braga
LisbonEdifício Arquiparque IIAv. Cáceres Monteiro, Nº 10, 6º1495-192 Algés
www.primaverabss.com/ptT (+351) 253 309 900F (+351) 253 309 909
Spain
MadridParque Europa EmpresarialEdifício París, Calle Rozabella, Nº 6Planta Baja, Oficina 1328230 Las Rozas, Madrid
www.primaverabss.com/esT (+34) 916 366 683F (+34) 916 366 687
Angola
LuandaRua Engº Armindo de AndradeNº 63, 1º DtoMiramar, Luanda
www.primaverabss.com/afrT (+244) 222 440 450 / 222 440 447M (+244) 921 543 587
Mozambique
MaputoAv. Vladimir Lenine, Nº 174Ed. Millennium ParkTorre A | 8º Andar EsqMaputo
www.primaverabss.com/afrT (+258) 21 303 388 F (+258) 21 303 389
United Arab Emirates
Dubai8th Floor Platinum TowerOffice # 805-04Jumeirah Lake TowersDubai, UAE, Po Box : 35005
www.primaverabss.comT (+ 971 ) 4 4504888F (+ 971 ) 4 4504800M (+971 ) (0) 50 7067450


![Brochure - Comarch BSS Suite [Comarch’s Strengths in BSS]](https://static.fdocuments.us/doc/165x107/55a6fb111a28abe80d8b4670/brochure-comarch-bss-suite-comarchs-strengths-in-bss-55b0f70eb6f7f.jpg)