Business Analysis - Texas Tech University
64
1 Valuation Date: April 1 st , 2005 Chris Coffey [email protected] Keith Fraser [email protected] Heather Lee [email protected] Whitney Kelsay [email protected] Carrie Redgrave [email protected]
Transcript of Business Analysis - Texas Tech University
1
Valuation Date: April 1st, 2005
Chris Coffey [email protected]
Keith Fraser [email protected]
Heather Lee [email protected]
Whitney Kelsay [email protected]
Carrie Redgrave [email protected]
2
CVS Valuation
Table of Contents Executive Summary…………………… 3 Business & Industry Analysis………… 7 Five Forces Model………………………. …… 8 Competitive Advantage……………….. ……. 12 Key Success Factors………………………….. 15 Accounting Analysis…………………. 18 Quantitative Measures & Indicators……….. 18 Structure of the Formal Accounting Analysis…………………………… 19 Ratio Analysis & Forecast Financials. 27 Financial Ratio Analysis…………………….. 27 Cross-Sectional (Benchmark) Analysis…….. 29 Financial Statement Forecast
Methodology…………………………...... 39
Valuations Analysis………………….. 43 Discounted Dividends Method……………… 46 Discounted Free Cash Flows Method………. 46 Discounted Residual Income Method………. 47 Abnormal Earnings Growth Method….…… 49 Long-Run Average Residual Income
Perpetuity Method…………………….... 49 Appendix…………………………........ 52 Sources………………………………... 64
3
Executive Summary
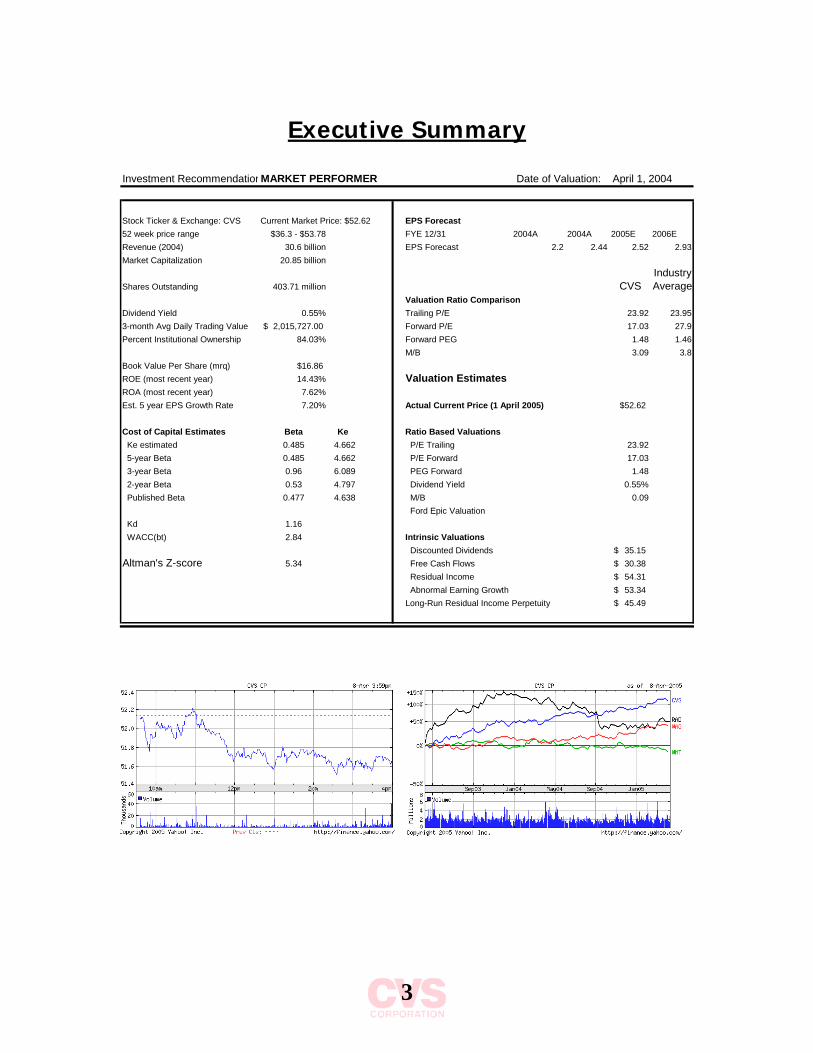
Investment RecommendationMARKET PERFORMER Date of Valuation: April 1, 2004
Stock Ticker & Exchange: CVS Current Market Price: $52.62 EPS Forecast52 week price range $36.3 - $53.78 FYE 12/31 2004A 2004A 2005E 2006ERevenue (2004) 30.6 billion EPS Forecast 2.2 2.44 2.52 2.93Market Capitalization 20.85 billion
IndustryShares Outstanding 403.71 million CVS Average
Valuation Ratio ComparisonDividend Yield 0.55% Trailing P/E 23.92 23.953-month Avg Daily Trading Value 2,015,727.00$ Forward P/E 17.03 27.9Percent Institutional Ownership 84.03% Forward PEG 1.48 1.46
M/B 3.09 3.8Book Value Per Share (mrq) $16.86ROE (most recent year) 14.43% Valuation EstimatesROA (most recent year) 7.62%Est. 5 year EPS Growth Rate 7.20% Actual Current Price (1 April 2005) $52.62
Cost of Capital Estimates Beta Ke Ratio Based Valuations Ke estimated 0.485 4.662 P/E Trailing 23.92 5-year Beta 0.485 4.662 P/E Forward 17.03 3-year Beta 0.96 6.089 PEG Forward 1.48 2-year Beta 0.53 4.797 Dividend Yield 0.55% Published Beta 0.477 4.638 M/B 0.09
Ford Epic Valuation Kd 1.16 WACC(bt) 2.84 Intrinsic Valuations
Discounted Dividends 35.15$ Altman's Z-score 5.34 Free Cash Flows 30.38$
Residual Income 54.31$ Abnormal Earning Growth 53.34$ Long-Run Residual Income Perpetuity 45.49$
4
Recommendation- Fairly Valued Security
We have determined that CVS has a reasonable stock price, with a buy/hold
recommendation. The recent acquisition of Eckerd Drug Stores has made it a
growing firm. The company is expected to grow at a steady pace, hence our
recommendation to buy or hold. Investors should view this as a secure long term
investment. CVS is such a solid company that 85 percent of its stock is owned by
institutional investors.
CVS is a strong company that has realized a substantial gain in sales from
existing stores, and hopes to realize more gains in the future from new Eckerd
stores. The entire industry is expecting steady growth, with no major changes in
the distribution of market share. These observations support our forecasted
growth rates and financial statements.
Current Financial Position
CVS is in the business of providing prescription drugs in a convenient way. We
have discovered that the retail drug industry is a highly concentrated and
growing industry. CVS has the second highest market cap compared to
Walgreen’s.
CVS provides mediocre quality financial reports. They meet GAAP requirements,
but much of the information needed by investors is not provided clearly. The
5
other players in the industry take a conservative approach to reporting their
financial position, while CVS takes a slightly more aggressive approach.
Forecasts of Future Financial Performance
In determining the intrinsic value of CVS, we forecast their sales growth, and in
turn, we are able to forecast their future cash flows, dividend payouts, and net
earnings. Due to the recent acquisition of Eckerd, we designate a fairly high
growth rate for the next five years and a slightly less aggressive rate for the
remaining five years in our ten year forecast.
Estimation of Equity Value
After forecasting their financials out for ten years, we used that information to
value CVS. We then ran four valuation models that presented us with information
about the value of future dividends paid, future free cash flows, abnormal
earnings, and residual income. After evaluating the merit of each valuation
model, we realized some models gave a better estimation of the true value of
CVS stock and decided to let some models weight more heavily in the final value.
Although we did not completely ignore models such as discounted dividends, we
did feel it didn’t give use a good idea of the value of the total company, but we
were happy to find that a large percent of our stock price is from dividends paid.
We believe that this supports our recommendation to buy or hold. After
considering all factors and mainly focusing on the abnormal earnings and
6
residual income models we believe that the stock price if fairly value around a
price of $54.00.
Valuation Risks
We are confident that our valuation of CVS is accurate to the best of our
knowledge. However, the sensitivity analyses show that a slight error in the
prediction of the growth rate or the cost of equity could greatly sway the intrinsic
value determined. Upon acquiring Eckerd, CVS increased its amount of goodwill
by one billion dollars. If this purchase becomes unprofitable, CVS will have to
impair the goodwill, which would cause a fluctuation in their stock price.
7
Business Analysis
Consumer Value Store, or CVS, was established in 1963 in the small town of
Lowell, Massachusetts. It began by selling health and beauty products, but
expanded to selling pharmaceutical drugs and general merchandise in 1967.
CVS strives to make a simple and friendly environment for their customers;
helping them lead happier, healthier lives. Currently CVS is among the leaders in
the retail-drug industry. Their top competitors are Walgreen’s, Rite Aid, and
Wal-Mart. CVS filled 13% of prescriptions in 2004, while Walgreen’s filled 14%
(http://www.cvs.com, 2005).
As of January 2005, CVS’s two segments of operations were Retail Pharmacy and
Pharmacy Benefit Management (PBM). The Retail Pharmacy makes up 95% of
revenue and includes all of the following: prescription and over-the-counter
drugs, photography and film, greeting cards, convenience foods, seasonal
merchandise, and beauty products. With the recent acquisition of Eckerd’s, CVS
is now the number one retail chain with 5,375 stores in 36 states, including DC
and Hawaii (http://www.cvs.com, 2005).
The PBM offers full service prescription benefits to managed care and other
organizations including assisted living centers. CVS also calls this their Specialty
Pharmacy segment or “CVS ProCare,” and it consists of 47 pharmacies in 19
states. It focuses on assisting people with expensive drug costs in dealing with
8
conditions such as, AIDS/HIV, transplants, and genetic conditions
(http://www.cvs.com, 2005).
Five Forces Model
To asses the current situation of CVS in the marketplace, we use the five forces
model. There are two main parts of this model, the first being the degree of
actual and potential competition, including rivalry among existing firms, threat of
new entrants, and threat of substitute products. The second part is the
bargaining power in input and output markets, including the bargaining power of
buyers, and bargaining power of suppliers.
Competitive Force 1: Rivalry among Existing Firms
CVS and Walgreen’s are the main competitors in the retail drug industry. They
sold 13 and 14 percent, respectively, of the nation’s prescriptions last year. Wal-
Mart and Rite Aid are also considered competitors, but Wal-Mart is not
specifically in the pharmaceutical business, and Rite Aid does not have near the
market share to be a main rival. Rivalry in the pharmaceutical industry is high.
Since CVS and Walgreen’s each hold a generous share of the market, CVS’ share
is not conceding. In fact, this industry has seen remarkable growth in the last
three to five years, allowing CVS to maintain its market share while increasing its
revenues and profit percentages (http://www.finance.yahoo.com, 2005).
9
The retail pharmaceutical industry is highly concentrated by a few major firms.
CVS, Walgreen’s and Rite Aid have market caps of $20.66 billion, $43.03 billion,
and $2.08 billion, respectively; whereas Wal-Mart has a market cap of $200.43
billion. Because of this, CVS and those alike, have to follow Wal-Mart’s pricing
and standards to be competitive. Since CVS does not specialize in groceries, like
Wal-Mart does, they can not compete in that area. However, CVS does pride
itself on being a leader in pharmaceutical drugs. Over 70% of their revenue
comes from providing prescription drugs to its customers.
The retail industry provides a low switching cost for its customers. This is evident
because a large percentage of CVS’ retail drug sales come from its generic
brands; which means that customers are not dedicated to one brand if prices of
other brands are lower. By offering superior customer service and convenience,
CVS tries to set itself apart from its competitors. However, it has no choice but to
compete on price because of the relatively low switching costs for customers.
CVS is unable to achieve an economy of scale due to the fact that it has a
large number of small local stores and is unable to compete with competitors
such as Wal-Mart, that are able to spread their fixed costs across more products
per store. The large number of small stores dramatically increases CVS’ fixed
costs.
10
The retail drug industry is highly competitive because there is a high level of exit
barriers and it is at full capacity, so the stores must compete on price. This is
evident because of CVS’s recent acquisition of Eckerd. Because there was so
much competition in the industry, CVS bought Eckerd to expand and maintain its
market share.
This will allow CVS to grow at a faster pace and enter new areas of the market.
The acquisition provided them with 1,200 additional stores that competed in
markets unfamiliar to CVS. If CVS attempted to exit the industry altogether, it
would call for a complete change of its corporate structure and re-design of its
stores. For this reason, exit barriers are high in the retail drug industry.
Competitive Force 2: The Threat of New Entrants
Entering into the retail drug industry comes at a high cost. It would require a
large initial investment in real estate property, product inventory, and human
capital. Recently, the development of new internet-based mail-order prescription
drug companies has lowered the cost of entry into the market. This progress is
still relatively new, and has yet to create a large impact to the industry.
There is not much opportunity for a first mover advantage due the fact that
it is easy for competitors to quickly establish themselves in the market and adapt
to new trends. For example, CVS quickly answered Walgreens’ move to the
southern region of the United States with its own expansion in to the South
11
through the acquisition of Eckerd.
With the proper licenses, it is relatively easy for new competitors to gain access
to the merchandise in the retail drug industry. However, these new entrants may
not be able to demand low prices as easily as existing competitors. There might
also be difficulty in ordering large quantities of merchandise due to the fact that
they are smaller than established companies such as CVS and Walgreens.
For any new company, there are some legal barriers, such as obtaining a local
business license. It is also necessary to acquire state and federal government
licenses that allow the sale of prescription drugs. The pharmacists hired must
also be qualified and licensed. Specialized employees such as these, come at a
high cost to all employers in the industry.
Competitive Force 3: Threat of Substitute Products
In this industry, CVS, Walgreen’s, and Rite Aid are facilitators of the same
products and services. They receive the same prescriptions and general
merchandise as their competitors. The threat of customers going to the
competition is high and it leaves the company vulnerable to the customers
taste and preferences. What sets them apart is their level of service and
convenience to their customers.
12
Competitive Force 4: Bargaining Power of Buyers
The retail drug industry experiences a slim profit margin on prescriptions and a
larger margin on general merchandise. This makes customers more inclined to
shop around for cheaper prices on similar products. In this industry, buyers are
willing to compare prices at CVS and its competitors’ sores to find the best price
of a prescription. Since these stores carry many of the same brands, it is just a
matter of who has the lowest price.
Competitive Force 5: Bargaining Power of Suppliers
The suppliers of retail pharmacies are drug manufacturers like Eli Lilly.
Although the retail drug industry is very price sensitive, the suppliers
of CVS and Walgreens have some bargaining power due to the
fact that their customers incur a high cost of not doing business. This means that
the bargaining power of suppliers to this industry is relatively low.
Overall, the industry is profitable and would be a good market in which to invest.
Competition has always been high, so, as long as the main competitors continue
to perform as they currently are, they will remain profitable.
Competitive Advantage
Although CVS seems to be in the business of merchandising, their focus is on
selling customer service.
13
In the retail drug industry, the cost leadership is possessed by Wal-Mart.
CVS and Walgreens are unable to beat Wal-Mart’s prices. Competitors of Wal-
Mart do not have the resources or industry dominance to supply the same
products at or below the price Wal-Mart is able to offer its customers. Other
retailers are unable to compete with Wal-Mart’s economy of scale and scope.
Compared to competitors such as Walgreens, CVS boasts that it has the most
stores in the nation. This increases its fixed cost per store, hence, not giving
them an economy of scale. In the industry, all stores provide their products and
services to the consumers with about the same efficiency. CVS’s goal is to
provide a wide range and depth of products to its customers. By doing this they
differentiate themselves from other competitors, who attempt to cut costs by
providing their customers with a limited selection of choices. Because of its
power over its suppliers, Wal-Mart has the lowest input cost per unit of
merchandise, so other competitors must find other ways to compete. In addition,
Wal-Mart owns its own trucking line and distribution centers. Because of this,
competitors like CVS are unable to have the lowest distribution cost in the
industry. CVS does not do a lot of brand advertising as compared to competitors
like Wal-Mart and Walgreens, but many of the suppliers and manufacturers
advertise the products sold by CVS. This makes the costs of those specific
products higher, and CVS’s profit margin lower.
CVS finds its competitive advantage is differentiation. Its main advantage is
14
having the ability to carry and sell a wide variety of name brand and off-brand
drugs. It also has an advantage compared to its competitors in that it has a large
number of small local neighborhood stores, so customers have a sense of
security in purchasing medications from CVS. It also delivers a higher quality of
service and convince. CVS provides its customers with an alternative to high
priced name brand drugs with it generic brands which are much cheaper. It also
appeals to its customers by providing “Rapid Refill”, a service that refills
prescription drugs by phone 24 hours a day. In addition to retail drugs, CVS
provides a variety of other products and services, such as photo developing,
personal care products, and many other things that its customers use on a daily
basis. Customer service is where CVS sets itself apart from it competitors. It
provides a number of neighborhood stores with drive-through pick up service for
its prescription drugs. The company boasts its 5,375 stores, saying it has more
pharmacies than any other retailer in the industry. The acquisition of Eckerd has
really added to their advantage by giving them the chance to expand quickly.
CVS has strived to make itself a strong name among its customers. They want to
be thought of as a drug store where the customers can fill their prescriptions and
get sound medical advice.
CVS is constantly trying to come up with new ways to stay on top of its
competition, by providing better and more convenient services to its customers.
They are currently looking at how it is going to compete in the area of mail order
15
prescription drugs. They predict that in the future, many heath insurance
companies will want their customers to buy prescription drugs through the mail
in the belief it will save them money. CVS currently provides a mail order service
that is still in its developmental stages. Soon they hope to implement this service
nation-wide. They believe that due to the aging population of the baby boomers
they should see an increase in sales of prescription and over-the-counter drugs
in the years to come. CVS should also see a significant increase in profits due to
new legalization on Medicare and the introduction of new drugs. They can
sustain their advantages at least for the next few quarters, due to the unrealized
potential of the Eckerd acquisition and expansion into new geographic markets.
The retail drug industry is very competitive and the difference between the top
competitors in the industry is small, so CVS must find other new was to gain an
advantage. There are huge cost barriers to enter the industry or even to stay
alive in the industry. CVS and Walgreens are the two main competitors, but
when you take a broader look at who actually competes with CVS, companies
such as Wal-Mart, grocery stores, and even quick shops come into play.
Key Success Factors
Strengths
CVS is the leader in the retail pharmacy industry and has the second largest
pharmacy chain. CVS is able to offer their customers benefits on their
prescriptions through their own Pharmacy Benefit Management. They are in
16
control of their suppliers because the loss of one, to them, would not hurt their
business. They are in an industry that will always be needed by people. To gain a
strong customer base they offer incentives to their loyal customers. CVS is
currently expanding their stores into new and existing markets.
Weaknesses
Having such a huge competitor (Wal-Mart) in their industry can hinder their
profits and sales. The company has seen a decline in their sales percentage in
the health and beauty and general and seasonal merchandise over the last three
years. CVS relies on the main part of the profit from their front end store items
during end of the year sales. If the company’s profit in the pharmacy section
start to see a decline it will have a hard time producing profit in another section
and they would not easily be able to move into a different industry.
Opportunities
Currently, CVS has been growing to adapt to its environment and competitors.
Baby boomers have a large effect on the retail drug industry because they are a
very populous group that is seeking cheap prescriptions. Additionally, they are
expanding into the south and the west coast for comfortable living. CVS saw the
opportunity to take advantage of this growth by acquiring the Eckerd stores in
those areas. It is obvious that CVS values the acquisition of Eckerd very highly
because they paid over one billion dollars in goodwill to buy Eckerd.
Threats
A threat that CVS has been dealing with, is the growth of Wal-Mart into
17
neighborhood’s everywhere. With the growth of one-stop shopping and low
prices, CVS has to be innovative in the market. CVS’s main focus is competing
on convenience and customer service, while Wal-Mart is lacking in that aspect.
Also, CVS is under investigation for possible securities fraud, presently the case is
still under investigation.
18
Accounting Analysis
In the Accounting analysis we will discuss both the quantitative and qualitative
data for CVS to better understand and evaluate how they are running the
financial side of their business. The quantitative section reviews over CVS’ past
performance in the form of ratios and the qualitative section consists of Six
Steps: Identifying key accounting policies, Assessing accounting flexibility,
Evaluating accounting strategy, Evaluating the quality of disclose, Identifying
“red flags”, and last, Undoing accounting disclosure.
Quantitative Measures and Indicators
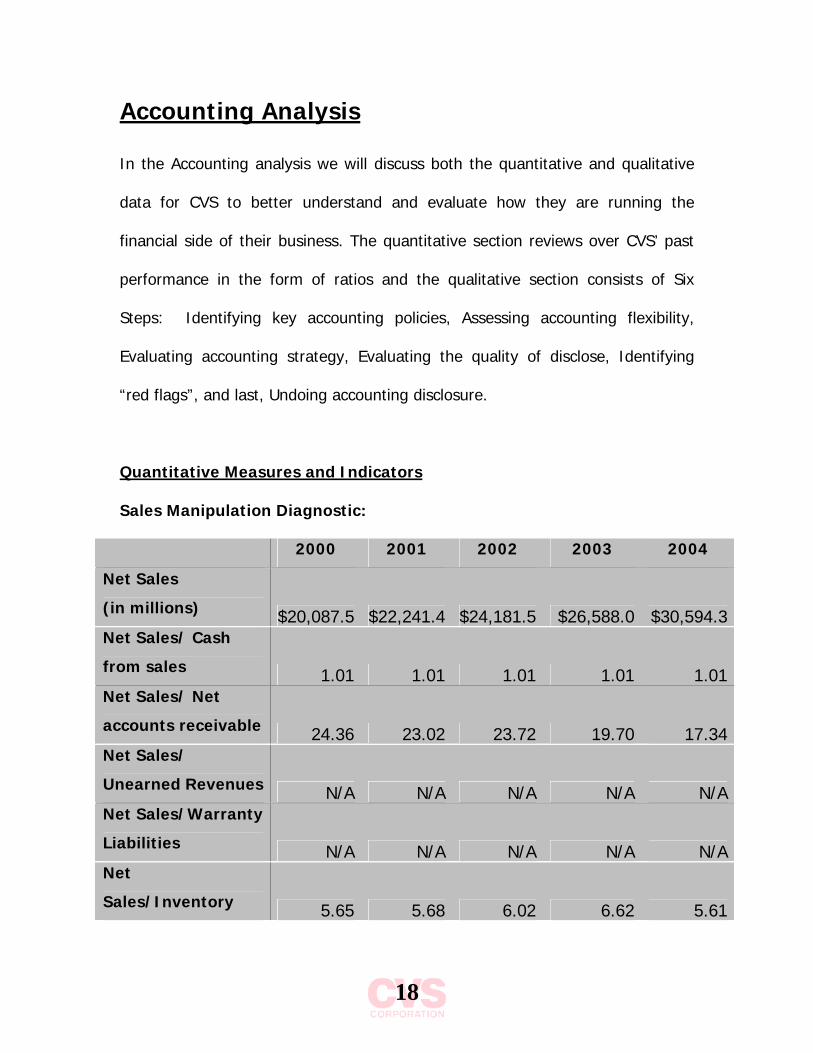
Sales Manipulation Diagnostic:
2000 2001 2002 2003 2004
Net Sales
(in millions) $20,087.5 $22,241.4 $24,181.5 $26,588.0 $30,594.3 Net Sales/ Cash
from sales 1.01 1.01 1.01 1.01 1.01 Net Sales/ Net
accounts receivable 24.36 23.02 23.72 19.70 17.34 Net Sales/
Unearned Revenues N/A N/A N/A N/A N/ANet Sales/Warranty
Liabilities N/A N/A N/A N/A N/ANet
Sales/Inventory 5.65 5.68 6.02 6.62 5.61
19
These ratios illustrate:
CVS’ net sales to cash from sales remained steady, almost the same.
The Net sales to accounts receivables decreased by almost a fifth over the
five years which clearly shows that accounts receivables are increasing by a
significant rate since net sales are also increasing.
The net sales to inventory on the other hand is increasing which indicates
that either the company is reducing their inventory or their inventory is
remaining the same and the increase is just the result of net sales increasing.
Core Expense Manipulation Diagnostics:
2000 2001 2002 2003 2004
Asset Turnover 2.53 2.58 2.51 2.52 2.10
Changes in CFFO/OI 0.59 0.88 1.00 0.68 0.63
Changes in CFFO/
NOA N/A N/A N/A N/A N/A
Total Accruals/
Change in Sales N/A N/A N/A N/A N/A
Pension Expense/
SG&A 0.0714 0.0615 0.0709 0.0665 0.0580
Structure of the Formal Accounting Analysis
Qualitative Measures
STEP 1: Identification of Key Accounting Policies
CVS has identified many different critical and significant accounting policies for
their company. Higher management believes that some of their policies are held
20
to a higher judgment and therefore are labeled as critical. Management follows
the standards of the generally accepted accounting principles (GAAP) and has
the Audit Committee of our Board of Directors and the Audit Committee review
them. CVS backs all their estimates on current trends in the industry and
historical trends the industry has faced. The following information was found on
CVS’ annual report to stockholders provided by the SEC (www.sec.gov).
Managers have labeled the following as critical accounting policies:
• Impairment of Long-Lived Assets: CVS’ criteria for long-lived assets include
their intangibles with definite lives, but exclude goodwill. Each store
individually recognizes and evaluates the degree of impairment on each long-
lived asset by comparing the assets carrying value to the future cash flows of
the store. In 2002, CVS recognized the SFAS No. 144 “Accounting for
Impairment or Disposal of Long-Lived Assets” for their evaluation standards.
• Closed Store Lease Liability: The unused portion of the lease is determined
by the present value of their existing obligation then recorded as a liability
under estimated future sublease income. CVS accounts for this recognition by
SFAS No. 146, “Accounting for Costs Associated with Exit or Disposal
Activities.”
• Self-Insurance Liabilities: This is a judgment call that CVS bases on (but is
not limited to) past claims, estimates from third-party insurance companies,
and demographic factors. Management reviews actual claims to their
estimates to account for any material differences.
21
• Inventory: Their inventory is stated at the lower of cost or market on a
first-in, first-out (FIFO) basis using the retail method of accounting to
determine cost of sales and inventory. It is adequately measured against
current market conditions and it is taken on a regular basis to ensure the
quality of their statements.
Managers have labeled these next set of accounting polices as significant to
their company, they are as follows:
• Fiscal Year: The Company’s fiscal year is a 52 or 53 week period ending on
the Saturday nearest to December 31 and unless stated all years refer to their
fiscal year.
• Cash and Cash Equivalents: These are all cash and those purchase
investments of three months or less.
• Accounts Receivables: This contains mainly those due from third party
providers (like insurance companies) and vendors. The amount is calculated
net of their uncollectible accounts.
• Property and Equipment: Property is generally depreciated over a 10-40
year period while fixtures and equipment are over a 5-10 year period.
Additional expenses such as maintenance and repair are recorded as incurred.
Anything that extends the useful life of an asset is capitalized and depreciated
accordingly.
• Intangible Assets: These are amortized on a straight-line basis either over
their useful life up to 10 years or for lease, their present lease time to end.
22
• Revenue Recognition: All revenue is recorded at the time the asset is sold
or at the time the service is provided. The company offers a discount to entice
them so to provide faster cash collections and is recorded at sale time. Any
returns are considered irrelevant.
• Vendor Allowances: They follow EITF No. 02-16, “Accounting by a Reseller
for Cash Consideration Received from a Vendor.” This allows them to have
lower inventory costs. The allowances are depreciated on a straight line bases
and are not amortized because the company feels it is not material.
• Store Openings and Closing Costs: New store openings are charged as
expense as is the book value of a closed store.
• Insurance: The Company is self-insured for the automotive, general and
worker’s compensation parts of their business. They have 3rd party insurance
to restrict exposure from the previous claims.
• Stock Based Compensation: These are recognized and recorded based on
the principles of Accounting Principles Board (“APB”) Opinion No. 25,
“Accounting for Stock Issued to Employees,” and related interpretations
• Advertising Costs: They are recorded as an expense when the advertising
takes place.
• Income Taxes: Taxes are recorded as payables because of the difference
in timing between the billing and actual period of accrual.
• Leases: Most of these are operating leases, as opposed to capital leases.
This makes their debt to equity ratio smaller than it would be if they used
23
more capital leases. Failure to recognize these as operating instead of capital
leases can lead to the understatement of lease assets.
STEP 2: Assessment of Accounting Flexibility
CVS has a significant amount of flexibility in the accounting policies chosen by
management. Some of the key policies that offer themselves to interpretation by
the managers include impairment of long-lived assets, self-insurance liabilities,
and inventory valuation. The methods of depreciating and amortizing long-lived
assets create flexibility for managers because they estimate the useful life of the
asset in the straight-line method. Self-insurance liabilities also allow for some
flexibility and interpretation. The level of expected risk determines the amount of
CVS’ insurance policies. Managers could choose to save money on insurance if
they are risk averse which would decrease their expenses, and in return
increasing their net income. On the other hand, managers might choose to
implement a larger insurance policy to increase expenses and decrease net
income to create a tax reduction. If they do this, they might also cut their
expenses in the long-run if other extraordinary expenses, like lawsuits and
environmental factors, are incurred. CVS uses FIFO to value their inventory and
cost of goods sold. Their other options are to use Last In, First Out (LIFO) or
weighted average. These methods each affect net income differently, so they
allow for some flexibility in management.
24
STEP 3: Evaluation of Accounting Strategy
CVS tries to be transparent in many areas to show their true financial standing,
although there are many areas that may be questionable in how they went about
estimating and reporting their financial numbers. CVS loosely follows the
guidelines set forth by the Securities Exchange Commission (SEC) when they are
given alternatives to choose from. They do conform to GAAP which allows
managers to make certain judgment calls. Their strategy appears to give just
what is required of them and no more detail than that. The company appears to
be taking a more aggressive approach to their accounting strategy.
The pharmaceutical section of the retail industry tends to lean to a more
conservative approach when choosing accounting standards. This industry is well
developed with a few main competitors which are Walgreen’s and Rite Aid. All
three firms tend to follow the same guidelines on many accounting policies such
as impairment of long-lived assets, not amortizing goodwill, depreciation on a
straight-line base, and their basis for insurance. Walgreen’s and Rite Aid both
use the LIFO method for inventory valuation while CVS choose to use the FIFO
method. All the firms conform to Accounting Standards No. 142 “Goodwill and
other Intangible Assets” when not amortizing their goodwill. CVS appears to have
no off-balance sheet accounting except for some operating leases but there is no
debt recorded. The company recognizes revenue at the time merchandise is sold
and when their service is provided. Their accounting strategy tends to follow
25
some trends of the industry while some of their other strategies lean towards
managements decisions and estimates.
STEP 4: Evaluation of the Quality of Disclosure
CVS has a low quality of disclosure in their footnotes. It appears that the
company follows GAAP’s requirement but fails to provide any information beyond
that on each of their policies. Their footnotes are broad and leave many
questions with unclear answers about where their numbers were derived from.
CVS provides very broad titles for their income and expense reporting and do not
allow users to see a detailed breakdown of what all is included in these
categories. CVS’s financial statements are not transparent from year to year
because they add and delete line items which cause inconsistency. Even though
CVS’s quality of disclosers leaves much to be desired by its users, we do not
believe that CVS is attempting to mislead users due to the fact that the quality of
disclosure is poor throughout the industry.
STEP 5: Identification of Potential “Red Flags”
CVS’ two competitors both have chosen to use LIFO for the valuation of
inventory while CVS uses FIFO. This might skew their net income level compared
to what their competitors are reporting. Due to the use of FIFO the assets value
will appear higher compared to their competitors leading others to believe that
they carry more inventory but this could be untrue since FIFO allows inventory
26
value to appear high. Their pension expenses and other employment expenses
as a percentage of total expenses have experienced a downward trend over the
past five years. This leads one to believe that the company’s expenses in other
areas have dramatically increased as a percentage of total expenses.
STEP 6: Undo Accounting Disclosure
After conducting our accounting analysis, we found out that CVS wasn’t quite as
transparent as they tried to appear to be. We couldn’t find anything of severe
relevance to initiate any further research. They followed the requirements of
GAAP, but chose not to disclose as much information. We don not believe as of
yet that they have used their flexibility in any inappropriate ways, but just that
their actions, if continued, may bring up questions from higher authority.
Because of this we don’t believe that we need to go back, revaluate, and correct
their financial statements. We would consider a more in-depth look into the
management’s decisions if this vague, unclear trend continues in upcoming
years.
27
Ratio Analysis & Forecast Financials
The purpose of this section is to predict the future performance of CVS. To do
this we forecast their financial statements for the next 10 years and compared
that to the forecasted industry average. The industry average is comprised of
Walgreen’s and Rite-Aid. Wal-Mart is not included in this because of the broad
scope of their business activities and the sheer size of their company. The
analysis of ratios, financial statements, and pro forma statements were used in
determining future values. A conservative approach was taken in predicting the
future figures and forecasting out the next 10 years.
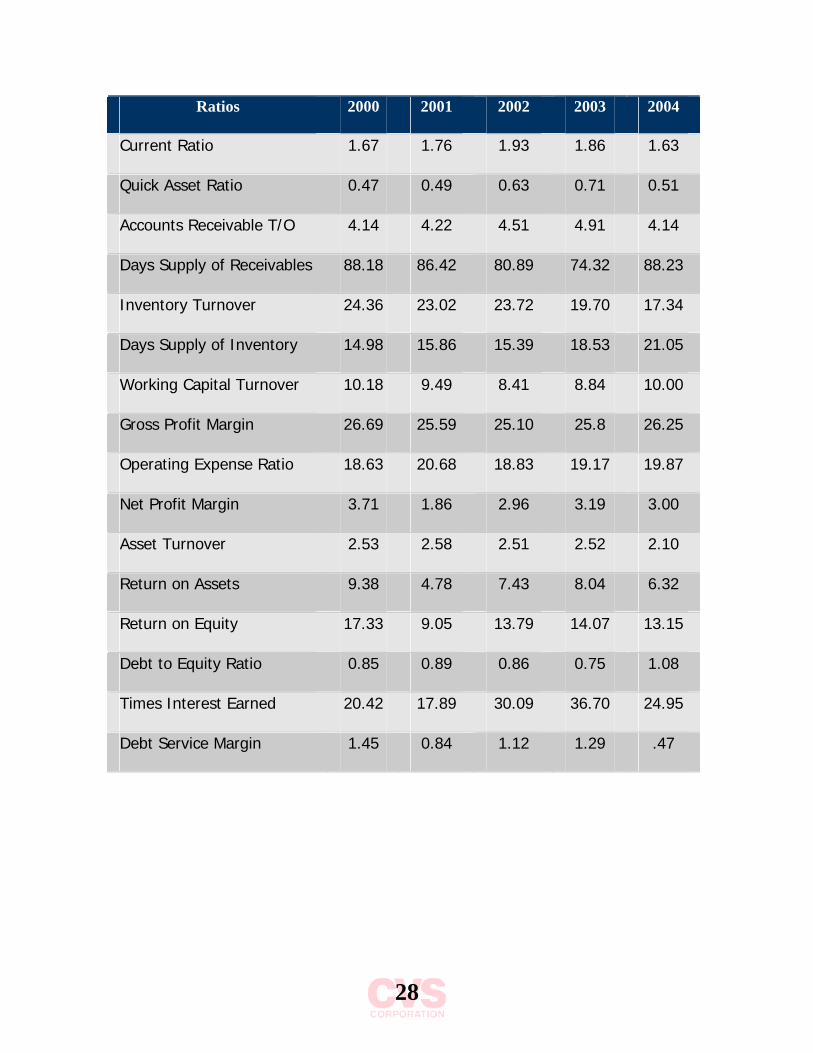
Financial Ratio Analysis
The following ratios were used in our trend (time series) analysis of CVS: Current
Ratio, Quick Asset Ratio, Accounts Receivable Turnover, Days Supply of
Receivables, Inventory Turnover, Days Supply of Inventory, Working Capital
Turnover, Gross Profit Margin, Operating Expense Ratio, Net Profit Margin, Asset
Turnover, Return on Assets, Return on Equity, Debt to Equity Ratio, Times
Interest Earned, and Debt Service Margin. A clear depiction of CVS’ standing was
determined by the basic fourteen ratios and no other ratios were deemed
necessary to use. This information can be found in the table below.
Table 1 - Financial Ratio Analysis
28
Ratios 2000 2001 2002 2003 2004
Current Ratio 1.67 1.76 1.93 1.86 1.63
Quick Asset Ratio 0.47 0.49 0.63 0.71 0.51
Accounts Receivable T/O 4.14 4.22 4.51 4.91 4.14
Days Supply of Receivables 88.18 86.42 80.89 74.32 88.23
Inventory Turnover 24.36 23.02 23.72 19.70 17.34
Days Supply of Inventory 14.98 15.86 15.39 18.53 21.05
Working Capital Turnover 10.18 9.49 8.41 8.84 10.00
Gross Profit Margin 26.69 25.59 25.10 25.8 26.25
Operating Expense Ratio 18.63 20.68 18.83 19.17 19.87
Net Profit Margin 3.71 1.86 2.96 3.19 3.00
Asset Turnover 2.53 2.58 2.51 2.52 2.10
Return on Assets 9.38 4.78 7.43 8.04 6.32
Return on Equity 17.33 9.05 13.79 14.07 13.15
Debt to Equity Ratio 0.85 0.89 0.86 0.75 1.08
Times Interest Earned 20.42 17.89 30.09 36.70 24.95
Debt Service Margin 1.45 0.84 1.12 1.29 .47
29
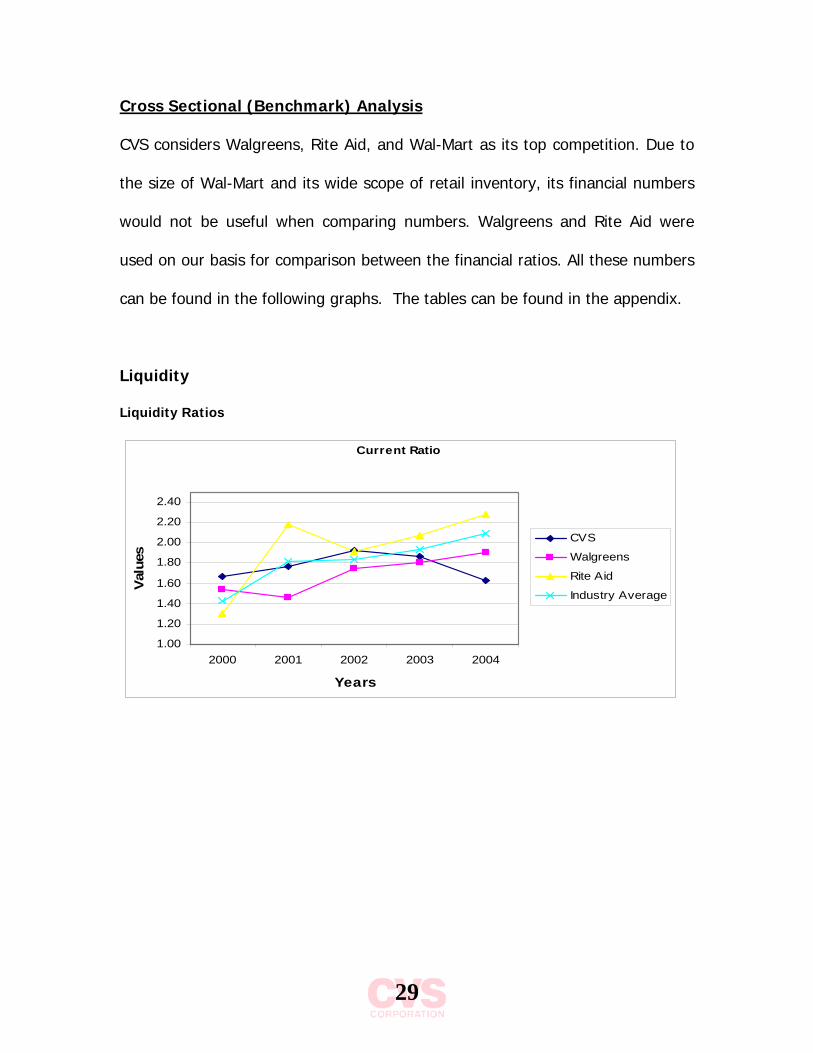
Cross Sectional (Benchmark) Analysis
CVS considers Walgreens, Rite Aid, and Wal-Mart as its top competition. Due to
the size of Wal-Mart and its wide scope of retail inventory, its financial numbers
would not be useful when comparing numbers. Walgreens and Rite Aid were
used on our basis for comparison between the financial ratios. All these numbers
can be found in the following graphs. The tables can be found in the appendix.
Liquidity
Liquidity Ratios
Current Ratio
1.00
1.20
1.40
1.60
1.80
2.00
2.20
2.40
2000 2001 2002 2003 2004
Years
Val
ues
CVS
Walgreens
Rite Aid
Industry Average
30
Quick Asset Ratio
0.00
0.10
0.20
0.30
0.40
0.50
0.60
0.70
0.80
0.90
2000 2001 2002 2003 2004
Years
Valu
es
CVS
Walgreens
Rite Aid
Industry Average
Inventory Turnover
3.00
3.50
4.00
4.50
5.00
5.50
6.00
2000 2001 2002 2003 2004
Years
Valu
es
CVS
Walgreens
Rite Aid
Industry Average
Days Supply of Inventory
0.0010.0020.0030.0040.0050.0060.0070.0080.0090.00
100.00
2000 2001 2002 2003 2004
Years
Valu
es
CVS
Walgreens
Rite Aid
Industry Average
31
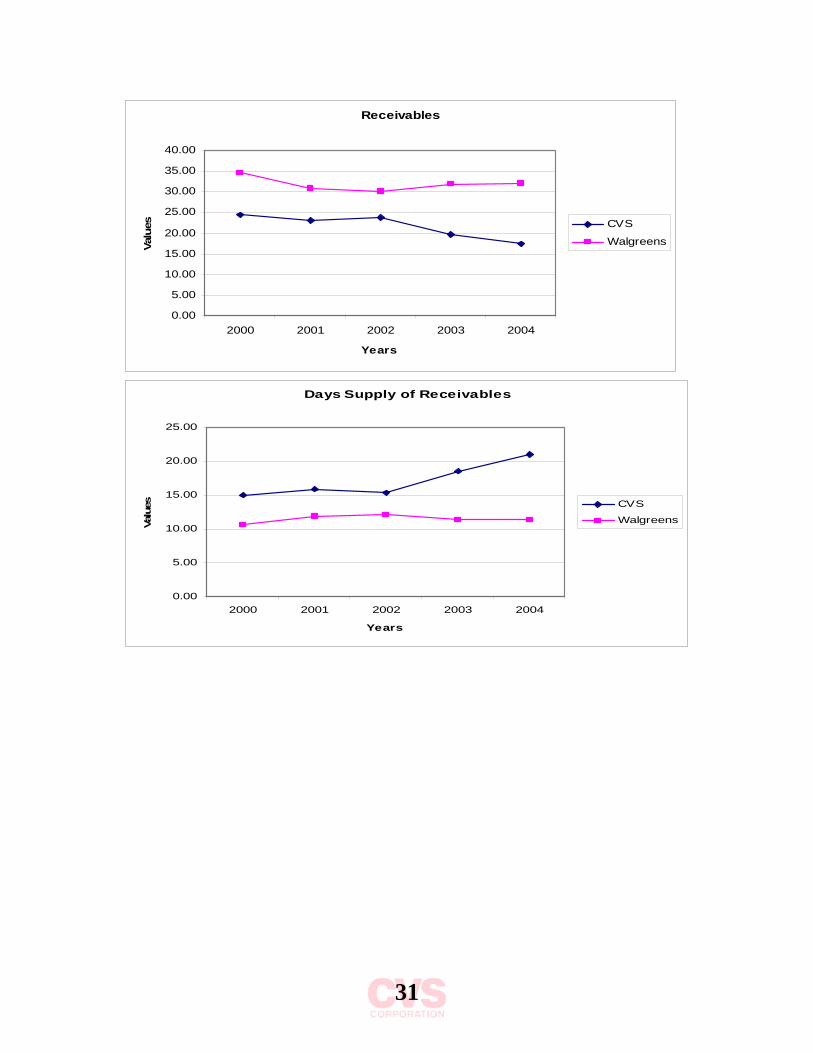
Receivables
0.00
5.00
10.00
15.00
20.00
25.00
30.00
35.00
40.00
2000 2001 2002 2003 2004
Years
Valu
es CVS
Walgreens
Days Supply of Receivables
0.00
5.00
10.00
15.00
20.00
25.00
2000 2001 2002 2003 2004
Years
Valu
es CVS
Walgreens
32
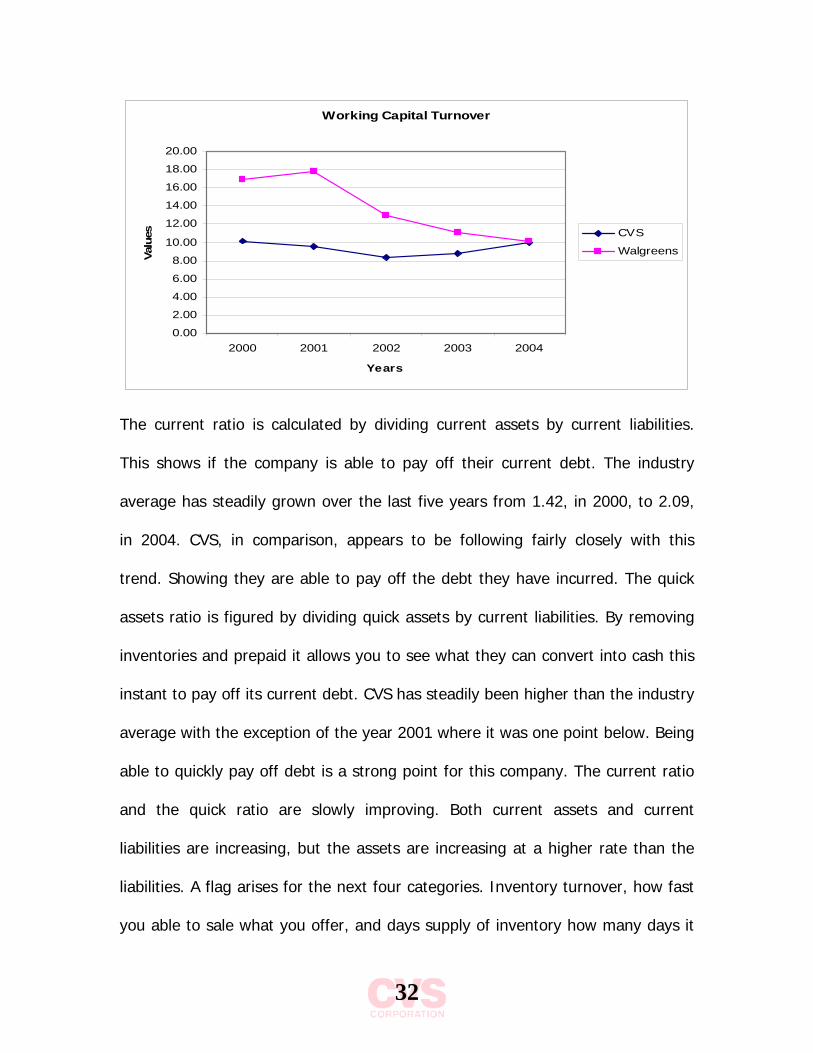
Working Capital Turnover
0.00
2.00
4.00
6.00
8.00
10.00
12.00
14.00
16.00
18.00
20.00
2000 2001 2002 2003 2004
Years
Valu
es CVS
Walgreens
The current ratio is calculated by dividing current assets by current liabilities.
This shows if the company is able to pay off their current debt. The industry
average has steadily grown over the last five years from 1.42, in 2000, to 2.09,
in 2004. CVS, in comparison, appears to be following fairly closely with this
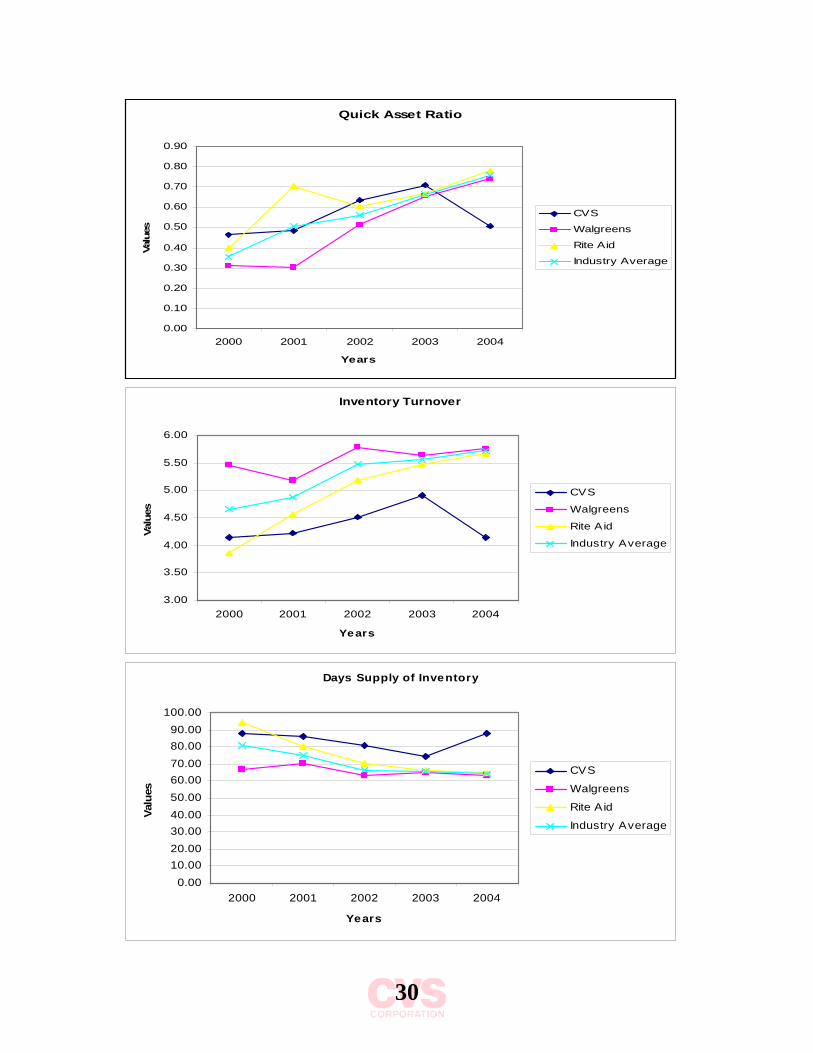
trend. Showing they are able to pay off the debt they have incurred. The quick
assets ratio is figured by dividing quick assets by current liabilities. By removing
inventories and prepaid it allows you to see what they can convert into cash this
instant to pay off its current debt. CVS has steadily been higher than the industry
average with the exception of the year 2001 where it was one point below. Being
able to quickly pay off debt is a strong point for this company. The current ratio
and the quick ratio are slowly improving. Both current assets and current
liabilities are increasing, but the assets are increasing at a higher rate than the
liabilities. A flag arises for the next four categories. Inventory turnover, how fast
you able to sale what you offer, and days supply of inventory how many days it
33
takes in a year to turnover you industry are to low and to long. CVS is gradually
below the industry on turning over their inventory, however they are slowly
moving at an increasing this rate since 2000. Therefore they are above the
industry on the days supply of inventory. In both case this is something to watch
out for. This could be a possible outcome of CVS using FIFO while its competitors
have both chosen to use LIFO. Receivables turnover, how quickly they are able
to collect cash for items on credit. The data for Rite Aid was not available so a
comparison between CVS and Walgreens was performed. CVS is below
Walgreens and is has steadily increased over the last five years. One wonders
why they are having problems collecting cash and should be closely watched for
improvement. Just the reverse holds true for days supply of receivable. They
were gradually increasing the last four years and took a jump this past year,
staying below the competition. This could effect there ability to remain liquid and
should be monitored for improvement. Working capital turnover is taken by
dividing sales by working capital. Working capital is just current assets minus
current liabilities. This shows how efficiently they are using there assets to
produce sales. A steady decrease is occurring between both firms here. CVS falls
short of Walgreens with numbers but this last year the gap between the two
significantly shorten. The industry trend should be watched for improvement.
Overall CVS is increasing is some aspects of their firm while others are falling
short of expectations.
34
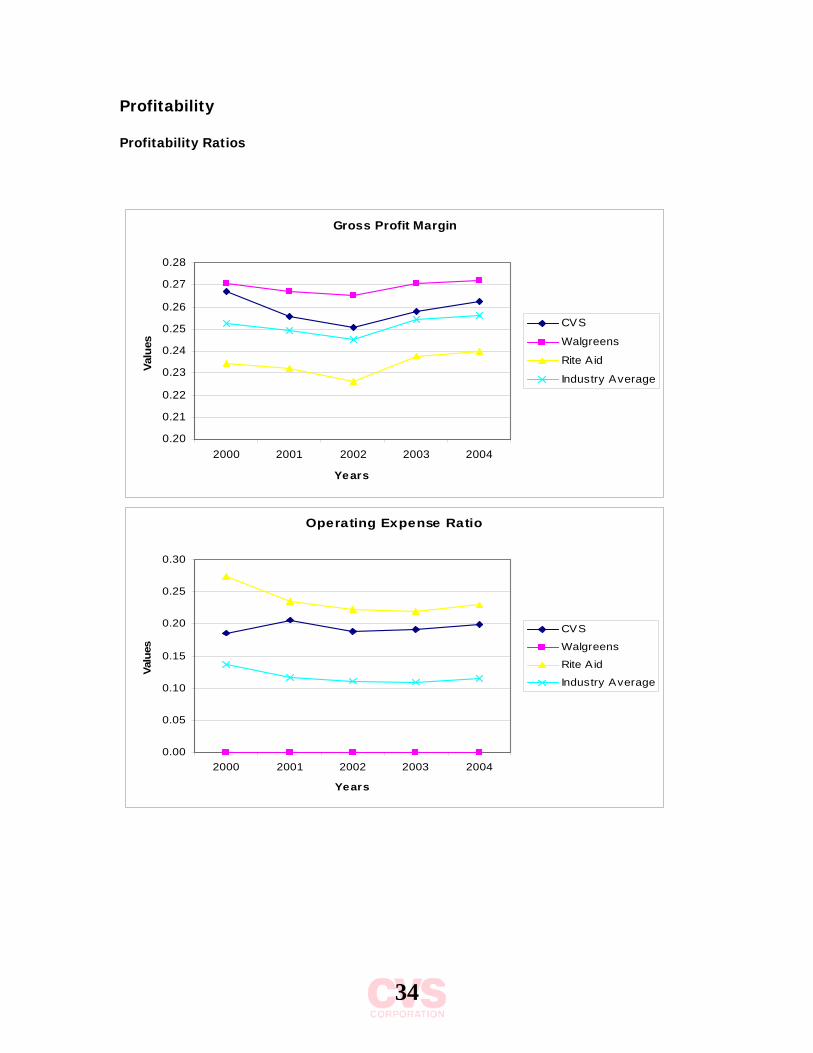
Profitability
Profitability Ratios
Gross Profit Margin
0.20
0.21
0.22
0.23
0.24
0.25
0.26
0.27
0.28
2000 2001 2002 2003 2004
Years
Valu
es
CVS
Walgreens
Rite Aid
Industry Average
Operating Expense Ratio
0.00
0.05
0.10
0.15
0.20
0.25
0.30
2000 2001 2002 2003 2004
Years
Valu
es
CVS
Walgreens
Rite A id
Industry Average
35
Net Profit Margin
-0.12
-0.10
-0.08
-0.06
-0.04
-0.02
0.00
0.02
0.04
0.06
2000 2001 2002 2003 2004
Years
Valu
es
CVS
Walgreens
Rite Aid
Industry Average
Asset Productivity
1.00
1.50
2.00
2.50
3.00
3.50
2000 2001 2002 2003 2004
Years
Valu
es
CVS
Walgreens
Rite Aid
Industry Average
Return on Assets
-0.25
-0.20
-0.15
-0.10
-0.05
0.00
0.05
0.10
0.15
2000 2001 2002 2003 2004
Years
Valu
es
CVS
Walgreens
Rite Aid
Industry Average
36
Return on Equity
0.00
0.10
0.20
2000 2001 2002 2003 2004
Years
Valu
es
CVS
Walgreens
Rite Aid
Industry Average
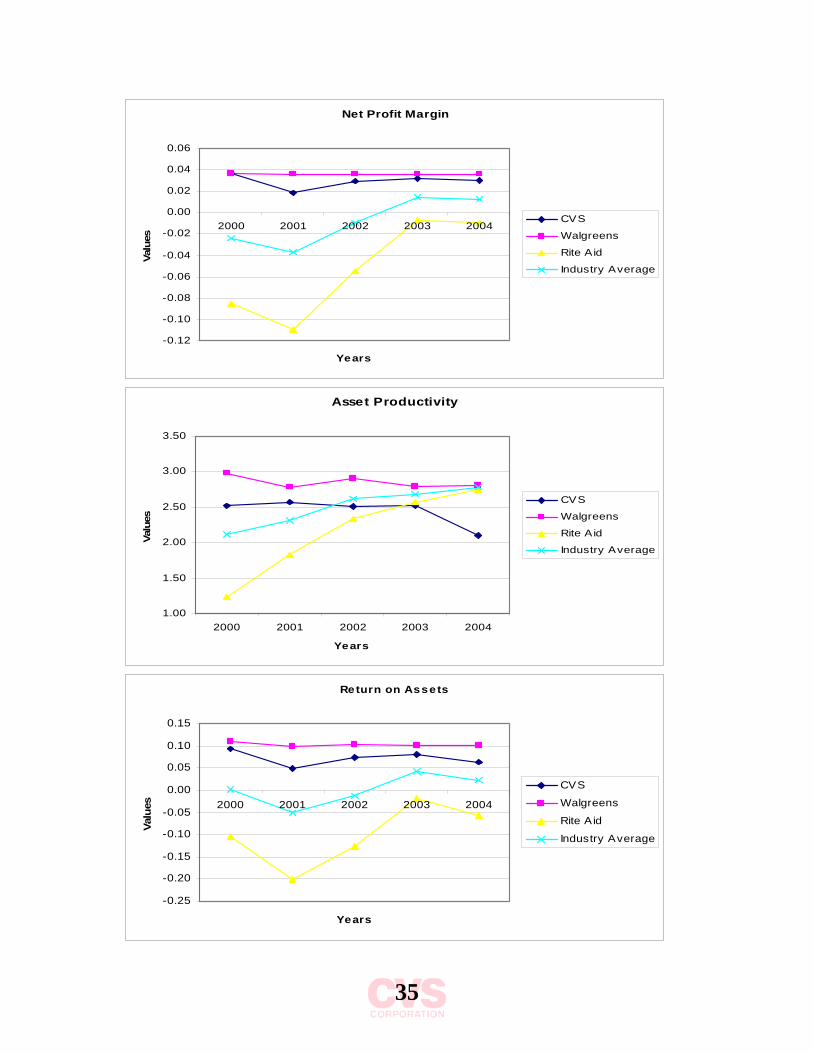
This shows how profitable a company is and if ratios are off it can show if they
are marking up there books to make their company look good. For example, if a
company has much different profitability ratios than the industry average, this
might be a red flag that a firm is manipulating their books. The gross profit
margin shows how much sales are a part of their gross profit. The industry
average is around 25% and our company is right there with a stable rate of
26%. As long as CVS can remain above or with the average this should not be a
problem. The operating expense ratio is found by taking operating expenses
divided by sales. By doing this is shows how much of there sales are a part of
expenses. A steady rate of .19 has held for the past five years, keeping CVS
above the industry average. The last three years CVS has closed in on the
industry but is above its competition by a margin of about .10%. Since they are
able to keep this number stable it is not a concern at this time. The net profit
margin is determined by dividing net income by sales. After everything is
calculated into their income how did that affect their sales? CVS had a stable rate
37
at .04 but in 2002 it dropped to .02, they were able to rise over the last two
years to .03. They are right with their competitor Walgreens and above the
industry average. CVS appears to have a constant Asset Productivity rate around
2.50 staying above the industry the except for the last two years. Asset turnover
is calculated by dividing sales by total assets. CVS appears to have a constant
rate around 2.50 staying above the industry the except for the last two years.
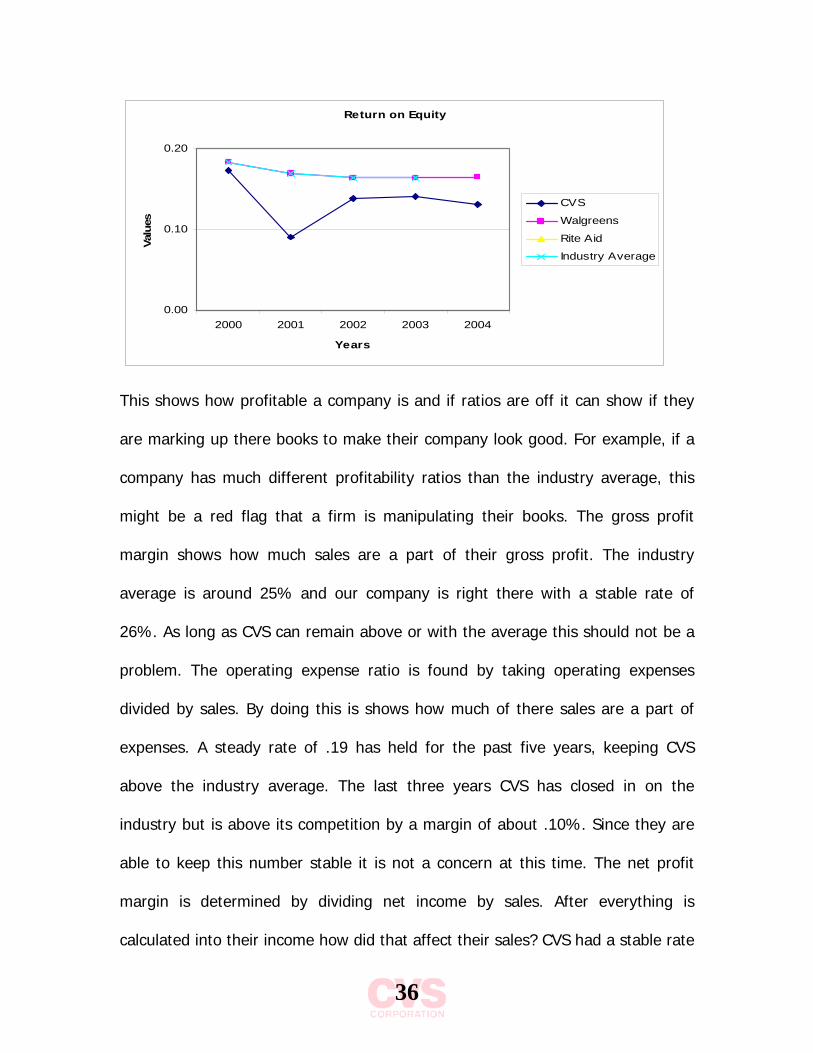
Return on equity figured by dividing net income by equity show that CVS had
slightly decreasing returns on equity. CVS had slightly decreasing returns on
equity. A high ROE is favorable because it means that net income is larger in
comparison to equity. This shows the profitability of CVS is going down. There
was a large drop in return on equity in 2001 for CVS, but the industry was not
affected.
Capital Structure
Debt to Equity
0.00
1.00
2.00
3.00
4.00
5.00
2000 2001 2002 2003 2004
Years
Valu
es
CVS
Walgreens
Rite Aid
Industry Average
38
Times Interest Earned
-5.00
0.00
5.00
10.00
15.00
20.00
25.00
30.00
35.00
40.00
2000 2001 2002 2003 2004
Years
Valu
es
CVS
Walgreens
Rite Aid
Indus try Average
Debt Service Margin
-0.40
-0.20
0.00
0.20
0.40
0.60
0.80
1.00
1.20
1.40
1.60
2000 2001 2002 2003 2004
Years
Valu
es
CVS
Walgreens
Rite Aid
Industry Average
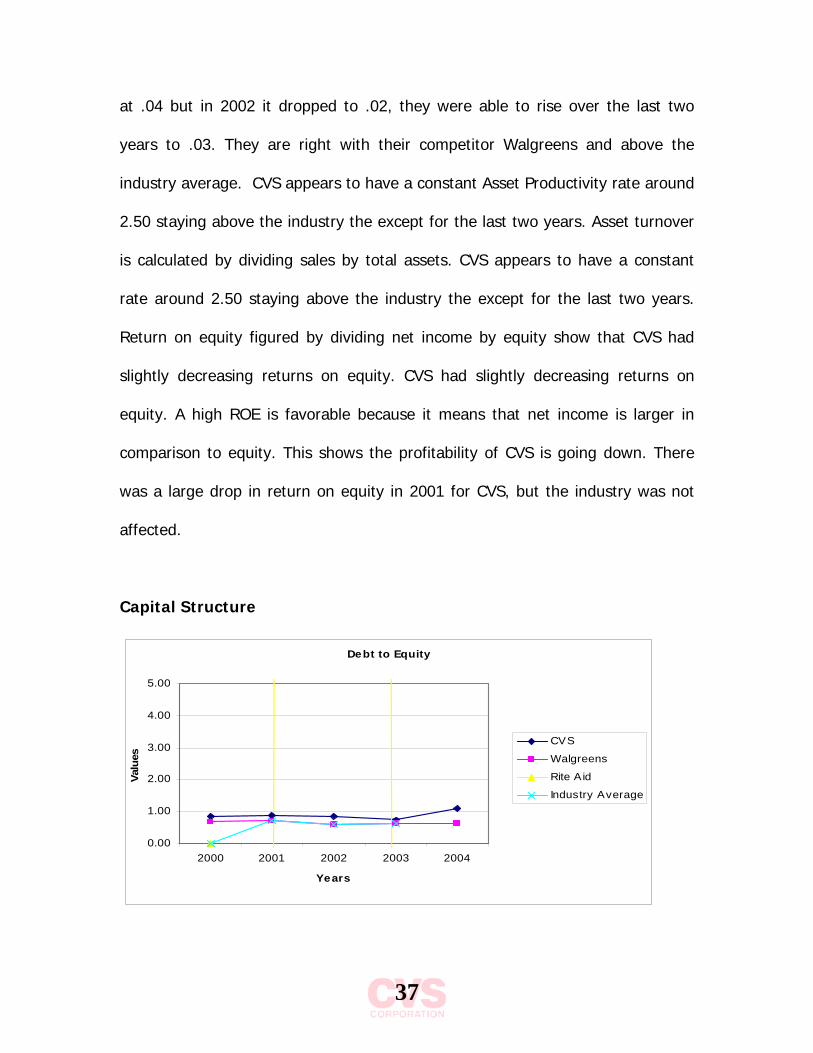
The debt to equity ratio is determined by dividing total liabilities by owner’s
equity. A small ratio is better because it shows that the company is financed by
methods other than debt. CVS has a decreasing debt to equity ratio but so does
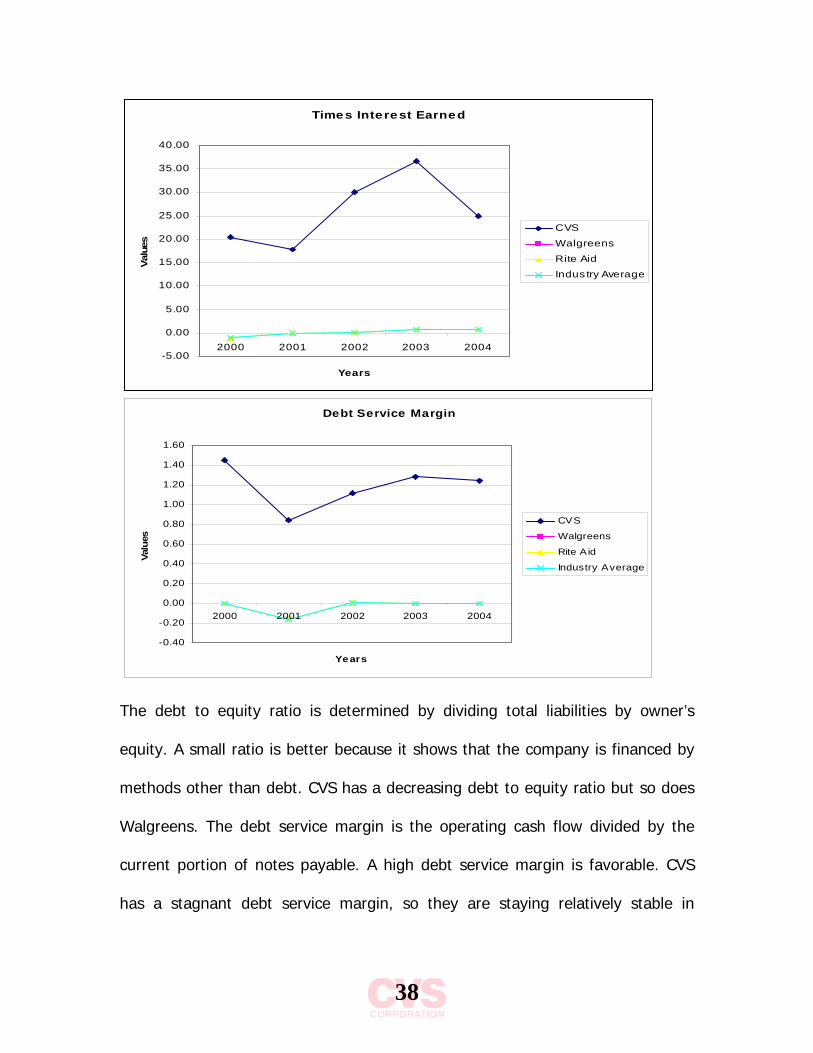
Walgreens. The debt service margin is the operating cash flow divided by the
current portion of notes payable. A high debt service margin is favorable. CVS
has a stagnant debt service margin, so they are staying relatively stable in
39
respect to their operating cash flows and current notes payable. The industry’s
numbers were unavailable, so CVS cannot be compared to anyone else.
Times interest earned is net income before interest and taxes divided by interest
expense. It is favorable to have higher net income compared to interest
expenses, so a larger number is favorable. CVS has an improving times interest
earned because it is getting larger. Rite Aid’s is also increasing, but it is very
small compared to CVS.
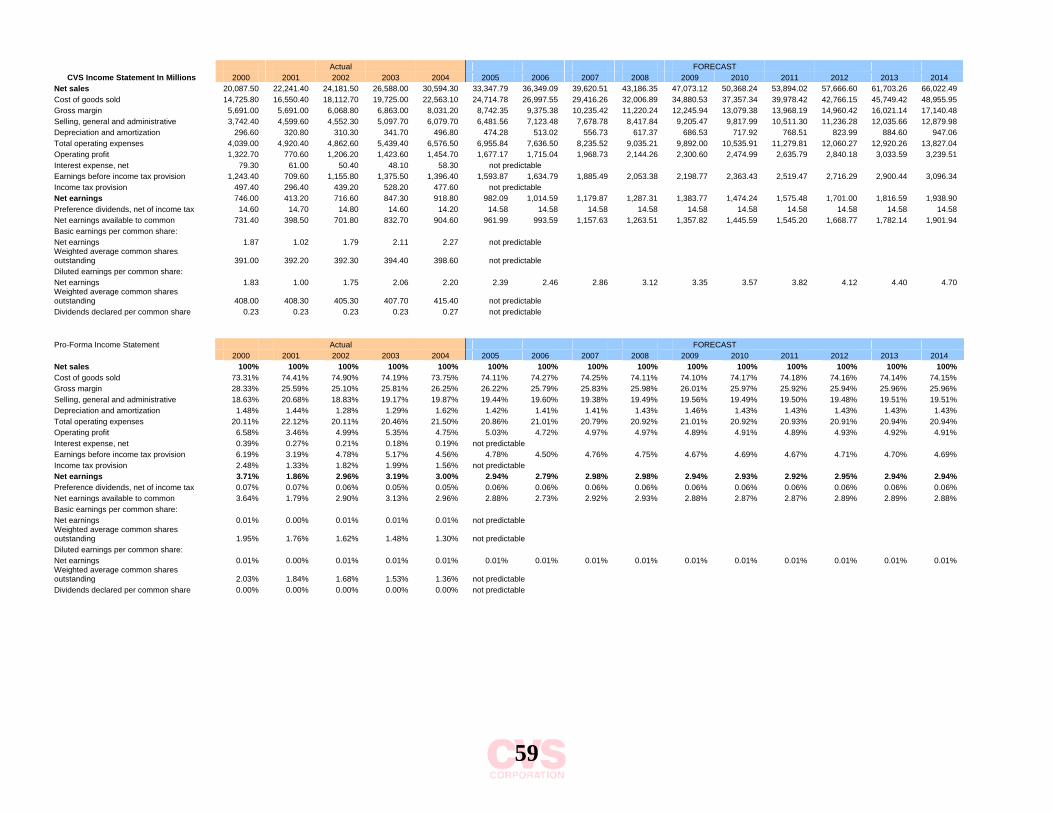
Financial Statement Forecasting Methodology:
Income Statement
The most important part of accurately forecasting a company’s future financials
is determining the sustainable growth rate. By analyzing the past 5 years’ net
income and dividend payout ratio we determined that the sustainable growth
rate (SGR) for our company will be around 9 percent. For the past five years CVS
had a growth rate around six percent and for 2003, it had a nine percent rate.
The Yahoo Finance website (www.finance.yahoo.com) predicted a growth rate
around 13 percent for the next five years. The acquisition of Eckerd was
completed in 2004, so we took into account the possible effects this will have on
CVS in the years to come. Because of this, CVS will most likely experience some
growth, so we figured that a rate of six percent was too low. We also felt that 13
was a very aggressive rate. Therefore we determined that a good growth rate for
40
2005 through 2009 would be 9 percent and for 2010 through 20014 would be 7
percent. It would be impossible for CVS to grow indefinitely, so it will most likely
level off in the distant future. In 2001 sales were negatively impacted by
pharmacy shortages. Many patents for brand name drugs began to expire in
2003, causing CVS to get a smaller profit margin on these items. This is because
generic drugs (with small profit margins) became available for sale, causing the
margin on the comparable brand name drugs to decrease in order to adequately
compete. Another incidence like this is not predictable, so it is safe to assume
the growth rates will be higher than in these years. We were unable to
determine a maximum sustainable growth rate because CVS does not pay
dividends.
For the most part, we used averages to forecast our pro forma income
statement. All of the data was taken 5 years back and will be forecasted 10 years
into the future. A conservative approach was taken when predicting the numbers
for future years.
For predicting the pro forma balance sheet a conservative approach was also
taken. The same method was applied over all the categories in this statement.
First a trend or pattern was established then an educated estimate was
determined.
41
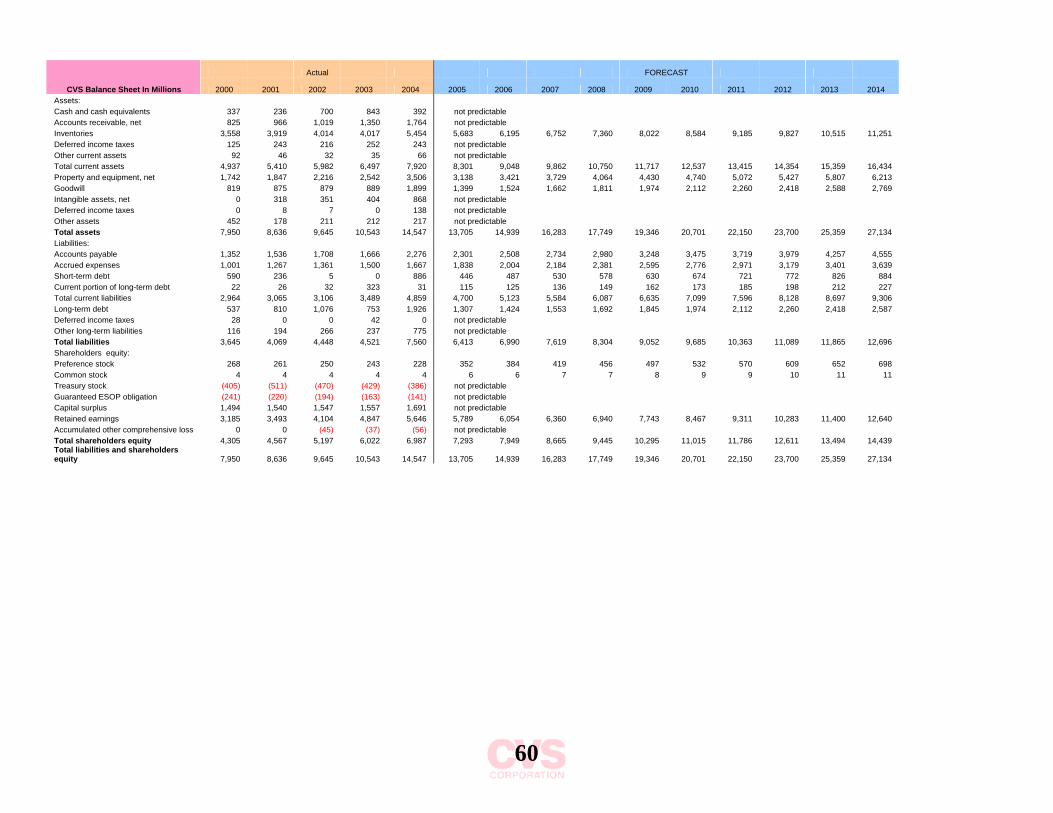
Balance Sheet
The Balance Sheet, like the Income Statement, was forecasted over the next ten
years. The methods for forecasting used were the average method, which is the
past five year’s data added together and divided by five, and the average-
difference method.
To predict future total assets, we computed assets as a percentage of sales
because sales have already been predicted. Then we averaged these
percentages to make assets 41.1 percent of sales for the next ten years. The
numbers we came up with for total assets will also be used as the forecasted
liabilities plus stockholder’s equity as these two numbers are always equal. To
come up with liabilities, we used the pro forma number (liabilities as a
percentage of assets). To get the equity section of the balance sheet, we used
the average of the pro forma numbers, with the exception of retained earnings
and other comprehensive loss. Retained earnings must equal the beginning
balance in retained earnings (last year’s RE) plus this year’s expected net
income, minus this year’s expected amount of dividend payment. The other
comprehensive loss was used as a plug to ensure that owner’s equity and
liabilities add up to total assets.
Even though these are good estimates taken from past years and applied
towards the future years, it’s impossible to predict major events that may occur.
42
While valuing a company, and especially forecasting, we have to keep this in
mind. We certainly hope that unfortunate events do not occur and throw off all
our predictions.
Statement of Cash Flows
To forecast the next 10 years of CVS’ cash flows we made a pro-forma CF sheet
for 2000 to 2004. Each line item in cash flows from operating activities was
divided by total CFFO, the line items in cash flows from investing activities were
divided by total CFFI, and the items in cash flows from financing activities were
divided by total CFFF. The total CFFO, CFFI, and CFFF were each divided by
cash and cash equivalents at the end of the year. An average of 2000 to 2004’s
pro forma percentages was used to forecast the CFFO, CFFI, and CFFF for years
2005 to 2014. This average was multiplied by the forecasted cash and cash
equivalents number to arrive at each of the line items of the cash flow
statement. Many of the items were not able to be forecasted because they are
influenced by unpredictable events. For the dividends paid we took the actual
five years data and used a moving average of a five year period to forecast the
next ten years. To get Additions to PP&E, we found the growth rate of PP&E
each year and determined those numbers to be the additions to PP&E. In order
to determine the cash flows from investing activities, we added Additions to
PP&E to Acquisitions Net of Cash, because these were the only predictable
numbers in this section.
43
Valuation Analysis
The purpose of this section is to determine the value of CVS. With the use of six
methods, we are able to determine if CVS is overvalued, undervalued, or
accurately valued. The six methods we have used to value CVS include the
following: method of comparables, discounted dividends, discounted free cash
flows, discounted residual income, abnormal earnings growth, long run average
residual income perpetuity based on the price to book ratio. The Ford Epic
valuation of CVS is $45.89. These methods allow us to view the firm with respect
to a variety of different aspects of the firm’s performance, and determine
whether it would be a good investment.
Comparables
The comparables method is the only non-intrinsic method of valuation we use;
this means that it does not only use information about the company to determine
its current value. It uses the industry average of certain ratios to determine the
company’s ideal stock price. The ratios used in comparing CVS to the industry
are the price to equity ratio (forward and trailing), price to book, dividend price
ratio, price to sales ratio, and the price earnings growth model. The closest
competitors to CVS in the retail pharmacy industry are Walgreen’s, Rite Aid, and
Wal-Mart.
44
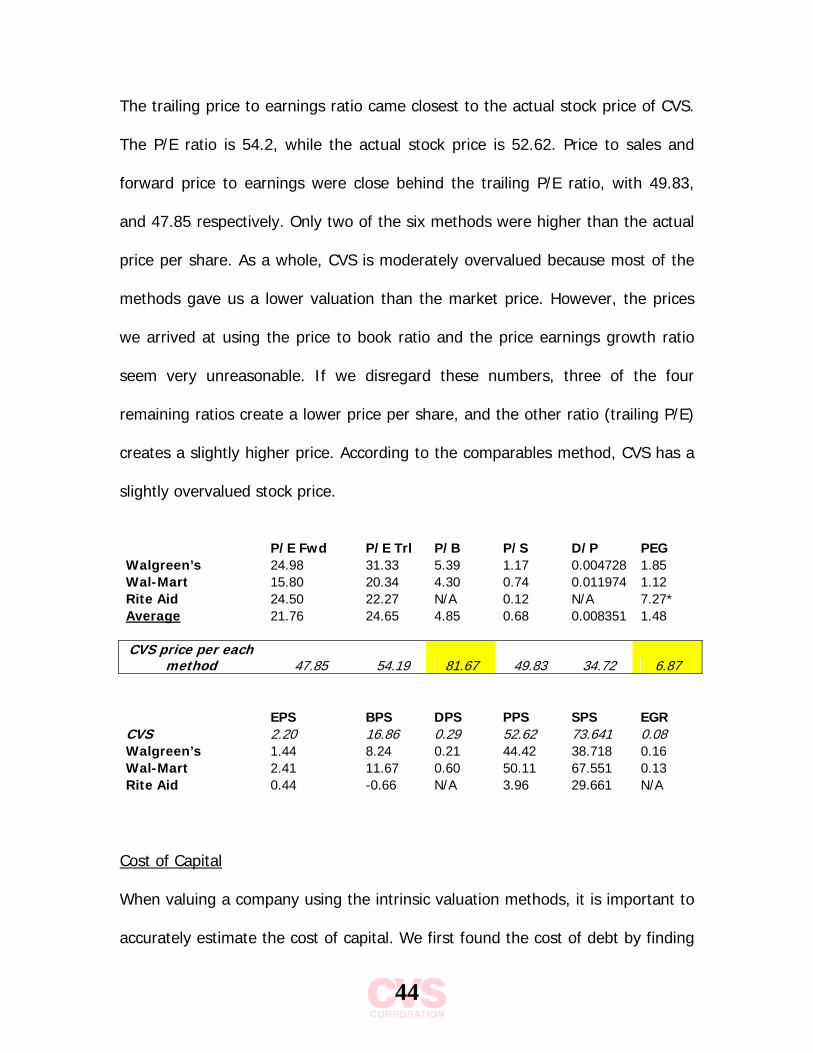
The trailing price to earnings ratio came closest to the actual stock price of CVS.
The P/E ratio is 54.2, while the actual stock price is 52.62. Price to sales and
forward price to earnings were close behind the trailing P/E ratio, with 49.83,
and 47.85 respectively. Only two of the six methods were higher than the actual
price per share. As a whole, CVS is moderately overvalued because most of the
methods gave us a lower valuation than the market price. However, the prices
we arrived at using the price to book ratio and the price earnings growth ratio
seem very unreasonable. If we disregard these numbers, three of the four
remaining ratios create a lower price per share, and the other ratio (trailing P/E)
creates a slightly higher price. According to the comparables method, CVS has a
slightly overvalued stock price.
P/E Fwd P/E Trl P/B P/S D/P PEG Walgreen’s 24.98 31.33 5.39 1.17 0.004728 1.85 Wal-Mart 15.80 20.34 4.30 0.74 0.011974 1.12 Rite Aid 24.50 22.27 N/A 0.12 N/A 7.27* Average 21.76 24.65 4.85 0.68 0.008351 1.48 CVS price per each
method 47.85 54.19 81.67 49.83 34.72 6.87 EPS BPS DPS PPS SPS EGR CVS 2.20 16.86 0.29 52.62 73.641 0.08 Walgreen’s 1.44 8.24 0.21 44.42 38.718 0.16 Wal-Mart 2.41 11.67 0.60 50.11 67.551 0.13 Rite Aid 0.44 -0.66 N/A 3.96 29.661 N/A
Cost of Capital
When valuing a company using the intrinsic valuation methods, it is important to
accurately estimate the cost of capital. We first found the cost of debt by finding
45
a weighted value of each debt item. Then we found the interest rates charged on
each item and multiplied that by the weighted value. The product of these
numbers was added up to arrive at the weighted average cost of debt. This is
what we used in the valuation models as the cost of debt for CVS.
The cost of equity was found by using the Capital Asset Pricing Model (CAPM)
formula:
Rj= Rf + βj(Rm –Rf)
We found the risk free rate by averaging the past five year’s treasury bill monthly
yields, then multiplied it by 12 to get a yearly rate of 4.046 percent.
(http://research.stlouisfed.org)
The market premium was found by subtracting the risk-free rate from the
average market yield from the past five years. The firm’s beta was found by
getting the slope of the firm’s past five year’s returns. For each variable
estimated, we used a five year span because we are trying to value the company
on a long-term basis. Most individual stock investments are held over the span of
many years. We also believe that it is unreasonable to consider any amount of
time less than five years to be a trend. We determined CVS to have a cost of
equity of 5.501 percent. (http://finance.yahoo.com)
46
Discounted Dividends and Discounted Free Cash Flow Methods
The discounted dividend method and the discounted free cash flow method are
very similar. The only difference between the two methods of valuation is in the
item forecasted. For the discounted dividends method, we forecast the amount
of dividends to be paid over the next ten years; and for the free cash flow
method, we forecast the amount of free cash flows to be paid over the next ten
years. We arrive at the number used for free cash flow by subtracting cash flows
from operating activities by cash flows from investing activities in each year from
2005 to 20014. To discount these numbers back to the 2004 dollars, we multiply
by the present value multiplier. Next we get the sum of the present values of the
dividends for the DD method and the sum of the present values of the free cash
flows for the FCF method. If there is a perpetual growth rate for year 20015 and
beyond, the terminal value must be computed, discounted back to 2004, and
added to the sum of the present value of the dividends (or free cash flows). We
arrive at the terminal value in 2014 dollars by dividing the perpetual dividend
(free cash flow) amount by the cost of capital less the perpetual growth rate.
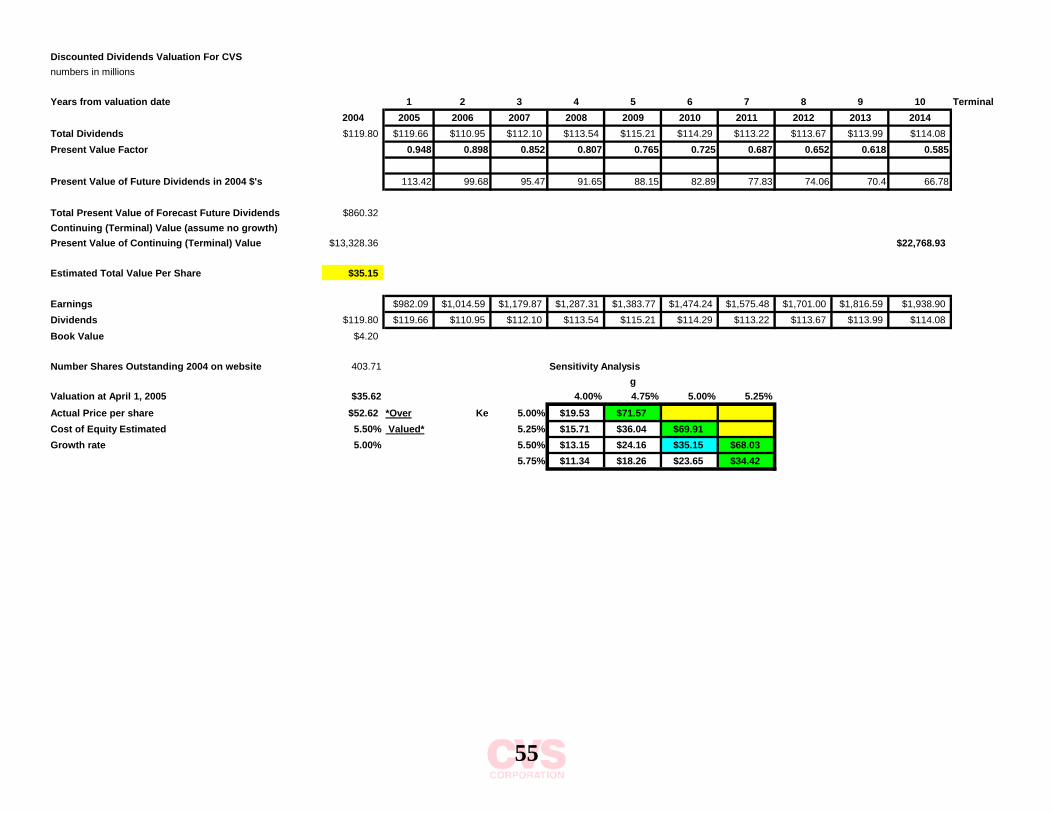
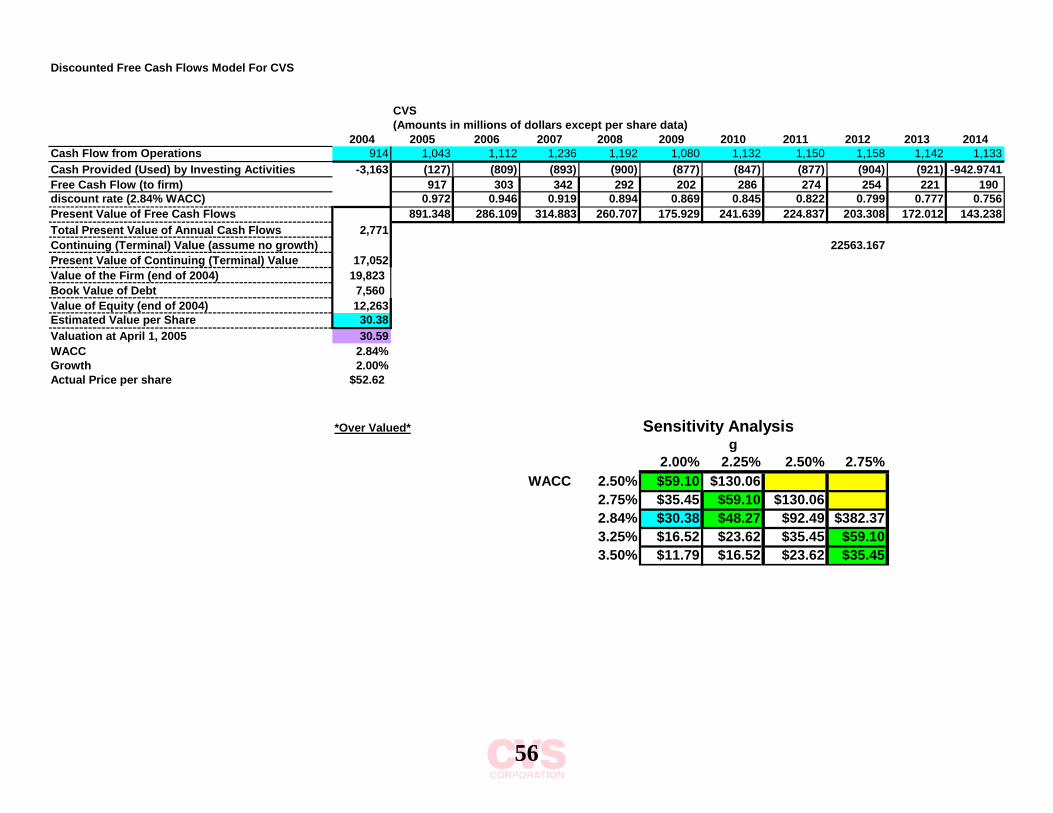
Once we determine the total present value of all the future dividends (free cash
flows) we divide by the firm’s number of shares outstanding. This gives us the
intrinsic value of CVS to date, which is $35.15 per share according to the
discounted dividends method. The free cash flow method gave us an intrinsic
value of $30.38. Both of these methods indicate that CVS is overvalued.
47
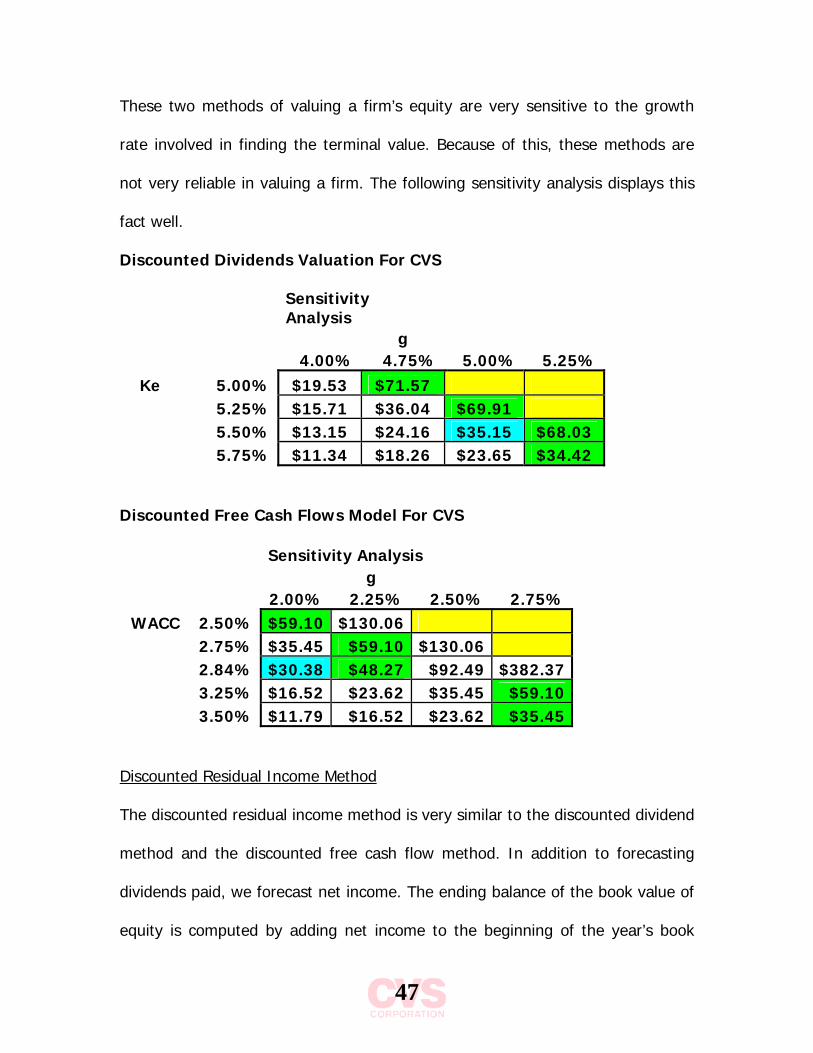
These two methods of valuing a firm’s equity are very sensitive to the growth
rate involved in finding the terminal value. Because of this, these methods are
not very reliable in valuing a firm. The following sensitivity analysis displays this
fact well.
Discounted Dividends Valuation For CVS
Sensitivity Analysis
g 4.00% 4.75% 5.00% 5.25%
Ke 5.00% $19.53 $71.57 5.25% $15.71 $36.04 $69.91 5.50% $13.15 $24.16 $35.15 $68.03 5.75% $11.34 $18.26 $23.65 $34.42
Discounted Free Cash Flows Model For CVS Sensitivity Analysis g 2.00% 2.25% 2.50% 2.75%WACC 2.50% $59.10 $130.06
2.75% $35.45 $59.10 $130.06 2.84% $30.38 $48.27 $92.49 $382.37 3.25% $16.52 $23.62 $35.45 $59.10 3.50% $11.79 $16.52 $23.62 $35.45
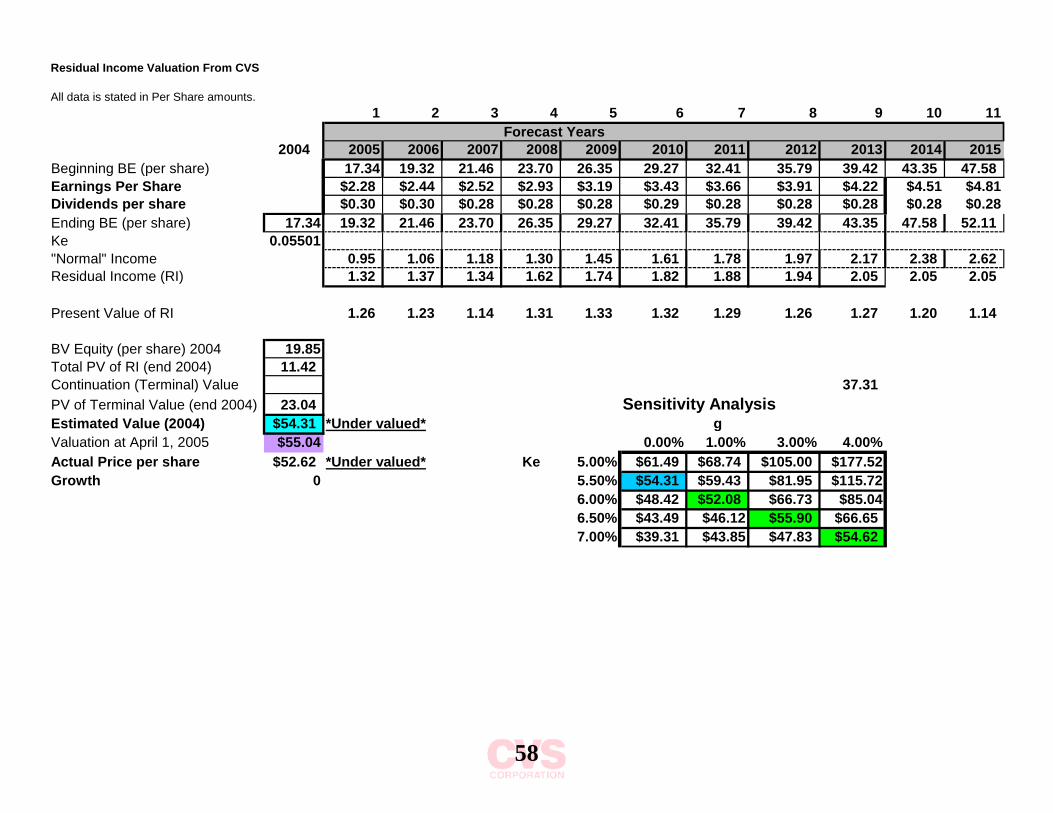
Discounted Residual Income Method
The discounted residual income method is very similar to the discounted dividend
method and the discounted free cash flow method. In addition to forecasting
dividends paid, we forecast net income. The ending balance of the book value of
equity is computed by adding net income to the beginning of the year’s book
48
value of equity and subtracting the amount of dividends paid. To get the amount
of residual income, we multiply the cost of equity by the ending book value of
equity that we just computed. Adding the sum of the present values of the
residual income to the 2004 book value of equity will give us the current value of
the firm’s equity. Next we add in the terminal value of the perpetuity and divide
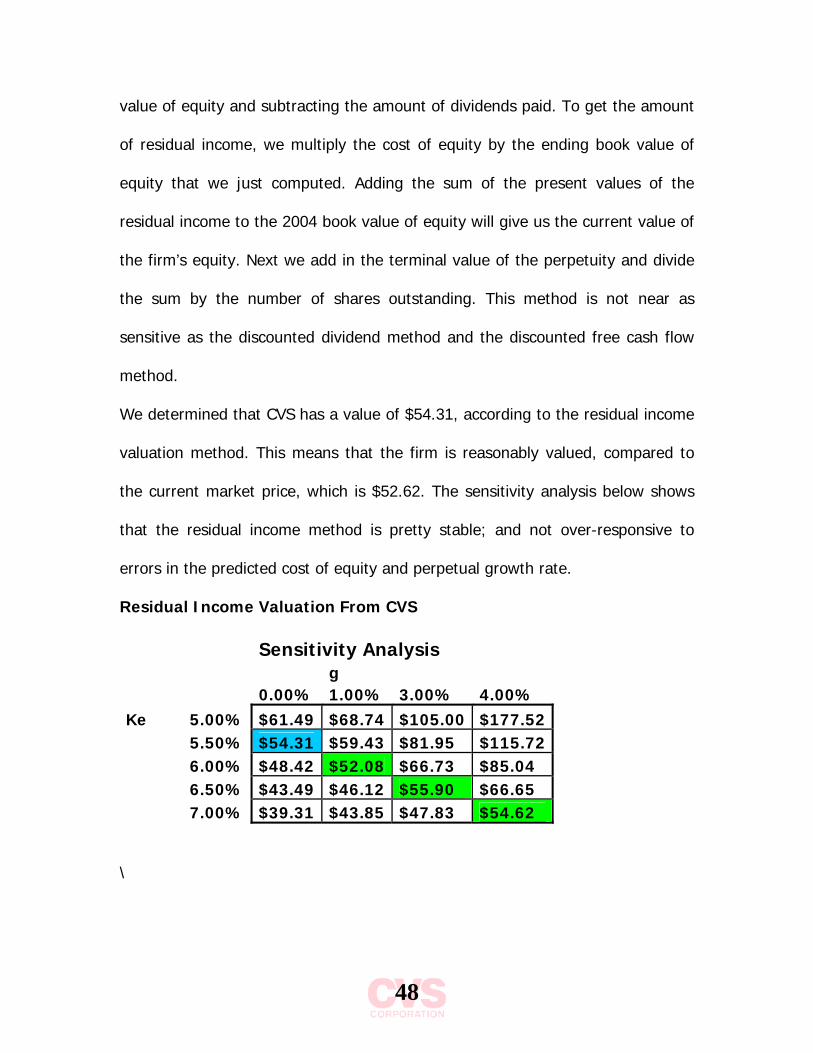
the sum by the number of shares outstanding. This method is not near as
sensitive as the discounted dividend method and the discounted free cash flow
method.
We determined that CVS has a value of $54.31, according to the residual income
valuation method. This means that the firm is reasonably valued, compared to
the current market price, which is $52.62. The sensitivity analysis below shows
that the residual income method is pretty stable; and not over-responsive to
errors in the predicted cost of equity and perpetual growth rate.
Residual Income Valuation From CVS
Sensitivity Analysis g 0.00% 1.00% 3.00% 4.00% Ke 5.00% $61.49 $68.74 $105.00 $177.52 5.50% $54.31 $59.43 $81.95 $115.72 6.00% $48.42 $52.08 $66.73 $85.04 6.50% $43.49 $46.12 $55.90 $66.65 7.00% $39.31 $43.85 $47.83 $54.62
\
49
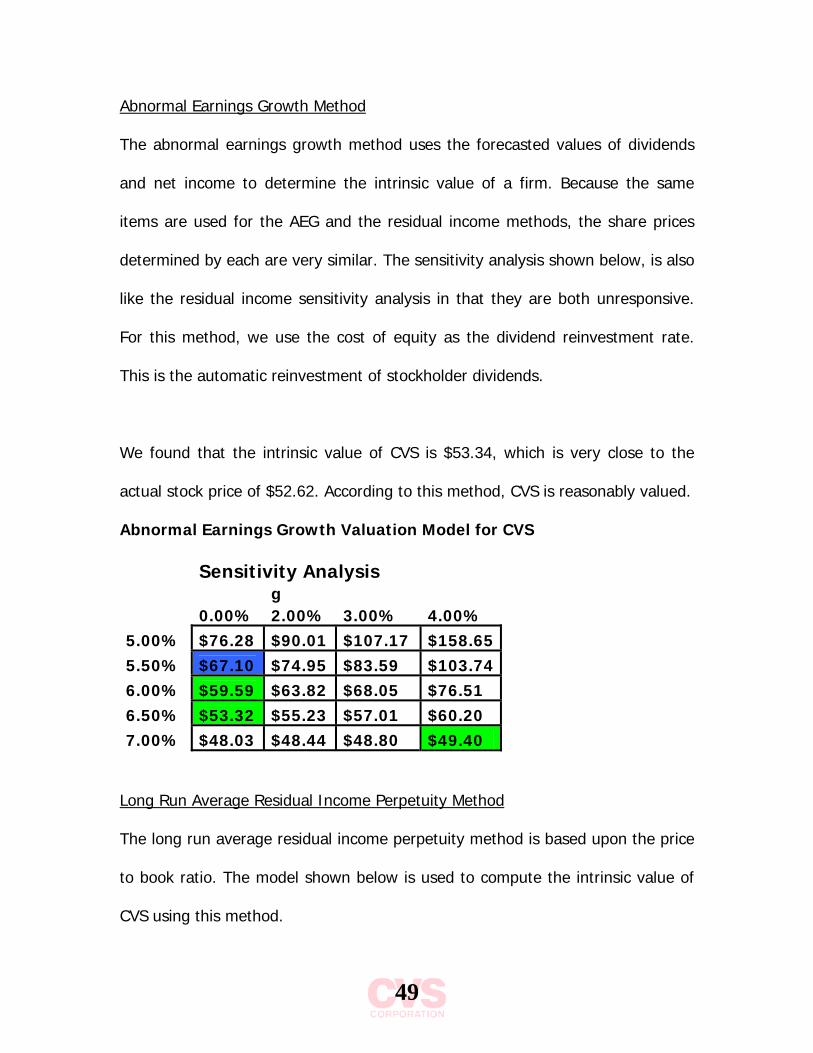
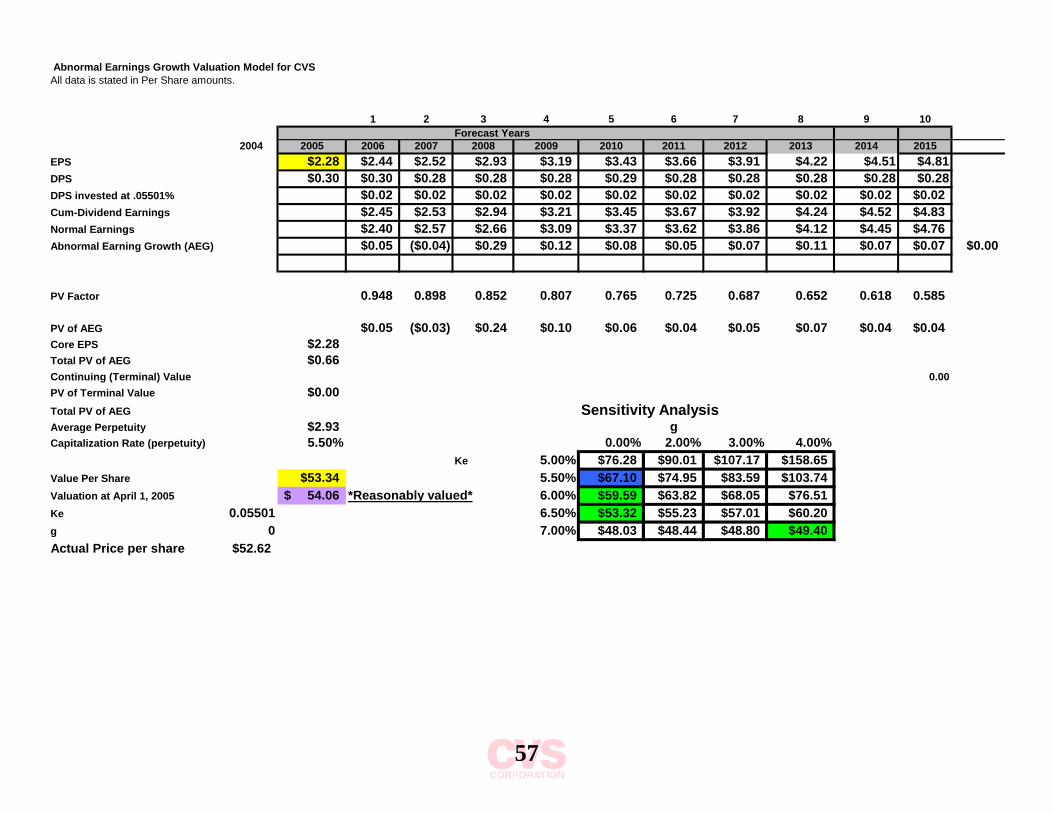
Abnormal Earnings Growth Method
The abnormal earnings growth method uses the forecasted values of dividends
and net income to determine the intrinsic value of a firm. Because the same
items are used for the AEG and the residual income methods, the share prices
determined by each are very similar. The sensitivity analysis shown below, is also
like the residual income sensitivity analysis in that they are both unresponsive.
For this method, we use the cost of equity as the dividend reinvestment rate.
This is the automatic reinvestment of stockholder dividends.
We found that the intrinsic value of CVS is $53.34, which is very close to the
actual stock price of $52.62. According to this method, CVS is reasonably valued.
Abnormal Earnings Growth Valuation Model for CVS Sensitivity Analysis g 0.00% 2.00% 3.00% 4.00% 5.00% $76.28 $90.01 $107.17 $158.65 5.50% $67.10 $74.95 $83.59 $103.74 6.00% $59.59 $63.82 $68.05 $76.51 6.50% $53.32 $55.23 $57.01 $60.20 7.00% $48.03 $48.44 $48.80 $49.40
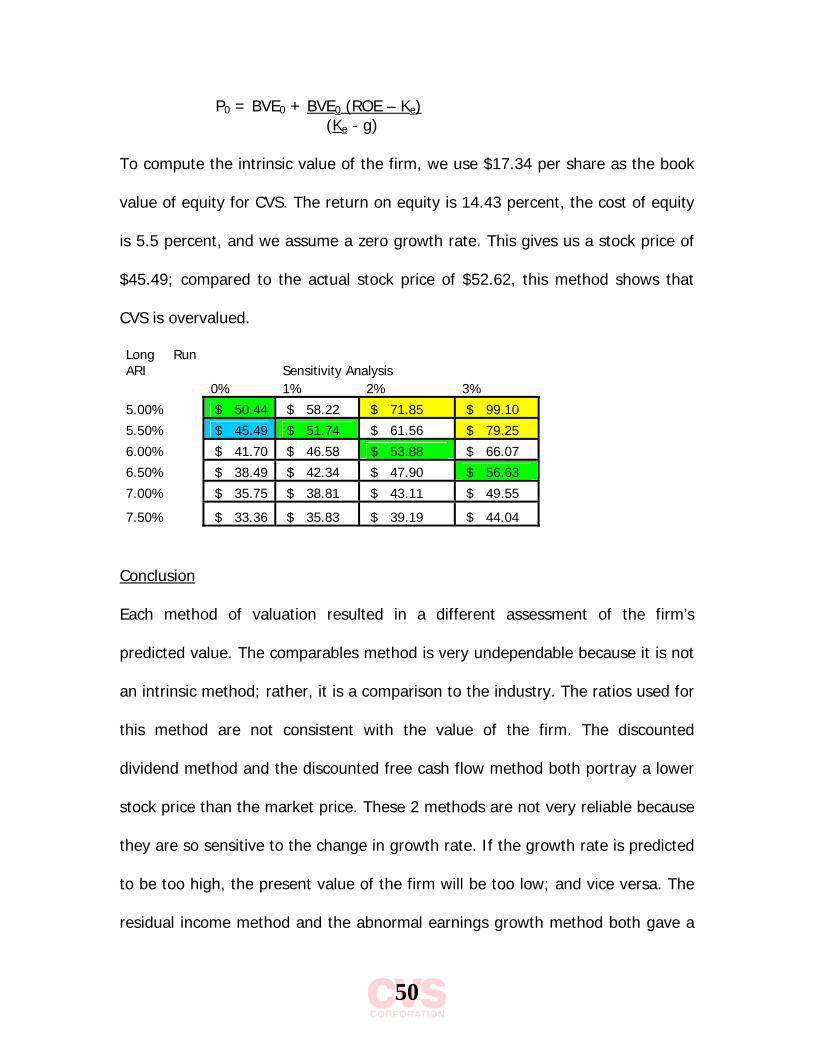
Long Run Average Residual Income Perpetuity Method
The long run average residual income perpetuity method is based upon the price
to book ratio. The model shown below is used to compute the intrinsic value of
CVS using this method.
50
P0 = BVE0 + BVE0 (ROE – Ke) (Ke - g)
To compute the intrinsic value of the firm, we use $17.34 per share as the book
value of equity for CVS. The return on equity is 14.43 percent, the cost of equity
is 5.5 percent, and we assume a zero growth rate. This gives us a stock price of
$45.49; compared to the actual stock price of $52.62, this method shows that
CVS is overvalued.
Long Run ARI Sensitivity Analysis 0% 1% 2% 3%
5.00% $ 50.44 $ 58.22 $ 71.85 $ 99.10
5.50% $ 45.49 $ 51.74 $ 61.56 $ 79.25
6.00% $ 41.70 $ 46.58 $ 53.88 $ 66.07
6.50% $ 38.49 $ 42.34 $ 47.90 $ 56.63
7.00% $ 35.75 $ 38.81 $ 43.11 $ 49.55
7.50% $ 33.36 $ 35.83 $ 39.19 $ 44.04
Conclusion
Each method of valuation resulted in a different assessment of the firm’s
predicted value. The comparables method is very undependable because it is not
an intrinsic method; rather, it is a comparison to the industry. The ratios used for
this method are not consistent with the value of the firm. The discounted
dividend method and the discounted free cash flow method both portray a lower
stock price than the market price. These 2 methods are not very reliable because
they are so sensitive to the change in growth rate. If the growth rate is predicted
to be too high, the present value of the firm will be too low; and vice versa. The
residual income method and the abnormal earnings growth method both gave a
51
very reasonable assessment of the intrinsic value of CVS. These two methods
prove to be the most reliable way to value a company because they use items
that are easy to accurately forecast. Also, the sensitivity analysis of these
methods is not very responsive to a change in the cost of capital and growth
rate. After analyzing each method of valuation, we can assume that CVS would
be a reasonable investment at its current market price.
52
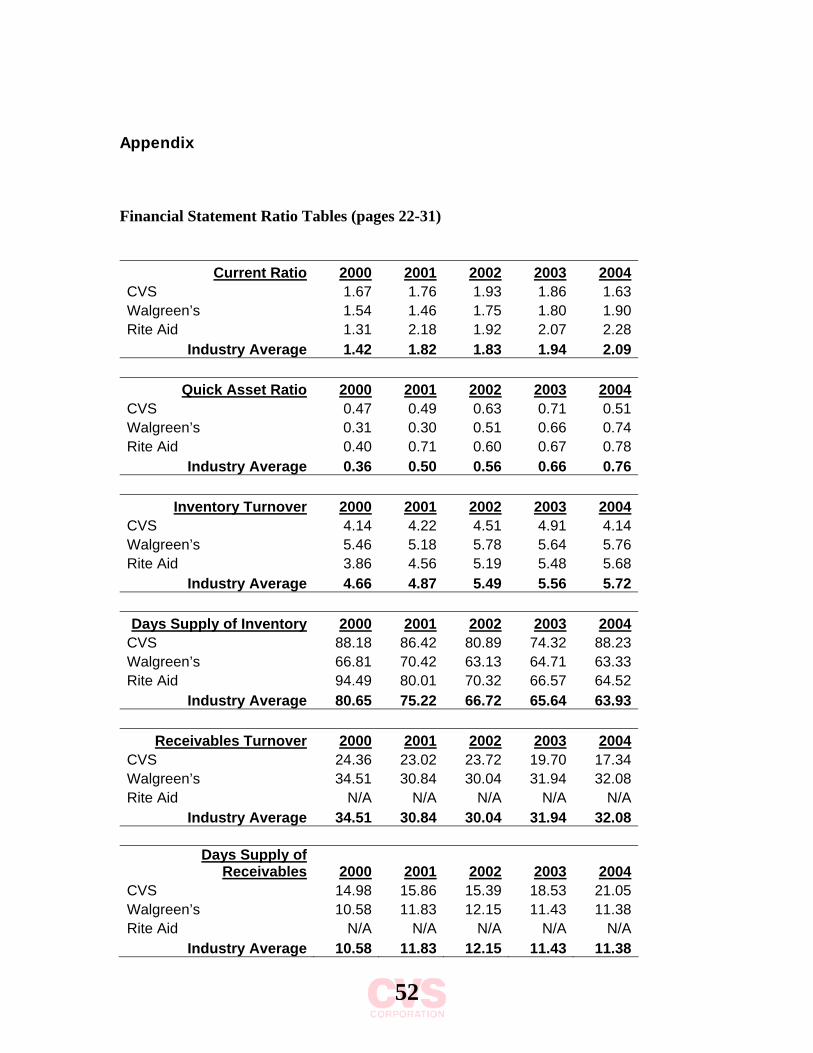
Appendix Financial Statement Ratio Tables (pages 22-31)
Current Ratio 2000 2001 2002 2003 2004 CVS 1.67 1.76 1.93 1.86 1.63 Walgreen’s 1.54 1.46 1.75 1.80 1.90 Rite Aid 1.31 2.18 1.92 2.07 2.28
Industry Average 1.42 1.82 1.83 1.94 2.09
Quick Asset Ratio 2000 2001 2002 2003 2004 CVS 0.47 0.49 0.63 0.71 0.51 Walgreen’s 0.31 0.30 0.51 0.66 0.74 Rite Aid 0.40 0.71 0.60 0.67 0.78
Industry Average 0.36 0.50 0.56 0.66 0.76
Inventory Turnover 2000 2001 2002 2003 2004 CVS 4.14 4.22 4.51 4.91 4.14 Walgreen’s 5.46 5.18 5.78 5.64 5.76 Rite Aid 3.86 4.56 5.19 5.48 5.68
Industry Average 4.66 4.87 5.49 5.56 5.72 Days Supply of Inventory 2000 2001 2002 2003 2004
CVS 88.18 86.42 80.89 74.32 88.23 Walgreen’s 66.81 70.42 63.13 64.71 63.33 Rite Aid 94.49 80.01 70.32 66.57 64.52
Industry Average 80.65 75.22 66.72 65.64 63.93
Receivables Turnover 2000 2001 2002 2003 2004 CVS 24.36 23.02 23.72 19.70 17.34 Walgreen’s 34.51 30.84 30.04 31.94 32.08 Rite Aid N/A N/A N/A N/A N/A
Industry Average 34.51 30.84 30.04 31.94 32.08
Days Supply of Receivables 2000 2001 2002 2003 2004
CVS 14.98 15.86 15.39 18.53 21.05 Walgreen’s 10.58 11.83 12.15 11.43 11.38 Rite Aid N/A N/A N/A N/A N/A
Industry Average 10.58 11.83 12.15 11.43 11.38
53
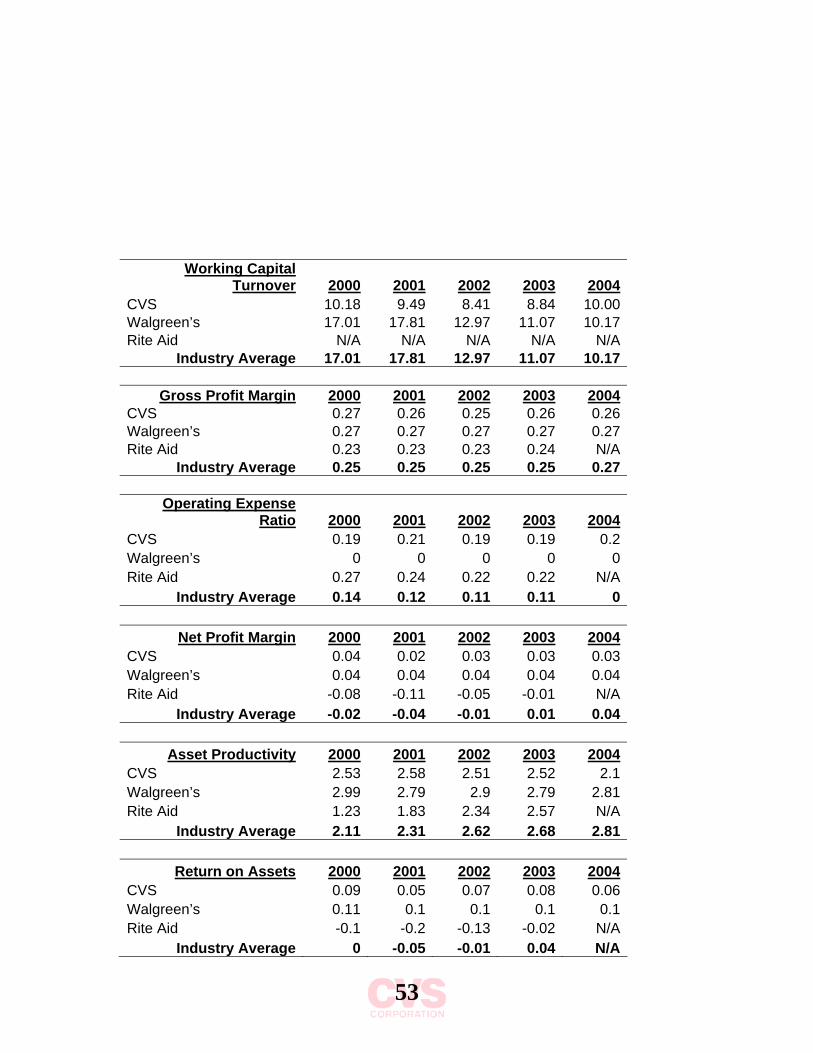
Working Capital
Turnover 2000 2001 2002 2003 2004 CVS 10.18 9.49 8.41 8.84 10.00 Walgreen’s 17.01 17.81 12.97 11.07 10.17 Rite Aid N/A N/A N/A N/A N/A
Industry Average 17.01 17.81 12.97 11.07 10.17
Gross Profit Margin 2000 2001 2002 2003 2004 CVS 0.27 0.26 0.25 0.26 0.26 Walgreen’s 0.27 0.27 0.27 0.27 0.27 Rite Aid 0.23 0.23 0.23 0.24 N/A
Industry Average 0.25 0.25 0.25 0.25 0.27
Operating Expense Ratio 2000 2001 2002 2003 2004
CVS 0.19 0.21 0.19 0.19 0.2 Walgreen’s 0 0 0 0 0 Rite Aid 0.27 0.24 0.22 0.22 N/A
Industry Average 0.14 0.12 0.11 0.11 0
Net Profit Margin 2000 2001 2002 2003 2004 CVS 0.04 0.02 0.03 0.03 0.03 Walgreen’s 0.04 0.04 0.04 0.04 0.04 Rite Aid -0.08 -0.11 -0.05 -0.01 N/A
Industry Average -0.02 -0.04 -0.01 0.01 0.04
Asset Productivity 2000 2001 2002 2003 2004 CVS 2.53 2.58 2.51 2.52 2.1 Walgreen’s 2.99 2.79 2.9 2.79 2.81 Rite Aid 1.23 1.83 2.34 2.57 N/A
Industry Average 2.11 2.31 2.62 2.68 2.81
Return on Assets 2000 2001 2002 2003 2004 CVS 0.09 0.05 0.07 0.08 0.06 Walgreen’s 0.11 0.1 0.1 0.1 0.1 Rite Aid -0.1 -0.2 -0.13 -0.02 N/A
Industry Average 0 -0.05 -0.01 0.04 N/A
54
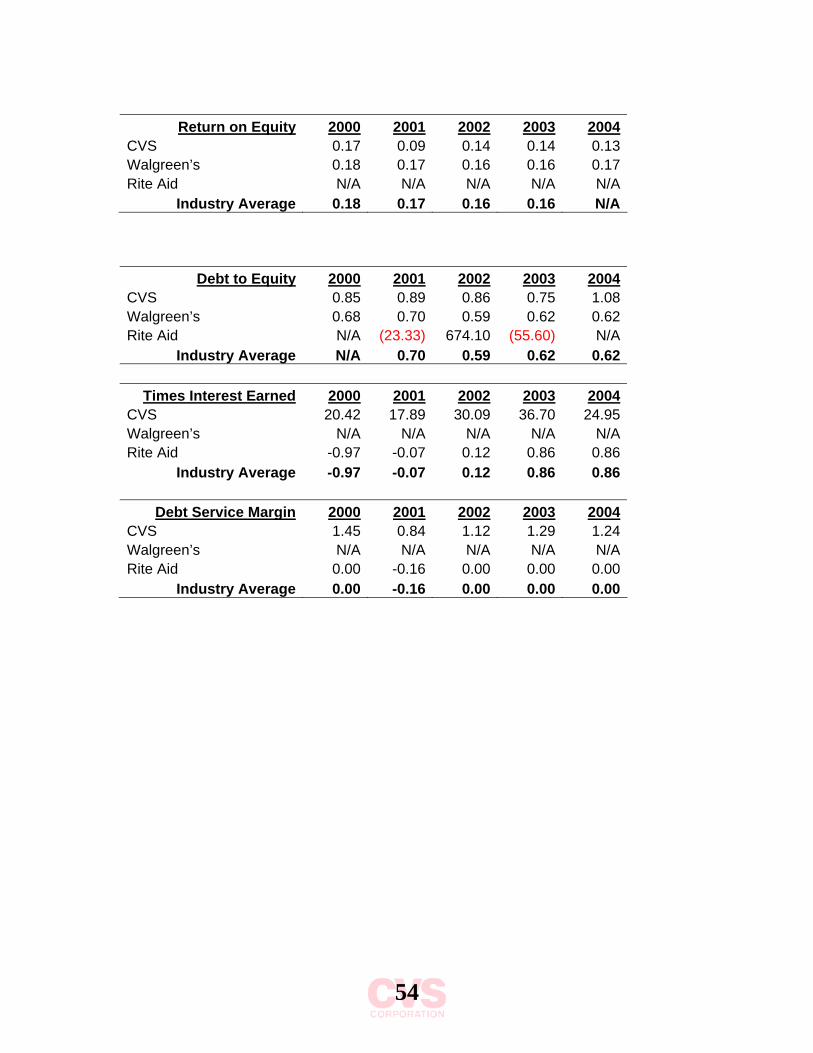
Return on Equity 2000 2001 2002 2003 2004
CVS 0.17 0.09 0.14 0.14 0.13 Walgreen’s 0.18 0.17 0.16 0.16 0.17 Rite Aid N/A N/A N/A N/A N/A
Industry Average 0.18 0.17 0.16 0.16 N/A
Debt to Equity 2000 2001 2002 2003 2004
CVS 0.85 0.89 0.86 0.75 1.08 Walgreen’s 0.68 0.70 0.59 0.62 0.62 Rite Aid N/A (23.33) 674.10 (55.60) N/A
Industry Average N/A 0.70 0.59 0.62 0.62
Times Interest Earned 2000 2001 2002 2003 2004 CVS 20.42 17.89 30.09 36.70 24.95 Walgreen’s N/A N/A N/A N/A N/A Rite Aid -0.97 -0.07 0.12 0.86 0.86
Industry Average -0.97 -0.07 0.12 0.86 0.86
Debt Service Margin 2000 2001 2002 2003 2004 CVS 1.45 0.84 1.12 1.29 1.24 Walgreen’s N/A N/A N/A N/A N/A Rite Aid 0.00 -0.16 0.00 0.00 0.00
Industry Average 0.00 -0.16 0.00 0.00 0.00
55
Discounted Dividends Valuation For CVSnumbers in millions
Years from valuation date 1 2 3 4 5 6 7 8 9 10 Terminal2004 2005 2006 2007 2008 2009 2010 2011 2012 2013 2014
Total Dividends $119.80 $119.66 $110.95 $112.10 $113.54 $115.21 $114.29 $113.22 $113.67 $113.99 $114.08Present Value Factor 0.948 0.898 0.852 0.807 0.765 0.725 0.687 0.652 0.618 0.585
113.42 99.68 95.47 91.65 88.15 82.89 77.83 74.06 70.4 66.78
Total Present Value of Forecast Future Dividends $860.32
Present Value of Continuing (Terminal) Value $13,328.36 $22,768.93
Estimated Total Value Per Share $35.15
Earnings $982.09 $1,014.59 $1,179.87 $1,287.31 $1,383.77 $1,474.24 $1,575.48 $1,701.00 $1,816.59 $1,938.90Dividends $119.80 $119.66 $110.95 $112.10 $113.54 $115.21 $114.29 $113.22 $113.67 $113.99 $114.08
Book Value $4.20
Number Shares Outstanding 2004 on website 403.71g
Valuation at April 1, 2005 $35.62 4.00% 4.75% 5.00% 5.25%Actual Price per share $52.62 *Over Ke 5.00% $19.53 $71.57Cost of Equity Estimated 5.50% Valued* 5.25% $15.71 $36.04 $69.91Growth rate 5.00% 5.50% $13.15 $24.16 $35.15 $68.03
5.75% $11.34 $18.26 $23.65 $34.42
Present Value of Future Dividends in 2004 $'s
Continuing (Terminal) Value (assume no growth)
Sensitivity Analysis
56
Discounted Free Cash Flows Model For CVS
CVS(Amounts in millions of dollars except per share data)
2004 2005 2006 2007 2008 2009 2010 2011 2012 2013 2014Cash Flow from Operations 914 1,043 1,112 1,236 1,192 1,080 1,132 1,150 1,158 1,142 1,133Cash Provided (Used) by Investing Activities -3,163 (127) (809) (893) (900) (877) (847) (877) (904) (921) -942.9741Free Cash Flow (to firm) 917 303 342 292 202 286 274 254 221 190discount rate (2.84% WACC) 0.972 0.946 0.919 0.894 0.869 0.845 0.822 0.799 0.777 0.756Present Value of Free Cash Flows 891.348 286.109 314.883 260.707 175.929 241.639 224.837 203.308 172.012 143.238Total Present Value of Annual Cash Flows 2,771Continuing (Terminal) Value (assume no growth) 22563.167Present Value of Continuing (Terminal) Value 17,052Value of the Firm (end of 2004) 19,823Book Value of Debt 7,560Value of Equity (end of 2004) 12,263Estimated Value per Share 30.38Valuation at April 1, 2005 30.59WACC 2.84%Growth 2.00%Actual Price per share $52.62
*Over Valued* Sensitivity Analysisg
2.00% 2.25% 2.50% 2.75%WACC 2.50% $59.10 $130.06
2.75% $35.45 $59.10 $130.062.84% $30.38 $48.27 $92.49 $382.373.25% $16.52 $23.62 $35.45 $59.103.50% $11.79 $16.52 $23.62 $35.45
57
Abnormal Earnings Growth Valuation Model for CVSAll data is stated in Per Share amounts.
1 2 3 4 5 6 7 8 9 10Forecast Years
2004 2005 2006 2007 2008 2009 2010 2011 2012 2013 2014 2015EPS $2.28 $2.44 $2.52 $2.93 $3.19 $3.43 $3.66 $3.91 $4.22 $4.51 $4.81DPS $0.30 $0.30 $0.28 $0.28 $0.28 $0.29 $0.28 $0.28 $0.28 $0.28 $0.28DPS invested at .05501% $0.02 $0.02 $0.02 $0.02 $0.02 $0.02 $0.02 $0.02 $0.02 $0.02Cum-Dividend Earnings $2.45 $2.53 $2.94 $3.21 $3.45 $3.67 $3.92 $4.24 $4.52 $4.83Normal Earnings $2.40 $2.57 $2.66 $3.09 $3.37 $3.62 $3.86 $4.12 $4.45 $4.76Abnormal Earning Growth (AEG) $0.05 ($0.04) $0.29 $0.12 $0.08 $0.05 $0.07 $0.11 $0.07 $0.07 $0.00
PV Factor 0.948 0.898 0.852 0.807 0.765 0.725 0.687 0.652 0.618 0.585
PV of AEG $0.05 ($0.03) $0.24 $0.10 $0.06 $0.04 $0.05 $0.07 $0.04 $0.04Core EPS $2.28Total PV of AEG $0.66Continuing (Terminal) Value 0.00PV of Terminal Value $0.00Total PV of AEG Sensitivity AnalysisAverage Perpetuity $2.93 gCapitalization Rate (perpetuity) 5.50% 0.00% 2.00% 3.00% 4.00%
Ke 5.00% $76.28 $90.01 $107.17 $158.65Value Per Share $53.34 5.50% $67.10 $74.95 $83.59 $103.74Valuation at April 1, 2005 54.06$ *Reasonably valued* 6.00% $59.59 $63.82 $68.05 $76.51Ke 0.05501 6.50% $53.32 $55.23 $57.01 $60.20g 0 7.00% $48.03 $48.44 $48.80 $49.40Actual Price per share $52.62
58
Residual Income Valuation From CVS
All data is stated in Per Share amounts.1 2 3 4 5 6 7 8 9 10 11
Forecast Years2004 2005 2006 2007 2008 2009 2010 2011 2012 2013 2014 2015
Beginning BE (per share) 17.34 19.32 21.46 23.70 26.35 29.27 32.41 35.79 39.42 43.35 47.58Earnings Per Share $2.28 $2.44 $2.52 $2.93 $3.19 $3.43 $3.66 $3.91 $4.22 $4.51 $4.81Dividends per share $0.30 $0.30 $0.28 $0.28 $0.28 $0.29 $0.28 $0.28 $0.28 $0.28 $0.28Ending BE (per share) 17.34 19.32 21.46 23.70 26.35 29.27 32.41 35.79 39.42 43.35 47.58 52.11Ke 0.05501"Normal" Income 0.95 1.06 1.18 1.30 1.45 1.61 1.78 1.97 2.17 2.38 2.62Residual Income (RI) 1.32 1.37 1.34 1.62 1.74 1.82 1.88 1.94 2.05 2.05 2.05
Present Value of RI 1.26 1.23 1.14 1.31 1.33 1.32 1.29 1.26 1.27 1.20 1.14
BV Equity (per share) 2004 19.85Total PV of RI (end 2004) 11.42Continuation (Terminal) Value 37.31PV of Terminal Value (end 2004) 23.04 Sensitivity AnalysisEstimated Value (2004) $54.31 *Under valued* gValuation at April 1, 2005 $55.04 0.00% 1.00% 3.00% 4.00%Actual Price per share $52.62 *Under valued* Ke 5.00% $61.49 $68.74 $105.00 $177.52Growth 0 5.50% $54.31 $59.43 $81.95 $115.72
6.00% $48.42 $52.08 $66.73 $85.046.50% $43.49 $46.12 $55.90 $66.657.00% $39.31 $43.85 $47.83 $54.62
59
Actual FORECAST
CVS Income Statement In Millions 2000 2001 2002 2003 2004 2005 2006 2007 2008 2009 2010 2011 2012 2013 2014 Net sales 20,087.50 22,241.40 24,181.50 26,588.00 30,594.30 33,347.79 36,349.09 39,620.51 43,186.35 47,073.12 50,368.24 53,894.02 57,666.60 61,703.26 66,022.49 Cost of goods sold 14,725.80 16,550.40 18,112.70 19,725.00 22,563.10 24,714.78 26,997.55 29,416.26 32,006.89 34,880.53 37,357.34 39,978.42 42,766.15 45,749.42 48,955.95 Gross margin 5,691.00 5,691.00 6,068.80 6,863.00 8,031.20 8,742.35 9,375.38 10,235.42 11,220.24 12,245.94 13,079.38 13,968.19 14,960.42 16,021.14 17,140.48 Selling, general and administrative 3,742.40 4,599.60 4,552.30 5,097.70 6,079.70 6,481.56 7,123.48 7,678.78 8,417.84 9,205.47 9,817.99 10,511.30 11,236.28 12,035.66 12,879.98 Depreciation and amortization 296.60 320.80 310.30 341.70 496.80 474.28 513.02 556.73 617.37 686.53 717.92 768.51 823.99 884.60 947.06 Total operating expenses 4,039.00 4,920.40 4,862.60 5,439.40 6,576.50 6,955.84 7,636.50 8,235.52 9,035.21 9,892.00 10,535.91 11,279.81 12,060.27 12,920.26 13,827.04 Operating profit 1,322.70 770.60 1,206.20 1,423.60 1,454.70 1,677.17 1,715.04 1,968.73 2,144.26 2,300.60 2,474.99 2,635.79 2,840.18 3,033.59 3,239.51 Interest expense, net 79.30 61.00 50.40 48.10 58.30 not predictable Earnings before income tax provision 1,243.40 709.60 1,155.80 1,375.50 1,396.40 1,593.87 1,634.79 1,885.49 2,053.38 2,198.77 2,363.43 2,519.47 2,716.29 2,900.44 3,096.34 Income tax provision 497.40 296.40 439.20 528.20 477.60 not predictable Net earnings 746.00 413.20 716.60 847.30 918.80 982.09 1,014.59 1,179.87 1,287.31 1,383.77 1,474.24 1,575.48 1,701.00 1,816.59 1,938.90 Preference dividends, net of income tax 14.60 14.70 14.80 14.60 14.20 14.58 14.58 14.58 14.58 14.58 14.58 14.58 14.58 14.58 14.58 Net earnings available to common 731.40 398.50 701.80 832.70 904.60 961.99 993.59 1,157.63 1,263.51 1,357.82 1,445.59 1,545.20 1,668.77 1,782.14 1,901.94 Basic earnings per common share: Net earnings 1.87 1.02 1.79 2.11 2.27 not predictable Weighted average common shares outstanding 391.00 392.20 392.30 394.40 398.60 not predictable Diluted earnings per common share: Net earnings 1.83 1.00 1.75 2.06 2.20 2.39 2.46 2.86 3.12 3.35 3.57 3.82 4.12 4.40 4.70 Weighted average common shares outstanding 408.00 408.30 405.30 407.70 415.40 not predictable Dividends declared per common share 0.23 0.23 0.23 0.23 0.27 not predictable Pro-Forma Income Statement Actual FORECAST 2000 2001 2002 2003 2004 2005 2006 2007 2008 2009 2010 2011 2012 2013 2014 Net sales 100% 100% 100% 100% 100% 100% 100% 100% 100% 100% 100% 100% 100% 100% 100% Cost of goods sold 73.31% 74.41% 74.90% 74.19% 73.75% 74.11% 74.27% 74.25% 74.11% 74.10% 74.17% 74.18% 74.16% 74.14% 74.15% Gross margin 28.33% 25.59% 25.10% 25.81% 26.25% 26.22% 25.79% 25.83% 25.98% 26.01% 25.97% 25.92% 25.94% 25.96% 25.96% Selling, general and administrative 18.63% 20.68% 18.83% 19.17% 19.87% 19.44% 19.60% 19.38% 19.49% 19.56% 19.49% 19.50% 19.48% 19.51% 19.51% Depreciation and amortization 1.48% 1.44% 1.28% 1.29% 1.62% 1.42% 1.41% 1.41% 1.43% 1.46% 1.43% 1.43% 1.43% 1.43% 1.43% Total operating expenses 20.11% 22.12% 20.11% 20.46% 21.50% 20.86% 21.01% 20.79% 20.92% 21.01% 20.92% 20.93% 20.91% 20.94% 20.94% Operating profit 6.58% 3.46% 4.99% 5.35% 4.75% 5.03% 4.72% 4.97% 4.97% 4.89% 4.91% 4.89% 4.93% 4.92% 4.91% Interest expense, net 0.39% 0.27% 0.21% 0.18% 0.19% not predictable Earnings before income tax provision 6.19% 3.19% 4.78% 5.17% 4.56% 4.78% 4.50% 4.76% 4.75% 4.67% 4.69% 4.67% 4.71% 4.70% 4.69% Income tax provision 2.48% 1.33% 1.82% 1.99% 1.56% not predictable Net earnings 3.71% 1.86% 2.96% 3.19% 3.00% 2.94% 2.79% 2.98% 2.98% 2.94% 2.93% 2.92% 2.95% 2.94% 2.94% Preference dividends, net of income tax 0.07% 0.07% 0.06% 0.05% 0.05% 0.06% 0.06% 0.06% 0.06% 0.06% 0.06% 0.06% 0.06% 0.06% 0.06% Net earnings available to common 3.64% 1.79% 2.90% 3.13% 2.96% 2.88% 2.73% 2.92% 2.93% 2.88% 2.87% 2.87% 2.89% 2.89% 2.88% Basic earnings per common share: Net earnings 0.01% 0.00% 0.01% 0.01% 0.01% not predictable Weighted average common shares outstanding 1.95% 1.76% 1.62% 1.48% 1.30% not predictable Diluted earnings per common share: Net earnings 0.01% 0.00% 0.01% 0.01% 0.01% 0.01% 0.01% 0.01% 0.01% 0.01% 0.01% 0.01% 0.01% 0.01% 0.01% Weighted average common shares outstanding 2.03% 1.84% 1.68% 1.53% 1.36% not predictable Dividends declared per common share 0.00% 0.00% 0.00% 0.00% 0.00% not predictable
60
Actual FORECAST
CVS Balance Sheet In Millions 2000 2001 2002 2003 2004 2005 2006 2007 2008 2009 2010 2011 2012 2013 2014 Assets: Cash and cash equivalents 337 236 700 843 392 not predictable Accounts receivable, net 825 966 1,019 1,350 1,764 not predictable Inventories 3,558 3,919 4,014 4,017 5,454 5,683 6,195 6,752 7,360 8,022 8,584 9,185 9,827 10,515 11,251 Deferred income taxes 125 243 216 252 243 not predictable Other current assets 92 46 32 35 66 not predictable Total current assets 4,937 5,410 5,982 6,497 7,920 8,301 9,048 9,862 10,750 11,717 12,537 13,415 14,354 15,359 16,434 Property and equipment, net 1,742 1,847 2,216 2,542 3,506 3,138 3,421 3,729 4,064 4,430 4,740 5,072 5,427 5,807 6,213 Goodwill 819 875 879 889 1,899 1,399 1,524 1,662 1,811 1,974 2,112 2,260 2,418 2,588 2,769 Intangible assets, net 0 318 351 404 868 not predictable Deferred income taxes 0 8 7 0 138 not predictable Other assets 452 178 211 212 217 not predictable Total assets 7,950 8,636 9,645 10,543 14,547 13,705 14,939 16,283 17,749 19,346 20,701 22,150 23,700 25,359 27,134 Liabilities: Accounts payable 1,352 1,536 1,708 1,666 2,276 2,301 2,508 2,734 2,980 3,248 3,475 3,719 3,979 4,257 4,555 Accrued expenses 1,001 1,267 1,361 1,500 1,667 1,838 2,004 2,184 2,381 2,595 2,776 2,971 3,179 3,401 3,639 Short-term debt 590 236 5 0 886 446 487 530 578 630 674 721 772 826 884 Current portion of long-term debt 22 26 32 323 31 115 125 136 149 162 173 185 198 212 227 Total current liabilities 2,964 3,065 3,106 3,489 4,859 4,700 5,123 5,584 6,087 6,635 7,099 7,596 8,128 8,697 9,306 Long-term debt 537 810 1,076 753 1,926 1,307 1,424 1,553 1,692 1,845 1,974 2,112 2,260 2,418 2,587 Deferred income taxes 28 0 0 42 0 not predictable Other long-term liabilities 116 194 266 237 775 not predictable Total liabilities 3,645 4,069 4,448 4,521 7,560 6,413 6,990 7,619 8,304 9,052 9,685 10,363 11,089 11,865 12,696 Shareholders equity: Preference stock 268 261 250 243 228 352 384 419 456 497 532 570 609 652 698 Common stock 4 4 4 4 4 6 6 7 7 8 9 9 10 11 11 Treasury stock (405) (511) (470) (429) (386) not predictable Guaranteed ESOP obligation (241) (220) (194) (163) (141) not predictable Capital surplus 1,494 1,540 1,547 1,557 1,691 not predictable Retained earnings 3,185 3,493 4,104 4,847 5,646 5,789 6,054 6,360 6,940 7,743 8,467 9,311 10,283 11,400 12,640 Accumulated other comprehensive loss 0 0 (45) (37) (56) not predictable Total shareholders equity 4,305 4,567 5,197 6,022 6,987 7,293 7,949 8,665 9,445 10,295 11,015 11,786 12,611 13,494 14,439 Total liabilities and shareholders equity 7,950 8,636 9,645 10,543 14,547 13,705 14,939 16,283 17,749 19,346 20,701 22,150 23,700 25,359 27,134
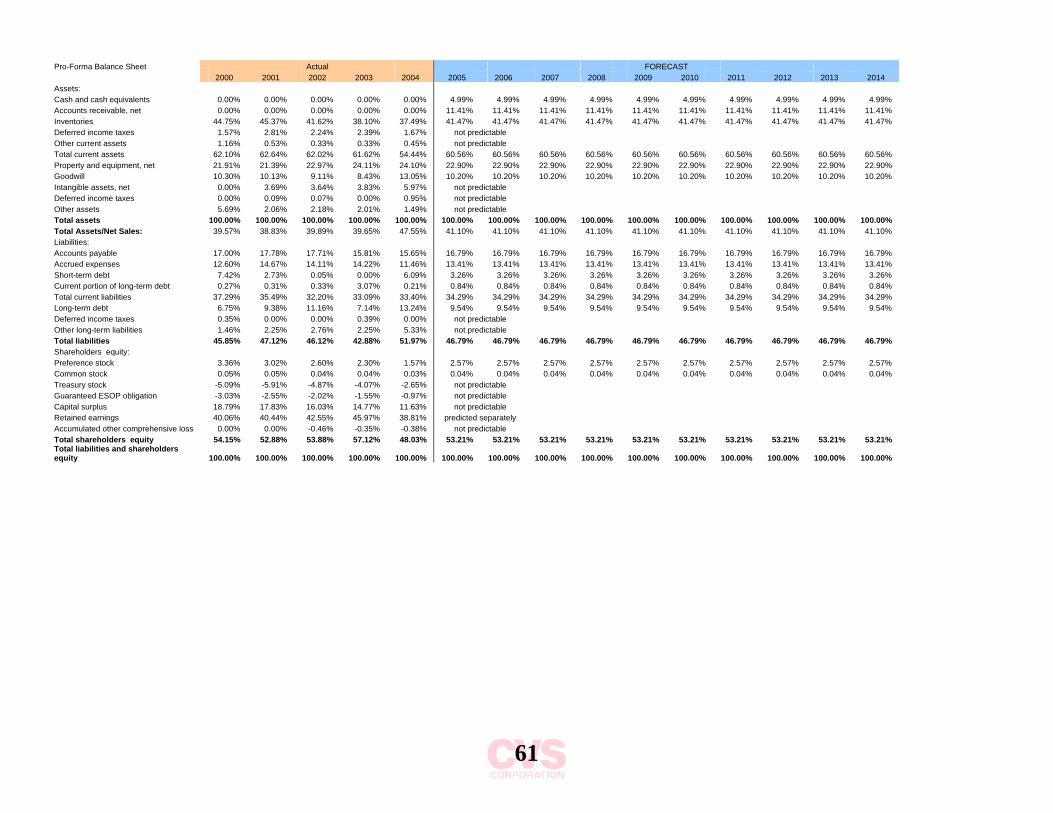
61
Pro-Forma Balance Sheet Actual FORECAST 2000 2001 2002 2003 2004 2005 2006 2007 2008 2009 2010 2011 2012 2013 2014 Assets: Cash and cash equivalents 0.00% 0.00% 0.00% 0.00% 0.00% 4.99% 4.99% 4.99% 4.99% 4.99% 4.99% 4.99% 4.99% 4.99% 4.99% Accounts receivable, net 0.00% 0.00% 0.00% 0.00% 0.00% 11.41% 11.41% 11.41% 11.41% 11.41% 11.41% 11.41% 11.41% 11.41% 11.41% Inventories 44.75% 45.37% 41.62% 38.10% 37.49% 41.47% 41.47% 41.47% 41.47% 41.47% 41.47% 41.47% 41.47% 41.47% 41.47% Deferred income taxes 1.57% 2.81% 2.24% 2.39% 1.67% not predictable Other current assets 1.16% 0.53% 0.33% 0.33% 0.45% not predictable Total current assets 62.10% 62.64% 62.02% 61.62% 54.44% 60.56% 60.56% 60.56% 60.56% 60.56% 60.56% 60.56% 60.56% 60.56% 60.56% Property and equipment, net 21.91% 21.39% 22.97% 24.11% 24.10% 22.90% 22.90% 22.90% 22.90% 22.90% 22.90% 22.90% 22.90% 22.90% 22.90% Goodwill 10.30% 10.13% 9.11% 8.43% 13.05% 10.20% 10.20% 10.20% 10.20% 10.20% 10.20% 10.20% 10.20% 10.20% 10.20% Intangible assets, net 0.00% 3.69% 3.64% 3.83% 5.97% not predictable Deferred income taxes 0.00% 0.09% 0.07% 0.00% 0.95% not predictable Other assets 5.69% 2.06% 2.18% 2.01% 1.49% not predictable Total assets 100.00% 100.00% 100.00% 100.00% 100.00% 100.00% 100.00% 100.00% 100.00% 100.00% 100.00% 100.00% 100.00% 100.00% 100.00% Total Assets/Net Sales: 39.57% 38.83% 39.89% 39.65% 47.55% 41.10% 41.10% 41.10% 41.10% 41.10% 41.10% 41.10% 41.10% 41.10% 41.10% Liabilities: Accounts payable 17.00% 17.78% 17.71% 15.81% 15.65% 16.79% 16.79% 16.79% 16.79% 16.79% 16.79% 16.79% 16.79% 16.79% 16.79% Accrued expenses 12.60% 14.67% 14.11% 14.22% 11.46% 13.41% 13.41% 13.41% 13.41% 13.41% 13.41% 13.41% 13.41% 13.41% 13.41% Short-term debt 7.42% 2.73% 0.05% 0.00% 6.09% 3.26% 3.26% 3.26% 3.26% 3.26% 3.26% 3.26% 3.26% 3.26% 3.26% Current portion of long-term debt 0.27% 0.31% 0.33% 3.07% 0.21% 0.84% 0.84% 0.84% 0.84% 0.84% 0.84% 0.84% 0.84% 0.84% 0.84% Total current liabilities 37.29% 35.49% 32.20% 33.09% 33.40% 34.29% 34.29% 34.29% 34.29% 34.29% 34.29% 34.29% 34.29% 34.29% 34.29% Long-term debt 6.75% 9.38% 11.16% 7.14% 13.24% 9.54% 9.54% 9.54% 9.54% 9.54% 9.54% 9.54% 9.54% 9.54% 9.54% Deferred income taxes 0.35% 0.00% 0.00% 0.39% 0.00% not predictable Other long-term liabilities 1.46% 2.25% 2.76% 2.25% 5.33% not predictable Total liabilities 45.85% 47.12% 46.12% 42.88% 51.97% 46.79% 46.79% 46.79% 46.79% 46.79% 46.79% 46.79% 46.79% 46.79% 46.79% Shareholders equity: Preference stock 3.36% 3.02% 2.60% 2.30% 1.57% 2.57% 2.57% 2.57% 2.57% 2.57% 2.57% 2.57% 2.57% 2.57% 2.57% Common stock 0.05% 0.05% 0.04% 0.04% 0.03% 0.04% 0.04% 0.04% 0.04% 0.04% 0.04% 0.04% 0.04% 0.04% 0.04% Treasury stock -5.09% -5.91% -4.87% -4.07% -2.65% not predictable Guaranteed ESOP obligation -3.03% -2.55% -2.02% -1.55% -0.97% not predictable Capital surplus 18.79% 17.83% 16.03% 14.77% 11.63% not predictable Retained earnings 40.06% 40.44% 42.55% 45.97% 38.81% predicted separately Accumulated other comprehensive loss 0.00% 0.00% -0.46% -0.35% -0.38% not predictable Total shareholders equity 54.15% 52.88% 53.88% 57.12% 48.03% 53.21% 53.21% 53.21% 53.21% 53.21% 53.21% 53.21% 53.21% 53.21% 53.21% Total liabilities and shareholders equity 100.00% 100.00% 100.00% 100.00% 100.00% 100.00% 100.00% 100.00% 100.00% 100.00% 100.00% 100.00% 100.00% 100.00% 100.00%
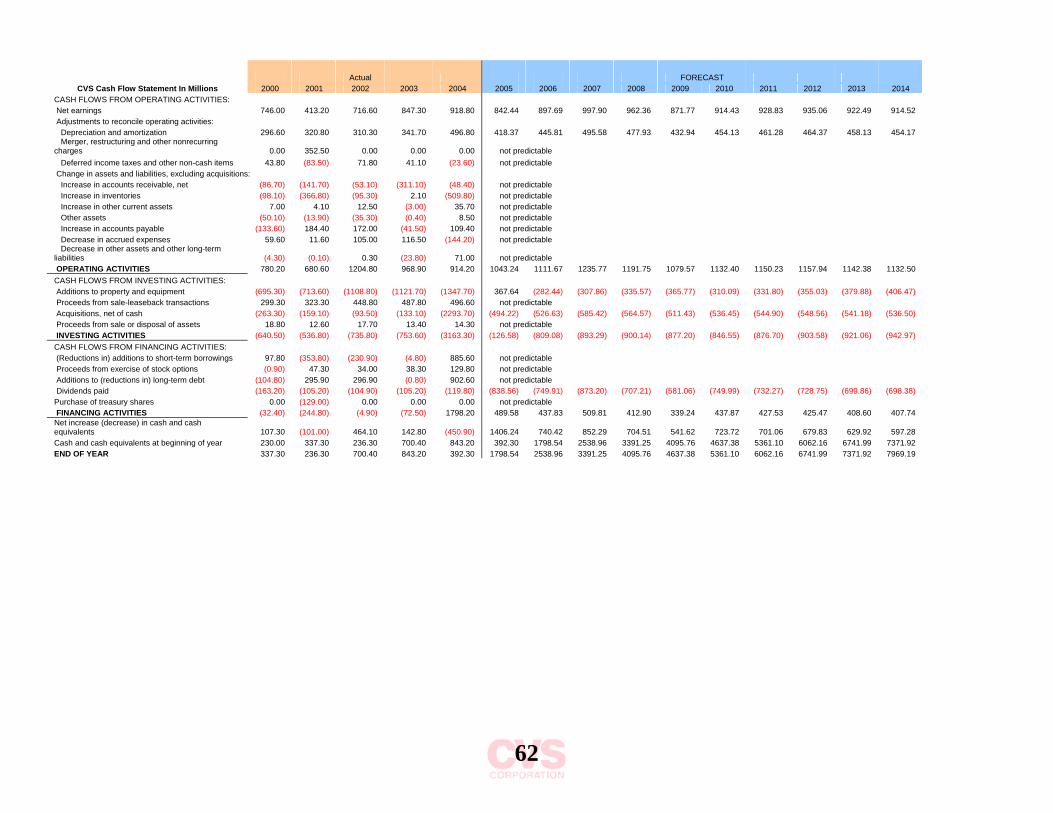
62
Actual FORECAST CVS Cash Flow Statement In Millions 2000 2001 2002 2003 2004 2005 2006 2007 2008 2009 2010 2011 2012 2013 2014
CASH FLOWS FROM OPERATING ACTIVITIES: Net earnings 746.00 413.20 716.60 847.30 918.80 842.44 897.69 997.90 962.36 871.77 914.43 928.83 935.06 922.49 914.52 Adjustments to reconcile operating activities: Depreciation and amortization 296.60 320.80 310.30 341.70 496.80 418.37 445.81 495.58 477.93 432.94 454.13 461.28 464.37 458.13 454.17 Merger, restructuring and other nonrecurring charges 0.00 352.50 0.00 0.00 0.00 not predictable Deferred income taxes and other non-cash items 43.80 (83.50) 71.80 41.10 (23.60) not predictable Change in assets and liabilities, excluding acquisitions: Increase in accounts receivable, net (86.70) (141.70) (53.10) (311.10) (48.40) not predictable Increase in inventories (98.10) (366.80) (95.30) 2.10 (509.80) not predictable Increase in other current assets 7.00 4.10 12.50 (3.00) 35.70 not predictable Other assets (50.10) (13.90) (35.30) (0.40) 8.50 not predictable Increase in accounts payable (133.60) 184.40 172.00 (41.50) 109.40 not predictable Decrease in accrued expenses 59.60 11.60 105.00 116.50 (144.20) not predictable Decrease in other assets and other long-term liabilities (4.30) (0.10) 0.30 (23.80) 71.00 not predictable OPERATING ACTIVITIES 780.20 680.60 1204.80 968.90 914.20 1043.24 1111.67 1235.77 1191.75 1079.57 1132.40 1150.23 1157.94 1142.38 1132.50 CASH FLOWS FROM INVESTING ACTIVITIES: Additions to property and equipment (695.30) (713.60) (1108.80) (1121.70) (1347.70) 367.64 (282.44) (307.86) (335.57) (365.77) (310.09) (331.80) (355.03) (379.88) (406.47) Proceeds from sale-leaseback transactions 299.30 323.30 448.80 487.80 496.60 not predictable Acquisitions, net of cash (263.30) (159.10) (93.50) (133.10) (2293.70) (494.22) (526.63) (585.42) (564.57) (511.43) (536.45) (544.90) (548.56) (541.18) (536.50) Proceeds from sale or disposal of assets 18.80 12.60 17.70 13.40 14.30 not predictable INVESTING ACTIVITIES (640.50) (536.80) (735.80) (753.60) (3163.30) (126.58) (809.08) (893.29) (900.14) (877.20) (846.55) (876.70) (903.58) (921.06) (942.97) CASH FLOWS FROM FINANCING ACTIVITIES: (Reductions in) additions to short-term borrowings 97.80 (353.80) (230.90) (4.80) 885.60 not predictable Proceeds from exercise of stock options (0.90) 47.30 34.00 38.30 129.80 not predictable Additions to (reductions in) long-term debt (104.80) 295.90 296.90 (0.80) 902.60 not predictable Dividends paid (163.20) (105.20) (104.90) (105.20) (119.80) (838.56) (749.91) (873.20) (707.21) (581.06) (749.99) (732.27) (728.75) (699.86) (698.38) Purchase of treasury shares 0.00 (129.00) 0.00 0.00 0.00 not predictable FINANCING ACTIVITIES (32.40) (244.80) (4.90) (72.50) 1798.20 489.58 437.83 509.81 412.90 339.24 437.87 427.53 425.47 408.60 407.74 Net increase (decrease) in cash and cash equivalents 107.30 (101.00) 464.10 142.80 (450.90) 1406.24 740.42 852.29 704.51 541.62 723.72 701.06 679.83 629.92 597.28 Cash and cash equivalents at beginning of year 230.00 337.30 236.30 700.40 843.20 392.30 1798.54 2538.96 3391.25 4095.76 4637.38 5361.10 6062.16 6741.99 7371.92 END OF YEAR 337.30 236.30 700.40 843.20 392.30 1798.54 2538.96 3391.25 4095.76 4637.38 5361.10 6062.16 6741.99 7371.92 7969.19
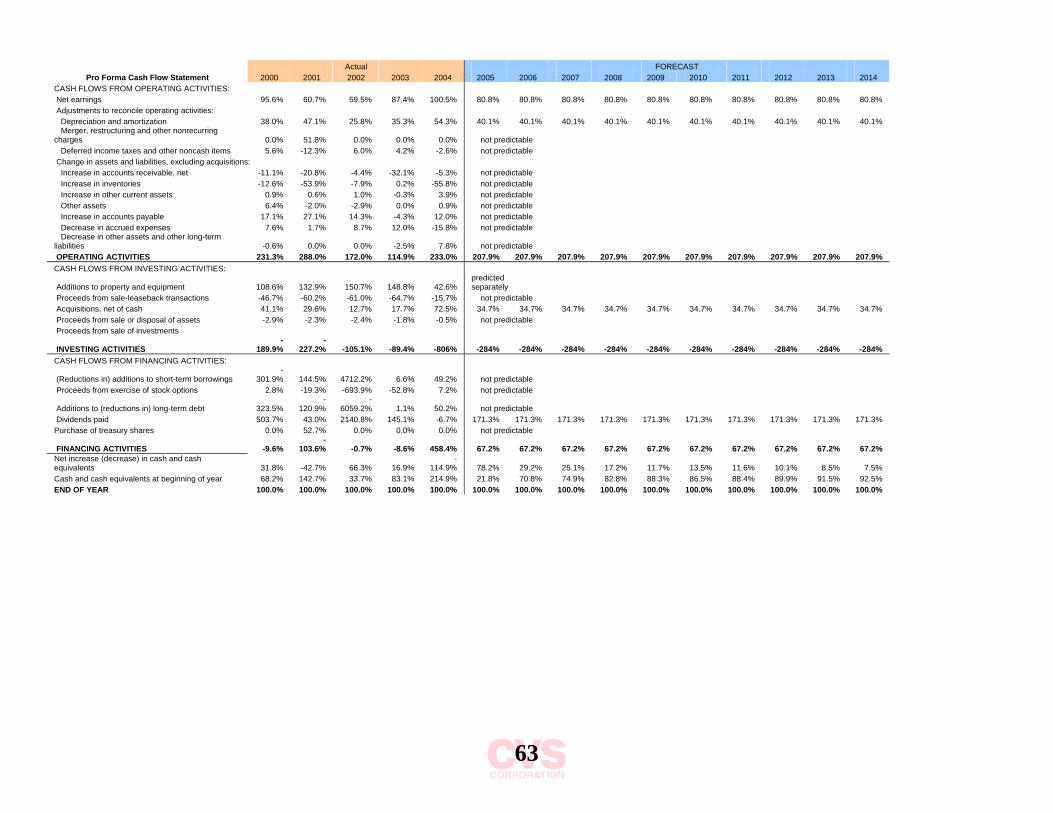
63
Actual FORECAST
Pro Forma Cash Flow Statement 2000 2001 2002 2003 2004 2005 2006 2007 2008 2009 2010 2011 2012 2013 2014 CASH FLOWS FROM OPERATING ACTIVITIES: Net earnings 95.6% 60.7% 59.5% 87.4% 100.5% 80.8% 80.8% 80.8% 80.8% 80.8% 80.8% 80.8% 80.8% 80.8% 80.8% Adjustments to reconcile operating activities: Depreciation and amortization 38.0% 47.1% 25.8% 35.3% 54.3% 40.1% 40.1% 40.1% 40.1% 40.1% 40.1% 40.1% 40.1% 40.1% 40.1% Merger, restructuring and other nonrecurring charges 0.0% 51.8% 0.0% 0.0% 0.0% not predictable Deferred income taxes and other noncash items 5.6% -12.3% 6.0% 4.2% -2.6% not predictable Change in assets and liabilities, excluding acquisitions: Increase in accounts receivable, net -11.1% -20.8% -4.4% -32.1% -5.3% not predictable Increase in inventories -12.6% -53.9% -7.9% 0.2% -55.8% not predictable Increase in other current assets 0.9% 0.6% 1.0% -0.3% 3.9% not predictable Other assets 6.4% -2.0% -2.9% 0.0% 0.9% not predictable Increase in accounts payable 17.1% 27.1% 14.3% -4.3% 12.0% not predictable Decrease in accrued expenses 7.6% 1.7% 8.7% 12.0% -15.8% not predictable Decrease in other assets and other long-term liabilities -0.6% 0.0% 0.0% -2.5% 7.8% not predictable OPERATING ACTIVITIES 231.3% 288.0% 172.0% 114.9% 233.0% 207.9% 207.9% 207.9% 207.9% 207.9% 207.9% 207.9% 207.9% 207.9% 207.9% CASH FLOWS FROM INVESTING ACTIVITIES:
Additions to property and equipment 108.6% 132.9% 150.7% 148.8% 42.6% predicted separately
Proceeds from sale-leaseback transactions -46.7% -60.2% -61.0% -64.7% -15.7% not predictable Acquisitions, net of cash 41.1% 29.6% 12.7% 17.7% 72.5% 34.7% 34.7% 34.7% 34.7% 34.7% 34.7% 34.7% 34.7% 34.7% 34.7% Proceeds from sale or disposal of assets -2.9% -2.3% -2.4% -1.8% -0.5% not predictable Proceeds from sale of investments
INVESTING ACTIVITIES -
189.9% -
227.2% -105.1% -89.4% -806% -284% -284% -284% -284% -284% -284% -284% -284% -284% -284% CASH FLOWS FROM FINANCING ACTIVITIES:
(Reductions in) additions to short-term borrowings -
301.9% 144.5% 4712.2% 6.6% 49.2% not predictable Proceeds from exercise of stock options 2.8% -19.3% -693.9% -52.8% 7.2% not predictable
Additions to (reductions in) long-term debt 323.5% -
120.9% -
6059.2% 1.1% 50.2% not predictable Dividends paid 503.7% 43.0% 2140.8% 145.1% -6.7% 171.3% 171.3% 171.3% 171.3% 171.3% 171.3% 171.3% 171.3% 171.3% 171.3% Purchase of treasury shares 0.0% 52.7% 0.0% 0.0% 0.0% not predictable
FINANCING ACTIVITIES -9.6% -
103.6% -0.7% -8.6% 458.4% 67.2% 67.2% 67.2% 67.2% 67.2% 67.2% 67.2% 67.2% 67.2% 67.2% Net increase (decrease) in cash and cash equivalents 31.8% -42.7% 66.3% 16.9%
-114.9% 78.2% 29.2% 25.1% 17.2% 11.7% 13.5% 11.6% 10.1% 8.5% 7.5%
Cash and cash equivalents at beginning of year 68.2% 142.7% 33.7% 83.1% 214.9% 21.8% 70.8% 74.9% 82.8% 88.3% 86.5% 88.4% 89.9% 91.5% 92.5% END OF YEAR 100.0% 100.0% 100.0% 100.0% 100.0% 100.0% 100.0% 100.0% 100.0% 100.0% 100.0% 100.0% 100.0% 100.0% 100.0%
64
Sources
• www.edgarscan.pwcglobal.com
• www.cvs.com
• www.walgreens.com
• www.riteaid.com
• www.sec.gov
• www.yahoo.com