Texas Tech Weekly Notes - Texas
45
1 1 TEXAS TECH FOOTBALL TEXAS TECH FOOTBALL THIRD WINNINGEST TEAM IN THE BIG 12 THIS CENTURY • 2010 ALAMO BOWL CHAMPIONS BIG 12 RECORD 16-STRAIGHT BOWL ELIGIBLE SEASONS • 2008 BIG 12 SOUTH CHAMPIONS 2010 GAME NOTES 2010 GAME NOTES vs. Texas vs. Texas Jones AT&T Stadium, Lubbock, Texas Jones AT&T Stadium, Lubbock, Texas September 18, 2010 • 7 p.m. (CT) • ABC/ESPN2 September 18, 2010 • 7 p.m. (CT) • ABC/ESPN2 3 TEXAS TECH (2-0; 0-0 BIG 12) SEPTEMBER 5 SMU (ESPN) W, 35-27 11 at New Mexico (The Mtn.) W, 52-17 18 *Texas (ABC/ESPN2) 7 p.m. OCTOBER 2 at *Iowa State TBA 9 vs. #*Baylor TBA 16 *Oklahoma State TBA 23 at *Colorado TBA 30 at *Texas A&M TBA NOVEMBER 6 *Missouri TBA 13 at *Oklahoma TBA 20 Weber State TBA 27 Houston TBA DECEMBER 4 &Big 12 Championship 7 p.m. * = Big 12 Conference Game # = Cotton Bowl, Dallas, Texas & = Cowboys Stadium, Arlington, Texas TEXAS (2-0; 0-0 BIG 12) SEPTEMBER 5 vs. Rice (ESPN) W, 34-17 11 Wyoming (Fox) W, 34-7 18 *Texas Tech (ABC/ESPN2) 7 p.m. 25 UCLA (ABC) 2:30 or 7 p.m. OCTOBER 2 #*vs. Oklahoma TBA 16 at *Nebraska TBA 23 *Iowa State TBA 30 *Baylor TBA NOVEMBER 6 at *Kansas State TBA 13 *Oklahoma State TBA 20 Florida Atlantic TBA 27 *Texas A&M (ESPN) 7 p.m. * = Big 12 Conference Game # = Cotton Bowl, Dallas, Texas JONES AT&T STADIUM Location ______________ Corner of University Ave. ___________________ and Marsha Sharp Freeway Capacity __________________________ 60,454 Tickets _________________________SOLD OUT Ticket Office _________________ (806) 742-TECH ____________________________ 889-GO-BIG12 GAME INFORMATION Date/Time: Saturday, September 18, 2010 at 7 p.m. (CT) Location: Lubbock, Texas (Jones AT&T Stadium; 60,454) Radio: Texas Tech Sports Network from Learfield Sports Brian Jensen (Play-by-Play/11th Season), John Harris (Analyst/28th Season), Chris Level (Sidelines/1st Season), Steve Pitts (Engineer/32nd Season) National Radio: Compass Radio Network Drew Bontadelli (Play-by-Play), Joe Senser (Analyst), Joe Rothstein (Studio Host) Satellite Radio: Sirius Channel 122/XM Channel 143 Television: ABC/ESPN2 Ron Franklin (Play-by-Play), Ed Cunningham (Analyst), Jeannine Edwards (Sidelines) On The Web: ESPN3.com will over a live webcast Live in-game statistics and other coverage can be found at www.texastech.com TEXAS TECH RED RAIDERS TEXAS LONGHORNS Record: 2-0; 0-0 BIG 12 Record: 2-0; 0-0 BIG 12 Rankings Receiving Votes Rankings: No. 6 (AP)/No. 4 (Coaches) Last Game W, at New Mexico (52-17) Last Game: W, Wyoming (34-7) Head Coach: Tommy Tuberville Head Coach: Mack Brown Career Record: 112-60 (15 Seasons) Career Record: 216-101-1 (26 years) Record at Tech: 2-0 (First Season) Record at Texas: 130-27 (13 years) vs. Texas: 0-0 vs. Texas Tech: 9-3 RED RAIDERS OPEN BIG 12 PLAY AGAINST NO. 4 TEXAS Two years removed from one of the greatest collegiate football games of all time, the Texas Tech Red Raiders and the Texas Longhorns renew their rivalry inside Jones AT&T Stadium on Saturday evening in front of a national television audience. Both teams enter Satur- day’s game with unblemished records as Texas handled Rice and Wyoming in its first two games of the year while Tech took care of SMU and New Mexico. The Longhorns are No. 6 in this week’s Associated Press poll and No. 4 in the USA Today/Coaches poll while the Red Raiders are unranked but receiving votes. Saturday’s game will be televised in primetime on ABC with a reverse mirror on ESPN2, mean- ing those sections of the country that will get the Notre Dame-Michigan State game on ABC, will be able to watch the Red Raiders and Longhorns on ESPN2. Announcing the game for ABC/ESPN will be Ron Franklin (play- by-play), Ed Cunningham (analyst) and Jeannine Edwards (sidelines). The game will also be carried nationally on the dial as the Compass Radio Net- work will provide a live broadcast with Drew Bontadelli and Joe Senser calling the action. RED RAIDERS HANDLE NEW MEXICO ON THE ROAD ALBUQUERQUE, N.M. (AP)-- Taylor Potts tossed three touchdown pass- es, with two of those going to Lyle Leong, to lead Texas Tech to a 52-17 victory Saturday over New Mexico. The Red Raiders (2-0) benefited from two blocked punts at the beginning of each half that led to short touch- down drives. The Lobos (0-2) didn’t help themselves, committing 16 pen- alties that cost them 145 yards. New Mexico quarterback B.R. Holbrook had 323 yards passing, his first career 300-yard game, and UNM receiver Ty Kirk set a career high with 119 yards. Potts, who completed passes to nine different receivers, went 22-34 in the air, with Leong catching five for 75 yards. Baron Batch also rushed for two touchdowns for Texas Tech. The Red Raiders took a 24-3 lead early in the second quarter before the Lobos closed within 31-17 and had a chance for more points before halftime, but an offensive pass interference and a personal foul on the same play negated a UNM touchdown with seven seconds left. Texas Tech scored 45 seconds into the game on a 55-yard pass from Potts to Austin Zouzalik. Aaron Crawford then blocked a punt on the Lobos’ next possession with Jonathan Brydon recovering at the 3. Eric Stephens scored on the next play for a 14-0 Red Raiders’ lead five minutes into the game. After a New Mexico field goal on the next possession, Stephens returned the kickoff 93 yards to the UNM 7, with Batch scoring two plays later. 2010 BIG 12 STANDINGS SOUTH CONF OVERALL STK Baylor 0-0 2-0 W2 Oklahoma 0-0 2-0 W4 Oklahoma State 0-0 2-0 W2 Texas 0-0 2-0 W2 Texas A&M 0-0 2-0 W2 Texas Tech 0-0 2-0 W5 NORTH CONF OVERALL STK Kansas State 0-0 2-0 W2 Missouri 0-0 2-0 W2 Nebraska 0-0 2-0 W3 Kansas 0-0 1-1 W1 Colorado 0-0 1-1 L1 Iowa State 0-0 1-1 L1
-
Upload
texas-tech-athletics -
Category
Documents
-
view
270 -
download
0
description
Texas Tech weekly game notes for the Texas game (9/18/10).
Transcript of Texas Tech Weekly Notes - Texas

11
2010 RED RAIDER FOOTBALL
TEXAS TECH FOOTBALLTEXAS TECH FOOTBALL
THIRD WINNINGEST TEAM IN THE BIG 12 THIS CENTURY • 2010 ALAMO BOWL CHAMPIONSBIG 12 RECORD 16-STRAIGHT BOWL ELIGIBLE SEASONS • 2008 BIG 12 SOUTH CHAMPIONS
2010 GAME NOTES2010 GAME NOTESvs. Texasvs. Texas
Jones AT&T Stadium, Lubbock, TexasJones AT&T Stadium, Lubbock, TexasSeptember 18, 2010 • 7 p.m. (CT) • ABC/ESPN2September 18, 2010 • 7 p.m. (CT) • ABC/ESPN2
3
TEXAS TECH (2-0; 0-0 BIG 12)SEPTEMBER5 SMU (ESPN) W, 35-2711 at New Mexico (The Mtn.) W, 52-1718 *Texas (ABC/ESPN2) 7 p.m.OCTOBER2 at *Iowa State TBA9 vs. #*Baylor TBA16 *Oklahoma State TBA23 at *Colorado TBA30 at *Texas A&M TBANOVEMBER6 *Missouri TBA13 at *Oklahoma TBA20 Weber State TBA27 Houston TBADECEMBER4 &Big 12 Championship 7 p.m.
* = Big 12 Conference Game# = Cotton Bowl, Dallas, Texas& = Cowboys Stadium, Arlington, Texas
TEXAS (2-0; 0-0 BIG 12)SEPTEMBER5 vs. Rice (ESPN) W, 34-1711 Wyoming (Fox) W, 34-718 *Texas Tech (ABC/ESPN2) 7 p.m. 25 UCLA (ABC) 2:30 or 7 p.m.OCTOBER2 #*vs. Oklahoma TBA16 at *Nebraska TBA23 *Iowa State TBA30 *Baylor TBANOVEMBER6 at *Kansas State TBA13 *Oklahoma State TBA20 Florida Atlantic TBA27 *Texas A&M (ESPN) 7 p.m.
* = Big 12 Conference Game# = Cotton Bowl, Dallas, Texas
JONES AT&T STADIUM
Location ______________ Corner of University Ave. ___________________ and Marsha Sharp FreewayCapacity __________________________ 60,454Tickets _________________________SOLD OUTTicket Office _________________ (806) 742-TECH____________________________ 889-GO-BIG12
GAME INFORMATION
Date/Time: Saturday, September 18, 2010 at 7 p.m. (CT)Location: Lubbock, Texas (Jones AT&T Stadium; 60,454)Radio: Texas Tech Sports Network from Learfield Sports Brian Jensen (Play-by-Play/11th Season), John Harris (Analyst/28th Season), Chris Level (Sidelines/1st Season), Steve Pitts (Engineer/32nd Season)National Radio: Compass Radio Network Drew Bontadelli (Play-by-Play), Joe Senser (Analyst), Joe Rothstein (Studio Host)Satellite Radio: Sirius Channel 122/XM Channel 143Television: ABC/ESPN2 Ron Franklin (Play-by-Play), Ed Cunningham (Analyst), Jeannine Edwards (Sidelines)On The Web: ESPN3.com will over a live webcast Live in-game statistics and other coverage can be found at www.texastech.com
TEXAS TECH RED RAIDERS TEXAS LONGHORNS
Record: 2-0; 0-0 BIG 12 Record: 2-0; 0-0 BIG 12Rankings Receiving Votes Rankings: No. 6 (AP)/No. 4 (Coaches)
Last Game W, at New Mexico (52-17) Last Game: W, Wyoming (34-7) Head Coach: Tommy Tuberville Head Coach: Mack BrownCareer Record: 112-60 (15 Seasons) Career Record: 216-101-1 (26 years)Record at Tech: 2-0 (First Season) Record at Texas: 130-27 (13 years)vs. Texas: 0-0 vs. Texas Tech: 9-3
RED RAIDERS OPEN BIG 12 PLAY AGAINST NO. 4 TEXASTwo years removed from one of the greatest collegiate football games of all time, the Texas Tech Red Raiders and the Texas Longhorns renew their rivalry inside Jones AT&T Stadium on Saturday evening in front of a national television audience. Both teams enter Satur-day’s game with unblemished records as Texas handled Rice and Wyoming in its first two games of the year while Tech took care of SMU and New Mexico. The Longhorns are No. 6 in this week’s Associated Press poll and No. 4 in the USA Today/Coaches poll while the Red Raiders are unranked but receiving votes. Saturday’s game will be televised in primetime on ABC with a reverse mirror on ESPN2, mean-ing those sections of the country that will get the Notre Dame-Michigan State game on ABC, will be able to watch the Red Raiders and Longhorns on ESPN2. Announcing the game for ABC/ESPN will be Ron Franklin (play-by-play), Ed Cunningham (analyst) and Jeannine Edwards (sidelines). The game will also be carried nationally on the dial as the Compass Radio Net-work will provide a live broadcast with Drew Bontadelli and Joe Senser calling the action.
RED RAIDERS HANDLE NEW MEXICO ON THE ROADALBUQUERQUE, N.M. (AP)-- Taylor Potts tossed three touchdown pass-es, with two of those going to Lyle Leong, to lead Texas Tech to a 52-17 victory Saturday over New Mexico. The Red Raiders (2-0) benefited from two blocked punts at the beginning of each half that led to short touch-down drives. The Lobos (0-2) didn’t help themselves, committing 16 pen-alties that cost them 145 yards. New Mexico quarterback B.R. Holbrook had 323 yards passing, his first career 300-yard game, and UNM receiver Ty Kirk set a career high with 119 yards. Potts, who completed passes to nine different receivers, went 22-34 in the air, with Leong catching five for 75 yards. Baron Batch also rushed for two touchdowns for Texas Tech. The Red Raiders took a 24-3 lead early in the second quarter before the Lobos closed within 31-17 and had a chance for more points before halftime, but an offensive pass interference and a personal foul on the same play negated a UNM touchdown with seven seconds left. Texas Tech scored 45 seconds into the game on a 55-yard pass from Potts to Austin Zouzalik. Aaron Crawford then blocked a punt on the Lobos’ next possession with Jonathan Brydon recovering at the 3. Eric Stephens scored on the next play for a 14-0 Red Raiders’ lead five minutes into the game. After a New Mexico field goal on the next possession, Stephens returned the kickoff 93 yards to the UNM 7, with Batch scoring two plays later.
2010 BIG 12 STANDINGSSOUTH CONF OVERALL STKBaylor 0-0 2-0 W2Oklahoma 0-0 2-0 W4Oklahoma State 0-0 2-0 W2Texas 0-0 2-0 W2Texas A&M 0-0 2-0 W2Texas Tech 0-0 2-0 W5
NORTH CONF OVERALL STKKansas State 0-0 2-0 W2Missouri 0-0 2-0 W2Nebraska 0-0 2-0 W3Kansas 0-0 1-1 W1Colorado 0-0 1-1 L1Iowa State 0-0 1-1 L1
22
2010 RED RAIDER FOOTBALL
ATHLETICS COMMUNICATIONSATHLETICS COMMUNICATIONS(806) 742-2770 • (806) 742-1970 - fax Assistant A.D./CommunicationsBlayne BealOffice ______________ (806) 742-2762Cell ________________ (806) 790-7924Email ____________ [email protected] Director/CommunicationsScott LacefieldOffice ______________ (806) 742-2770Cell ________________ (817) 691-3786Email __________ [email protected] Director/CommunicationsBrandon IretonOffice ______________ (806) 742-2770Cell ________________ (325) 998-0753Email __________ [email protected]
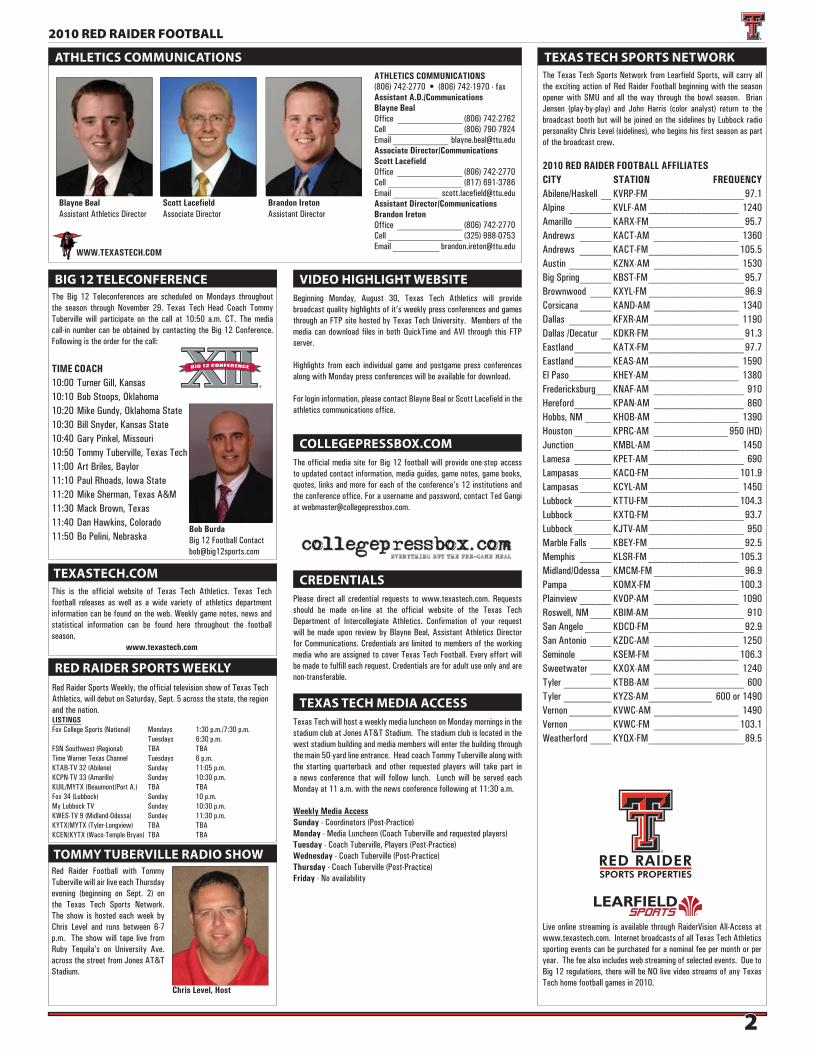
Blayne BealAssistant Athletics Director
Scott LacefieldAssociate Director
TEXAS TECH SPORTS NETWORKThe Texas Tech Sports Network from Learfield Sports, will carry all the exciting action of Red Raider Football beginning with the season opener with SMU and all the way through the bowl season. Brian Jensen (play-by-play) and John Harris (color analyst) return to the broadcast booth but will be joined on the sidelines by Lubbock radio personality Chris Level (sidelines), who begins his first season as part of the broadcast crew.
2010 RED RAIDER FOOTBALL AFFILIATESCITY STATION FREQUENCYAbilene/Haskell __ KVRP-FM __________________97.1Alpine ________ KVLF-AM _________________ 1240Amarillo _______ KARX-FM__________________95.7Andrews ______ KACT-AM ________________ 1360Andrews ______ KACT-FM _________________ 105.5Austin ________ KZNX-AM ________________ 1530Big Spring ______ KBST-FM __________________95.7Brownwood ____ KXYL-FM __________________96.9Corsicana ______ KAND-AM ________________ 1340Dallas ________ KFXR-AM_________________ 1190Dallas /Decatur __ KDKR-FM __________________91.3Eastland _______ KATX-FM __________________97.7Eastland _______ KEAS-AM_________________ 1590El Paso ________ KHEY-AM _________________ 1380 Fredericksburg ___ KNAF-AM _________________ 910Hereford _______ KPAN-AM _________________ 860Hobbs, NM _____ KHOB-AM ________________ 1390Houston _______ KPRC-AM ______________ 950 (HD)Junction _______ KMBL-AM ________________ 1450Lamesa _______ KPET-AM __________________ 690Lampasas ______ KACQ-FM_________________ 101.9Lampasas ______ KCYL-AM _________________ 1450Lubbock _______ KTTU-FM _________________ 104.3Lubbock _______ KXTQ-FM __________________93.7Lubbock _______ KJTV-AM __________________ 950Marble Falls ____ KBEY-FM __________________92.5Memphis ______ KLSR-FM _________________ 105.3Midland/Odessa __ KMCM-FM _________________96.9Pampa ________ KOMX-FM ________________ 100.3Plainview ______ KVOP-AM ________________ 1090Roswell, NM ____ KBIM-AM __________________ 910San Angelo _____ KDCD-FM__________________92.9San Antonio ____ KZDC-AM ________________ 1250Seminole ______ KSEM-FM ________________ 106.3Sweetwater ____ KXOX-AM ________________ 1240Tyler _________ KTBB-AM _________________ 600Tyler _________ KYZS-AM ____________ 600 or 1490Vernon ________ KVWC-AM ________________ 1490Vernon ________ KVWC-FM ________________ 103.1Weatherford ____ KYQX-FM __________________89.5
Live online streaming is available through RaiderVision All-Access at www.texastech.com. Internet broadcasts of all Texas Tech Athletics sporting events can be purchased for a nominal fee per month or per year. The fee also includes web streaming of selected events. Due to Big 12 regulations, there will be NO live video streams of any Texas Tech home football games in 2010.
BIG 12 TELECONFERENCEThe Big 12 Teleconferences are scheduled on Mondays throughout the season through November 29. Texas Tech Head Coach Tommy Tuberville will participate on the call at 10:50 a.m. CT. The media call-in number can be obtained by contacting the Big 12 Conference. Following is the order for the call:
TIME COACH10:00 Turner Gill, Kansas10:10 Bob Stoops, Oklahoma10:20 Mike Gundy, Oklahoma State10:30 Bill Snyder, Kansas State10:40 Gary Pinkel, Missouri10:50 Tommy Tuberville, Texas Tech11:00 Art Briles, Baylor11:10 Paul Rhoads, Iowa State11:20 Mike Sherman, Texas A&M11:30 Mack Brown, Texas11:40 Dan Hawkins, Colorado11:50 Bo Pelini, Nebraska
Bob BurdaBig 12 Football [email protected]
VIDEO HIGHLIGHT WEBSITEBeginning Monday, August 30, Texas Tech Athletics will provide broadcast quality highlights of it’s weekly press conferences and games through an FTP site hosted by Texas Tech University. Members of the media can download files in both QuickTime and AVI through this FTP server.
Highlights from each individual game and postgame press conferences along with Monday press conferences will be available for download.
For login information, please contact Blayne Beal or Scott Lacefield in the athletics communications office.
COLLEGEPRESSBOX.COMThe official media site for Big 12 football will provide one-stop access to updated contact information, media guides, game notes, game books, quotes, links and more for each of the conference’s 12 institutions and the conference office. For a username and password, contact Ted Gangi at [email protected].
CREDENTIALSPlease direct all credential requests to www.texastech.com. Requests should be made on-line at the official website of the Texas Tech Department of Intercollegiate Athletics. Confirmation of your request will be made upon review by Blayne Beal, Assistant Athletics Director for Communications. Credentials are limited to members of the working media who are assigned to cover Texas Tech Football. Every effort will be made to fulfill each request. Credentials are for adult use only and are non-transferable.
TEXASTECH.COM
TEXAS TECH MEDIA ACCESSTexas Tech will host a weekly media luncheon on Monday mornings in the stadium club at Jones AT&T Stadium. The stadium club is located in the west stadium building and media members will enter the building through the main 50-yard line entrance. Head coach Tommy Tuberville along with the starting quarterback and other requested players will take part in a news conference that will follow lunch. Lunch will be served each Monday at 11 a.m. with the news conference following at 11:30 a.m.
Weekly Media AccessSunday - Coordinators (Post-Practice)Monday - Media Luncheon (Coach Tuberville and requested players)Tuesday - Coach Tuberville, Players (Post-Practice)Wednesday - Coach Tuberville (Post-Practice)Thursday - Coach Tuberville (Post-Practice)Friday - No availability
RED RAIDER SPORTS WEEKLY
This is the official website of Texas Tech Athletics. Texas Tech football releases as well as a wide variety of athletics department information can be found on the web. Weekly game notes, news and statistical information can be found here throughout the football season.
www.texastech.com
Red Raider Sports Weekly, the official television show of Texas Tech Athletics, will debut on Saturday, Sept. 5 across the state, the region and the nation.LISTINGSFox College Sports (National) Mondays 1:30 p.m./7:30 p.m. Tuesdays 6:30 p.m.FSN Southwest (Regional) TBA TBATime Warner Texas Channel Tuesdays 6 p.m.KTAB-TV 32 (Abilene) Sunday 11:05 p.m.KCPN-TV 33 (Amarillo) Sunday 10:30 p.m.KUIL/MYTX (Beaumont/Port A.) TBA TBAFox 34 (Lubbock) Sunday 10 p.m.My Lubbock TV Sunday 10:30 p.m.KWES-TV 9 (Midland-Odessa) Sunday 11:30 p.m.KYTX/MYTX (Tyler-Longview) TBA TBAKCEN/KYTX (Waco-Temple-Bryan) TBA TBA
TOMMY TUBERVILLE RADIO SHOWRed Raider Football with Tommy Tuberville will air live each Thursday evening (beginning on Sept. 2) on the Texas Tech Sports Network. The show is hosted each week by Chris Level and runs between 6-7 p.m. The show will tape live from Ruby Tequila’s on University Ave. across the street from Jones AT&T Stadium.
Brandon IretonAssistant Director
WWW.TEXASTECH.COM
Chris Level, Host

33
2010 RED RAIDER FOOTBALL
Seeking the chance to take the Big 12’s third winningest program to new heights, Tommy Tuber-ville was named the 14th head coach in school history on January 10, 2010.
Tuberville inherits a program that has been bowl eligible for a Big 12 record 16 consecutive seasons and has won 29 games in the last three seasons. His SEC coaching pedigree suggests that his impact on the Red Raider program will be substantial and his first test will arrive on Sept. 5 when Texas Tech opens the 2010 season at home against the SMU Mustangs. In 10 seasons at Auburn, Tuberville led the Tigers to 85 overall wins, which ranks fourth in school history. The Tigers also won 49 Southeastern Conference games, a number that is the fourth-best mark in the SEC. Tuberville led Auburn to seven straight bowl appearances, including New Year’s Day bowl games in four of those years. In 2007, Tuberville led Auburn to an 9-4 mark, including a 5-3 record in the Southeastern Conference with wins at No. 4 Florida and a record-setting sixth consecutive win over Alabama in the Iron Bowl. The Tigers concluded the season with an overtime victory over Clemson in the Chick-fil-A Bowl, marking the program’s fifth bowl victory in the last six seasons. For the second consecutive year, Tuberville was a finalist for the Liberty Mutual Coach of the Year award for his efforts on and off the field. The 2006 season saw Tuberville direct the Tigers to their second season with at least 10 wins in the previous three years with an 11-2 record after a 17-14 victory over Nebraska in the AT&T Cotton Bowl Classic. One of three finalist for the inaugural Liberty Mutual Coach of the Year award, Tuberville’s 2006 squad was the only program in the country to defeat two teams ranked in the top five nationally - National Champion Florida and LSU. Coming off a perfect 13-0 season in 2004, expectations for Tommy Tuberville’s 2005 Au-burn squad were modest after the Tigers lost four players to the first round of the NFL draft, including their entire starting backfield. But Auburn surprised many of the experts, finishing 9-3 and earning a share of its fifth Southeastern Conference Western Division title in six years. Au-burn ended the regular season with back-to-back victories over Georgia and Alabama - two teams ranked at the time in the top 10 - setting a new school record in the process with 22 victories over a two year period. In 2004, Tuberville led Auburn to its best season ever as the Tigers won a school-record 13 games and captured the SEC Championship and the NOKIA Sugar Bowl title. Auburn won its first conference title since 1989 including its first outright championship since 1987. Auburn defeated five top 15 teams, becoming just the 10th NCAA Division I-A team to finish 13-0 or better. The Tigers earned their first ever berth in a Bowl Championship Series game and defeated Virginia Tech, 16-13 in the Sugar Bowl. For his efforts, Tuberville was named the AFCA, Associated Press, Paul “Bear” Bryant, FCA, SEC and Walter Camp Coach of the Year. The season before Tuberville’s arrival, Auburn finished with a dismal 3-8 overall record and a last place finish in the SEC Western Division. Tuberville guided the program back to the top of the league standings, leading Auburn to an SEC Championship, five Western Division titles including outright championships in 2000 and 2004 and co-championships in 2001, 2002 and 2005. Since 2000, the program is tied for the best conference record among SEC teams with a mark of 47-17 (.734). Tuberville has directed Auburn to eight consecutive bowl appearances, including five New Year’s Day bowl berths and three consecutive January 1 bowl games from 2005-07. Tuberville built an Auburn program that excelled both on and off the field. Players flourished under Tuberville’s guidance as Auburn earned 36 first-team All-Southeastern Conference awards, eight All-America honors, 26 SEC All-Freshmen accolades, 57 SEC Player of the Week honors, two SEC Player of the Year awards, two Jacobs Awards presented annually to the league’s top blocker and one Most Valuable Player of the SEC Championship game. Thirty-two players have been selected in the NFL Draft including an SEC-record four in the first round of the 2005 Draft. Running backs Ronnie Brown and Carnell Williams were taken second and fifth respectively, while cornerback Carlos Rogers was selected ninth overall and quar-terback Jason Campbell was picked 25th in the first round. It also marked the first time in NFL Draft history that an entire backfield from the same team was taken in the first round. Since 2004, 26 Auburn players have been drafted, including 22 in the last five drafts. Of those 22 selections since 2005, almost half have been selected in the first two rounds; five first-round selections and five second- round picks.
Carnell Williams earned NFL Offensive Rookie of the Year honors in 2005, while in 2006 Marcus McNeill became the first NFL rookie offensive lineman in 16 years to start in the Pro Bowl. McNeill was named to the 2007 Pro Bowl making him just the second NFL lineman ever to be named to the Pro Bowl in their first two years. The East team head coach at the 2006 Hula Bowl, Tuberville is currently on the Board of Trustees of the American Football Coaches Association and is serving a three-year term on the AFCA rules committee. For his numerous achievements during his career, Tuberville was inducted into the Arkansas Sports Hall of Fame in February, 2008. Off the field, Auburn earned more than 81 SEC Academic Honor Roll distinctions during Tuberville’s tenure, and when the NCAA released its Academic Progress Report (APR) in February 2006, Auburn football had a multi-year score of 981, which was the highest score among public BCS conference institutions. The program received public recognition from the NCAA for being in the top 10 percentile nationally and was one of only four BCS institutions to earn such distinctions. Tuberville’s community service reached well beyond the local, state and national level in May 2008, when he participated in the inaugural Armed Forces Entertainment Coaches Tour in the Middle East with fellow college coaches Mark Richt of Georgia, Randy Shannon of Miami (Fla.), Jack Siedlecki of Yale and Charlie Weis of Notre Dame. With a mission to help boost troop morale, the six-day tour made stops at military bases in Germany, Qatar, Bahrain, United Arab Emirates and a visit to the USS Nassau in the Persian Gulf. In addition, Tuberville continually stresses the importance of participating in community service projects to Auburn’s football team. Auburn football players regularly read at local schools, serve as mentors and visit with the elderly. The last two summers, the football team spent a day working at Story Book Farm which is a non-profit organization that provides therapeutic horseback riding for children suffering from disabilities, chronic illnesses or those who have suffered a loss. Tuberville understands the process and commitment it takes to build a successful program. Coaching stops at perennial college football powers University of Miami and Texas A&M and a four-year head coaching stint at the University of Mississippi gave him the background in building and maintaining a successful program. He began his coaching career at Hermitage (Ark.) High School where he spent two years as an assistant and two as a head coach. After three straight four-win seasons, Tuberville guided HHS to a 7-3 mark in 1979 before moving to Arkansas State. A 1976 graduate of Southern Arkansas University, Tuberville was a letterman at free safe-ty and a two-year member of the golf team at SAU. He is a 1972 graduate of Harmony Grove High School in Camden, Ark. Tuberville is married to the former Suzanne Fette of Guilford, Ind. They are the parents of two sons, Thomas Tucker and Troy Allen.
COACHING CAREER2010-Present Head Coach, Texas Tech University 2-01999-08 Head Coach, Auburn University 85-401995-98 Head Coach, University of Mississippi 25-201994 Defensive Coordinator, Texas A&M1993 Defensive Coordinator, University of Miami1986-92 Defensive Coach, University of Miami1980-84 Assistant Coach, Arkansas State UniversityCareer Record 112-60
PERSONALName: Thomas Hawley TubervilleBorn: September 18, 1954Hometown: Camden, Ark.Wife: The former Suzanne Fette of Guilford, Ind.Children: Thomas Tucker (15), Troy Allen (13)Education: B.S., Physical Education (1976), Southern Arkansas University
“THE RIVERBOAT “THE RIVERBOAT GAMBLER”GAMBLER”
IS NOW THE IS NOW THE
HIGH PLAINS HIGH PLAINS COMMANDERCOMMANDER
HEAD COACH TOMMY TUBERVILLEHEAD COACH TOMMY TUBERVILLE
44
2010 RED RAIDER FOOTBALL
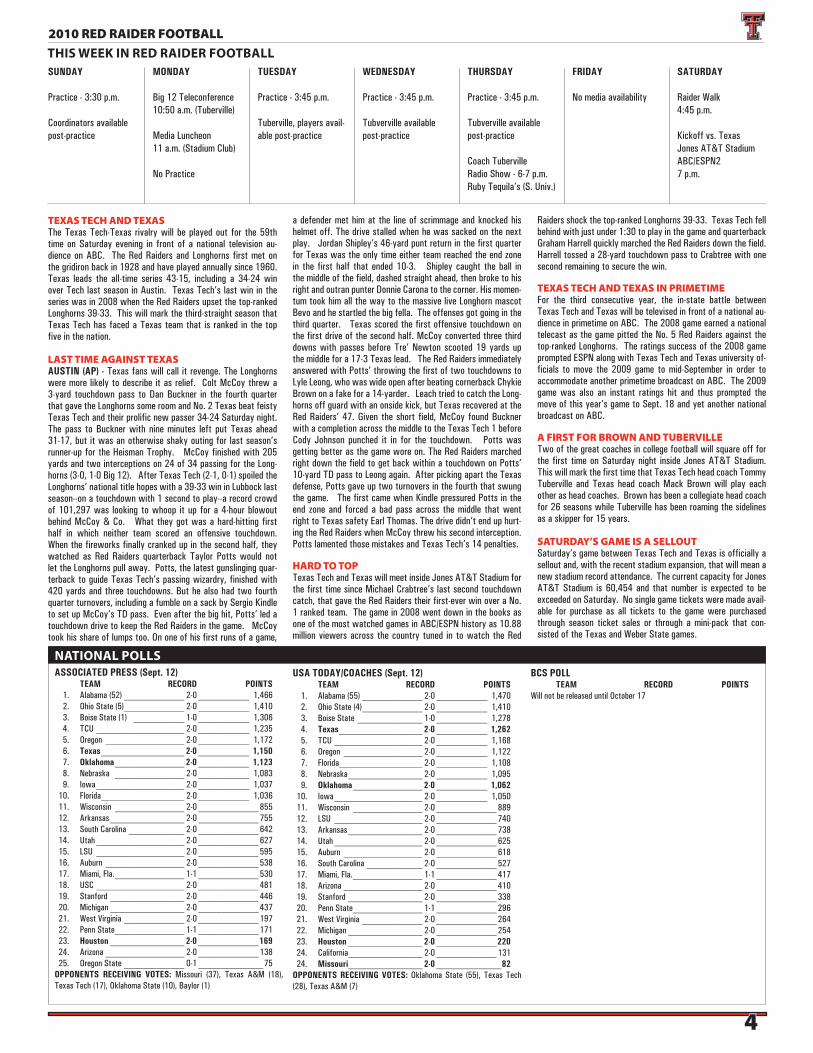
ASSOCIATED PRESS (Sept. 12) TEAM RECORD POINTS 1. Alabama (52) _____________ 2-0 ___________ 1,466 2. Ohio State (5) _____________ 2-0 ___________ 1,410 3. Boise State (1) ___________ 1-0 ___________ 1,306 4. TCU ___________________ 2-0 ___________ 1,235 5. Oregon _________________ 2-0 ___________ 1,172 6. Texas __________________ 2-0 ___________ 1,150 7. Oklahoma _______________ 2-0 ___________ 1,123 8. Nebraska _______________ 2-0 ___________ 1,083 9. Iowa ___________________ 2-0 ___________ 1,037 10. Florida__________________ 2-0 ___________ 1,036 11. Wisconsin _______________ 2-0 _____________ 855 12. Arkansas ________________ 2-0 _____________ 755 13. South Carolina ____________ 2-0 _____________ 642 14. Utah ___________________ 2-0 _____________ 627 15. LSU ___________________ 2-0 _____________ 595 16. Auburn _________________ 2-0 _____________ 538 17. Miami, Fla. _______________ 1-1 _____________ 530 18. USC ___________________ 2-0 _____________ 481 19. Stanford ________________ 2-0 _____________ 446 20. Michigan ________________ 2-0 _____________ 437 21. West Virginia _____________ 2-0 _____________ 197 22. Penn State _______________ 1-1 _____________ 171 23. Houston ________________ 2-0 _____________169 24. Arizona _________________ 2-0 _____________ 138 25. Oregon State _____________ 0-1 ______________75OPPONENTS RECEIVING VOTES: Missouri (37), Texas A&M (18), Texas Tech (17), Oklahoma State (10), Baylor (1)
USA TODAY/COACHES (Sept. 12) TEAM RECORD POINTS 1. Alabama (55) _____________ 2-0 ___________ 1,470 2. Ohio State (4) _____________ 2-0 ___________ 1,410 3. Boise State ______________ 1-0 ___________ 1,278 4. Texas __________________ 2-0 ___________ 1,262 5. TCU ___________________ 2-0 ___________ 1,168 6. Oregon _________________ 2-0 ___________ 1,122 7. Florida__________________ 2-0 ___________ 1,108 8. Nebraska ________________ 2-0 ___________ 1,095 9. Oklahoma _______________ 2-0 ___________ 1,062 10. Iowa ___________________ 2-0 ___________ 1,050 11. Wisconsin _______________ 2-0 _____________ 889 12. LSU ___________________ 2-0 _____________ 740 13. Arkansas ________________ 2-0 _____________ 738 14. Utah ___________________ 2-0 _____________ 625 15. Auburn _________________ 2-0 _____________ 618 16. South Carolina ____________ 2-0 _____________ 527 17. Miami, Fla. _______________ 1-1 _____________ 417 18. Arizona _________________ 2-0 _____________ 410 19. Stanford ________________ 2-0 _____________ 338 20. Penn State _______________ 1-1 _____________ 296 21. West Virginia _____________ 2-0 _____________ 264 22. Michigan ________________ 2-0 _____________ 254 23. Houston ________________ 2-0 _____________220 24. California ________________ 2-0 _____________ 131 24. Missouri________________ 2-0 ______________82OPPONENTS RECEIVING VOTES: Oklahoma State (55), Texas Tech (28), Texas A&M (7)
BCS POLL TEAM RECORD POINTSWill not be released until October 17
NATIONAL POLLS
SUNDAY
Practice - 3:30 p.m.
Coordinators available post-practice
MONDAY
Big 12 Teleconference10:50 a.m. (Tuberville)
Media Luncheon11 a.m. (Stadium Club)
No Practice
TUESDAY
Practice - 3:45 p.m.
Tuberville, players avail-able post-practice
WEDNESDAY
Practice - 3:45 p.m.
Tubverville available post-practice
THURSDAY
Practice - 3:45 p.m.
Tubverville available post-practice
Coach Tuberville Radio Show - 6-7 p.m.Ruby Tequila’s (S. Univ.)
FRIDAY
No media availability
SATURDAY
Raider Walk 4:45 p.m.
Kickoff vs. TexasJones AT&T StadiumABC/ESPN27 p.m.
THIS WEEK IN RED RAIDER FOOTBALL
TEXAS TECH AND TEXASThe Texas Tech-Texas rivalry will be played out for the 59th time on Saturday evening in front of a national television au-dience on ABC. The Red Raiders and Longhorns first met on the gridiron back in 1928 and have played annually since 1960. Texas leads the all-time series 43-15, including a 34-24 win over Tech last season in Austin. Texas Tech’s last win in the series was in 2008 when the Red Raiders upset the top-ranked Longhorns 39-33. This will mark the third-straight season that Texas Tech has faced a Texas team that is ranked in the top five in the nation.
LAST TIME AGAINST TEXASAUSTIN (AP) - Texas fans will call it revenge. The Longhorns were more likely to describe it as relief. Colt McCoy threw a 3-yard touchdown pass to Dan Buckner in the fourth quarter that gave the Longhorns some room and No. 2 Texas beat feisty Texas Tech and their prolific new passer 34-24 Saturday night. The pass to Buckner with nine minutes left put Texas ahead 31-17, but it was an otherwise shaky outing for last season’s runner-up for the Heisman Trophy. McCoy finished with 205 yards and two interceptions on 24 of 34 passing for the Long-horns (3-0, 1-0 Big 12). After Texas Tech (2-1, 0-1) spoiled the Longhorns’ national title hopes with a 39-33 win in Lubbock last season--on a touchdown with 1 second to play--a record crowd of 101,297 was looking to whoop it up for a 4-hour blowout behind McCoy & Co. What they got was a hard-hitting first half in which neither team scored an offensive touchdown. When the fireworks finally cranked up in the second half, they watched as Red Raiders quarterback Taylor Potts would not let the Longhorns pull away. Potts, the latest gunslinging quar-terback to guide Texas Tech’s passing wizardry, finished with 420 yards and three touchdowns. But he also had two fourth quarter turnovers, including a fumble on a sack by Sergio Kindle to set up McCoy’s TD pass. Even after the big hit, Potts’ led a touchdown drive to keep the Red Raiders in the game. McCoy took his share of lumps too. On one of his first runs of a game,
a defender met him at the line of scrimmage and knocked his helmet off. The drive stalled when he was sacked on the next play. Jordan Shipley’s 46-yard punt return in the first quarter for Texas was the only time either team reached the end zone in the first half that ended 10-3. Shipley caught the ball in the middle of the field, dashed straight ahead, then broke to his right and outran punter Donnie Carona to the corner. His momen-tum took him all the way to the massive live Longhorn mascot Bevo and he startled the big fella. The offenses got going in the third quarter. Texas scored the first offensive touchdown on the first drive of the second half. McCoy converted three third downs with passes before Tre’ Newton scooted 19 yards up the middle for a 17-3 Texas lead. The Red Raiders immediately answered with Potts’ throwing the first of two touchdowns to Lyle Leong, who was wide open after beating cornerback Chykie Brown on a fake for a 14-yarder. Leach tried to catch the Long-horns off guard with an onside kick, but Texas recovered at the Red Raiders’ 47. Given the short field, McCoy found Buckner with a completion across the middle to the Texas Tech 1 before Cody Johnson punched it in for the touchdown. Potts was getting better as the game wore on. The Red Raiders marched right down the field to get back within a touchdown on Potts’ 10-yard TD pass to Leong again. After picking apart the Texas defense, Potts gave up two turnovers in the fourth that swung the game. The first came when Kindle pressured Potts in the end zone and forced a bad pass across the middle that went right to Texas safety Earl Thomas. The drive didn’t end up hurt-ing the Red Raiders when McCoy threw his second interception. Potts lamented those mistakes and Texas Tech’s 14 penalties.
HARD TO TOPTexas Tech and Texas will meet inside Jones AT&T Stadium for the first time since Michael Crabtree’s last second touchdown catch, that gave the Red Raiders their first-ever win over a No. 1 ranked team. The game in 2008 went down in the books as one of the most watched games in ABC/ESPN history as 10.88 million viewers across the country tuned in to watch the Red
Raiders shock the top-ranked Longhorns 39-33. Texas Tech fell behind with just under 1:30 to play in the game and quarterback Graham Harrell quickly marched the Red Raiders down the field. Harrell tossed a 28-yard touchdown pass to Crabtree with one second remaining to secure the win.
TEXAS TECH AND TEXAS IN PRIMETIMEFor the third consecutive year, the in-state battle between Texas Tech and Texas will be televised in front of a national au-dience in primetime on ABC. The 2008 game earned a national telecast as the game pitted the No. 5 Red Raiders against the top-ranked Longhorns. The ratings success of the 2008 game prompted ESPN along with Texas Tech and Texas university of-ficials to move the 2009 game to mid-September in order to accommodate another primetime broadcast on ABC. The 2009 game was also an instant ratings hit and thus prompted the move of this year’s game to Sept. 18 and yet another national broadcast on ABC.
A FIRST FOR BROWN AND TUBERVILLETwo of the great coaches in college football will square off for the first time on Saturday night inside Jones AT&T Stadium. This will mark the first time that Texas Tech head coach Tommy Tuberville and Texas head coach Mack Brown will play each other as head coaches. Brown has been a collegiate head coach for 26 seasons while Tuberville has been roaming the sidelines as a skipper for 15 years.
SATURDAY’S GAME IS A SELLOUTSaturday’s game between Texas Tech and Texas is officially a sellout and, with the recent stadium expansion, that will mean a new stadium record attendance. The current capacity for Jones AT&T Stadium is 60,454 and that number is expected to be exceeded on Saturday. No single game tickets were made avail-able for purchase as all tickets to the game were purchased through season ticket sales or through a mini-pack that con-sisted of the Texas and Weber State games.
55
2010 RED RAIDER FOOTBALL
GAMEDAY ASSIGNMENTS
TOMMY TUBERVILLEHead Coach--Sideline--
JAMES WILLISDefensive Coordinator--Sideline--
SAM McELROYDefensive Line--Press Box--
ROBERT PRUNTYDefensive Ends/Outside LBs--Sideline--
TRAVARIS ROBINSONDefensive Backs--Sideline--
NEAL BROWNOffensive Coordinator--Sideline--
SONNY CUMBIEInside Receivers--Press Box--
TOMMY MAINORDWide Receivers--Sideline--
MATT MOOREOffensive Line--Sideline--
CHAD SCOTTRunning Backs--Sideline--
HAPPY BIRTHDAY TUBSTexas Tech head coach Tommy Tuberville will be looking for a special gift this week - a win over Texas. Tuberville will cel-ebrate his 56th birthday on Saturday when the Red Raiders take on the fourth-ranked Longhorns at Jones AT&T Stadium. Coach Tuberville is 2-0 all-time (as head coach) on his birthday with both wins coming while he was the head coach of the Auburn Tigers. Over the span of his 31-year collegiate coaching career, his teams are a combined 4-0 on his birthday.Tuberville On His Birthday - Head Coach2004 (Auburn) W, 10-9 vs. LSU 1999 (Auburn) W, 41-7 at LSU
Tuberville On His Birthday - Assistant Coach1993 (Miami) W, 21-2 vs. Virginia Tech1982 (Ark. State) W, 13-12 vs. Tennessee-Chattanooga
LaCOUR LEADING THE SPECIAL TEAMS UNITThe play of senior punter Jonathan LaCour has been one of the biggest surprises through two games this season. LaCour, who was suspended by the Big 12 for the first six games of 2009 and ended up not playing the entire year, is second in the Big 12 in punting at 48.0 yards-per-game. He trails Oklahoma’s Tress Way by the slimmest of margins as Way leads the league at 48.2 yards-per-game. In his first punt of the 2010 season (and his first in a game since 2008), LaCour booted the pigskin 60 yards and that tied his career long that he set against Baylor in 2007.• On the other side of things, Texas Tech blocked two punts on Saturday at New Mexico which was a first by the Red Raiders this century. Both blocked punts set up touchdowns and helped Tech cruise to a 52-17 win.
STEPHENS MOVING UP ON KICKOFF CHARTSSophomore Eric Stephens, who set the single-season kickoff return yardage record as a freshman in 2009, is just 190 yards away from moving into first place on the school’s career list. Stephens currently has 1,120 career kickoff return yards and 190 more will move him past All-American and college football hall of fame member Donny Anderson who posted 1,309 be-tween 1963-65.• Ranks sixth with 41 career returns and needs seven more to move into sole possession of fourth place.• Totaled 264 all-purpose yards against New Mexico that in-cluded 175 kickoff return yards, 46 rushing yards and 43 yards receiving.• His 93-yard return midway through the first quarter against UNM marked a career long. His previous long was a 64-yard return last season against Baylor in Cowboys Stadium.
“LYNWOOD” MOVES INTO SECONDTwo years removed from one of the most intriguing stories in all of college football, senior placekicker Matt “Lynwood” Wil-liams has moved into second place on the career PAT list at Texas Tech. Williams earned national attention after former head coach Mike Leach stopped Williams after he participated in a third quarter Kick For Rent contest, sponsored by Lynwood Townhomes, on Sept. 20, 2008, against UMASS. Leach was so impressed by Williams that he offered him the chance to walk on and earn a spot on the team. Williams was successful in his try-out and his first collegiate action came at Kansas where he was successful on nine extra point attempts against the Jayhawks. His first career field goal (29-yards) came in the game against Texas the very next week.• Since the Kansas game in 2008, Williams has made 105 extra point attempts and now ranks second behind Alex Trlica who owns both the school and NCAA record of 233.
ALL DRESSED IN WHITEThere was a lot of white on the Texas Tech sideline against New Mexico as the Red Raiders dressed in white pants, white jerseys and white helmets. Tech wore white helmets in a game for the first time since the Jim Carlen era between 1970-74.
TECH LIGHTS UP THE SCOREBOARD AT UNMThe Texas Tech offense lit up the Lobo scoreboard to the tune of 52 points on Saturday evening at University Stadium. The 52 points scored were the most by the Red Raiders since a 66-14 beating of Kansas State last season (Oct. 10).
TECH NAMES PLAYERS OF THE WEEKTexas Tech has announced its players of the week following Saturday’s 52-17 win over New Mexico. Left guard Lonnie Ed-wards picked up the offensive honors while Scott Smith earned
the nod on the defensive side of the ball. Aaron Crawford picked up special teams accolades. The scout team players of the week were Andre McCorkle (offense) and Dartwan Bush (defense).
OLD RELIABLESenior NT Colby Whitlock might very well be one of the best de-fensive lineman in the country and he has the resume to back it up. Whitlock has made 38 consecutive starts dating back to his freshman season in 2007 and will be in search of No. 39 on Sat-urday against Texas. Whitlock, an Oklahoma native, cracked the starting lineup at Oklahoma State on Sept. 22, 2007, and hasn’t looked back since - racking up 133 total tackles, includ-ing 22 for a loss. Fellow senior Brian Duncan is right behind him with 36 consecutive starts dating back to the Northwestern State game in 2007.
SECONDARY TAKING ADVANTAGEThe Texas Tech secondary has been opportunistic in the first two games of the 2010 season as the group has racked up five interceptions. With five pickoffs, Texas Tech is only five away from tying its entire total (10) from all of last season.
RECORDS WATCH - TAYLOR POTTS• Needs 356 passing yards to move in 7th place (career passing yardage)• Needs 5 touchdowns to move into 6th place (career touch-downs)• Needs 63 passing attempts to move into 8th place (career passing attempts)• Needs 42 pass completions to move into 7th place (career passing completions)
MAKE THAT EIGHTTexas Tech’s 35-27 victory over SMU on Sunday marked eight straight season-opening wins for the Red Raiders dating back to the 2003 season. The rare Sunday game (a first since the 1996 Alamo Bowl) was played before a national audience on ESPN and was the debut for coach Tommy Tuberville.
TUBERVILLE ERA BEGINS WITH A WINThe much anticipated Tommy Tuberville era at Texas Tech be-gan with a 35-27 win over SMU. Tuberville is now 2-1 all-time in his coaching career when starting a new job. He lost his opener at Ole Miss (46-13 to Auburn) in 1995 but was victori-ous in his debut at Auburn as the Tigers defeated Appalachian State 22-15 in 1999.
RECORD CROWDS TURN OUT FOR THE OPENERThe excitement of a new era of Red Raider football continues to build as record crowds turned out for Texas Tech’s season opener against SMU. The second largest crowd (57,528) in Jones AT&T Stadium history watched the Red Raiders defeat SMU on Sunday afternoon. The 57,528 fans were the most to ever attend a home season opener and topped last season’s home opening crowd of 47,824 against North Dakota. Amongst the crowd were 12,910 Texas Tech students and that is the largest student crowd in school history.
RAIDER WALK A HUGE SUCCESS IN WEEK ONEThe first Raider Walk in school history was an overwhelming success as the crowd was estimated at between 10 and 12 thousand fans. The Raider Walk is the pathway that the team takes by foot from the corner of Canton Ave. and Drive of Cham-pions to the Football Training Facility. The walk begins two hours and 15 minutes prior to kickoff each home game.
FIRST TOUCHDOWNS GO TO LEONGSenior quarterback Taylor Potts found his old high school buddy Lyle Leong in the corner of the end zone for a two-yard touch-down strike that marked the first of the season for the Red Raiders on Sunday against SMU. Leong didn’t stop there as he caught the second touchdown (six-yard reception) of the game with 14:30 remaining in the second quarter to help the Red Raid-ers build a 14-0 lead.
CAREER DAY FOR LEONGLyle Leong got his senior year off with a bang as he led the Red Raider offense with 11 catches, 142 receiving yards and three touchdowns against SMU. Leong surpassed his previous career high of nine receptions and 117 yards receiving that he set last season against Rice. His three touchdowns on the afternoon tied his career high (set twice previously) and it marked the fifth multiple touchdown game of his career.
66
2010 RED RAIDER FOOTBALLPOTTS IMPRESSIVE AGAINST SMUSenior quarterback Taylor Potts enjoyed a solid season opener on Sunday and led the Red Raiders to a 35-27 win over SMU. Potts completed 34 of 53 passes without an interception and piled up 359 passing yards along with four touchdowns through the air. In the season opener last season against North Dakota, Potts was 34-of-48 with three interceptions while throwing for 405 yards and two touchdowns.
PROTECTING THE HOUSEAs Under Armour (Texas Tech’s official apparel provider) would say, “We Must Protect This House.” Texas Tech has taken that motto seriously over the years as the Red Raiders have amassed a home record of 41-6 since 2003. The .872 winning percent-age ranks third in the league behind Texas and Oklahoma.
RECORD SEASON TICKET SALESThe Red Raider faithful have spoken in record numbers in re-gards to the excitement of the arrival of coach Tuberville and this new era of Texas Tech football. On July 21, 2010, Texas Tech announced that a new school record in season ticket sales had been established - and by the first game against SMU, the old record was shattered. Texas Tech’s final season ticket count was 46,565 which blew away the previous record of 41,740.
ALL ABOUT REDTexas Tech head coach Tommy Tuberville and the athletics department announced a new RED OUT Initiative on Friday, Au-gust 20. Red Raider fans have been urged to wear RED each and every time they attend a Texas Tech sporting event, home or away.
EXPANSION, EXPANSIONTexas Tech’s Jones AT&T Stadium can lay claim to being one of just a few stadiums across the country that expanded twice within one calendar year. The addition of 6,000 north end zone seats prior to the Texas A&M game on Oct. 29, 2009, coupled with the opening of the east side stadium building for the 2010 season opener has increased stadium capacity to 60,454. The east side stadium building features 29 luxury suites along with 544 outdoor club seats as well as a private dining club that will be open daily to members. When combined with the west side stadium building, Jones AT&T Stadium now boasts 83 luxury suites and 1,644 club seats. In addition to the stadium, Texas Tech also spent close to 2.3 million in renovating the football training facility. A football hall of fame and turf practice field were added while the locker room and weight room underwent major renovations.
THIRD WINNINGEST PROGRAM THIS CENTURYTexas Tech enters the 2010 season as the third winningest Big 12 program in this century. With 47 league wins since 2000, Texas Tech ranks behind Texas and Oklahoma who lead the way with 69 and 67, respectively.
EIGHT-STRAIGHTTexas Tech football has reeled of eight-straight seasons of win-ning eight-plus games and that streak has made the Red Raiders one of the most consistent programs in the nation. Texas Tech is also in the middle of a streak of 15-straight winning seasons.
BIG 12 BOWL RECORD CONTINUESTexas Tech’s appearance in the 2010 Valero Alamo Bowl (a 41-31 win over Michigan State) marked the 16th-consecutive year of bowl eligibility for the Red Raider football program – a Big 12 record. Texas Tech will be looking to push that streak to 17 consecutive years this season and the Red Raiders will be in search of their 10th-straight bowl appearance and 34th overall.
DEGREES IN HANDEight players on this year’s team have already completed the bachelor’s degree and are either pursuing a second degree or are enrolled in graduate school.CURRENT RED RAIDERS WITH DEGREESGerardo Acevedo ........... Human Development & Family StudiesBritton Barbee ........................................................ PsychologyBrian Duncan ............................................................ MarketingJulius Howard ..................................................CommunicationsFranklin Mitchem ........................................................ BusinessLaRon Moore ................. Human Development & Family StudiesChris Olson ...........................................................ManagementTaylor Potts.................................. Exercise And Sports Science
HERE WE GO AGAINIn what seems to be the norm in the summertime, the Red Raid-ers aren’t getting any love when it comes to predicting the order of finish in the Big 12 South Division. Texas Tech is picked to finish fourth in the division behind Oklahoma, Texas and Texas A&M. Texas Tech has finished higher in the Big 12 South than its preseason prediction in four of the last five years.
PRESEASON WATCH LISTSTexas Tech has three offensive players listed on preseason watchlists in quarterback Taylor Potts, wide receiver Detron Lewis and running back Baron Batch. Potts is a preseason can-didate for the Davey O’Brien Award (nation’s top quarterback) for the second straight year as is Lewis who is up for the Bilet-nikoff Award (nation’s top receiver). Batch is also a preseason candidate for the Doak Walker Award for the second straight year. On the defensive side, Brian Duncan has been named to the preseason watchlists for the Dick Butkus Award (nation’s top linebacker), the Lott Trophy (nation’s top defensive player) and the Bronko Nagurski Award (nation’s top defensive player).RED RAIDERS ON PRESEASON WATCHLISTSDavey O’Brien Award ............................................ Taylor PottsBiletnikoff Award ................................................Detron LewisDoak Walker Award .............................................. Baron BatchButkus Award ......................................................Brian DuncanLott Trophy..........................................................Brian DuncanBronko Nagurski Trophy ......................................Brian Duncan
YOUNG STAFFTommy Tuberville has assembled a young and energetic coach-ing staff here in his first season at Texas Tech and one that he believes can help bring Tech its first major football cham-pionship. The average age of this year’s staff is 37 years old. Offensively, the average age drops to 31 years old and is led by Neal Brown (30), the third youngest coordinator in the FBS. Defensively, the average age is 39 years old and the group is anchored by James Willis (38), the 37th youngest coordinator in the FBS.YOUNGEST COORDINATORS IN THE FBSAge Name School O/D DOB27 Lincoln Riley East Carolina offensive 9/5/8329 Paul Nichols Toledo co-defensive 1/25/8130 Neal Brown Texas Tech offensive 3/11/8030 Marcus Arroyo Wyoming offensive 1/23/8030 Matt Campbell Toledo offensive 11/29/7931 Billy Napier Clemson offensive 7/21/7931 Jeff Grady Fresno State offensive 3/3/7931 Nick Rolovich Hawai’i offensive 2/16/79
MASKED RIDER EARNS HIGH PRAISEThe Masked Rider was ranked as the ninth best mascot in col-lege football according to a poll released on August 21, 2010, byThe Associated Press. The poll listed the top 12 mascots in the nation and included Big 12 schools Colorado (Ralphie) and Texas (Bevo).
OFFENSIVE LINE GETS A MAKEOVERTexas Tech’s offensive line got a makeover during the offsea-son and the coaching staff hopes it pays dividends this season. Overall, the group only lost a total of 24 pounds but that does not give the proper insight into the radical change that has oc-curred. Terry McDaniel, Deveric Gallington, Mickey Okafor and LaAdrian Waddle lost a combined 98 pounds from the end of last season to the start of training camp. Tech offensive line coach Matt Moore wanted to see slimmer and more quick-footed play-ers on the line and he hopes the changes in body types will do the trick. There were a few weight gains in the group as Lonnie Edwards gained 32 pounds, Jonathan Guerra added 16, Blake Emert put on 10 and Chris Olson added four.
START YOUR ENGINESA new term in the Texas Tech offense is “NASCAR” and the only setback might be the fact that the officiating crew may not be able to keep pace. First-year offense coordinator Neal Brown will play an up-tempo scheme designed to keep the of-fense in a rhythm and hopefully the defense on its heels. One of the biggest changes from years past, is that the play calling will come from the sidelines and will no longer be in the hands of the quarterback.
TECH’S RECORD WHENOverall Record ................................................................2-0Big 12 Record .................................................................0-0Non-Conference ............................................................. 2-0Home ..............................................................................1-0Away ..............................................................................1-0Neutral ...........................................................................0-0Current Streak .......................................................Won FiveCurrent Home Streak .......................................... Won ThreeCurrent Road Streak .............................................. Won OneCurrent Bowl Streak .............................................. Won OneLast Win .............................52-17 at New Mexico (9/11/10)Last Loss .................... 24-17 at Oklahoma State (11/14/09)Day Games ......................................................................1-0Night Games ....................................................................1-0On Television ..................................................................2-0ABC ................................................................................0-0FSN ................................................................................0-0ESPN ...............................................................................1-0ESPN2 .............................................................................0-0The Mtn...........................................................................1-0August .............................................................................0-0September ......................................................................2-0October ..........................................................................0-0November .......................................................................0-0January ...........................................................................0-0Against Teams In Top 25 ................................................0-0Against Teams In Top 15 ................................................0-0Against Teams In Top 10 ................................................0-0vs. Non-Ranked Teams ....................................................2-0On Natural Grass ............................................................1-0On Field Turf ...................................................................1-0When Tech Scores First ..................................................2-0Opponent Scores First .....................................................0-0Come-From-Behind Wins ..................................................0-0Leading After First Quarter .............................................2-0Behind After First Quarter ...............................................0-0Tied After First Quarter ..................................................0-0Leading At Halftime ........................................................2-0Behind At Halftime ..........................................................0-0Tied At Halftime .............................................................0-0Leading After Third Quarter ............................................2-0Behind After Third Quarter ..............................................0-0Tied After Third Quarter .................................................0-0Overtime .........................................................................0-0Scoring 20 points or less .................................................0-0Scoring 20 points or more ...............................................2-0Scoring 30+ points .........................................................2-0Allowing 20 points or less ...............................................1-0Allowing 10 points or less ...............................................0-0With a 100-yard rusher ...................................................0-0Allowing a 100-yard rusher .............................................0-0With a 300-yard passer ...................................................1-0With a 400-yard passer ...................................................0-0With a 500-yard passer ....................................................0-0Allowing a 300-yard passer ............................................1-0Allowing a 400-yard passer ............................................0-0More Total Offense Than Opponent ................................2-0Total Offense 300-plus yards ..........................................2-0Total Offense 400-plus yards ..........................................2-0Total Offense 500-plus yards ..........................................0-0Allowing 300-plus yards total offense .............................2-0No Turnovers ..................................................................1-0Less Than Three Turnovers .............................................2-0Three Or More Turnovers ................................................0-0No Takeaways ................................................................0-0Three Or More Takeaways ..............................................2-0Fewer Turnovers .............................................................2-0Equal Turnovers ..............................................................0-0More Turnovers ..............................................................0-0Won Time of Possession .................................................0-0Opponent Controls Time Of Possession ...........................2-0
77
2010 RED RAIDER FOOTBALLTHE STABLE IS FULLTexas Tech running back coach Chad Scott can’t help but get excited when he opens the barn door that reveals a tal-ented stable of running backs. Led by senior Baron Batch, the running back situation at Texas Tech may be at its best since the late 1990’s when Tech had the nickname of “Tailback U.” Batch and sophomore Eric Stephens, who showed tremendous potential as a freshman, are leading the way for the Red Raiders but are a getting a strong push from junior Aaron Crawford and freshman Ben McRoy.
POTTS NAMED STARTING QUARTERBACKSenior gunslingerTaylor Potts was named the starting quarter-back for the 2010 season and will take the reins of the Tech offense against SMU on Sept. 5. Potts, a 2010 Davey O’Brien preseason candidate, made 10 starts in 2009 and threw for 3,440 yards along with 22 touchdowns. He wrapped up the 2009 season in impressive fashion as he threw for 372 yards and two touchdowns on 29-of-43 passing against Michigan State in the Valero Alamo Bowl. That effort paced the Red Raid-ers to a 41-31 win over the Spartans and after the game he was named the offensive most valuable player.
NAME & JERSEY NUMBER CHANGE FOR POTTSNo more “Nick” and no more No. 15. Taylor Potts is just Taylor Potts and he his reverting back to his high school number (12) for his senior season.
NEW PHILOSOPHYPossibly the biggest message of Coach Tuberville’s brief ten-ure at Texas Tech has been that defense wins championships. That mentality has brought an entirely new focus to the Red Raider defensive unit that was often overlooked by Tech’s high-powered offense. Led by coordinator James Willis, the new look Texas Tech defense will be aggressive and has some star power of its own in senior linebacker Bront Bird and Brian Duncan along with senior nose tackle Colby Whitlock. All three players have the potential to play at the next level and will be the catalysts for Willis’ first defensive unit on the South Plains.
BIRD AND DUNCAN CLOG THE MIDDLETexas Tech will have two of the top linebackers in the Big 12 clogging up the middle in 2010 with the return of seniors Bront Bird and Brian Duncan. Duncan was the team leader in tackles last season with 88 and will be another key figure in 2010. Duncan will be moving to the outside this year and will at times be like a rush end. He has been named to the watchlists for the Butkus Award as well as the Lott and Nagurski Trophies. Bird finished sixth on the team in 2009 with 56 total tackles and has become one of the key leaders on the defensive unit. He gained nearly 10 pounds in the off season and will make the move to middle linebacker after playing previously on the outside.
DAVIS LOOKS FOR BIG THINGS AS SOPHOMORESophomore safety Cody Davis earned Freshman All-American honors in his Red Raider debut in 2009 and now he’s looking to shake the freshman title and become Tech’s first defensive All-American since Kevin Curtis in 2001. Davis was second on the squad with 81 total tackles in 2009 and picked up honorable mention All-Big 12 accolades.
TEAM COMPARISONSOffensive Numbers Tech UTRushing Yards/Gm ....................................... 112.0 ....................182.0Rushing Yards/Att ........................................... 3.3 ........................4.9Passing Yards/Gm ....................................... 334.5 ....................197.0Passing Yards/Att ......................................... 11.5 ........................6.7Total Offense Yards/Gm .............................. 446.5 ....................379.0Total Offense Yards/Play ................................ 5.5 ........................5.7Points/Gm ..................................................... 43.5 ......................34.0
Defensive Numbers Tech UTRushing Yards/Gm ....................................... 103.0 ......................73.0Rushing Yards/Att ........................................... 3.8 ........................2.0Passing Yards/Gm ....................................... 277.0 ....................165.0Passing Yards/Att ........................................... 6.2 ........................6.7Total Offense Yards/Gm .............................. 380.0 ....................238.0Total Offense Yards/Play ................................ 5.3 ........................3.9Points/Gm ..................................................... 22.0 ......................12.0
NCAA RANKINGSOffense Tech UTRushing ................................................................93 ....................44Passing .................................................................11 ....................72Total.....................................................................29 ....................64Scoring ..............................................................T-17 .................T-39
Defense Tech UTRush .....................................................................41 ....................13Pass .....................................................................48 ....................69Total..................................................................T-80 ....................15Scoring .................................................................62 ....................17
Returns Tech UTPunt .....................................................................57 ....................23Kickoff ...................................................................4 ..................105
Miscellaneous Tech UTNet Punting ............................................................3 ....................82Turnover Margin ..................................................T-7 .................T-40
Rushing Rank StatTech ......................Baron Batch .......................... NR ...............42.00UT .........................Foswhitt Whittaker................ NR ...............56.50
Passing Rank StatTech ......................Taylor Potts ...........................29 .............153.87UT .........................Garrett Gilbert ........................71 .............124.82
Total Offense Rank StatTech ......................Taylor Potts ...........................11 .............316.50UT .........................Garrett Gilbert .....................T-62 .............210.00
Receptions/Gm Rank StatTech ......................Lyle Leong .............................T-9 .................8.00UT .........................Marcus Davis ........................ NR .................3.50
Receiving Yd/Gm Rank StatTech ......................Lyle Leong ..............................12 .............108.50UT .........................Marcus Davis ........................ NR ...............52.00
Punting Rank StatTech ......................Jonathan LaCour ................... NR ...............48.00UT .........................John Gold .............................. NR .................37.7
Punt Returns Rank StatTech ......................Detron Lewis ......................... NR .................6.00UT .........................Curtis Brown ..........................14 ...............17.33
Kickoff Returns Rank StatTech ......................Eric Stephens .........................10 ...............33.00UT .........................Eddie Jones ........................... NR ...............13.67
Scoring Rank StatTech ......................Lyle Leong .............................T-5 ...............15.00UT .........................Justin Tucker ......................T-10 .................2.00

88
2010 RED RAIDER FOOTBALLDEPTH CHART - TEXAS
OFFENSE DEFENSE
65 LaAdrian Waddle 6-6 322 So-1L Columbus, Texas74 Mickey Okafor 6-6 305 Jr-2L Houston, Texas
78 Lonnie Edwards 6-4 322 Jr-2L Brownsboro, Texas61 Jonathan Guerra 6-4 297 Jr-SQ Victoria, Texas
73 Justin Keown 6-4 300 Jr-3L Anderson, S.C.75 Blake Emert 6-5 297 Jr-1L Garland, Texas
66 Deveric Gallington 6-3 314 So-1L North Richland Hills, Texas59 Joel Gray 6-6 302 Fr-RS Lewisville, Texas
70 Chris Olson 6-5 300 Sr-3L Dallas, Texas68 Terry McDaniel 6-6 315 So-1L Diana, Texas
12 Taylor Potts 6-5 222 Sr-3L Abilene, Texas1 Steven Sheffield 6-4 197 Sr-3L Austin, Texas
25 Baron Batch 5-10 210 Sr-3L Midland, Texasor 24 Eric Stephens 5-8 192 So-1L Mansfield, Texas32 Aaron Crawford 5-10 205 Jr-1L Memphis, Tenn.
19 Lyle Leong 6-1 175 Sr-3L Abilene, Texas18 Eric Ward 6-0 202 Fr-RS Wichita Falls, Texas14 Darrin Moore 6-4 210 So-TR Irving, Texas
11 Tramain Swindall 6-3 184 Jr-2L Oklahoma City, Okla.2 Cornelius Douglas 5-10 200 So-SQ Lawton, Okla.83 Blake Kelley 5-10 188 Sr-SQ Beaumont, Texas
17 Detron Lewis 6-0 208 Sr-3L College Station, Texas82 Adam James 6-3 233 Jr-2L Celina, Texas6 Austin Zouzalik 5-11 191 So-1L Lubbock, Texas
8 Jacoby Franks 6-0 185 Jr-2L Orange, Texasor 86 Alex Torres 6-1 196 So-1L El Paso, Texas4 Derrick Mays 5-10 174 Fr-RS Killeen, Texas
LT
LG
C
RG
RT
QB
F
X
H
Y
Z
LE
DT
NT
RE
LB
LB
LB
LC
LS
RS
RC
94 Scott Smith 6-6 266 Jr-TR Kailua, Hawaii91 Kerry Hyder 6-2 265 Fr-RS Austin, Texas90 David Neill 6-5 284 Jr-2L Flower Mound, Texas
98 Donald Langley 6-2 274 Jr-TR Germantown, Md.92 Lawrence Rumph 6-3 284 Jr-TR Keller, Texas61 Bobbie Agoucha 6-4 341 Jr-TR Houston, Texas
93 Colby Whitlock 6-3 294 Sr-3L Noble, Okla.47 Myles Wade 6-1 300 Jr-1L Portland, Ore.99 Chris Perry 6-4 309 Jr-2L Keller, Texas
57 Brian Duncan 6-1 248 Sr-3L Baton Rouge, La.40 Aundrey Barr 6-2 230 Fr-RS Carrollton, Texas
41 Sam Fehoko 6-0 233 Jr-2L Honolulu, Hawaii45 Tyrone Sonier 6-2 233 Jr-2L Missouri City, Texas
20 Bront Bird 6-4 248 Sr-3L Odessa, Texas51 Cqulin Hubert 6-2 231 Fr-HS Houston, Texas
13 Julius Howard 5-11 220 Sr-3L Irving, Texas42 Daniel Cobb 6-0 215 Fr-RS Killeen, Texas
7 Will Ford 6-0 195 So-1L Abilene, Texas5 Tre’ Porter 6-0 182 Fr-HS Midwest City, Okla.
16 Cody Davis 6-2 194 So-1L Stephenville, Texas1 Terrance Bullitt 6-3 191 Fr-RS Garland, Texas
26 Franklin Mitchem 6-2 200 Sr-2L Klein, Texas30 Brett Dewhurst 5-11 197 Jr-2L Klein, Texas
12 D.J. Johnson 6-0 190 So-1L Austin, Texas21 Jarvis Phillips 5-10 189 Fr-RS Dallas, Texas
SPECIAL TEAMS
P
PK
9 Jonathan LaCour 6-1 216 Sr-2L Kingwood, Texas43 Ryan Erxleben 6-1 192 So-1L Lake Travis, Texas
85 Matt Williams 5-10 170 Sr-2L Weatherford, Texas49 Donnie Carona 6-0 217 Jr-2L Beaumont, Texas
6 Austin Zouzalik 5-11 191 So-1L Lubbock, Texas17 Detron Lewis 6-0 208 Sr-3L College Station, Texas
24 Eric Stephens 5-8 192 So-1L Mansfield, Texas
2 Cornelius Douglas 5-10 200 So-SQ Lawton, Okla.
49 Donnie Carona 6-0 217 Jr-2L Beaumont, Texas85 Matt Williams 5-10 170 Sr-2L Weatherford, TexasKO
60 Jesse Smitherman 6-3 235 Jr-SQ Burleson, Texas52 Alex Chester 5-11 200 Fr-HS Austin, Texas
9 Jonathan LaCour 6-1 216 Sr-2L Kingwood, Texas6 Austin Zouzalik 5-11 191 So-1L Lubbock, Texas
SAM
MIKE
WILL
DS
H
PR
KR
KR
PRONUNCIATION GUIDEUrell Johnnson ______________ YOU-rel Jacob Karam ________________ CARE-umAustin Zouzalik ______________ zoo-ZAH-lickSeth Doege _________________ DAY-guiEugene Neboh _______________ KNEE-bowGerardo Acevedo _____________ asah-VAY-dohSam Fehoko ________________ fee-HOKE-ohRyan Erleben ________________ urx-LEY-benCqulin Hubert _______________ CUE-lin; HUE-bertTyrone Sonier _______________ sone-YAYTahrick Peak ________________ tuh-REEKBobbie Agoucha ______________ uh-GOOCH-aJustin Keown _______________ COW-uhnLawrence Rumph _____________ RUMP
99
2010 RED RAIDER FOOTBALL
NO PLAYER POS HT WT YR-EX HOMETOWN/HIGH SCHOOL/LAST SCHOOL1 Terrance Bullitt S 6-3 191 Fr-RS Garland, Texas/Naaman Forest1 Steven Sheffield QB 6-4 197 Sr-3L Austin, Texas/Connally2 Cornelius Douglas IR 5-10 200 So-Sq Lawton, Okla./Lawton3 Urell Johnson DB 6-0 163 Fr-HS New Orleans, La./O. Perry Walker3 Jacob Karam QB 6-0 211 Fr-RS Friendswood,Texas/Friendswood4 Derrick Mays WR 5-10 174 Fr-RS Killeen, Texas/Shoemaker5 Tre’ Porter CB 6-0 182 Fr-HS Midwest City, Okla./Carl Albert 6 Austin Zouzalik IR 5-11 191 So-1L Lubbock, Texas/Coronado7 Seth Doege QB 6-1 200 So-1L Wolfforth, Texas/Frenship7 Will Ford DB 6-0 190 So-1L Abilene, Texas/Cooper8 Jacoby Franks WR 6-0 195 Jr-2L Orange, Texas/West Orange-Stark9 Jonathan LaCour P 6-1 216 Jr-2L Kingwood, Texas/Kingwood10 Harrison Jeffers RB 5-7 201 So-1L Lawton, Okla./Eisenhower11 Tramain Swindall IR 6-3 184 Jr-2L Oklahoma City, Okla./Millwood12 D.J. Johnson DB 6-0 190 So-1L Austin, Texas/St. Stephen’s Episcopal12 Taylor Potts QB 6-5 222 Sr-3L Abilene, Texas/Abilene13 Julius Howard LB 5-11 220 Sr-3L Irving, Texas/Nimitz14 Darrin Moore WR 6-4 210 So-TR Irving, Texas/McArthur/Blinn College16 Cody Davis S 6-2 194 So-1L Stephenville, Texas/Stephenville17 Detron Lewis IR 6-0 208 Sr-3L College Station, Texas/A&M Consolidated18 Eric Ward WR 6-0 202 Fr-RS Wichita Falls, Texas/Rider19 Lyle Leong WR 6-1 175 Sr-3L Abilene, Texas/Abilene20 Bront Bird LB 6-4 248 Sr-3L Odessa, Texas /Permian21 Jarvis Phillips DB 5-10 189 Fr-RS Dallas, Texas/Carter24 Eric Stephens RB 5-8 192 So-1L Mansfield, Texas/Timberview25 Baron Batch RB 5-10 210 Sr-3L Midland, Texas/Midland26 Franklin Mitchem S 6-2 200 Sr-2L Klein, Texas/Collins27 Zach Winbush LB 6-1 206 Fr-HS Schertz, Texas/Clemens29 Michael Aguilar LB 5-11 238 Sr-Sq Harlingen, Texas/Harlingen/Texas A&M-Kingsville30 Brett Dewhurst S 5-11 197 Jr-2L Klein, Texas/Klein31 Eugene Neboh CB 5-10 174 So-Sq Odessa, Texas/Permian32 Aaron Crawford RB 5-10 205 Jr-1L Memphis, Tenn./Ridgeway34 Ben McRoy ATH 5-9 160 Fr-HS Lakeland, Fla./Lakeland35 Arlan Waller DB 6-0 190 So-Sq DeSoto, Texas/DeSoto 36 Gerardo Acevedo RB 6-1 212 Sr-1L Mission, Texas/Veterans Memorial37 Andre McCorkle RB 6-1 210 Sr-Sq Corpus Christi, Texas/Texas State40 Aundrey Barr DE 6-2 230 Fr-RS Carrollton, Texas/Newman Smith41 Sam Fehoko LB 6-0 233 Jr-2L Honolulu, Hawaii/Farrington42 Daniel Cobb LB 6-0 215 Fr-RS Killeen, Texas/Ellison43 Ryan Erxleben P 6-1 192 So-1L Lake Travis, Texas/Lake Travis45 Tyrone Sonier LB 6-2 233 Jr-2L Missouri City, Texas /Fort Bend Marshall47 Myles Wade DT 6-1 300 Jr-1L Portland, Ore./Central Catholic/Arizona Western CC49 Donnie Carona K 5-11 217 Jr-2L Beaumont, Texas/Kelly51 Cqulin Hubert LB 6-2 231 Fr-HS Houston, Texas/Eisenhower52 Alex Chester DS 5-11 200 Fr-HS Austin, Texas/Austin56 Jonathan Brydon LB 6-4 236 Sr-1L San Antonio, Texas/Clark57 Brian Duncan DE 6-1 248 Sr-3L Baton Rouge, La./Tara59 Joel Gray OL 6-6 302 Fr-RS Lewisville, Texas/Hebron60 Jesse Smitherman DS 6-3 235 Jr-Sq Burleson, Texas/Burleson/Kilgore College61 Jonathan Guerra OL 6-4 297 Jr-Sq Victoria, Texas/Memorial65 LaAdrian Waddle OL 6-6 322 So-1L Columbus, Texas/Columbus66 Deveric Gallington OL 6-3 314 So-1L North Richland Hills, Texas/Richland68 Terry McDaniel OL 6-6 315 So-1L Diana, Texas/New Diana70 Chris Olson OL 6-5 300 Sr-3L Dallas, Texas/Highland Park72 Beau Carpenter OL 6-6 293 Fr-HS Sulphur Springs, Texas/Sulphur Springs73 Justin Keown C 6-4 300 Jr-2L Anderson, S.C./Hargrave Military Academy74 Mickey Okafor OL 6-6 305 Jr-2L Houston, Texas/Westbury75 Blake Emert OL 6-5 297 Jr-1L Garland, Texas/Sachse78 Lonnie Edwards OL 6-4 322 Jr-2L Brownsboro, Texas /Brownsboro82 Adam James IR 6-3 233 Jr-2L Celina, Texas/Celina83 Blake Kelley IR 5-10 188 Sr-Sq Beaumont, Texas/West Brook/Blinn College85 Matt Williams PK 5-10 170 Sr-2L Weatherford, Texas/Weatherford86 Alexander Torres WR 6-1 199 So-1L El Paso, Texas/Franklin87 Aaron Fisher WR 6-2 186 Fr-RS Keller, Texas/Fossil Ridge90 David Neill DL 6-5 284 Jr-2L Flower Mound, Texas/Marcus 91 Kerry Hyder DE 6-2 265 Fr-RS Austin, Texas/Lyndon B. Johnson92 Lawrence Rumph DT 6-3 284 Jr-TR Keller, Texas /Fossil Ridge/Navarro JC93 Colby Whitlock DL 6-3 294 Sr-3L Noble, Okla./Noble94 Scott Smith DE 6-6 266 Jr-TR Kailua, Hawaii/St. Louis/Buter CC98 Donald Langley DT 6-2 274 Jr-TR Germantown, Md./Seneca Valley/Copiah-Lincoln CC99 Chris Perry DL 6-4 309 Jr-2L Keller, Texas/Fossil Ridge/Miami (Fla.)
DRESS ROSTER - NEW MEXICO
1010
2010 RED RAIDER FOOTBALL
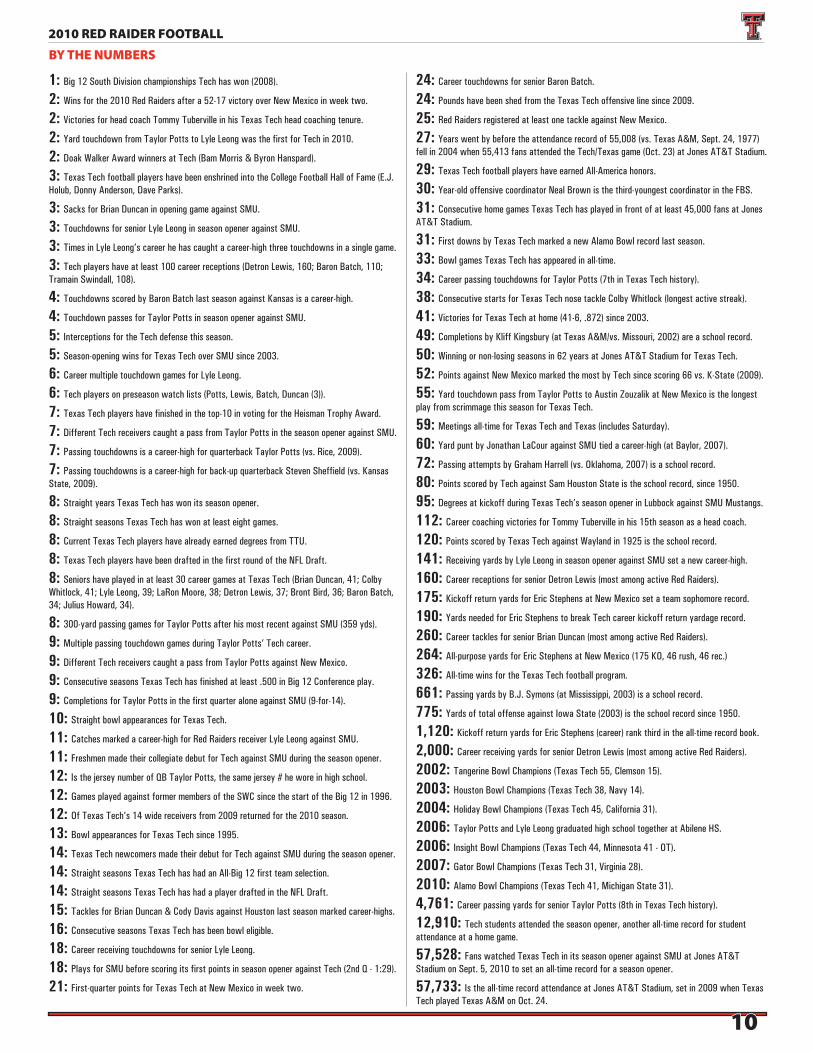
BY THE NUMBERS
1: Big 12 South Division championships Tech has won (2008).
2: Wins for the 2010 Red Raiders after a 52-17 victory over New Mexico in week two.
2: Victories for head coach Tommy Tuberville in his Texas Tech head coaching tenure.
2: Yard touchdown from Taylor Potts to Lyle Leong was the first for Tech in 2010.
2: Doak Walker Award winners at Tech (Bam Morris & Byron Hanspard).
3: Texas Tech football players have been enshrined into the College Football Hall of Fame (E.J. Holub, Donny Anderson, Dave Parks).
3: Sacks for Brian Duncan in opening game against SMU.
3: Touchdowns for senior Lyle Leong in season opener against SMU.
3: Times in Lyle Leong’s career he has caught a career-high three touchdowns in a single game.
3: Tech players have at least 100 career receptions (Detron Lewis, 160; Baron Batch, 110; Tramain Swindall, 108).
4: Touchdowns scored by Baron Batch last season against Kansas is a career-high.
4: Touchdown passes for Taylor Potts in season opener against SMU.
5: Interceptions for the Tech defense this season.
5: Season-opening wins for Texas Tech over SMU since 2003.
6: Career multiple touchdown games for Lyle Leong.
6: Tech players on preseason watch lists (Potts, Lewis, Batch, Duncan (3)).
7: Texas Tech players have finished in the top-10 in voting for the Heisman Trophy Award.
7: Different Tech receivers caught a pass from Taylor Potts in the season opener against SMU.
7: Passing touchdowns is a career-high for quarterback Taylor Potts (vs. Rice, 2009).
7: Passing touchdowns is a career-high for back-up quarterback Steven Sheffield (vs. Kansas State, 2009).
8: Straight years Texas Tech has won its season opener.
8: Straight seasons Texas Tech has won at least eight games.
8: Current Texas Tech players have already earned degrees from TTU.
8: Texas Tech players have been drafted in the first round of the NFL Draft.
8: Seniors have played in at least 30 career games at Texas Tech (Brian Duncan, 41; Colby Whitlock, 41; Lyle Leong, 39; LaRon Moore, 38; Detron Lewis, 37; Bront Bird, 36; Baron Batch, 34; Julius Howard, 34).
8: 300-yard passing games for Taylor Potts after his most recent against SMU (359 yds).
9: Multiple passing touchdown games during Taylor Potts’ Tech career.
9: Different Tech receivers caught a pass from Taylor Potts against New Mexico.
9: Consecutive seasons Texas Tech has finished at least .500 in Big 12 Conference play.
9: Completions for Taylor Potts in the first quarter alone against SMU (9-for-14).
10: Straight bowl appearances for Texas Tech.
11: Catches marked a career-high for Red Raiders receiver Lyle Leong against SMU.
11: Freshmen made their collegiate debut for Tech against SMU during the season opener.
12: Is the jersey number of QB Taylor Potts, the same jersey # he wore in high school.
12: Games played against former members of the SWC since the start of the Big 12 in 1996.
12: Of Texas Tech’s 14 wide receivers from 2009 returned for the 2010 season.
13: Bowl appearances for Texas Tech since 1995.
14: Texas Tech newcomers made their debut for Tech against SMU during the season opener.
14: Straight seasons Texas Tech has had an All-Big 12 first team selection.
14: Straight seasons Texas Tech has had a player drafted in the NFL Draft.
15: Tackles for Brian Duncan & Cody Davis against Houston last season marked career-highs.
16: Consecutive seasons Texas Tech has been bowl eligible.
18: Career receiving touchdowns for senior Lyle Leong.
18: Plays for SMU before scoring its first points in season opener against Tech (2nd Q - 1:29).
21: First-quarter points for Texas Tech at New Mexico in week two.
24: Career touchdowns for senior Baron Batch.
24: Pounds have been shed from the Texas Tech offensive line since 2009.
25: Red Raiders registered at least one tackle against New Mexico.
27: Years went by before the attendance record of 55,008 (vs. Texas A&M, Sept. 24, 1977) fell in 2004 when 55,413 fans attended the Tech/Texas game (Oct. 23) at Jones AT&T Stadium.
29: Texas Tech football players have earned All-America honors.
30: Year-old offensive coordinator Neal Brown is the third-youngest coordinator in the FBS.
31: Consecutive home games Texas Tech has played in front of at least 45,000 fans at Jones AT&T Stadium.
31: First downs by Texas Tech marked a new Alamo Bowl record last season.
33: Bowl games Texas Tech has appeared in all-time.
34: Career passing touchdowns for Taylor Potts (7th in Texas Tech history).
38: Consecutive starts for Texas Tech nose tackle Colby Whitlock (longest active streak).
41: Victories for Texas Tech at home (41-6, .872) since 2003.
49: Completions by Kliff Kingsbury (at Texas A&M/vs. Missouri, 2002) are a school record.
50: Winning or non-losing seasons in 62 years at Jones AT&T Stadium for Texas Tech.
52: Points against New Mexico marked the most by Tech since scoring 66 vs. K-State (2009).
55: Yard touchdown pass from Taylor Potts to Austin Zouzalik at New Mexico is the longest play from scrimmage this season for Texas Tech.
59: Meetings all-time for Texas Tech and Texas (includes Saturday).
60: Yard punt by Jonathan LaCour against SMU tied a career-high (at Baylor, 2007).
72: Passing attempts by Graham Harrell (vs. Oklahoma, 2007) is a school record.
80: Points scored by Tech against Sam Houston State is the school record, since 1950.
95: Degrees at kickoff during Texas Tech’s season opener in Lubbock against SMU Mustangs.
112: Career coaching victories for Tommy Tuberville in his 15th season as a head coach.
120: Points scored by Texas Tech against Wayland in 1925 is the school record.
141: Receiving yards by Lyle Leong in season opener against SMU set a new career-high.
160: Career receptions for senior Detron Lewis (most among active Red Raiders).
175: Kickoff return yards for Eric Stephens at New Mexico set a team sophomore record.
190: Yards needed for Eric Stephens to break Tech career kickoff return yardage record.
260: Career tackles for senior Brian Duncan (most among active Red Raiders).
264: All-purpose yards for Eric Stephens at New Mexico (175 KO, 46 rush, 46 rec.)
326: All-time wins for the Texas Tech football program.
661: Passing yards by B.J. Symons (at Mississippi, 2003) is a school record.
775: Yards of total offense against Iowa State (2003) is the school record since 1950.
1,120: Kickoff return yards for Eric Stephens (career) rank third in the all-time record book.
2,000: Career receiving yards for senior Detron Lewis (most among active Red Raiders).
2002: Tangerine Bowl Champions (Texas Tech 55, Clemson 15).
2003: Houston Bowl Champions (Texas Tech 38, Navy 14).
2004: Holiday Bowl Champions (Texas Tech 45, California 31).
2006: Taylor Potts and Lyle Leong graduated high school together at Abilene HS.
2006: Insight Bowl Champions (Texas Tech 44, Minnesota 41 - OT).
2007: Gator Bowl Champions (Texas Tech 31, Virginia 28).
2010: Alamo Bowl Champions (Texas Tech 41, Michigan State 31).
4,761: Career passing yards for senior Taylor Potts (8th in Texas Tech history).
12,910: Tech students attended the season opener, another all-time record for student attendance at a home game.
57,528: Fans watched Texas Tech in its season opener against SMU at Jones AT&T Stadium on Sept. 5, 2010 to set an all-time record for a season opener.
57,733: Is the all-time record attendance at Jones AT&T Stadium, set in 2009 when Texas Tech played Texas A&M on Oct. 24.
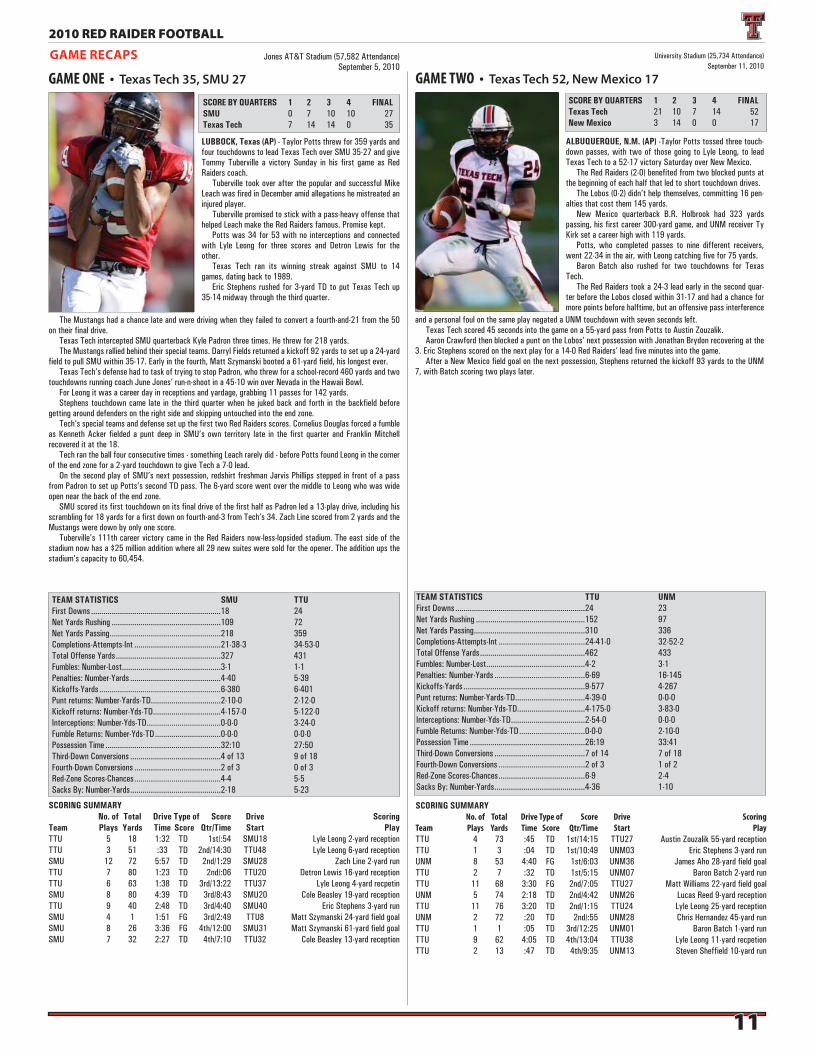
1111
2010 RED RAIDER FOOTBALL
GAME RECAPS
GAME ONE • Texas Tech 35, SMU 27
SCORE BY QUARTERS 1 2 3 4 FINALSMU 0 7 10 10 27Texas Tech 7 14 14 0 35
LUBBOCK, Texas (AP) - Taylor Potts threw for 359 yards and four touchdowns to lead Texas Tech over SMU 35-27 and give Tommy Tuberville a victory Sunday in his first game as Red Raiders coach. Tuberville took over after the popular and successful Mike Leach was fired in December amid allegations he mistreated an injured player. Tuberville promised to stick with a pass-heavy offense that helped Leach make the Red Raiders famous. Promise kept. Potts was 34 for 53 with no interceptions and connected with Lyle Leong for three scores and Detron Lewis for the other. Texas Tech ran its winning streak against SMU to 14 games, dating back to 1989. Eric Stephens rushed for 3-yard TD to put Texas Tech up 35-14 midway through the third quarter.
The Mustangs had a chance late and were driving when they failed to convert a fourth-and-21 from the 50 on their final drive. Texas Tech intercepted SMU quarterback Kyle Padron three times. He threw for 218 yards. The Mustangs rallied behind their special teams. Darryl Fields returned a kickoff 92 yards to set up a 24-yard field to pull SMU within 35-17. Early in the fourth, Matt Szymanski booted a 61-yard field, his longest ever. Texas Tech’s defense had to task of trying to stop Padron, who threw for a school-record 460 yards and two touchdowns running coach June Jones’ run-n-shoot in a 45-10 win over Nevada in the Hawaii Bowl. For Leong it was a career day in receptions and yardage, grabbing 11 passes for 142 yards. Stephens touchdown came late in the third quarter when he juked back and forth in the backfield before getting around defenders on the right side and skipping untouched into the end zone. Tech’s special teams and defense set up the first two Red Raiders scores. Cornelius Douglas forced a fumble as Kenneth Acker fielded a punt deep in SMU’s own territory late in the first quarter and Franklin Mitchell recovered it at the 18. Tech ran the ball four consecutive times - something Leach rarely did - before Potts found Leong in the corner of the end zone for a 2-yard touchdown to give Tech a 7-0 lead. On the second play of SMU’s next possession, redshirt freshman Jarvis Phillips stepped in front of a pass from Padron to set up Potts’s second TD pass. The 6-yard score went over the middle to Leong who was wide open near the back of the end zone. SMU scored its first touchdown on its final drive of the first half as Padron led a 13-play drive, including his scrambling for 18 yards for a first down on fourth-and-3 from Tech’s 34. Zach Line scored from 2 yards and the Mustangs were down by only one score. Tuberville’s 111th career victory came in the Red Raiders now-less-lopsided stadium. The east side of the stadium now has a $25 million addition where all 29 new suites were sold for the opener. The addition ups the stadium’s capacity to 60,454.
SCORING SUMMARY No. of Total Drive Type of Score Drive ScoringTeam Plays Yards Time Score Qtr/Time Start PlayTTU 5 18 1:32 TD 1st/:54 SMU18 Lyle Leong 2-yard receptionTTU 3 51 :33 TD 2nd/14:30 TTU48 Lyle Leong 6-yard receptionSMU 12 72 5:57 TD 2nd/1:29 SMU28 Zach Line 2-yard runTTU 7 80 1:23 TD 2nd/:06 TTU20 Detron Lewis 16-yard receptionTTU 6 63 1:38 TD 3rd/13:22 TTU37 Lyle Leong 4-yard recpetinSMU 8 80 4:39 TD 3rd/8:43 SMU20 Cole Beasley 19-yard receptionTTU 9 40 2:48 TD 3rd/4:40 SMU40 Eric Stephens 3-yard runSMU 4 1 1:51 FG 3rd/2:49 TTU8 Matt Szymanski 24-yard field goalSMU 8 26 3:36 FG 4th/12:00 SMU31 Matt Szymanski 61-yard field goalSMU 7 32 2:27 TD 4th/7:10 TTU32 Cole Beasley 13-yard reception
TEAM STATISTICS SMU TTUFirst Downs ...............................................................18 24Net Yards Rushing .....................................................109 72Net Yards Passing ......................................................218 359Completions-Attempts-Int ..........................................21-38-3 34-53-0Total Offense Yards ...................................................327 431Fumbles: Number-Lost ................................................3-1 1-1Penalties: Number-Yards ............................................4-40 5-39Kickoffs-Yards ...........................................................6-380 6-401Punt returns: Number-Yards-TD..................................2-10-0 2-12-0Kickoff returns: Number-Yds-TD.................................4-157-0 5-122-0Interceptions: Number-Yds-TD ....................................0-0-0 3-24-0Fumble Returns: Number-Yds-TD ................................0-0-0 0-0-0Possession Time ........................................................32:10 27:50Third-Down Conversions ............................................4 of 13 9 of 18Fourth-Down Conversions ..........................................2 of 3 0 of 3Red-Zone Scores-Chances ..........................................4-4 5-5Sacks By: Number-Yards ............................................2-18 5-23
Jones AT&T Stadium (57,582 Attendance)September 5, 2010
GAME TWO • Texas Tech 52, New Mexico 17SCORE BY QUARTERS 1 2 3 4 FINALTexas Tech 21 10 7 14 52New Mexico 3 14 0 0 17
ALBUQUERQUE, N.M. (AP) -Taylor Potts tossed three touch-down passes, with two of those going to Lyle Leong, to lead Texas Tech to a 52-17 victory Saturday over New Mexico. The Red Raiders (2-0) benefited from two blocked punts at the beginning of each half that led to short touchdown drives. The Lobos (0-2) didn’t help themselves, committing 16 pen-alties that cost them 145 yards. New Mexico quarterback B.R. Holbrook had 323 yards passing, his first career 300-yard game, and UNM receiver Ty Kirk set a career high with 119 yards. Potts, who completed passes to nine different receivers, went 22-34 in the air, with Leong catching five for 75 yards. Baron Batch also rushed for two touchdowns for Texas Tech. The Red Raiders took a 24-3 lead early in the second quar-ter before the Lobos closed within 31-17 and had a chance for more points before halftime, but an offensive pass interference
and a personal foul on the same play negated a UNM touchdown with seven seconds left. Texas Tech scored 45 seconds into the game on a 55-yard pass from Potts to Austin Zouzalik. Aaron Crawford then blocked a punt on the Lobos’ next possession with Jonathan Brydon recovering at the 3. Eric Stephens scored on the next play for a 14-0 Red Raiders’ lead five minutes into the game. After a New Mexico field goal on the next possession, Stephens returned the kickoff 93 yards to the UNM 7, with Batch scoring two plays later.
SCORING SUMMARY No. of Total Drive Type of Score Drive Scoring
Team Plays Yards Time Score Qtr/Time Start Play
TTU 4 73 :45 TD 1st/14:15 TTU27 Austin Zouzalik 55-yard receptionTTU 1 3 :04 TD 1st/10:49 UNM03 Eric Stephens 3-yard runUNM 8 53 4:40 FG 1st/6:03 UNM36 James Aho 28-yard field goalTTU 2 7 :32 TD 1st/5:15 UNM07 Baron Batch 2-yard runTTU 11 68 3:30 FG 2nd/7:05 TTU27 Matt Williams 22-yard field goalUNM 5 74 2:18 TD 2nd/4:42 UNM26 Lucas Reed 9-yard receptionTTU 11 76 3:20 TD 2nd/1:15 TTU24 Lyle Leong 25-yard receptionUNM 2 72 :20 TD 2nd/:55 UNM28 Chris Hernandez 45-yard runTTU 1 1 :05 TD 3rd/12:25 UNM01 Baron Batch 1-yard runTTU 9 62 4:05 TD 4th/13:04 TTU38 Lyle Leong 11-yard recpetionTTU 2 13 :47 TD 4th/9:35 UNM13 Steven Sheffield 10-yard run
TEAM STATISTICS TTU UNMFirst Downs ...............................................................24 23Net Yards Rushing .....................................................152 97Net Yards Passing ......................................................310 336Completions-Attempts-Int ..........................................24-41-0 32-52-2Total Offense Yards ...................................................462 433Fumbles: Number-Lost ................................................4-2 3-1Penalties: Number-Yards ............................................6-69 16-145Kickoffs-Yards ...........................................................9-577 4-267Punt returns: Number-Yards-TD..................................4-39-0 0-0-0Kickoff returns: Number-Yds-TD.................................4-175-0 3-83-0Interceptions: Number-Yds-TD ....................................2-54-0 0-0-0Fumble Returns: Number-Yds-TD ................................0-0-0 2-10-0Possession Time ........................................................26:19 33:41Third-Down Conversions ............................................7 of 14 7 of 18Fourth-Down Conversions ..........................................2 of 3 1 of 2Red-Zone Scores-Chances ..........................................6-9 2-4Sacks By: Number-Yards ............................................4-36 1-10
University Stadium (25,734 Attendance)September 11, 2010
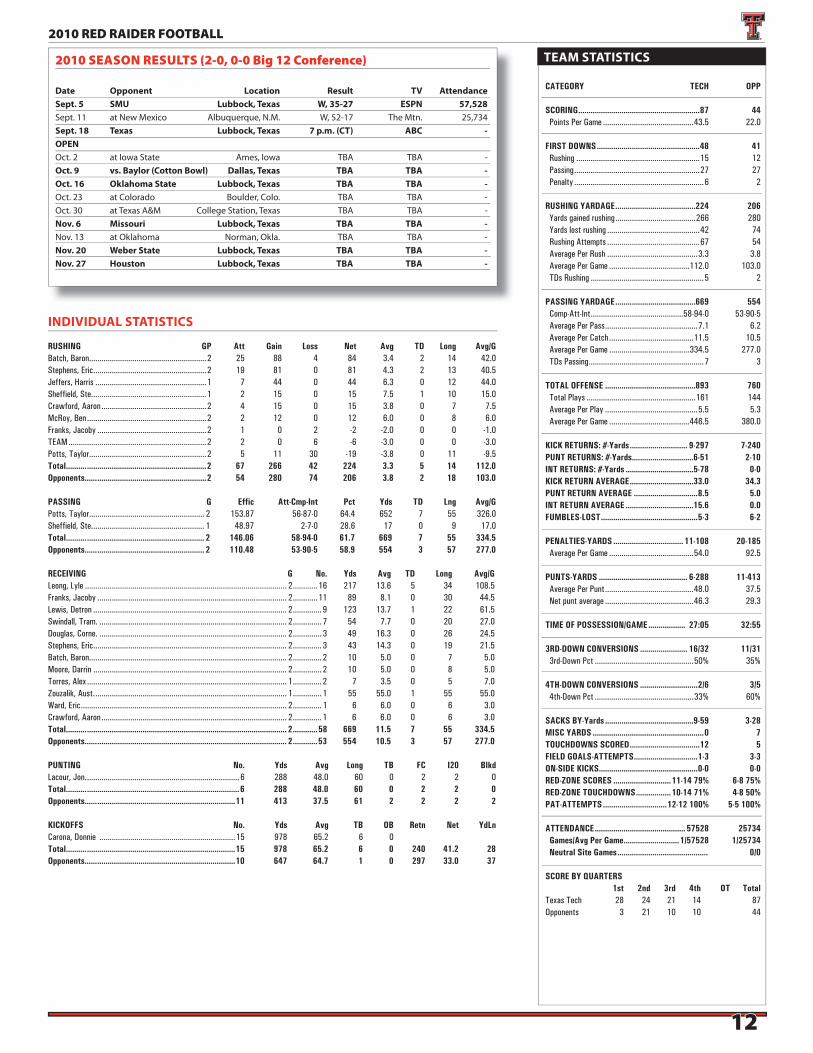
1212
2010 RED RAIDER FOOTBALL
2010 SEASON RESULTS (2-0, 0-0 Big 12 Conference)
Date Opponent Location Result TV AttendanceSept. 5 SMU Lubbock, Texas W, 35-27 ESPN 57,528Sept. 11 at New Mexico Albuquerque, N.M. W, 52-17 The Mtn. 25,734Sept. 18 Texas Lubbock, Texas 7 p.m. (CT) ABC -OPENOct. 2 at Iowa State Ames, Iowa TBA TBA -Oct. 9 vs. Baylor (Cotton Bowl) Dallas, Texas TBA TBA -Oct. 16 Oklahoma State Lubbock, Texas TBA TBA -Oct. 23 at Colorado Boulder, Colo. TBA TBA -Oct. 30 at Texas A&M College Station, Texas TBA TBA -Nov. 6 Missouri Lubbock, Texas TBA TBA -Nov. 13 at Oklahoma Norman, Okla. TBA TBA -Nov. 20 Weber State Lubbock, Texas TBA TBA -Nov. 27 Houston Lubbock, Texas TBA TBA -
CATEGORY TECH OPP
SCORING ...........................................................87 44Points Per Game ............................................43.5 22.0
FIRST DOWNS ..................................................48 41 Rushing ............................................................15 12 Passing .............................................................27 27 Penalty ...............................................................6 2
RUSHING YARDAGE .......................................224 206 Yards gained rushing .......................................266 280 Yards lost rushing .............................................42 74 Rushing Attempts .............................................67 54 Average Per Rush ............................................3.3 3.8 Average Per Game .......................................112.0 103.0 TDs Rushing .......................................................5 2
PASSING YARDAGE .......................................669 554 Comp-Att-Int .............................................58-94-0 53-90-5 Average Per Pass .............................................7.1 6.2 Average Per Catch .........................................11.5 10.5 Average Per Game .......................................334.5 277.0 TDs Passing ........................................................7 3
TOTAL OFFENSE ............................................893 760 Total Plays .....................................................161 144 Average Per Play .............................................5.5 5.3 Average Per Game .......................................446.5 380.0
KICK RETURNS: #-Yards ............................ 9-297 7-240PUNT RETURNS: #-Yards..............................6-51 2-10INT RETURNS: #-Yards .................................5-78 0-0KICK RETURN AVERAGE ...............................33.0 34.3PUNT RETURN AVERAGE ...............................8.5 5.0INT RETURN AVERAGE .................................15.6 0.0FUMBLES-LOST ...............................................5-3 6-2
PENALTIES-YARDS .................................. 11-108 20-185 Average Per Game .........................................54.0 92.5
PUNTS-YARDS ........................................... 6-288 11-413 Average Per Punt ...........................................48.0 37.5 Net punt average ...........................................46.3 29.3
TIME OF POSSESSION/GAME .................. 27:05 32:55
3RD-DOWN CONVERSIONS ....................... 16/32 11/31 3rd-Down Pct ................................................50% 35%
4TH-DOWN CONVERSIONS ............................2/6 3/5 4th-Down Pct ................................................33% 60%
SACKS BY-Yards ...........................................9-59 3-28MISC YARDS ......................................................0 7TOUCHDOWNS SCORED ..................................12 5FIELD GOALS-ATTEMPTS ...............................1-3 3-3ON-SIDE KICKS................................................0-0 0-0RED-ZONE SCORES ............................11-14 79% 6-8 75%RED-ZONE TOUCHDOWNS .................10-14 71% 4-8 50%PAT-ATTEMPTS ...............................12-12 100% 5-5 100%
ATTENDANCE ............................................ 57528 25734 Games/Avg Per Game ...........................1/57528 1/25734 Neutral Site Games ............................................ 0/0
SCORE BY QUARTERS 1st 2nd 3rd 4th OT Total
Texas Tech 28 24 21 14 87Opponents 3 21 10 10 44
INDIVIDUAL STATISTICS
RUSHING GP Att Gain Loss Net Avg TD Long Avg/GBatch, Baron.........................................................2 25 88 4 84 3.4 2 14 42.0Stephens, Eric .......................................................2 19 81 0 81 4.3 2 13 40.5Jeffers, Harris ......................................................1 7 44 0 44 6.3 0 12 44.0Sheffield, Ste. .......................................................1 2 15 0 15 7.5 1 10 15.0Crawford, Aaron ...................................................2 4 15 0 15 3.8 0 7 7.5McRoy, Ben ..........................................................2 2 12 0 12 6.0 0 8 6.0Franks, Jacoby .....................................................2 1 0 2 -2 -2.0 0 0 -1.0TEAM ...................................................................2 2 0 6 -6 -3.0 0 0 -3.0Potts, Taylor.........................................................2 5 11 30 -19 -3.8 0 11 -9.5Total.......... ..........................................................2 67 266 42 224 3.3 5 14 112.0Opponents...... .....................................................2 54 280 74 206 3.8 2 18 103.0
PASSING G Effic Att-Cmp-Int Pct Yds TD Lng Avg/GPotts, Taylor........................................................ 2 153.87 56-87-0 64.4 652 7 55 326.0Sheffield, Ste. ...................................................... 1 48.97 2-7-0 28.6 17 0 9 17.0Total.......... ......................................................... 2 146.06 58-94-0 61.7 669 7 55 334.5Opponents...... .................................................... 2 110.48 53-90-5 58.9 554 3 57 277.0
RECEIVING G No. Yds Avg TD Long Avg/GLeong, Lyle .................................................................................................. 2 ............16 217 13.6 5 34 108.5Franks, Jacoby ............................................................................................ 2 ............11 89 8.1 0 30 44.5Lewis, Detron .............................................................................................. 2 .............. 9 123 13.7 1 22 61.5Swindall, Tram. ........................................................................................... 2 .............. 7 54 7.7 0 20 27.0Douglas, Corne. ........................................................................................... 2 .............. 3 49 16.3 0 26 24.5Stephens, Eric .............................................................................................. 2 .............. 3 43 14.3 0 19 21.5Batch, Baron................................................................................................ 2 .............. 2 10 5.0 0 7 5.0Moore, Darrin .............................................................................................. 2 .............. 2 10 5.0 0 8 5.0Torres, Alex ................................................................................................. 1 .............. 2 7 3.5 0 5 7.0Zouzalik, Aust. ............................................................................................. 1 .............. 1 55 55.0 1 55 55.0Ward, Eric .................................................................................................... 2 .............. 1 6 6.0 0 6 3.0Crawford, Aaron .......................................................................................... 2 .............. 1 6 6.0 0 6 3.0Total.......... ................................................................................................. 2 ............58 669 11.5 7 55 334.5Opponents...... ............................................................................................ 2 ............53 554 10.5 3 57 277.0
PUNTING No. Yds Avg Long TB FC I20 BlkdLacour, Jon. .......................................................................... 6 288 48.0 60 0 2 2 0Total.......... ..........................................................................6 288 48.0 60 0 2 2 0Opponents...... ...................................................................11 413 37.5 61 2 2 2 2
KICKOFFS No. Yds Avg TB OB Retn Net YdLnCarona, Donnie ..................................................................15 978 65.2 6 0 Total.......... ........................................................................15 978 65.2 6 0 240 41.2 28Opponents...... ...................................................................10 647 64.7 1 0 297 33.0 37
TEAM STATISTICS

1313
2010 RED RAIDER FOOTBALLSCORING TD FGs Kick Rush Rcv Pass DXP Saf PointsLeong, Lyle ...........................................................5 0-0 0-0 0-0 0 0-0 0 0 30Williams, Matt ......................................................0 1-2 12-12 0-0 0 0-0 0 0 15Stephens, Eric .......................................................2 0-0 0-0 0-0 0 0-0 0 0 12Batch, Baron.........................................................2 0-0 0-0 0-0 0 0-0 0 0 12Zouzalik, Aust. ......................................................1 0-0 0-0 0-0 0 0-0 0 0 6Lewis, Detron .......................................................1 0-0 0-0 0-0 0 0-0 0 0 6Sheffield, Ste. .......................................................1 0-0 0-0 0-0 0 0-0 0 0 6Carona, Donnie .....................................................0 0-1 0-0 0-0 0 0-0 0 0 0Total.......... ........................................................12 1-3 12-12 0-0 0 0-0 0 0 87Opponents...... .....................................................5 3-3 5-5 0-0 0 0-0 0 0 44
TOTAL OFFENSE G Plays Rush Pass Total Avg/GPotts, Taylor.............................................................................................................2 92 -19 652 633 316.5Batch, Baron.............................................................................................................2 25 84 0 84 42.0Stephens, Eric ...........................................................................................................2 19 81 0 81 40.5Jeffers, Harris ..........................................................................................................1 7 44 0 44 44.0Sheffield, Ste. ...........................................................................................................1 9 15 17 32 32.0Crawford, Aaron .......................................................................................................2 4 15 0 15 7.5McRoy, Ben ..............................................................................................................2 2 12 0 12 6.0Franks, Jacoby .........................................................................................................2 1 -2 0 -2 -1.0TEAM .......................................................................................................................2 2 -6 0 -6 -3.0Total.......... ..............................................................................................................2 161 224 669 893 446.5Opponents...... .........................................................................................................2 144 206 554 760 380.0
FIELD GOALS FGM-FGA Pct 01-19 20-29 30-39 40-49 50-99 Lg BlkWilliams, Matt 1-2 50.0 0-0 1-1 0-0 0-1 0-0 22 1Carona, Donnie 0-1 0.0 0-0 0-0 0-0 0-0 0-1 0 1
FG SEQUENCE Texas Tech OPPONENTSSMU ..................................................................................47,51 ..................................................(24),(61)New Mexico .........................................................................(22) .........................................................(28)Numbers in (parentheses) indicate field goal was made.
ALL PURPOSE G Rush Rec PR KOR IR Tot Avg/GStephens, Eric ....................................................................... 2 81 43 0 297 0 421 210.5Leong, Lyle ........................................................................... 2 0 217 0 0 0 217 108.5Lewis, Detron ....................................................................... 2 0 123 12 0 0 135 67.5Batch, Baron......................................................................... 2 84 10 0 0 0 94 47.0Franks, Jacoby ..................................................................... 2 -2 89 0 0 0 87 43.5Crawford, Aaron ................................................................... 2 15 6 39 0 0 60 30.0Swindall, Tram. .................................................................... 2 0 54 0 0 0 54 27.0Douglas, Corne. .................................................................... 2 0 49 0 0 0 49 24.5Jeffers, Harris ...................................................................... 1 44 0 0 0 0 44 44.0Zouzalik, Aust. ...................................................................... 1 0 55 -15 0 0 40 40.0Ford, Will .............................................................................. 2 0 0 0 0 27 27 13.5Phillips, Jarv. ........................................................................ 2 0 0 0 0 27 27 13.5Sheffield, Ste. ....................................................................... 1 15 0 0 0 0 15 15.0Brydon, Jon. ......................................................................... 2 0 0 15 0 0 15 7.5Porter, Tre’ ........................................................................... 2 0 0 0 0 13 13 6.5McRoy, Ben .......................................................................... 2 12 0 0 0 0 12 6.0Johnson, D.J......................................................................... 2 0 0 0 0 11 11 5.5Moore, Darrin ....................................................................... 2 0 10 0 0 0 10 5.0Torres, Alex .......................................................................... 1 0 7 0 0 0 7 7.0Ward, Eric ............................................................................. 2 0 6 0 0 0 6 3.0TEAM ................................................................................... 2 -6 0 0 0 0 -6 -3.0Potts, Taylor......................................................................... 2 -19 0 0 0 0 -19 -9.5Total.......... ..........................................................................2 224 669 51 297 78 1319 659.5Opponents...... .....................................................................2 206 554 10 240 0 1010 505.0
PUNT RET No. Yds Avg TD LongZouzalik, Aust. ........................2 -15 -7.5 0 3Lewis, Detron .........................2 12 6.0 0 7Brydon, Jon. ...........................1 15 15.0 0 0Crawford, Aaron .....................1 39 39.0 0 0Total.......... ........................... 6 51 8.5 0 7Opponents...... ...................... 2 10 5.0 0 16
INTERCEPTIONS No. Yds Avg TD LongPhillips, Jarv. ..........................2 27 13.5 0 27Ford, Will ................................1 27 27.0 0 27Porter, Tre’ .............................1 13 13.0 0 13Johnson, D.J...........................1 11 11.0 0 11Total.......... ........................... 5 78 15.6 0 27Opponents...... ...................... 0 0 0.0 0 0
KICK RET No. Yds Avg TD LongStephens, Eric .........................9 297 33.0 0 93Total.......... ........................... 9 297 33.0 0 93Opponents...... ...................... 7 240 34.3 0 92
FUMBLE RET No. Yds Avg TD LongTotal.......... ........................... 0 0 0.0 0 0Opponents...... ...................... 2 10 5.0 0 7
CONVERSIONSThird Down 1 2 3 4 TotalTexas Tech 4-8 6-10 3-7 3-7 16-32Opponents 2-8 1-5 4-9 4-9 11-31
Fourth Down 1 2 3 4 TotalTexas Tech 0-0 1-2 0-1 1-2 2-5Opponents 0-0 1-1 1-1 1-3 3-5
TURNOVERSTakeaways – 7Turnovers – 3Points Off Turnovers – Tech: 28 (4 TD, 0 FG) Opponents: 7 (1 TD, 0 FG)Points Off Turnovers/Game – Texas Tech: 14.0 Opponents: 3.5
RED ZONETexas Tech Red Zone Entries – 11-of-14 Scores – 11 (10 TD, 1 FG) Non-Scores – 3 (1 FUMBLE, 1 DOWNS, 1 END OF HALF) Opponent Red Zone Entries – 6-of-8 Scores – 4 (4 TD, 2 FG) Non-Scores – 2 (1 INT, 1 END OF HALF)
KICKOFFSKickoffs – 15Touchbacks – 6Opponent Kickoff Returns – 7 for 240 yards (34.2)Fair Catches – 2Out of Bounds – 0
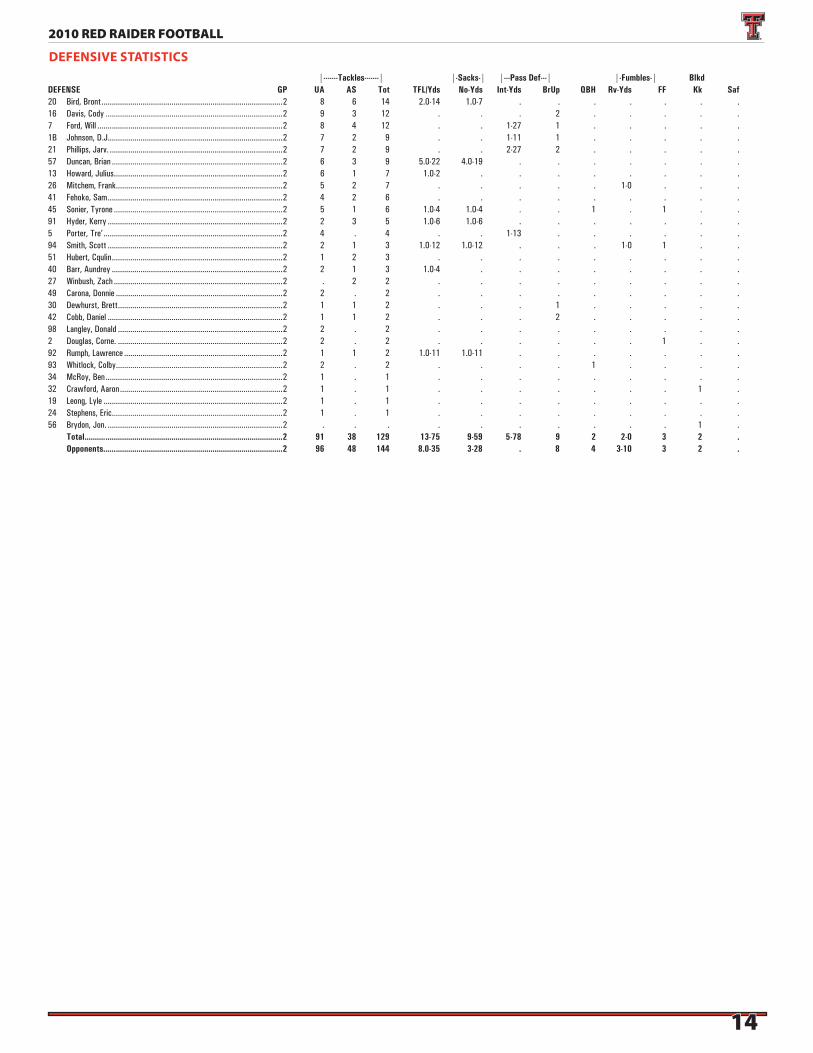
1414
2010 RED RAIDER FOOTBALL
|-------Tackles-------| |-Sacks-| |---Pass Def---| |-Fumbles-| Blkd DEFENSE GP UA AS Tot TFL/Yds No-Yds Int-Yds BrUp QBH Rv-Yds FF Kk Saf20 Bird, Bront ........................................................................................2 8 6 14 2.0-14 1.0-7 . . . . . . .16 Davis, Cody ......................................................................................2 9 3 12 . . . 2 . . . . .7 Ford, Will ..........................................................................................2 8 4 12 . . 1-27 1 . . . . .1B Johnson, D.J.....................................................................................2 7 2 9 . . 1-11 1 . . . . .21 Phillips, Jarv. ....................................................................................2 7 2 9 . . 2-27 2 . . . . .57 Duncan, Brian ...................................................................................2 6 3 9 5.0-22 4.0-19 . . . . . . .13 Howard, Julius ..................................................................................2 6 1 7 1.0-2 . . . . . . . .26 Mitchem, Frank. ................................................................................2 5 2 7 . . . . . 1-0 . . .41 Fehoko, Sam .....................................................................................2 4 2 6 . . . . . . . . .45 Sonier, Tyrone ..................................................................................2 5 1 6 1.0-4 1.0-4 . . 1 . 1 . .91 Hyder, Kerry .....................................................................................2 2 3 5 1.0-6 1.0-6 . . . . . . .5 Porter, Tre’ .......................................................................................2 4 . 4 . . 1-13 . . . . . .94 Smith, Scott .....................................................................................2 2 1 3 1.0-12 1.0-12 . . . 1-0 1 . .51 Hubert, Cqulin ...................................................................................2 1 2 3 . . . . . . . . .40 Barr, Aundrey ...................................................................................2 2 1 3 1.0-4 . . . . . . . .27 Winbush, Zach ..................................................................................2 . 2 2 . . . . . . . . .49 Carona, Donnie .................................................................................2 2 . 2 . . . . . . . . .30 Dewhurst, Brett ................................................................................2 1 1 2 . . . 1 . . . . .42 Cobb, Daniel .....................................................................................2 1 1 2 . . . 2 . . . . .98 Langley, Donald ................................................................................2 2 . 2 . . . . . . . . .2 Douglas, Corne. ................................................................................2 2 . 2 . . . . . . 1 . .92 Rumph, Lawrence .............................................................................2 1 1 2 1.0-11 1.0-11 . . . . . . .93 Whitlock, Colby .................................................................................2 2 . 2 . . . . 1 . . . .34 McRoy, Ben ......................................................................................2 1 . 1 . . . . . . . . .32 Crawford, Aaron ...............................................................................2 1 . 1 . . . . . . . 1 .19 Leong, Lyle .......................................................................................2 1 . 1 . . . . . . . . .24 Stephens, Eric ...................................................................................2 1 . 1 . . . . . . . . .56 Brydon, Jon. .....................................................................................2 . . . . . . . . . . 1 . Total.......... ......................................................................................2 91 38 129 13-75 9-59 5-78 9 2 2-0 3 2 . Opponents...... .................................................................................2 96 48 144 8.0-35 3-28 . 8 4 3-10 3 2 .
DEFENSIVE STATISTICS
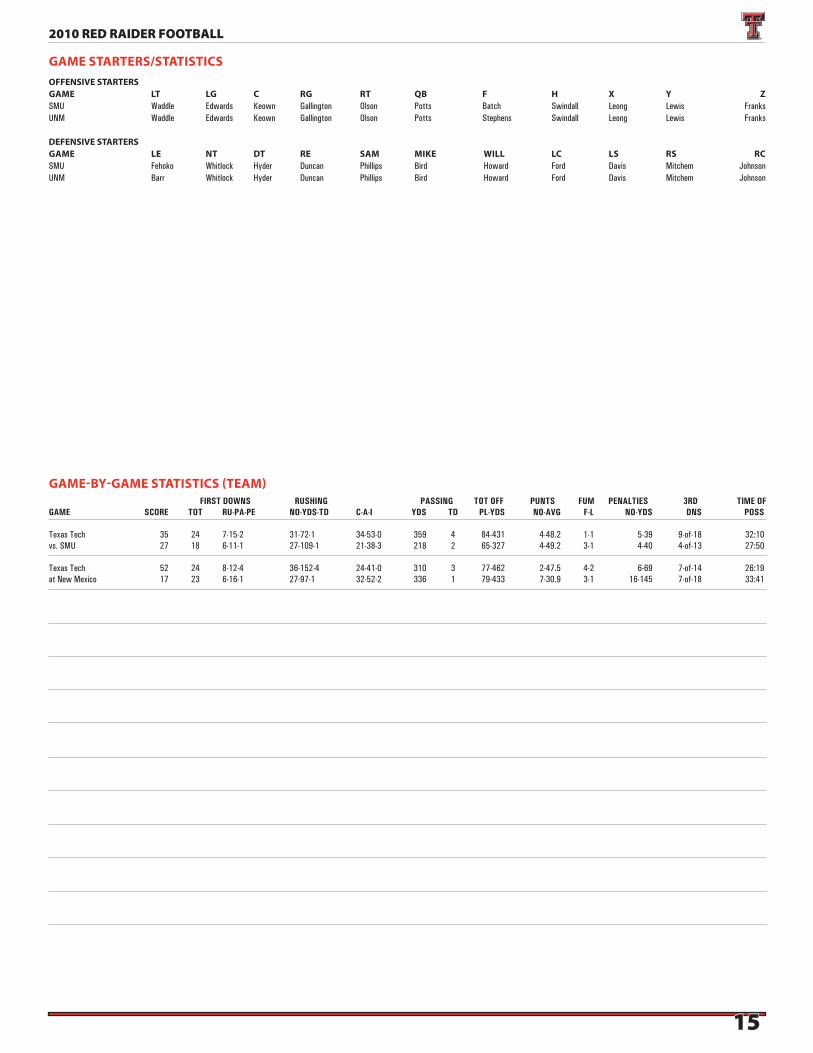
1515
2010 RED RAIDER FOOTBALL
OFFENSIVE STARTERSGAME LT LG C RG RT QB F H X Y ZSMU Waddle Edwards Keown Gallington Olson Potts Batch Swindall Leong Lewis FranksUNM Waddle Edwards Keown Gallington Olson Potts Stephens Swindall Leong Lewis Franks
DEFENSIVE STARTERSGAME LE NT DT RE SAM MIKE WILL LC LS RS RCSMU Fehoko Whitlock Hyder Duncan Phillips Bird Howard Ford Davis Mitchem Johnson UNM Barr Whitlock Hyder Duncan Phillips Bird Howard Ford Davis Mitchem Johnson
FIRST DOWNS RUSHING PASSING TOT OFF PUNTS FUM PENALTIES 3RD TIME OFGAME SCORE TOT RU-PA-PE NO-YDS-TD C-A-I YDS TD PL-YDS NO-AVG F-L NO-YDS DNS POSS
Texas Tech 35 24 7-15-2 31-72-1 34-53-0 359 4 84-431 4-48.2 1-1 5-39 9-of-18 32:10 vs. SMU 27 18 6-11-1 27-109-1 21-38-3 218 2 65-327 4-49.2 3-1 4-40 4-of-13 27:50
Texas Tech 52 24 8-12-4 36-152-4 24-41-0 310 3 77-462 2-47.5 4-2 6-69 7-of-14 26:19at New Mexico 17 23 6-16-1 27-97-1 32-52-2 336 1 79-433 7-30.9 3-1 16-145 7-of-18 33:41
GAME-BY-GAME STATISTICS (TEAM)
GAME STARTERS/STATISTICS

1616
2010 RED RAIDER FOOTBALL
INDIVIDUALGAME-BY GAME STATISTICS
PASSING C-A-I-Yds/TD #12 Potts #1 SheffieldSMU ....................................... 34-53-0-359/4 .......................... DNPUNM ....................................... 22-34-0-293/3 .................2-7-0-17/0
FIELD GOALSMade, Missed, Blocked #49 Carona #85 WilliamsSMU ..............................................................51 .........................47UNM ............................................................................................22
PUNTINGNumber-Avg./I20 #9 LacourSMU ...................................................................................4-48.2/1UNM ...................................................................................2-47.5/1
RUSHINGRush-Yds/TD SMU UNMBatch............................................15-56/0 10-32/2Crawford .......................................... 1-3/0 3-12/0Franks .............................................. 0-0/0 1-(-2)/0Jeffers............................................... 0-00 7-44/0McRoy .............................................. 1-8/0 1-4/0Potts ........................................... 3-(-20)/0 2-1/0Sheffield .............................................DNP 2-15/1Stephens ........................................ 9-35/1 10-46/1
RECEIVINGRec-Yds/TD SMU UNM Batch.............................................. 2-10/0 0-0/0Crawford .......................................... 0-0/0 1-6/0 Douglas .......................................... 3-49/0 0-0/0Franks ............................................ 6-31/0 5-58/0Leong..........................................11-142/3 5-75/2Lewis .............................................. 6-79/1 3-44/0Moore ............................................... 0-0/0 2-10/0 Stephens .......................................... 0-0/0 3-43/0Swindall ......................................... 5-42/0 2-12/0Torres .................................................DNP 2-7/0Ward................................................. 1-6/0 0-0/0Zouzalik ..............................................DNP 1-55/1
TACKLESUT-AT-TT SMU UNMBarr .......................................... 1-0-1 1-1-2 Bird .......................................... 5-0-5 3-6-9 Carona ...................................... 1-0-1 1-0-1Cobb ......................................... 0-0-0 1-1-2Crawford .................................. 0-0-0 1-0-1Davis ........................................ 5-0-5 4-3-7Dewhurst .................................. 0-0-0 1-1-2Douglas .................................... 0-0-0 1-0-1Duncan ..................................... 4-1-5 2-2-4Ford .......................................... 4-1-5 4-3-7Fehoko ...................................... 4-1-5 0-1-1Howard..................................... 3-0-3 3-1-4Hubert ...................................... 0-0-0 1-2-3Hyder........................................ 1-0-1 1-3-4Johnson .................................... 3-0-3 4-2-6Langley ..................................... 1-0-1 1-0-1Leong........................................ 0-0-0 1-0-1McRoy ...................................... 1-0-1 0-0-0Mitchem ................................... 5-1-6 0-1-1Phillips. ..................................... 5-0-5 2-2-4Porter ....................................... 0-0-0 4-0-4Rumph ...................................... 0-0-0 1-1-2Smith ........................................ 0-0-0 2-1-3Sonier ....................................... 2-0-2 3-1-4Stephens .................................. 1-0-1 1-0-1Whitlock ................................... 2-0-2 0-0-0Winbush .................................... 0-0-0 0-2-2
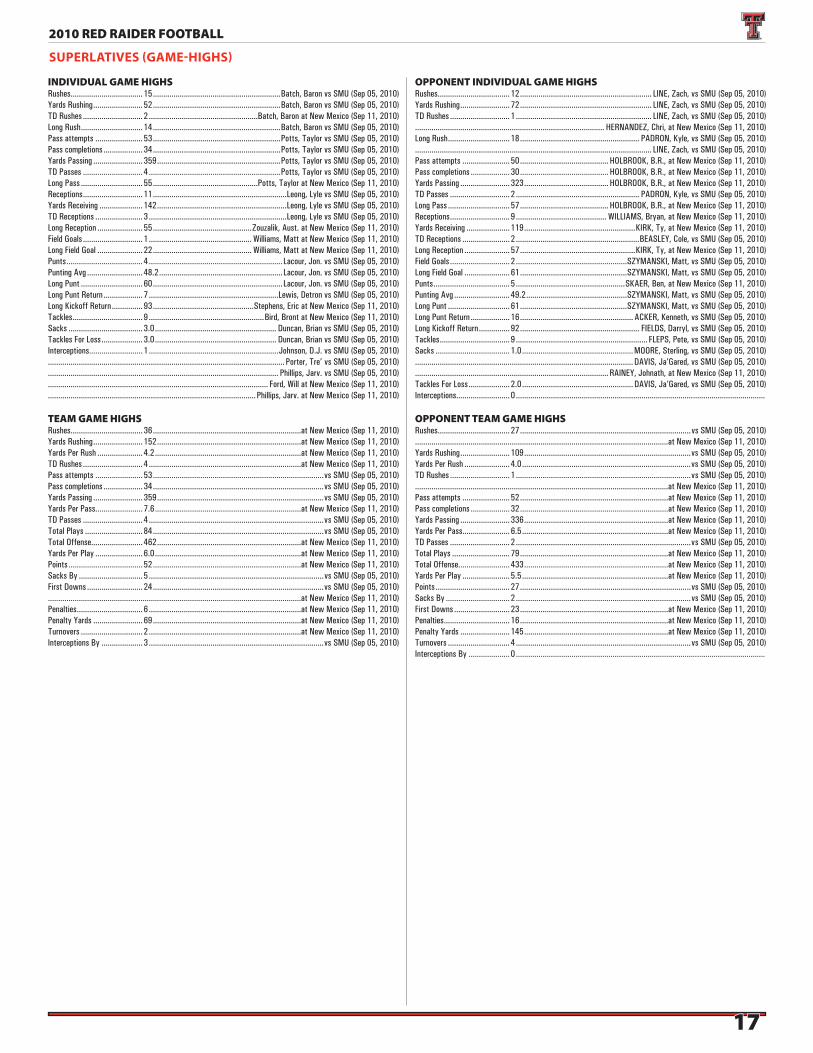
1717
2010 RED RAIDER FOOTBALL
INDIVIDUAL GAME HIGHSRushes................................... 15 ..............................................................Batch, Baron vs SMU (Sep 05, 2010)Yards Rushing ........................ 52 ..............................................................Batch, Baron vs SMU (Sep 05, 2010)TD Rushes ............................. 2 .....................................................Batch, Baron at New Mexico (Sep 11, 2010)Long Rush .............................. 14 ..............................................................Batch, Baron vs SMU (Sep 05, 2010)Pass attempts ....................... 53 ..............................................................Potts, Taylor vs SMU (Sep 05, 2010)Pass completions ................... 34 ..............................................................Potts, Taylor vs SMU (Sep 05, 2010)Yards Passing ........................ 359 ............................................................Potts, Taylor vs SMU (Sep 05, 2010)TD Passes ............................. 4 ................................................................Potts, Taylor vs SMU (Sep 05, 2010)Long Pass .............................. 55 ...................................................Potts, Taylor at New Mexico (Sep 11, 2010)Receptions ............................. 11 .................................................................Leong, Lyle vs SMU (Sep 05, 2010)Yards Receiving ..................... 142 ...............................................................Leong, Lyle vs SMU (Sep 05, 2010)TD Receptions ....................... 3 ...................................................................Leong, Lyle vs SMU (Sep 05, 2010)Long Reception ...................... 55 ................................................Zouzalik, Aust. at New Mexico (Sep 11, 2010)Field Goals ............................. 1 .................................................. Williams, Matt at New Mexico (Sep 11, 2010)Long Field Goal ...................... 22 ................................................ Williams, Matt at New Mexico (Sep 11, 2010)Punts ..................................... 4 .................................................................Lacour, Jon. vs SMU (Sep 05, 2010)Punting Avg ........................... 48.2 ............................................................Lacour, Jon. vs SMU (Sep 05, 2010)Long Punt .............................. 60 ...............................................................Lacour, Jon. vs SMU (Sep 05, 2010)Long Punt Return ................... 7 ...............................................................Lewis, Detron vs SMU (Sep 05, 2010)Long Kickoff Return ............... 93 .................................................Stephens, Eric at New Mexico (Sep 11, 2010)Tackles .................................. 9 ........................................................Bird, Bront at New Mexico (Sep 11, 2010)Sacks .................................... 3.0 ........................................................... Duncan, Brian vs SMU (Sep 05, 2010)Tackles For Loss .................... 3.0 ........................................................... Duncan, Brian vs SMU (Sep 05, 2010)Interceptions.......................... 1 ...............................................................Johnson, D.J. vs SMU (Sep 05, 2010)................................................................................................................... Porter, Tre’ vs SMU (Sep 05, 2010)................................................................................................................ Phillips, Jarv. vs SMU (Sep 05, 2010)........................................................................................................... Ford, Will at New Mexico (Sep 11, 2010)..................................................................................................... Phillips, Jarv. at New Mexico (Sep 11, 2010)
TEAM GAME HIGHSRushes................................... 36 ........................................................................at New Mexico (Sep 11, 2010)Yards Rushing ........................ 152 ......................................................................at New Mexico (Sep 11, 2010)Yards Per Rush ...................... 4.2 .......................................................................at New Mexico (Sep 11, 2010)TD Rushes ............................. 4 ..........................................................................at New Mexico (Sep 11, 2010)Pass attempts ....................... 53 ...................................................................................vs SMU (Sep 05, 2010)Pass completions ................... 34 ...................................................................................vs SMU (Sep 05, 2010)Yards Passing ........................ 359 .................................................................................vs SMU (Sep 05, 2010)Yards Per Pass....................... 7.6 .......................................................................at New Mexico (Sep 11, 2010)TD Passes ............................. 4 .....................................................................................vs SMU (Sep 05, 2010)Total Plays ............................ 84 ...................................................................................vs SMU (Sep 05, 2010)Total Offense......................... 462 ......................................................................at New Mexico (Sep 11, 2010)Yards Per Play ....................... 6.0 .......................................................................at New Mexico (Sep 11, 2010)Points .................................... 52 ........................................................................at New Mexico (Sep 11, 2010)Sacks By ............................... 5 .....................................................................................vs SMU (Sep 05, 2010)First Downs ........................... 24 ...................................................................................vs SMU (Sep 05, 2010)...........................................................................................................................at New Mexico (Sep 11, 2010)Penalties ................................ 6 ..........................................................................at New Mexico (Sep 11, 2010)Penalty Yards ........................ 69 ........................................................................at New Mexico (Sep 11, 2010)Turnovers .............................. 2 ..........................................................................at New Mexico (Sep 11, 2010)Interceptions By .................... 3 .....................................................................................vs SMU (Sep 05, 2010)
OPPONENT INDIVIDUAL GAME HIGHSRushes................................... 12 ................................................................ LINE, Zach, vs SMU (Sep 05, 2010)Yards Rushing ........................ 72 ................................................................ LINE, Zach, vs SMU (Sep 05, 2010)TD Rushes ............................. 1 .................................................................. LINE, Zach, vs SMU (Sep 05, 2010)............................................................................................ HERNANDEZ, Chri, at New Mexico (Sep 11, 2010)Long Rush .............................. 18 .......................................................... PADRON, Kyle, vs SMU (Sep 05, 2010)................................................................................................................... LINE, Zach, vs SMU (Sep 05, 2010)Pass attempts ....................... 50 ........................................... HOLBROOK, B.R., at New Mexico (Sep 11, 2010)Pass completions ................... 30 ........................................... HOLBROOK, B.R., at New Mexico (Sep 11, 2010)Yards Passing ........................ 323 ......................................... HOLBROOK, B.R., at New Mexico (Sep 11, 2010)TD Passes ............................. 2 ............................................................ PADRON, Kyle, vs SMU (Sep 05, 2010)Long Pass .............................. 57 ........................................... HOLBROOK, B.R., at New Mexico (Sep 11, 2010)Receptions ............................. 9 ............................................ WILLIAMS, Bryan, at New Mexico (Sep 11, 2010)Yards Receiving ..................... 119 ......................................................KIRK, Ty, at New Mexico (Sep 11, 2010)TD Receptions ....................... 2 ............................................................BEASLEY, Cole, vs SMU (Sep 05, 2010)Long Reception ...................... 57 ........................................................KIRK, Ty, at New Mexico (Sep 11, 2010)Field Goals ............................. 2 ......................................................SZYMANSKI, Matt, vs SMU (Sep 05, 2010)Long Field Goal ...................... 61 ....................................................SZYMANSKI, Matt, vs SMU (Sep 05, 2010)Punts ..................................... 5 .....................................................SKAER, Ben, at New Mexico (Sep 11, 2010)Punting Avg ........................... 49.2 .................................................SZYMANSKI, Matt, vs SMU (Sep 05, 2010)Long Punt .............................. 61 ....................................................SZYMANSKI, Matt, vs SMU (Sep 05, 2010)Long Punt Return ................... 16 ....................................................... ACKER, Kenneth, vs SMU (Sep 05, 2010)Long Kickoff Return ............... 92 .......................................................... FIELDS, Darryl, vs SMU (Sep 05, 2010)Tackles .................................. 9 ................................................................ FLEPS, Pete, vs SMU (Sep 05, 2010)Sacks .................................... 1.0 ......................................................MOORE, Sterling, vs SMU (Sep 05, 2010).......................................................................................................... DAVIS, Ja’Gared, vs SMU (Sep 05, 2010).............................................................................................. RAINEY, Johnath, at New Mexico (Sep 11, 2010)Tackles For Loss .................... 2.0 ...................................................... DAVIS, Ja’Gared, vs SMU (Sep 05, 2010)Interceptions.......................... 0 .........................................................................................................................
OPPONENT TEAM GAME HIGHSRushes................................... 27 ...................................................................................vs SMU (Sep 05, 2010)...........................................................................................................................at New Mexico (Sep 11, 2010)Yards Rushing ........................ 109 .................................................................................vs SMU (Sep 05, 2010)Yards Per Rush ...................... 4.0 ..................................................................................vs SMU (Sep 05, 2010)TD Rushes ............................. 1 .....................................................................................vs SMU (Sep 05, 2010)...........................................................................................................................at New Mexico (Sep 11, 2010)Pass attempts ....................... 52 ........................................................................at New Mexico (Sep 11, 2010)Pass completions ................... 32 ........................................................................at New Mexico (Sep 11, 2010)Yards Passing ........................ 336 ......................................................................at New Mexico (Sep 11, 2010)Yards Per Pass....................... 6.5 .......................................................................at New Mexico (Sep 11, 2010)TD Passes ............................. 2 .....................................................................................vs SMU (Sep 05, 2010)Total Plays ............................ 79 ........................................................................at New Mexico (Sep 11, 2010)Total Offense......................... 433 ......................................................................at New Mexico (Sep 11, 2010)Yards Per Play ....................... 5.5 .......................................................................at New Mexico (Sep 11, 2010)Points .................................... 27 ...................................................................................vs SMU (Sep 05, 2010)Sacks By ............................... 2 .....................................................................................vs SMU (Sep 05, 2010)First Downs ........................... 23 ........................................................................at New Mexico (Sep 11, 2010)Penalties ................................ 16 ........................................................................at New Mexico (Sep 11, 2010)Penalty Yards ........................ 145 ......................................................................at New Mexico (Sep 11, 2010)Turnovers .............................. 4 .....................................................................................vs SMU (Sep 05, 2010)Interceptions By .................... 0 .........................................................................................................................
SUPERLATIVES (GAME-HIGHS)

1818
2010 RED RAIDER FOOTBALL
Yards Opponent Play/Situation/Result93 ...................... UNM .............................................................................................................................................................................................................................................. Eric Stephens 93-yard kickoff return/First Down55 ...................... UNM ........................................................................................................................................................................................................................Austin Zouzalik 55-yard reception/2nd and 10/Touchdown29 ...................... UNM .............................................................................................................................................................................................................................................. Eric Stephens 39-yard kickoff return/First Down34 ...................... SMU .......................................................................................................................................................................................................................................Lyle Leong 34-yard reception/2nd and 6/First Down32 ...................... SMU ............................................................................................................................................................................................................................................... Eric Stephens 32-yard kickoff return/First Down30 ...................... UNM .............................................................................................................................................................................................................................. Jacoby Franks 30-yard reception/3rd and 19/First Down30 ...................... SMU ............................................................................................................................................................................................................................................... Eric Stephens 30-yard kickoff return/First Down27 ...................... UNM ...............................................................................................................................................................................................................Jarvis Phillips 27-yard interception return/4th and 3/First Down27 ...................... UNM ...................................................................................................................................................................................................................... Will Ford 27-yard interception return/1st and 10/First Down26 ...................... SMU .......................................................................................................................................................................................................................Cornelius Douglas 26-yard reception/1st and 10/First Down26 ...................... UNM .............................................................................................................................................................................................................................................. Eric Stephens 26-yard kickoff return/First Down25 ...................... UNM ...................................................................................................................................................................................................................................Lyle Leong 25-yard reception/1st and 10/Touchdown
LONGEST PLAYS - TEXAS TECH 25-PLUS YARDS
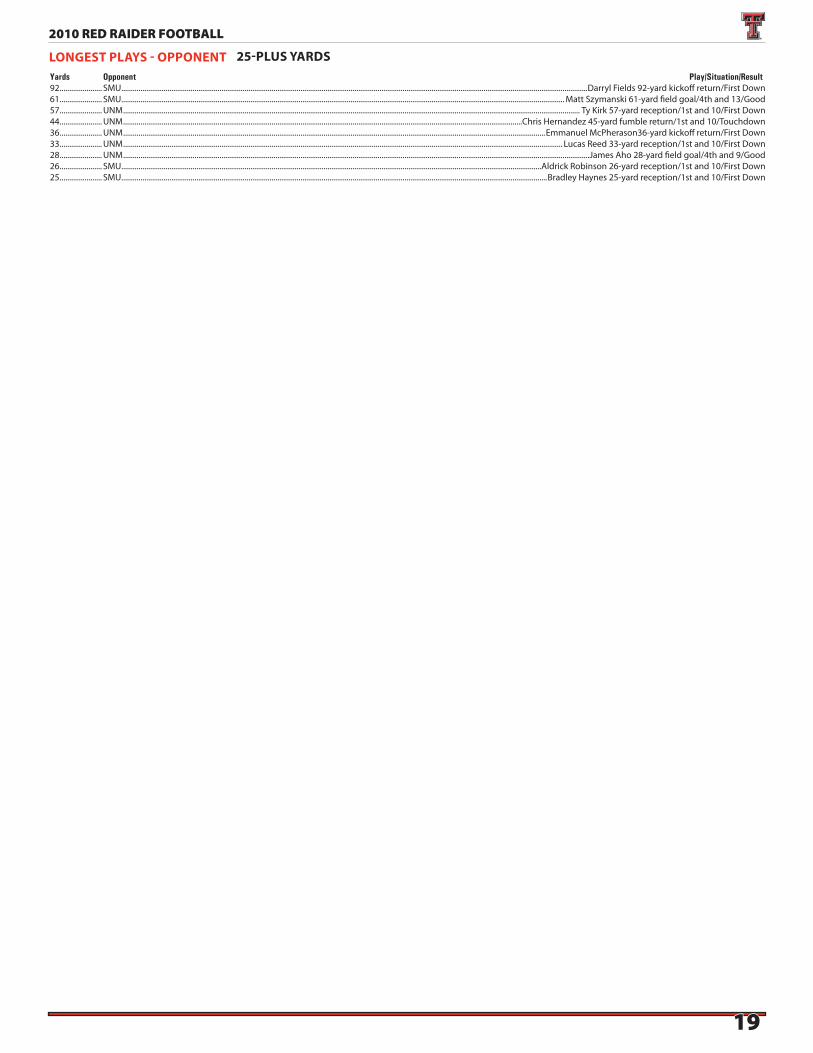
1919
2010 RED RAIDER FOOTBALL
Yards Opponent Play/Situation/Result92 ...................... SMU ..................................................................................................................................................................................................................................................Darryl Fields 92-yard kickoff return/First Down61 ...................... SMU ...................................................................................................................................................................................................................................... Matt Szymanski 61-yard fi eld goal/4th and 13/Good57 ...................... UNM ............................................................................................................................................................................................................................................. Ty Kirk 57-yard reception/1st and 10/First Down44 ...................... UNM ...............................................................................................................................................................................................................Chris Hernandez 45-yard fumble return/1st and 10/Touchdown36 ...................... UNM ...........................................................................................................................................................................................................................Emmanuel McPherason36-yard kickoff return/First Down33 ...................... UNM .................................................................................................................................................................................................................................... Lucas Reed 33-yard reception/1st and 10/First Down28 ...................... UNM ..................................................................................................................................................................................................................................................James Aho 28-yard fi eld goal/4th and 9/Good26 ...................... SMU ..........................................................................................................................................................................................................................Aldrick Robinson 26-yard reception/1st and 10/First Down25 ...................... SMU .............................................................................................................................................................................................................................Bradley Haynes 25-yard reception/1st and 10/First Down
LONGEST PLAYS - OPPONENT 25-PLUS YARDS

2020
2010 RED RAIDER FOOTBALL
TEXAS TECH
No. of Total Drive Type of Score Drive ScoringOpponent Plays Yards Time Score Qtr/Time Start PlaySMU 5 18 1:32 TD 1st/:54 SMU18 Lyle Leong 2-yard receptionSMU 3 51 :33 TD 2nd/14:30 TTU48 Lyle Leong 6-yard receptionSMU 7 80 1:23 TD 2nd/:06 TTU20 Detron Lewis 16-yard receptionSMU 6 63 1:38 TD 3rd/13:22 TTU37 Lyle Leong 4-yard recpetinSMU 9 40 2:48 TD 3rd/4:40 SMU40 Eric Stephens 3-yard runUNM 4 73 :45 TD 1st/14:15 TTU27 Austin Zouzalik 55-yard receptionUNM 1 3 :04 TD 1st/10:49 NM03 Eric Stephens 3-yard runUNM 2 7 :32 TD 1st/5:15 NM07 Baron Batch 2-yard runUNM 11 68 3:30 FG 2nd/7:05 TTU27 Matt Williams 22-yard field goalUNM 11 76 3:20 TD 2nd/1:15 TTU24 Lyle Leong 25-yard receptionUNM 1 1 :05 TD 3rd/12:25 NM01 Baron Batch 1-yard runUNM 9 62 4:05 TD 4th/13:04 TTU38 Lyle Leong 11-yard recpetionUNM 2 13 :47 TD 4th/9:35 NM13 Steven Sheffield 10-yard run
OPPONENTS
No. of Total Drive Type of Score Drive ScoringOpponent Plays Yards Time Score Qtr/Time Start PlaySMU 12 72 5:57 TD 2nd/1:29 SMU28 Zach Line 2-yard runSMU 8 80 4:39 TD 3rd/8:43 SMU20 Cole Beasley 19-yard receptionSMU 4 1 1:51 FG 3rd/2:49 TTU8 Matt Szymanski 24-yard field goalSMU 8 26 3:36 FG 4th/12:00 SMU31 Matt Szymanski 61-yard field goalSMU 7 32 2:27 TD 4th/7:10 TTU32 Cole Beasley 13-yard receptionUNM 8 53 4:40 FG 1st/6:03 NM36 James Aho 28-yard field goalUNM 5 74 2:18 TD 2nd/4:42 NM26 Lucas Reed 9-yard receptionUNM 2 72 :20 TD 2nd/:55 NM28 Chris Hernandez 45-yard run
SCORING DRIVES
TEXAS TECH’S LONGEST (BY YARDAGE) DRIVES OF THE YEAR
No. of Total Drive Type of Score Drive ScoringOpponent Plays Yards Time Score Qtr/Time Start PlaySMU 7 80 1:23 TD 2nd/:06 TTU20 Detron Lewis 16-yard receptionUNM 11 76 3:20 TD 2nd/1:15 TTU24 Lyle Leong 25-yard receptionUNM 11 68 3:30 FG 2nd/7:05 TTU27 Matt Williams 22-yard field goalSMU 6 63 1:38 TD 3rd/13:22 TTU37 Lyle Leong 4-yard recpetinUNM 9 62 4:05 TD 4th/13:04 TTU38 Lyle Leong 11-yard recpetion
TEXAS TECH’S QUICKEST DRIVES OF THE YEAR
No. of Total Drive Type of Score Drive ScoringOpponent Plays Yards Time Score Qtr/Time Start PlayUNM 1 3 :04 TD 1st/10:49 NM03 Eric Stephens 3-yard runUNM 1 1 :05 TD 3rd/12:25 NM01 Baron Batch 1-yard runUNM 2 7 :32 TD 1st/5:15 NM07 Baron Batch 2-yard runSMU 3 51 :33 TD 2nd/14:30 TTU48 Lyle Leong 6-yard receptionUNM 4 73 :45 TD 1st/14:15 TTU27 Austin Zouzalik 55-yard receptionUNM 2 13 :47 TD 4th/9:35 NM13 Steven Sheffield 10-yard runSMU 7 80 1:23 TD 2nd/:06 TTU20 Detron Lewis 16-yard receptionSMU 5 18 1:32 TD 1st/:54 SMU18 Lyle Leong 2-yard reception
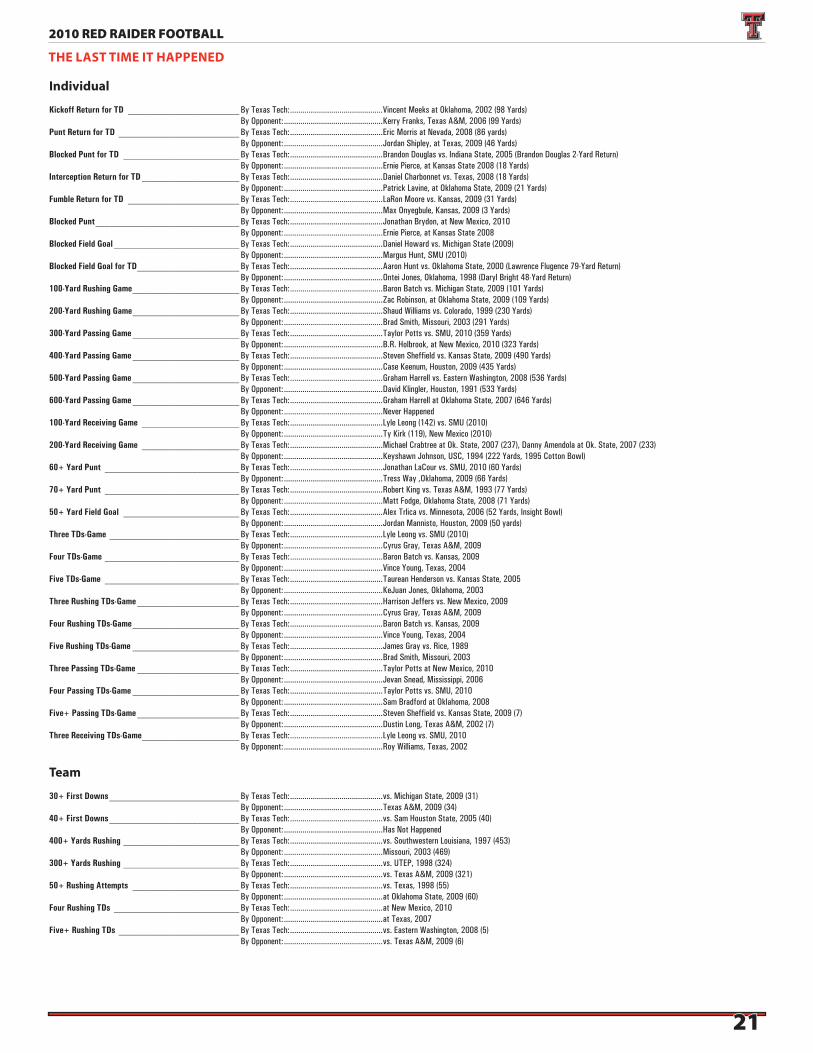
2121
2010 RED RAIDER FOOTBALL
Individual
Kickoff Return for TD ________________________ By Texas Tech: .............................................Vincent Meeks at Oklahoma, 2002 (98 Yards) By Opponent: ................................................Kerry Franks, Texas A&M, 2006 (99 Yards)Punt Return for TD __________________________ By Texas Tech: .............................................Eric Morris at Nevada, 2008 (86 yards) By Opponent: ................................................Jordan Shipley, at Texas, 2009 (46 Yards)Blocked Punt for TD _________________________ By Texas Tech: .............................................Brandon Douglas vs. Indiana State, 2005 (Brandon Douglas 2-Yard Return) By Opponent: ................................................Ernie Pierce, at Kansas State 2008 (18 Yards)Interception Return for TD _____________________ By Texas Tech: .............................................Daniel Charbonnet vs. Texas, 2008 (18 Yards) By Opponent: ................................................Patrick Lavine, at Oklahoma State, 2009 (21 Yards)Fumble Return for TD ________________________ By Texas Tech: .............................................LaRon Moore vs. Kansas, 2009 (31 Yards) By Opponent: ................................................Max Onyegbule, Kansas, 2009 (3 Yards)Blocked Punt _______________________________ By Texas Tech: .............................................Jonathan Brydon, at New Mexico, 2010 By Opponent: ................................................Ernie Pierce, at Kansas State 2008Blocked Field Goal ___________________________ By Texas Tech: .............................................Daniel Howard vs. Michigan State (2009) By Opponent: ................................................Margus Hunt, SMU (2010)Blocked Field Goal for TD ______________________ By Texas Tech: .............................................Aaron Hunt vs. Oklahoma State, 2000 (Lawrence Flugence 79-Yard Return) By Opponent: ................................................Ontei Jones, Oklahoma, 1998 (Daryl Bright 48-Yard Return)100-Yard Rushing Game _______________________ By Texas Tech: .............................................Baron Batch vs. Michigan State, 2009 (101 Yards) By Opponent: ................................................Zac Robinson, at Oklahoma State, 2009 (109 Yards)200-Yard Rushing Game _______________________ By Texas Tech: .............................................Shaud Williams vs. Colorado, 1999 (230 Yards) By Opponent: ................................................Brad Smith, Missouri, 2003 (291 Yards)300-Yard Passing Game _______________________ By Texas Tech: .............................................Taylor Potts vs. SMU, 2010 (359 Yards) By Opponent: ................................................B.R. Holbrook, at New Mexico, 2010 (323 Yards)400-Yard Passing Game _______________________ By Texas Tech: .............................................Steven Sheffield vs. Kansas State, 2009 (490 Yards) By Opponent: ................................................Case Keenum, Houston, 2009 (435 Yards)500-Yard Passing Game _______________________ By Texas Tech: .............................................Graham Harrell vs. Eastern Washington, 2008 (536 Yards) By Opponent: ................................................David Klingler, Houston, 1991 (533 Yards)600-Yard Passing Game _______________________ By Texas Tech: .............................................Graham Harrell at Oklahoma State, 2007 (646 Yards) By Opponent: ................................................Never Happened100-Yard Receiving Game _____________________ By Texas Tech: .............................................Lyle Leong (142) vs. SMU (2010) By Opponent: ................................................Ty Kirk (119), New Mexico (2010)200-Yard Receiving Game _____________________ By Texas Tech: .............................................Michael Crabtree at Ok. State, 2007 (237), Danny Amendola at Ok. State, 2007 (233) By Opponent: ................................................Keyshawn Johnson, USC, 1994 (222 Yards, 1995 Cotton Bowl)60+ Yard Punt _____________________________ By Texas Tech: .............................................Jonathan LaCour vs. SMU, 2010 (60 Yards) By Opponent: ................................................Tress Way ,Oklahoma, 2009 (66 Yards)70+ Yard Punt _____________________________ By Texas Tech: .............................................Robert King vs. Texas A&M, 1993 (77 Yards) By Opponent: ................................................Matt Fodge, Oklahoma State, 2008 (71 Yards)50+ Yard Field Goal _________________________ By Texas Tech: .............................................Alex Trlica vs. Minnesota, 2006 (52 Yards, Insight Bowl) By Opponent: ................................................Jordan Mannisto, Houston, 2009 (50 yards)Three TDs-Game ____________________________ By Texas Tech: .............................................Lyle Leong vs. SMU (2010) By Opponent: ................................................Cyrus Gray, Texas A&M, 2009Four TDs-Game _____________________________ By Texas Tech: .............................................Baron Batch vs. Kansas, 2009 By Opponent: ................................................Vince Young, Texas, 2004Five TDs-Game _____________________________ By Texas Tech: .............................................Taurean Henderson vs. Kansas State, 2005 By Opponent: ................................................KeJuan Jones, Oklahoma, 2003Three Rushing TDs-Game ______________________ By Texas Tech: .............................................Harrison Jeffers vs. New Mexico, 2009 By Opponent: ................................................Cyrus Gray, Texas A&M, 2009Four Rushing TDs-Game _______________________ By Texas Tech: .............................................Baron Batch vs. Kansas, 2009 By Opponent: ................................................Vince Young, Texas, 2004Five Rushing TDs-Game _______________________ By Texas Tech: .............................................James Gray vs. Rice, 1989 By Opponent: ................................................Brad Smith, Missouri, 2003Three Passing TDs-Game ______________________ By Texas Tech: .............................................Taylor Potts at New Mexico, 2010 By Opponent: ................................................Jevan Snead, Mississippi, 2006Four Passing TDs-Game _______________________ By Texas Tech: .............................................Taylor Potts vs. SMU, 2010 By Opponent: ................................................Sam Bradford at Oklahoma, 2008Five+ Passing TDs-Game ______________________ By Texas Tech: .............................................Steven Sheffield vs. Kansas State, 2009 (7) By Opponent: ................................................Dustin Long, Texas A&M, 2002 (7)Three Receiving TDs-Game _____________________ By Texas Tech: .............................................Lyle Leong vs. SMU, 2010 By Opponent: ................................................Roy Williams, Texas, 2002
Team
30+ First Downs ____________________________ By Texas Tech: .............................................vs. Michigan State, 2009 (31) By Opponent: ................................................Texas A&M, 2009 (34)40+ First Downs ____________________________ By Texas Tech: .............................................vs. Sam Houston State, 2005 (40) By Opponent: ................................................Has Not Happened400+ Yards Rushing _________________________ By Texas Tech: .............................................vs. Southwestern Louisiana, 1997 (453) By Opponent: ................................................Missouri, 2003 (469)300+ Yards Rushing _________________________ By Texas Tech: .............................................vs. UTEP, 1998 (324) By Opponent: ................................................vs. Texas A&M, 2009 (321)50+ Rushing Attempts _______________________ By Texas Tech: .............................................vs. Texas, 1998 (55) By Opponent: ................................................at Oklahoma State, 2009 (60)Four Rushing TDs ___________________________ By Texas Tech: .............................................at New Mexico, 2010 By Opponent: ................................................at Texas, 2007Five+ Rushing TDs __________________________ By Texas Tech: .............................................vs. Eastern Washington, 2008 (5) By Opponent: ................................................vs. Texas A&M, 2009 (6)
THE LAST TIME IT HAPPENED

2222
2010 RED RAIDER FOOTBALL350 Passing Yards ___________________________ By Texas Tech: .............................................vs. SMU 2010 (359) By Opponent: ................................................Nebraska 2008 (357)400+ Passing Yards _________________________ By Texas Tech: .............................................vs. Michigan State, 2009 (460) By Opponent: ................................................Houston, 2009 (435)500+ Passing Yards _________________________ By Texas Tech: .............................................vs. Kansas State, 2009 (554) By Opponent: ................................................Houston, 1991 (533)600+ Passing Yards _________________________ By Texas Tech: .............................................at Oklahoma State, 2007 (646) By Opponent: ................................................Has Not Happened60+ Pass Attempts __________________________ By Texas Tech: .............................................vs. Texas A&M, 2009 (61) By Opponent: ................................................Eastern Washington, 2008 (63)70+ Pass Attempts __________________________ By Texas Tech: .............................................vs. Oklahoma, 2007 (72) By Opponent: ................................................Houston, 1991 (70)40+ Pass Completions ________________________ By Texas Tech: .............................................vs. Texas A&M, 2009 (43) By Opponent: ................................................Has Not Happened50+ Pass Completions ________________________ By Texas Tech: .............................................at SMU, 2007 (50) By Opponent: ................................................Has Not HappenedFive+ TD Passes ____________________________ By Texas Tech: .............................................vs. Kansas State, 2009 (8) By Opponent: ................................................Texas A&M, 2002 (7)500+ Yards of Total Offense ___________________ By Texas Tech: .............................................vs. Michigan State, 2009 (579) By Opponent: ................................................vs. Texas A&M, 2009 (559)600+ Yards of Total Offense ___________________ By Texas Tech: .............................................vs. Oklahoma State, 2008 (629) By Opponent: ................................................at Oklahoma, 2008 (625)700+ Yards of Total Offense ___________________ By Texas Tech: .............................................vs. Kansas State, 2009 (739) By Opponent: ................................................Has Not Happened80+ Total Plays ____________________________ By Texas Tech: .............................................vs. SMU, 2010 (84) By Opponent: ................................................at Oklahoma State, 2009 (81)90+ Total Plays ____________________________ By Texas Tech: .............................................at Kansas State, 2008 (90) By Opponent: ................................................vs. New Mexico, 2009 (91)100+ Total Plays ___________________________ By Texas Tech: .............................................vs. Iowa State, 2003 (111) By Opponent: ................................................Has Not Happened70+ Points ________________________________ By Texas Tech: .............................................vs. Northwestern State, 2007 (75) By Opponent: ................................................Has Not Happened60+ Points ________________________________ By Texas Tech: .............................................vs. Kansas State, 2009 (66) By Opponent: ................................................Missouri, 2003 (62)50+ Points ________________________________ By Texas Tech: .............................................at New Mexico, 2010 (52) By Opponent: ................................................vs. Texas A&M, 2009 (52)40+ Points ________________________________ By Texas Tech: .............................................at New Mexico, 2010 (52) By Opponent: ................................................vs. Texas A&M, 2009 (52)No Turnovers ______________________________ By Texas Tech: .............................................vs. SMU (2010) By Opponent: ................................................TCU, 2006Two Blocked Punts __________________________ By Texas Tech: .............................................at New Mexico (2010 By Opponent: ................................................N/ASafety Recorded ____________________________ By Texas Tech: .............................................vs. Texas, 2008, Colby Whitlock tackle in the end zone By Opponent: ................................................at Kansas State, 2004, Cumbie flagged for intentional grounding in end zoneShutout at Jones AT&T Stadium ________________ By Texas Tech: .............................................vs. Southeastern Louisiana, 2006, 62-0 By Opponent: ................................................vs. Arkansas, 1987, 31-0Shutout on the Road _________________________ By Texas Tech: .............................................at Baylor, 2005, 28-0 By Opponent: ................................................at Nebraska, 1997, 29-0100 Rusher/100 Receiver ______________________ By Texas Tech: .............................................vs. Michigan State, 2009 (Baron Batch [101 rush] and Detron Lewis [114 receiving]) By Opponent: ................................................Minnesota, 2006 (Amir Pinnix [179 rush] and Jack Simmons [134 receiving])Two 100-Yard Rushers _______________________ By Texas Tech: .............................................vs. Lamar, 1988 (James Gray [113] and Clifton Winston [105]) By Opponent: ................................................vs. Texas A&M, 2009 (Cyrus Gray [132] and Christian Michael [121])Two 100-Yard Receivers ______________________ By Texas Tech: .............................................vs. Rice, 2009 (Tramain Swindall [123] and Lyle Leong [117]) By Opponent: ................................................Baylor, 1998 (Morris Anderson [130] and D. Thompson [119])Two 200-Yard Receivers ______________________ By Texas Tech: .............................................at Oklahoma State, 2007 (Michael Crabtree [237] and Danny Amendola [233]) By Opponent: ................................................Hsas Not HappenedThree 100-Yard Receivers _____________________ By Texas Tech: .............................................vs. Kansas State, 2005 (Henderson [118], Hicks [105] and Johnson [107]) By Opponent: ................................................Has Not HappenedIntercepted Five+ Passes _____________________ By Texas Tech: .............................................vs. SMU, 2008 (5) By Opponent: ................................................Oklahoma, 2003 (5)Intercepted Four Passes _______________________ By Texas Tech: .............................................vs. Clemson, 2002 By Opponent: ................................................Colorado, 2007Under 200 Yards of Total Offense _______________ By Texas Tech: .............................................at Texas, 1999 (160) By Opponent: ................................................Southeastern Louisiana, 2006 (189)Under 150 Yards of Total Offense _______________ By Texas Tech: .............................................vs. Miami, 1990 (93) By Opponent: ................................................Northwestern State, 2007 (118)Under 100 Yards Rushing ______________________ By Texas Tech: .............................................vs. SMU 2010 (72) By Opponent: ................................................New Mexico, 2010 (97)Under 50 Yards Rushing _______________________ By Texas Tech: .............................................at Nebraska 2009 (25) By Opponent: ................................................Oklahoma, 2009 (48)Negative Rushing Yards _______________________ By Texas Tech: .............................................at Texas, 2009 (-6) By Opponent: ................................................Kansas State, 1996 (-12)No Touchdown _____________________________ By Texas Tech: .............................................at TCU, 2006 By Opponent: ................................................at SMU, 2007Offensive Two-Point Conversion ________________ By Texas Tech: .............................................vs. Texas A&M, 2009 By Opponent: ................................................Texas, 200335 Minutes of Possession _____________________ By Texas Tech: .............................................vs. Oklahoma, 2009 (37:01) By Opponent: ................................................vs. Nebraska, 2008 (40:12)Scored TD in Last Minute to Win ________________ By Texas Tech: .............................................vs. Texas, 2008 (Michael Crabtree 28-yard reception from Harrell with one second remaining) By Opponent: ................................................at Houston, 2009Field Goal in Last Minute to Win _________________ By Texas Tech: .............................................vs. Texas A&M, 1997 By Opponent: ................................................New Mexico, 2004Won on Two-Point Conversion __________________ By Texas Tech: .............................................vs. Texas, 1988 By Opponent: ................................................SMU, 1961
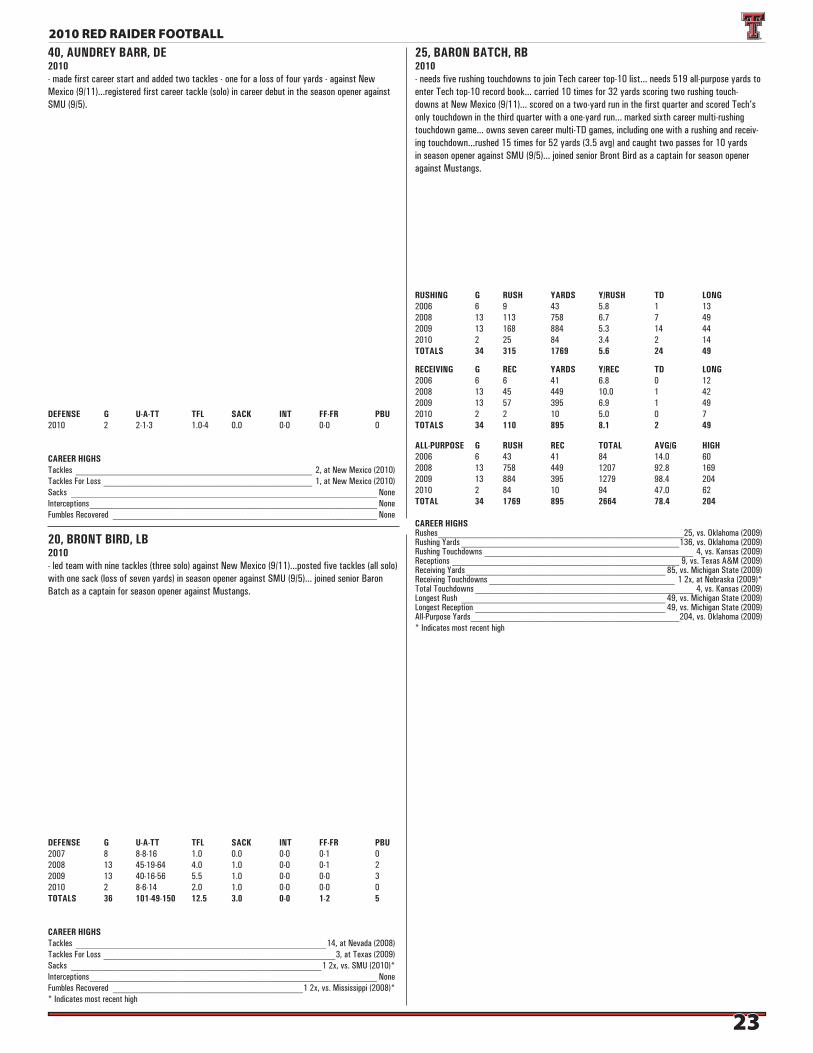
2323
2010 RED RAIDER FOOTBALL40, AUNDREY BARR, DE2010- made first career start and added two tackles - one for a loss of four yards - against New Mexico (9/11)...registered first career tackle (solo) in career debut in the season opener against SMU (9/5).
25, BARON BATCH, RB2010- needs five rushing touchdowns to join Tech career top-10 list... needs 519 all-purpose yards to enter Tech top-10 record book... carried 10 times for 32 yards scoring two rushing touch-downs at New Mexico (9/11)... scored on a two-yard run in the first quarter and scored Tech’s only touchdown in the third quarter with a one-yard run... marked sixth career multi-rushing touchdown game... owns seven career multi-TD games, including one with a rushing and receiv-ing touchdown...rushed 15 times for 52 yards (3.5 avg) and caught two passes for 10 yards in season opener against SMU (9/5)... joined senior Bront Bird as a captain for season opener against Mustangs.
20, BRONT BIRD, LB2010- led team with nine tackles (three solo) against New Mexico (9/11)...posted five tackles (all solo) with one sack (loss of seven yards) in season opener against SMU (9/5)... joined senior Baron Batch as a captain for season opener against Mustangs.
CAREER HIGHSTackles ___________________________________________________ 2, at New Mexico (2010)Tackles For Loss _____________________________________________ 1, at New Mexico (2010)Sacks __________________________________________________________________ NoneInterceptions ______________________________________________________________ NoneFumbles Recovered _________________________________________________________ None
DEFENSE G U-A-TT TFL SACK INT FF-FR PBU2010 2 2-1-3 1.0-4 0.0 0-0 0-0 0
CAREER HIGHSRushes _____________________________________________________25, vs. Oklahoma (2009)Rushing Yards _______________________________________________136, vs. Oklahoma (2009)Rushing Touchdowns _____________________________________________ 4, vs. Kansas (2009)Receptions _________________________________________________ 9, vs. Texas A&M (2009)Receiving Yards ___________________________________________ 85, vs. Michigan State (2009)Receiving Touchdowns ________________________________________ 1 2x, at Nebraska (2009)*Total Touchdowns _______________________________________________ 4, vs. Kansas (2009)Longest Rush ____________________________________________ 49, vs. Michigan State (2009)Longest Reception _________________________________________ 49, vs. Michigan State (2009)All-Purpose Yards _____________________________________________204, vs. Oklahoma (2009)* Indicates most recent high
ALL-PURPOSE G RUSH REC TOTAL AVG/G HIGH2006 6 43 41 84 14.0 602008 13 758 449 1207 92.8 1692009 13 884 395 1279 98.4 2042010 2 84 10 94 47.0 62TOTAL 34 1769 895 2664 78.4 204
CAREER HIGHSTackles ______________________________________________________14, at Nevada (2008)Tackles For Loss __________________________________________________3, at Texas (2009)Sacks ______________________________________________________1 2x, vs. SMU (2010)*Interceptions ______________________________________________________________ NoneFumbles Recovered _________________________________________1 2x, vs. Mississippi (2008)** Indicates most recent high
DEFENSE G U-A-TT TFL SACK INT FF-FR PBU2007 8 8-8-16 1.0 0.0 0-0 0-1 0 2008 13 45-19-64 4.0 1.0 0-0 0-1 22009 13 40-16-56 5.5 1.0 0-0 0-0 32010 2 8-6-14 2.0 1.0 0-0 0-0 0TOTALS 36 101-49-150 12.5 3.0 0-0 1-2 5
RECEIVING G REC YARDS Y/REC TD LONG2006 6 6 41 6.8 0 122008 13 45 449 10.0 1 422009 13 57 395 6.9 1 492010 2 2 10 5.0 0 7TOTALS 34 110 895 8.1 2 49
RUSHING G RUSH YARDS Y/RUSH TD LONG2006 6 9 43 5.8 1 132008 13 113 758 6.7 7 492009 13 168 884 5.3 14 442010 2 25 84 3.4 2 14TOTALS 34 315 1769 5.6 24 49
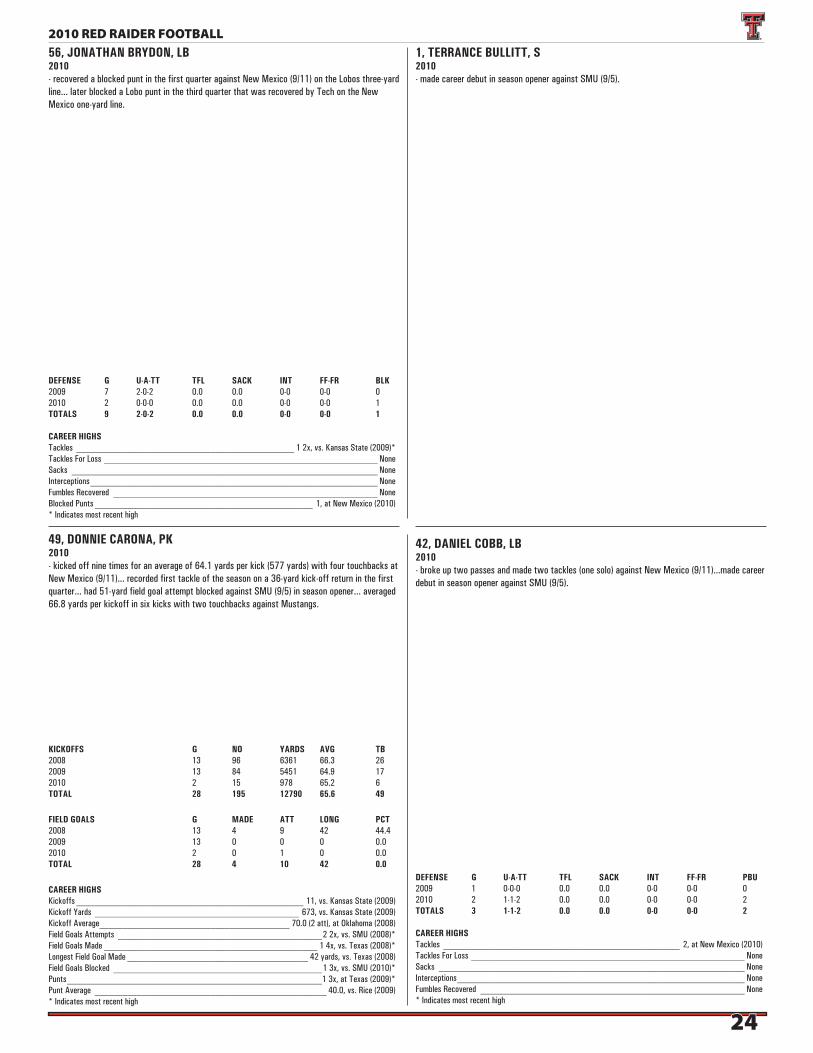
2424
2010 RED RAIDER FOOTBALL
49, DONNIE CARONA, PK2010- kicked off nine times for an average of 64.1 yards per kick (577 yards) with four touchbacks at New Mexico (9/11)... recorded first tackle of the season on a 36-yard kick-off return in the first quarter... had 51-yard field goal attempt blocked against SMU (9/5) in season opener... averaged 66.8 yards per kickoff in six kicks with two touchbacks against Mustangs.
CAREER HIGHSKickoffs _________________________________________________ 11, vs. Kansas State (2009)Kickoff Yards ____________________________________________ 673, vs. Kansas State (2009)Kickoff Average _________________________________________ 70.0 (2 att), at Oklahoma (2008)Field Goals Attempts ____________________________________________2 2x, vs. SMU (2008)*Field Goals Made ______________________________________________ 1 4x, vs. Texas (2008)*Longest Field Goal Made _______________________________________ 42 yards, vs. Texas (2008)Field Goals Blocked _____________________________________________1 3x, vs. SMU (2010)*Punts _______________________________________________________1 3x, at Texas (2009)*Punt Average __________________________________________________ 40.0, vs. Rice (2009)* Indicates most recent high
FIELD GOALS G MADE ATT LONG PCT2008 13 4 9 42 44.42009 13 0 0 0 0.02010 2 0 1 0 0.0TOTAL 28 4 10 42 0.0
42, DANIEL COBB, LB2010- broke up two passes and made two tackles (one solo) against New Mexico (9/11)...made career debut in season opener against SMU (9/5).
1, TERRANCE BULLITT, S2010- made career debut in season opener against SMU (9/5).
56, JONATHAN BRYDON, LB2010- recovered a blocked punt in the first quarter against New Mexico (9/11) on the Lobos three-yard line... later blocked a Lobo punt in the third quarter that was recovered by Tech on the New Mexico one-yard line.
CAREER HIGHSTackles _______________________________________________ 1 2x, vs. Kansas State (2009)*Tackles For Loss ___________________________________________________________ NoneSacks __________________________________________________________________ NoneInterceptions ______________________________________________________________ NoneFumbles Recovered _________________________________________________________ NoneBlocked Punts _______________________________________________ 1, at New Mexico (2010)* Indicates most recent high
DEFENSE G U-A-TT TFL SACK INT FF-FR BLK2009 7 2-0-2 0.0 0.0 0-0 0-0 02010 2 0-0-0 0.0 0.0 0-0 0-0 1TOTALS 9 2-0-2 0.0 0.0 0-0 0-0 1
KICKOFFS G NO YARDS AVG TB2008 13 96 6361 66.3 262009 13 84 5451 64.9 172010 2 15 978 65.2 6TOTAL 28 195 12790 65.6 49
CAREER HIGHSTackles ___________________________________________________ 2, at New Mexico (2010)Tackles For Loss ___________________________________________________________ NoneSacks __________________________________________________________________ NoneInterceptions ______________________________________________________________ NoneFumbles Recovered _________________________________________________________ None* Indicates most recent high
DEFENSE G U-A-TT TFL SACK INT FF-FR PBU2009 1 0-0-0 0.0 0.0 0-0 0-0 02010 2 1-1-2 0.0 0.0 0-0 0-0 2TOTALS 3 1-1-2 0.0 0.0 0-0 0-0 2
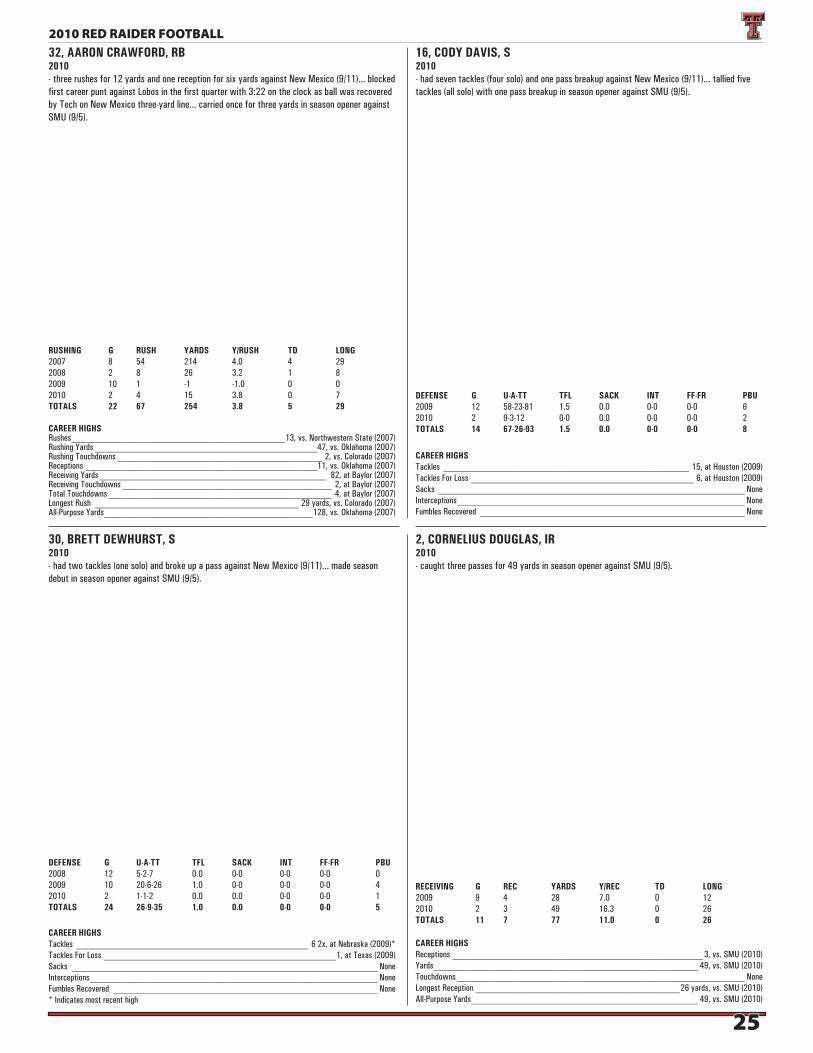
2525
2010 RED RAIDER FOOTBALL32, AARON CRAWFORD, RB2010- three rushes for 12 yards and one reception for six yards against New Mexico (9/11)... blocked first career punt against Lobos in the first quarter with 3:22 on the clock as ball was recovered by Tech on New Mexico three-yard line... carried once for three yards in season opener against SMU (9/5).
CAREER HIGHSRushes ______________________________________________13, vs. Northwestern State (2007)Rushing Yards ________________________________________________47, vs. Oklahoma (2007)Rushing Touchdowns ____________________________________________ 2, vs. Colorado (2007)Receptions __________________________________________________11, vs. Oklahoma (2007)Receiving Yards _________________________________________________ 82, at Baylor (2007)Receiving Touchdowns _____________________________________________ 2, at Baylor (2007)Total Touchdowns ________________________________________________ 4, at Baylor (2007)Longest Rush ____________________________________________ 29 yards, vs. Colorado (2007)All-Purpose Yards _____________________________________________128, vs. Oklahoma (2007)
RUSHING G RUSH YARDS Y/RUSH TD LONG2007 8 54 214 4.0 4 292008 2 8 26 3.2 1 82009 10 1 -1 -1.0 0 02010 2 4 15 3.8 0 7TOTALS 22 67 254 3.8 5 29
16, CODY DAVIS, S2010- had seven tackles (four solo) and one pass breakup against New Mexico (9/11)... tallied five tackles (all solo) with one pass breakup in season opener against SMU (9/5).
CAREER HIGHSTackles _____________________________________________________ 15, at Houston (2009)Tackles For Loss ________________________________________________ 6, at Houston (2009)Sacks __________________________________________________________________ NoneInterceptions ______________________________________________________________ NoneFumbles Recovered _________________________________________________________ None
DEFENSE G U-A-TT TFL SACK INT FF-FR PBU2009 12 58-23-81 1.5 0.0 0-0 0-0 6 2010 2 9-3-12 0-0 0.0 0-0 0-0 2TOTALS 14 67-26-93 1.5 0.0 0-0 0-0 8
30, BRETT DEWHURST, S2010- had two tackles (one solo) and broke up a pass against New Mexico (9/11)... made season debut in season opener against SMU (9/5).
CAREER HIGHSTackles __________________________________________________ 6 2x, at Nebraska (2009)*Tackles For Loss __________________________________________________1, at Texas (2009)Sacks __________________________________________________________________ NoneInterceptions ______________________________________________________________ NoneFumbles Recovered _________________________________________________________ None* Indicates most recent high
DEFENSE G U-A-TT TFL SACK INT FF-FR PBU2008 12 5-2-7 0.0 0-0 0-0 0-0 02009 10 20-6-26 1.0 0-0 0-0 0-0 42010 2 1-1-2 0.0 0.0 0-0 0-0 1TOTALS 24 26-9-35 1.0 0.0 0-0 0-0 5
2, CORNELIUS DOUGLAS, IR2010- caught three passes for 49 yards in season opener against SMU (9/5).
CAREER HIGHSReceptions ______________________________________________________ 3, vs. SMU (2010)Yards _________________________________________________________ 49, vs. SMU (2010)Touchdowns ______________________________________________________________ NoneLongest Reception ____________________________________________26 yards, vs. SMU (2010)All-Purpose Yards _________________________________________________ 49, vs. SMU (2010)
RECEIVING G REC YARDS Y/REC TD LONG2009 9 4 28 7.0 0 122010 2 3 49 16.3 0 26TOTALS 11 7 77 11.0 0 26
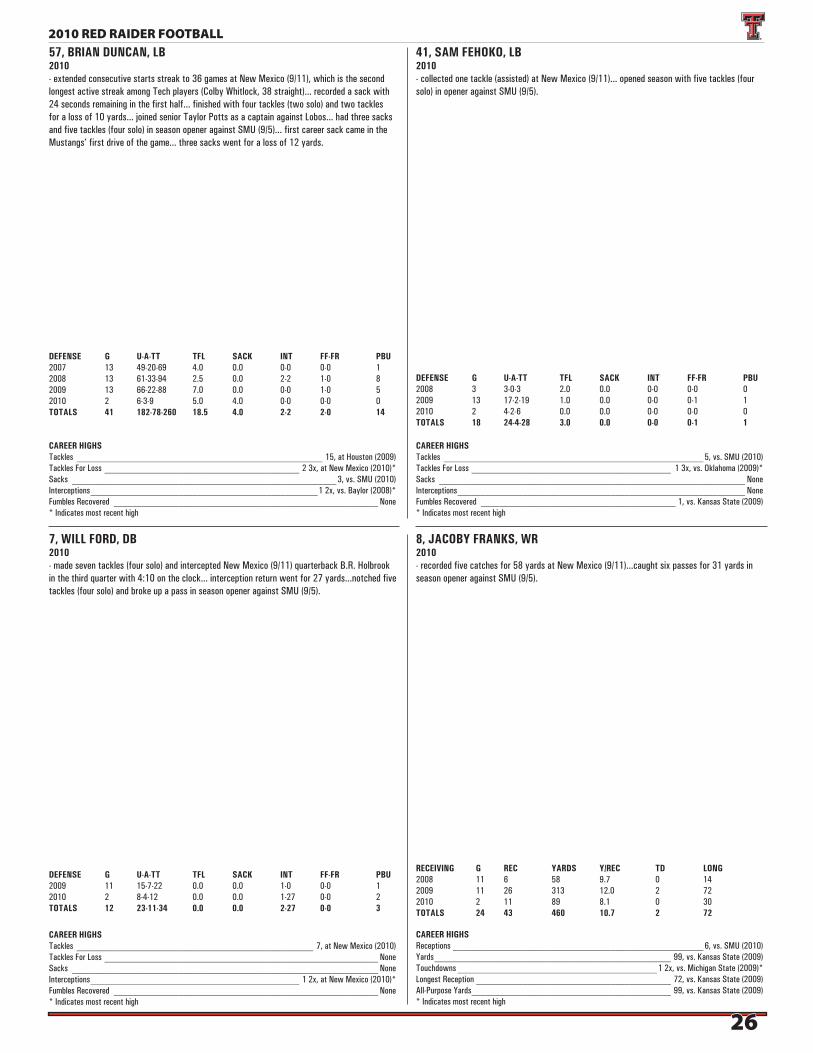
2626
2010 RED RAIDER FOOTBALL57, BRIAN DUNCAN, LB2010- extended consecutive starts streak to 36 games at New Mexico (9/11), which is the second longest active streak among Tech players (Colby Whitlock, 38 straight)... recorded a sack with 24 seconds remaining in the first half... finished with four tackles (two solo) and two tackles for a loss of 10 yards... joined senior Taylor Potts as a captain against Lobos... had three sacks and five tackles (four solo) in season opener against SMU (9/5)... first career sack came in the Mustangs’ first drive of the game... three sacks went for a loss of 12 yards.
CAREER HIGHSTackles _____________________________________________________ 15, at Houston (2009)Tackles For Loss __________________________________________ 2 3x, at New Mexico (2010)*Sacks _________________________________________________________ 3, vs. SMU (2010)Interceptions _________________________________________________1 2x, vs. Baylor (2008)*Fumbles Recovered _________________________________________________________ None* Indicates most recent high
DEFENSE G U-A-TT TFL SACK INT FF-FR PBU2007 13 49-20-69 4.0 0.0 0-0 0-0 12008 13 61-33-94 2.5 0.0 2-2 1-0 82009 13 66-22-88 7.0 0.0 0-0 1-0 52010 2 6-3-9 5.0 4.0 0-0 0-0 0TOTALS 41 182-78-260 18.5 4.0 2-2 2-0 14
41, SAM FEHOKO, LB2010- collected one tackle (assisted) at New Mexico (9/11)... opened season with five tackles (four solo) in opener against SMU (9/5).
CAREER HIGHSTackles ________________________________________________________ 5, vs. SMU (2010)Tackles For Loss ___________________________________________ 1 3x, vs. Oklahoma (2009)*Sacks __________________________________________________________________ NoneInterceptions ______________________________________________________________ NoneFumbles Recovered __________________________________________ 1, vs. Kansas State (2009)* Indicates most recent high
DEFENSE G U-A-TT TFL SACK INT FF-FR PBU2008 3 3-0-3 2.0 0.0 0-0 0-0 0 2009 13 17-2-19 1.0 0.0 0-0 0-1 12010 2 4-2-6 0.0 0.0 0-0 0-0 0TOTALS 18 24-4-28 3.0 0.0 0-0 0-1 1
7, WILL FORD, DB2010- made seven tackles (four solo) and intercepted New Mexico (9/11) quarterback B.R. Holbrook in the third quarter with 4:10 on the clock... interception return went for 27 yards...notched five tackles (four solo) and broke up a pass in season opener against SMU (9/5).
CAREER HIGHSTackles ___________________________________________________ 7, at New Mexico (2010)Tackles For Loss ___________________________________________________________ NoneSacks __________________________________________________________________ NoneInterceptions _____________________________________________ 1 2x, at New Mexico (2010)*Fumbles Recovered _________________________________________________________ None* Indicates most recent high
DEFENSE G U-A-TT TFL SACK INT FF-FR PBU2009 11 15-7-22 0.0 0.0 1-0 0-0 12010 2 8-4-12 0.0 0.0 1-27 0-0 2TOTALS 12 23-11-34 0.0 0.0 2-27 0-0 3
8, JACOBY FRANKS, WR2010- recorded five catches for 58 yards at New Mexico (9/11)...caught six passes for 31 yards in season opener against SMU (9/5).
CAREER HIGHSReceptions ______________________________________________________ 6, vs. SMU (2010)Yards ___________________________________________________ 99, vs. Kansas State (2009)Touchdowns ___________________________________________1 2x, vs. Michigan State (2009)*Longest Reception __________________________________________ 72, vs. Kansas State (2009)All-Purpose Yards ___________________________________________ 99, vs. Kansas State (2009)* Indicates most recent high
RECEIVING G REC YARDS Y/REC TD LONG2008 11 6 58 9.7 0 142009 11 26 313 12.0 2 722010 2 11 89 8.1 0 30 TOTALS 24 43 460 10.7 2 72
2727
2010 RED RAIDER FOOTBALL13, JULIUS HOWARD, LB2010- notched four tackles (three solo) at New Mexico (9/11)... posted three tackles (all solo), includ-ing one for a loss of two yards, in season opener against SMU (9/5).
CAREER HIGHSTackles _______________________________________________________ 8, at Baylor (2009)Tackles For Loss _________________________________________________ 1, at Baylor (2009)Sacks __________________________________________________________________ NoneInterceptions ______________________________________________________________ NoneFumbles Recovered ____________________________________________1, at Texas A&M (2008)
DEFENSE G U-A-TT TFL SACK INT FF-FR PBU2007 6 0-0-0 0.0 0.0 0-0 0-0 02008 13 4-6-10 0.0 0.0 0-0 0-1 02009 13 25-4-29 1.0 0.0 0-0 0-0 22010 2 6-1-7 1.0 0.0 0-0 0-0 0TOTALS 34 35-11-46 2.0 0.0 0-0 0-1 2
51, CQULIN HUBERT, LB2010- collected three tackles (one solo), including first career, at New Mexico (9/11)...made career debut in season opener against SMU (9/5).
91, KERRY HYDER, DE2010- recorded first career sack (six-yard loss) and had four tackles (one solo) at New Mexico (9/11)...made career debut with a tackle (solo) on SMU’s (9/5) second drive of the game during the season opener.
CAREER HIGHSTackles ___________________________________________________ 4, at New Mexico (2010)Tackles For Loss _____________________________________________ 1, at New Mexico (2010)Sacks ____________________________________________________ 1, at New Mexico (2010)Interceptions ______________________________________________________________ NoneFumbles Recovered _________________________________________________________ None
DEFENSE G U-A-TT TFL SACK INT FF-FR PBU2010 2 2-3-5 1.0 1.0 0-0 0-0 0
82, ADAM JAMES, IR2010- made season debut against SMU (9/5) in season opener.
CAREER HIGHSReceptions _________________________________________________4, at Kansas State (2008)Yards ____________________________________________________36, at Kansas State (2008)Touchdowns ________________________________________1 2x, vs. North Dakota State (2009)*Longest Reception ___________________________________________ 20, vs. Texas A&M (2009)All-Purpose Yards ____________________________________________36, at Kansas State (2008)* Indicates most recent high
RECEIVING G REC YARDS Y/REC TD LONG2008 13 15 159 10.6 1 222009 12 17 154 9.1 1 202010 2 0 0 0.0 0 0 TOTALS 27 32 313 9.8 2 22
CAREER HIGHSTackles ___________________________________________________ 3, at New Mexico (2010)Tackles For Loss ___________________________________________________________ NoneSacks __________________________________________________________________ NoneInterceptions ______________________________________________________________ NoneFumbles Recovered _________________________________________________________ None
DEFENSE G U-A-TT TFL SACK INT FF-FR PBU2010 2 1-2-3 0.0 0.0 0-0 0-0 0
2828
2010 RED RAIDER FOOTBALL12, D.J. JOHNSON, DB2010- made six tackles (four solo) at New Mexico (9/11)...intercepted SMU quarterback Kyle Padron in the third quarter with 7:42 on the clock during season opener (9/5)... recorded three tackles (all solo) and broke up one pass.
CAREER HIGHSTackles ___________________________________________________ 6, at New Mexico (2010)Tackles For Loss ___________________________________________________________ NoneSacks __________________________________________________________________ NoneInterceptions __________________________________________________1 2x, vs. SMU (2010)*Fumbles Recovered _________________________________________________________ None* Indicates most recent high
DEFENSE G U-A-TT TFL SACK INT FF-FR PBU2009 12 22-2-24 0.0 0.0 1-7 1-0 72010 2 7-2-9 0.0 0.0 1-11 0-0 2TOTALS 14 29-4-33 0.0 0.0 2-18 1-0 9
9, JONATHAN LaCOUR, P2010- ranks fourth on Tech all-time career list averaging 40.8 yards per punt...averaged 47.5 yards per punt on two punts, including one inside the 20, at New Mexico (9/11)... matched a career-long 60-yard punt (Baylor, 2007) during season opener against SMU (9/5)... averaged 48.2 yards per punt (four punts) with one going inside the 20-yard line against Mustangs... punt inside the 20 was downed at the SMU 6-yard line.
CAREER HIGHSPunts ______________________________________________________ 6, vs. Oklahoma (2007)Punt Average _________________________________________________ 51.7, at Baylor (2007)Inside the 20 _________________________________________________ 2 4x, vs. Texas (2008)*Long Punt ___________________________________________________ 60 2x, vs. SMU (2010)** Indicates most recent high
PUNTS G PUNTS YDS AVG LG TB I202007 12 29 1236 42.6 60 2 82008 12 25 927 37.1 53 0 112010 2 6 288 48.0 60 0 2TOTAL 26 60 2451 40.8 60 2 21
98, DONALD LANGLEY, DT2010- tallied one tackle (solo) at New Mexico (9/11)... marked first career tackle (solo) in career debut in season opener against SMU (9/5).
10, HARRISON JEFFERS, RB2010- made season debut rushing seven times for 44 yards at New Mexico (9/11).
CAREER HIGHSRushes ____________________________________________________8, vs. New Mexico (2009)Rushing Yards _________________________________________________ 57, at Houston (2009)Rushing Touchdowns __________________________________________3, vs. New Mexico (2009)Receptions ________________________________________________ 6, vs. Kansas State (2009)Receiving Yards _____________________________________________90, vs. New Mexico (2009)Receiving Touchdowns _________________________________________1, vs. New Mexico (2009)Total Touchdowns ____________________________________________4, vs. New Mexico (2009)Longest Rush _________________________________________________ 35, at Houston (2009)Longest Reception ___________________________________________62, vs. New Mexico (2009)All-Purpose Yards _____________________________________________128, vs. Oklahoma (2007)
RECEIVING G REC YARDS Y/REC TD LONG2009 12 27 218 8.1 1 622010 1 0 0 0.0 0 0TOTALS 13 27 218 8.1 1 62
RUSHING G RUSH YARDS Y/RUSH TD LONG2009 12 35 217 6.2 4 352010 1 7 44 6.3 0 12TOTALS 13 42 261 6.2 4 35
CAREER HIGHSTackles ________________________________________________ 1 2x, at New Mexico (2010)*Tackles For Loss ___________________________________________________________ NoneSacks __________________________________________________________________ NoneInterceptions ______________________________________________________________ NoneFumbles Recovered _________________________________________________________ None* Indicates most recent high
DEFENSE G U-A-TT TFL SACK INT FF-FR PBU2010 2 2-0-2 0.0 0.0 0-0 0-0 0
2929
2010 RED RAIDER FOOTBALL19, LYLE LEONG, WR2010- needs six receptions for 100 career (would become the fourth active Tech player with 100 ca-reer receptions - Lewis 160, Batch 110, Swindall 108)... needs two receiving touchdowns to join Tech career top-10 list... caught five passes for 75 yards with two touchdowns at New Mexico (9/11)... owns six career multiple touchdown performances, including three games with a trio of TDs... opened the season with back-to-back multiple touchdown performances (3 vs. SMU, 2 at New Mexico)... marks second time during career with multiple touchdowns in consecutive games (3 vs. Rice, 2 at Texas - 2009)... made season debut breaking previous career-highs with 11 re-ceptions and 142 yards and tied a career-high three touchdowns (set twice previously) in season opener against SMU (9/5)... previous career-highs were nine catches and 117 yards, both coming against Rice (2009)... marked second career 100-yard receiving game... caught TD passes from Taylor Potts in the first, second and third quarter against Mustangs... two-yard TD reception in first quarter (0:54) was the first for Tech in 2010 season.
CAREER HIGHSReceptions _____________________________________________________ 11, vs. SMU (2010)Yards ________________________________________________________ 142, vs. SMU (2010)Touchdowns __________________________________________________3 3x, vs. SMU (2010)*Longest Reception _________________________________________ 43, vs. Michigan State (2009)All-Purpose Yards ________________________________________________ 142, vs. SMU (2010)* Indicates most recent high
RECEIVING G REC YARDS Y/REC TD LONG2007 12 15 174 11.6 1 272008 12 18 206 11.4 3 322009 13 45 571 12.7 9 432010 2 16 217 13.6 5 34 TOTALS 39 94 1168 12.4 18 43
17, DETRON LEWIS, WR2010- needs 12 receptions to join school’s career top-10 list... needs 211 receiving yards to enter Tech’s career top-10 list... 20-yard completion in fourth quarter at New Mexico (9/11) marked 2,000 career receiving yards... recorded 44 receiving yards on three catches against Lobos... caught six passes for 79 yards with a touchdown in season opener against SMU (9/5)... has recorded 25 receptions, 451 yards and four touchdowns in four career season openers.
CAREER HIGHSReceptions ______________________________________________ 10, vs. Michigan State (2009)Yards ______________________________________________163, vs. Eastern Washington (2008)Touchdowns ____________________________________________ 2 2x, vs. Kansas State (2009)*Longest Reception _____________________________________163, vs. Eastern Washington (2008)All-Purpose Yards _______________________________________76, vs. Eastern Washington (2008)* Indicates most recent high
RECEIVING G REC YARDS Y/REC TD LONG2007 9 10 120 12.0 3 502008 13 76 913 12.0 3 762009 13 65 844 13.0 6 612010 2 9 123 13.7 1 22 TOTALS 37 160 2000 12.5 13 76
4, DERRICK MAYS, WR2010- made career debut in season opener against SMU (9/5).
34 BEN McROY, ATH2010- carried once for four yards at New Mexico (9/11)... made career debut in season opener against SMU (9/5) rushing once for eight yards.
CAREER HIGHSRushes _________________________________________________ 1 2x, at New Mexico (2010)*Rushing Yards ____________________________________________________ 8, vs. SMU (2010)Rushing Touchdowns ________________________________________________________ NoneReceptions _______________________________________________________________ NoneReceiving Yards ____________________________________________________________ NoneReceiving Touchdowns _______________________________________________________ NoneTotal Touchdowns __________________________________________________________ NoneLongest Rush ____________________________________________________ 8, vs. SMU (2010)All-Purpose Yards __________________________________________________ 8, vs. SMU (2010)* Indicates most recent high
RUSHING G RUSH YARDS Y/RUSH TD LONG2010 2 2 12 6.0 0 8
3030
2010 RED RAIDER FOOTBALL26, FRANKLIN MITCHEM, S2010- had one tackle (assisted) at New Mexico (9/11)... led team during season opener against SMU (9/5) with six tackles (five solo) and had one fumble recovery.
CAREER HIGHSTackles ______________________________________________________ 8, vs. Kansas (2009)Tackles For Loss ____________________________________________ 1, vs. Kansas State (2009)Sacks __________________________________________________________________ NoneInterceptions ___________________________________________1 2x, vs. Michigan State (2009)*Fumbles Recovered _____________________________________________1 4x, vs. SMU (2010)** Indicates most recent high
DEFENSE G U-A-TT TFL SACK INT FF-FR PBU2008 13 9-7-16 0.0 0.0 0-0 2-0 02009 10 45-12-57 1.0 0.0 2-7 0-3 52010 2 5-2-7 0.0 0.0 0-0 0-1 0TOTALS 25 59-21-80 1.0 0.0 2-7 2-4 5
14, DARRIN MOORE, WR2010- caught two passes for 10 yards at New Mexico (9/11)... made career debut in season opener against SMU (9/5).
21, JARVIS PHILLIPS, DB2010- finished with four tackles and intercepted New Mexico (9/11) quarterback B.R. Holbrook in the fourth quarter with 2:37 left in the game... interception was returned 27 yards to the New Mexico 27-yard line... made career debut in season opener against SMU (9/5) with five tackles (all solo), one interception and broke up two passes... intercepted SMU quarterback Kyle Padron in the first quarter with 0:03 on the clock.
CAREER HIGHSTackles ________________________________________________________ 5, vs. SMU (2010)Tackles For Loss ___________________________________________________________ NoneSacks __________________________________________________________________ NoneInterceptions _____________________________________________ 1 2x, at New Mexico (2010)*Fumbles Recovered _________________________________________________________ None* Indicates most recent high
DEFENSE G U-A-TT TFL SACK INT FF-FR PBU2010 2 7-2-9 0.0 0.0 2-27 0-0 2
5, TRE’ PORTER, CB2010- collected four solo tackles at New Mexico (9/11)... made career debut in season opener against SMU (9/5) with one interception, which he returned for 13 yards... intercepted SMU quarterback Kyle Padron in the second quarter with 8:22 on the clock.
CAREER HIGHSTackles ___________________________________________________ 4, at New Mexico (2010)Tackles For Loss ___________________________________________________________ NoneSacks __________________________________________________________________ NoneInterceptions _____________________________________________________ 1, vs. SMU (2010)Fumbles Recovered _________________________________________________________ None
DEFENSE G U-A-TT TFL SACK INT FF-FR PBU2010 2 4-0-4 0.0 0.0 1-13 0-0 1
CAREER HIGHSReceptions _________________________________________________ 2, at New Mexico (2010)Yards ____________________________________________________ 10, at New Mexico (2010)Touchdowns ______________________________________________________________ NoneLongest Reception ____________________________________________ 8, at New Mexico (2010)All-Purpose Yards ____________________________________________ 10, at New Mexico (2010)* Indicates most recent high
RECEIVING G REC YARDS Y/REC TD LONG2010 2 2 10 5.0 0 8
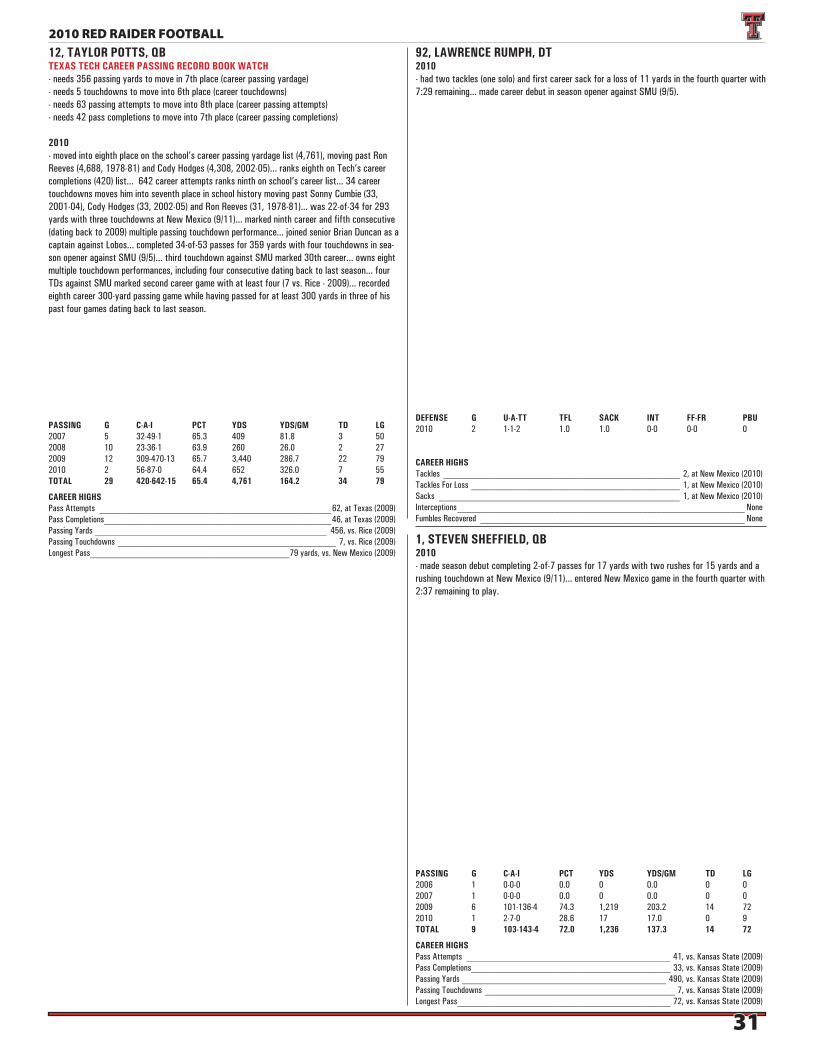
3131
2010 RED RAIDER FOOTBALL12, TAYLOR POTTS, QBTEXAS TECH CAREER PASSING RECORD BOOK WATCH- needs 356 passing yards to move in 7th place (career passing yardage)- needs 5 touchdowns to move into 6th place (career touchdowns)- needs 63 passing attempts to move into 8th place (career passing attempts)- needs 42 pass completions to move into 7th place (career passing completions)
2010- moved into eighth place on the school’s career passing yardage list (4,761), moving past Ron Reeves (4,688, 1978-81) and Cody Hodges (4,308, 2002-05)... ranks eighth on Tech’s career completions (420) list... 642 career attempts ranks ninth on school’s career list... 34 career touchdowns moves him into seventh place in school history moving past Sonny Cumbie (33, 2001-04), Cody Hodges (33, 2002-05) and Ron Reeves (31, 1978-81)... was 22-of-34 for 293 yards with three touchdowns at New Mexico (9/11)... marked ninth career and fifth consecutive (dating back to 2009) multiple passing touchdown performance... joined senior Brian Duncan as a captain against Lobos... completed 34-of-53 passes for 359 yards with four touchdowns in sea-son opener against SMU (9/5)... third touchdown against SMU marked 30th career... owns eight multiple touchdown performances, including four consecutive dating back to last season... four TDs against SMU marked second career game with at least four (7 vs. Rice - 2009)... recorded eighth career 300-yard passing game while having passed for at least 300 yards in three of his past four games dating back to last season.
CAREER HIGHSPass Attempts __________________________________________________62, at Texas (2009)Pass Completions _________________________________________________46, at Texas (2009)Passing Yards __________________________________________________ 456, vs. Rice (2009)Passing Touchdowns _______________________________________________ 7, vs. Rice (2009)Longest Pass ___________________________________________79 yards, vs. New Mexico (2009)
PASSING G C-A-I PCT YDS YDS/GM TD LG2007 5 32-49-1 65.3 409 81.8 3 502008 10 23-36-1 63.9 260 26.0 2 272009 12 309-470-13 65.7 3,440 286.7 22 792010 2 56-87-0 64.4 652 326.0 7 55TOTAL 29 420-642-15 65.4 4,761 164.2 34 79
92, LAWRENCE RUMPH, DT2010- had two tackles (one solo) and first career sack for a loss of 11 yards in the fourth quarter with 7:29 remaining... made career debut in season opener against SMU (9/5).
CAREER HIGHSTackles ___________________________________________________ 2, at New Mexico (2010)Tackles For Loss _____________________________________________ 1, at New Mexico (2010)Sacks ____________________________________________________ 1, at New Mexico (2010)Interceptions ______________________________________________________________ NoneFumbles Recovered _________________________________________________________ None
DEFENSE G U-A-TT TFL SACK INT FF-FR PBU2010 2 1-1-2 1.0 1.0 0-0 0-0 0
1, STEVEN SHEFFIELD, QB2010- made season debut completing 2-of-7 passes for 17 yards with two rushes for 15 yards and a rushing touchdown at New Mexico (9/11)... entered New Mexico game in the fourth quarter with 2:37 remaining to play.
CAREER HIGHSPass Attempts ____________________________________________ 41, vs. Kansas State (2009)Pass Completions ___________________________________________ 33, vs. Kansas State (2009)Passing Yards ____________________________________________ 490, vs. Kansas State (2009)Passing Touchdowns _________________________________________ 7, vs. Kansas State (2009)Longest Pass ______________________________________________ 72, vs. Kansas State (2009)
PASSING G C-A-I PCT YDS YDS/GM TD LG2006 1 0-0-0 0.0 0 0.0 0 02007 1 0-0-0 0.0 0 0.0 0 02009 6 101-136-4 74.3 1,219 203.2 14 722010 1 2-7-0 28.6 17 17.0 0 9TOTAL 9 103-143-4 72.0 1,236 137.3 14 72

3232
2010 RED RAIDER FOOTBALL94, SCOTT SMITH, DE2010- recorded two tackles (one solo), with one tackle for a loss of 12 yards, forced one fumble, recovered one fumble and had first career sack at New Mexico (9/11)... made career debut in season opener against SMU (9/5).
45, TYRONE SONIER, LB2010- collected four tackles (three solo), forced one fumble and had one quarterback hurry at New Mexico (9/11)... had two tackles (both solo), including first career sack for a four-yard loss in the season opener against SMU (9/5).
CAREER HIGHSTackles ___________________________________________________ 4, at New Mexico (2010)Tackles For Loss __________________________________________________ 1, vs. SMU (2010)Sacks _________________________________________________________ 1, vs. SMU (2010)Interceptions ______________________________________________________________ NoneFumbles Recovered _________________________________________________________ None
DEFENSE G U-A-TT TFL SACK INT FF-FR PBU2008 4 2-0-2 0.0 0.0 0-0 0-0 0 2009 3 2-2-4 0.0 0.0 0-0 0-0 02010 2 5-1-6 1.0 1.0 0-0 1-0 0TOTALS 9 8-4-12 1.0 1.0 0-0 1-0 0
24, ERIC STEPHENS, RBTEXAS TECH CAREER KICK RETURN RECORD BOOK WATCH- needs 16 kick returns to break all-time record (career kick returns)- needs 190 kick-return yards to break all-time record (career kick return yards)
2010- 41 career kick returns rank sixth in Texas Tech history... 1,120 career kick-return yards rank third in Texas Tech history... had 175 kick return yards, 46 yards rushing (10 carries), including one rushing touchdown, and 43 yards receiving (three catches) for 264 all-purpose yards at New Mexico (9/11)... 175 kick-return yards are second most during career (school-record 182 at Texas - 2009)... return yards at New Mexico break school record for a sophomore in a single-game... posted a career-long 93-yard kick return midway through the first quarter to the Lobos seven-yard line......marks eighth career and fourth consecutive game (dating back to 2009) with at least 100 all-purpose yards... carried nine times for 35 yards with one rushing touchdown and returned five kickoffs for 122 yards (24.4 avg) for a team-leading 157 all-purpose yards in the season opener against SMU (9/5).
CAREER HIGHSRushes ___________________________________________________ 10, at New Mexico (2010)Rushing Yards ___________________________________________ 46 2x, at New Mexico (2010)*Rushing Touchdowns _______________________________________ 1 4x, at New Mexico (2010)*Receptions ______________________________________________ 3 3x, at New Mexico (2010)*Receiving Yards _____________________________________________ 43, at New Mexico (2010)Receiving Touchdowns ______________________________________________ 1, vs. Rice (2009)Total Touchdowns ______________________________________________1 3x, vs. SMU (2010)*Longest Rush ________________________________________________30, vs. Oklahoma (2009)Longest Reception ________________________________________________ 34, vs. Rice (2009)Kickoff Returns ___________________________________________________7, at Texas (2009)Kickoff Return Yards _____________________________________________ 182, at Texas (2009)Longest Kickoff Return ________________________________________ 93, at New Mexico (2010)All-Purpose Yards ___________________________________________ 264, at New Mexico (2010)* Indicates most recent high
KICK RETURNS G RET YARDS Y/RET TD LONG2009 13 32 823 25.7 0 642010 2 9 297 33.0 0 93TOTALS 15 41 1,120 27.3 0 93
RECEIVING G REC YARDS Y/REC TD LONG2009 13 14 113 8.1 1 342010 2 3 43 14.3 0 19TOTALS 15 17 156 9.2 1 34
RUSHING G RUSH YARDS Y/RUSH TD LONG2009 13 49 254 5.2 2 302010 2 19 81 4.3 2 13TOTALS 15 68 335 4.9 4 30
ALL PURPOSE G RUSH REC PR KR IR TOTAL AVG/G2009 13 254 113 0 823 0 1,190 91.52010 2 81 43 0 43 0 421 210.5TOTALS 15 335 156 0 112 0 1,611 107.4
CAREER HIGHSTackles ___________________________________________________ 3, at New Mexico (2010)Tackles For Loss _____________________________________________ 1, at New Mexico (2010)Sacks ____________________________________________________ 1, at New Mexico (2010)Interceptions ______________________________________________________________ NoneFumbles Recovered ___________________________________________ 1, at New Mexico (2010)
DEFENSE G U-A-TT TFL SACK INT FF-FR PBU2010 2 2-1-3 1.0 1.0 0-0 1-1 0
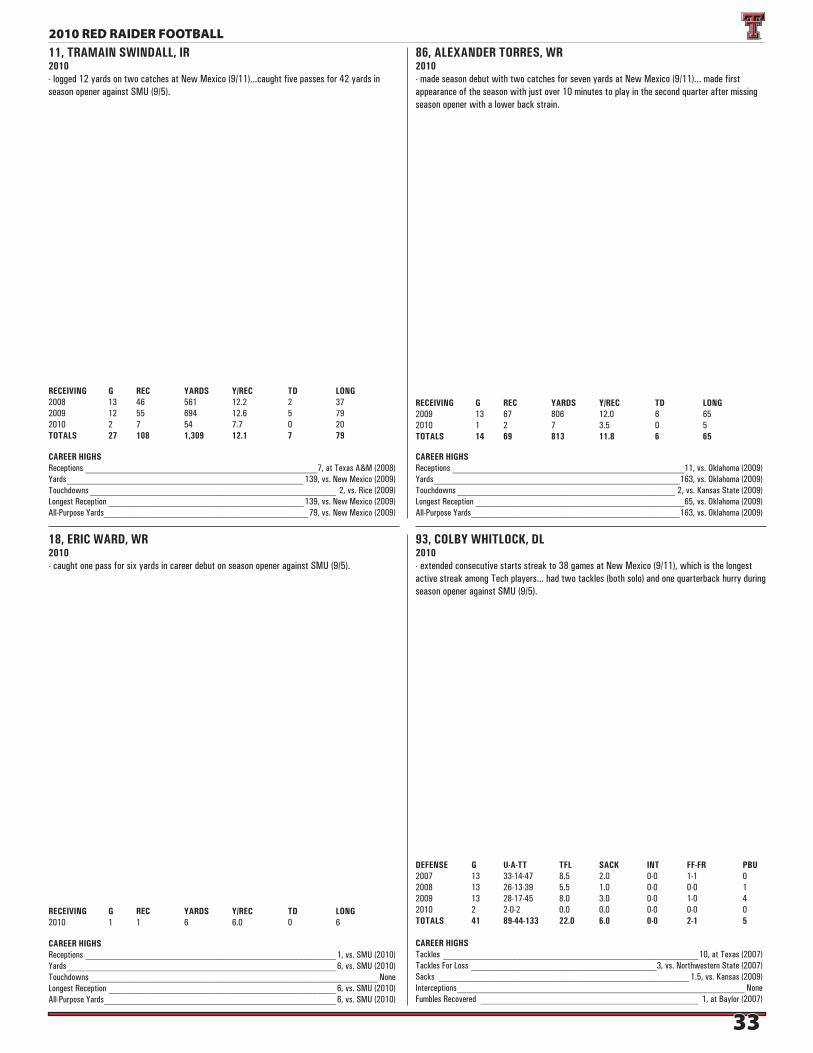
3333
2010 RED RAIDER FOOTBALL11, TRAMAIN SWINDALL, IR2010- logged 12 yards on two catches at New Mexico (9/11)...caught five passes for 42 yards in season opener against SMU (9/5).
CAREER HIGHSReceptions __________________________________________________7, at Texas A&M (2008)Yards ___________________________________________________ 139, vs. New Mexico (2009)Touchdowns _____________________________________________________ 2, vs. Rice (2009)Longest Reception __________________________________________ 139, vs. New Mexico (2009)All-Purpose Yards ____________________________________________79, vs. New Mexico (2009)
RECEIVING G REC YARDS Y/REC TD LONG2008 13 46 561 12.2 2 372009 12 55 694 12.6 5 792010 2 7 54 7.7 0 20 TOTALS 27 108 1,309 12.1 7 79
18, ERIC WARD, WR2010- caught one pass for six yards in career debut on season opener against SMU (9/5).
CAREER HIGHSReceptions ______________________________________________________ 1, vs. SMU (2010)Yards __________________________________________________________ 6, vs. SMU (2010)Touchdowns ______________________________________________________________ NoneLongest Reception _________________________________________________ 6, vs. SMU (2010)All-Purpose Yards __________________________________________________ 6, vs. SMU (2010)
RECEIVING G REC YARDS Y/REC TD LONG2010 1 1 6 6.0 0 6
86, ALEXANDER TORRES, WR2010- made season debut with two catches for seven yards at New Mexico (9/11)... made first appearance of the season with just over 10 minutes to play in the second quarter after missing season opener with a lower back strain.
CAREER HIGHSReceptions __________________________________________________11, vs. Oklahoma (2009)Yards _____________________________________________________163, vs. Oklahoma (2009)Touchdowns _______________________________________________ 2, vs. Kansas State (2009)Longest Reception _____________________________________________65, vs. Oklahoma (2009)All-Purpose Yards _____________________________________________163, vs. Oklahoma (2009)
RECEIVING G REC YARDS Y/REC TD LONG2009 13 67 806 12.0 6 652010 1 2 7 3.5 0 5 TOTALS 14 69 813 11.8 6 65
93, COLBY WHITLOCK, DL2010- extended consecutive starts streak to 38 games at New Mexico (9/11), which is the longest active streak among Tech players... had two tackles (both solo) and one quarterback hurry during season opener against SMU (9/5).
CAREER HIGHSTackles _______________________________________________________10, at Texas (2007)Tackles For Loss ________________________________________3, vs. Northwestern State (2007)Sacks ______________________________________________________ 1.5, vs. Kansas (2009)Interceptions ______________________________________________________________ NoneFumbles Recovered _______________________________________________ 1, at Baylor (2007)
DEFENSE G U-A-TT TFL SACK INT FF-FR PBU2007 13 33-14-47 8.5 2.0 0-0 1-1 02008 13 26-13-39 5.5 1.0 0-0 0-0 12009 13 28-17-45 8.0 3.0 0-0 1-0 42010 2 2-0-2 0.0 0.0 0-0 0-0 0TOTALS 41 89-44-133 22.0 6.0 0-0 2-1 5

3434
2010 RED RAIDER FOOTBALL
27, ZACH WINBUSH, LB2010- was in on two tackles (both assisted) at New Mexico (9/11) for first career tackles... made career debut in season opener against SMU (9/5).
85, MATT WILLIAMS, PK2010- moved into second place on Tech’s all-time career PAT list (105)... was a perfect 7-for-7 in PATs and made a 22-yard field goal - first of the season - at New Mexico (9/11)... had 47-yard field goal attempt blocked against SMU (9/5) in season opener... was 5-for-5 in PATs.
CAREER HIGHSField Goals Attempts _____________________________________3 2x, vs. Michigan State (2009)*Field Goals Made __________________________________________ 2 4x, Michigan State (2009)*Longest Field Goal Made ___________________________________________ 43, vs. Baylor (2009)Field Goals Blocked _____________________________________________1 2x, vs. SMU (2010)** Indicates most recent high
FIELD GOALS G PAT/AT FG/FGA PCT LONG2008 6 33-33 2-3 66.7 312009 13 60-61 11-14 78.6 432010 2 12-12 1-2 50.0 22TOTAL 21 105-106 14-19 73.7 43
CAREER HIGHSTackles ___________________________________________________ 2, at New Mexico (2010)Tackles For Loss ___________________________________________________________ NoneSacks __________________________________________________________________ NoneInterceptions ______________________________________________________________ NoneFumbles Recovered _________________________________________________________ None
DEFENSE G U-A-TT TFL SACK INT FF-FR PBU2010 2 0-2-2 0.0 0.0 0-0 0-0 0TOTALS 2 0-2-2 0.0 0.0 0-0 0-0 0
6, AUSTIN ZOUZALIK, IR2010- first touch of the season resulted in a 55-yard touchdown reception (also a career-long, previous was 50-yard catch in Alamo Bowl in 2009) that gave Texas Tech a 7-0 lead with 14:15 remain-ing in the first quarter at New Mexico (9/11)... missed the season opener after undergoing an appendectomy (8/12).
CAREER HIGHSRushes ________________________________________________________ 1, vs. Baylor (2009)Rushing Yards ___________________________________________________ 5, vs. Baylor (2009)Rushing Touchdowns ________________________________________________________ NoneReceptions _____________________________________________________ 7, vs. Baylor (2009)Receiving Yards _________________________________________________ 92, vs. Baylor (2009)Receiving Touchdowns ______________________________________ 1 3x, at New Mexico (2010)*Total Touchdowns _________________________________________ 1 3x, at New Mexico (2010)*Longest Rush ___________________________________________________ 5, vs. Baylor (2009)Longest Reception ___________________________________________ 55, at New Mexico (2010)Punt Returns ________________________________________________5, vs. New Mexico (2009)Punt Return Yards ___________________________________________52, vs. New Mexico (2009)Longest Punt Return _____________________________________ 26 2x, at Oklahoma State (2009)*All-Purpose Yards ________________________________________________ 97, vs. Baylor (2009)* Indicates most recent high
PUNT RETURNS G RET YARDS Y/RET TD LONG2009 13 21 201 9.6 0 26 2010 1 2 -15 -7.5 0 3TOTALS 14 23 186 8.1 0 26
RECEIVING G REC YARDS Y/REC TD LONG2009 13 35 469 13.4 2 50 2010 1 1 55 55.0 1 55TOTALS 14 36 524 37.4 3 55
RUSHING G RUSH YARDS Y/RUSH TD LONG2009 13 1 5 5.0 0 5 2010 1 0 0 0.0 0 0TOTALS 14 1 5 5.0 0 5
ALL PURPOSE G RUSH REC PR KR IR TOTAL AVG/G2009 13 5 469 201 63 0 738 56.82010 1 0 55 -15 0 0 40 40.0TOTALS 14 5 524 186 63 0 778 55.6

3535
2010 RED RAIDER FOOTBALL
GAME
Most Attempts: 72, Graham Harrell vs. Oklahoma (2007)Most Completions: 49, Kliff Kingsbury at Texas A&M (2002); vs. Missouri (2002)Highest Completion Percentage: 83.7%, Graham Harrell vs. Iowa State (2007); 36-of-43Most Yards per Completion: 28.8, Kliff Kingsbury vs. Oklahoma (1999); 9-of-17, 259 yardsMost Yards: 661, B.J. Symons at Mississippi (2003)Most Yards by Class: Freshman: 422, Billy Joe Tolliver vs. TCU (1985) Sophomore: 519, Graham Harrell vs. Texas (2006) Junior: 646, Graham Harrell at Oklahoma State (2007) Senior: 661, B.J. Symons at Mississippi (2003)Most Touchdowns: 8, B.J. Symons vs. Texas A&M (2003)Miscellaneous: Longest Texas Tech Pass: 95, Robert Hall to Rodney Blackshear vs. Houston (1991) Most Passing Yards In A Half: Steven Sheffield (370) vs. Kansas State (2009) - First Half SINGLE-GAME YARDAGE LEADERS 1. B.J. Symons at Mississippi (2003)....................................661 2. Graham Harrell at Oklahoma State (2007) ........................646 3. Cody Hodges vs. Kansas State (2005) ..............................643 4. B.J. Symons at N.C. State (2003) ....................................586 5. B.J. Symons at Oklahoma State (2003) ............................552 6. Graham Harrell vs. E. Washington (2008)..........................536 7. Sonny Cumbie vs. California (2004) ..................................520 8. Graham Harrell vs. Texas (2006) ......................................519 9. Kliff Kingsbury vs. Missouri (2002)...................................510 10. B.J. Symons vs. Texas A&M (2003) .................................505
SEASON
Most Attempts: 719, B.J. Symons (2003)Most Completions: 512, Graham Harrell (2007)Highest Completion Percentage: 71.8%, Graham Harrell (2007); 512-of-713Most Yards per Completion: 15.1, Billy Joe Tolliver (1988); 190 completions, 2,869 yardsMost Yards: 5,833, B.J. Symons (2003)Most Yards by Class: Freshman: 1,596, Zebbie Lethridge (1994) Sophomore: 4,555, Graham Harrell (2006) Junior: 5,705, Graham Harrell (2007) Senior: 5,833, B.J. Symons (2003)Most Yards per Game: 448.7, B.J. Symons (2003); 5,833/13 Most Touchdowns: 52, B.J. Symons (2003)Miscellaneous: Most 300-Yard Games: 13, Graham Harrell (2007) Most 400-Yard Games: 11, Graham Harrell (2007)
SINGLE-SEASON YARDAGE LEADERS 1. B.J. Symons (2003) ......................................................5,833 2. Graham Harrell (2007) ...................................................5,705 3. Graham Harrell (2008) ...................................................5,111 4. Kliff Kingsbury (2002) ...................................................5,017 5. Sonny Cumbie (2004) ....................................................4,742 6. Graham Harrell (2006) ...................................................4,555 7. Cody Hodges (2005) ......................................................4,238 8. Kliff Kingsbury (2001) ...................................................3,502 9. Taylor Potts (2009) .......................................................3,440 10. Kliff Kingsbury (2000) ...................................................3,418
SINGLE-SEASON YARD PER GAME LEADERS 1. B.J. Symons (2003) ......................................................448.7 2. Graham Harrell (2007) ...................................................438.8 3. Sonny Cumbie (2004) ....................................................395.2 4. Graham Harrell (2008) ...................................................393.2 5. Kliff Kingsbury (2002) ...................................................358.4 6. Cody Hodges (2005) ......................................................353.2 7. Graham Harrell (2006) ...................................................350.4 8. Kliff Kingsbury (2001) ...................................................318.4 9. Taylor Potts (2009) .......................................................286.7 10. Kliff Kingsbury (2000) ...................................................284.3
SINGLE-SEASON TOUCHDOWN LEADERS 1. B.J. Symons (2003) ...........................................................52 2. Graham Harrell (2007) ........................................................48 3. Kliff Kingsbury (2002) ........................................................45 Graham Harrell (2008) ........................................................45 5. Graham Harrell (2006) ........................................................38 6. Sonny Cumbie (2004) .........................................................32 7. Cody Hodges (2005) ...........................................................31 8. Kliff Kingsbury (2001) ........................................................25 9. Taylor Potts (2009) ............................................................22 10. Robert Hall (1993) ..............................................................21 Kliff Kingsbury (2000) ........................................................21
SINGLE-SEASON PASS ATTEMPT LEADERS 1. B.J. Symons (2003) .........................................................719 2. Graham Harrell (2007) ......................................................713 3. Kliff Kingsbury (2002) ......................................................712 4. Sonny Cumbie (2004) .......................................................642 5. Graham Harrell (2008) ......................................................626 6. Graham Harrell (2006) ......................................................617 7. Kliff Kingsbury (2000) ......................................................585 8. Cody Hodges (2005) .........................................................531 9. Kliff Kingsbury (2001) ......................................................529 10. Taylor Potts (2009) ..........................................................470
SINGLE-SEASON COMPLETION LEADERS 1. Graham Harrell (2007) ......................................................512 2. Kliff Kingsbury (2002) ......................................................479 3. B.J. Symons (2003) .........................................................470 4. Graham Harrell (2008) ......................................................442 5. Sonny Cumbie (2004) .......................................................421 6. Graham Harrell (2006) ......................................................412 7. Kliff Kingsbury (2001) ......................................................365 8. Kliff Kingsbury (2000) ......................................................362 9. Cody Hodges (2005) .........................................................353 10. Taylor Potts (2009) ..........................................................309
CAREER
Most Attempts: 2,062, Graham Harrell (2005-08)Most Completions: 1,403, Graham Harrell (2005-08)Highest Completion Percentage: 68.0, Graham Harrell (2005-08); 1,403-of-2,062Most Yards per Completion: 14.9, Rodney Allison (1974-77); 161 completions, 2,411 yardsMost Yards: 15,793, Graham Harrell (2005-08)Most Yards per Game: 350.9, Graham Harrell (2005-08);15,793.45 gamesMost Touchdowns: 134, Graham Harrell (2005-08)Miscellaneous: Most 300-Yard Games: 32, Graham Harrell (2005-08) Most 400-Yard Games: 20, Graham Harrell (2005-08)
CAREER YARDAGE LEADERS 1. Graham Harrell (2005-08) ............................................15,793 2. Kliff Kingsbury (1999-02) ............................................12,429 3. Robert Hall (1990-93) ...................................................7,908 4. Zebbie Lethridge (1994-97) ...........................................6,789 5. Billy Joe Tolliver (1985-88) ...........................................6,756 6. B.J. Symons (2000-03) .................................................6,378 7. Sonny Cumbie (2001-04) ...............................................5,116 8. Taylor Potts (2007-) ......................................................4,761 9. Ron Reeves (1978-81) ...................................................4,688 10. Cody Hodges (2002-05).................................................4,308
CAREER TOUCHDOWN LEADERS 1. Graham Harrell (2005-present) .........................................134 2. Kliff Kingsbury (1999-02) ...................................................95 3. B.J. Symons (2000-03) ......................................................59 4. Robert Hall (1990-93) ........................................................48 5. Zebbie Lethridge (1994-97) ................................................42 6. Billy Joe Tolliver (1985-88) ................................................38 7. Taylor Potts (2007-) ...........................................................34 8. Sonny Cumbie (2001-04) ....................................................33 Cody Hodges (2002-05)......................................................33 10. Ron Reeves (1978-81) ........................................................31
CAREER PASS ATTEMPTS LEADERS 1. Graham Harrell (2005-08) ..............................................2,062 2. Kliff Kingsbury (1999-02) ..............................................1,883 3. Zebbie Lethridge (1994-97) ...........................................1,070 4. Billy Joe Tolliver (1985-88) ...........................................1,008 5. Robert Hall (1990-93) ......................................................997 6. B.J. Symons (2000-03) ....................................................797 7. Ron Reeves (1978-81) ......................................................763 8. Sonny Cumbie (2001-04) ..................................................704 9. Taylor Potts (2007-) .........................................................642 10. Cody Hodges (2002-05)....................................................543
CAREER COMPLETION LEADERS 1. Graham Harrell (2005-08) ..............................................1,403 2. Kliff Kingsbury (1999-02) ..............................................1,231 3. B.J. Symons (2000-03) ....................................................554 4. Robert Hall (1990-93) ......................................................548 5. Zebbie Lethridge (1994-97) ..............................................519 6. Billy Joe Tolliver (1985-88) ..............................................493 7. Sonny Cumbie (2001-04) ..................................................461 8. Taylor Potts (2007-) .........................................................420 9. Cody Hodges (2002-05)....................................................360 10. Ron Reeves (1978-81) ......................................................352
PASSING RECORDS
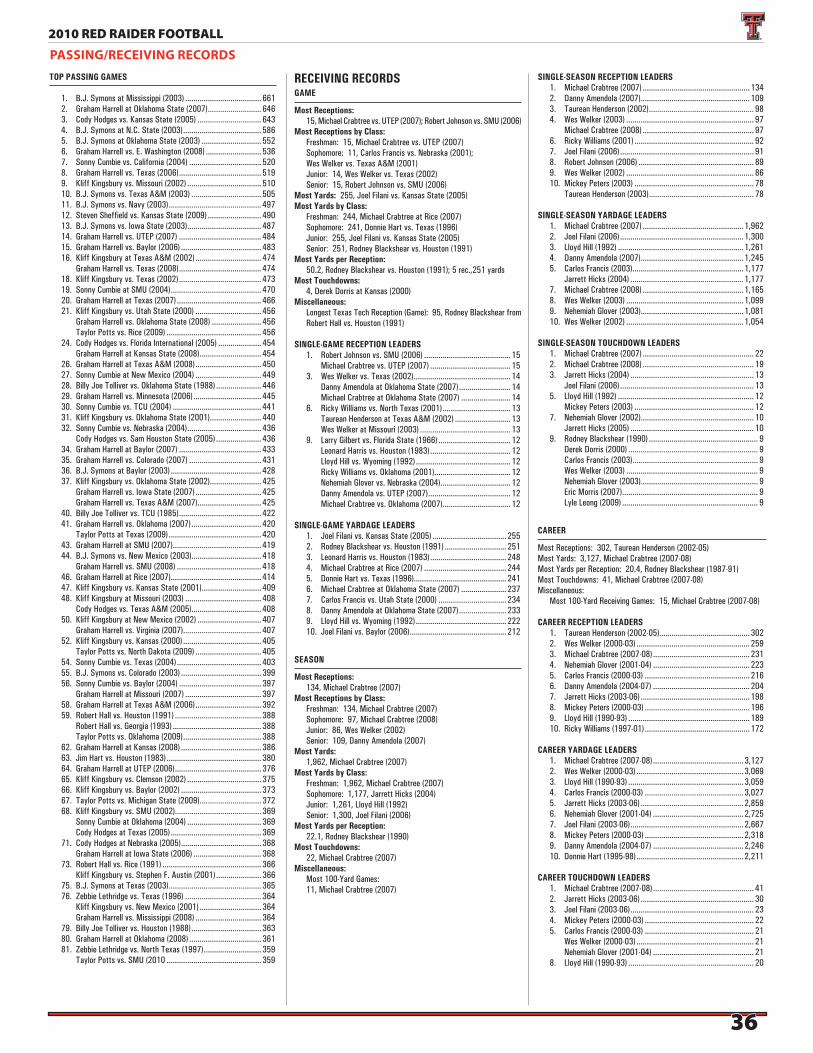
3636
2010 RED RAIDER FOOTBALL
TOP PASSING GAMES
1. B.J. Symons at Mississippi (2003) ..................................... 661 2. Graham Harrell at Oklahoma State (2007) .......................... 646 3. Cody Hodges vs. Kansas State (2005) ............................... 643 4. B.J. Symons at N.C. State (2003) ...................................... 586 5. B.J. Symons at Oklahoma State (2003) ............................. 552 6. Graham Harrell vs. E. Washington (2008) ........................... 536 7. Sonny Cumbie vs. California (2004) ................................... 520 8. Graham Harrell vs. Texas (2006) ........................................ 519 9. Kliff Kingsbury vs. Missouri (2002) .................................... 510 10. B.J. Symons vs. Texas A&M (2003) .................................. 505 11. B.J. Symons vs. Navy (2003) ............................................. 497 12. Steven Sheffield vs. Kansas State (2009) .......................... 490 13. B.J. Symons vs. Iowa State (2003) .................................... 487 14. Graham Harrell vs. UTEP (2007) ........................................ 484 15. Graham Harrell vs. Baylor (2006) ....................................... 483 16. Kliff Kingsbury at Texas A&M (2002) ................................ 474 Graham Harrell vs. Texas (2008) ........................................ 474 18. Kliff Kingsbury vs. Texas (2002) ........................................ 473 19. Sonny Cumbie at SMU (2004) ............................................ 470 20. Graham Harrell at Texas (2007) ......................................... 466 21. Kliff Kingsbury vs. Utah State (2000) ................................ 456 Graham Harrell vs. Oklahoma State (2008) ........................ 456 Taylor Potts vs. Rice (2009) .............................................. 456 24. Cody Hodges vs. Florida International (2005) ..................... 454 Graham Harrell at Kansas State (2008) .............................. 454 26. Graham Harrell at Texas A&M (2008) ................................ 450 27. Sonny Cumbie at New Mexico (2004) ................................ 449 28. Billy Joe Tolliver vs. Oklahoma State (1988) ...................... 446 29. Graham Harrell vs. Minnesota (2006) ................................. 445 30. Sonny Cumbie vs. TCU (2004) ........................................... 441 31. Kliff Kingsbury vs. Oklahoma State (2001) ......................... 440 32. Sonny Cumbie vs. Nebraska (2004) .................................... 436 Cody Hodges vs. Sam Houston State (2005) ...................... 436 34. Graham Harrell at Baylor (2007) ........................................ 433 35. Graham Harrell vs. Colorado (2007) ................................... 431 36. B.J. Symons at Baylor (2003) ............................................ 428 37. Kliff Kingsbury vs. Oklahoma State (2002) ......................... 425 Graham Harrell vs. Iowa State (2007) ................................ 425 Graham Harrell vs. Texas A&M (2007) ............................... 425 40. Billy Joe Tolliver vs. TCU (1985) ........................................ 422 41. Graham Harrell vs. Oklahoma (2007) .................................. 420 Taylor Potts at Texas (2009) ............................................. 420 43. Graham Harrell at SMU (2007) ........................................... 419 44. B.J. Symons vs. New Mexico (2003).................................. 418 Graham Harrell vs. SMU (2008) ......................................... 418 46. Graham Harrell at Rice (2007) ............................................ 414 47. Kliff Kingsbury vs. Kansas State (2001) ............................. 409 48. Kliff Kingsbury at Missouri (2003) ..................................... 408 Cody Hodges vs. Texas A&M (2005).................................. 408 50. Kliff Kingsbury at New Mexico (2002) ............................... 407 Graham Harrell vs. Virginia (2007) ...................................... 407 52. Kliff Kingsbury vs. Kansas (2000) ...................................... 405 Taylor Potts vs. North Dakota (2009) ................................ 405 54. Sonny Cumbie vs. Texas (2004) ......................................... 403 55. B.J. Symons vs. Colorado (2003) ....................................... 399 56. Sonny Cumbie vs. Baylor (2004) ........................................ 397 Graham Harrell at Missouri (2007) ..................................... 397 58. Graham Harrell at Texas A&M (2006) ................................ 392 59. Robert Hall vs. Houston (1991) .......................................... 388 Robert Hall vs. Georgia (1993) ........................................... 388 Taylor Potts vs. Oklahoma (2009) ...................................... 388 62. Graham Harrell at Kansas (2008) ....................................... 386 63. Jim Hart vs. Houston (1983) .............................................. 380 64. Graham Harrell at UTEP (2006) .......................................... 376 65. Kliff Kingsbury vs. Clemson (2002) .................................... 375 66. Kliff Kingsbury vs. Baylor (2002) ....................................... 373 67. Taylor Potts vs. Michigan State (2009) .............................. 372 68. Kliff Kingsbury vs. SMU (2002).......................................... 369 Sonny Cumbie at Oklahoma (2004) .................................... 369 Cody Hodges at Texas (2005) ............................................ 369 71. Cody Hodges at Nebraska (2005) ....................................... 368 Graham Harrell at Iowa State (2006) ................................. 368 73. Robert Hall vs. Rice (1991) ................................................ 366 Kliff Kingsbury vs. Stephen F. Austin (2001) ...................... 366 75. B.J. Symons at Texas (2003) ............................................. 365 76. Zebbie Lethridge vs. Texas (1996) ..................................... 364 Kliff Kingsbury vs. New Mexico (2001) .............................. 364 Graham Harrell vs. Mississippi (2008) ................................ 364 79. Billy Joe Tolliver vs. Houston (1988) .................................. 363 80. Graham Harrell at Oklahoma (2008) ................................... 361 81. Zebbie Lethridge vs. North Texas (1997) ............................ 359 Taylor Potts vs. SMU (2010 .............................................. 359
RECEIVING RECORDSGAME
Most Receptions: 15, Michael Crabtree vs. UTEP (2007); Robert Johnson vs. SMU (2006)Most Receptions by Class: Freshman: 15, Michael Crabtree vs. UTEP (2007) Sophomore: 11, Carlos Francis vs. Nebraska (2001); Wes Welker vs. Texas A&M (2001) Junior: 14, Wes Welker vs. Texas (2002) Senior: 15, Robert Johnson vs. SMU (2006)Most Yards: 255, Joel Filani vs. Kansas State (2005)Most Yards by Class: Freshman: 244, Michael Crabtree at Rice (2007) Sophomore: 241, Donnie Hart vs. Texas (1996) Junior: 255, Joel Filani vs. Kansas State (2005) Senior: 251, Rodney Blackshear vs. Houston (1991)Most Yards per Reception: 50.2, Rodney Blackshear vs. Houston (1991); 5 rec.,251 yardsMost Touchdowns: 4, Derek Dorris at Kansas (2000)Miscellaneous: Longest Texas Tech Reception (Game): 95, Rodney Blackshear from
Robert Hall vs. Houston (1991)
SINGLE-GAME RECEPTION LEADERS 1. Robert Johnson vs. SMU (2006) .......................................... 15 Michael Crabtree vs. UTEP (2007) ....................................... 15 3. Wes Welker vs. Texas (2002) ............................................... 14 Danny Amendola at Oklahoma State (2007) ......................... 14 Michael Crabtree at Oklahoma State (2007) ........................ 14 6. Ricky Williams vs. North Texas (2001) ................................. 13 Taurean Henderson at Texas A&M (2002) ........................... 13 Wes Welker at Missouri (2003) ............................................ 13 9. Larry Gilbert vs. Florida State (1966) ................................... 12 Leonard Harris vs. Houston (1983) ....................................... 12 Lloyd Hill vs. Wyoming (1992) .............................................. 12 Ricky Williams vs. Oklahoma (2001) ..................................... 12 Nehemiah Glover vs. Nebraska (2004) .................................. 12 Danny Amendola vs. UTEP (2007) ........................................ 12 Michael Crabtree vs. Oklahoma (2007) ................................. 12
SINGLE-GAME YARDAGE LEADERS 1. Joel Filani vs. Kansas State (2005) .................................... 255 2. Rodney Blackshear vs. Houston (1991) .............................. 251 3. Leonard Harris vs. Houston (1983) ..................................... 248 4. Michael Crabtree at Rice (2007) ........................................ 244 5. Donnie Hart vs. Texas (1996)............................................. 241 6. Michael Crabtree at Oklahoma State (2007) ...................... 237 7. Carlos Francis vs. Utah State (2000) ................................. 234 8. Danny Amendola at Oklahoma State (2007) ....................... 233 9. Lloyd Hill vs. Wyoming (1992) ............................................ 222 10. Joel Filani vs. Baylor (2006) ............................................... 212
SEASON
Most Receptions: 134, Michael Crabtree (2007)Most Receptions by Class: Freshman: 134, Michael Crabtree (2007) Sophomore: 97, Michael Crabtree (2008) Junior: 86, Wes Welker (2002) Senior: 109, Danny Amendola (2007)Most Yards: 1,962, Michael Crabtree (2007)Most Yards by Class: Freshman: 1,962, Michael Crabtree (2007) Sophomore: 1,177, Jarrett Hicks (2004) Junior: 1,261, Lloyd Hill (1992) Senior: 1,300, Joel Filani (2006)Most Yards per Reception: 22.1, Rodney Blackshear (1990)Most Touchdowns: 22, Michael Crabtree (2007)Miscellaneous: Most 100-Yard Games: 11, Michael Crabtree (2007)
SINGLE-SEASON RECEPTION LEADERS 1. Michael Crabtree (2007) .................................................... 134 2. Danny Amendola (2007) ..................................................... 109 3. Taurean Henderson (2002) ................................................... 98 4. Wes Welker (2003) .............................................................. 97 Michael Crabtree (2008) ...................................................... 97 6. Ricky Williams (2001) .......................................................... 92 7. Joel Filani (2006) ................................................................. 91 8. Robert Johnson (2006) ........................................................ 89 9. Wes Welker (2002) .............................................................. 86 10. Mickey Peters (2003) .......................................................... 78 Taurean Henderson (2003) ................................................... 78
SINGLE-SEASON YARDAGE LEADERS 1. Michael Crabtree (2007) .................................................1,962 2. Joel Filani (2006) ............................................................1,300 3. Lloyd Hill (1992) .............................................................1,261 4. Danny Amendola (2007) ..................................................1,245 5. Carlos Francis (2003) ......................................................1,177 Jarrett Hicks (2004) .......................................................1,177 7. Michael Crabtree (2008) .................................................1,165 8. Wes Welker (2003) .........................................................1,099 9. Nehemiah Glover (2003)..................................................1,081 10. Wes Welker (2002) .........................................................1,054
SINGLE-SEASON TOUCHDOWN LEADERS 1. Michael Crabtree (2007) ...................................................... 22 2. Michael Crabtree (2008) ...................................................... 19 3. Jarrett Hicks (2004) ............................................................ 13 Joel Filani (2006) ................................................................. 13 5. Lloyd Hill (1992) .................................................................. 12 Mickey Peters (2003) .......................................................... 12 7. Nehemiah Glover (2002)....................................................... 10 Jarrett Hicks (2005) ............................................................ 10 9. Rodney Blackshear (1990) ..................................................... 9 Derek Dorris (2000) ............................................................... 9 Carlos Francis (2003) ............................................................. 9 Wes Welker (2003) ................................................................ 9 Nehemiah Glover (2003)......................................................... 9 Eric Morris (2007) .................................................................. 9 Lyle Leong (2009) .................................................................. 9
CAREER
Most Receptions: 302, Taurean Henderson (2002-05)Most Yards: 3,127, Michael Crabtree (2007-08)Most Yards per Reception: 20.4, Rodney Blackshear (1987-91)Most Touchdowns: 41, Michael Crabtree (2007-08)Miscellaneous: Most 100-Yard Receiving Games: 15, Michael Crabtree (2007-08)
CAREER RECEPTION LEADERS 1. Taurean Henderson (2002-05)............................................ 302 2. Wes Welker (2000-03) ....................................................... 259 3. Michael Crabtree (2007-08) ............................................... 231 4. Nehemiah Glover (2001-04) ............................................... 223 5. Carlos Francis (2000-03) ................................................... 216 6. Danny Amendola (2004-07) ............................................... 204 7. Jarrett Hicks (2003-06) ..................................................... 198 8. Mickey Peters (2000-03) ................................................... 196 9. Lloyd Hill (1990-93) ........................................................... 189 10. Ricky Williams (1997-01) ................................................... 172
CAREER YARDAGE LEADERS 1. Michael Crabtree (2007-08) ............................................3,127 2. Wes Welker (2000-03) ....................................................3,069 3. Lloyd Hill (1990-93) ........................................................3,059 4. Carlos Francis (2000-03) ................................................3,027 5. Jarrett Hicks (2003-06) ..................................................2,859 6. Nehemiah Glover (2001-04) ............................................2,725 7. Joel Filani (2003-06) .......................................................2,667 8. Mickey Peters (2000-03) ................................................2,318 9. Danny Amendola (2004-07) ............................................2,246 10. Donnie Hart (1995-98) ....................................................2,211
CAREER TOUCHDOWN LEADERS 1. Michael Crabtree (2007-08) ................................................. 41 2. Jarrett Hicks (2003-06) ....................................................... 30 3. Joel Filani (2003-06) ............................................................ 23 4. Mickey Peters (2000-03) ..................................................... 22 5. Carlos Francis (2000-03) ..................................................... 21 Wes Welker (2000-03) ......................................................... 21 Nehemiah Glover (2001-04) ................................................. 21 8. Lloyd Hill (1990-93) ............................................................. 20
PASSING/RECEIVING RECORDS

3737
2010 RED RAIDER FOOTBALL
GAME
Most Attempts: 43, Anthony Hutchison vs. TCU (1982)Most Yards: 287, Byron Hanspard vs. Baylor (1996)Most Yards by Class: Freshman: 230, Shaud Williams vs. Colorado (1999) Sophomore: 260, Byron Hanspard vs. Air Force (1995) Junior: 287, Byron Hanspard vs. Baylor (1996) Senior: 268, James Hadnot vs. New Mexico (1978)Most Yards per Attempt: 14.1, Taurean Henderson vs. Indiana State (2005); 10, 141 yardsMost Touchdowns: 5, James Gray vs. Rice (1989); Billy Taylor vs. TCU (1977)Miscellaneous: Most Players Gaining: 100 Yards: Ricky Williams (159) and Rob Peters (106) vs. Baylor (1998) Most Yards Gained by Two Players: 385 vs. Baylor (1996); Byron Hanspard (287) and Sammy Morris (98) Longest Texas Tech Run: 90, Donny Anderson vs. TCU (1964)
SINGLE-GAME YARDAGE LEADERS 1. Byron Hanspard vs. Baylor (1996) .......................................287 2. James Gray vs. Duke (1989) ...............................................280 3. Byron Hanspard vs. Oklahoma State (1996) ........................272 4. James Hadnot vs. New Mexico (1978) ................................268 5. Byron Hanspard vs. Air Force (1995) ...................................260 6. Ricky Williams vs. UTEP (1998) ..........................................251 7. Byron Hanspard vs. SW Louisiana (1996) ............................247 8. Ricky Williams vs. Fresno State (1998) ...............................244 9. James Gray vs. Arizona (1989) ...........................................234 10. James Gray vs. SMU (1989) ...............................................232
SEASON
Most Attempts: 339, Byron Hanspard (1996)Most Yards: 2,084, Byron Hanspard (1996)Most Yards by Class: Freshman: 894, Ricky Williams (1997) Sophomore: 1,582, Ricky Williams (1998) Junior: 2,084, Byron Hanspard (1996) Senior: 1,752, Byron Morris (1993)Most Yards per Attempt: 9.1, Lonnie Graham (1954)Most Yards per Game: 189.5, Byron Hanspard (1996)Most Touchdowns: 22, Byron Morris (1993)
SINGLE-SEASON YARDAGE LEADERS 1. Byron Hanspard (1996) ....................................................2,084 2. Byron Morris (1998) ........................................................1,752 3. Ricky Williams (1998) ......................................................1,582 4. James Gray (1989) ..........................................................1,509 5. Byron Hanspard (1995) ....................................................1,374 6. James Hadnot (1979) ......................................................1,371 7. James Hadnot (1978) ......................................................1,369 8. Byron Morris (1992) ........................................................1,279 9. Doug McCutchen (1970) ..................................................1,068 10. James Gray (1987) ..........................................................1,006
SINGLE-SEASON ATTEMPT LEADERS 1. Byron Hanspard (1996) .......................................................339 2. Ricky Williams (1998) .........................................................336 3. Byron Morris (1993) ...........................................................298 4. James Hadnot (1979) .........................................................273 5. James Gray (1989) .............................................................263 6. James Hadnot (1978) .........................................................251 7. Byron Hanspard (1995) .......................................................248 8. Byron Morris (1992) ...........................................................242 9. Doug McCutchen (1970) .....................................................227 10. Anthony Lynn (1990) ..........................................................224
SINGLE-SEASON TOUCHDOWN LEADERS 1. Byron Morris (1993) .............................................................22 2. James Gray (1989) ...............................................................20 3. Donny Anderson (1965) ........................................................17 Taurean Henderson (2005) ....................................................17 5. Taurean Henderson (2004) ....................................................16 6. Ricky Williams (2001) ...........................................................14 Baron Batch (2009) ..............................................................14 8. Bobby Cavazos (1953) ..........................................................13 Billy Taylor (1977) ................................................................13 Byron Hanspard (1996) .........................................................13 Ricky Williams (1998) ...........................................................13
CAREER
Most Attempts: 789, Ricky Williams (1997-01)Most Yards: 4,219, Byron Hanspard (1994-96)Most Yards per Attempt: 6.2, James Sides (1953-55)Most Yards per Game: 127.8, Byron Hanspard (1994-96)Most Touchdowns: 52, James Gray (1986-89)Miscellaneous: Most Games Rushing for 100 Yards: 21, Byron Hanspard (1994-96) Most Games Rushing for 200 Yards: 6, Byron Hanspard (1994-96)
CAREER YARDAGE LEADERS 1. Byron Hanspard (1994-96) ...............................................4,219 2. James Gray (1986-89) .....................................................4,066 3. Ricky Williams (1997-01) .................................................3,661 4. Byron Morris (1991-93) ...................................................3,544 5. Taurean Henderson (2002-05)..........................................3,241 6. James Hadnot (1976-79) .................................................2,794 7. Larry Isaac (1973-76) ......................................................2,633 8. Donny Anderson (1963-65) ..............................................2,280 9. Shannon Woods (2005-08) ...............................................2,249 10. Doug McCutchen (1970-72) .............................................2,222
CAREER ATTEMPT LEADERS 1. Ricky Williams (1997-01) ....................................................789 2. Byron Hanspard (1994-96) ..................................................760 3. James Gray (1986-89) ........................................................742 4. Byron Morris (1991-93) ......................................................638 5. Taurean Henderson (2002-05).............................................577 6. Larry Isaac (1973-76) .........................................................538 7. James Hadnot (1976-78) ....................................................532 8. Donny Anderson (1963-65) .................................................526 9. Doug McCutchen (1970-72) ................................................496 10. Anthony Lynn (1988-91) .....................................................492
CAREER TOUCHDOWN LEADERS 1. James Gray (1986-89) ..........................................................52 2. Taurean Henderson (2002-05)...............................................50 3. Byron Morris (1991-93) ........................................................37 4. Ricky Williams (1997-01) ......................................................36 5. Shannon Woods (2005-08) ....................................................33 6. Bobby Cavazos (1951-53) .....................................................32 7. Larry Isaac (1973-76) ...........................................................31 8. Billy Taylor (1974-77) ...........................................................29 Byron Hanspard (1994-96) ....................................................29 Zebbie Lethridge (1994-97) ...................................................29
TOP RUSHING GAMES
Total 100-Yard Performances: 189Total 200-Yard Performances: 26
1. Byron Hanspard vs. Baylor (1996) .......................................287 2. James Gray vs. Duke (1989) ...............................................280 3. Byron Hanspard vs. Oklahoma State (1996) ........................272 4. James Hadnot vs. New Mexico (1978) ................................268 5. Byron Hanspard vs. Air Force (1995) ...................................260 6. Ricky Williams vs. UTEP (1998) ..........................................251 7. Byron Hanspard vs. SW Louisiana (1996) ............................247 8. Ricky Williams vs. Fresno State (1998) ...............................244 9. James Gray vs. Arizona (1989) ...........................................234 10. James Gray vs. SMU (1989) ...............................................232 11. Shaud Williams vs. Colorado (1999) ....................................230 12. Byron Hanspard vs. Houston (1995) ....................................228 13. James Gray vs. Rice (1989) ................................................227 14. Byron Hanspard vs. Utah State (1996) ................................224 15. Byron Morris vs. Houston (1993) ........................................223 Byron Morris vs. TCU (1993) ..............................................223 17. Byron Morris vs. SMU (1993) .............................................222 Byron Morris vs. Houston (1992) ........................................222 19. Byron Hanspard vs. Georgia (1996) .....................................214 20. James Hadnot vs. Baylor (1978) .........................................212 21. James Gray vs. TCU (1989) ................................................209 22. Walter Schlinkman vs. Creighton (1942)..............................206 Anthony Hutchison vs. SMU (1982) ....................................206 24. James Hadnot vs. Rice (1979) ............................................204 Cliff Hoskins vs. Baylor (1972) ...........................................204 Doug McCutchen vs. TCU (1970) ........................................204 27. Byron Morris vs. TCU (1992) ..............................................199 James Hadnot vs. Houston (1979) ......................................199 29. Byron Hanspard vs. Texas A&M (1996) ..............................198 30. Byron Hanspard vs. Kansas (1996) .....................................194 31. James Gray vs. Rice (1988) ................................................181 32. Byron Hanspard vs. SMU (1995) .........................................180 Byron Hanspard vs. Arkansas State (1995) .........................180 34. Ricky Williams vs. Kansas (1997) ........................................179 35. Anthony Hutchison vs. New Mexico (1981) .........................178 36. Byron Morris vs. SMU (1992) .............................................175 Anthony Hutchison vs. TCU (1982) .....................................175 38. Byron Morris vs. Baylor (1993) ...........................................174 39. James Gray vs. TCU (1987) ................................................173 James Gray vs. Rice (1987) ................................................173 Billy Taylor vs. Arizona (1976) ............................................173 Joe Barnes vs. SMU (1973) ................................................173 43. George Smith vs. North Carolina (1972) ..............................172 44. Ricky Williams vs. North Texas (1998) ................................170 Sammy Morris vs. Texas A&M (1999) ................................170 46. Donny Anderson vs. TCU (1969) .........................................169 Taurean Henderson at Kansas (2004) .................................169 48. Robert Lewis vs. Arkansas (1983) ......................................167 49. James Hadnot vs. SMU (1978) ...........................................166 50. Ricky Williams vs. Baylor (1998) .........................................159 51. Byron Morris vs. Texas (1993) ............................................158 George Smith vs. New Mexico (1972) .................................158 53. Byron Morris vs. Baylor (1992) ...........................................157 James Gray vs. North Texas (1988) ....................................157 Donny Anderson vs. New Mexico St. (1965) .......................157 56. Doug McCutchen vs. Baylor (1970) .....................................155 57. James Hadnot vs. New Mexico (1979) ................................153 George Smith vs. Utah (1972) .............................................153 Ricky Williams vs. Baylor (2001) .........................................153 60. Shaud Williams vs. North Texas (1999) ...............................151 James Gray vs. Lamar (1987) .............................................151 Billy Taylor vs. TCU (1977) .................................................151 63. James Gray vs. Colorado State (1987) ................................150 Billy Taylor vs. North Carolina (1977) .................................150
RUSHING RECORDS
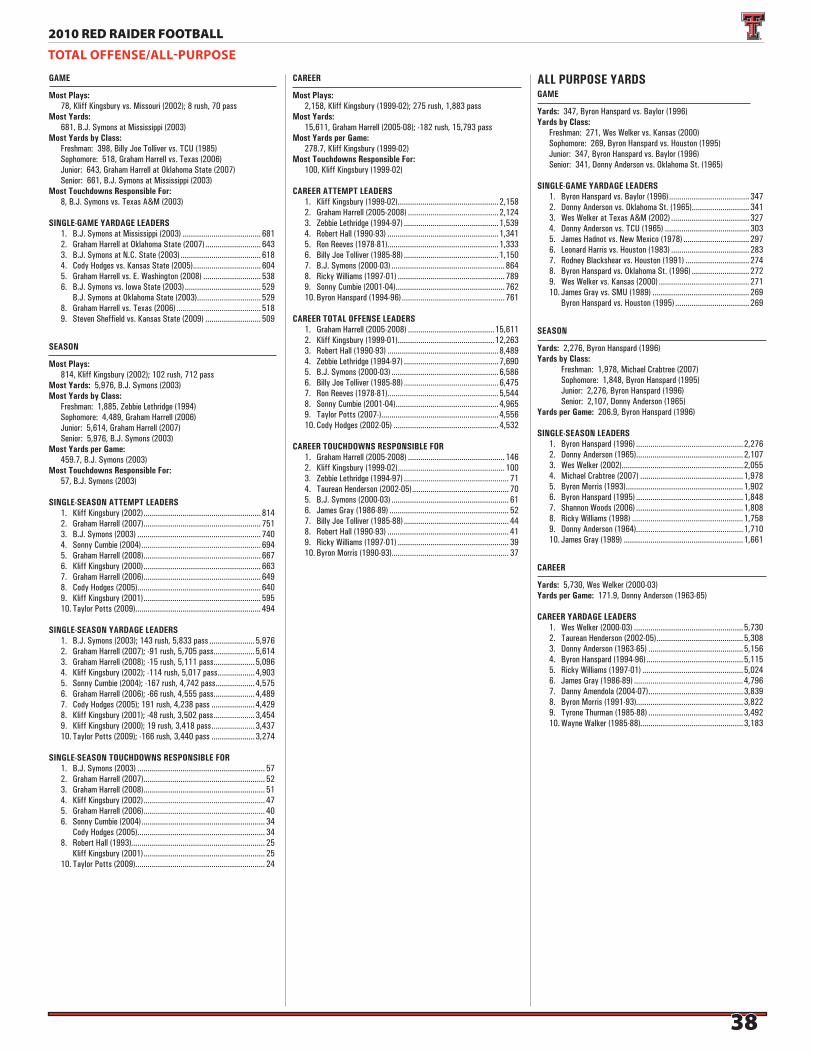
3838
2010 RED RAIDER FOOTBALL
GAME
Most Plays: 78, Kliff Kingsbury vs. Missouri (2002); 8 rush, 70 passMost Yards: 681, B.J. Symons at Mississippi (2003)Most Yards by Class: Freshman: 398, Billy Joe Tolliver vs. TCU (1985) Sophomore: 518, Graham Harrell vs. Texas (2006) Junior: 643, Graham Harrell at Oklahoma State (2007) Senior: 661, B.J. Symons at Mississippi (2003)Most Touchdowns Responsible For: 8, B.J. Symons vs. Texas A&M (2003)
SINGLE-GAME YARDAGE LEADERS 1. B.J. Symons at Mississippi (2003) ...................................... 681 2. Graham Harrell at Oklahoma State (2007) ........................... 643 3. B.J. Symons at N.C. State (2003) ....................................... 618 4. Cody Hodges vs. Kansas State (2005) ................................. 604 5. Graham Harrell vs. E. Washington (2008) ............................ 538 6. B.J. Symons vs. Iowa State (2003) ..................................... 529 B.J. Symons at Oklahoma State (2003) ............................... 529 8. Graham Harrell vs. Texas (2006) ......................................... 518 9. Steven Sheffield vs. Kansas State (2009) ........................... 509
SEASON
Most Plays: 814, Kliff Kingsbury (2002); 102 rush, 712 passMost Yards: 5,976, B.J. Symons (2003)Most Yards by Class: Freshman: 1,885, Zebbie Lethridge (1994) Sophomore: 4,489, Graham Harrell (2006) Junior: 5,614, Graham Harrell (2007) Senior: 5,976, B.J. Symons (2003)Most Yards per Game: 459.7, B.J. Symons (2003)Most Touchdowns Responsible For: 57, B.J. Symons (2003)
SINGLE-SEASON ATTEMPT LEADERS 1. Kliff Kingsbury (2002) ......................................................... 814 2. Graham Harrell (2007) ......................................................... 751 3. B.J. Symons (2003) ............................................................ 740 4. Sonny Cumbie (2004) .......................................................... 694 5. Graham Harrell (2008) ......................................................... 667 6. Kliff Kingsbury (2000) ......................................................... 663 7. Graham Harrell (2006) ......................................................... 649 8. Cody Hodges (2005) ............................................................ 640 9. Kliff Kingsbury (2001) ......................................................... 595 10. Taylor Potts (2009) ............................................................. 494
SINGLE-SEASON YARDAGE LEADERS 1. B.J. Symons (2003); 143 rush, 5,833 pass ......................5,976 2. Graham Harrell (2007); -91 rush, 5,705 pass ....................5,614 3. Graham Harrell (2008); -15 rush, 5,111 pass ....................5,096 4. Kliff Kingsbury (2002); -114 rush, 5,017 pass ..................4,903 5. Sonny Cumbie (2004); -167 rush, 4,742 pass ...................4,575 6. Graham Harrell (2006); -66 rush, 4,555 pass ....................4,489 7. Cody Hodges (2005); 191 rush, 4,238 pass .....................4,429 8. Kliff Kingsbury (2001); -48 rush, 3,502 pass ....................3,454 9. Kliff Kingsbury (2000); 19 rush, 3,418 pass .....................3,437 10. Taylor Potts (2009); -166 rush, 3,440 pass .....................3,274
SINGLE-SEASON TOUCHDOWNS RESPONSIBLE FOR 1. B.J. Symons (2003) .............................................................. 57 2. Graham Harrell (2007) ........................................................... 52 3. Graham Harrell (2008) ........................................................... 51 4. Kliff Kingsbury (2002) ........................................................... 47 5. Graham Harrell (2006) ........................................................... 40 6. Sonny Cumbie (2004) ............................................................ 34 Cody Hodges (2005) .............................................................. 34 8. Robert Hall (1993)................................................................. 25 Kliff Kingsbury (2001) ........................................................... 25 10. Taylor Potts (2009) ............................................................... 24
CAREER
Most Plays: 2,158, Kliff Kingsbury (1999-02); 275 rush, 1,883 passMost Yards: 15,611, Graham Harrell (2005-08); -182 rush, 15,793 passMost Yards per Game: 278.7, Kliff Kingsbury (1999-02)Most Touchdowns Responsible For: 100, Kliff Kingsbury (1999-02)
CAREER ATTEMPT LEADERS 1. Kliff Kingsbury (1999-02) .................................................2,158 2. Graham Harrell (2005-2008) ............................................2,124 3. Zebbie Lethridge (1994-97) ..............................................1,539 4. Robert Hall (1990-93) ......................................................1,341 5. Ron Reeves (1978-81) ......................................................1,333 6. Billy Joe Tolliver (1985-88) ..............................................1,150 7. B.J. Symons (2000-03) ....................................................... 864 8. Ricky Williams (1997-01) .................................................... 789 9. Sonny Cumbie (2001-04) ..................................................... 762 10. Byron Hanspard (1994-96) .................................................. 761
CAREER TOTAL OFFENSE LEADERS 1. Graham Harrell (2005-2008) ..........................................15,611 2. Kliff Kingsbury (1999-01) ...............................................12,263 3. Robert Hall (1990-93) ......................................................8,489 4. Zebbie Lethridge (1994-97) ..............................................7,690 5. B.J. Symons (2000-03) ....................................................6,586 6. Billy Joe Tolliver (1985-88) ..............................................6,475 7. Ron Reeves (1978-81) ......................................................5,544 8. Sonny Cumbie (2001-04) ..................................................4,965 9. Taylor Potts (2007-) .........................................................4,556 10. Cody Hodges (2002-05) ...................................................4,532 CAREER TOUCHDOWNS RESPONSIBLE FOR 1. Graham Harrell (2005-2008) ............................................... 146 2. Kliff Kingsbury (1999-02) .................................................... 100 3. Zebbie Lethridge (1994-97) ................................................... 71 4. Taurean Henderson (2002-05) ............................................... 70 5. B.J. Symons (2000-03) ......................................................... 61 6. James Gray (1986-89) .......................................................... 52 7. Billy Joe Tolliver (1985-88) ................................................... 44 8. Robert Hall (1990-93) ........................................................... 41 9. Ricky Williams (1997-01) ...................................................... 39 10. Byron Morris (1990-93)......................................................... 37
ALL PURPOSE YARDSGAME
Yards: 347, Byron Hanspard vs. Baylor (1996)Yards by Class: Freshman: 271, Wes Welker vs. Kansas (2000) Sophomore: 269, Byron Hanspard vs. Houston (1995) Junior: 347, Byron Hanspard vs. Baylor (1996) Senior: 341, Donny Anderson vs. Oklahoma St. (1965)
SINGLE-GAME YARDAGE LEADERS 1. Byron Hanspard vs. Baylor (1996) ....................................... 347 2. Donny Anderson vs. Oklahoma St. (1965) ............................ 341 3. Wes Welker at Texas A&M (2002) ...................................... 327 4. Donny Anderson vs. TCU (1965) ......................................... 303 5. James Hadnot vs. New Mexico (1978) ................................ 297 6. Leonard Harris vs. Houston (1983) ...................................... 283 7. Rodney Blackshear vs. Houston (1991) ............................... 274 8. Byron Hanspard vs. Oklahoma St. (1996) ............................ 272 9. Wes Welker vs. Kansas (2000) ............................................ 271 10. James Gray vs. SMU (1989) ............................................... 269 Byron Hanspard vs. Houston (1995) .................................... 269
SEASON
Yards: 2,276, Byron Hanspard (1996)Yards by Class: Freshman: 1,978, Michael Crabtree (2007) Sophomore: 1,848, Byron Hanspard (1995) Junior: 2,276, Byron Hanspard (1996) Senior: 2,107, Donny Anderson (1965)Yards per Game: 206.9, Byron Hanspard (1996)
SINGLE-SEASON LEADERS 1. Byron Hanspard (1996) ....................................................2,276 2. Donny Anderson (1965) ....................................................2,107 3. Wes Welker (2002) ...........................................................2,055 4. Michael Crabtree (2007) ..................................................1,978 5. Byron Morris (1993) .........................................................1,902 6. Byron Hanspard (1995) ....................................................1,848 7. Shannon Woods (2006) ....................................................1,808 8. Ricky Williams (1998) ......................................................1,758 9. Donny Anderson (1964) ....................................................1,710 10. James Gray (1989) ..........................................................1,661
CAREER
Yards: 5,730, Wes Welker (2000-03)Yards per Game: 171.9, Donny Anderson (1963-65)
CAREER YARDAGE LEADERS 1. Wes Welker (2000-03) .....................................................5,730 2. Taurean Henderson (2002-05) ..........................................5,308 3. Donny Anderson (1963-65) ..............................................5,156 4. Byron Hanspard (1994-96) ...............................................5,115 5. Ricky Williams (1997-01) .................................................5,024 6. James Gray (1986-89) .....................................................4,796 7. Danny Amendola (2004-07) ..............................................3,839 8. Byron Morris (1991-93)....................................................3,822 9. Tyrone Thurman (1985-88) ..............................................3,492 10. Wayne Walker (1985-88)..................................................3,183
TOTAL OFFENSE/ALL-PURPOSE
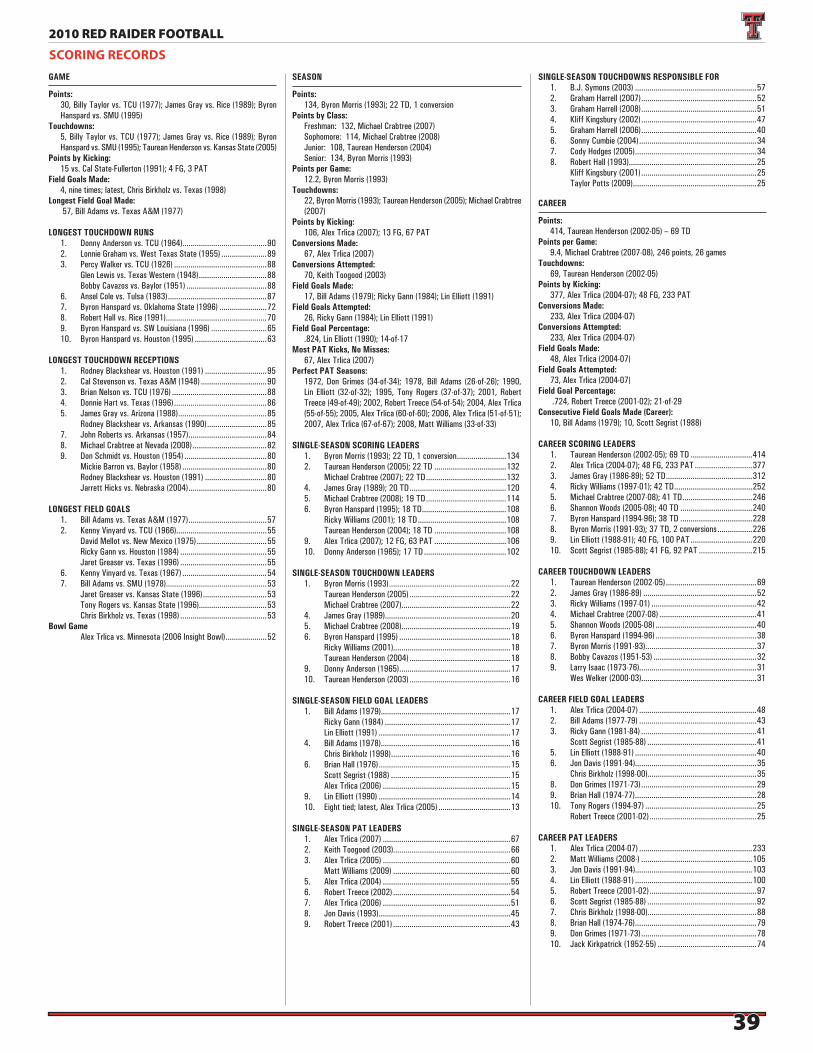
3939
2010 RED RAIDER FOOTBALL
GAME
Points: 30, Billy Taylor vs. TCU (1977); James Gray vs. Rice (1989); Byron
Hanspard vs. SMU (1995)Touchdowns: 5, Billy Taylor vs. TCU (1977); James Gray vs. Rice (1989); Byron
Hanspard vs. SMU (1995); Taurean Henderson vs. Kansas State (2005)Points by Kicking: 15 vs. Cal State-Fullerton (1991); 4 FG, 3 PATField Goals Made: 4, nine times; latest, Chris Birkholz vs. Texas (1998)Longest Field Goal Made: 57, Bill Adams vs. Texas A&M (1977)
LONGEST TOUCHDOWN RUNS 1. Donny Anderson vs. TCU (1964).........................................90 2. Lonnie Graham vs. West Texas State (1955) ......................89 3. Percy Walker vs. TCU (1926) .............................................88 Glen Lewis vs. Texas Western (1948) .................................88 Bobby Cavazos vs. Baylor (1951) .......................................88 6. Ansel Cole vs. Tulsa (1983) ................................................87 7. Byron Hanspard vs. Oklahoma State (1996) .......................72 8. Robert Hall vs. Rice (1991) .................................................70 9. Byron Hanspard vs. SW Louisiana (1996) ...........................65 10. Byron Hanspard vs. Houston (1995) ...................................63
LONGEST TOUCHDOWN RECEPTIONS 1. Rodney Blackshear vs. Houston (1991) ..............................95 2. Cal Stevenson vs. Texas A&M (1948) ................................90 3. Brian Nelson vs. TCU (1976) ..............................................88 4. Donnie Hart vs. Texas (1996) .............................................86 5. James Gray vs. Arizona (1988) ...........................................85 Rodney Blackshear vs. Arkansas (1990) .............................85 7. John Roberts vs. Arkansas (1957) ......................................84 8. Michael Crabtree at Nevada (2008) ....................................82 9. Don Schmidt vs. Houston (1954) ........................................80 Mickie Barron vs. Baylor (1958) .........................................80 Rodney Blackshear vs. Houston (1991) ..............................80 Jarrett Hicks vs. Nebraska (2004) ......................................80
LONGEST FIELD GOALS 1. Bill Adams vs. Texas A&M (1977) ......................................57 2. Kenny Vinyard vs. TCU (1966)............................................55 David Mellot vs. New Mexico (1975) ..................................55 Ricky Gann vs. Houston (1984) ..........................................55 Jaret Greaser vs. Texas (1996) ..........................................55 6. Kenny Vinyard vs. Texas (1967) .........................................54 7. Bill Adams vs. SMU (1978).................................................53 Jaret Greaser vs. Kansas State (1996) ...............................53 Tony Rogers vs. Kansas State (1996).................................53 Chris Birkholz vs. Texas (1998) ..........................................53Bowl Game Alex Trlica vs. Minnesota (2006 Insight Bowl) ....................52
SEASON
Points: 134, Byron Morris (1993); 22 TD, 1 conversionPoints by Class: Freshman: 132, Michael Crabtree (2007) Sophomore: 114, Michael Crabtree (2008) Junior: 108, Taurean Henderson (2004) Senior: 134, Byron Morris (1993)Points per Game: 12.2, Byron Morris (1993)Touchdowns: 22, Byron Morris (1993); Taurean Henderson (2005); Michael Crabtree
(2007)Points by Kicking: 106, Alex Trlica (2007); 13 FG, 67 PATConversions Made: 67, Alex Trlica (2007)Conversions Attempted: 70, Keith Toogood (2003)Field Goals Made: 17, Bill Adams (1979); Ricky Gann (1984); Lin Elliott (1991)Field Goals Attempted: 26, Ricky Gann (1984); Lin Elliott (1991)Field Goal Percentage: .824, Lin Elliott (1990); 14-of-17Most PAT Kicks, No Misses: 67, Alex Trlica (2007)Perfect PAT Seasons: 1972, Don Grimes (34-of-34); 1978, Bill Adams (26-of-26); 1990,
Lin Elliott (32-of-32); 1995, Tony Rogers (37-of-37); 2001, Robert Treece (49-of-49); 2002, Robert Treece (54-of-54); 2004, Alex Trlica (55-of-55); 2005, Alex Trlica (60-of-60); 2006, Alex Trlica (51-of-51); 2007, Alex Trlica (67-of-67); 2008, Matt Williams (33-of-33)
SINGLE-SEASON SCORING LEADERS 1. Byron Morris (1993); 22 TD, 1 conversion ........................134 2. Taurean Henderson (2005); 22 TD ...................................132 Michael Crabtree (2007); 22 TD .......................................132 4. James Gray (1989); 20 TD ...............................................120 5. Michael Crabtree (2008); 19 TD .......................................114 6. Byron Hanspard (1995); 18 TD .........................................108 Ricky Williams (2001); 18 TD ...........................................108 Taurean Henderson (2004); 18 TD ...................................108 9. Alex Trlica (2007); 12 FG, 63 PAT ...................................106 10. Donny Anderson (1965); 17 TD ........................................102
SINGLE-SEASON TOUCHDOWN LEADERS 1. Byron Morris (1993) ...........................................................22 Taurean Henderson (2005) .................................................22 Michael Crabtree (2007).....................................................22 4. James Gray (1989).............................................................20 5. Michael Crabtree (2008).....................................................19 6. Byron Hanspard (1995) ......................................................18 Ricky Williams (2001).........................................................18 Taurean Henderson (2004) .................................................18 9. Donny Anderson (1965) ......................................................17 10. Taurean Henderson (2003) .................................................16
SINGLE-SEASON FIELD GOAL LEADERS 1. Bill Adams (1979)...............................................................17 Ricky Gann (1984) .............................................................17 Lin Elliott (1991) ................................................................17 4. Bill Adams (1978)...............................................................16 Chris Birkholz (1998) ..........................................................16 6. Brian Hall (1976) ................................................................15 Scott Segrist (1988) ..........................................................15 Alex Trlica (2006) ..............................................................15 9. Lin Elliott (1990) ................................................................14 10. Eight tied; latest, Alex Trlica (2005) ...................................13
SINGLE-SEASON PAT LEADERS 1. Alex Trlica (2007) ..............................................................67 2. Keith Toogood (2003).........................................................66 3. Alex Trlica (2005) ..............................................................60 Matt Williams (2009) .........................................................60 5. Alex Trlica (2004) ..............................................................55 6. Robert Treece (2002) .........................................................54 7. Alex Trlica (2006) ..............................................................51 8. Jon Davis (1993) ................................................................45 9. Robert Treece (2001) .........................................................43
SINGLE-SEASON TOUCHDOWNS RESPONSIBLE FOR 1. B.J. Symons (2003) ...........................................................57 2. Graham Harrell (2007) ........................................................52 3. Graham Harrell (2008) ........................................................51 4. Kliff Kingsbury (2002) ........................................................47 5. Graham Harrell (2006) ........................................................40 6. Sonny Cumbie (2004) .........................................................34 7. Cody Hodges (2005) ...........................................................34 8. Robert Hall (1993) ..............................................................25 Kliff Kingsbury (2001) ........................................................25 Taylor Potts (2009) ............................................................25
CAREER
Points: 414, Taurean Henderson (2002-05) – 69 TDPoints per Game: 9.4, Michael Crabtree (2007-08), 246 points, 26 gamesTouchdowns: 69, Taurean Henderson (2002-05)Points by Kicking: 377, Alex Trlica (2004-07); 48 FG, 233 PATConversions Made: 233, Alex Trlica (2004-07)Conversions Attempted: 233, Alex Trlica (2004-07)Field Goals Made: 48, Alex Trlica (2004-07)Field Goals Attempted: 73, Alex Trlica (2004-07)Field Goal Percentage: .724, Robert Treece (2001-02); 21-of-29Consecutive Field Goals Made (Career): 10, Bill Adams (1979); 10, Scott Segrist (1988)
CAREER SCORING LEADERS 1. Taurean Henderson (2002-05); 69 TD ..............................414 2. Alex Trlica (2004-07); 48 FG, 233 PAT ............................377 3. James Gray (1986-89); 52 TD ..........................................312 4. Ricky Williams (1997-01); 42 TD ......................................252 5. Michael Crabtree (2007-08); 41 TD ..................................246 6. Shannon Woods (2005-08); 40 TD ...................................240 7. Byron Hanspard (1994-96); 38 TD ...................................228 8. Byron Morris (1991-93); 37 TD, 2 conversions .................226 9. Lin Elliott (1988-91); 40 FG, 100 PAT ..............................220 10. Scott Segrist (1985-88); 41 FG, 92 PAT ..........................215
CAREER TOUCHDOWN LEADERS 1. Taurean Henderson (2002-05) ............................................69 2. James Gray (1986-89) .......................................................52 3. Ricky Williams (1997-01) ...................................................42 4. Michael Crabtree (2007-08) ...............................................41 5. Shannon Woods (2005-08) .................................................40 6. Byron Hanspard (1994-96) .................................................38 7. Byron Morris (1991-93) ......................................................37 8. Bobby Cavazos (1951-53) ..................................................32 9. Larry Isaac (1973-76).........................................................31 Wes Welker (2000-03)........................................................31
CAREER FIELD GOAL LEADERS 1. Alex Trlica (2004-07) .........................................................48 2. Bill Adams (1977-79) .........................................................43 3. Ricky Gann (1981-84) ........................................................41 Scott Segrist (1985-88) .....................................................41 5. Lin Elliott (1988-91) ...........................................................40 6. Jon Davis (1991-94)...........................................................35 Chris Birkholz (1998-00).....................................................35 8. Don Grimes (1971-73) ........................................................29 9. Brian Hall (1974-77) ...........................................................28 10. Tony Rogers (1994-97) ......................................................25 Robert Treece (2001-02) ....................................................25
CAREER PAT LEADERS 1. Alex Trlica (2004-07) .......................................................233 2. Matt Williams (2008-) ......................................................105 3. Jon Davis (1991-94).........................................................103 4. Lin Elliott (1988-91) .........................................................100 5. Robert Treece (2001-02) ....................................................97 6. Scott Segrist (1985-88) .....................................................92 7. Chris Birkholz (1998-00).....................................................88 8. Brian Hall (1974-76) ...........................................................79 9. Don Grimes (1971-73) ........................................................78 10. Jack Kirkpatrick (1952-55) ................................................74
SCORING RECORDS
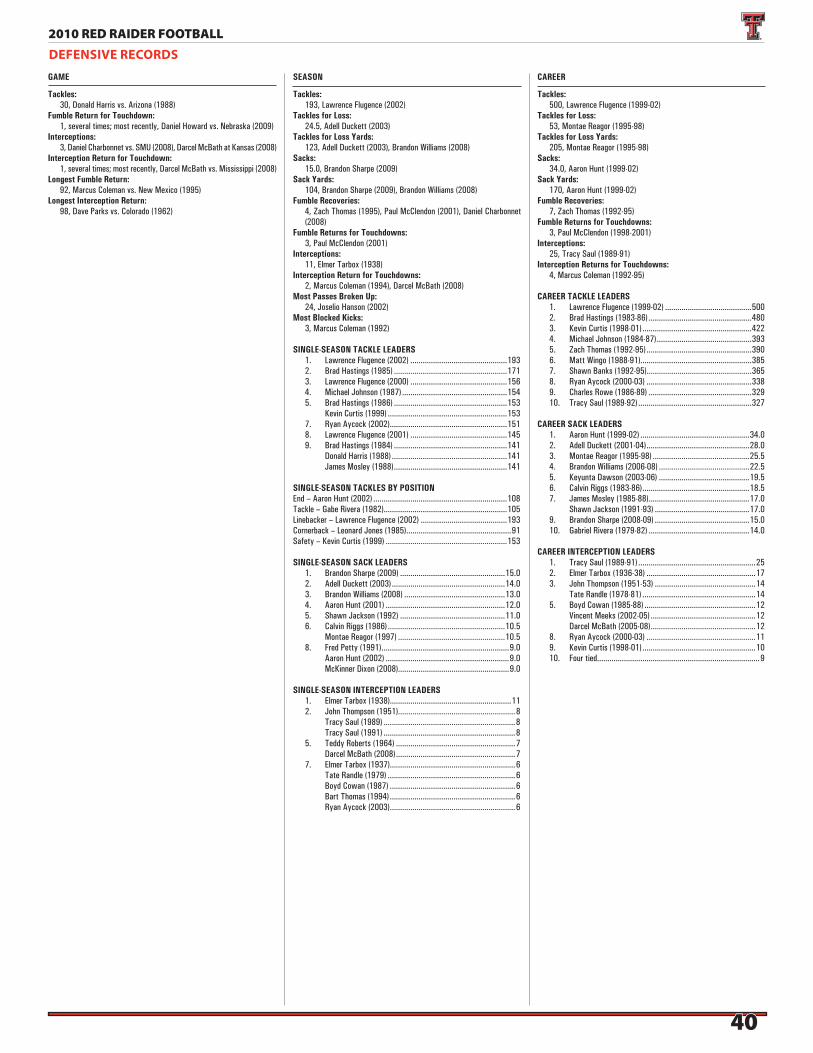
4040
2010 RED RAIDER FOOTBALL
GAME
Tackles: 30, Donald Harris vs. Arizona (1988)Fumble Return for Touchdown: 1, several times; most recently, Daniel Howard vs. Nebraska (2009)Interceptions: 3, Daniel Charbonnet vs. SMU (2008), Darcel McBath at Kansas (2008)Interception Return for Touchdown: 1, several times; most recently, Darcel McBath vs. Mississippi (2008)Longest Fumble Return: 92, Marcus Coleman vs. New Mexico (1995)Longest Interception Return: 98, Dave Parks vs. Colorado (1962)
SEASON
Tackles: 193, Lawrence Flugence (2002)Tackles for Loss: 24.5, Adell Duckett (2003)Tackles for Loss Yards: 123, Adell Duckett (2003), Brandon Williams (2008)Sacks: 15.0, Brandon Sharpe (2009)Sack Yards: 104, Brandon Sharpe (2009), Brandon Williams (2008)Fumble Recoveries: 4, Zach Thomas (1995), Paul McClendon (2001), Daniel Charbonnet
(2008)Fumble Returns for Touchdowns: 3, Paul McClendon (2001)Interceptions: 11, Elmer Tarbox (1938)Interception Return for Touchdowns: 2, Marcus Coleman (1994), Darcel McBath (2008)Most Passes Broken Up: 24, Joselio Hanson (2002)Most Blocked Kicks: 3, Marcus Coleman (1992)
SINGLE-SEASON TACKLE LEADERS 1. Lawrence Flugence (2002) ...............................................193 2. Brad Hastings (1985) .......................................................171 3. Lawrence Flugence (2000) ...............................................156 4. Michael Johnson (1987) ...................................................154 5. Brad Hastings (1986) .......................................................153 Kevin Curtis (1999) ..........................................................153 7. Ryan Aycock (2002) .........................................................151 8. Lawrence Flugence (2001) ...............................................145 9. Brad Hastings (1984) .......................................................141 Donald Harris (1988) ........................................................141 James Mosley (1988) .......................................................141
SINGLE-SEASON TACKLES BY POSITIONEnd – Aaron Hunt (2002) .................................................................108Tackle – Gabe Rivera (1982)............................................................105Linebacker – Lawrence Flugence (2002) ..........................................193Cornerback – Leonard Jones (1985) ...................................................91Safety – Kevin Curtis (1999) ...........................................................153
SINGLE-SEASON SACK LEADERS 1. Brandon Sharpe (2009) ...................................................15.0 2. Adell Duckett (2003) .......................................................14.0 3. Brandon Williams (2008) .................................................13.0 4. Aaron Hunt (2001) ..........................................................12.0 5. Shawn Jackson (1992) ...................................................11.0 6. Calvin Riggs (1986) .........................................................10.5 Montae Reagor (1997) ....................................................10.5 8. Fred Petty (1991) ..............................................................9.0 Aaron Hunt (2002) ............................................................9.0 McKinner Dixon (2008)......................................................9.0
SINGLE-SEASON INTERCEPTION LEADERS 1. Elmer Tarbox (1938)...........................................................11 2. John Thompson (1951).........................................................8 Tracy Saul (1989) ................................................................8 Tracy Saul (1991) ................................................................8 5. Teddy Roberts (1964) ..........................................................7 Darcel McBath (2008) ..........................................................7 7. Elmer Tarbox (1937).............................................................6 Tate Randle (1979) ..............................................................6 Boyd Cowan (1987) .............................................................6 Bart Thomas (1994) .............................................................6 Ryan Aycock (2003) .............................................................6
CAREER
Tackles: 500, Lawrence Flugence (1999-02)Tackles for Loss: 53, Montae Reagor (1995-98)Tackles for Loss Yards: 205, Montae Reagor (1995-98)Sacks: 34.0, Aaron Hunt (1999-02)Sack Yards: 170, Aaron Hunt (1999-02)Fumble Recoveries: 7, Zach Thomas (1992-95)Fumble Returns for Touchdowns: 3, Paul McClendon (1998-2001)Interceptions: 25, Tracy Saul (1989-91)Interception Returns for Touchdowns: 4, Marcus Coleman (1992-95)
CAREER TACKLE LEADERS 1. Lawrence Flugence (1999-02) ..........................................500 2. Brad Hastings (1983-86) ..................................................480 3. Kevin Curtis (1998-01) .....................................................422 4. Michael Johnson (1984-87) ..............................................393 5. Zach Thomas (1992-95) ...................................................390 6. Matt Wingo (1988-91)......................................................385 7. Shawn Banks (1992-95)...................................................365 8. Ryan Aycock (2000-03) ...................................................338 9. Charles Rowe (1986-89) ..................................................329 10. Tracy Saul (1989-92) .......................................................327
CAREER SACK LEADERS 1. Aaron Hunt (1999-02) .....................................................34.0 2. Adell Duckett (2001-04) ..................................................28.0 3. Montae Reagor (1995-98) ...............................................25.5 4. Brandon Williams (2006-08) ............................................22.5 5. Keyunta Dawson (2003-06) ............................................19.5 6. Calvin Riggs (1983-86) ....................................................18.5 7. James Mosley (1985-88) .................................................17.0 Shawn Jackson (1991-93) ..............................................17.0 9. Brandon Sharpe (2008-09) ..............................................15.0 10. Gabriel Rivera (1979-82) .................................................14.0
CAREER INTERCEPTION LEADERS 1. Tracy Saul (1989-91) .........................................................25 2. Elmer Tarbox (1936-38) .....................................................17 3. John Thompson (1951-53) .................................................14 Tate Randle (1978-81) .......................................................14 5. Boyd Cowan (1985-88) ......................................................12 Vincent Meeks (2002-05) ...................................................12 Darcel McBath (2005-08) ...................................................12 8. Ryan Aycock (2000-03) .....................................................11 9. Kevin Curtis (1998-01) .......................................................10 10. Four tied...............................................................................9
DEFENSIVE RECORDS

4141
2010 RED RAIDER FOOTBALL
GAME
Returns: 6, Ivory McCann vs. Texas (2001)Yards: 182, Eric Stephens at Texas (2009)Yards by Class: Freshman: 182, Eric Stephens at Texas (2009) Sophomore: 175, Eric Stephens at New Mexico (2010) Junior: 132, Rodney Blackshear vs. Texas A&M (1990) Senior: 169, Donny Anderson vs. Oklahoma State (1965)Yards per Return: 60.0, Johnnie Mack vs. SMU (2003); 2-120 yardsTouchdowns: 1, several times; most recently, Vincent Meeks at Oklahoma (2002);
98 yards100-Yard Returns: 100, Ivory McCann vs. New Mexico (2001), Keith Henderson vs.
Houston (1984), Donny Anderson vs. Oklahoma State (1965), Jack Kirkpatrick vs. Tulsa (1953), Jack Kirkpatrick vs. West Texas State (1953)
LONGEST KICKOFF RETURNS 1. Ivory McCann vs. New Mexico (2001) ..............................100 Keith Henderson vs. Houston (1984).................................100 Donny Anderson vs. Oklahoma St. (1965) .........................100 Jack Kirkpatrick vs. Tulsa (1953) .....................................100 Jack Kirkpatrick vs. West Texas State (1953) ..................100 6. Vincent Meeks at Oklahoma (2002) ....................................98 7. Frank Graves vs. New Mexico (1951) .................................97 8. Herman Bailey vs. Hardin-Simmons (1949) .........................95 Lawrence Williams vs. New Mexico (1973) .........................95 Dane Johnson vs. Texas (1997) ..........................................95
SEASON
Returns: 32, Eric Stephens (2009)Yards: 823, Eric Stephens (2009); 32 returnsYards by Class: Freshman: 823, Eric Stephens (2009) Sophomore: 495, Ivory McCann (2002) Junior: 621, Rodney Blackshear (1990) Senior: 541, Donny Anderson (1965)Yards per Return: 30.8, Lawrence Williams (1972); 16-493 yardsTouchdowns: 2, Jack Kirkpatrick (1953)
SINGLE-SEASON YARDAGE LEADERS 1. Eric Stephens (2009); 32 returns ......................................823 2. Rodney Blackshear (1990); 24 returns .............................621 3. Ivory McCann (2001); 22 returns .....................................606 4. Johnnie Mack (2003); 22 returns .....................................546 5. Donny Anderson (1965); 22 returns ..................................541 6. Tyrone Thurman (1988); 23 returns .................................535 7. Ivory McCann (2002); 27 returns .....................................495 8. Lawrence Williams (1972); 16 returns ..............................493 9. Lawrence Williams (1973); 19 returns ..............................491 10. Jamar Wall (2008); 20 returns .........................................477
SINGLE-SEASON RETURN LEADERS 1. Eric Stephens (2009) ..........................................................32 2. Ivory McCann (2002) .........................................................27 3. Rodney Blackshear (1990)..................................................24 4. Tyrone Thurman (1988)......................................................23 5. Donny Anderson (1965) ......................................................22 Ivory McCann (2001) .........................................................22 Johnnie Mack (2003) .........................................................22 8. Wayne Walker (1986) .........................................................21 Johnnie Mack (2004) .........................................................21
CAREER
Returns: 56, Donny Anderson (1963-65)Yards: 1,309, Donny Anderson (1963-65); 56 returnsYards per Return: 30.3, Ronnie Rice (1957-59); 19-577 yardsTouchdowns: 2, Jack Kirkpatrick (1952-55)
CAREER YARDAGE LEADERS 1. Donny Anderson (1963-65); 56 returns .........................1,309 2. Lawrence Williams (1972-74); 47 returns ......................1,268 3. Eric Stephens (2009-); 37 returns ..................................1,120 4. Ivory McCann (2001-02); 49 returns .............................1,101 5. Wayne Walker (1985-88); 51 returns................................959 6. Johnnie Mack (2003-04); 43 returns ................................955 7. Rodney Blackshear (1987-91); 37 returns ........................899 8. Mike Leinert (1965-67); 40 returns ..................................824 9. John Norman (1997-00); 37 returns .................................790 10. Leonard Harris (1981-83); 34 returns ...............................774
CAREER RETURN LEADERS 1. Donny Anderson (1963-65).................................................56 2. Wayne Walker (1985-88) ....................................................51 3. Ivory McCann (2001-02) ....................................................49 4. Lawrence Williams (1972-74) .............................................47 5. Johnnie Mack (2003-04) ....................................................43 6. Eric Stephens (2009-) .........................................................41 7. Mike Leinert (1965-67).......................................................40 8. Tyrone Thurman (1985-88) ................................................37 Rodney Blackshear (1987-91) ............................................37 John Norman (1997-00) .....................................................37 11. Leonard Harris (1981-83) ...................................................34
KICKOFF RETURN RECORDS
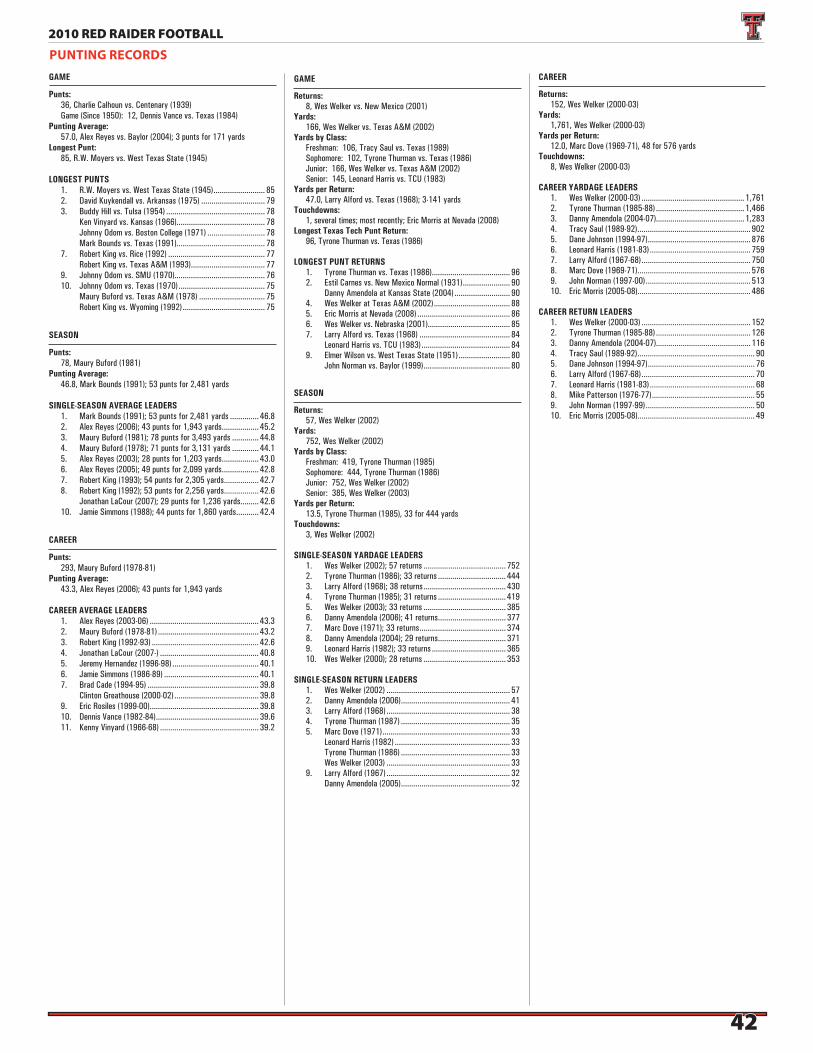
4242
2010 RED RAIDER FOOTBALL
GAME
Punts: 36, Charlie Calhoun vs. Centenary (1939) Game (Since 1950): 12, Dennis Vance vs. Texas (1984)Punting Average: 57.0, Alex Reyes vs. Baylor (2004); 3 punts for 171 yardsLongest Punt: 85, R.W. Moyers vs. West Texas State (1945)
LONGEST PUNTS 1. R.W. Moyers vs. West Texas State (1945) ......................... 85 2. David Kuykendall vs. Arkansas (1975) ............................... 79 3. Buddy Hill vs. Tulsa (1954) ................................................ 78 Ken Vinyard vs. Kansas (1966)........................................... 78 Johnny Odom vs. Boston College (1971) ............................ 78 Mark Bounds vs. Texas (1991)........................................... 78 7. Robert King vs. Rice (1992) ............................................... 77 Robert King vs. Texas A&M (1993) .................................... 77 9. Johnny Odom vs. SMU (1970)............................................ 76 10. Johnny Odom vs. Texas (1970) .......................................... 75 Maury Buford vs. Texas A&M (1978) ................................ 75 Robert King vs. Wyoming (1992) ........................................ 75
SEASON
Punts: 78, Maury Buford (1981)Punting Average: 46.8, Mark Bounds (1991); 53 punts for 2,481 yards
SINGLE-SEASON AVERAGE LEADERS 1. Mark Bounds (1991); 53 punts for 2,481 yards .............. 46.8 2. Alex Reyes (2006); 43 punts for 1,943 yards .................. 45.2 3. Maury Buford (1981); 78 punts for 3,493 yards ............. 44.8 4. Maury Buford (1978); 71 punts for 3,131 yards ............. 44.1 5. Alex Reyes (2003); 28 punts for 1,203 yards .................. 43.0 6. Alex Reyes (2005); 49 punts for 2,099 yards .................. 42.8 7. Robert King (1993); 54 punts for 2,305 yards................. 42.7 8. Robert King (1992); 53 punts for 2,256 yards................. 42.6 Jonathan LaCour (2007); 29 punts for 1,236 yards......... 42.6 10. Jamie Simmons (1988); 44 punts for 1,860 yards ........... 42.4
CAREER
Punts: 293, Maury Buford (1978-81)Punting Average: 43.3, Alex Reyes (2006); 43 punts for 1,943 yards
CAREER AVERAGE LEADERS 1. Alex Reyes (2003-06) ..................................................... 43.3 2. Maury Buford (1978-81) ................................................. 43.2 3. Robert King (1992-93) .................................................... 42.6 4. Jonathan LaCour (2007-) ................................................ 40.8 5. Jeremy Hernandez (1996-98) .......................................... 40.1 6. Jamie Simmons (1986-89) .............................................. 40.1 7. Brad Cade (1994-95) ...................................................... 39.8 Clinton Greathouse (2000-02) ......................................... 39.8 9. Eric Rosiles (1999-00) ..................................................... 39.8 10. Dennis Vance (1982-84) .................................................. 39.6 11. Kenny Vinyard (1966-68) ................................................ 39.2
GAME
Returns: 8, Wes Welker vs. New Mexico (2001)Yards: 166, Wes Welker vs. Texas A&M (2002)Yards by Class: Freshman: 106, Tracy Saul vs. Texas (1989) Sophomore: 102, Tyrone Thurman vs. Texas (1986) Junior: 166, Wes Welker vs. Texas A&M (2002) Senior: 145, Leonard Harris vs. TCU (1983)Yards per Return: 47.0, Larry Alford vs. Texas (1968); 3-141 yardsTouchdowns: 1, several times; most recently; Eric Morris at Nevada (2008)Longest Texas Tech Punt Return: 96, Tyrone Thurman vs. Texas (1986)
LONGEST PUNT RETURNS 1. Tyrone Thurman vs. Texas (1986) ...................................... 96 2. Estil Carnes vs. New Mexico Normal (1931) ....................... 90 Danny Amendola at Kansas State (2004) ........................... 90 4. Wes Welker at Texas A&M (2002) ..................................... 88 5. Eric Morris at Nevada (2008) ............................................. 86 6. Wes Welker vs. Nebraska (2001)........................................ 85 7. Larry Alford vs. Texas (1968) ............................................ 84 Leonard Harris vs. TCU (1983) ........................................... 84 9. Elmer Wilson vs. West Texas State (1951) ......................... 80 John Norman vs. Baylor (1999) .......................................... 80
SEASON
Returns: 57, Wes Welker (2002)Yards: 752, Wes Welker (2002)Yards by Class: Freshman: 419, Tyrone Thurman (1985) Sophomore: 444, Tyrone Thurman (1986) Junior: 752, Wes Welker (2002) Senior: 385, Wes Welker (2003)Yards per Return: 13.5, Tyrone Thurman (1985), 33 for 444 yardsTouchdowns: 3, Wes Welker (2002)
SINGLE-SEASON YARDAGE LEADERS 1. Wes Welker (2002); 57 returns ........................................ 752 2. Tyrone Thurman (1986); 33 returns ................................. 444 3. Larry Alford (1968); 38 returns ........................................ 430 4. Tyrone Thurman (1985); 31 returns ................................. 419 5. Wes Welker (2003); 33 returns ........................................ 385 6. Danny Amendola (2006); 41 returns ................................. 377 7. Marc Dove (1971); 33 returns .......................................... 374 8. Danny Amendola (2004); 29 returns ................................. 371 9. Leonard Harris (1982); 33 returns .................................... 365 10. Wes Welker (2000); 28 returns ........................................ 353
SINGLE-SEASON RETURN LEADERS 1. Wes Welker (2002) ............................................................ 57 2. Danny Amendola (2006) ..................................................... 41 3. Larry Alford (1968) ............................................................ 38 4. Tyrone Thurman (1987) ..................................................... 35 5. Marc Dove (1971) .............................................................. 33 Leonard Harris (1982) ........................................................ 33 Tyrone Thurman (1986) ..................................................... 33 Wes Welker (2003) ............................................................ 33 9. Larry Alford (1967) ............................................................ 32 Danny Amendola (2005) ..................................................... 32
CAREER
Returns: 152, Wes Welker (2000-03)Yards: 1,761, Wes Welker (2000-03)Yards per Return: 12.0, Marc Dove (1969-71), 48 for 576 yardsTouchdowns: 8, Wes Welker (2000-03)
CAREER YARDAGE LEADERS 1. Wes Welker (2000-03) ..................................................1,761 2. Tyrone Thurman (1985-88) ...........................................1,466 3. Danny Amendola (2004-07)...........................................1,283 4. Tracy Saul (1989-92) ....................................................... 902 5. Dane Johnson (1994-97) .................................................. 876 6. Leonard Harris (1981-83) ................................................. 759 7. Larry Alford (1967-68) ..................................................... 750 8. Marc Dove (1969-71) ....................................................... 576 9. John Norman (1997-00) ................................................... 513 10. Eric Morris (2005-08)....................................................... 486
CAREER RETURN LEADERS 1. Wes Welker (2000-03) ..................................................... 152 2. Tyrone Thurman (1985-88) .............................................. 126 3. Danny Amendola (2004-07).............................................. 116 4. Tracy Saul (1989-92) ......................................................... 90 5. Dane Johnson (1994-97) .................................................... 76 6. Larry Alford (1967-68) ....................................................... 70 7. Leonard Harris (1981-83) ................................................... 68 8. Mike Patterson (1976-77) .................................................. 55 9. John Norman (1997-99) ..................................................... 50 10. Eric Morris (2005-08)......................................................... 49
PUNTING RECORDS
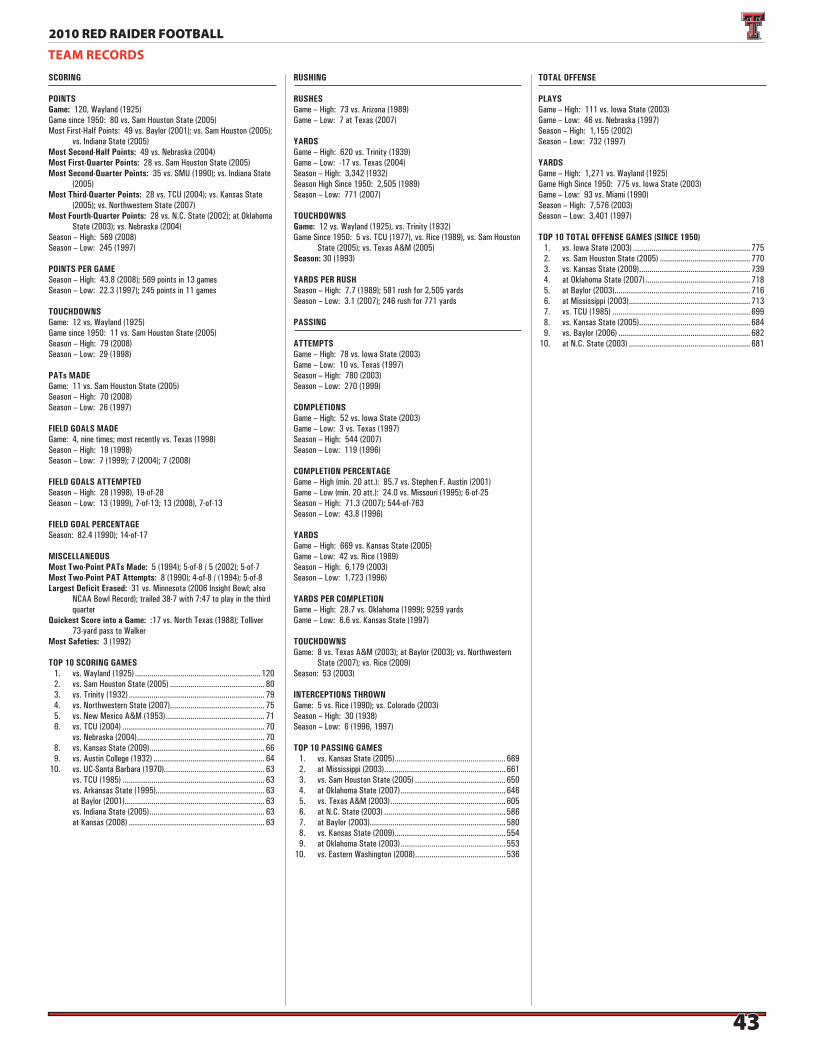
4343
2010 RED RAIDER FOOTBALL
SCORING
POINTSGame: 120, Wayland (1925) Game since 1950: 80 vs. Sam Houston State (2005) Most First-Half Points: 49 vs. Baylor (2001); vs. Sam Houston (2005);
vs. Indiana State (2005)Most Second-Half Points: 49 vs. Nebraska (2004)Most First-Quarter Points: 28 vs. Sam Houston State (2005)Most Second-Quarter Points: 35 vs. SMU (1990); vs. Indiana State
(2005)Most Third-Quarter Points: 28 vs. TCU (2004); vs. Kansas State
(2005); vs. Northwestern State (2007)Most Fourth-Quarter Points: 28 vs. N.C. State (2002); at Oklahoma
State (2003); vs. Nebraska (2004)Season – High: 569 (2008)Season – Low: 245 (1997)
POINTS PER GAMESeason – High: 43.8 (2008); 569 points in 13 gamesSeason – Low: 22.3 (1997); 245 points in 11 games
TOUCHDOWNSGame: 12 vs. Wayland (1925)Game since 1950: 11 vs. Sam Houston State (2005)Season – High: 79 (2008)Season – Low: 29 (1998)
PATs MADEGame: 11 vs. Sam Houston State (2005)Season – High: 70 (2008)Season – Low: 26 (1997)
FIELD GOALS MADEGame: 4, nine times; most recently vs. Texas (1998)Season – High: 19 (1998)Season – Low: 7 (1999); 7 (2004); 7 (2008)
FIELD GOALS ATTEMPTEDSeason – High: 28 (1998), 19-of-28Season – Low: 13 (1999), 7-of-13; 13 (2008), 7-of-13
FIELD GOAL PERCENTAGESeason: 82.4 (1990); 14-of-17
MISCELLANEOUSMost Two-Point PATs Made: 5 (1994); 5-of-8 / 5 (2002); 5-of-7Most Two-Point PAT Attempts: 8 (1990); 4-of-8 / (1994); 5-of-8Largest Deficit Erased: 31 vs. Minnesota (2006 Insight Bowl; also
NCAA Bowl Record); trailed 38-7 with 7:47 to play in the third quarter
Quickest Score into a Game: :17 vs. North Texas (1988); Tolliver 73-yard pass to Walker
Most Safeties: 3 (1992)
TOP 10 SCORING GAMES 1. vs. Wayland (1925) ............................................................. 120 2. vs. Sam Houston State (2005) .............................................. 80 3. vs. Trinity (1932) .................................................................. 79 4. vs. Northwestern State (2007) .............................................. 75 5. vs. New Mexico A&M (1953) ................................................ 71 6. vs. TCU (2004) ..................................................................... 70 vs. Nebraska (2004) .............................................................. 70 8. vs. Kansas State (2009) ........................................................ 66 9. vs. Austin College (1932) ...................................................... 64 10. vs. UC-Santa Barbara (1970)................................................. 63 vs. TCU (1985) ..................................................................... 63 vs. Arkansas State (1995)..................................................... 63 at Baylor (2001) .................................................................... 63 vs. Indiana State (2005) ........................................................ 63 at Kansas (2008) .................................................................. 63
RUSHING
RUSHESGame – High: 73 vs. Arizona (1989)Game – Low: 7 at Texas (2007)
YARDSGame – High: 620 vs. Trinity (1939)Game – Low: -17 vs. Texas (2004)Season – High: 3,342 (1932) Season High Since 1950: 2,505 (1989)Season – Low: 771 (2007)
TOUCHDOWNSGame: 12 vs. Wayland (1925), vs. Trinity (1932) Game Since 1950: 5 vs. TCU (1977), vs. Rice (1989), vs. Sam Houston
State (2005); vs. Texas A&M (2005)Season: 30 (1993)
YARDS PER RUSHSeason – High: 7.7 (1989); 581 rush for 2,505 yardsSeason – Low: 3.1 (2007); 246 rush for 771 yards
PASSING
ATTEMPTSGame – High: 78 vs. Iowa State (2003)Game – Low: 10 vs. Texas (1997)Season – High: 780 (2003)Season – Low: 270 (1999)
COMPLETIONSGame – High: 52 vs. Iowa State (2003)Game – Low: 3 vs. Texas (1997)Season – High: 544 (2007)Season – Low: 119 (1996)
COMPLETION PERCENTAGEGame – High (min. 20 att.): 85.7 vs. Stephen F. Austin (2001)Game – Low (min. 20 att.): 24.0 vs. Missouri (1995); 6-of-25Season – High: 71.3 (2007); 544-of-763Season – Low: 43.8 (1996)
YARDSGame – High: 669 vs. Kansas State (2005)Game – Low: 42 vs. Rice (1989)Season – High: 6,179 (2003)Season – Low: 1,723 (1996)
YARDS PER COMPLETIONGame – High: 28.7 vs. Oklahoma (1999); 9259 yardsGame – Low: 6.6 vs. Kansas State (1997)
TOUCHDOWNSGame: 8 vs. Texas A&M (2003); at Baylor (2003); vs. Northwestern
State (2007); vs. Rice (2009)Season: 53 (2003)
INTERCEPTIONS THROWNGame: 5 vs. Rice (1990); vs. Colorado (2003)Season – High: 30 (1938)Season – Low: 6 (1996, 1997)
TOP 10 PASSING GAMES 1. vs. Kansas State (2005) ...................................................... 669 2. at Mississippi (2003) ........................................................... 661 3. vs. Sam Houston State (2005) ............................................ 650 4. at Oklahoma State (2007) ................................................... 646 5. vs. Texas A&M (2003) ........................................................ 605 6. at N.C. State (2003) ........................................................... 586 7. at Baylor (2003) .................................................................. 580 8. vs. Kansas State (2009) ...................................................... 554 9. at Oklahoma State (2003) ................................................... 553 10. vs. Eastern Washington (2008) ............................................ 536
TOTAL OFFENSE
PLAYSGame – High: 111 vs. Iowa State (2003)Game – Low: 46 vs. Nebraska (1997)Season – High: 1,155 (2002)Season – Low: 732 (1997)
YARDSGame – High: 1,271 vs. Wayland (1925) Game High Since 1950: 775 vs. Iowa State (2003)Game – Low: 93 vs. Miami (1990)Season – High: 7,576 (2003)Season – Low: 3,401 (1997)
TOP 10 TOTAL OFFENSE GAMES (SINCE 1950) 1. vs. Iowa State (2003) ......................................................... 775 2. vs. Sam Houston State (2005) ............................................ 770 3. vs. Kansas State (2009) ...................................................... 739 4. at Oklahoma State (2007) ................................................... 718 5. at Baylor (2003) .................................................................. 716 6. at Mississippi (2003) ........................................................... 713 7. vs. TCU (1985) ................................................................... 699 8. vs. Kansas State (2005) ...................................................... 684 9. vs. Baylor (2006) ................................................................ 682 10. at N.C. State (2003) ........................................................... 681
TEAM RECORDS
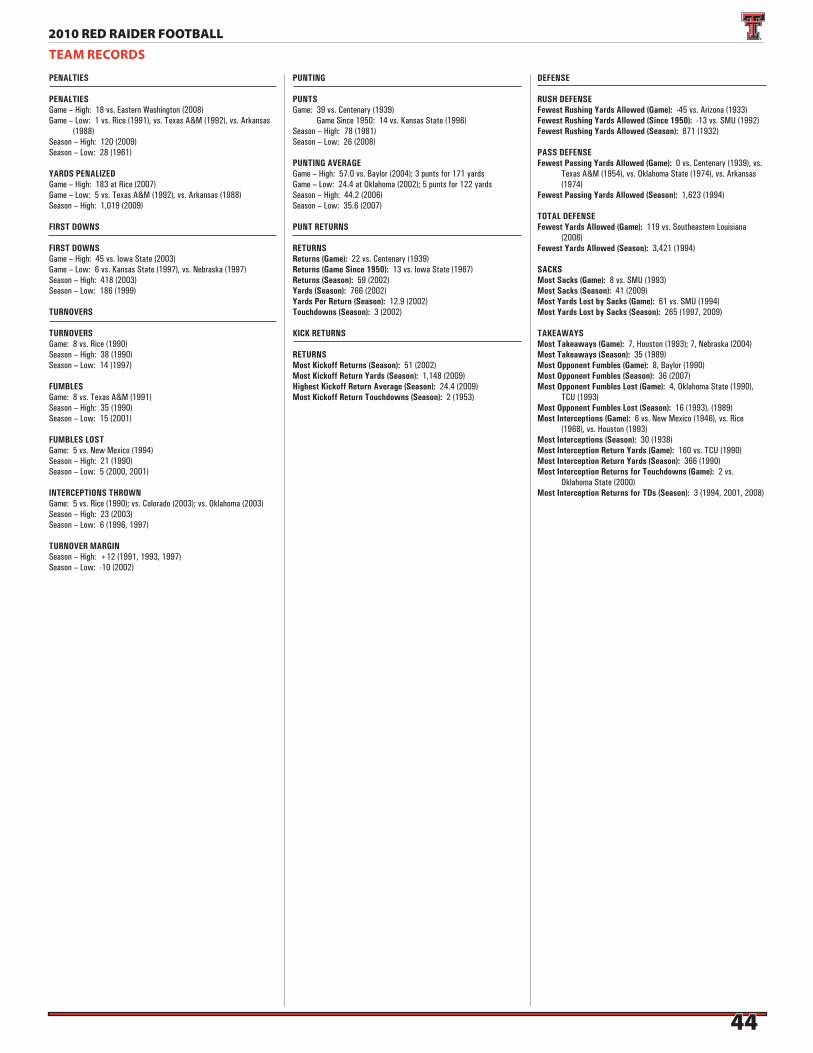
4444
2010 RED RAIDER FOOTBALL
PENALTIES
PENALTIESGame – High: 18 vs. Eastern Washington (2008)Game – Low: 1 vs. Rice (1991), vs. Texas A&M (1992), vs. Arkansas
(1988)Season – High: 120 (2009)Season – Low: 28 (1961)
YARDS PENALIZEDGame – High: 183 at Rice (2007)Game – Low: 5 vs. Texas A&M (1992), vs. Arkansas (1988)Season – High: 1,019 (2009)
FIRST DOWNS
FIRST DOWNSGame – High: 45 vs. Iowa State (2003)Game – Low: 6 vs. Kansas State (1997), vs. Nebraska (1997)Season – High: 418 (2003)Season – Low: 186 (1999)
TURNOVERS
TURNOVERSGame: 8 vs. Rice (1990)Season – High: 38 (1990)Season – Low: 14 (1997)
FUMBLESGame: 8 vs. Texas A&M (1991)Season – High: 35 (1990)Season – Low: 15 (2001)
FUMBLES LOSTGame: 5 vs. New Mexico (1994)Season – High: 21 (1990)Season – Low: 5 (2000, 2001)
INTERCEPTIONS THROWNGame: 5 vs. Rice (1990); vs. Colorado (2003); vs. Oklahoma (2003)Season – High: 23 (2003)Season – Low: 6 (1996, 1997)
TURNOVER MARGINSeason – High: +12 (1991, 1993, 1997)Season – Low: -10 (2002)
PUNTING
PUNTSGame: 39 vs. Centenary (1939) Game Since 1950: 14 vs. Kansas State (1996)Season – High: 78 (1981)Season – Low: 26 (2008)
PUNTING AVERAGEGame – High: 57.0 vs. Baylor (2004); 3 punts for 171 yardsGame – Low: 24.4 at Oklahoma (2002); 5 punts for 122 yardsSeason – High: 44.2 (2006)Season – Low: 35.6 (2007)
PUNT RETURNS
RETURNSReturns (Game): 22 vs. Centenary (1939)Returns (Game Since 1950): 13 vs. Iowa State (1967)Returns (Season): 59 (2002)Yards (Season): 766 (2002)Yards Per Return (Season): 12.9 (2002)Touchdowns (Season): 3 (2002)
KICK RETURNS
RETURNSMost Kickoff Returns (Season): 51 (2002)Most Kickoff Return Yards (Season): 1,148 (2009)Highest Kickoff Return Average (Season): 24.4 (2009)Most Kickoff Return Touchdowns (Season): 2 (1953)
DEFENSE
RUSH DEFENSEFewest Rushing Yards Allowed (Game): -45 vs. Arizona (1933)Fewest Rushing Yards Allowed (Since 1950): -13 vs. SMU (1992)Fewest Rushing Yards Allowed (Season): 871 (1932)
PASS DEFENSEFewest Passing Yards Allowed (Game): 0 vs. Centenary (1939), vs.
Texas A&M (1954), vs. Oklahoma State (1974), vs. Arkansas (1974)
Fewest Passing Yards Allowed (Season): 1,623 (1994)
TOTAL DEFENSEFewest Yards Allowed (Game): 119 vs. Southeastern Louisiana
(2006)Fewest Yards Allowed (Season): 3,421 (1994)
SACKSMost Sacks (Game): 8 vs. SMU (1993)Most Sacks (Season): 41 (2009)Most Yards Lost by Sacks (Game): 61 vs. SMU (1994)Most Yards Lost by Sacks (Season): 265 (1997, 2009)
TAKEAWAYSMost Takeaways (Game): 7, Houston (1993); 7, Nebraska (2004)Most Takeaways (Season): 35 (1989)Most Opponent Fumbles (Game): 8, Baylor (1990)Most Opponent Fumbles (Season): 36 (2007)Most Opponent Fumbles Lost (Game): 4, Oklahoma State (1990),
TCU (1993)Most Opponent Fumbles Lost (Season): 16 (1993), (1989)Most Interceptions (Game): 6 vs. New Mexico (1946), vs. Rice
(1968), vs. Houston (1993)Most Interceptions (Season): 30 (1938)Most Interception Return Yards (Game): 160 vs. TCU (1990)Most Interception Return Yards (Season): 366 (1990)Most Interception Returns for Touchdowns (Game): 2 vs.
Oklahoma State (2000)Most Interception Returns for TDs (Season): 3 (1994, 2001, 2008)
TEAM RECORDS
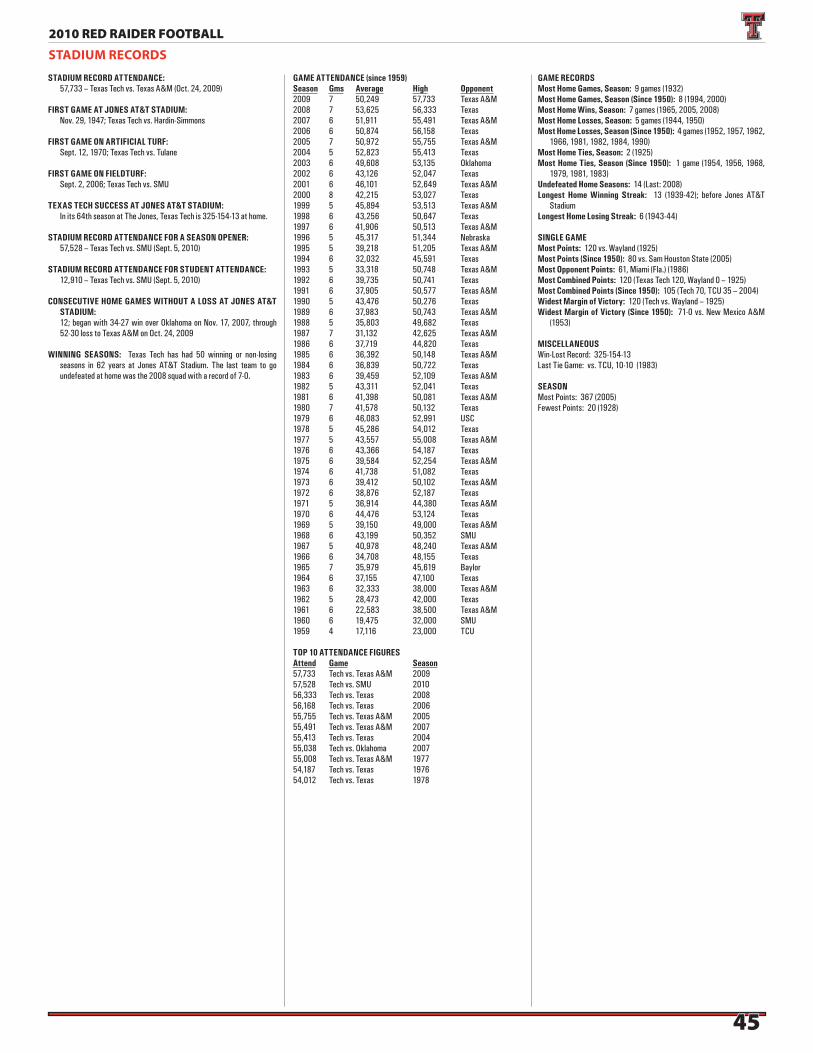
4545
2010 RED RAIDER FOOTBALL
STADIUM RECORD ATTENDANCE: 57,733 – Texas Tech vs. Texas A&M (Oct. 24, 2009)
FIRST GAME AT JONES AT&T STADIUM: Nov. 29, 1947; Texas Tech vs. Hardin-Simmons
FIRST GAME ON ARTIFICIAL TURF: Sept. 12, 1970; Texas Tech vs. Tulane
FIRST GAME ON FIELDTURF: Sept. 2, 2006; Texas Tech vs. SMU
TEXAS TECH SUCCESS AT JONES AT&T STADIUM: In its 64th season at The Jones, Texas Tech is 325-154-13 at home.
STADIUM RECORD ATTENDANCE FOR A SEASON OPENER: 57,528 – Texas Tech vs. SMU (Sept. 5, 2010)
STADIUM RECORD ATTENDANCE FOR STUDENT ATTENDANCE: 12,910 – Texas Tech vs. SMU (Sept. 5, 2010)
CONSECUTIVE HOME GAMES WITHOUT A LOSS AT JONES AT&T STADIUM:
12; began with 34-27 win over Oklahoma on Nov. 17, 2007, through 52-30 loss to Texas A&M on Oct. 24, 2009
WINNING SEASONS: Texas Tech has had 50 winning or non-losing seasons in 62 years at Jones AT&T Stadium. The last team to go undefeated at home was the 2008 squad with a record of 7-0.
GAME ATTENDANCE (since 1959)Season Gms Average High Opponent2009 7 50,249 57,733 Texas A&M2008 7 53,625 56,333 Texas2007 6 51,911 55,491 Texas A&M2006 6 50,874 56,158 Texas2005 7 50,972 55,755 Texas A&M2004 5 52,823 55,413 Texas2003 6 49,608 53,135 Oklahoma2002 6 43,126 52,047 Texas2001 6 46,101 52,649 Texas A&M2000 8 42,215 53,027 Texas1999 5 45,894 53,513 Texas A&M1998 6 43,256 50,647 Texas1997 6 41,906 50,513 Texas A&M1996 5 45,317 51,344 Nebraska1995 5 39,218 51,205 Texas A&M1994 6 32,032 45,591 Texas1993 5 33,318 50,748 Texas A&M1992 6 39,735 50,741 Texas1991 6 37,905 50,577 Texas A&M1990 5 43,476 50,276 Texas1989 6 37,983 50,743 Texas A&M1988 5 35,803 49,682 Texas1987 7 31,132 42,625 Texas A&M1986 6 37,719 44,820 Texas1985 6 36,392 50,148 Texas A&M1984 6 36,839 50,722 Texas1983 6 39,459 52,109 Texas A&M1982 5 43,311 52,041 Texas1981 6 41,398 50,081 Texas A&M1980 7 41,578 50,132 Texas1979 6 46,083 52,991 USC1978 5 45,286 54,012 Texas1977 5 43,557 55,008 Texas A&M1976 6 43,366 54,187 Texas1975 6 39,584 52,254 Texas A&M1974 6 41,738 51,082 Texas1973 6 39,412 50,102 Texas A&M1972 6 38,876 52,187 Texas1971 5 36,914 44,380 Texas A&M1970 6 44,476 53,124 Texas1969 5 39,150 49,000 Texas A&M1968 6 43,199 50,352 SMU1967 5 40,978 48,240 Texas A&M1966 6 34,708 48,155 Texas1965 7 35,979 45,619 Baylor1964 6 37,155 47,100 Texas1963 6 32,333 38,000 Texas A&M1962 5 28,473 42,000 Texas1961 6 22,583 38,500 Texas A&M1960 6 19,475 32,000 SMU1959 4 17,116 23,000 TCU
TOP 10 ATTENDANCE FIGURESAttend Game Season57,733 Tech vs. Texas A&M 200957,528 Tech vs. SMU 201056,333 Tech vs. Texas 200856,168 Tech vs. Texas 200655,755 Tech vs. Texas A&M 200555,491 Tech vs. Texas A&M 200755,413 Tech vs. Texas 200455,038 Tech vs. Oklahoma 200755,008 Tech vs. Texas A&M 197754,187 Tech vs. Texas 197654,012 Tech vs. Texas 1978
GAME RECORDSMost Home Games, Season: 9 games (1932)Most Home Games, Season (Since 1950): 8 (1994, 2000)Most Home Wins, Season: 7 games (1965, 2005, 2008)Most Home Losses, Season: 5 games (1944, 1950)Most Home Losses, Season (Since 1950): 4 games (1952, 1957, 1962,
1966, 1981, 1982, 1984, 1990)Most Home Ties, Season: 2 (1925)Most Home Ties, Season (Since 1950): 1 game (1954, 1956, 1968,
1979, 1981, 1983)Undefeated Home Seasons: 14 (Last: 2008)Longest Home Winning Streak: 13 (1939-42); before Jones AT&T
StadiumLongest Home Losing Streak: 6 (1943-44)
SINGLE GAMEMost Points: 120 vs. Wayland (1925)Most Points (Since 1950): 80 vs. Sam Houston State (2005)Most Opponent Points: 61, Miami (Fla.) (1986)Most Combined Points: 120 (Texas Tech 120, Wayland 0 – 1925)Most Combined Points (Since 1950): 105 (Tech 70, TCU 35 – 2004)Widest Margin of Victory: 120 (Tech vs. Wayland – 1925)Widest Margin of Victory (Since 1950): 71-0 vs. New Mexico A&M
(1953)
MISCELLANEOUSWin-Lost Record: 325-154-13Last Tie Game: vs. TCU, 10-10 (1983)
SEASONMost Points: 367 (2005)Fewest Points: 20 (1928)
STADIUM RECORDS