THE SOL’S FOR UNITED STATES HISTORY. EARLY AMERICA 17 TH AND 18 TH CENTURY.

BOOT CAMP DAY
SOL’S 6.1, 6.5, 6.6, 6.10, 6.11, 6.12, 6.14, 6.16, 6.19, 6.20

PROBABILITY SOL 6.16
• Independent event - two events whose occurrence of one event DOES NOT affect the likelihood that the other event will occur•Dependent event - two events whose occurrence of one event DOES affect the likelihood that the other event will occur

PROBABILITY SOL 6.16

CIRCLE GRAPHS SOL 6.14
• Circle graphs are used to display data that is part of a whole, or any percentage data.
• The percentages in a circle graph always add up to 100%
• Circle graphs can be used to tell how parts relate to a whole. For example, we could draw a circle graph to show how we spend our day or our allowance.
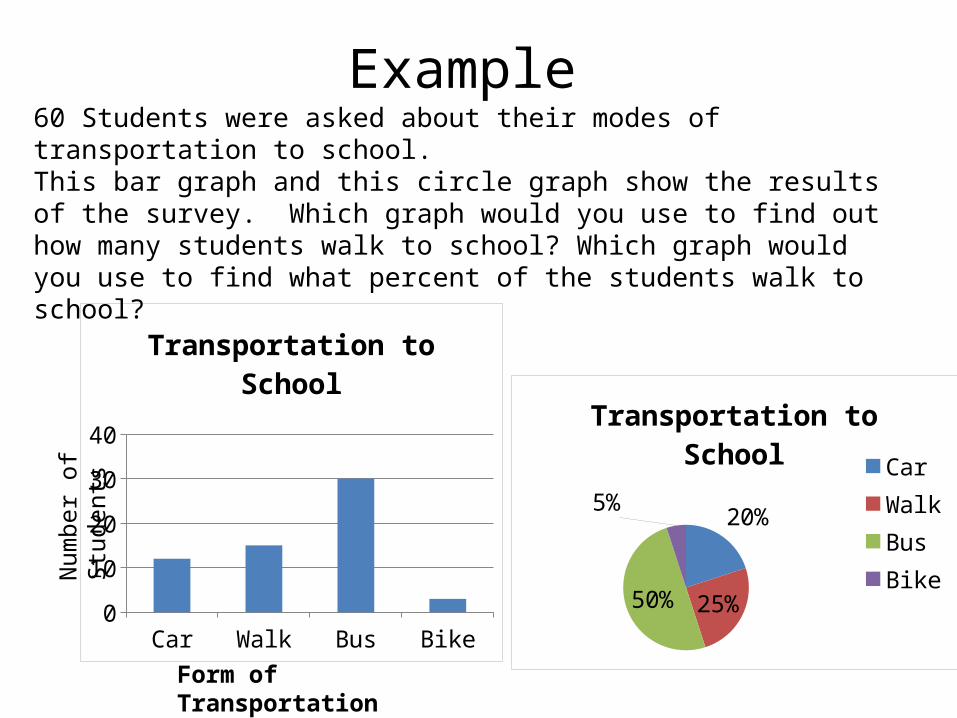
Example
Car Walk Bus Bike05
101520253035
Transportation to School
Form of Transportation
Num
ber o
f Stu
dent
s
60 Students were asked about their modes of transportation to school. This bar graph and this circle graph show the results of the survey. Which graph would you use to find out how many students walk to school? Which graph would you use to find what percent of the students walk to school?
20%
25%50%
5%
Transportation to School
CarWalkBusBike

Ratio SOL 6.1
Describe situations in which they might want to compare the quantity of one thing to the quantity of another.
When listing a ratio, order does matter.
There are three ways to write a ratio like this:
1) 7 to 10 ( the word “to”)2) 7/10 (fraction form)3) 7 : 10 (colon)

Write the ratio of sandwiches to coke bottles 3 different ways.
Ratio SOL 6.1

Exponents/Perfect Squares SOL 6.5
•
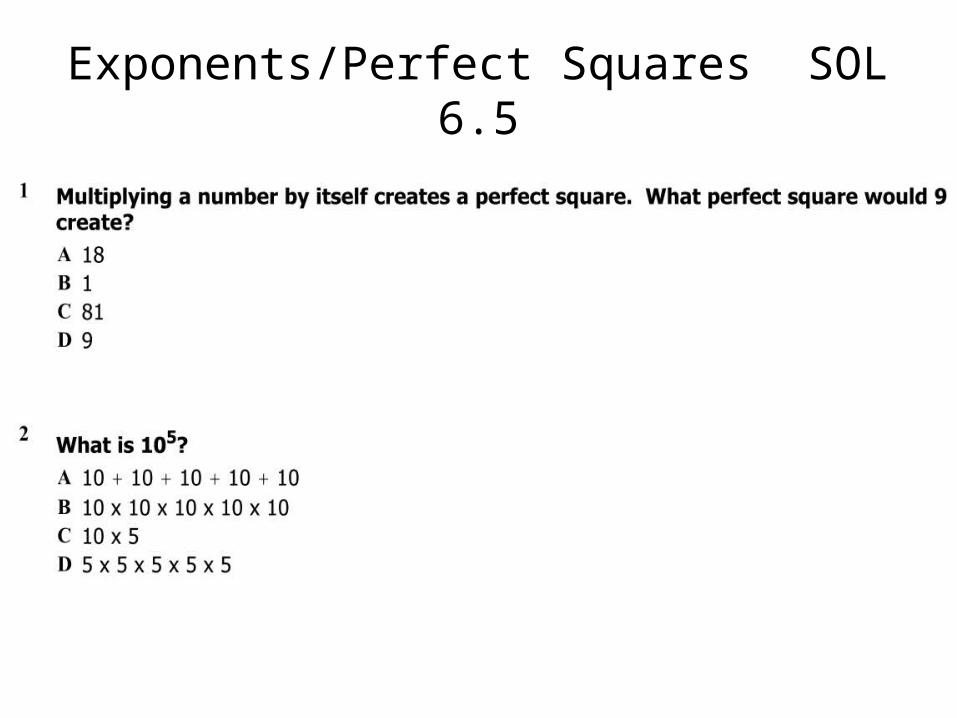
Exponents/Perfect Squares SOL 6.5

+ - x and divide Fractions SOL 6.6
Remember to stack and then get a common denominator.

+ - x and divide Fractions SOL 6.6
Remember to stack and then get a common denominator.
Don’t forget to check mark!
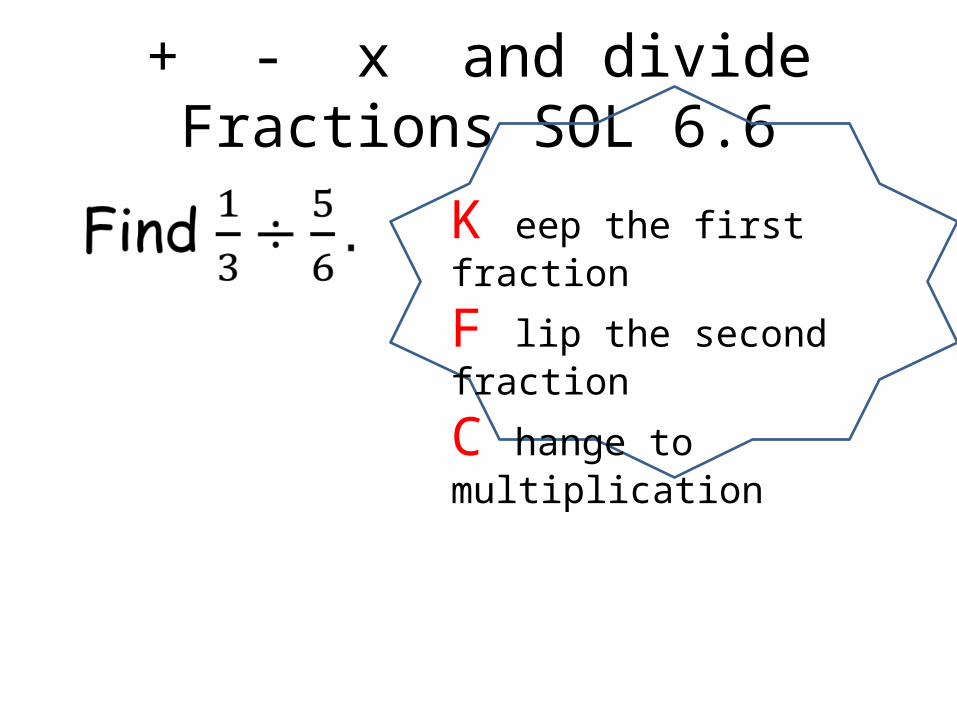
+ - x and divide Fractions SOL 6.6
K eep the first fraction
F lip the second fraction
C hange to multiplication
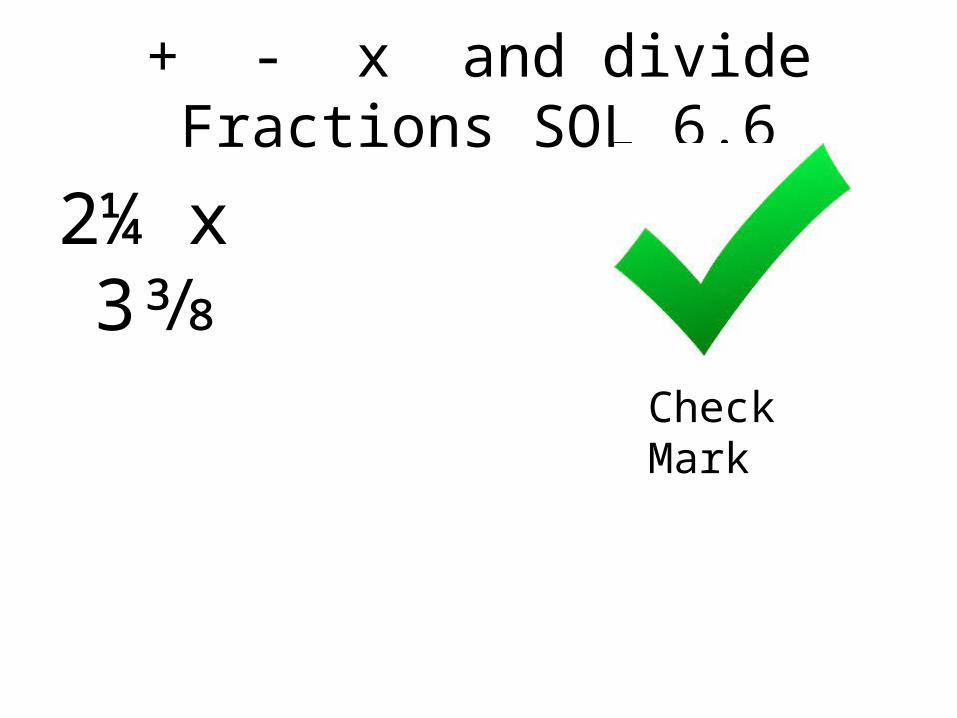
2¼ x 3⅜
+ - x and divide Fractions SOL 6.6
Check Mark

FORMULAS SOL 6.10
• Pi – the ratio of the circumference of a circle to it’s diameter
• 4 ways to wite Pi– 3.14– 22/7– C/D– C/2r

FORMULAS SOL 6.10

FORMULAS SOL 6.10

FORMULAS SOL 6.10

COORDINATE PLANE SOL 6.11• Coordinate Plane- a plane in which a horizontal number line and a vertical
number line intersect at their zero points.• X-axis- the horizontal number line• Y-axis- the vertical number line• Origin- the point where the number lines intersect at their zero points (0,0)• Quadrants- the x-axis and the y-axis separate the coordinate plane into four
regions• Ordered pair- a pair of numbers used to locate a point in the coordinate
plane. Written (x-coordinate, y-coordinate) or (x, y)• X-coordinate- the first number of an ordered pair (positive = right, negative
= left)• Y-coordinate- the second number of an ordered pair (positive = up, negative
= down)

The 4 Quadrants
y-axis
I
(+, +)
II
(-, +)III
(-, -)IV
(+, -)
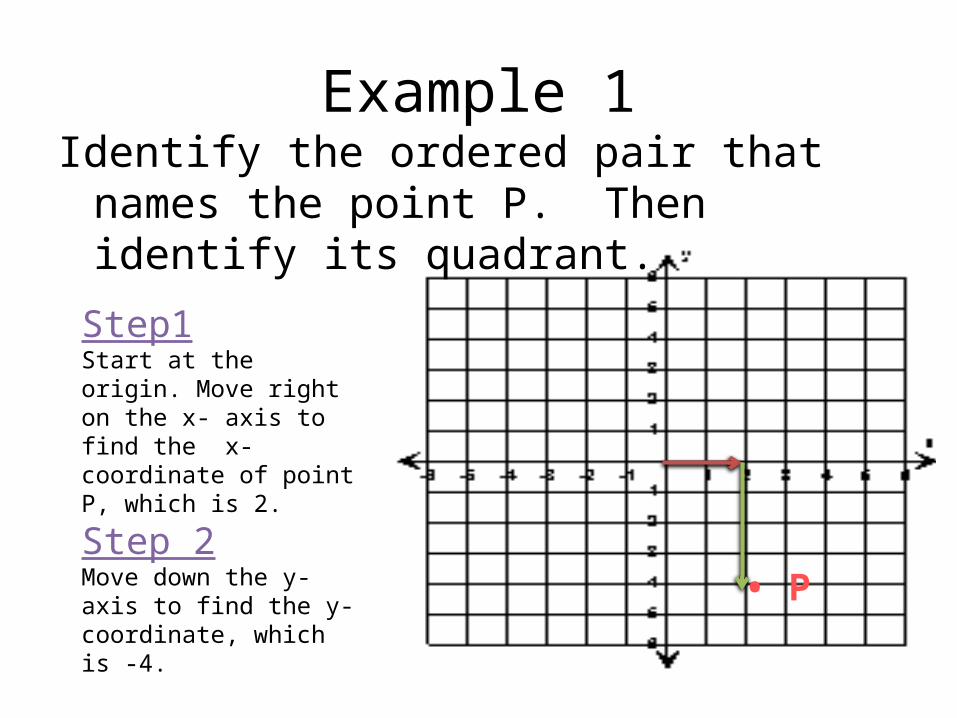
Example 1Identify the ordered pair that names the point P.
Then identify its quadrant.
• P
Step1Start at the origin. Move right on the x- axis to find the x-coordinate of point P, which is 2.
Step 2Move down the y-axis to find the y-coordinate, which is -4.

• Identify the ordered pair that names the point A. Then identify its quadrant.
YOUR TURN
• A

CONGRUENCE SOL 6.12
• Congruent figures – figures that have the same shape and the same size

INEQUALITIES SOL 6.20
• Inequality -a mathematical sentence that compares expressions. It contains the symbols <, >, ≤, or ≥. To write an inequality, look for the following phrases to determine where to place the inequality symbol.

Key SymbolsInequality Symbols
Symbol < > < >
Key Phrases
• Is less than
• Is fewer than
• Is greater than
• Is more than
• Is less than or equal to• Is at most• Is no more
than• Up to and
including
• Is greater than or equal to• Is at least• Is no less
than
An inequality contains the symbols <, >, ≤, or ≥. To write an inequality, look for the above phrases to determine where to place the inequality symbol.
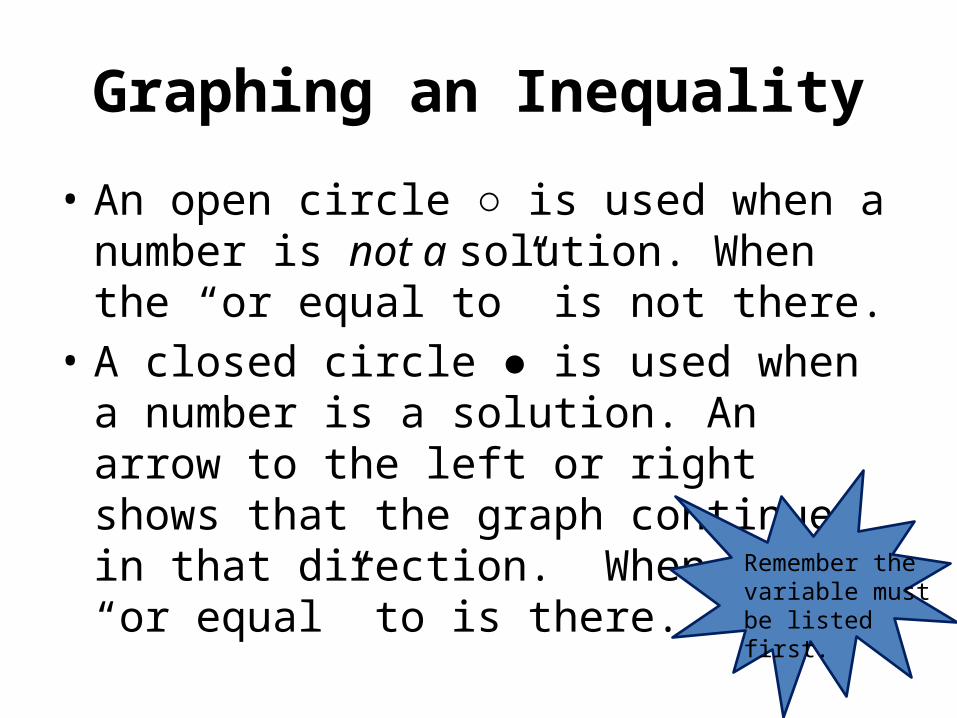
Graphing an Inequality
• An open circle ○ is used when a number is not a solution. When the “or equal to” is not there.
• A closed circle ● is used when a number is a solution. An arrow to the left or right shows that the graph continues in that direction. When the “or equal” to is there.
Remember the variable must be listed first.

Graphing an Inequality

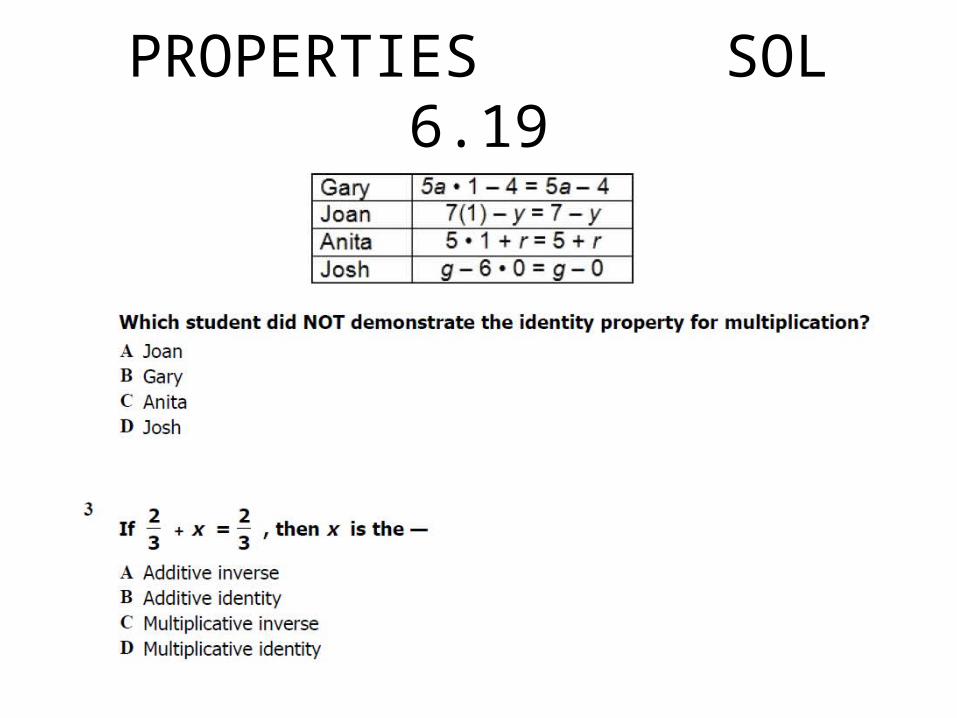
PROPERTIES SOL 6.19
Property Key ConceptAdditive Identity adding zeroMultiplicative Identity multiplying by
1Multiplicative Inverse flip the
fractionMultiplicative Property of zero multiplying by
0
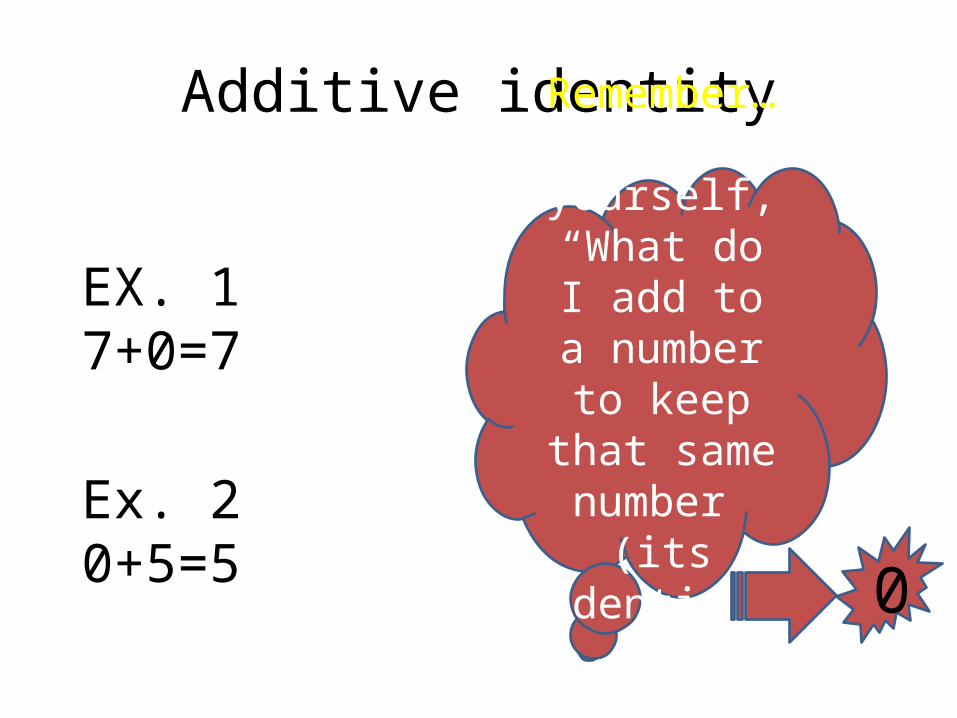
Additive identity
EX. 17+0=7
Ex. 20+5=5
Remember…Ask yourself, “What do I
add to a number to keep that
same number (its identity)?
0

Multiplicative Identity
Ex. 19x1=9
Ex. 21x6=6
Remember…Ask yourself, “What do I multiply a
number by to keep that
same number (its identity)?
1

Multiplicative Inverse or Inverse property of multiplication
Ex. 1 5 = 1
Ex. 2 9 = 1
Remember…Inverse means
FLIP THE FRACTION

Multiplicative Property of zero
Ex. 1 8 x 0 = 0
Ex. 2 0 x 7 = 0
Remember…Any number
times 0 equals 0!
PROPERTIES SOL 6.19