Boosting Work and Earnings for Housing-Assisted Families Nandita Verma Solutions 2013: National...
25
Boosting Work and Earnings for Housing-Assisted Families Nandita Verma Solutions 2013: National Conference on State and Local Housing Policy September 17, 2013
-
Upload
jocelyn-mattinson -
Category
Documents
-
view
214 -
download
0
Transcript of Boosting Work and Earnings for Housing-Assisted Families Nandita Verma Solutions 2013: National...

Boosting Work and Earnings for Housing-Assisted Families
Nandita Verma
Solutions 2013: National Conference on State and Local Housing Policy
September 17, 2013

MDRC
• Not-for-profit social policy research organization
• Based in NYC and Oakland
• Rigorously evaluates (and sometimes helps design) innovative social policies
• Pioneered large-scale random assignment evaluations of social programs
• Mission: Build evidence to improve the lives of low-income families
2
Topics Broad issueHelping housing subsidy recipients make progress toward
economic security. Making assisted housing a “platform” for interventions to
improve work outcomes for low-income families Evidence
• Jobs-Plus: A place-based employment intervention for residents of public housing
• Work Rewards: A demonstration for “Housing Choice Voucher” recipients
Future work • HUD’s National FSS evaluation• HUD’s Rent Reform demonstration
3

Jobs-Plus DemonstrationTarget group: Residents of public housing
• Place-based employment intervention• Multi-component, “saturation” strategy
3 components:1. Employment and training services
Convenient on-site “job centers” 2. New rent rules to “make work pay”
Rent rises less as earnings grow3. Community support for work
Neighbor-to-neighbor outreach
Public and private sponsors: • HUD, The Rockefeller Foundation, other public and private
funders 4
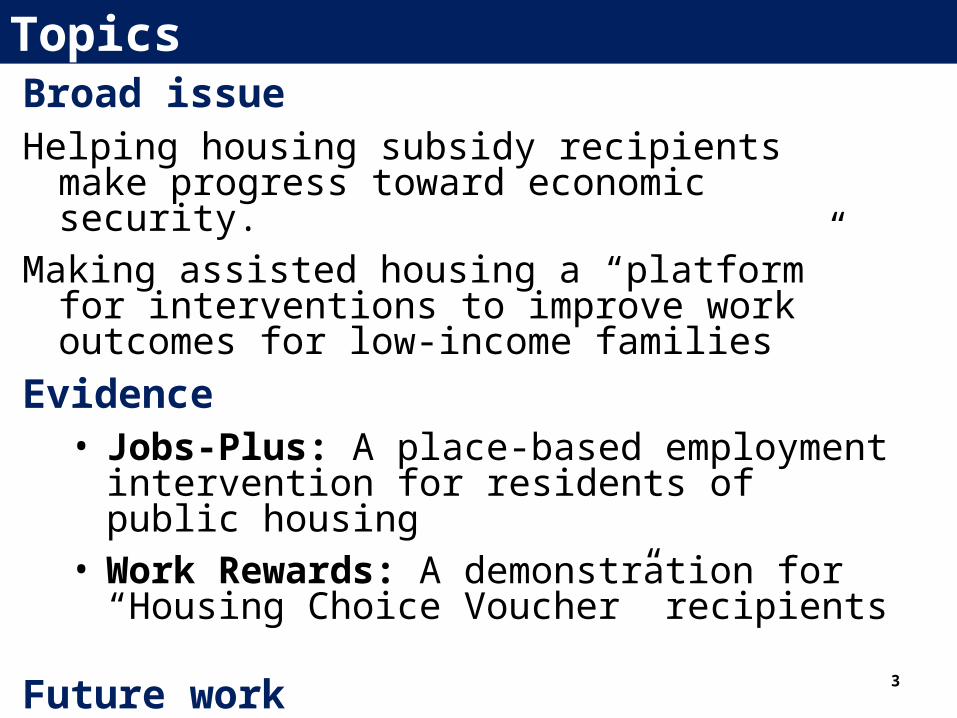
Diverse housing developments in 6 cities: Baltimore Chattanooga Dayton Los Angeles St. Paul Seattle
Randomly allocated developments within each city to program and control groups
Local partnerships and collaboration: • Public housing authorities• Welfare agencies• Workforce agencies • Residents• Other service agencies
Mandatory partners
5
Jobs-Plus sites
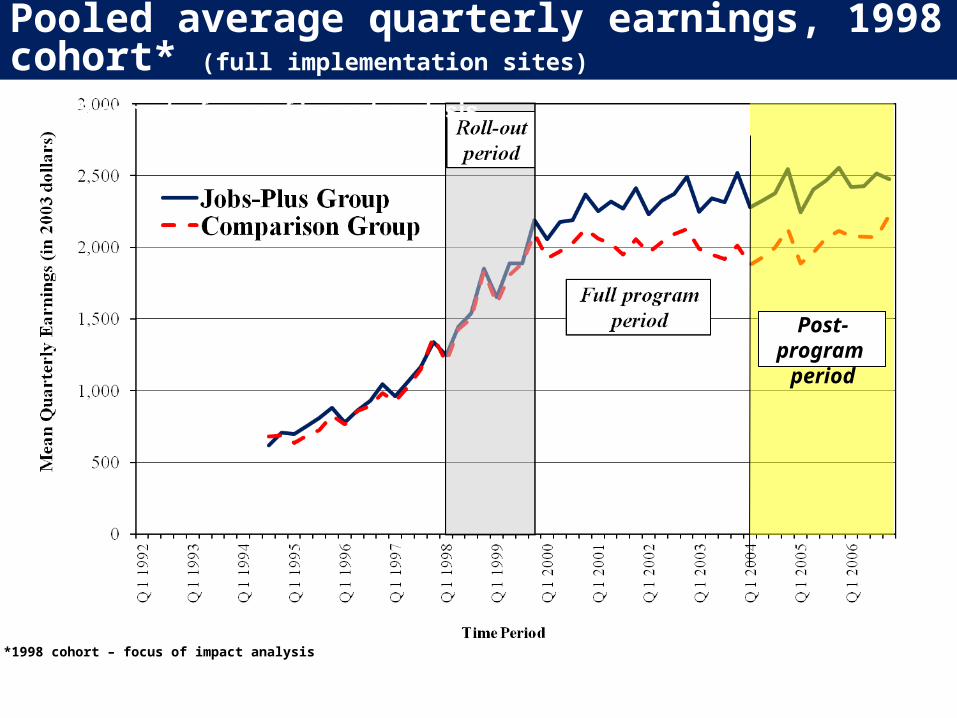
Figure pooled 1
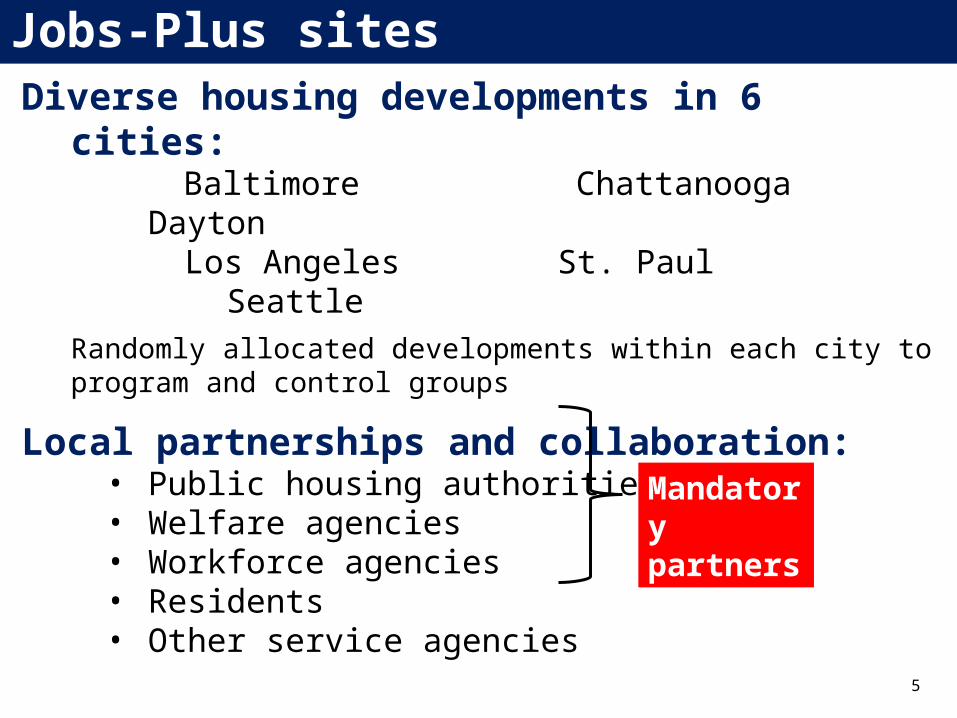
Mean Quarterly Earnings for the 1998 Able-Bodied Sample:3 sites pooled
Post-program period
Pooled average quarterly earnings, 1998 cohort* (full implementation sites)
*1998 cohort – focus of impact analysis
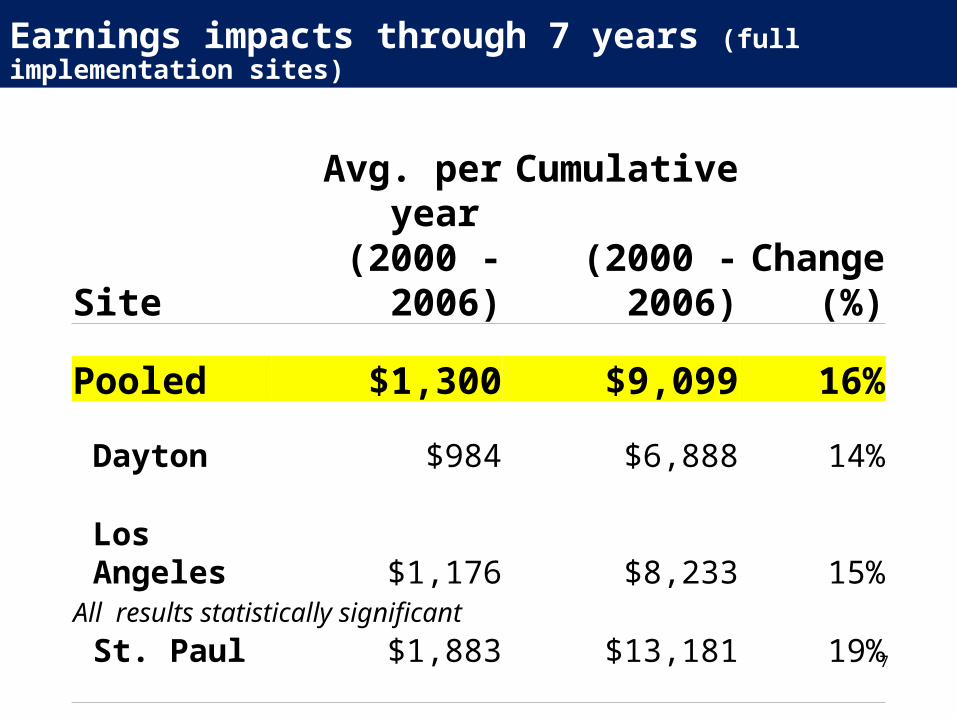
SiteAvg. per year (2000 - 2006)
Cumulative (2000 - 2006)
Change (%)
Pooled $1,300 $9,099 16%
Dayton $984 $6,888 14%
Los Angeles $1,176 $8,233 15%
St. Paul $1,883 $13,181 19%
All results statistically significant
7
Earnings impacts through 7 years (full implementation sites)
New York City• Now serving 4 public housing developments
• A key feature of Mayor Bloomberg’s new “Young Men’s Initiative”: Will add up to 7 new Jobs-Plus sites
San Antonio, Texas– Operating in public housing developments
Obama administration (HUD) – Proposing federal expansion in new budget
8
Replication efforts
9
Testing 3 employment interventions for Housing Choice Vouchers recipients
2 NYC housing agencies• HPD: Dept. of Housing Preservation and Development• NYCHA: New York City Housing Authority
Early impact results• 30 months for employment & earnings
NYC Work Rewards Demonstration

10
HPD Sample (Dept. of Housing Preservation and Development)
1. Family Self-Sufficiency (FSS) program • Employment and other service referrals• Asset-building (Escrow “savings” accounts)• 5-year program
2. FSS + workforce incentives• Cash rewards for:
‒ Sustained full-time work: $150/month‒ Completed education/training
• Paid every 2 months over 2 years
NYCHA Sample (NYC Housing Authority)
3. Workforce incentives alone
The 3 Interventions
Do more immediate work incentives “add value” to effects of FSS alone?
Does FSS increase work, earnings, other outcomes (vs. control group)?
Do workforce incentives alone (“outside of” rent rules) increase work, earnings, other outcomes
(vs. control group)?

11
Findings from the FSS study
HPD Sample
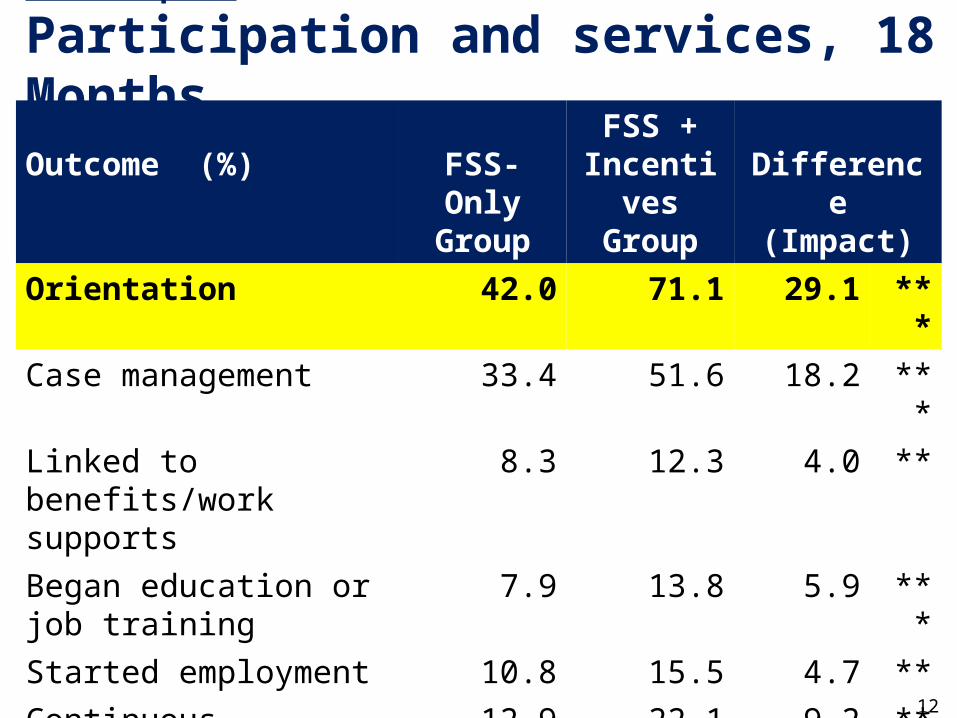
Participation and services, 18 Months
Outcome (%) FSS-Only Group
FSS + Incentives
GroupDifference (Impact)
Orientation 42.0 71.1 29.1 ***Case management 33.4 51.6 18.2 ***
Linked to benefits/work supports
8.3 12.3 4.0 **
Began education or job training
7.9 13.8 5.9 ***
Started employment 10.8 15.5 4.7 **Continuous employment (30 days)
12.9 22.1 9.2 ***
Any milestone 44.9 67.5 22.6 ***12
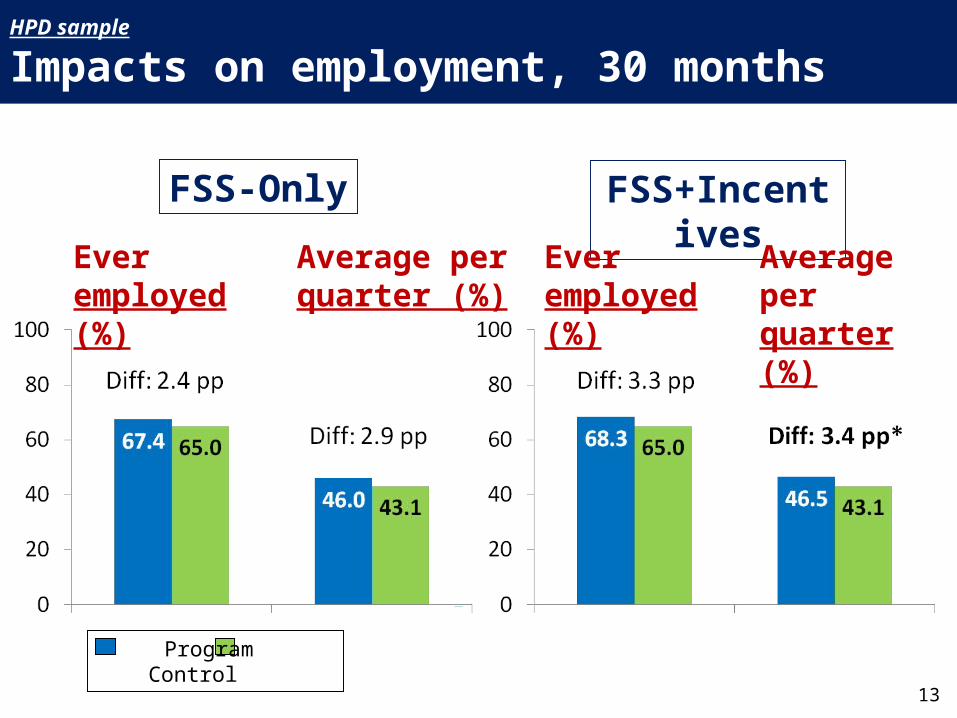
Program Control
13
Ever employed (%)
Average per quarter (%)
FSS-Only FSS+Incentives
Ever employed (%)
Average per quarter (%)
HPD sample
Impacts on employment, 30 months

Program Control
Diff: $503 Diff: $550
FSS-Only FSS+Incentives
14
Total Earnings Total Earnings
HPD sample
Impacts on earnings, 30 months

FSS-Only FSS + Incentives
Impact($) Change (%) Impact($) Change (%)
Full sample +503 +2.8 + 551 +3.1
Employment subgroups Not working at baseline +1,658 +24.3 +3,102** +45.4
Working at baseline -706 -2.4 -1,940 -6.5
SNAP subgroups Receiving at baseline +2,056* +15.2 +1,261 +9.3
Not receiving -2,127 † -7.9 -704 -2.6
††
15
HPD sample
Impacts on earnings by subgroup, 30 months
16
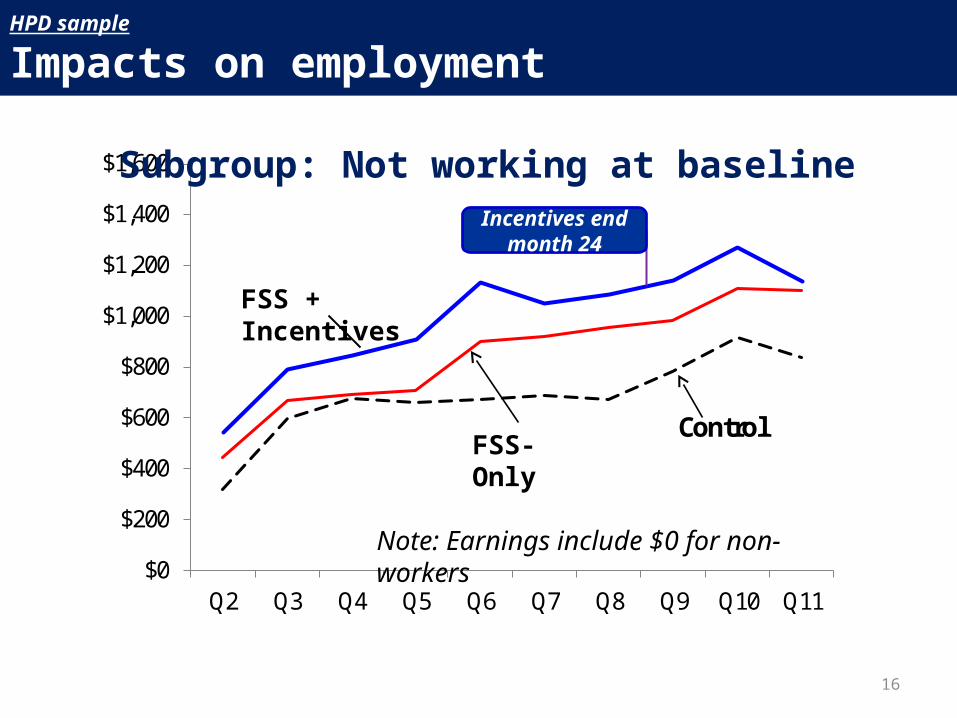
$0
$200
$400
$600
$800
$1,000
$1,200
$1,400
$1,600
Q2 Q3 Q4 Q5 Q6 Q7 Q8 Q9 Q10 Q11
Control
FSS + Incentives
FSS-Only
Note: Earnings include $0 for non-workers
Subgroup: Not working at baselineIncentives end
month 24
HPD sample
Impacts on employment

17
Findings From the Incentives-Only Study
(NYCHA SAMPLE)

Statistical significance levels: *** = 1 percent; ** = 5 percent; * = 10 percent .18
Diff: $1,453
Program Control
Diff: 3.9**
Ever employed (%) Total Earnings (%)
NYCHA sample
Impacts on employment and earnings, 30 months
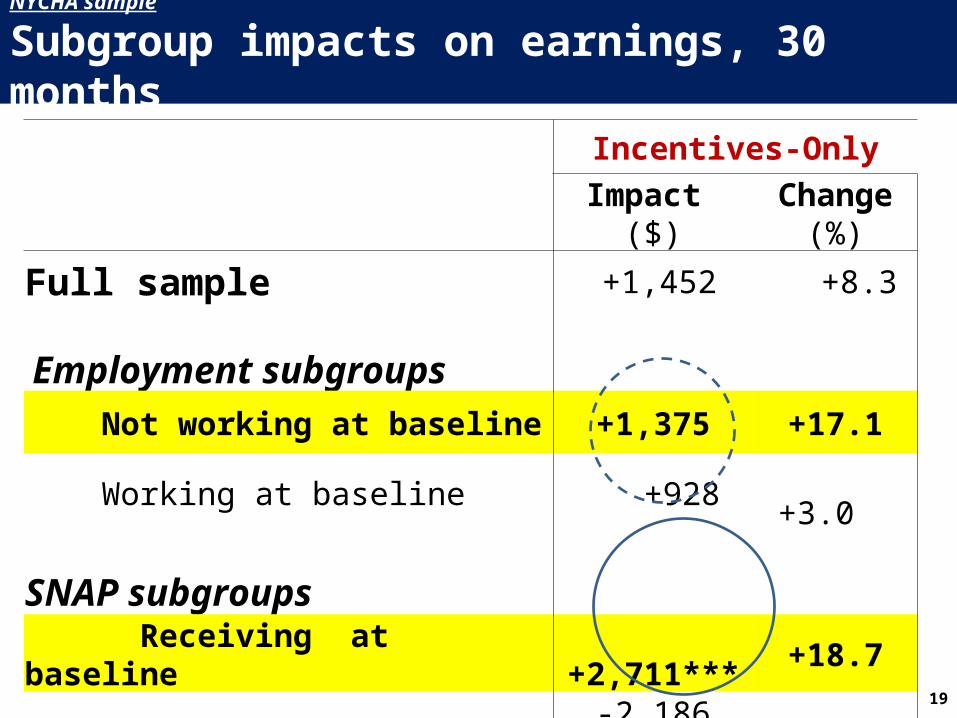
Incentives-Only
Impact ($) Change(%)
Full sample +1,452 +8.3
Employment subgroups Not working at baseline +1,375 +17.1
Working at baseline +928 +3.0
SNAP subgroups Receiving at baseline +2,711*** +18.7 Not receiving -2,186
†† -8.819
NYCHA sample
Subgroup impacts on earnings, 30 months
20
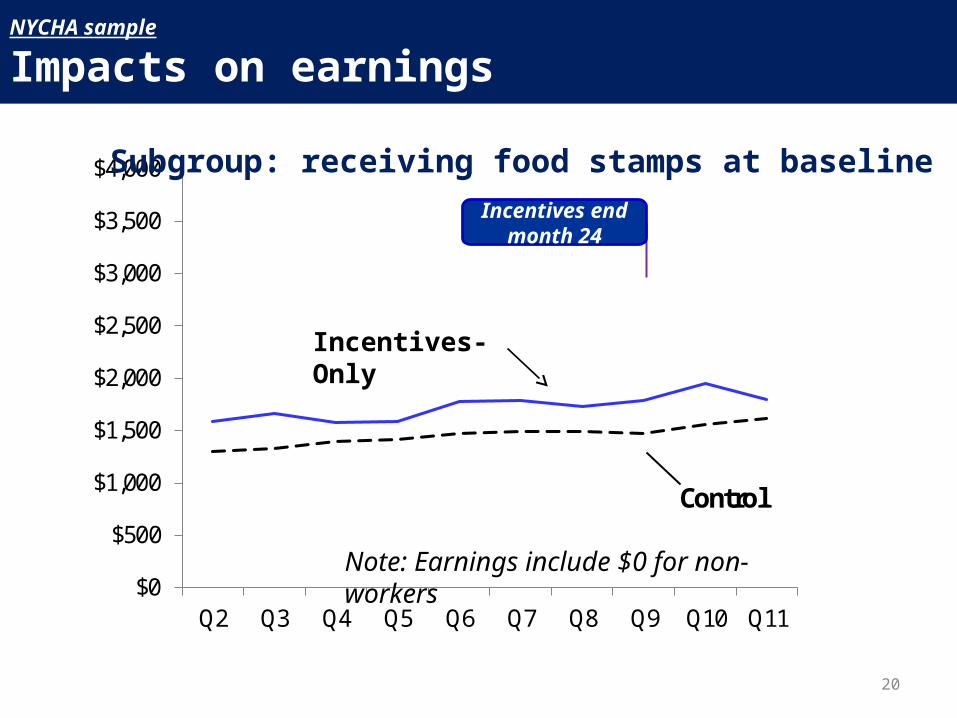
$0
$500
$1,000
$1,500
$2,000
$2,500
$3,000
$3,500
$4,000
Q2 Q3 Q4 Q5 Q6 Q7 Q8 Q9 Q10 Q11
Control
Incentives-Only
Note: Earnings include $0 for non-workers
Subgroup: receiving food stamps at baselineIncentives end
month 24
NYCHA sample
Impacts on earnings

• Early NYC test raises cautions about FSS-Only, but…– Longer follow-up to come (results could change)
• Incentives may matter. Impressive earnings gains for: – Tenants not working at baseline (FSS+Incentives)– Tenants on food stamps at baseline (Incentives-Only)
• Future reports: Survey analysis, longer-term impacts, and cost-benefit
• National influence of Work Rewards:– Only available evidence on effects of FSS alone– Shaping HUD’s new national FSS evaluation (benchmark;
guide for analysis)– Inspiration for planning a new supplemental test
21
Conclusions and next steps

DRAFT – NOT FOR DISTRIBUTION 22
• Employment services not always a primary focus
• Staff more skilled in job placement than advancement coaching; “value added” for working participants unclear
• Escrow and Section 8 difficult for CBO staff to understand and explain – Escrow marketing not well integrated into service
delivery or payment milestones
• Efforts to leverage existing CBO services and resources not as strong as envisioned
Observations on operating FSS
23
NEW HUD-FUNDED EVALUATIONS
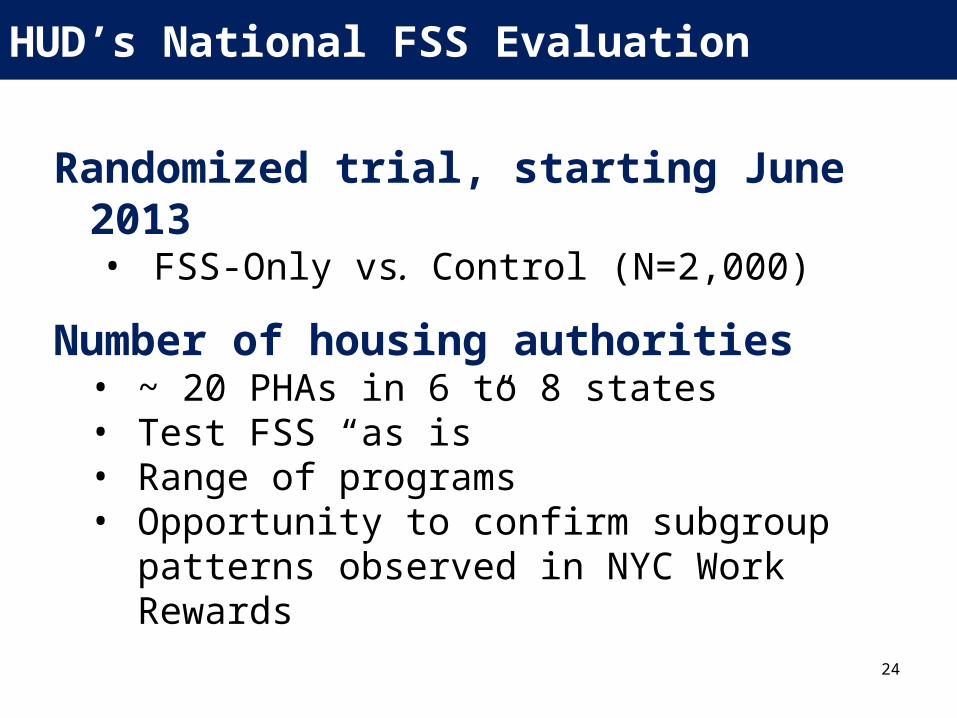
Randomized trial, starting June 2013• FSS-Only vs. Control (N=2,000)
Number of housing authorities• ~ 20 PHAs in 6 to 8 states• Test FSS “as is” • Range of programs• Opportunity to confirm subgroup patterns
observed in NYC Work Rewards
24
HUD’s National FSS Evaluation

Design new rent policy for voucher holders to: • Promote work and income reporting• Simplify rent rules for residents and PHAs• Reduce administrative burden for PHAs• Stay revenue neutral
Randomized trial in 5 PHAs, starting July 2013• Combined sample = 4,000 households:
Existing rent rules (30% of income)vs.
Alternative rent rules (TBD) 25
HUD’s Rent Reform Demonstration