blinkx plc Corporate and Business...
35
blinkx plc Corporate and Business Overview S. Brian Mukherjee, CEO Edward Reginelli, CFO February 2014
-
Upload
truonglien -
Category
Documents
-
view
215 -
download
0
Transcript of blinkx plc Corporate and Business...

blinkx plcCorporate and Business Overview
S. Brian Mukherjee, CEOEdward Reginelli, CFO
February 2014

Safeharbor Statement
2
This announcement or presentation contains (or may contain) certain forward-looking statements with respect to certain of blinkx's plans and its current goals and expectations relating to its future financial condition and performance and which involve a number of risks and uncertainties. blinkx cautions readers that no forward-looking statement is a guarantee of future performance and that actual results could differ materially from those contained in the forward-looking statements. These forward-looking statements can be identified by the fact that they do not relate only to historical or current facts. Forward-looking statements sometimes use words such as 'aim', 'anticipate', 'target', 'expect', 'estimate', 'intend', 'plan', 'goal', 'believe', or other words of similar meaning. Examples of forward-looking statements include, among others, statements regarding blinkx's future financial position, income growth, impairment charges, business strategy, projected levels of growth in its markets, projected costs, estimates of capital expenditure, and plans and objectives for future operations of blinkx and other statementsthat are not historical fact.
By their nature, forward-looking statements involve risk and uncertainty because they relate to future events and circumstances,including, but not limited to US and UK domestic and global economic and business conditions, the effects of blogs and media coverage, the effects of continued volatility in credit markets, market-related risks such as changes in interest rates and exchange rates, the policies and actions of governmental and regulatory authorities, changes in legislation, the further development of standards and interpretations under International Financial Reporting Standards ("IFRS") applicable to past, current and future periods, evolving practices with regard to the interpretation and application of standards under IFRS, theoutcome of pending and future litigation, the success of future acquisitions and other strategic transactions and the impact of competition - a number of which factors are beyond blinkx's control. As a result, blinkx's actual future results may differ materially from the plans, goals, and expectations set forth in blinkx's forward-looking statements.
Any forward-looking statements made herein by or on behalf of blinkx speak only as of the date they are made. Except as required by the FCA, AIM or applicable law, blinkx expressly disclaims any obligation or undertaking to release publicly any updates or revisions to any forward-looking statements contained in this announcement or presentation to reflect any changes in blinkx expectations with regard thereto or any changes in events, conditions or circumstances on which any such statement is based. Neither the content of the Company's website (or any other website) nor the content of any website accessible from hyperlinks on the Company's website (or any other website) is incorporated into, or forms part of, this announcement.

3
Agenda
Corporate Snapshot
Market Overview
Product and Technology
Business Model and Financials
Growth Strategy

Corporate Snapshot
4
1. Adjusted for acquisitions and exceptional expenses, share based compensation, other income
History Founded 2004IPO 2007 (LSE AIM: BLNX)
Headquarters London, UKSan Francisco, CA
Locations Boston, Cambridge, Chicago, Herndon, London, Los Angeles, Montreal, Mountain View, New York, San Francisco, Seattle, Tempe
Employees 343 Total : 109 Research & Development, 88 Sales, 66 Marketing & Services, 36 Ad Operations, 44 General & Administrative
Products Video Search, Discovery and Syndication PlatformDesktop and Mobile App Distribution and Monetization PlatformMulti-format Advertising and Campaign Management ToolsData Capture, Traffic Filtering, Optimization and Targeting Engine
Financials(H1 2014)
$111.6M – Revenue (+36%)$18.2M – Adjusted EBITDA1 (+76%)$69.4M – Cash (+67%) 119% – Cash Conversion Rate
Relationships 70+ Agencies900+ Brands1100+ Content Partners4600+ Publishers

Commercial Model
5
Content
Consumers Advertisers

6
Ad Units
FIND A STORE

7
Agenda
Corporate Snapshot
Market Overview
Product and Technology
Business Model and Financials
Growth Strategy

Video Enablement of the Web
8
Worldwide
U.S.
Source: Cisco Systems, eMarketer
69% 69% 70% 70% 70% 70%
32% 33% 35% 37% 38% 39%
2012 2013 2014 2015 2016 2017
Broadband Household Penetration Worldwide
1520
26
33
42
53
2012 2013 2014 2015 2016 2017
Online Video Traffic Worldwide
1000 Petabytes/ Month
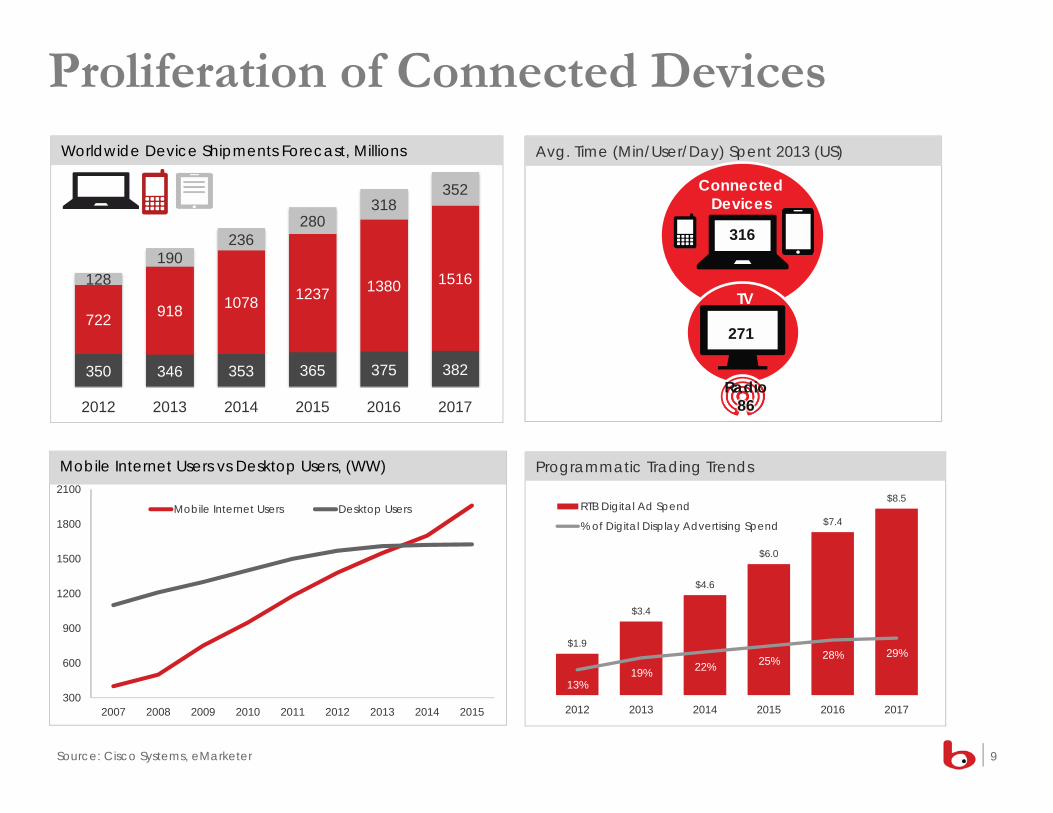
Proliferation of Connected Devices
9Source: Cisco Systems, eMarketer
Avg. Time (Min/User/Day) Spent 2013 (US)
350 346 353 365 375 382
722 918 1078 1237 1380 1516128190
236280
318352
2012 2013 2014 2015 2016 2017
Worldwide Device Shipments Forecast, Millions
300
600
900
1200
1500
1800
2100
2007 2008 2009 2010 2011 2012 2013 2014 2015
Mobile Internet Users Desktop Users
Mobile Internet Users vs Desktop Users, (WW)
$1.9
$3.4
$4.6
$6.0
$7.4
$8.5
13%19% 22% 25% 28% 29%
0%
10%
20%
30%
40%
50%
60%
70%
80%
90%
100%
$0.0
$1.0
$2.0
$3.0
$4.0
$5.0
$6.0
$7.0
$8.0
$9.0
2012 2013 2014 2015 2016 2017
RTB Digital Ad Spend
% of Digital Display Advertising Spend
Programmatic Trading Trends
316
86
271
TV
ConnectedDevices
Radio
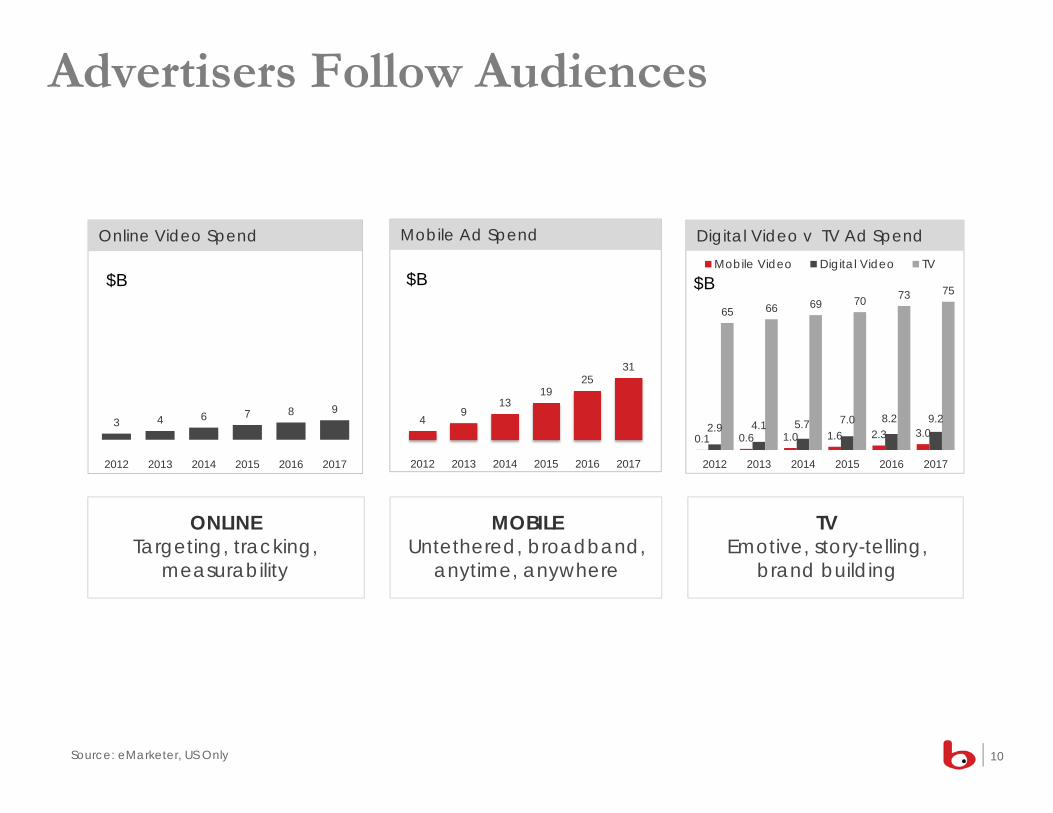
Advertisers Follow Audiences
10
ONLINETargeting, tracking,
measurability
TVEmotive, story-telling,
brand building
MOBILEUntethered, broadband,
anytime, anywhere
49
1319
2531
2012 2013 2014 2015 2016 2017
Mobile Ad Spend
$B
0.1 0.6 1.0 1.6 2.3 3.02.9 4.1 5.7 7.0 8.2 9.2
65 66 69 70 73 75
2012 2013 2014 2015 2016 2017
Mobile Video Digital Video TV
Digital Video v TV Ad Spend
$B
Source: eMarketer, US Only
3 4 6 7 8 9
2012 2013 2014 2015 2016 2017
Online Video Spend
$B

11
Agenda
Corporate Snapshot
Market Overview
Product and Technology
Business Model and Financials
Growth Strategy
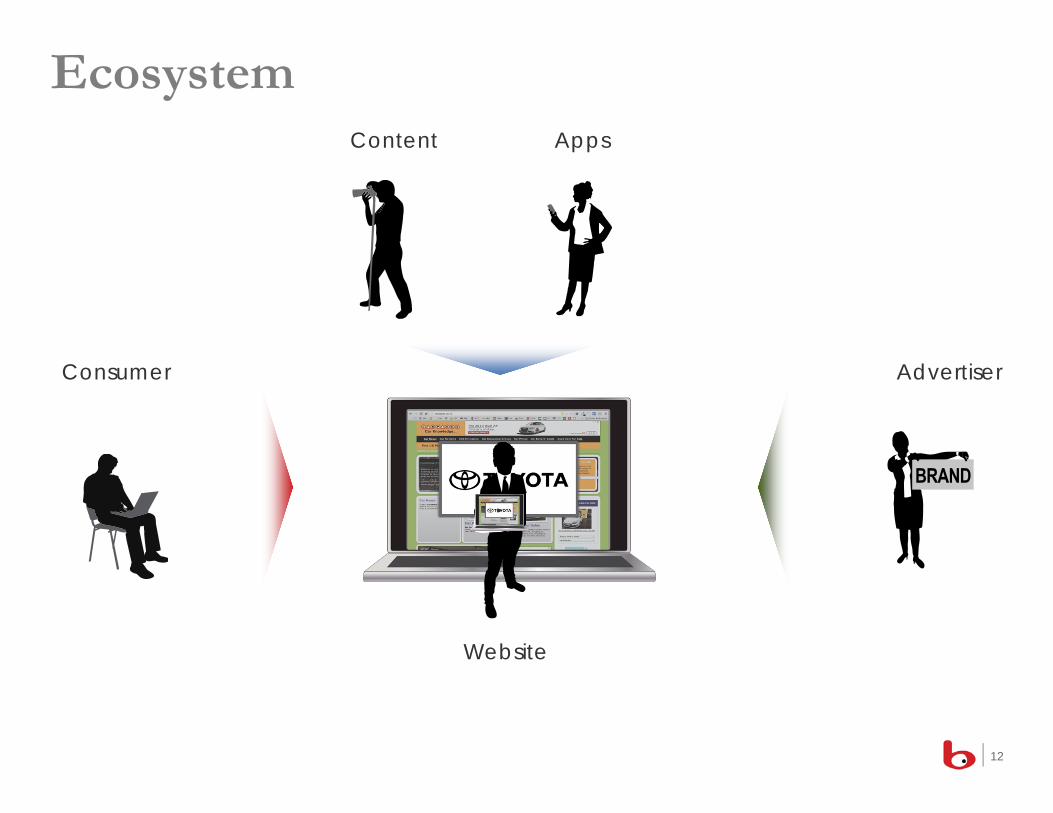
Ecosystem
12
Consumer Advertiser
Website
Content Apps

Value Flow
13
Content(Motortrend)
Consumers(You)
Advertisers(Toyota)
Web Publishers(CarPages.co.uk)
$$$
$Content
Atte
ntio
nC
onte
nt
Apps(CNBC)
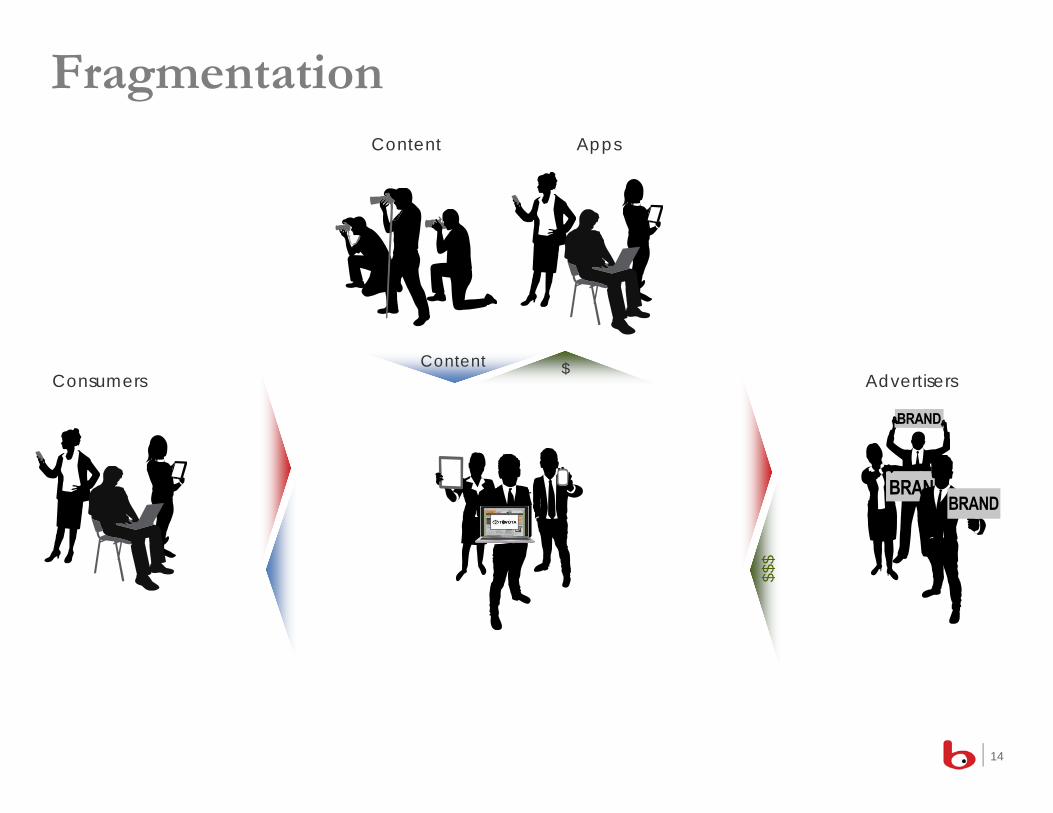
Fragmentation
14
Advertisers
Website
$$$
$Content
Atte
ntio
nC
onte
nt
Aud
ienc
e
Consumers
Content Apps

blinkx Engine
15
Content
Web Publishers Agencies
AD
AD
AD
Consumers Advertisers
Match consumers with content and ads millions of times a day in real time
Apps

blinkx Ecosystem
16
Content
Aggregators Agencies/PlatformsAudiences Advertisers
Search Discovery Syndication
Content Ads Audiences
Video Text Social Display Mobile
Apps

• Focus is on traffic filtering and optimization (B2B), not origination (B2C)
• Proprietary tools and technology for high-speed and volume trading in real time
• Advertisers and Partners are governed by agreed upon Terms & Conditions
• Campaigns typically verified by third parties for delivery and performance
• View-ability and verification are still in flux with no common standards
Standards & Protocols
17

Text v. Video Search
18
Text search engines miss the VIDEO in Video Searchblinkx actually WATCHES the video
Tesla Motors, Headquarter, Silicon Valley, Electric
October, 2013
Tags: Tesla, Electric, Silicon Valley
http://www.aol.com/video/translogic-3-tesla-motors-part-2/517141686/

TEXT ANALYSIS
Advanced textual analysis, page and site-level human design contextanalysis and visual spidering with support for over 200 video and audio metadata file formats
Continuous, speaker-independent, large vocabulary speech recognition. Neural Network and Hidden Markov Model-based acoustic language modelling
Visual Analysis: Real-time scene decomposition, On-screen Character and Facial Recognition, visual &metadata Closed-Caption extraction
IMAGE ANALYSISSPEECH ANALYSIS
Fallon SesameJimmyClassroomStreetroots
Context, Meaning and Relevance
19

20
Agenda
Corporate Snapshot
Market Overview
Product and Technology
Business Model and Financials
Growth Strategy

Business Model
21
Audience
Content
Advertisers
Licensed Indexed
Platform Traded
Search
blinkx
Syndicates
Display
Connected TV
Mobile
Monetisation
Conventional
Premium
I
Direct Sold
II
Opportunity

Historical Financials
-8-4 -5 -4
-8
-3
2
6
2
75
1715
H1'08
H2'08
H1'09
H2'09
H1'10
H2'10
H1'11
H2'11
H1'12
H2'12
H1'13
H2'13
H1'14
Operating Cash Flow, $MOperating Cash Flow, $MOperating Cash Flow, $M
1. Adjusted for share based compensation and other income22
1820
108
673
1
-5-5-3-4
-2
H1'14
H2'13
H1'13
H2'12
H1'12
H2'11
H1'11
H2'10
H1'10
H2'09
H1'09
H2'08
H1'08
Adjusted EBITDA1, $M
3 4 6 8 1321
2739
45
7082
116 112
H1'08
H2'08
H1'09
H2'09
H1'10
H2'10
H1'11
H2'11
H1'12
H2'12
H1'13
H2'13
H1'14
Revenue, $M
1517
8655
2
-2
-7-6
-3-4-7
H1'14
H2'13
H1'13
H2'12
H1'12
H2'11
H1'11
H2'10
H1'10
H2'09
H1'09
H2'08
H1'08
Adjusted PBT, $M
23
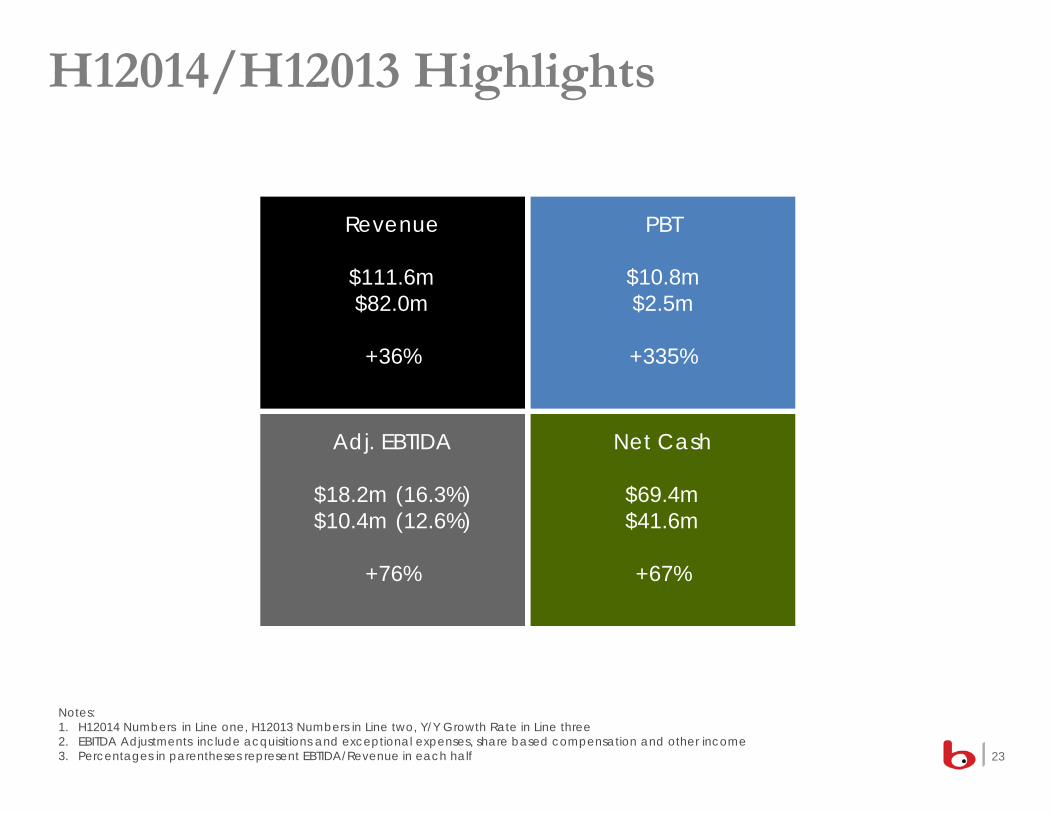
Revenue
$111.6m$82.0m
+36%
Adj. EBTIDA
$18.2m (16.3%)$10.4m (12.6%)
+76%
PBT
$10.8m $2.5m
+335%
Net Cash
$69.4m$41.6m
+67%
Notes: 1. H12014 Numbers in Line one, H12013 Numbers in Line two, Y/Y Growth Rate in Line three2. EBITDA Adjustments include acquisitions and exceptional expenses, share based compensation and other income3. Percentages in parentheses represent EBTIDA/Revenue in each half
H12014/H12013 Highlights
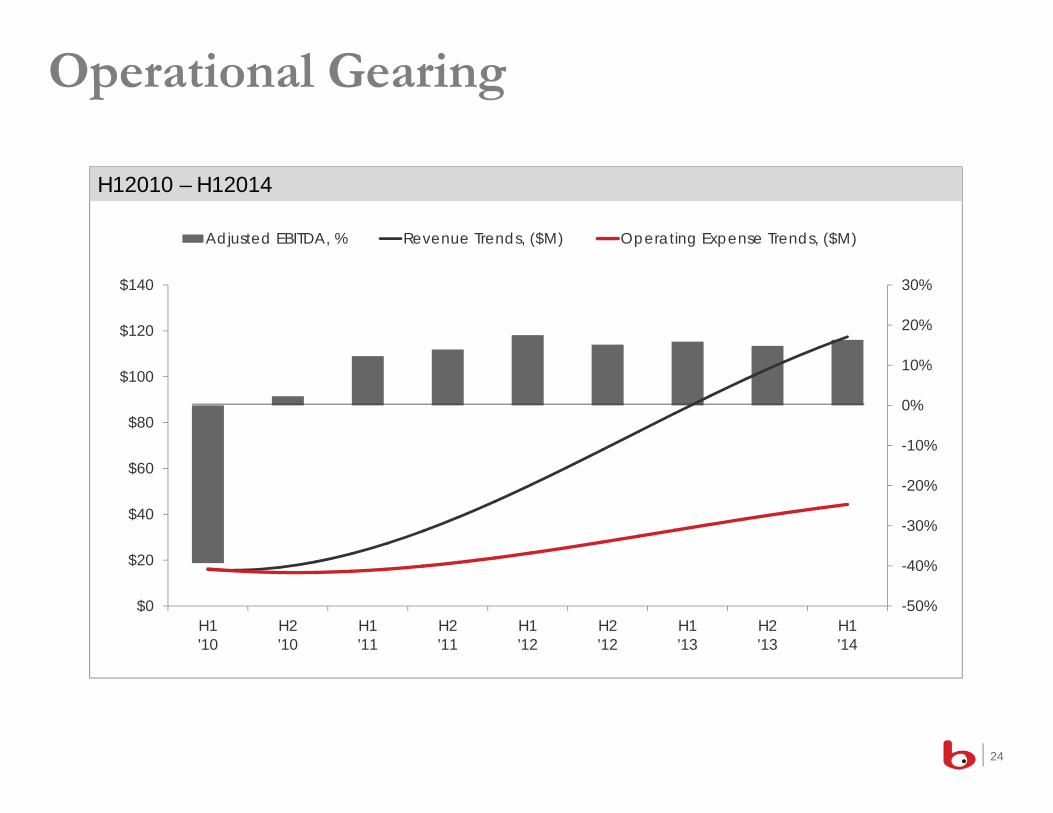
Operational Gearing
24
-50%
-40%
-30%
-20%
-10%
0%
10%
20%
30%
$0
$20
$40
$60
$80
$100
$120
$140
H1'10
H2'10
H1'11
H2'11
H1'12
H2'12
H1'13
H2'13
H1'14
Adjusted EBITDA, % Revenue Trends, ($M) Operating Expense Trends, ($M)
H12010 – H12014

55.9
69.4
H1 2014Beginning
cash
AdjustedEBITDA
Proceedsfrom issuance
of shares
Foreignexchange
InterestIncome
AcquistionRelated
CapitalizedExpenses
& PPE
TaxPayments
Workingcapital
H1 2014Ending cash
H12014 ($M)
18.23.4
1.8 0.1 (4.8)
(2.1)(2.0)
(1.1)
Cash Bridge
25

26
Agenda
Corporate Snapshot
Market Overview
Product and Technology
Business Model and Financials
Growth Strategy

27
Vision
Connect audiences, brands through premium content

Video Search
Search Syndication
Video Discovery
DiscoverySyndication
2004 2009 2011 2013 Future
Evolution
28
bVA
premium mobile video
PROGRAMMATIC INTEGRATIONS

Inorganic Growth
29
Relationships ☐ Build, Buy or Partner
Unified Advertising Technology Platform
Common Data Management Platform
Cross Platform Reporting and Analytics Engine
Existing Assets R&D investments
DEMANDSUPPLY
Sell Side Ad Technology Buy Side Ad Technology
ExchangeSSPAd NetworkPublisher DSP Trading Desk Agency
Con
sum
er
Ad
verti
ser
Capability
Technology Stack
Note: Illustrative, based on blinkx perspective

ACQUI-HIRE• Mobile
• Ad-Technology
• Data/Analytics
ACCELERATE• Mobile
• Video
• Geography
EXPAND• Mobile
• Video
• Programmatic
30
premium mobile video
M&A Focus

M&A Process
31
Strategy
Financials
CultureExecution
Integration

M&A History
32
premium mobile video
Apr 2009 May 2011 Nov 2011 Aug 2013 Dec 2013
Structure
Purchase of certain net assets from the ZangoCompanies from a consortium of financial institutions in a foreclosure sale
Stock Purchase Stock PurchasePurchase of certain net assets from Grab Networks Holdings Inc.
Stock Purchase
ProductsApp development, licensing, distribution and monetization platform
Display and rich media advertising network for long-tailindependent web publishers
Self service, auction based performance ad network (AdOn), digital agency (PrimeVisibility)
Video content syndication, distribution and audience extensionplatform
Ultra Premium, brand focused mobile video technology and adplatform
RationaleExpand supply of organic, owned and operated audiences and apps
Expand supply of audiences from long tail publishers for new video audience
Expand scale, scopeand reach ofaudiences, new products and services
Accelerate video content syndication monetization audience extension
Extend desktop offerings into mobilecontent, technology, advertising at scale

Recent Acquisitions
33
CONTENT
PUBLISHERS
ADVERTISERS
Premium, Mobile Video Technology and Advertising Technology Platform
Premium, Mobile Video Technology and Advertising Technology Platform
Leading Video Content Syndication and Distribution Platform
Leading Video Content Syndication and Distribution Platform

Rhythm New Media
34
1. Rhythm estimate based on comScore data & Rhythm’s Q412 Insights Report and first party publisher data2. Rhythm estimate based on first party publisher data Standardized measurement of In-Stream video completion.
Scale74m Uniques/Month
Reach100% Transparency/Site Selection
Scope200+ Ultra-Premium Apps
PerformancePremium, In stream Mobile Video
premium mobile video
74MM
- indicates rhythm partner1
Blind,Long-Tail
Transparent,Premium
In BannerVideo
In StreamVideo

Conclusions
35
• Technology pioneer with unique strengths and assets in digital video
• Booming segment of a robust sector with demonstrated growth and potential
• Profitable, disciplined revenue growth with strong cash conversion
• Product and technology diversification provide scale, scope and reach
• Expanding universe of inorganic and organic growth opportunities
• Connect audiences, brands through premium content across four screens