"Annual Report and Financial Statements for the Period...
48
blinkx plc Annual Report and Financial Statements for the Period Ended 31 March 2010 Company number: 06223359
Transcript of "Annual Report and Financial Statements for the Period...

blin
kx p
lcAn
nual
Repo
rt an
d Fi
nanc
ial S
tate
men
ts fo
r the
Per
iod
Ende
d 31
Mar
ch 2
010
Company number: 06223359

Table of Contents CEO’s Report …………………………………………………………………………………… 3
Board of Directors 4
Directors’ Report 6
Corporate Governance 11
Directors’ Responsibilities Statement 12
Independent Auditors’ Report to the Members of blinkx plc 13
Consolidated Income Statement 15
Consolidated Statement of Comprehensive Income 15
Consolidated Balance Sheet 16
Consolidated Statement of Changes in Equity 17
Consolidated Cash Flow Statement 18
Notes to the Consolidated Financial Statements 19
Company Balance Sheet 39
Company Statement of Changes in Equity 40
Company Cash Flow Statement 41
Notes to the Company Only Financial Statements 42
Shareholder Information and Advisors 46
………………………………………………………………………………
………………………………………………………………………………
…………………………………………………………………………
…………………………………………………………
………………………………………
………………………………………………………………
………………………………………………
……………………………………………………………………
……………………………………………………
……………………………………………………………
…………………………………………………
………………………………………………………………………
………………………………………………………
………………………………………………………………
………………………………………………
…………………………………………………………


3
CEO’s Report
Dear Investor, I am pleased to report another exceptional performance this year. While the full year financial results were excellent, our second half was nothing short of transformational as the business moved into EBITDA positive territory, ahead of expectations. Over the past 12 months, blinkx consistently demonstrated robust growth, defying macro industry trends. We increased revenue by more than 140%, and gross profit by 123%, despite the challenging economic environment. Furthermore, revenue and gross profit in the second half grew almost 60% over the first half, while operating expenses dropped in the second half as compared to the first. As a result, operating margin improved, net losses narrowed and the company was profitable on an EBITDA basis in the second half. Despite the downturn, we achieved these milestones ahead of schedule and analyst expectations. This remarkable accomplishment was driven by the success of our unique advertising platform, which delivers targeted, ROI-guaranteed, brand advertising in online video, and has enjoyed widespread adoption by over 800 global brands. Fiscal Year 2010 achievements include: » Results ahead of analyst consensus on all key metrics including top line revenue and gross profit » For the year:
» Revenue increased over 140% from FY2009 to $33.7m » Gross profit up 123% to $21.9m from FY2009 » DSO improved to 65 days from 83 days for FY2009
» For the second half of 2010: » EBITDA of $0.03m, compared with LBITDA of $5.85m in first half » Revenue of $20.6m, a 57% increase from the first half » Gross profit of $13.4m, a 58% increase from the first half » Cash used by operating activities of $2.5m, compared with $8.1m in first half
» Video streams in the UK and US grew by 186% (comScore) » Daily Video Search run rate increased over 169% to 22.6 million searches per day in March 2010, from 8.4 million per day in March 2009 » Repeat campaign bookings grew by 193% compared to FY2009 in addition to strong increase of 112% in brands advertising with blinkx » New, expanded distribution agreements with top partners, including Ask, ITN and ELO » Successful beta launch of Cheep, blinkx’s first transaction hijacking product
Since my last report, blinkx’s traffic has surged 204% in the UK, making us the second fastest growing video site after Facebook, according to comScore. Moreover, the number of videos viewed over the Internet in the UK has shot up 37% over the same time period. This powerful groundswell towards online video underscores the strength and vitality of our business model. blinkx’s aggressive audience growth, breaking into both comScore and Nielsen’s Top 10 Video Sites, combined with our top-tier content partnerships, has enabled our business to flourish over the period, and we achieved a 112% increase in the number of brands advertising with us. We continued to attract leading brand advertisers, including Coca Cola, Virgin and Toyota, while maintaining consistently high CPMs (Cost Per Mille), through the effectiveness of our unique Contextual Advertising platform, blinkx AdHoc. Online video is the fastest growing sector in advertising, and we expect to further accelerate the growth of our business based on this momentum. In addition, blinkx made significant progress on the product and business development fronts during the period. The strength of our technology has enabled us to forge new distribution deals with many of our top partners, including providing video search for Ask.com, powering advertising for the ITN Premium News Network, and building a broadband TV offering for Brazilian media giant ELO. We also recently partnered with Mobica to bring blinkx video channels to mobile devices. In conclusion: since our IPO, the blinkx team has built strong foundations for the business; a portfolio of consumer products, the AdHoc advertising platform, and our network of over 720 content partners and top-tier distribution partners. As a result, while we remain mindful of the macroeconomic environment, we see 2010 as a year of tremendous promise, because blinkx is now well positioned in one of the fastest growing segments of the media sector. Having reached profitability on an EBITDA basis and after making infrastructure investments early in the year, the business is now positioned to capitalise on this market momentum and drive increased profitability from growing revenue. Suranga ChandratillakeCEO and Founder blinkx 29 July 2010

4
Board of Directors
The Directors of blinkx are as follows Name Age Position Anthony Bettencourt 49 Non-executive Chairman Suranga Chandratillake 32 Chief Executive Officer Dr Michael Lynch 45 Non-executive Director Mark Opzoomer 53 Non-executive Director Anthony Bettencourt, Non-executive Chairman Anthony Bettencourt is currently the non-executive chairman of blinkx plc., the world's largest video search engine on the Internet. Previously, Anthony served as Chief Executive Officer of Autonomy Interwoven and Autonomy ZANTAZ. Prior to that, he was the Chief Executive Officer of Verity, Inc, where he was responsible for growing the business from $15m in annual revenues to more than $140m from 1995 to 2006, resulting in Verity's agreeing to be acquired for more than $500m at the end of 2005. In 2005, he was awarded the prestigious Ernst & Young Entrepreneur of the Year award for software and technology in the Silicon Valley . Anthony serves on the advisory board for Santa Clara University's Center for Science, Technology and Society, as well as serving as a judge for the Tech Awards and a mentor for Santa Clara University 's Global Social Benefit Incubator program. He serves on the board of directors of NetBase, Next Page, Alameda County Community Food Bank and is an independent advisor to the board of Autonomy, Inc. Anthony earned a B.A. in English from Santa Clara University in 2006.
Suranga Chandratillake, Chief Executive Officer A technology entrepreneur with over a decade of experience in next-generation search, Suranga Chandratillake founded blinkx in 2004 and launched the company in 2005. After early success, Suranga took the company public on the AIM market of the London Stock Exchange in May 2007. Prior to founding blinkx, Suranga was U.S. CTO of Autonomy, responsible for growing Autonomy’s research and development division in the United States. Before joining Autonomy, Suranga held a variety of roles in technology, sales and marketing at Morgan Stanley, netdecisions and anondesign. Suranga received his MA in Computer Science from the University of Cambridge. A highly regarded expert on the convergence of the Web and TV, including the future of television, interactive TV and online advertising, Suranga is often invited to speak at leading industry events including Financial Times’ Digital Media Conference, Cannes Lions International Advertising Festival and Monaco Media Forum. Named a Young Global Leader Honoree in 2009 by the World Economic Forum, Suranga has also been recognised as one of the top 10 leaders in Science and Innovation by The Observer’s Future 500 list, and one of Digital Media Wire’s “25 Executives to Watch in Digital Entertainment”.
Dr Michael Lynch, Non-executive Director Dr. Mike Lynch, OBE, founded Autonomy in 1996 and rapidly established the company’s reputation as the world’s leading provider of infrastructure software for unstructured information and meaning-based technologies. Prior to this, Mike Lynch founded and ran Neurodynamics where much of Autonomy’s proprietary technology was developed. December 2005 saw Autonomy’s $500 million acquisition of former competitor Verity which consolidated Autonomy’s position as number one in the market and last year Autonomy posted record revenues and profits in what he described as a transformational year. Mike is a past winner of the CBI’s Entrepreneur of the Year Award and was recently appointed a Non-Executive Director of the BBC. He studied Electrical and Information Sciences at Cambridge and received a Ph.D. in adaptive techniques in signal processing and connectionist models, as well as a research fellowship in adaptive pattern recognition. He holds the Institute of Electrical Engineers’ medal for Outstanding Achievement.

5
Mark Opzoomer, Non-executive Director Mark Opzoomer has extensive knowledge of Internet, communications and media markets in many different countries and 24 years of corporate operating and deal-making experience. He is currently co-founder of Zattikka Limited, a social, browser and mobile games publisher. Mark was previously non-executive director, then CEO of Rambler Media Limited, Moscow, 2005 through 2009. He was the Managing Director and Regional Vice President of Yahoo! Europe from July 2001 to December 2003, where he successfully restored growth and profitability. Prior to joining Yahoo! Europe, Mark was Deputy Chief Executive of Hodder Headline plc, an LSE -listed book publishing company, and previously Commercial and Finance Director of Sega Europe Ltd and Commercial Director of Virgin Communications Ltd. Since 2003, Mark has been a private consultant, non-executive director on the boards of several companies which currently include Newbay Software Limited, Entertainment One Limited, and Forward Internet Group and is a founding partner of Bond Capital Partners. Mark was a director of Autonomy from June 2003 to October 2004. Mark is a chartered accountant, has an MBA (IMD Lausanne), and has also completed the London and Wharton business school programme for public company directors.
6
Directors’ Report
The Directors present their annual report on the affairs of the Group and the financial statements for the year ended 31 March 2010.
Principal activity The principal activity of the Group comprises the provision of video search and advertising services on the internet. The Company’s principal activity is that of a holding company. The subsidiary and associated undertakings principally affecting the profits or net assets of the Group in the year are listed in note 29 to the financial statements.
Review of Developments and 2010 results Results of the Group shown in the consolidated income statement, beginning on page 15. Revenue for the year was $33.7 million (2009: $13.9m) and net loss was $8.5 m (2009: $8.9m loss). The Enhanced Business Review below provides further comments on the developments and the results for the year.
Enhanced Business Review The Directors’ Report should be read in conjunction with the CEO’s Report which gives details of the Group’s performance during the period and expected future developments. A summary of the Group’s key performance indicators is provided below:
Financial Non Financial
2010 2009 2010 2009
Revenue $33.7m $13.9m Headcount at 31 March 108 ees 57 ees
Gross margin % 65% 71% Peak number of daily
searches
Over 22
million
Over 7
million
Net Loss $8.5m $8.9m
Cash and cash equivalents $14.6m $21.4m
R&D spend $11.1m $4.5m
Net assets $25.5m $24.2m
Key Performance Indicators Financial and non-financial key performance indicators (“KPIs”) are addressed in the table above. These KPIs are reviewed by the management and the Board of Directors on a regular basis. The Directors have in place a process of regularly reviewing risks to the business and monitoring associated controls, actions and contingency plans. A summary of the Group’s principal risks and uncertainties is provided at page 8 of the Directors’ Report.
Dividends The Directors do not recommend the payment of a dividend (2009: $nil). The Group’s current policy, which is kept under regular review, is to retain future earnings for the development and expansion of the business.

7
Financial Instruments In relation to the use of financial instruments, the Directors’ objectives are to minimise risk whilst achieving maximum return on liquid assets. The Directors are averse to principal loss and manage the safety and preservation of the Group’s invested funds by limiting default and market risks by investing with highly rated financial institutions. The Group’s investment portfolio is comprised entirely of cash and cash equivalents. The Group does not use derivative financial instruments. The Group has not faced any material exposure to price risk, credit risk, liquidity risk or cash flow risk that would effect the ultimate objectives of the business. See note 24. Further information about the Group’s assets and liabilities is provided in the notes to the financial statements.
Capital Structure Details of the issued share capital, together with details of the movements in the Company’s issued share capital during the year are shown in note 19. The Company has one class of ordinary shares which carry no right to fixed income. Each share carries the right to one vote at general meetings of the Company. There are no specific restrictions on the size of a holding nor on the transfer of shares, which are both governed by the general provisions of the Articles of Association and prevailing legislation. The Directors are not aware of any agreements between holders of the Company’s shares that may result in restrictions on the transfer of securities or on voting rights. Details of employee share schemes are set out in note 22. No person has any special rights of control over the Company’s share capital and all issued shares are fully paid. With regard to the appointment and replacement of Directors, the Company is governed by its Articles of Association, the Companies Acts and related legislation. The Articles themselves may be amended by special resolution of the shareholders.
Future Developments The Group’s stated objective is to establish the Group and its technology as the leader in the search, discovery, monetisation and distribution of online television and video. To achieve this goal the Group intends to continue to develop the technology and release new products in these areas and increase market penetration by signing new customers and expanding its relationship with existing customers. Directors The Directors who served throughout the period to 31 March 2010 and to the date of this report were: Anthony Bettencourt; Michael Lynch; Mark Opzoomer; and Suranga Chandratillake.
Re-election of Directors The Company’s articles of association require at least one third of the Directors to be subject to re-election at each Annual General Meeting. Michael Lynch will stand for re-election at the next Annual General Meeting.
Directors’ responsibilities statement A statement of Directors’ responsibilities is set out on page 12.
Directors’ indemnities The Group has made qualifying third party indemnity provisions for the benefit of its Directors which remain in force at the date of this report.

8
Supplier payment policy The Group’s policy is to establish terms of payment with suppliers when agreeing the terms of each transaction, ensure that suppliers are made aware of the terms of payment and to abide by the terms of payment. Trade creditors of the Group at 31 March 2010 were equivalent to 38 days’ purchases (2009: 21 days).
Critical risks and uncertainties The risks to which the business is exposed are summarised below: » Our business depends on our core technology and we will continue to develop both the technology and its applications in the consumer space. Technology which significantly competes with our technology or any material claims against our technology would present a material risk to the Group; » If there is a negative change in economic and market conditions, this could impact on the growth of the business; » Being unable to retain key customers could have a negative impact on the business; » Being unable to hire and retain adequately qualified personnel could negatively impact on the continued growth and development of the business; » The adoption of some form of net neutrality legislation where Internet Service Providers may slow or restrict access to certain content, applications or services that in relation to rich media content results in additional charges for users or impacts users’ ability to access this type of content; » Significant competition from Google, AOL, Yahoo and other internet service companies and destination websites; » Interruptions of services from our bandwidth providers, data centres, electricity providers and service providers; and » We have a license from Autonomy for consumer applications of its IDOL technology platform that is exclusive through 22 May 2012. Failure to build competitive advantage and create additional barriers to entry through our own development of our own intellectual property during this period could result in other companies licensing Autonomy’s technology for consumer applications and developing technology and product offerings which could compete with blinkx and impact our overall market position. The processes to identify and manage the key risks to the success of the Group are an integral part of the internal control environment. Further information on the financial risks faced by the Group can be found in note 24 of the financial statements.
Substantial shareholdings On 29 July 2010, the Company had been notified of the following voting rights as a shareholder of the Company. Number shares %
Autonomy Corporation Plc 42,497,166 13.8
Standard Life Investments Limited 27,989,934 9.1
Michael Lynch 23,252,712 7.5
Charitable and political donations The Group did not make any charitable or political donations during the year or preceding year.

9
Directors’ remuneration - audited The total amount of Directors’ remuneration was as follows: 2010
$ 2009
$
Emoluments 574,000 493,000
Remuneration of the Directors was as follows: 2010
$
2009
$
Anthony Bettencourt 56,000 60,000
Suranga Chandratillake 406,000 313,000
Michael Lynch 56,000 60,000
Mark Opzoomer 56,000 60,000
Details of share options granted to the Directors are set out below. No Directors’ share options were cancelled or lapsed, or changed, during the year. Vesting and exercise of options is subject to continued employment. At 31 March 2009
Number Granted Number
Exercised Number
At 31 March 2010 Number
Suranga Chandratillake 3,502,571 990,000 - 4,492,571 Michael Lynch 35,248 - - 35,248 None of the Directors have pension, retirement or similar entitlement. No payment or awards were made to former Directors during the period.
Going concern The directors have considered the financial resources of the Group and the risks associated with doing business in the current economic climate environment, including the principal risks and uncertainties disclosed on page 8 of the Directors’ report, and believe the Group is well placed to manage these risks successfully. In doing this they have prepared a business plan and cash flow forecast setting out key business assumptions, including the rate of revenue growth, margins and cost control. The directors have considered these assumptions to be reasonable and that the Group has adequate resources to continue in operational existence for the foreseeable future. Accordingly, they continue to adopt the going concern basis in preparing these financial statements.

10
Auditors Each of the persons who is a Director at the date of approval of this annual report confirms that: » so far as the Director is aware, there is no relevant audit information of which the Company’s auditors are unaware; and » the Director has taken all the steps that he ought to have taken as a Director in order to make himself aware of any relevant audit information and to establish that the Company’s auditors are aware of that information. This confirmation is given and should be interpreted in accordance with the provisions of s418 of the Companies Act 2006. A resolution to reappoint Deloitte LLP as the Company’s auditors will be proposed at he Annual General Meeting. On behalf of the Board Suranga Chandratillake Founder and Chief Executive Officer 29 July 2010 Registered office: Cambridge Business Park, Cowley Road, Cambridge Registered number: 06223359

11
Corporate Governance Whilst companies whose shares are listed on AIM are not formally required to comply with the UK Corporate Governance Code (“the Code”), the Board of Directors attempts to support the Code and complies in some areas where it considers it appropriate to do so, given both the size and resources available to the Group. The Board is committed to ensuring that high standards of corporate governance are maintained. There is a clear division of responsibility between the Chairman and the Chief Executive Officer. At 31 March 2010 the Board comprised four Directors, three of whom were Non-Executive Directors. The Non-Executive Directors do not have any day to day involvement in the running of the business. The Board is responsible for overall strategy, the policy and decision making framework in which this strategy is implemented, approval of budgets, monitoring performance, and risk management. The Board meets at regular scheduled intervals and follows a formal agenda; it also meets as and when required. The Directors may take independent professional advice at the Group’s expense.
Board Committees The Group has an Audit Committee, a Nominations Committee and a Remuneration Committee, each consisting of all non-executive Directors. Each committee has written terms of delegated responsibilities.
Relationships with Shareholders The Board understands the need for clear communications with its shareholders. In addition to presentations after publication of results and the Annual General Meeting, meetings are held with fund managers, analysts, and institutional investors. Information is posted on the Group’s web site, www.blinkx.com, which contains a comprehensive Investor Relations section.

Directors’ Responsibilities Statement The directors are responsible for preparing the Annual Report and the financial statements in accordance with applicable law and regulations. Company law requires the directors to prepare financial statements for each financial year. Under that law the directors are required to prepare the group financial statements in accordance with International Financial Reporting Standards (IFRSs) as adopted by the European Union and have also chosen to prepare the parent company financial statements under IFRSs as adopted by the EU. Under company law the directors must not approve the accounts unless they are satisfied that they give a true and fair view of the state of affairs of the company and of the profit or loss of the company for that period. In preparing these financial statements, International Accounting Standard 1 requires that directors: » properly select and apply accounting policies; » present information, including accounting policies, in a manner that provides relevant, reliable, comparable and
understandable information; » provide additional disclosures when compliance with the specific requirements in IFRSs are insufficient to enable users to
understand the impact of particular transactions, other events and conditions on the entity's financial position and financial performance; and
» make an assessment of the company's ability to continue as a going concern. The directors are responsible for keeping adequate accounting records that are sufficient to show and explain the company's transactions and disclose with reasonable accuracy at any time the financial position of the company and enable them to ensure that the financial statements comply with the Companies Act 2006. They are also responsible for safeguarding the assets of the company and hence for taking reasonable steps for the prevention and detection of fraud and other irregularities. The directors are responsible for the maintenance and integrity of the corporate and financial information included on the company's website. Legislation in the United Kingdom governing the preparation and dissemination of financial statements may differ from legislation in other jurisdictions. By order of the Board
12
13
Independent Auditors’ Report to the Members of blinkx plc We have audited the financial statements of blinkx plc for the year ended 31 March 2010 which comprise the Consolidated Income Statement, the Consolidated Statement of Comprehensive Income, the Consolidated and Company Balance Sheets, the Consolidated and Company Statement of Changes in Equity the Consolidated and Company Cash Flow Statements and the related notes 1 to 38. The financial reporting framework that has been applied in their preparation is applicable law and International Financial Reporting Standards (IFRSs) as adopted by the European Union and as applied in accordance with the provisions of the Companies Act 2006. This report is made solely to the company’s members, as a body, in accordance with Chapter 3 of Part 16 of the Companies Act 2006. Our audit work has been undertaken so that we might state to the company’s members those matters we are required to state to them in an auditors’ report and for no other purpose. To the fullest extent permitted by law, we do not accept or assume responsibility to anyone other than the company and the company’s members as a body, for our audit work, for this report, or for the opinions we have formed. Respective responsibilities of directors and auditors As explained more fully in the Directors’ Responsibilities Statement, the directors are responsible for the preparation of the financial statements and for being satisfied that they give a true and fair view. Our responsibility is to audit the financial statements in accordance with applicable law and International Standards on Auditing (UK and Ireland). Those standards require us to comply with the Auditing Practices Board’s (APB’s) Ethical Standards for Auditors. Scope of the audit of the financial statements An audit involves obtaining evidence about the amounts and disclosures in the financial statements sufficient to give reasonable assurance that the financial statements are free from material misstatement, whether caused by fraud or error. This includes an assessment of: whether the accounting policies are appropriate to the group’s and the parent company’s circumstances and have been consistently applied and adequately disclosed; the reasonableness of significant accounting estimates made by the directors; and the overall presentation of the financial statements. Opinion on financial statements In our opinion: » the financial statements give a true and fair view of the state of the group’s and the parent company’s affairs as at 31
March 2010 of the group’s loss for the year then ended; » the group financial statements have been properly prepared in accordance with IFRSs as adopted by the European Union; » the parent company financial statements have been properly prepared in accordance with IFRSs as adopted by the
European Union and as applied in accordance with the provisions of the Companies Act 2006; and » the financial statements have been prepared in accordance with the requirements of the Companies Act 2006. Opinion on other matter prescribed by the Companies Act 2006 In our opinion: » the information given in the Directors’ Report for the financial year for which the financial statements are prepared is
consistent with the financial statements.

14
Matters on which we are required to report by exception We have nothing to report in respect of the following matters where the Companies Act 2006 requires us to report to you if, in our opinion: Under the Companies Act 2006 we are required to report to you if, in our opinion: » adequate accounting records have not been kept by the parent company, or returns adequate for our audit have not been
received from branches not visited by us; or » the parent company financial statements are not in agreement with the accounting records and returns; or » certain disclosures of directors’ remuneration specified by law are not made; or » we have not received all the information and explanations we require for our audit. Richard Knights (Senior Statutory Auditor) for and on behalf of Deloitte LLP Chartered Accountants and Statutory Auditors Cambridge, United Kingdom 3 August 2010

15
Consolidated Income Statement for the Year ended 31 March 2010
Notes
Year ended 31 March
2010
Year ended 31 March
2009
$'000 $'000
Revenue: continuing operations 5 33,664 13,933
Cost of revenue (11,737) (4,102)
Gross profit 21,927 9,831
Operating expenses
Research and development (10,610) (4,526)
Sales and marketing (17,810) (13,952)
Administrative expenses (2,461) (1,810)
Loss from operations (8,954) (10,457)
Investment revenue 9 40 1,127
Loss before taxation (8,914) (9,330)
Tax 10 399 459
Loss for the year attributable to equity holders of the parent
6 (8,515)
(8,871)
Loss per share (cents) Cents Cents
Basic and diluted 11 (2.94) (3.19)
Consolidated Statement of Comprehensive Income for the Year ended 31 March 2010
Notes
Year ended 31 March
2010
Year ended 31 March
2009
$'000 $'000
Loss for the year 6 (8,515) (8,871) Exchange difference on translation of foreign operations 703 (9,632)
Total comprehensive income for the year (7,812) (18,503)

16
Consolidated Balance Sheet at 31 March 2010
Notes As at 31
March 2010 As at 31
March 2009
$'000 $'000
ASSETS
Non-current assets
Goodwill 12 2,417 -
Intangible assets 13 4,126 1,862
Property, plant and equipment 14 592 486
Other receivables 16 385 426
7,520 2,774
Current assets
Trade receivables 16 5,998 3,181
Other receivables 16 2,874 1,827
Cash and cash equivalents 16 14,579 21,366
23,451 26,374
Total assets 30,971 29,148
LIABILITIES
Current liabilities
Trade and other payables 18 (5,246) (4,520)
Non-current liabilities
Other payables 18 (222) (426)
Total liabilities (5,468) (4,946)
Net assets 25,503 24,202
Shareholders' equity Share capital 19 5,964 5,487
Share premium account 20 56,345 49,126
Stock compensation reserve 9,280 7,863
Currency translation reserve (8,413) (9,116)
Merger reserve (4,323) (4,323)
Retained earnings (33,350) (24,835)
Total equity 25,503 24,202
The financial statements of blinkx plc (registered number 06223359) were approved by the Board of Directors and authorised for issue on 29 July 2010. They were signed on its behalf by: Suranga Chandratillake Founder and Chief Executive Officer

17
Consolidated Statement of Changes in Equity for the Year ended 31 March 2010
Ordinary Share Stock Currency
share premium compensation translation
capital account reserve reserve Sub-total
$'000 $'000 $'000 $'000 $'000
Balance as at 1 April 2008 5,483 49,126 6,429 516 61,554
Net loss for the year - - - - -
Other comprehensive income - - - (9,632) (9,632) Total comprehensive income for the year - - - (9,632) (9,632)
Issue of shares 4 - - - 4
Share based payments - - 1,434 - 1,434
Balance as at 1 April 2009 5,487 49,126 7,863 (9,116) 53,360
Net loss for the year - - - - -
Other comprehensive income - - - 703 703 Total comprehensive income for the year - - - 703 703
Issue of shares, net of costs 477 7,219 - - 7,696
Share based payments - - 1,417 - 1,417
Balance as at 31 March 2010 5,964 56,345 9,280 (8,413) 63,176
Sub-total Merger Retained forwarded reserve earnings Total
$'000 $'000 $'000 $'000
Balance as at 1 April 2008 61,554 (4,323) (15,964) 41,267
Net loss for the year - - (8,871) (8,871)
Other comprehensive income (9,632) - - (9,632) Total comprehensive income for the year (9,632) - (8,871) (18,503)
Issue of shares 4 - - 4
Share based payments 1,434 - - 1,434
Balance as at 1 April 2009 53,360 (4,323) (24,835) 24,202
Net loss for the year - - (8,515) (8,515)
Other comprehensive income 703 - - 703 Total comprehensive income for the year 703 - (8,515) (7,812)
Issue of shares, net of costs 7,696 - - 7,696
Share based payments 1,417 - - 1,417
Balance as at 31 March 2010 63,176 (4,323) (33,350) 25,503

18
Consolidated Cash Flow Statement for the Year ended 31 March 2010
Notes
Year ended 31 March
2010
Year ended 31 March
2009 $'000 $'000 CASH FLOWS FROM OPERATING ACTIVITIES Loss from operations (8,954) (10,457) Adjustments for: Depreciation and amortisation 3,133 308 Share based payments 1,417 1,434 Foreign exchange gains (545) (313)
Operating cash flows before movements in working capital (4,949) (9,028) Changes in operating assets and liabilities: Increase in trade and other receivables (587) (3,333) (Decrease) / increase in trade and other payables (5,064) 2,924 Cash used in operations (10,600) (9,437)
Income taxes received - 257
Net cash used in operating activities (10,600) (9,180)
CASH FLOWS FROM INVESTING ACTIVITIES Interest received 40 1,127 Purchase of property, plant and equipment and intangible assets (936) (702) Cash paid to purchase net assets, net of cash acquired (3,928) - Costs incurred to purchase net assets (305) - Net cash (used in) / generated by investing activities (5,129) 425
CASHFLOWS FROM FINANCING ACTIVITIES
Proceeds from issuance of shares, net of costs 7,696 4 Net cash generated by financing activities 7,696 4
Net decrease in cash and cash equivalents (8,033) (8,751)
Beginning cash and cash equivalents 21,366 39,436 Effect of foreign exchange on cash and cash equivalents 1,246 (9,319) Ending cash and cash equivalents 16 14,579 21,366
19
Notes to the Consolidated Financial Statements Year Ended 31 March 2010
1. General information blinkx plc is a Company incorporated in England and Wales under the Companies Act. The address of the registered office is Cambridge Business Park, Cowley Road, Cambridge, CB4 0WZ. The nature of the Group’s operations and its principal activities are set out on page 6. The Company’s functional currency is sterling as that is the currency of the primary economic environment in which the Company operates. The presentational currency is US dollar as that is the currency of the primary economic environment in which the Group operates. Foreign operations are included in accordance with policies set out in note 3.
2. Adoption of new and revised Standards In the current year, the following new and revised Standards and Interpretations have been adopted and have affected the amounts reported in these financial statements. Standards affecting presentation and disclosure IAS 1 (revised 2007) IAS 1 (2007) has introduced a number of changes in the format and content of
the financial statements. Under IAS1 (revised) the Company has included a statement of comprehensive income for the years ended 31 March 2009 and 2010. The revision has no impact on the balance sheets for 2010, 2009 or 2008. The 2008 balance sheet is available in the 2008 annual report, which is available on the Company’s website at www.blinkx.com under the heading ‘Investors’.
IFRS 8 Operating segments IFRS 8 is a disclosure Standard that has not led to any redesignation of the Group’s reportable segments.
Improving Disclosures about Financial Instruments (amendments to IFRS 7 Financial Instruments: Disclosures)
The amendments to IFRS 7 expand the disclosures required in respect of fair value measurements and liquidity risks. The Group has elected not to provide comparative information for these expanded disclosures in the current year in accordance with the transitional reliefs offered in these amendments.
At the date of authorisation of these financial statements, the following Standards and Interpretations which have not yet been applied in these financial statements were in issue but not yet effective (and in some cases, had not yet been adopted by the EU):
Amendment to IFRS 1 (Jan. 2010) Limited Exemption from Comparative IFRS 7 Disclosures for First-time Adopters IFRS 9 Financial Instruments IAS 24 (revised Nov. 2009) Related Party Disclosures Amendment to IAS 32 (Oct. 2009) Classification of Rights Issues Amendments to IFRS 1 (Jul. 2009) Additional Exemptions for First-time Adopters Amendments to IFRS 2 (Jun. 2009) Group Cash-settled Share-based Payment Transactions IFRS 1 (revised Nov. 2008) First-time Adoption of International Financial Reporting Standards IFRS 3 (revised Jan. 2008) Business Combinations Amendments to IAS 27 (Jan. 2008) Consolidated and Separate Financial Statements Amendment to IAS 39 (Jul. 2008) Eligible Hedged Items Amendments to IFRIC 14 (Nov. 2009) Prepayments of a Minimum Funding Requirement IFRIC 19 Extinguishing Financial Liabilities with Equity Instruments IFRIC 18 Transfers of Assets from Customers IFRIC 17 Distributions of Non-cash Assets to Owners

20
The directors anticipate that the adoption of these Standards and Interpretations in future periods will have no material impact on the financial statements of the Group.
3. Significant accounting policies a ) BASIS OF ACCOUNTING
The financial statements have been prepared in accordance with International Financial Reporting Standards (IFRSs). The financial statements have also been prepared in accordance with IFRSs adopted by the European Union and therefore the Group financial statements comply with Article 4 of the EU IAS Regulation. The financial statements have been prepared on the historical cost basis. The principal accounting policies adopted are set out below. Going concern The Directors have adopted the going concern basis of preparation for the reasons set forth in the Directors’ report on page 6. b ) BASIS OF CONSOLIDATION
The consolidated financial statements incorporate the financial statements of the Company and entities controlled by the Company (its subsidiaries) made up to 31 March each year. Control is achieved where the Company has the power to govern the financial and operating policies of an investee entity so as to obtain benefits from its activities. The results of subsidiaries acquired or disposed of during the year are included in the consolidated income statement from the effective date of acquisition or up to the effective date of disposal, as appropriate. Where necessary, adjustments are made to the financial statements of subsidiaries to bring the accounting policies used into line with those used by the Group. All intra-Group transactions, balances, income and expenses are eliminated on consolidation. c ) GOODWILL
Goodwill arising on consolidation represents the excess of the cost of acquisition over the Group’s interest in the fair value of the identifiable assets and liabilities of a subsidiary, associate or jointly controlled entity at the date of acquisition. Goodwill is initially recognised as an asset at cost and is subsequently measured at costs less any accumulated impairment losses. Goodwill which is recognised as an asset is reviewed for impairment at least annually. Any impairment is recognised immediately in profit or loss as is not subsequently reversed. Goodwill is tested for impairment annually, or more frequently when there is an indication that the unit may be impaired. If the recoverable amount is less than the carrying amount, the impairment loss is allocated to reduce the carrying amount of goodwill. An impairment loss recognised for goodwill is not reversed in a subsequent period. d) REVENUE RECOGNITION
The Group earns its revenue from providing online video search and advertising services. The Group’s business is based on the principle of facilitating free access to content via an advertising-supported distribution model and its revenues are derived from advertising on the internet. The Group applies its technology across a set of standard and inter-related products to connect its audience with contextually relevant advertising in a variety of formats. Advertisers select from these formats which are priced on different pricing schemes that include both impression-based (CPM) and performance-based (CPC and CPA) options. Contracts containing multiple deliverables are split into their constituent parts and each deliverable’s fair value is separately determined and recognised accordingly. The policies for each of the Group’s key revenue streams in relation to services is set out below: Advertising revenue When sales values are based on the volume of impressions (cost per mille), revenue is based on an agreed amount per impression and the number of impressions displayed. This revenue is recognised as the volumes are reported either by the Group’s customers or the Group’s internal reporting system, based on the contractual terms. When sales values are based on volume of clicks (pay per click), revenue is based upon an agreed amount per click that the end user makes after viewing the advertisement and the number of clicks made by the users. The revenue is recognised as volumes of clicks are reported by the Group’s customers.

21
Share of advertising revenues Where customers use the blinkx technology to retrieve their own content, contractual arrangements may provide for the Group to receive a share of the customer’s advertising revenues. The amount of revenue is dependent upon the amount paid per clip or per advert shown. This revenue is recognised as reported by the Group’s customers. E-commerce revenues The Group may generate revenues from e-commerce partners when an e-commerce transaction is referred to the partner from another vendor. Revenues are recognised upon completion of the transaction. Upfront licence payment and related revenues In certain cases customers will enter into a licence agreement to licence the right to use the blinkx technology. The revenue is in the form of an up-front non-refundable payment with all future advertising revenues accruing directly to the customer. Revenues from software licence agreements are recognised where there is persuasive evidence of an agreement with a customer (a signed contract and/or binding purchase order), delivery of the software has taken place, collectability is probable and the fee is fixed and determinable. Revenue from subscription based services is recognised rateably over the contract term beginning on the commencement date of each contract. Revenues from customer support services are recognised rateably over the term of the support period. If customer support services are included free or at a discount in a licence agreement, these amounts are allocated out of the licence fee at their fair market value based on the value established by independent sale of the customer support services to customers. Investment revenue Investment revenues include bank interest and income from short term deposits. e) LEASING
Rentals payable under operating leases are charged to the income statement on a straight-line basis over the term of the relevant lease. f) FOREIGN CURRENCIES
Transactions in currencies other than the functional currency of the entity concerned are recorded at the rates of exchange prevailing on the dates of the transactions. At each balance sheet date, monetary assets and liabilities that are denominated in foreign currencies are retranslated into the presentational currency, US dollars, at the rates prevailing on the balance sheet date. The Group has selected US dollars as its presentational currency as that is the currency of the principal economic environment in which the Group operates. Non-monetary assets and liabilities carried at fair value that are denominated in foreign currencies are translated at the rates prevailing at the date when the fair value was determined. Gains and losses arising on retranslation are included in net profit or loss for the period, except for exchange differences arising on non-monetary assets and liabilities where the changes in fair value are recognised directly in equity. On consolidation, the assets and liabilities of the Group’s foreign denominated operations are translated at exchange rates prevailing on the balance sheet date. Income and expense items are translated at the average exchange rates for the period unless exchange rates fluctuate significantly. Exchange differences arising, if any, are classified as equity and transferred to the Group’s translation reserve. Such translation differences are recognised as income or as expenses in the period in which the operation is disposed of. g ) TAXATION
The tax expense will represent the sum of the tax currently payable and deferred tax. The tax currently payable or receivable is based on taxable loss/profit for the year. Taxable loss/profit differs from net loss/profit as reported in the income statement because it will exclude items of income or expense that are taxable or deductible in other years and it further excludes items that are never taxable or deductible. The Group’s liability for current tax is calculated using tax rates that have been enacted or substantively enacted by the balance sheet date.

22
Deferred tax is the tax expected to be payable or recoverable on differences between the carrying amounts of assets and liabilities in the financial statements and the corresponding tax bases used in the computation of taxable profit, and is accounted for using the balance sheet liability method. Deferred tax liabilities are generally recognised for all taxable temporary differences and deferred tax assets are recognised to the extent that it is probable that taxable profits are available against which deductible temporary differences can be utilised. Such assets and liabilities will not be recognised if the temporary difference arises from goodwill or from the initial recognition (other than in a business combination) of other assets and liabilities in a transaction that affects neither the tax profit nor the accounting profit. Deferred tax liabilities are recognised for taxable temporary differences arising on investments in subsidiaries and associates, and interests in joint ventures, except where the Group are able to control the reversal of the temporary difference and it is probable that the temporary difference will not reverse in the foreseeable future. The carrying amount of deferred tax assets are reviewed at each balance sheet date and reduced to the extent that it is no longer probable that sufficient taxable profits are available to allow all or part of the asset to be recovered. Deferred tax is calculated at the tax rates that are expected to apply in the period when the liability is settled or the asset is realised. Deferred tax is charged or credited in the income statement, except when it relates to items charged or credited directly to equity, in which case the deferred tax will also be dealt with in equity. h ) PROPERTY, PLANT AND EQUIPMENT
Leasehold improvements, fixtures, fittings and computer equipment are stated at cost less accumulated depreciation and any recognised impairment loss. Depreciation is charged so as to write off the cost of assets, over their estimated useful lives, using the straight-line method, on the following bases: Fixtures, fittings and computer equipment Over 3–5 years Leasehold improvements Over shorter of economic life or lease term The gain or loss arising on the disposal or retirement of an asset is determined as the difference between the sales proceeds and the carrying amount of the asset and is recognised in income. i ) INTERNALLY-GENERATED INTANGIBLE ASSETS – RESEARCH AND DEVELOPMENT EXPENDITURE
Expenditure on research activities is recognised as an expense in the period in which it is incurred. An internally-generated intangible asset arising from the Group’s product development is recognised only if all of the following conditions are met: » an asset is created that can be identified (such as software or new processes); » it is probable that the asset created will generate future economic benefits; » the development cost of the asset can be measured reliably; and » the product from which the asset arises meets the Group’s criteria for technical feasibility. Internally-generated intangible assets are amortised on a straight-line basis over their useful lives, which is considered to be 3 years starting when the associated technology commences use. Where no internally-generated intangible asset can be recognised, development expenditure is recognised as an expense in the period in which it is incurred. j) OTHER INTANGIBLE ASSETS EXCLUDING GOODWILL
Other intangible assets excluding goodwill are measured initially at purchase cost and are amortised on a straight-line basis over their estimated useful lives, on the following bases: Tradenames, patents and trademarks 3 - 5 years Software licences 3 years Purchased technology 3 years Relationships 1 - 4 years k) IMPAIRMENT OF ASSETS EXCLUDING GOODWILL
At each balance sheet date, the Group will review the carrying amounts of its tangible and intangible assets to determine whether there is any indication that those assets have suffered an impairment loss. If any such indication exists, the recoverable amount of the asset

23
is estimated in order to determine the extent of the impairment loss (if any). Where the asset does not generate cash flows that are independent from other assets, the Group estimates the recoverable amount of the cash-generating unit to which the asset belongs. Recoverable amount is the higher of fair value less costs to sell and value in use. In assessing value in use, the estimated future cash flows are discounted to their present value using a pre-tax discount rate that reflects current market assessments of the time value of money and the risks specific to the asset for which the estimates of future cash flows have not been adjusted. If the recoverable amount of an asset (or cash-generating unit) is estimated to be less than its carrying amount, the carrying amount of the asset (cash-generating unit) is reduced to its recoverable amount. An impairment loss is recognised as an expense immediately, unless the relevant asset is carried at a revalued amount, in which case the impairment loss is treated as a revaluation decrease. Where an impairment loss subsequently reverses, the carrying amount of the asset (cash-generating unit) is increased to the revised estimate of its recoverable amount, but so that the increased carrying amount does not exceed the carrying amount that would have been determined had no impairment loss been recognised for the asset (cash-generating unit) in prior years. A reversal of an impairment loss is recognised as income immediately, unless the relevant asset is carried at a revalued amount, in which case the reversal of the impairment loss is treated as a revaluation increase. l) PROVISIONS
Provisions are recognised when the Group has a present obligation as a result of a past event, and it is probable that the Group will be required to settle that obligation. Provisions are measured at the Directors’ best estimate of the expenditure required to settle the obligation at the balance sheet date, and are discounted to present value where the effect is material. m ) SHARE-BASED PAYMENTS
The Group has applied the requirements of IFRS 2 Share-based Payments. The Group issues equity-settled share-based payments to certain employees. Equity-settled share-based payments are measured at fair value at the date of grant. The fair value determined at the grant date of the equity-settled share-based payments is expensed on a straight-line basis over the vesting period, based on the Group’s estimate of shares that will eventually vest. Fair value is measured by use of a Black Scholes model. The expected life used in the model has been adjusted, based on management’s best estimate, for the effects of non-transferability, exercise restrictions, and behavioural considerations. n ) LOSS FROM OPERATIONS
Loss from operations are stated before investment income, finance costs and tax. o ) RETIREMENT BENEFITS
Payments to a defined contribution scheme are charged as an expense as they fall due. p ) FINANCIAL INSTRUMENTS
Financial assets and financial liabilities are recognised in the Group’s balance sheet when the Group becomes a party to the contractual provisions of the instrument. Loans and receivables Trade receivables, loans and other receivables that have fixed or determinable payments that are not quoted in an active market are classified as loans and receivables. Loans and receivables are measured at amortised cost using the effective interest method, less any impairment. Interest income is recognised by applying the effective interest rate, except for short-term receivables when the recognition of interest would be immaterial. Impairment of financial assets For certain categories of financial asset, such as trade receivables, assets that are assessed not to be impaired individually are subsequently assessed for impairment on a collective basis. Objective evidence of impairment for a portfolio of receivables could include the Group’s past experience of collecting payments, an increase in the number of delayed payments in the portfolio past the average credit period, as well as observable changes in national or local economic conditions that correlate with default on receivables. The carrying amount of the financial asset is reduced by the impairment loss directly for all financial assets with the exception of trade receivables, where the carrying amount is reduced through the use of an allowance account. When a trade receivable is considered uncollectible, it is written off against the allowance account. Subsequent recoveries of amounts previously written off are credited against the allowance account. Changes in the carrying amount of the allowance account are recognised in profit or loss.

24
Cash and cash equivalents comprise cash on hand and demand deposits, and other short-term highly liquid investments that are readily convertible to a known amount of cash and are subject to an insignificant risk of changes in value. Financial liabilities and equity Financial liabilities and equity instruments are classified according to the substance of the contractual arrangements entered into. Equity instruments An equity instrument is any contract that evidences a residual interest in the assets of the Group after deducting all of its liabilities. Equity instruments issued by the Group are recorded at the proceeds received, net of direct issue costs. Financial liabilities All financial liabilities are classified as ‘other financial liabilities’. Other financial liabilities Other financial liabilities, including borrowings, are initially measured at fair value, net of transaction costs. Other financial liabilities are subsequently measured at amortised cost using the effective interest method, with interest expense recognised on an effective yield basis. The effective interest method is a method of calculating the amortised cost of a financial liability and of allocating interest expense over the relevant period. The effective interest rate is the rate that exactly discounts estimated future cash payments through the expected life of the financial liability or, where appropriate, a shorter period. Derecognition of financial liabilities The Group derecognises financial liabilities when, and only when, the Group’s obligations are discharged, cancelled or they expire. Derivative financial instruments The Group does not use derivative financial instruments.
4. Critical accounting judgements and key sources of estimation uncertainty CRITICAL JUDGMENTS IN APPLYING THE GROUP’S ACCOUNTING POLICIES In the process of applying the Group’s accounting policies, which are described in note 3, the Directors have made the following judgements, estimates and assumptions REVENUE RECOGNITION
In making its judgement with regard to revenue recognition, the Directors have considered the detailed criteria for the recognition of revenue for the provision of services set out in IAS 18 ‘Revenue’ and the policy in note 3, in particular regarding whether the debt is collectable. DEBTOR PROVISIONING
There is a policy in relation to doubtful debt provision and the Directors have exercised judgement in relation to this. CAPITALISATION OF RESEARCH AND DEVELOPMENT COSTS
In making judgements in relation to research and development costs, the Directors have considered the detailed criteria for the capitalisation of research and development set out in IAS 38 ‘Intangible assets’ GOING CONCERN
In adopting the going concern basis for the preparation of the annual and accounts, the Directors have exercised judgement with respect to the adequacy of resources to continue the operational existence for the foreseeable future. IDENTIFICATION AND VALUATION OF PURCHASED INTANGIBLES
In making judgements in relation to the identification, valuation and useful economic life of purchased intangibles, the Directors based their assessment on a valuation report prepared by an expert third party. KEY SOURCES OF ESTIMATION UNCERTAINTY
The key assumptions concerning the future, and other key sources of estimation uncertainty at the balance sheet date, that have a significant risk of causing a material adjustment to the carrying amounts of assets and liabilities within the next financial period, are discussed below.
Cash and cash equivalents

25
The Directors consider that the carrying amount of trade receivables approximates their fair value. A provision has been made for estimated unrecoverable amounts based on information available to management. Changes in collectability of trade receivables may impact the level of provision required. SHARE OPTION CHARGE
In calculating the share option charge the Directors have considered the expected life of the option, the volatility of the Company’s share price, the risk free rate and anticipated level of leavers. SUBSIDIARY INVESTMENTS
The Company’s initial valuation of its investment in its subsidiary undertaking, blinkx UK Limited, was based on the fair value at the time of IPO, and subsequent capital contributions. The Directors have considered the criteria in IAS 36, Impairment of Assets, in assessing the carrying value. IMPAIRMENT OF GOODWILL
Determining whether goodwill is impaired requires an estimation of the value in use of the cash generating unit (CGU) to which goodwill has been allocated. The value in use calculation requires the entity to estimate the future cash flows of the CGU and a suitable discount rate in order to calculate present value. The carrying amount of goodwill at the balance sheet date was $2,417,000 (2009:$nil).
5. Segmental analysis blinkx plc is organized internally along function lines with each line reporting to the Group’s chief operating decision maker, the Chief Executive Officer. The primary function lines include: finance; operations, marketing, sales, technology and development. Each of these functions supports the overall business activities, however they do not engage in activities from which they earn revenues or incur expenditure in their operations with each other. No discrete financial information is produced for these functional lines. The Group’s chief operating decision maker is ultimately responsible for entity-wide resource allocation decisions and evaluates the performance of the Group on a group wide basis and any elements within it on a combination of information from the executives in charge of the different functional lines and Group financial information. The Group operates a global internet business and its commercial activity is not generated from distinguishable geographic origins. Although the Group has operations in several geographic locations, no discrete financial performance information is maintained on a regional basis because of the globally distributed nature of the revenues and high degree of functional integration among the different geographic locations. Consequently, decisions around the allocation of resources are not determined on a regional basis and the chief operating decision maker does not assess the Group’s performance on a geographic basis. The Group’s business is based on the principle of facilitating free access to content via an advertising-supported distribution model and its revenues are derived from advertising on the internet. The Group applies its technology across a set of standard and inter-related products to connect its audience with contextually relevant advertising. Advertisers select from several product types which are priced on different pricing schemes. Each of the products generates revenues from a mix of the various pricing methodologies. There is considerable overlap among the products and advertisers and it is not meaningful to separate the revenues by primary pricing scheme or product. Consequently, separate financial information is not prepared for the various products to assess their performance or for the purpose of resource allocation decisions. As a consequence of the above factors the Group has one operating and reportable segment in accordance with IFRS 8 “Operating Segments”. IFRS 8 also requires information on any customer which is 10% or more of the combined revenue. There are no customer which are greater than 10% of total revenue in the current year (2009: 3 customers accounted for 21%, 14% and 11% respectively of total revenue). Geographical analysis of the Group’s revenues and its non-current assets, including analysis between the Group’s country of domicile and other countries, is not disclosed under IFRS 8.33 as the information is not readily available and the cost to develop it is considered to be excessive.
TRADE RECEIVABLES
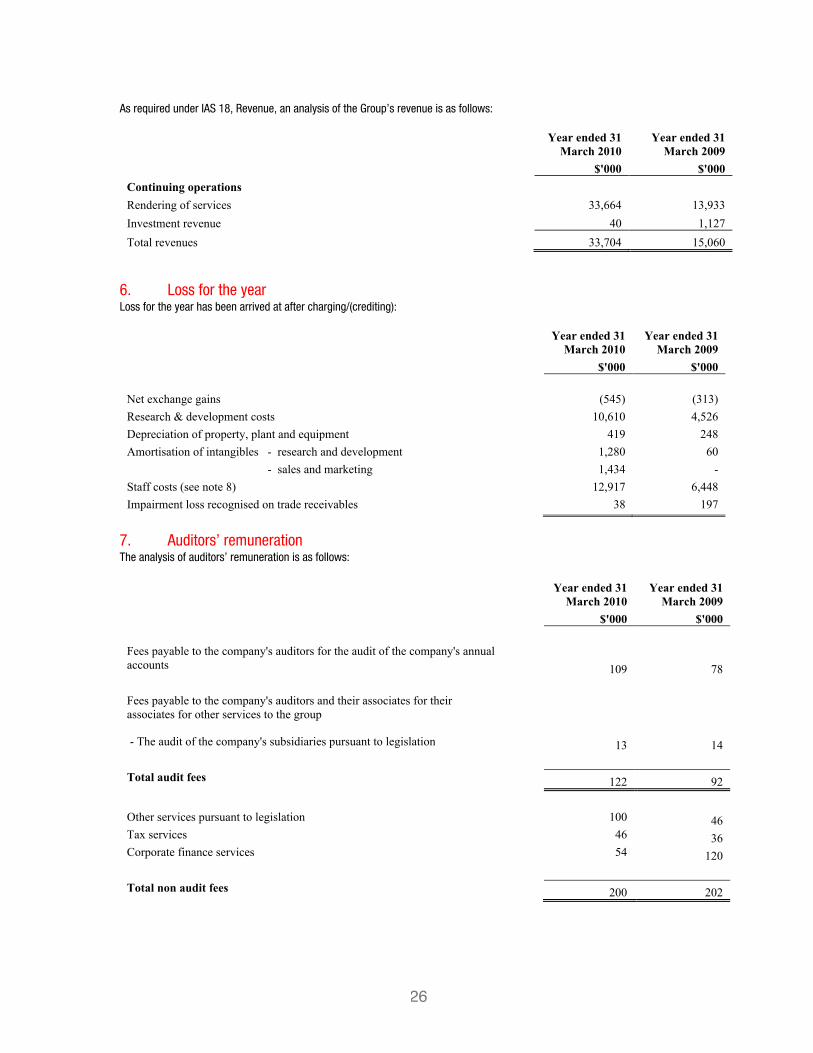
26
Rendering of services 33,664 13,933 Investment revenue 40 1,127 Total revenues 33,704 15,060
6. Loss for the year Loss for the year has been arrived at after charging/(crediting):
Year ended 31
March 2010 Year ended 31
March 2009 $'000 $'000 Net exchange gains (545) (313) Research & development costs 10,610 4,526 Depreciation of property, plant and equipment 419 248 Amortisation of intangibles - research and development 1,280 60 - sales and marketing 1,434 - Staff costs (see note 8) 12,917 6,448 Impairment loss recognised on trade receivables 38 197
7. Auditors’ remuneration The analysis of auditors’ remuneration is as follows:
Year ended 31
March 2010 Year ended 31
March 2009 $'000 $'000 Fees payable to the company's auditors for the audit of the company's annual accounts 109 78 Fees payable to the company's auditors and their associates for their associates for other services to the group
- The audit of the company's subsidiaries pursuant to legislation 13 14 Total audit fees 122 92 Other services pursuant to legislation 100 46 Tax services 46 36 Corporate finance services 54 120 Total non audit fees 200 202
As required under IAS 18, Revenue, an analysis of the Group’s revenue is as follows:
Year ended 31
March 2010 Year ended 31
March 2009 $'000 $'000 Continuing operations

27
Sales & marketing 66 33 Technical 32 15 Administration & operations 11 5 109 53
Year ended 31
March 2010 Year ended 31
March 2009 $'000 $'000 Wages & salaries 12,000 5,978 Social security costs 903 453 Other pension costs 14 17 12,917 6,448
Information on directors’ remuneration, who are considered to be the Group’s key management personnel for the purposes of IAS 24 Related Party Disclosures, can be found in the Directors’ Report on page 9.
9. Investment revenue
Year ended 31
March 2010 Year ended 31
March 2009 $'000 $'000 Interest receivable on cash and cash equivalents 40 1,127
8. Staff costs The average monthly number of employees (including executive Directors) was:
Year ended 31
March 2010 Year ended 31
March 2009 Number Number

28
10. Tax
Year ended 31
March 2010 Year ended 31
March 2009 $'000 $'000
Research and development tax credit 399 459 Corporation tax is calculated at 28% (2009: 28%) of the estimated assessable loss for the year. Taxation for other jurisdictions is calculated at the rates prevailing in the respective jurisdictions. The credit for the year can be reconciled to the loss per the income statement as follows:
Year ended 31
March 2010 Year ended 31
March 2009 $'000 % $'000 % Loss before tax (8,914) (9,330)
Tax at UK corporation rate of 28% (2009: 28%) (2,496) (28)% (2,613) (28)% Adjustment for overseas tax rate (389) (4)% (445) (5)% Tax effect of expense not deductible in determining taxable loss 156 2% 508 5% Capital allowances in excess of depreciation 86 1% (71) (1)% Unutilised tax losses 2,278 26% 2,251 24% Prior year adjustment (34) - (89) (1)% Tax credit and effective rate for the year (399) (3)% (459) (6)%
The Group has not recognised any deferred tax assets or liabilities at either balance sheet date. See note 17.

29
11. Loss per share The loss per ordinary and diluted loss per share are equal because share options are only included in the calculation of diluted earnings per share if the issue would decrease the net earnings per share or increase the net loss per share. The calculation is based on information in the table shown below:
Year ended 31
March 2010 Year ended 31
March 2009
$'000 $'000
Loss Loss (used in calculation of basic and diluted loss per share) (8,515) (8,871) Number of shares Weighted average number of shares for the purpose of basic and diluted earnings per share 289,999,121 278,075,720
12. Goodwill
$'000 Cost At 1 April 2008 - Movement in year - At 1 April 2009 - Recognised on purchase of net assets (see note 27) 2,417 As at 31 March 2010 2,417 Accumulated impairment losses At 1 April 2008 - Movement in year - At 1 April 2009 - Movement in year - As at 31 March 2009 - Carrying amount As at 31 March 2010 2,417
As at 31 March 2009 -
The Group tests goodwill annually for impairment, or more frequently if there are indications that goodwill might be impaired. As described in note 5 the Group has only one reportable segment under IFRS 8 Operating Segments. The acquisition and integration process adopted by the Group is such that the acquired assets are rapidly integrated into the Group such that it is not possible to separately identify results from acquired assets. Consequently the Group has one cash generating unit ‘CGU’ and all goodwill and other intangible assets are allocated to that unit. This is consistent with the way management monitors and makes decision about the business. Value in use calculations are prepared for the single CGU. The key assumptions for the value in use calculations are those regarding growth rates, costs and discount rates. Management have based the growth rates on industry analyst forecasts and are consistent with rates achieved by comparable companies. Costs are assumed to decline as a percentage of sales throughout the forecast period, which is also consistent with historic results. The percentages are based on the 2010 levels. A discount rate of 13% has been applied to the cash flows, which is a similar rate to that used by industry analysts. The Group has prepared sensitivity analysis with varying growth and discount rates. The Group’s

30
impairment model covers a forecast five year period. The directors consider five years to be an appropriate period to consider but note that it might reasonably extend beyond this period which would provide further upside sensitivity Based on all of the above the directors have concluded that no impairment of goodwill is required to be recorded.
13. Other intangible assets
Relationship Purchased technology
Capitalized development
costs
Tradenames, trademarks
& patents Software
licences Total
$'000 $'000 $'000 $'000 $'000 $'000 Cost
At 1 April 2008 - - - - 7 7
Additions - - - - 1,917 1,917 Exchange differences - - - - (1) (1)
As at 31 March 2009 - - - - 1,923 1,923
Additions 2,000 1,800 512 535 8 4,855 Exchange differences - - - - 88 88
As at 31 March 2010 2,000 1,800 512 535 2,019 6,866 Amortisation
At 1 April 2008 - - - - (2) (2)
Amortisation - - - - (60) (60) Exchange differences - - - - 1 1
As at 31 March 2009 - - - - (61) (61)
Amortisation (1,338) (573) - (96) (707) (2,714) Exchange differences - - - - 35 35
As at 31 March 2010 (1,338) (573) - (96) (733) (2,740) Net book value
As at 31 March 2010 662 1,227 512 439 1,286 4,126
As at 31 March 2009 - - - - 1,862 1,862
31
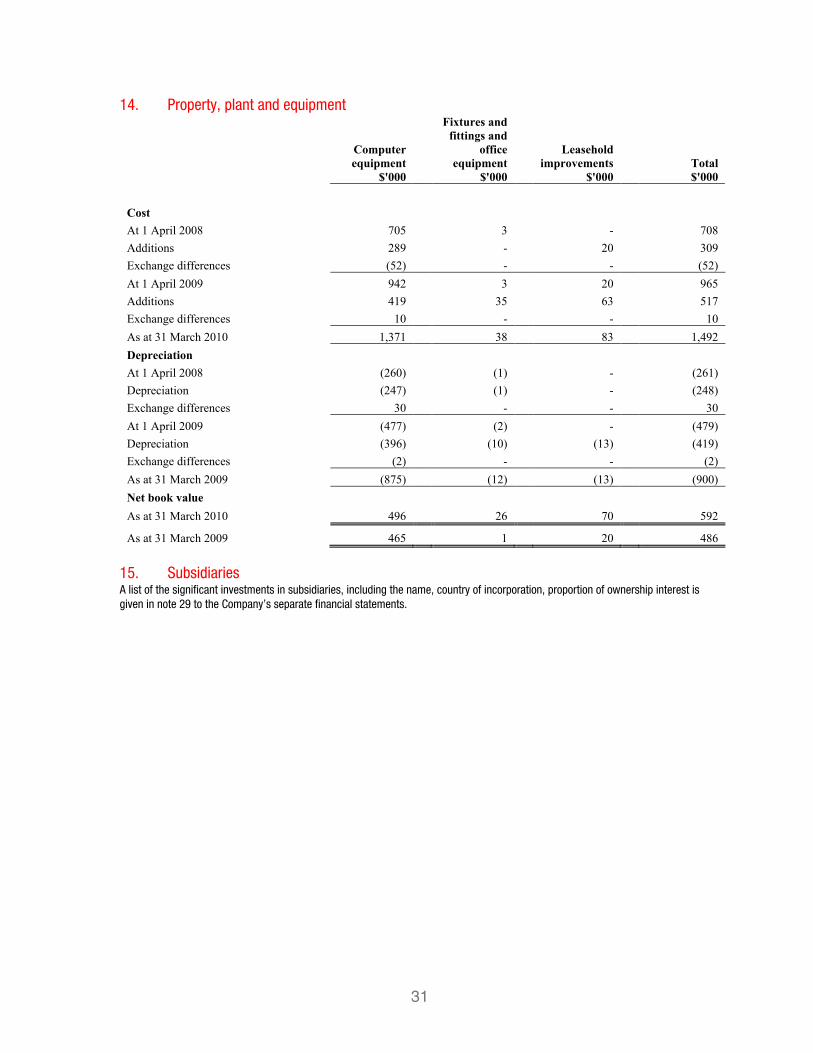
14. Property, plant and equipment
Computer equipment
$'000
Fixtures and fittings and
office equipment
$'000
Leasehold improvements
$'000
Total $'000
Cost At 1 April 2008 705 3 - 708 Additions 289 - 20 309 Exchange differences (52) - - (52) At 1 April 2009 942 3 20 965 Additions 419 35 63 517 Exchange differences 10 - - 10 As at 31 March 2010 1,371 38 83 1,492 Depreciation At 1 April 2008 (260) (1) - (261) Depreciation (247) (1) - (248) Exchange differences 30 - - 30 At 1 April 2009 (477) (2) - (479) Depreciation (396) (10) (13) (419) Exchange differences (2) - - (2) As at 31 March 2009 (875) (12) (13) (900) Net book value As at 31 March 2010 496 26 70 592
As at 31 March 2009 465 1 20 486 15. Subsidiaries A list of the significant investments in subsidiaries, including the name, country of incorporation, proportion of ownership interest is given in note 29 to the Company’s separate financial statements.

32
16. Other financial assets a ) TRADE AND OTHER RECEIVABLES
2010 2009 $'000 $'000 Current assets Trade receivables 7,623 3,283 Allowance for doubtful debts (1,625) (102) Net trade receivables 5,998 3,181
Other receivables and prepayments 2,874 1,827
Non current assets Other receivables 385 426
The average credit period taken on sales of goods is 65 days (2009: 83 days). The Group has credit risk with respect to trade receivables due from its customers. The Group has an increasing number of customers as the business grows which will assist in reducing credit risk through diversity. Allowance is made for bad and doubtful debts based on management’s assessment of the risk taking into account the ageing profile, experience and circumstance. In cases where collectability is uncertain at the time of invoicing a sales allowance is offset against the receivable and no revenue is recognised. Ongoing credit evaluation is performed on the financial condition of accounts receivable. Included within the Group’s trade receivables balance are debtors with a carrying valuing of $2,613,000 (2009: $755,000) which are past due between 0-90 days and $1,883,000 (2009: $107,000) in excess of 90 days. The remaining balance of $3,127,000 (2009: $2,421,000) is not yet due. The Group’s allowance for doubtful debt amounts to $1,625,000 (2009: $102,000),including a reserve on purchase assets of $1,400,000 (2009: $nil). The charge for the year was $38,000 (2009: $197,000). No interest has been charged for overdue debts in the period. The Directors have considered the credit quality of assets neither past due nor impaired and do not consider further credit provision is required in excess of the allowance for doubtful debts. The Directors consider that the carrying amount of trade and other receivables approximates their fair value. b ) CASH AND CASH EQUIVALENTS
Cash and cash equivalents comprise cash held by the Group and short-term bank deposits with an original maturity of one month or less. The carrying amount of these assets approximates their fair value. c ) CREDIT RISK
The Group’s principal financial assets are bank balances and cash, trade and other receivables. The Group’s credit risk is primarily with cash and cash equivalents. This credit risk is limited because counterparties are banks with high credit ratings assigned by international credit-rating agencies. The Group carries out credit checks on its customers and has in place credit control systems to minimise the credit risk to the Group whilst maintaining healthy commercial relationships. The Group had no other significant concentration of credit risk in the current or prior year.
17. Deferred tax No deferred tax assets or liabilities have been recognised by the Group in the year. At the balance sheet date there is an unrecognised deferred tax asset relating to tax losses (and accelerated capital allowances) of $7.8m (2009: $2.7m). No deferred tax asset has been recognised due to the unpredictability of future profit streams. Should suitable taxable profits arise, the unrecognised deferred tax asset will reverse against those profits.

33
18. Other financial liabilities TRADE AND OTHER PAYABLES
2010 2009 $'000 $'000 Current liabilities Trade payables 2,348 886 Deferred revenue 936 525 Other accrued liabilities 1,962 3,109 5,246 4,520
Non current liabilities Trade payable 135 - Deferred revenue 87 426 222 426
Trade creditors and accruals principally comprise amounts outstanding for trade purchases and ongoing costs. The average credit period taken for trade purchases is 38 days (2009: 21 days). No interest has been charged by suppliers in respect of overdue amounts in the year. The Directors consider that the carrying amount of trade payables approximates to their fair value.
19. Share capital
2010 2009 $'000 $'000 Authorised 500,000,000 ordinary shares of 1 pence shares each 9,864 9,864 Issued 307,207,690 ordinary shares of 1 pence each 5,964 5,487
(2009: 278,128,180 ordinary shares of 1 pence each) The Company has one class of ordinary share which carry no right to fixed income. Issues of shares in the year relate to the placing of 27,927,971 shares in November 2009 and the exercise of employee share options.
20. Share premium account
Share
premium $'000 Balance at 31 March 2008 49,126 Premium arising on issue of equity shares, net of costs - Balance at 31 March 2009 49,126 Premium arising on issue of equity shares, net of costs 7,219 Balance at 31 March 2010 56,345

34
21. Operating lease arrangements
2010 2009 $'000 $'000 Minimum lease payments under operating leases recognised as an expense in the year 762 -
At the balance sheet date, the Group had outstanding commitments for future minimum lease payments under non-cancellable operating leases, which fall due as follows: 2010 2009 $'000 $'000 Within one year 969 - In the second to fifth years inclusive 2,193 -
3,192 - Operating lease payments represents rental payable by the Group for certain of its office properties, computer equipment and software. Lease terms range from three to five years.
22. Share based payments Share based compensation charges have been charged in the income statement within the following functional areas:
Year ended 31
March 20010 Year ended 31
March 2009
$'000 $'000
Sales and marketing 574 564
Research & development 738 768
Administrative expenses 105 102
1,417 1,434 On the demerger from Autonomy Corporation plc the Company established the following share options schemes; » the blinkx 2007 Enterprise Management Incentive Plan (the ‘blinkx EMI Scheme’) » the blinkx US Share Option Plan (the ‘blinkx US Plan’) » the blinkx Autonomy Employee Discretionary Share Option Scheme 2007 (the ‘Autonomy Discretionary Scheme’) » the blinkx Autonomy Employee US Share Option Plan (the ‘Autonomy US Plan’) The blinkx EMI Scheme and the blinkx US Plan allow for the grant of options over ordinary shares to employees of the Company and its subsidiaries. At the time of demerger two special grants were made under these plans. The first allowed a fully vested grant at nominal value and the second was a grant at nominal value but with a 3 year vesting period. Since then grants have been made at market value and with a 3 or 4 year vesting period with options vesting in varying sized tranches over that period. No option may be granted for a term in excess of 10 years. Vested options are exercisable following termination of employment for a period ranging from 40 to 90 days.
35
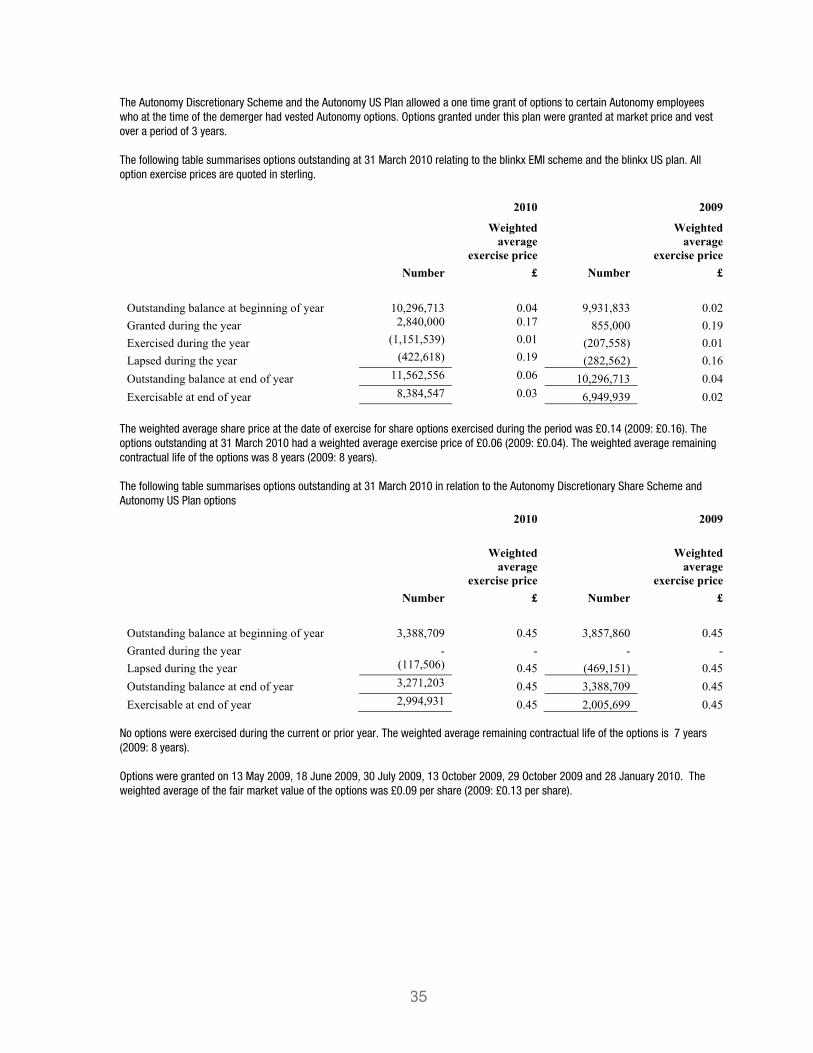
The Autonomy Discretionary Scheme and the Autonomy US Plan allowed a one time grant of options to certain Autonomy employees who at the time of the demerger had vested Autonomy options. Options granted under this plan were granted at market price and vest over a period of 3 years. The following table summarises options outstanding at 31 March 2010 relating to the blinkx EMI scheme and the blinkx US plan. All option exercise prices are quoted in sterling.
2010 2009
Weighted average
exercise price
Weighted average
exercise price Number £ Number £ Outstanding balance at beginning of year 10,296,713 0.04 9,931,833 0.02 Granted during the year 2,840,000 0.17 855,000 0.19 Exercised during the year (1,151,539) 0.01 (207,558) 0.01 Lapsed during the year (422,618) 0.19 (282,562) 0.16 Outstanding balance at end of year 11,562,556 0.06 10,296,713 0.04 Exercisable at end of year 8,384,547 0.03 6,949,939 0.02
The weighted average share price at the date of exercise for share options exercised during the period was £0.14 (2009: £0.16). The options outstanding at 31 March 2010 had a weighted average exercise price of £0.06 (2009: £0.04). The weighted average remaining contractual life of the options was 8 years (2009: 8 years). The following table summarises options outstanding at 31 March 2010 in relation to the Autonomy Discretionary Share Scheme and Autonomy US Plan options
2010 2009
Weighted average
exercise price
Weighted average
exercise price Number £ Number £ Outstanding balance at beginning of year 3,388,709 0.45 3,857,860 0.45 Granted during the year - - - - Lapsed during the year (117,506) 0.45 (469,151) 0.45 Outstanding balance at end of year 3,271,203 0.45 3,388,709 0.45 Exercisable at end of year 2,994,931 0.45 2,005,699 0.45
No options were exercised during the current or prior year. The weighted average remaining contractual life of the options is 7 years (2009: 8 years). Options were granted on 13 May 2009, 18 June 2009, 30 July 2009, 13 October 2009, 29 October 2009 and 28 January 2010. The weighted average of the fair market value of the options was £0.09 per share (2009: £0.13 per share).

36
The inputs into the Black-Scholes model are as follows:
2010 2009 Weighted average share price 17p 19p Weighted average exercise price 17p 19p Expected volatility 67-82% 100-102% Expected life 3-4 years 3-4 years Risk free rate 3.50% 3.50% Expected dividend - -
Expected volatility was determined by calculating the historical volatility of the Group’s share price since IPO. The expected life used in the model has been adjusted, based on management’s best estimate, for the effects of non-transferability, exercise restrictions, and behavioural considerations.
23. Other share-based payments There were no other share-based payments made during the year. During the period ending 31 March 2008, the Group has granted a warrant over 120,000 shares to an adviser in relation to strategic services. The warrant vests quarterly over a 3 year period and has an exercise price equal to market price on date of grant, being 20.25 pence. The fair value of the warrant at the date of grant was 11 pence per warrant. The charge to sales and marketing for the year was $5,000 (2009: $5,000). Should the adviser cease providing services no further options will vest from that date. The fair value at the date of grant was measured by use of a Black Scholes model.
24. Financial Instruments CAPITAL RISK MANAGEMENT
The Group manages its capital to ensure that entities in the Group are able to continue as going concerns while maximizing the return to shareholders through the optimisation of the debt and equity balance. The capital structure of the Group consists of cash and cash equivalents and equity attributable to equity holders of the parent, comprising issued capital, reserves and retained earnings. GEARING RATIO
The Board of Directors reviews the capital structure on a regular basis and as part of this review, the Board considers the cost of capital and the risks associated with each class of capital. The Group will set a target gearing ratio determined as the proportion of net debt to equity when it considers that this is necessary. EXTERNALLY IMPOSED CAPITAL REQUIREMENT
The Group is not subject to externally imposed capital requirements. SIGNIFICANT ACCOUNTING POLICIES
Details of the significant accounting policies and methods adopted, including the criteria for recognition, the basis of measurement and the basis on which income and expenses are recognised, in respect of each class of financial asset, financial liability and equity instrument are disclosed in note 3 to the financial statements.

37
CLASSES OF FINANCIAL INSTRUMENTS
2010 2009
$'000 $'000
Financial assets (all loans and receivables)
Cash and cash equivalents 14,579 21,366
Amounts due from customers 7,623 3,283
Financial liabilities (all at amortised cost)
Trade payables (2,483) (886) The fair value of all of the Group’s financial instruments are derived from inputs other than unadjusted quoted prices that are observable for the asset or liability, either directly or indirectly. The carrying amount of financial assets and financial liabilities recorded at amortised costs in the financial statements approximate their fair values. Therefore there is no difference between the carrying value and fair value of the above financial assets and liabilities. FINANCIAL RISK MANAGEMENT
The Group’s financial function provides services to the business, monitors and manages the financial risks relating to the operations of the Group. These risks include market risk (including currency risk), credit risk and liquidity risk. The Group does not enter into or trade financial instruments, including derivative financial instruments, for any purpose. MARKET RISK
The Group’s activities expose it primarily to the financial risks of changes in foreign currency exchange rates as it undertakes certain transactions denominated in foreign currencies. The Group’s presentational currency is US dollars and the Company’s functional currency is sterling and as a result cash is held in sterling. The Group holds its funds in several different financial institutions. The carrying amounts of the Group’s foreign currency denominated monetary assets and monetary liabilities at the reporting date are as follows: 2010 2009 2010 2009 Liabilities Liabilities Assets Assets $'000 $'000 $'000 $'000 US Dollar 165 112 176 173
FOREIGN CURRENCY SENSITIVITY ANALYSIS
The Group is mainly exposed to movements in pound sterling and US dollar. The following table details the Group’s sensitivity to a 20% increase and decrease (2009: 20%) in the functional currency of the entity against the relevant foreign currencies. 20% is the sensitivity rate used (2009: 20%) when reporting foreign currency risk internally to key management personnel and represents management’s assessment of the reasonably possible change in foreign exchange rates. The sensitivity analysis includes only outstanding foreign currency denominated monetary items and adjusts their translation at the year end for a 20% change (2009: 20%) in foreign currency rates. The sensitivity analysis includes loans to foreign operations within the Group where the denomination of the loan is in a currency other than the currency of the lender or the borrower. A positive number below in 2010 indicates an increase in profit and other equity where the Sterling strengthens 20% against the relevant currency. For a 20% weakening of the Sterling against the relevant currency, there would be an equal and opposite impact on the profit and other equity, and the balances below would be negative.

38
2010 2009 $'000 $'000 Profit and loss cash and cash equivalents 22 5 amounts due from customers 13 29 trade payables 30 22
CREDIT RISK MANAGEMENT
Credit risk refers to the risk that a counterparty will default on its contractual obligations resulting in financial loss to the Group. The Group has adopted a policy of only dealing with counterparties that are considered to be creditworthy by management, having completed various credit checks. The Group’s principal financial assets are cash and cash equivalents, trade and other receivables. The Group’s credit risk is primarily with cash and cash equivalents. This credit risk is limited because counterparties are a number of different banks with high credit ratings assigned by international credit-rating agencies. Details regarding the management of credit risk in relation to trade receivables is dealt with in note 16. Other than noted here the Group has no other significant concentration of credit risk at either balance sheet date. The carrying amount of financial assets recorded in the financial statements, which is net of impairment losses, represents the Group’s maximum exposure to credit risk. LIQUIDITY RISK MANAGEMENT
The Group manages liquidity risk by maintaining adequate reserves, diversifying its cash accounts across several banking institutions and constantly monitoring forecast and actual cash flows.
25. Events after the balance sheet date There are no post balance sheet events.
26. Related party transactions For the purposes of IAS 24 Related Party Disclosures, the directors are considered to be the Group’s key management personnel. Their remuneration is disclosed within the Directors’ Report on page 9. There were no other related party transactions in either the current year or prior year.
27. Purchase of net assets
On 16 April 2009, the Group purchased certain net assets from a consortium of financial institutions to facilitate the growth of the video search and advertising business. Fair value of the assets at time of purchase was $266,000 for plant and equipment, $4,300,000 for intangible assets (per valuation conducted by a qualified independent appraiser), and $2,678,000 for net current liabilities. Net current liabilities includes $72,000 in cash, $2,838,000 in trade and other receivables, $3,148,000 in trade payables, and $2,440,000 in other payables. The company recognized goodwill of $2,417,000. Book value was the same as fair value for all acquired items except for purchased intangibles, which had a $nil book value. The purchase was satisfied by $4,000,000 paid to the vendors ($3,928,000 net of cash purchased) and $305,000 in directly attributable costs related to the transaction, resulting in net cash outflows of $4,233,000. It is not practical to determine the financial effect of the purchased net assets for the period from acquisition to the end of the financial period. The Group’s core products and those purchased have been integrated and the operations merged such that it is not practical to determine the portion of the result that specifically relates to these assets. It is impracticable to disclose the combined entity revenue and profit and loss information required by IFRS3.70 as the information is not available.

39
Company Balance Sheet as at 31 March 2010
Note
As at 31 March
2010
As at 31 March
2009 £'000 £'000 Non-current assets Investment in subsidiary 29 100,343 99,459 Current assets Amounts due from subsidiary undertakings 20,739 10,915 Other receivables 51 43 Cash and cash equivalents 30 6,800 12,268 27,590 23,226 Current liabilities Trade and other payables 31 (190) (232) Net assets 127,743 122,453
EQUITY Capital and reserves Share capital 33 3,072 2,781 Share premium 34 29,300 24,902 Stock compensation reserve 1,719 835 Merger reserve 96,432 96,432 Retained earnings 35 (2,780) (2,497) Total Equity 127,743 122,453
The financial statements of blinkx plc (registered number 06223359) were approved by the Board of Directors and authorised for issue on 29 July 2010. They were signed on its behalf by: Suranga Chandratillake Founder and Chief Executive Officer 29 July 2010

Company Statement of Changes in Equity Year ended 31 March 2010
Ordinary share
capital £'000
Share premium
£'000
Stock compensation
reserve £'000
Merger reserve
£'000
Retained earnings
£’000 Total £'000
Balance as at 1 April 2008 2,779 24,902 - 96,432 (2,708) 121,405 Profit for the year - - - - 211 211 Other comprehensive income for the year
-
-
-
-
-
-
Total Comprehensive income for the year
-
-
-
-
211
211
Issue of shares, net of expenses
2
-
-
-
-
2
Capital contribution - - 835 - - 835 Balance as at 1 April 2009 2,781 24,902 835 96,432 (2,497) 122,453 Loss for the year - - - - (283) (283) Other comprehensive income for the year
-
-
-
-
-
-
Total Comprehensive income for the year
-
-
-
-
(283)
(283)
Issue of shares, net of expenses
291
4,398
-
-
-
4,689
Capital contribution - - 884 - - 884 Balance as at 31 March 2010
3,072
29,300
1,719
96,432
(2,780)
127,743
40

41
Company Cash Flow Statement Year ended 31 March 2010
2010 2009 Note £'000 £'000 Net cash used in operating activities 36 (10,178) (7,463) CASH FLOWS FROM INVESTING ACTIVITIES Proceeds from redemption of preference shares in subsidiary 4,676 - Interest received 21 647 Net cash generated by investing activities 4,697 647 CASHFLOWS FROM FINANCING ACTIVITIES Proceeds from issuance of shares 13 2 Net cash generated by financing activities 13 2 Net (decrease) in cash and cash equivalents (5,468) (6,814) Beginning cash and cash equivalents 12,268 19,082 Ending cash and cash equivalents 6,800 12,268

Notes to the Company Only Financial Statements 28. Significant accounting policies The separate financial statements of the Company are presented as required by the Companies Act 2006. As permitted by that Act, the separate financial statements have been prepared in accordance with International Financial Reporting Standards adopted by the European Union. The Company has no employees other than the three non-executive Directors. Their remuneration is shown in the Group remuneration report. The financial statements have been prepared on the historical cost basis. The principal accounting policies adopted are the same as those set out in note 3 to the consolidated financial statements except as noted below. Investments in subsidiaries are stated at cost less, where appropriate, provisions for impairment. These Company financial statements are presented in sterling as that is the currency of the primary economic environment in which the Company operates. As permitted by section 408 of the Companies Act 2006 the income statement of the parent Company is not presented as part of these accounts. The parent Company’s loss for the financial year amounted to £283,000 (2009: profit £211,000). The Company’s profit or loss for each year is the same as its total comprehensive income for each year.
29. Subsidiaries
Cost and net book value £'000 At 1 April 2008 98,624 Capital contribution 835 At 1 April 2009 99,459 Capital contribution 884 At 31 March 2010 100,343
The capital contribution is in respect of equity settled share based payments made to employees of the Company’s subsidiaries for which the Company receives no reimbursement. Details of the principal subsidiary companies at 31 March 2010 are as follows:
Place of incorporation (or
registration) and operation Percentage
owned blinkx UK Ltd * England & Wales 100% blinkx inc US 100% Pinball Corp * US 100%
* Directly owned subsidiaries Operating subsidiaries of the above companies have been excluded to the extent such subsidiaries’ operations are consolidated in the interim operating companies’ operations and results. These include operating subsidiaries in the US and Canada.
42

30. Financial assets LOANS FROM OTHER GROUP ENTITIES
At the balance sheet date there are receivable from fellow Group companies amounts of £20,739,000 (2009: £10,900,000). The carrying amount of these assets approximates their fair value. There are no past due or impaired receivable balances. CASH AND CASH EQUIVALENTS
These comprise cash held by the Company and short-term bank deposits with an original maturity of three months or less. The carrying amount of these assets approximates their fair value.
31. Financial liabilities TRADE AND OTHER PAYABLES
Trade payables principally comprise amounts outstanding for trade purchases and ongoing costs. The average credit period taken for trade purchases is 101 days (2009: 10 days). The carrying amount of trade payables approximates to their fair value.
32. Deferred tax No deferred tax assets or liabilities have been recognised by the Company in the year. At the balance sheet date there is an unrecognised deferred tax asset of £100,000 (2009: no unrecognised asset).
33. Share capital
2010 2009 £'000 £'000 Authorised 500,000,000 ordinary shares of 1 pence shares each 5,000 5,000 Issued 307,207,690 ordinary shares of 1 pence each 3,072 2,781
(2009: 278,128,180 ordinary shares of 1 pence each) The Company has one class of ordinary share which carry no right to fixed income. Issuances of shares in the year related to the placing of 27,927,971 shares in November 2009 and 1,151,539 in relation to the exercise of employee share options.
34. Share premium account
£'000 Balance at 31 March 2008 24,902 Premium arising on issue of equity shares - Balance at 31 March 2009 24,902 Premium arising on issue of equity shares 4,398 Balances at 31 March 2010 29,300
43
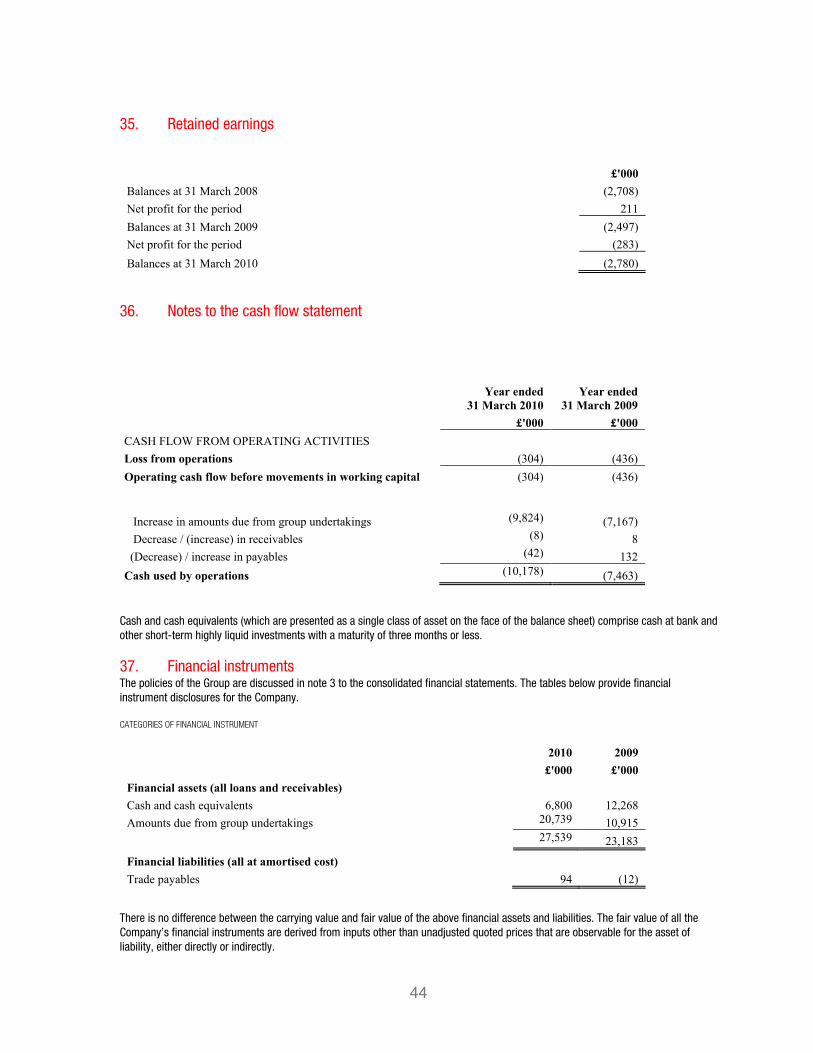
35. Retained earnings
£'000 Balances at 31 March 2008 (2,708) Net profit for the period 211 Balances at 31 March 2009 (2,497) Net profit for the period (283) Balances at 31 March 2010 (2,780)
36. Notes to the cash flow statement
Year ended
31 March 2010 Year ended
31 March 2009 £'000 £'000 CASH FLOW FROM OPERATING ACTIVITIES Loss from operations (304) (436) Operating cash flow before movements in working capital (304) (436)
Increase in amounts due from group undertakings (9,824) (7,167) Decrease / (increase) in receivables (8) 8 (Decrease) / increase in payables (42) 132 Cash used by operations (10,178) (7,463)
Cash and cash equivalents (which are presented as a single class of asset on the face of the balance sheet) comprise cash at bank and other short-term highly liquid investments with a maturity of three months or less.
37. Financial instruments The policies of the Group are discussed in note 3 to the consolidated financial statements. The tables below provide financial instrument disclosures for the Company. CATEGORIES OF FINANCIAL INSTRUMENT
2010 2009 £'000 £'000 Financial assets (all loans and receivables) Cash and cash equivalents 6,800 12,268 Amounts due from group undertakings 20,739 10,915 27,539 23,183
Financial liabilities (all at amortised cost) Trade payables 94 (12)
There is no difference between the carrying value and fair value of the above financial assets and liabilities. The fair value of all the Company’s financial instruments are derived from inputs other than unadjusted quoted prices that are observable for the asset of liability, either directly or indirectly.
44

FOREIGN CURRENCY RISK MANAGEMENT
The carrying amounts of the Company’s foreign currency denominated monetary assets and monetary liabilities at the reporting date are as follows:
2010 2009 2010 2009 Liabilities Liabilities Assets Assets $'000 $'000 $'000 $'000 US Dollar 83 - 60 -
FOREIGN CURRENCY SENSITIVITY ANALYSIS
The Company is mainly exposed to movements in US dollar. The Company has maintained its sensitivity at 20% in 2010 (2009: 20%). The following table details the Group’s sensitivity to a 20% increase and decrease (2009; 20%) in the functional currency of the entity against the relevant foreign currencies. 20% is the sensitivity rate (2009: 20%) used when reporting foreign currency risk internally to key management personnel and represents management’s assessment of the reasonably possible change in foreign exchange rates. The sensitivity analysis includes only outstanding foreign currency denominated monetary items and adjusts their translation at the year end for a 20% change (2009; 20%) in foreign currency rates. The sensitivity analysis includes loans to foreign operations within the Group where the denomination of the loan is in a currency other than the currency of the lender or the borrower. A positive number below for 2009 indicates an increase in profit and other equity where the Sterling strengthens 20% against the relevant currency. For a 20% weakening of the Sterling against the relevant currency, there would be an equal and opposite impact on the profit and other equity, and the balances below would be negative.
2010 2009 £'000 £'000 Profit and loss cash and cash equivalents 12 - trade payables 17 - inter company loans 3,684 1,809
The movements above arise where the Company has financial assets or liabilities in currencies other than sterling. There has not been any significant change in the Company’s sensitivity to foreign currency during the period.
38. Related parties All transactions are conducted on an arm’s length basis and the amount owed by subsidiary undertakings is £20,739,000 (2009: £10,920,000).
45

Shareholder Information and Advisors Registrars and blinkx Shareholder Services All Administrative inquiries regarding shareholdings such as questions about lost share certificates should be directed to the company’s registrars as follows: Computershare Investor Services PLC The Pavilions Bridgwater Road Bristol BS99 6ZY UK Tel: +44 870 707 1593 email: [email protected]
Stock Exchanges blinkx’s ordinary shares are listed on the London Stock Exchange (AIM) under the symbol “BLNX.” blinkx does not maintain listings
.segnahcxe kcots rehto yna no
Shareholder Communications Topics featured in this Annual Report can be found via the blinkx home page on the Internet (www.blinkx.com). Financial
.sserdda taht aiv dnuof eb osla nac seitivitca rehto dna secivres ,stcudorp xknilb no swen ,stluser
AIM Nominated
Advisors / Auditors Advisor and Broker Investor Relations
Deloitte LLP Citigroup Global Markets Financial Dynamics Ltd
City House Citigroup Centre Holborn Gate
126-130 Hills Road Canada Square 26 Southampton Buildings
Cambridge Canary Wharf London
CB2 1RY London WC2A 1PB
E14 5LB
Corporate Legal Advisors Registered Office
Bird & Bird LLP Pillsbury Winthrop Shaw Cambridge Business Park
15 Fetter Lane Pittman LLP Cowley Road
London 2475 Hanover Street Cambridge
EC4A 1JP Palo Alto CB4 0WZ
CA 94304, USA Registered in England 6223359
San Francisco, USA Office: One Market Plaza, Spear Tower Suite 1810, San Francisco, CA 94105, USA // Tel: +1 (415) 655-1450 // Fax: +1 (415) 655-1440 London, UK Office: 105 Piccadilly, London, W1J 7NJ, UK // Tel: +44 (0) 20 8906 6857 // Fax: +44 1223 425014
46

One Market PlazaSpear Tower Suite, 1810 San Francisco, CA 94105, USATel: +1 (415) 655 1450Fax: +1 (415) 655 1440
105 PiccadillyLondon, W1J 7NJ, UK Tel: +44 (0) 20 8906 6857Fax: +44 1223 425014