Biketastic: Sensing and Mapping for Better Bikingkshilton/pdf/ReddyShilton...routes are uploaded,...
4
Biketastic: Sensing and Mapping for Better Biking Sasank Reddy, Katie Shilton, Gleb Denisov, Christian Cenizal, Deborah Estrin, Mani Srivastava Center for Embedded Networked Sensing University of California at Los Angeles (UCLA), Los Angeles, CA 90095 {sasank, kshilton, gdenisov, ccenizal}@ucla.edu, [email protected], [email protected] ABSTRACT Bicycling is an affordable, environmentally friendly alter- native transportation mode to motorized travel. A common task performed by bikers is to find good routes in an area, where the quality of a route is based on safety, efficiency, and enjoyment. Finding routes involves trial and error as well as exchanging information between members of a bike community. Biketastic is a platform that enriches this ex- perimentation and route sharing process making it both eas- ier and more effective. Using a mobile phone application and online map visualization, bikers are able to document and share routes, ride statistics, sensed information to infer route roughness and noisiness, and media that documents ride experience. Biketastic was designed to ensure the link between information gathering, visualization, and bicycling practices. In this paper, we present architecture and algo- rithms for route data inferences and visualization. We eval- uate the system based on feedback from bicyclists provided during a two-week pilot. Author Keywords Location based services, mobile sensing systems, participa- tory sensing, map visualization ACM Classification Keywords H.5.m Information Interfaces and Presentation: Miscella- neous General Terms Algorithms, Design, Human Factors INTRODUCTION With the rising costs and detrimental environmental effects associated with motorized travel, individuals are exploring alternative modes of transport. One transport type that has become popular is bicycling. New and even experienced bikers often seek “good” routes to traverse. The quality of a route can be influenced by safety, efficiency, or over- all enjoyment. For instance, a safe route could be one that Permission to make digital or hard copies of all or part of this work for personal or classroom use is granted without fee provided that copies are not made or distributed for profit or commercial advantage and that copies bear this notice and the full citation on the first page. To copy otherwise, or republish, to post on servers or to redistribute to lists, requires prior specific permission and/or a fee. CHI 2010, April 10 – 15, 2010, Atlanta, Georgia, USA Copyright 2010 ACM 978-1-60558-929-9/10/04...$10.00. avoids congested streets and instead goes through smooth side roads with less traffic. An efficient route might be the quickest way to get between two places with the fewest num- ber of stops. A fun route could be one that goes by points of interest. These good routes are often found through an informal process of experimentation combined with knowl- edge sharing in the biking community. Biketastic aims to facilitate this knowledge exchange among bikers by creating a platform where participants can share routes and experience. Biketastic participants ride new or familiar routes while running an application on a mobile phone. The mobile phone application captures location, sens- ing data, and media. Basic route information, such as the spatial and temporal extent as well as length and speed in- formation is obtained by recording a location trace using the GPS sensor. The physical dynamics of the route are doc- umented using the accelerometer and microphone. Specifi- cally, road roughness and general noise level along a route is inferred using these sensors. Finally, the experience of a route is obtained by having individuals capture geo-tagged media, such as images and video clips of interesting, trouble- some, and beneficial assets, along with tags and descriptions while riding. The route data are uploaded to a backend plat- form which contains a map-based system that makes visual- izing and sharing the route information easy and convenient. RELATED WORK Many web systems exist to support the route planning needs of bicyclists. In this section, we describe a representative subset and detail how Biketastic differs. Existing services can be divided into mashups, geowikis, and ride loggers. Bicycling specific mashups, such as Bikely and Veloroutes, are web sites built on top of mapping APIs to enable in- dividuals to draw and share routes. Geowikis, including Cyclopath and OpenCycleMap, extend the capabilities of mashups by introducing rich geo-editing features, such as the ability to create and modify points of interest and route/path segments. Cyclopath also provides route planning based on user submitted bikeability ratings [7, 8]. Furthermore, ge- owikis contain features from traditional wikis, including the ability to comment on and watch specific regions. Ride loggers are services that enable individuals to upload ride location traces to a website for visualization and ride analytics. Typically, these services support a variety of in- put mechanisms including importing data from GPS track- ing devices and from mobile phone applications. Once the
Transcript of Biketastic: Sensing and Mapping for Better Bikingkshilton/pdf/ReddyShilton...routes are uploaded,...

Biketastic: Sensing and Mapping for Better Biking
Sasank Reddy, Katie Shilton, Gleb Denisov,Christian Cenizal, Deborah Estrin, Mani Srivastava
Center for Embedded Networked SensingUniversity of California at Los Angeles (UCLA), Los Angeles, CA 90095
{sasank, kshilton, gdenisov, ccenizal}@ucla.edu, [email protected], [email protected]
ABSTRACTBicycling is an affordable, environmentally friendly alter-native transportation mode to motorized travel. A commontask performed by bikers is to find good routes in an area,where the quality of a route is based on safety, efficiency,and enjoyment. Finding routes involves trial and error aswell as exchanging information between members of a bikecommunity. Biketastic is a platform that enriches this ex-perimentation and route sharing process making it both eas-ier and more effective. Using a mobile phone applicationand online map visualization, bikers are able to documentand share routes, ride statistics, sensed information to inferroute roughness and noisiness, and media that documentsride experience. Biketastic was designed to ensure the linkbetween information gathering, visualization, and bicyclingpractices. In this paper, we present architecture and algo-rithms for route data inferences and visualization. We eval-uate the system based on feedback from bicyclists providedduring a two-week pilot.
Author KeywordsLocation based services, mobile sensing systems, participa-tory sensing, map visualization
ACM Classification KeywordsH.5.m Information Interfaces and Presentation: Miscella-neous
General TermsAlgorithms, Design, Human Factors
INTRODUCTIONWith the rising costs and detrimental environmental effectsassociated with motorized travel, individuals are exploringalternative modes of transport. One transport type that hasbecome popular is bicycling. New and even experiencedbikers often seek “good” routes to traverse. The qualityof a route can be influenced by safety, efficiency, or over-all enjoyment. For instance, a safe route could be one that
Permission to make digital or hard copies of all or part of this work forpersonal or classroom use is granted without fee provided that copies arenot made or distributed for profit or commercial advantage and that copiesbear this notice and the full citation on the first page. To copy otherwise, orrepublish, to post on servers or to redistribute to lists, requires prior specificpermission and/or a fee.CHI 2010, April 10 – 15, 2010, Atlanta, Georgia, USACopyright 2010 ACM 978-1-60558-929-9/10/04...$10.00.
avoids congested streets and instead goes through smoothside roads with less traffic. An efficient route might be thequickest way to get between two places with the fewest num-ber of stops. A fun route could be one that goes by pointsof interest. These good routes are often found through aninformal process of experimentation combined with knowl-edge sharing in the biking community.
Biketastic aims to facilitate this knowledge exchange amongbikers by creating a platform where participants can shareroutes and experience. Biketastic participants ride new orfamiliar routes while running an application on a mobilephone. The mobile phone application captures location, sens-ing data, and media. Basic route information, such as thespatial and temporal extent as well as length and speed in-formation is obtained by recording a location trace using theGPS sensor. The physical dynamics of the route are doc-umented using the accelerometer and microphone. Specifi-cally, road roughness and general noise level along a routeis inferred using these sensors. Finally, the experience ofa route is obtained by having individuals capture geo-taggedmedia, such as images and video clips of interesting, trouble-some, and beneficial assets, along with tags and descriptionswhile riding. The route data are uploaded to a backend plat-form which contains a map-based system that makes visual-izing and sharing the route information easy and convenient.
RELATED WORKMany web systems exist to support the route planning needsof bicyclists. In this section, we describe a representativesubset and detail how Biketastic differs. Existing servicescan be divided into mashups, geowikis, and ride loggers.
Bicycling specific mashups, such as Bikely and Veloroutes,are web sites built on top of mapping APIs to enable in-dividuals to draw and share routes. Geowikis, includingCyclopath and OpenCycleMap, extend the capabilities ofmashups by introducing rich geo-editing features, such asthe ability to create and modify points of interest and route/pathsegments. Cyclopath also provides route planning based onuser submitted bikeability ratings [7, 8]. Furthermore, ge-owikis contain features from traditional wikis, including theability to comment on and watch specific regions.
Ride loggers are services that enable individuals to uploadride location traces to a website for visualization and rideanalytics. Typically, these services support a variety of in-put mechanisms including importing data from GPS track-ing devices and from mobile phone applications. Once the
routes are uploaded, workout statistics are calculated includ-ing calories burned, average pace, and route speed. Manyhave “dashboards” that accumulate ride statistics and pro-mote exercise goal setting. A popular ride logger focusedon exercise is MapMyRide [6]. EveryTrail is an alternativetailored for road and mountain routes [4].
Biketastic differs in both purpose and capability from exist-ing bike services. For instance, ride logger applications aredesigned primarily as exercise and recreational bike plan-ning/tracking tools. In contrast, Biketastic is created forusers to log commuter routes with the intention to share themwith a larger community. Biketastic augments the capabili-ties of mashups and geowikis by requiring users to actuallyride the routes they share and by capturing aspects of the ridethrough sensors. For example, in addition to logging loca-tion traces, Biketastic obtains information about road rough-ness and noise levels using accelerometers and microphonescommon on smartphones. Furthermore, the system allowsindividuals to submit media along the route.
Finally, specific logging platforms have been developed forbikes corresponding to “cyclocomputers” [9] and systemsthat consist of a network of sensors [3]. Biketastic exploresthe capture of lower resolution information in exchange foraffordability and convenience. By using mobile phones forsensing, we do not require individuals to buy expensive, spe-cialized equipment. In addition, since sensing occurs on asingle device, the user is not bothered with having to man-age several sensors in various positions on the bike.
SYSTEM DESIGN, ARCHITECTURE, AND PROCESSINGThe initial design of Biketastic involved input from the localbike community. We asked a small group of expert bikerswhat they would be interested in getting out of the platformand what features should be emphasized. Most wanted asystem where individuals could find routes in a particulararea based on the experience of others. Bikers also placed astrong emphasis on metrics to help rank the quality of routeswhere traffic density, road quality, ride efficiency, and accessto assets are contributing factors. Finally, the bike commu-nity was frustrated with existing map-based visualizationssince browsing through routes was often confusing and dif-ficult due to cumbersome, overly detailed interfaces.
CaptureWe developed a mobile phone application for the GoogleG1 platform to record bicycle route information. The appli-cation records fine-grained location traces by collecting GPSdata (latitude, longitude, and speed) every 1 second. Further-more, the application enables capturing of geo-tagged media(images or video). The microphone and the accelerometerembedded on the phone are sampled to infer route noise leveland roughness. The phone samples its audio stream and ob-tains the maximum amplitude every 1 second. The goal isto find areas that have excessive noise levels, which couldbe indicators of large vehicles or heavy traffic. The phonealso uses its accelerometer to monitor acceleration varianceof the axis corresponding to the direction pointing towardsearth, which gives an indication of both divots and bumps.
Using these sensors does have one complication - the valid-ity of the data due to phone positioning. Thus, when thebiker starts a ride, the application asks the participant wherethe phone is located (outside a bag or inside) to figure outif noise data should be gathered. Further, if the phone ismounted on the bike, the application goes through a calibra-tion phase to determine which axis corresponds to the downdirection (assuming a 3-axis accelerometer) and its offset an-gle so that meaningful roughness data can be gathered.
ProcessingAs data is collected on the mobile phone, it is uploaded toa backend sensor storage database. Once the user indicatesthat a route is complete, a series of processing operations areperformed to obtain additional inferences, to gather aggre-gate metrics about the route, and for visualization purposes.
Outlier DetectionGPS quality can be affected by the environment in whichthe ride occurs. In areas where tall buildings or over-hangsexist, location values can be significantly displaced. To ad-dress this issue, outlier detection is performed [10]. Locationpoints in which the speed exceeds an experimentally derivedthreshold of 45 mph are discarded (not likely biking points).
Sensor InterpretationThe Biketastic system enables users to compare sensor de-rived information (speed, traffic, and roughness) within aspecific route. We found that providing objective compara-tive measures across different routes is far more challengingand a subject for future work due to differences in sensorplacement, bike types, and user riding behavior. In this sec-tion, we review the techniques used to interpret the sensordata that is gathered for the within route measures.
Speed is obtained directly from the GPS sensor, but cleanedby replacing instances where the GPS based value is signifi-cantly different from the speed obtained from location pointsby using the average of the previous and next valid points.The goal of gathering sound information during a ride was tocompare traffic levels along a route. We experimented withusing both low level features such as amplitude information,as well as obtaining ambient sound classification features,including Mel-Frequency cepstrum coefficients, brightness,bandwidth, and zero crossing rate, from 1-second segments.
In general, when the phone is positioned externally with themicrophone in the opposite direction of travel, the systemcan use amplitude information to identify quiet streets withvery little traffic versus road segments with many passing ve-hicles. To support additional phone positions and to counterthe effect of wind, classifying segments of audio using ambi-ent noise sound features and supervised learning algorithmsis promising. Our preliminary work has revealed a high levelof accuracy (over 90%) when classifying with a C4.5 De-cision Tree based on 10-fold cross validation of 500 audiosegments labeled with traffic levels. We are exploring a hy-brid technique where changes in amplitude variance triggerthe classifier to run since there is a energy burden associatedwith calculating the additional audio features.
In order to obtain road roughness information, we calibratethe accelerometer so that we are able to obtain the down-ward force acting on the phone when attached to a bike. Byanalyzing the change in variance of 5 second segments, thesystem is able to indicate rough patches along a route seg-ment such as the existence of pot holes, uneven pavement,and other road deficiencies. But indicating the “intensity”of a pot hole becomes difficult due to the varying speed lev-els of bike riders. Thus, we have been experimenting withobtaining scaling parameters to normalize roughness by cap-turing training data over similar potholes at different speeds.
Summary and Derived InformationBiketastic reverse geocodes the start and end points of a rideto obtain address information. The system also calculatesroute statistics including the distance traveled and the max-imum, minimum, and average speed, noise level, roughnessalong the route. Using route location data, external indexesare queried to derive elevation and zip code information.
Route RepresentationThe final processing module involves transforming route dataso that it can be presented using the map platform. The stepsinclude: de-clustering, simplification, and smoothing. In thede-clustering step, the route is processed so that clusters ofpoints are removed for visualization appeal. Whenever auser stays stationary, several location points are uploaded.But due to the imprecise nature of GPS, the points do notoccur at the same location. De-clustering considers locationpoints sequentially, and if a new point is within a certainminimum distance from the preceding point’s center, it isconsidered part of the cluster. This continues until a point isreached that exceeds the distance threshold, and if the clus-ter is at least four points (minimum cluster size), then all thepoints are replaced with the center point [10].
Since bike routes often have intricate spatial variances, itis not always appealing to represent every nuance of a ridein all zoom levels on a map. Instead, route simplificationis desired for usability and visual appeal [1]. The highestzoom level (fine grained details) will result in the raw loca-tion data to be shown while traversing to lower zoom levels(coarse grained details) results in varying levels of route sim-plification. To accommodate this feature, we employed theDouglas-Peucker algorithm, a mechanism to select a subsetof points in a route which lie within a predefined distancethreshold of the original route [2]. By varying the distancethreshold, the level of simplification is changed.
Simplification causes location traces to be very rigid in struc-ture, making them appear as straight lines connected withsegment points. To make traces look more natural, seg-ment points need to be smoothed into curves. This is doneby finding two equidistant anchor points, along the locationtrace, and then using the bezier-curve algorithm to smooththe segment point using these anchors [5]. An example ofthe simplification and smoothing of routes is shown in Fig-ure 1 where the left route represents the original and the rightroute is the simplified and smoothed version.
Figure 1. Simplification and smoothing of route information.
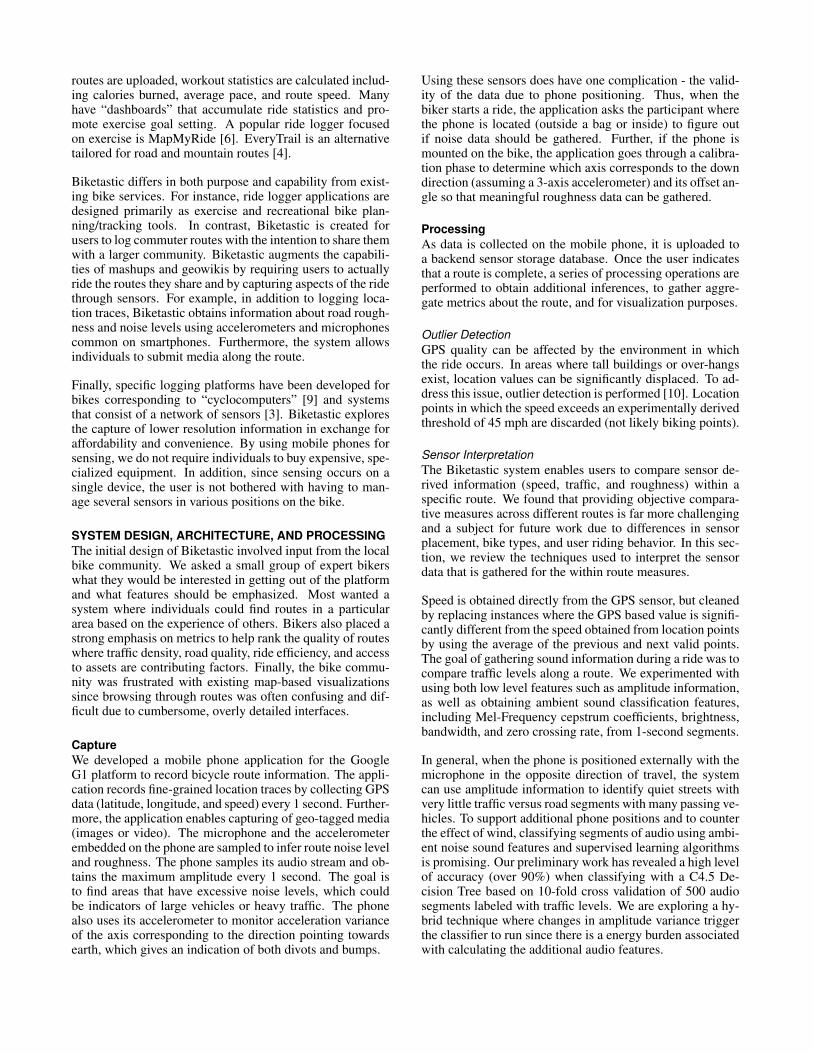
VISUALIZATIONThe Biketastic visualization has two components: a dynamicside-bar and a map. Figure 2 shows the elements in theFlash-based visualization. Individuals are initially presentedwith a screen for browsing routes. All rides from the lastmonth are shown on a map, with the ability to scroll throughprevious months. When an individual hovers over a partic-ular route, it is highlighted and the start and end address areshown with zoomed in maps of these points.
Figure 2. Side-bar and main map for exploring routes.
Individuals can investigate a route by clicking on it. Thiscauses a minimap to appear that shows the raw location dataof the route in the side-bar. Route summary statistics such asthe date, distance, and duration traversed are provided belowthe minimap. If any media was collected, thumbnails appearon the route as well. Also, each route can be referencedexternally through an unique link.
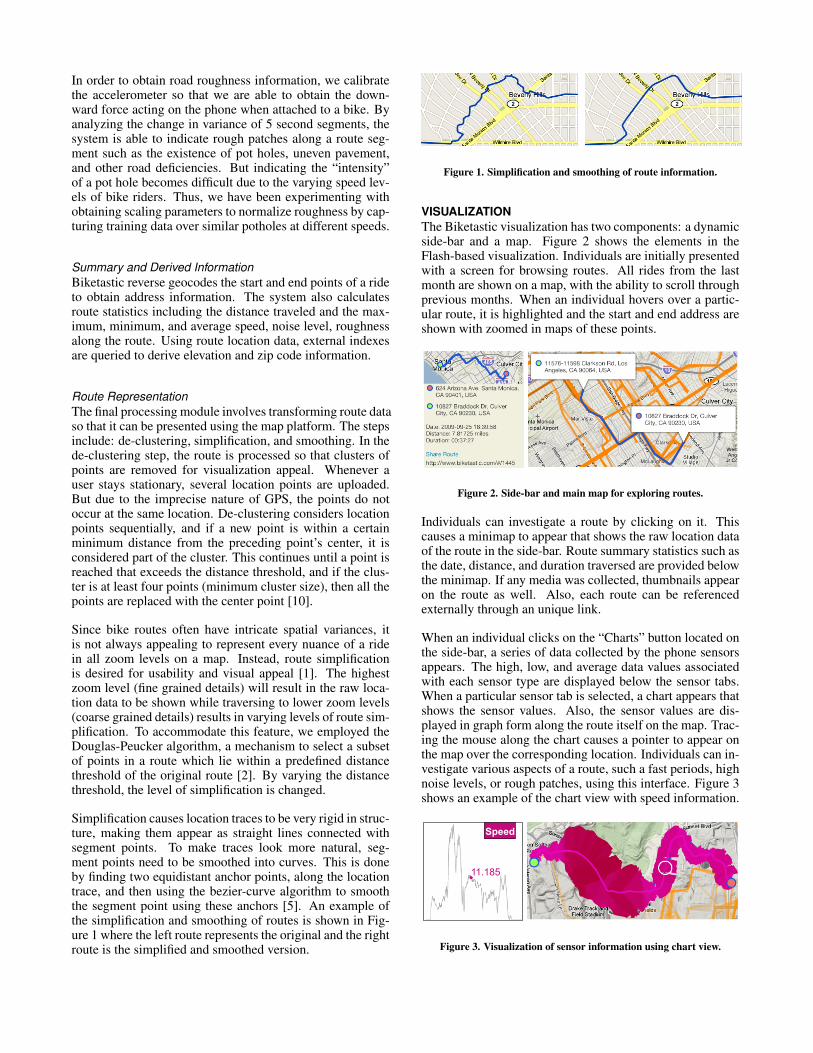
When an individual clicks on the “Charts” button located onthe side-bar, a series of data collected by the phone sensorsappears. The high, low, and average data values associatedwith each sensor type are displayed below the sensor tabs.When a particular sensor tab is selected, a chart appears thatshows the sensor values. Also, the sensor values are dis-played in graph form along the route itself on the map. Trac-ing the mouse along the chart causes a pointer to appear onthe map over the corresponding location. Individuals can in-vestigate various aspects of a route, such a fast periods, highnoise levels, or rough patches, using this interface. Figure 3shows an example of the chart view with speed information.
11.185
Speed
Figure 3. Visualization of sensor information using chart view.

EVALUATIONWe conducted a pilot evaluation with 12 users recruited vialocal bike advocacy organizations. The individuals ran Bike-tastic for two weeks, and submitted a total of 208 routes.The minimum number of routes submitted by a user was 7and the maximum was 36. The majority of users submit-ted routes on at least half of the days the pilot ran. Also,8 users submitted a total of 14 images. Every user loggedonto the website. Overall, 10 users participated in evalua-tion focus groups, which consisted of 3 sessions made up of3-4 riders. Focus group discussions centered on motivationsfor using Biketastic, system usability, and the effectivenessof information dissemination through the system. Interviewnotes were coded for discussions of usability, including sys-tem critiques and suggestions; comments about system useand cycling practices; and analysis of information learnedfrom and conclusions drawn from, the system.
Usability: Fitting System to PracticeAmong the most interesting findings of the focus groupswere the ways in which bikers overwhelmingly tied critiquesof the system to disruptions of their existing biking prac-tices. Many users used Biketastic for long rides and typicallyfound engaging the system for short routes to be cumber-some (e.g. “...for short trips it was a hassle. Turning the de-vice on and off for 1 mile is not worth it.”). The participantssuggested that the interface to engage Biketastic be simpleron the phone. Instead of going through dialogs indicatingthe positioning of the phone every time, the system shouldremember previous settings and just have a simple “start”button. Another area where practice and usability collidedwas in the media capture feature. As one rider expressed, “Iwas too lazy to stop biking and take a picture of pot hole.”Instead, users suggested that easy-to-use tags could be usedto indicate features of a route.
Participants’ suggestions for new features were also based intheir own biking practices. Riders were interested in time fil-ters to differentiate routes based on time of day, a feature wehad neglected to consider. One female biker felt that day andnight routes varied based on safety. Other bikers felt timedifferentiation was useful because traffic can differ signifi-cantly during different periods of the day. Another sugges-tion referenced the mental map that these experienced bikershad developed of their city. Biketastic automatically inferredexact addresses for start and end points, however, bikers feltthat cross streets and even neighborhood information wouldbe just as, if not more, useful. Rider information was also animportant part of cycling practice that participants felt couldbe better expressed in Biketastic. They suggested that thesystem track rider profiles, gathering such data as age, gen-der, and experience level. The system could then use this in-formation to determine what kind of people bike where andwhen. Website users could then receive recommendationsbased on these attributes.
Learning in BiketasticMost participants indicated that they initially explored theweb interface to learn new information about their own rides,such as how far were they biked and how their speed com-
pared across trips. For instance, one participant was sur-prised that “my commute is shorter than I expected” andanother user validated her suspicion that her commute was“slightly slanted” (on a long incline) using the elevation chartvisualization. During the pilot, many users also became in-terested in the routes ridden by others. Participants expressedinterest in exploring “hot spots” or routes that received a lotof coverage. The respondents felt that they either learnedor verified knowledge of popular streets and well-traversedavenues for getting from one neighborhood to another. Vi-sualization clutter caused by these frequently ridden routescould be eliminated by abstracting raw traces to road or pathsegments [8]
Participants found noise and roughness data less understand-able in its numeric or even semantic form. Instead manysuggested that changes in sensor data (e.g. from relativelylow to high levels or vice versa) be used as indicators of“events” that riders could later annotate. Furthermore, thisvalidation step by riders would eliminate false indicators ofroute friendliness. For instance, noise readings are compli-cated by the fact that riders sometimes ride on bike-friendlystretches that are right beside, but not actually on, congestedstreets. Finally, participants wanted the ability to annotatetheir routes to better engage with the data by adding captionsto sensor information and highlight route sections.
REFERENCES1. M. Agrawala and C. Stolte. Rendering effective route
maps: improving usability through generalization. InSIGGRAPH, pages 241–249. ACM, 2001.
2. D. Douglas and T. Peucker. Algorithms for thereduction of the number of points required to representa digitized line or its caricature. Cartographica, 1973.
3. S. Eisenman, E. Miluzzo, N. Lane, R. Peterson,G. Ahn, and A. Campbell. The bikenet mobile sensingsystem for cyclist experience mapping. In Sensys,pages 87–101. ACM New York, NY, USA, 2007.
4. Everytrail. Geotagging with everytrail, September2009. http://www.everytrail.com.
5. J. Foley. Computer graphics: principles and practice.Addison-Wesley Professional, 1995.
6. MapMyRide. Map your cycling, bike map andmountain biking routes, September 2009.http://www.mapmyride.com.
7. OpenCycleMap. Openstreetmap cycle map, September2009. http://opencyclemap.com.
8. R. Priedhorsky and L. Terveen. The computationalgeowiki: what, why, and how. In CSCW, pages267–276. ACM New York, NY, USA, 2008.
9. Wikipedia. Cyclocomputer, September 2009.http://wikipedia.org/Cyclocomputer.
10. C. Zhou, D. Frankowski, P. Ludford, S. Shekhar, andL. Terveen. Discovering personal gazetteers: aninteractive clustering approach. In ACM GIS, 2004.