Bicycle Facilities Master Plan - Missoula, MT
89
Bicycle Facilities Master Plan Missoula, Montana March 2017
Transcript of Bicycle Facilities Master Plan - Missoula, MT
Bicycle Facilities Master PlanMissoula, Montana
March 2017

Client:
Missoula MPO, City of Missoula
Jessica Morriss
Aaron Wilson
Ben Weiss
David Gray
David Prescott
Consultant Team:
Alta Planning + Design, Inc.
Joe Gilpin Kim Voros Erin David Aileen Daney Sam Piper Kelly Ream Kyle James
Acknowledgements:
LSA Associates, Inc.
Bicycle Facilities Master Plan

Table of Contents
Introduction . . . . . . . . . . . . . . . . . . . . . . . . . . . . . 6Bicycle Facilities Master Plan Defined . . . . 6Why Bicycling? . . . . . . . . . . . . . . . . . . . . . . . 7
Existing Network . . . . . . . . . . . . . . . . . . . . . . . . 12
Existing Use . . . . . . . . . . . . . . . . . . . . . . . . . . . . 17American Community Survey . . . . . . . . . . 17Missoula Area Transportation Survey . . . . 17Automatic Counters . . . . . . . . . . . . . . . . . . 21
Community Benefits . . . . . . . . . . . . . . . . . . . . . 22Health Benefits . . . . . . . . . . . . . . . . . . . . . . 23Environmental Benefits . . . . . . . . . . . . . . . 23Transportation Benefits . . . . . . . . . . . . . . . 25Total Benefits . . . . . . . . . . . . . . . . . . . . . . . . 25
Design Users . . . . . . . . . . . . . . . . . . . . . . . . . . . 32The Four Types of Bicyclists . . . . . . . . . . . . 32Women as an Indicator Species . . . . . . . . 33Public Outreach Summary . . . . . . . . . . . . . 33Gaps and Opportunities Analysis . . . . . . . 36Facility Selection . . . . . . . . . . . . . . . . . . . . . 42
Recommendations . . . . . . . . . . . . . . . . . . . . . . 46Recommendations Development . . . . . . . 46Bicycle Facility Recommendations . . . . . . 49Neighborhood Greenway Network . . . . . . 50Wayfinding System . . . . . . . . . . . . . . . . . . . 52Evaluation . . . . . . . . . . . . . . . . . . . . . . . . . . 54
Implementation . . . . . . . . . . . . . . . . . . . . . . . . . 60Implementation Goals . . . . . . . . . . . . . . . . 60Implementation Strategies . . . . . . . . . . . . 61Cost Estimates . . . . . . . . . . . . . . . . . . . . . . 62Performance Measures . . . . . . . . . . . . . . . 63Plan Adoption . . . . . . . . . . . . . . . . . . . . . . . 63
Table of FiguresFigure 1 . Missoula Transportation Planning Organization . . . . . . . . . . . . . . . . . . . . . . . . . . . . . 6Figure 2 . Existing Bikeways . . . . . . . . . . . . . . . 15Figure 3 . Existing Bikeways - Urban Core . . . . 16Figure 4 . Bicycle Commute Mode Split (US Census and ACS) . . . . . . . . . . . . . . . . . . . . . . . . 17Figure 5 . Active Transportation Mode Share . 18Figure 6 . Bike Count Station Map . . . . . . . . . . 19Figure 7 . Manual count summary . . . . . . . . . . 20Figure 8 . Downtown spot mode share . . . . . . 21Figure 9 . Seasonal variation in walking and bicycling . . . . . . . . . . . . . . . . . . . . . . . . . . . . . . . 21Figure 10 . Bicycle mode share growth scenarios . . . . . . . . . . . . . . . . . . . . . . . . . . . . . . 22Figure 11 . Bicycle trip growth projected in 2045 . . . . . . . . . . . . . . . . . . . . . . . . . . . . . . . . . . 22Figure 12 . Bicycle crash summary . . . . . . . . . 27Figure 13 . Bike Collision Frequency Map 2010-2014 . . . . . . . . . . . . . . . . . . . . . . . . . . . . . . . . . . 28Figure 14 . Bike Collision Frequency Map Urban Core . . . . . . . . . . . . . . . . . . . . . . . . . . . . . . . . . . . 29Figure 15 . Four types of bicyclists . . . . . . . . . 32Figure 16 . Trips by women . . . . . . . . . . . . . . . . 33Figure 17 . Wikimap results by the numbers . 34Figure 18 . Wikimap Results Map . . . . . . . . . . 35Figure 19 . Gaps & Opportunities . . . . . . . . . . . 37Figure 20. Level of Traffic Stress Model . . . . . 40Figure 21. Level of Traffic Stress Connectivity Clusters . . . . . . . . . . . . . . . . . . . . . . . . . . . . . . . 41Figure 22. Example Bikeway Configuration Alternatives . . . . . . . . . . . . . . . . . . . . . . . . . . . . 42Figure 23 . Facility Selection Chart . . . . . . . . . 43Figure 24 . Mileage of Existing and Proposed Facilities in the Missoula Urban Area . . . . . . . 46Figure 25 . Proposed Bikeways . . . . . . . . . . . . 47Figure 26 . Proposed Bikeways - Urban Core . 48Figure 27 . Proposed Neighborhood Greenway Network . . . . . . . . . . . . . . . . . . . . . . . . . . . . . . . 51Figure 28 . Bicycle LTS: Existing Conditions . . 56Figure 29 . Bicycle LTS: Proposed Network . . . 57Figure 30 . LRTP bicycle commute mode share goal . . . . . . . . . . . . . . . . . . . . . . . . . . . . . . . . . . . 61
Table of TablesTable 1. Estimated Health-Related Benefits . 24Table 2 . Estimated Environmental Related Benefits . . . . . . . . . . . . . . . . . . . . . . . . . . . . . . . 24Table 3 . Estimated Transportation Related Benefits . . . . . . . . . . . . . . . . . . . . . . . . . . . . . . . 25Table 4 . Estimated Total Bicycle Related Benefits . . . . . . . . . . . . . . . . . . . . . . . . . . . . . . . 25Table 5 . Lineal Improvements . . . . . . . . . . . . 66Table 6 . Spot Improvements . . . . . . . . . . . . . . 85


Section 1: Introduction

6 | Activate Missoula: Bicycle Facilities Master Plan6 | Activate Missoula: Bicycle Facilities Master Plan
Introduction
Bicycle Facilities Master Plan Defined
The Bicycle Facilities Master Plan establishes a detailed strategy and project list for improving bicycling in Missoula and is the guiding document for bikeway implementation . The Bicycle Facilities Master Plan supports the vision and the goals of both the Long Range Transportation Plan and the Missoula Active Transportation Plan . It provides greater detail for achieving a more connected bikeway network that increases access and minimizes stress for Missoula Residents . The relationship between these planning documents is depicted in Figure 1 .
The Bicycle Facilities Master Plan:
■ Expands the bikeway network and increase the acces-sibility of bicycling to a larger portion of Missoula residents
■ Focuses on facility types that are comfortable to a wide range of Missoula residents
■ Improves bikeway network connections by creating safer and more comfortable intersection crossings
Figure 1. Missoula Transportation Planning Organization
Long Range Transportation Plan (LRTP)
Updated in 2016
Updated every four years, the LRTP sets a priori-tized multi-modal vision for the Missoula area’s Transportation Future supporting the Envision Missoula Growth Policy . The LRTP is compliant with FHWA guidelines and makes the Missoula area eligible to receive federal funds for project implementation .
Missoula Active Transportation Plan (MATP)
Updated in 2011
The MATP lays our the community’s vision for the bike and pedestrian components of the larger, multi-modal transportation system, recommends new policies and designs and provides a list of proposed projects from which the MPO can draw in prioritizing funding .
Missoula Master Sidewalk Plan (MMSP)
Draft - 2010
The MMSP establishes a strategy for the system-atic completion, repair and upgrade of the City sidewalk system . The plan seeks to provide a continuous sidewalk system throughout the community, guide the installation of sidewalks where need is the greatest, repair hazardous and deteriorated sidewalks, meet ADA stan-dards and identify key pedestrian corridors .
Missoula Bicycle Facilities Master Plan (MBFMP)
Adopted in 2017
The MBFMP establishes a strategy for the systematic completion of a connected, acces-sible, and comfortable bikeway network . By providing greater detail on key bikeway facility investments, the plan seeks to prioritize proj-ects in order to maximize cycling potential .

Introduction | 7
Why Bicycling?
Bicycle mobility is an important component of overall mobility within the active transportation category, in concert with walking and transit .
Mobility, Independence, and Aging in Place
Nearly 25 percent, or about 21,000 of Missoula’s 86,000 urban area residents (American Community Survey) are under the age of 16 or older than 70 and are not legally able or less likely to drive, respectively . This plan does not focus only on able-bodied adults that already enjoy bicy-cling . Rather, it is especially for those who will be given greater independence as the bicycling system improves . As the “under 16” and “70 and over” age groups become more mobile through walking and bicycling, fewer auto-mobile trips will be made by their caretakers and parents, thereby improving the dependents’ health, reducing the impact on the environment, and reducing traffic conges-tion, especially around schools at drop-off and pick-up times .
Quality of Life
Bicycling and walking are also important ways to improve quality of life for existing and prospective Missoula resi-dents . Millennials and baby boomers alike are trending towards locations where they can ride a bike or walk to access their daily needs .
Cities that invest in active transportation are investing in people and their quality of life . Business decisions are increasingly being made based on quality of life amenities for employees and their families . Sidewalks, on-street bicycle facilities, shared-use paths, and transit service are important quality of life indicators . They demonstrate a commitment to healthy transportation options and lifestyles .
Safety
In cities where more people begin their commutes by walking or bicycling, corresponding fatality rates are generally lower .
Studies show that installing pedestrian and bicycle facilities directly improves safety by reducing the risk of pedestrian-automobile and bicycle-automobile crashes . For example, streets with bike lanes have been shown to be safer not just for bicyclists (compared with no bicycle facilities) but also for pedestrians and motorists .1 Streets without bicycle facilities may pose a greater collision risk . When walking and bicycling rates double, per-mile pedestrian-motorist collision risk can decrease by as much as 34 percent .2
Health
In addition to the safety benefits that occur when more people are walking and bicycling, active transportation can have many positive impacts on personal and commu-nity health issues such as diabetes, heart disease, and obesity .
1 Ewing, R. and Dumbaugh, E. (2010). The Built Environment and Traffic Safety: A Review of Empirical Evidence. Injury Prevention 16: 211-212.2 Jacobson, P. (2003). Safety in Numbers: More Walkers and Bicyclists, Safer Walking and Bicycling. Injury Prevention 9: 205-209.
Parks & Recreation Plans:
Master Parks & Recreation Plan for the Greater Missoula Area – Adopted 2004
Missoula Parks & Open Space Plan (MPOSP) – Adopted 2006
Conservation Lands Management Plan (MCLMP) – Adopted 2010
Missoula County Parks & Trails Plan – Adopted 2011
These plans were created to protect open spaces . inventory and identify needed open spaces, inven-tory and identify needs for parks, trails and other recreational needs in the Missoula area .
The MCLMP, specifically focused on designated conservations land, provides long-term main-tenance, acquisition, and design guidance for managed natural areas .
8 | Activate Missoula: Bicycle Facilities Master Plan8 | Activate Missoula: Bicycle Facilities Master Plan
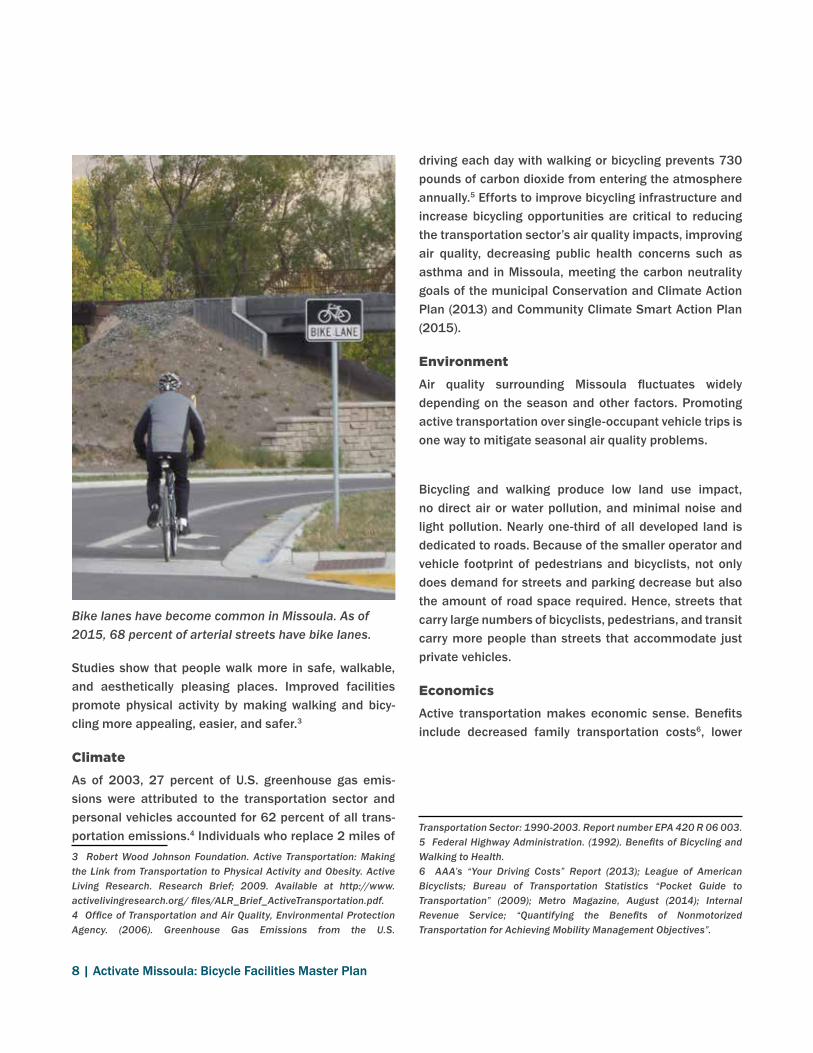
driving each day with walking or bicycling prevents 730 pounds of carbon dioxide from entering the atmosphere annually .5 Efforts to improve bicycling infrastructure and increase bicycling opportunities are critical to reducing the transportation sector’s air quality impacts, improving air quality, decreasing public health concerns such as asthma and in Missoula, meeting the carbon neutrality goals of the municipal Conservation and Climate Action Plan (2013) and Community Climate Smart Action Plan (2015) .
Environment
Air quality surrounding Missoula fluctuates widely depending on the season and other factors . Promoting active transportation over single-occupant vehicle trips is one way to mitigate seasonal air quality problems .
Bicycling and walking produce low land use impact, no direct air or water pollution, and minimal noise and light pollution . Nearly one-third of all developed land is dedicated to roads . Because of the smaller operator and vehicle footprint of pedestrians and bicyclists, not only does demand for streets and parking decrease but also the amount of road space required . Hence, streets that carry large numbers of bicyclists, pedestrians, and transit carry more people than streets that accommodate just private vehicles .
Economics
Active transportation makes economic sense. Benefits include decreased family transportation costs6, lower
Transportation Sector: 1990-2003. Report number EPA 420 R 06 003.5 Federal Highway Administration. (1992). Benefits of Bicycling and Walking to Health.6 AAA’s “Your Driving Costs” Report (2013); League of American Bicyclists; Bureau of Transportation Statistics “Pocket Guide to Transportation” (2009); Metro Magazine, August (2014); Internal Revenue Service; “Quantifying the Benefits of Nonmotorized Transportation for Achieving Mobility Management Objectives”.
Studies show that people walk more in safe, walkable, and aesthetically pleasing places . Improved facilities promote physical activity by making walking and bicy-cling more appealing, easier, and safer .3
Climate
As of 2003, 27 percent of U .S . greenhouse gas emis-sions were attributed to the transportation sector and personal vehicles accounted for 62 percent of all trans-portation emissions .4 Individuals who replace 2 miles of 3 Robert Wood Johnson Foundation. Active Transportation: Making the Link from Transportation to Physical Activity and Obesity. Active Living Research. Research Brief; 2009. Available at http://www.activelivingresearch.org/ files/ALR_Brief_ActiveTransportation.pdf.4 Office of Transportation and Air Quality, Environmental Protection Agency. (2006). Greenhouse Gas Emissions from the U.S.
Bike lanes have become common in Missoula. As of 2015, 68 percent of arterial streets have bike lanes.

Introduction | 9
Americans say that having bike lanes or paths in their community is important to them, and two-thirds of homebuyers consider the walkability of an area in their purchase decision .10 This preference for communities that accommodate walking and bicycling is reflected in property values across the country .11 Houses in walkable neighborhoods have property values $4,000 to $34,000 higher than houses in areas with average walkability .12
National Park Service. Donald L. Greer, 2001.10 Bureau of Transportation Statistics. (2010). Transportation Statistics Annual Report. Retrieved from http://www.bts.gov/ publications/transportation_statistics_annual_report/2010/.11 Racca, D.P. and Dhanju, A. (2006). Property Value/Desirability Effects of Bike Paths Adjacent to Residential Areas. Prepared for Delaware Center for Transportation and the State of Delaware Department of Transportation.12 Cortright, J. (2009). Walking the Walk: How Walkability Raises Housing Values in U.S. Cities. CEOs for Cities.
healthcare costs7, and higher property values8 .
Facilities such as shared-use paths and trails can also positively influence property values. Nearly two-thirds of homeowners who purchased their home after a path or trail was built said that the it positively influenced their purchase decision . Eighty-one percent felt that the nearby path or trail’s presence would have a positive effect or no effect on the sale of their homes9 .
7 Rous, Larissa, et al. “Cost Effectiveness of Community-Based Physical Activity Interventions”. American Journal of Preventive Medicine, 2008; Pratt, Macera & Wang. Higher Direct Medical Costs Associated with Physical Inactivity, 2000; Chenoweth, D. The Economic Costs of Physical Inactivity, Obesity, and Overweight in California Adults: Health Care, Workers’ Compensation, and Lost Productivity. Topline Report, 2005.8 “Walking the Walk”, CEOs for Cities, 2009; Lindsey, Greg, Seth Payton, Joyce Man, and John Ottensmann. (2003). Public Choices and Property Values: Evidence from Greenways in Indianapolis. The Center for Urban Policy and the Environment; “Valuing Bike Boulevards in Portland through Hedonic Regression”, 2008.9 “Omaha Recreational Trails: Their Effect on Property Values and Public Safety”. Rivers and Trails Conservation Assistance, National Park Service. Donald L. Greer, 2000; “Nebraska Rural Trails: Three Studies of Trail Impact”. Rivers and Trails Conservation Assistance,
Missoula’s first two-way cycle track connects the Milwaukee Trail to the University of Montana along Maurice Avenue.


Section 2: Existing System

12 | Activate Missoula: Bicycle Facilities Master Plan12 | Activate Missoula: Bicycle Facilities Master Plan
Existing NetworkMissoula’s existing on-street bikeway system is limited almost entirely to collector and arterial streets . Historically, City staff have responded to the public’s requests to include bike facilities on these major road-ways and desire to have direct routes to destinations with limited traffic control. Administrative Rule 415 and the Complete Streets Policy have provided good guidance on when and how to add bicycle facilities to these major roadways . However, ROW constraints, funding issues, and a lack of a cohesive vision for a connected bicycle network have led to bicycle facilities that do not connect to all destinations or to each other and vary widely in their comfort levels . Meanwhile, seventy-four percent of Missoula’s streets are local . Many of these streets represent tremendous opportunities to connect the network and maximize the amount of use it can attract . The following is a summary of the existing bikeway clas-sifications in Missoula. Existing bikeways are depicted in Figures 2 and 3 .
Cycle Tracks
Also known as Protected or Separated Bike Lanes, cycle tracks combine the user experience of a separate path with the on-street infrastructure of conventional bike lanes through various forms of physical separation from adjacent traffic. Cycle tracks are distinct from the sidewalk and can have many forms . In situations where on-street parking is allowed, cycle tracks are located to the curb-side of the parking (in contrast to bike lanes) . Cycle tracks can be at street level, at sidewalk level, or at an intermediate level . By providing greater separation from motor vehicle traffic, cycle tracks offer a higher level of security than bike lanes and are attractive to a wider spectrum of the public . Missoula currently has two such facilities, a one-way raised example on Higgins Avenue and a two-way street level example on Maurice Avenue .
Raised one-way cycle track on Higgins Avenue
Street-level two-way cycle track on Maurice Avenue

Existing System | 13
Bike Lanes
A bike lane uses signage, striping, and stenciling to designate a portion of the roadway for the preferential or exclusive use of bicyclists, allowing both motor vehicles and bicycles to operate at their typical speeds in a way intended to reduce stresses and conflicts for all. These lane markings indicate that motorists must avoid travel on the bike lane portion of the roadway .
Bike lanes can vary considerably with the amount of comfort they provide to users . A bike lane on a two lane collector with a 25 to 30mph limit will feel much more comfortable than one on a higher speed arterial with multiple travel lanes . Similarly, the presence of on-street parking makes a bike lane less comfortable to users .
Buffered Bike Lanes
Buffered bike lanes are enhancements of conventional bike lanes by including a designated painted buffer space separating the bike lane further from the adjacent vehicle travel and/or parking lane . Missoula currently has a buffered bike lane on East Spruce Street and on Arthur Ave . Buffered bike lanes can be considered on any street where sufficient width exists.
Bike Route
Bike Routes include paved shoulders an shared roadways where people biking and driving operate within the same travel lane, either side by side or single file depending on roadway configuration. The most basic type of Bike Route is a signed shared roadway, which uses a combi-nation of pavement markings and signage to identify the route and alert drivers to the presence of bicyclists . These facilities are used to connect other bikeways or designate preferred routes through high-demand corri-dors . In contrast to many other communities, Missoula typically designates bike routes on collectors and arterial roadways, often where there is not space for separate, designated bicycle facilities . This results in situations where vehicle volumes and speeds are higher and can make sharing a lane uncomfortable for all users . By designating some local streets as bike routes, Missoula has the potential to dramatically increase the number of people riding bicycles .
Bike lanes on a one-way street (Missoula Avenue)
Buffered bike lane on East Spruce Street

14 | Activate Missoula: Bicycle Facilities Master Plan14 | Activate Missoula: Bicycle Facilities Master Plan
Unpaved Trail
Natural surface trails are present in many parts of Missoula . These facilities link neighborhoods, and provide access to recreational areas . Natural surface trails can be narrow and steep such as those on Mount Jumbo, or similar in configuration to a shared-use path like the Kim Williams Trail .
Shared-Use Paths
Shared-use paths are paved off-street bikeways that are open to most forms of non-motorized use including skateboarders and rollerbladers . Shared-use paths are physically separated from roadways either in its own right of way or paralleling a roadway . Shared-use paths that parallel roadways are called sidepaths . Shared-use paths can serve as transportation and/or recreation facilities . Missoula’s most notable shared-use paths are the riverfront trail system, the Milwaukee Road, and the Bitteroot Trail .
Bike routes are currently designated on many arterial and Collector streets where bike lanes are not feasible.
The Milwaukee Trail transitions from a paved shared use path to an unpaved trail as it enters the Kim Williams Natural Area.
FIGURE 2

Existing System | 15
Figure 2. Existing Bikeways
!
!
!
!
!!
!
!
!
!
!
!
! !!
!
!!!!
!!!!!
!
!!
!!!
!!
!
!
!
!
!!
!
!
!
!
!
!
!
!
!
!
!
!
!
!
! !!
!!
!
!(
!(
!(
!(
!(
!
!
!(
!(
!
!
!(
!(
!
!(
!
!(
!
!(!(
!(
!
!
!
£¤93
£¤93
UV200
£¤12
£¤12
£¤93
RA
TTLE
SNA
KE
DR
S 7TH ST W
W RAILROAD ST
RIVER RD
BLUE MOUNTAIN
RD
SCO
TT S
T
ENGLAND
BLVD
NORTH AVE W
PATTEE CANYON
DR
TOW
ER
ST
WG
REEN
OU
GH
DR
L OW
ER
MIL
LER CREEK
RD
GR
AN
TC
REE
KRD
S 14TH ST W
EXPRESSWAY
PATTEE
CANYONRD
FLY
NN
LN
GH
AR
RE
TTST
N R
USS
ELL
ST
HILL
VI
EWW
AY
23R
DA
VE
WH
ITA
KE
R D
R
UPP
ERM
ILLER
CREEK
RD
SPEEDWAY AVE
MULLAN RD
SWHIGGINS AVE
39TH ST
SOUTH AVE W
CLE
ME
NTS
RD
S 5TH ST WS 6TH ST W
VAN BUREN ST
S 3RD ST W
E BROADWAY
HIGHWAY 10 W
AR
TH
UR
AV
E
S H
IGG
INS
AV
EW
BROA
DW
AY
BROOKS ST
NR
ESE
RV
EST
NO
RANG
EST
RU
SSEL
LST
RES
ER
VE
ST
SO
RA
NG
E ST
S 5TH ST E
STEP
HENSAVE
¥I-90
¥I-90
EXISTING BIKEWAYS¹0 1 2
MILES
EASTMISSOULA
EXISTING BICYCLE NETWORK
Bicycle Route
Bicycle Lane
Protected Bicycle Lane
Unpaved Trail
Paved Trail
Road
Rail
Water Body
Park
City Limits
OTHER EXISTING FEATURES
!( Enhanced Pedestrian Crossing
! Traffic Signal
FIGURE 2

16 | Activate Missoula: Bicycle Facilities Master Plan16 | Activate Missoula: Bicycle Facilities Master Plan
Figure 3. Existing Bikeways - Urban Core
!
!
!
!!
!
!
!
!
! ! !
!
!
!
!
!
!
!
!
!
!
!
!
!
!
!
!
!
!
!
!
!
!
!
!
!
!
!
!
!
!
!
!
!
!
!
!
!
!
!
! !!
!
!
!
!(
!(
!(
!(
!(
!
!
!(
!(
!
!
!
!(
!
!
£¤93
£¤93
£¤12
£¤12
E SPRUCE ST
LOLO ST
E MAIN ST
TOOLE AVE
E FRONT ST
MIS
SOU
LA A
VE
GR
EA
T N
OR
THE
RN
AV
E
MOUNT AVE
SPURGIN RD
BA
NC
RO
FT S
T
W RAILROAD ST
RIVER RD
SCO
TT S
T
EN
G LAND BLVD
NORTH AVE W
PAX
SON
ST
PATTEECANYO
ND
R
HIG
H
PARK WAY
WGREEN
OU
GH
DRPHILIPS ST
E BECKWITH AVES 14TH ST W
W SPRUCE ST
PALMER ST
S 7TH ST W
RODGERS ST
CEMETERY RD
N R
USS
ELL
ST
DU
NC
AN
DR
WHIT
AKER DR
WFRONT
ST
RA
TTLE
SNA
KE
DR
SWHIGGINS AVE
SOUTH AVE E
39TH ST
S 5TH ST WS 6TH ST W
VAN BUREN ST
SOUTH AVE W
S 3RD ST W
E BROADWAY
MULLAN RD
AR
TH
UR
AV
E
S H
IGG
INS
AV
E
W BRO
AD
WAY
BROOKS
ST
NO
RANG
EST
RU
SSE
LL S
T
RES
ER
VE
ST
SO
RA
NG
EST
S 5TH ST ES 6TH ST E
NR
ESER
VE
ST
STEPHENS
AVE
¥I-90
¥I-90
EXISTING BIKEWAYS - URBAN CORE¹0 0.5 1
MILES
EASTMISSOULA
EXISTING BICYCLE NETWORK
Bicycle Route
Bicycle Lane
Protected Bicycle Lane
Unpaved Trail
Paved Trail
Road
Rail
Water Body
Park
City Limits
OTHER EXISTING FEATURES
!( Enhanced Pedestrian Crossing
! Traffic Signal
FIGURE 3

Existing System | 17
Existing UseProviding an accurate picture of bicycle activity within any community is difficult. Data is typically not available or not comprehensive enough to form a complete picture of transportation behavior . Data providing counts for vehicles is by comparison much better . Both the Montana Department of Transportation and the City of Missoula have collected regular data for years, allowing long-term trends to be understood . Overall, Missoula exhibits high overall levels of active transportation (including bicycling) when compared nationally .
American Community Survey
The US Census has long been one of the only readily available sources of data to measure general levels of transportation choices . The data is limited to commute based trips to work, and does not reflect the spectrum of potential trip types available . The American Community Survey (ACS) has supplemented the 10-year cycle of the overall census to provide additional annual data . For communities the size of Missoula, annual data is not statistically valid; therefore, 5-year averages of this data are used . This method provides some insight; however, it is slow to note significant changes over time. ACS surveys are sent out at random and serve as an annual average . The data does not pick up seasonal variability
in travel behavior and has a margin of error of +/- 1 .4 percent . Figure 4 depicts bicycle commute mode share as reported by the US Census and the ACS for the last 15 years in the City of Missoula . Overall levels of bicycle commuting are stable in Missoula . Figure 5 depicts non-automobile based commuting for the various census blocks around Missoula . It is clear that bicycle commuting varies considerably depending on neighborhood, with generally higher rates—approaching 20 percent—near downtown .
Missoula Area Transportation Survey
The Bureau of Business and Economic Research at the University of Montana conducted a statistically valid transportation survey (+/- 4 percent) from September to November 2015 . It included a mix of city and county resi-dents and covered a wide variety of topics . For the survey period, a bicycle commute mode share of 15 .9 percent within the city and 3 .7 percent for county residents within the planning area was reported . Taken together these valuses average to 12 .7 percent . Further, fully 54 percent of city residents and 45 percent of county residents had ridden a bicycle within the previous 30 days . These numbers are encouraging and represent significantly higher numbers than the yearly averages that take into account seasonality such as from the ACS .
0%1%2%3%4%5%
BICY
CLE
COM
MU
TE M
ODE
SPLI
T
6%7%8%9%
10%11%12%13%
2014 2015
MISSOULA AREA TRANSPORTATION SURVEYSEPT/OCT 2015 - PEAK USAGE
ACS / US CENSUS - ANNUAL AVERAGE
4%+
ACS or CensusEstimate
Margin of Error (High)
Margin of Error (Low)
20132012201120102009200820072000
Figure 4. Bicycle Commute Mode Split (US Census and ACS)

18 | Activate Missoula: Bicycle Facilities Master Plan18 | Activate Missoula: Bicycle Facilities Master Plan
Figure 5. Active Transportation Mode Share
90
90
93
12
93
93
12
90
BROOKS ST
SW HIGGINS
SOUTH AVE W
S 3RD ST W
W BROADWAY
RESER
VE ST
AR
THU
R AVE
3%
3%
2%
1%
5%
5%
2%
2%
2%
7%
17%18%
10%
1%
19%
34%
28%
27%
52%
18%
>5%
% of census tract commuting by transit, foot or bike1
1Source: U.S. Census Bureau, American Community Survey, 2009-2013
5-10%
10-15%
15-20%
20-25%
25-30%
30-35%
<35%
% commuting by transit1
% commuting by foot1
% commuting by bike1
Missoula City Limit
Study Area
Census Tract
ACTIVE TRANSPORTATION MODE SHAREFIGURE 5

Existing System | 19
Figure 6. Bike Count Station Map
!(
!(
!(
!(
!(
!(
!(
!(
!(
!(
!(
!(!(
!(
!(!(
!(
!(
!(
!(
!(!(
!(
!(
!(
!(
!(
!(
!(
!(
!(
!(
!(
!(
!(
!(
!(
!(
!(
£¤93
£¤93
UV200
£¤12
£¤12
£¤93
RA
TTLE
SNA
KE
DR
GR
EAT
NO
RTH
ER
NAV
E
S 7TH ST W
BA
NC
RO
FT S
T
W RAILROAD ST
RIVER RD
BLUE MOUNTAIN
RD
SCO
TT S
T
NORTH AVE W
TOW
ER
ST
WG
REEN
OU
GH
DR
L OW
ER
MIL
LER CREEK
RD
GR
AN
TC
REE
KRD
S 14TH ST W
EXPRESSWAY
PATTEE
CANYONRD
FLY
NN
LN
GH
AR
RE
TTST
N R
USS
ELL
ST
HILL
VI
EWW
AY
23R
DA
VE
WH
ITA
KE
R D
R
UPP
ERM
ILLER
CREEK
RD
SPEEDWAY AVE
MULLAN RD
SWHIGGINS AVE
39TH ST
SOUTH AVE W
CLE
ME
NTS
RD
S 3RD ST W
E BROADWAY
HIGHWAY 10 W
AR
TH
UR
AV
E
W BRO
AD
WAY
BROOKS ST
N R
ESE
RV
E ST
NO
RAN
GEST
RU
SSE
LL S
T
RES
ER
VE
ST
SO
RA
NG
E
STST
EPHENS
AVE
¥I-90
¥I-90
BIKE COUNT STATION MAP¹0 1 2
MILES
EASTMISSOULA
EXISTING BICYCLE NETWORK
Bicycle Route
Bicycle Lane
Protected Bicycle Lane
Unpaved Trail
Paved Trail
Road
Rail
Water Body
Park
City Limits
OTHER EXISTING FEATURESCOUNT & STATION TYPE
!( Automatic, Continuous
!( Manual, Annual
!( Manual, Odd Years
!( Manual, Optional
FIGURE 6

20 | Activate Missoula: Bicycle Facilities Master Plan20 | Activate Missoula: Bicycle Facilities Master Plan
Bicycle Counts
Manual Counts
Since 2010, bicycle and pedestrian counts have been conducted twice per year by volunteers organized by the MPO . Data is collected at seventeen stations during even years and an additional twelve stations on odd years . Weekday counts are collected during the peak two hours in the evening from 4:00 to 6:00 pm with an earlier peak of 3:00 to 5:00 pm at stations surrounding the University of Montana . Weekend counts are collected from 12:00 to 2:00 pm . Figure 6 shows the locations of each of the count stations .
The manual counts have provided a new source of data that measures a snapshot of overall levels of bicycling for all trips, and has allowed annual comparisons at the same location and comparisons to other areas of Missoula to be made; however, the weather and air quality can have a profound impact on the observed numbers . During some Septembers, poor air quality due to local and regional fires may have depressed counts. In 2014 and 2015, the fall count week overlapped with significant rainfall and also impacted counts . These factors illustrate the limitations of relying on this data in the long term . Figure 7 summarizes some of the data collected during the manual counts . Figure 8 displays intersection counts where vehicle counts were merged with those collected manually .
Manual counts indicate a steady increase from 2010 through 2013. Although pedestrian and bicycle counts fell nearly 50% between 2013 and 2014, counts remain greater than 2010. 2010 and 2014 were both cool and rainy on most count days suggesting low counts are indicative of the imact of weather on bicycle and pedestrian volumes.
02010 2011 2012 2013 2014
5,000
10,000
15,000
20,000
From 2010 to 2014, bicyclists counted increased by
Total estimated weekday AADT at 17 annual count stations
From 2010 to 2014, over half of all pedestrians and bicyclists were recorded at downtown core count stations. Combined AADT numbers for pedestrians and bicyclists represent a large share of total roadway use.
18%
From 2010 to 2014, pedestrians counted increased by
25%
From 2011 to 2013, the largest increases in pedestrian and bicycle counts were recorded at S 6th St E and the Madison Street Pedestrian Bridge, while the most significant decreases were recorded at Arthur Ave and North Riverfront Trail - Brennan’s Wave.
Arthur Ave
-64%North Riverfront
Trail
-49%Madison Street
Pedestrian Bridge
+127%S 6th Street E
+130%
71%
21%
8%
Orange, Front & Main Count Station
Higgins and Spruce Count Station
51%
17%
32%
61%
Higgins and Front Count Station
18%
21%
Figure 7. Manual count summary

Existing System | 21
0
5,000
10,000
15,000
20,000
25,000
30,000
35,000
40,000
Jan Feb Mar Apr May Jun Jul Aug Sep Oct Nov Dec
Located on the Milwaukee Trail, the South Riverfront automated counter provides real-time data. Continuous collection provides a better understanding of how localized seasonal conditions and events impact bicyclist and pedestrian volumes. The first year of collected data illustrates the correlation between trail use, weather and localized events. Mirroring seasonal weather conditions, trail use fluctuates thourought the year.
1728
MAX
June 17
160
MIN
Dec 18
1835
MAX
21MIN
Dec 2
5
M a y 9
Smoke
Rainy
Figure 9. Seasonal variation in walking and bicycling
insight into the seasonal usage of bicycles . Figure 9 displays trail counter data collected on the Kim Williams trail for the 2015 calendar year . This data shows bicycling to be more impacted by the winter months than walking . From May to October, bicycling is more prevalent than walking .
Manual counts indicate a steady increase from 2010 through 2013. Although pedestrian and bicycle counts fell nearly 50% between 2013 and 2014, counts remain greater than 2010. 2010 and 2014 were both cool and rainy on most count days suggesting low counts are indicative of the imact of weather on bicycle and pedestrian volumes.
02010 2011 2012 2013 2014
5,000
10,000
15,000
20,000
From 2010 to 2014, bicyclists counted increased by
Total estimated weekday AADT at 17 annual count stations
From 2010 to 2014, over half of all pedestrians and bicyclists were recorded at downtown core count stations. Combined AADT numbers for pedestrians and bicyclists represent a large share of total roadway use.
18%
From 2010 to 2014, pedestrians counted increased by
25%
From 2011 to 2013, the largest increases in pedestrian and bicycle counts were recorded at S 6th St E and the Madison Street Pedestrian Bridge, while the most significant decreases were recorded at Arthur Ave and North Riverfront Trail - Brennan’s Wave.
Arthur Ave
-64%North Riverfront
Trail
-49%Madison Street
Pedestrian Bridge
+127%S 6th Street E
+130%
71%
21%
8%
Orange, Front & Main Count Station
Higgins and Spruce Count Station
51%
17%
32%
61%
Higgins and Front Count Station
18%
21%
Figure 8. Downtown spot mode share
Automatic Counters
Automatic counters have become inexpensive and provide streaming data at a particular location throughout the year. Missoula installed its first automatic counter on the Kim Williams Trail near the University of Montana in October 2014. In the fall of 2015, an additional five counters were added to the Bitteroot Trail in various loca-tions . Data recorded from the Kim Williams trail provides

22 | Activate Missoula: Bicycle Facilities Master Plan22 | Activate Missoula: Bicycle Facilities Master Plan
Community BenefitsWith bicycle mode share significantly higher than most other communities in the United States, Missoula expe-riences substantial benefits. This benefits analysis was conducted with a combination of available locally and nationally collected data . All projections are based on the most recent five-year estimates from the ACS, which are then extrapolated through the use of various multipliers derived from national studies and quantified in terms of monetary value where appropriate . The estimated monetary values are then calibrated to baseline values and compared to bicycle and walk mode commute splits of peer cities . This analysis is likely to under represent the existing levels of walking and bicycling as it is heavily influenced by the National Household Transportation Survey . It is likely that the typical Missoula resident walks and bicycles more than the average American .
Future estimates were derived from an estimate of future mode share in Missoula based on the 2045 mode share goals from the 2017 Long Range Transportation Plan . Low, mid, and high mode share growth scenarios were considered for 2045 as depicted in Figure 10 . Missoula’s projected population at 2045 is also included in this analysis . Figure 11 explores the potential increases in annual bicycle trips per year both through popula-tion growth alone and if Missoula hits the high bicycle commute mode share goal of approximately 18 percent . This figure shows that, even if bicycle commute mode share does not increase, the overall number of annual bicycle commute trips will increase by 27 percent in 2045 due to population growth alone . The high mode share goal of 18 percent at 2045 would result in a 300 percent increase in bicycle trips over existing .
Based on the analysis, Missoulian’s bike approximately 19 million miles per year based on an estimated 8 .2 million trips . This indicates the baseline value that can be projected into the future with increased mode share and increased population as variables .
0%
2013
BICY
CLE
COM
MU
TE M
ODE
SHAR
E (A
CS)
2045
2%
4%
6%
8%LOW
MID
HIGH
10%
12%
14%
16%
18%
Figure 10. Bicycle mode share growth scenarios
Figure 11. Bicycle trip growth projected in 2045
215%INCREASE
OVER 2015BASELINE
25,946,000BIKE TRIPSPER YEAR
32,840,000 BIKE TRIPSPER YEAR
10,423,000BIKE TRIPSPER YEAR
8,235,000BIKE TRIPSPER YEAR
300% INCREASE
OVER 2015BASELINE
27% INCREASE
OVER 2015BASELINE
EXISTING 6% BIKE MODE SHARE
HIGH GOAL 18% BIKE
MODE SHARE
ESTIMATE
EXISTING BIKE MODE
SHARE + PROJECTED
POPULATION INCREASE
HIGH GOAL ESTIMATE + PROJECTED
POPULATION INCREASE
2015 2045

Existing System | 23
Health Benefits
Missoula’s existing levels of bicycling equate to a great deal of physical activity. The Benefit Impact Model quan-tifies this existing estimated hours of physical activity and projected increases if modes share increases in the future. Benefits include improved community health and reduced household healthcare spending . The primary inputs into the health component of the Benefit Impact Model derived from 2009-2013 ACS journey to work data, 2009 National Household Travel Survey, and historic Safe Routes to School data . Existing bicycle and walk commute data was multiplied by national trip purpose ratios to generate mode split data that includes all trip purposes . This balanced mode split data was indexed against the mode split data of Missoula’s six peer cities, and multiplied by various health factors .
Environmental Benefits
Many communities have minimal existing levels of bicycling . The existing levels of walking and bicycling provide environmental benefits to the community by not being emissions generating trips . Building off the health benefits analysis where annual trips and miles traveled and the mode share growth scenarios, the implications for hydrocarbon, particulate matter, nitrous oxides, carbon monoxide and carbon dioxide (CO2) can be estimated . This analysis uses national methodologies to determine trip replacement . Every walking or bicycling trip is not equal to a replaced vehicle trip . Based on a review of air emissions studies, each pound of emis-sions was assigned an equivalent dollar amount based on how much it would cost to clean up the pollutant or the cost equivalent of how much damage the pollutant causes to the environment . Other potential ecological services associated with bicycle projects such as water
IN ANNUAL HEALTHCARE COST SAVINGSThat’s the equivalent of 1,700 trips to the doctor!
$297,000 22%
750MILES BIKED PER YEAR
TRIPS AROUNDTHE EARTH!
19,000,000 That’s the equivalent of
ANNUAL MILES BIKED
REDUCED HEALTHCARE COSTS ANNUAL PHYSICAL ACTIVITY FROM BICYCLING
OF MISSOULA RESIDENTS MEETING THE CDC RECOMMENDED HOURS OF PHYSICAL ACTIVITY JUST FROM BICYCLING ( ~30 minutes/day)

24 | Activate Missoula: Bicycle Facilities Master Plan24 | Activate Missoula: Bicycle Facilities Master Plan
regulation, carbon sequestration, carbon storage, and waste treatment exist, but the quantifiable value of these services are negligible on the overall impact . Even at existing levels of bicycling, Missoula may avoid almost 9
million pounds of CO2 from being released into the atmo-sphere; reaching the high mode share goal could save an additional estimated 10 million pounds of CO2 from being released annually .
Baseline Low Mid High
Total Total Difference Total Difference Total Difference
Annual Bike Trips 8,235,000 8,649,000 414,000 17,297,000 9,062,000 25,946,000 17,711,000
Annual Miles by Bike 18,998,000 19,579,000 581,000 31,737,000 12,739,000 43,895,000 24,897,000
Annual Hours of Physical Activity
1,900,000 1,958,000 58,000 3,174,000 1,274,000 4,390,000 2,490,000
Rec . Physical Activity Minimum Met
14,500 15,000 500 24,000 9,500 34,000 20,000
Regional Physical Activity Need Met
21 .4% 22 .0% 0 .7% 35 .7% 14 .3% 49 .4% 28 .0%
Total Health Related Savings
$297,000 $312,000 $15,000 $625,000 $328,000 $937,000 $640,000
Table 1. Estimated Health-Related Benefits
Baseline Low Mid High
Total Total Difference Total Difference Total Difference
CO2 Emissions Reduced (lbs)
9,327,000 9,795,000 468,000 19,591,000 10,264,000 29,386,000 20,059,000
Other Vehicle Emissions Reduced (lbs)
242,000 255,000 13,000 509,000 267,000 764,000 522,000
Total Vehicle Emission Related Savings
$250,000 $263,000 $13,000 $525,000 $275,000 $788,000 $538,000
Table 2. Estimated Environmental Related Benefits
C02 EMISSIONS REDUCED PER YEAR 242,000 lbs OF OTHER VEHICLE EMISSIONS REDUCED
9,327,000 lbsREDUCED VEHICLE EMISSIONS

Existing System | 25
values were assigned to the transportation-related bene-fits. This analysis is the most conceptual of the three, and actual savings may not ultimately result in the provided estimate .
Total Benefits
Further improving the bicycling system in Missoula will result in more trips being taken by bicycle . Increases in mode share can yield significant annual benefits. The city currently experiences approximately $9 .6 million in annual benefits from bicycling, and could experience a further $480,000 to $11 million in additional benefits depending on population growth and varying levels of future mode share increases .
Transportation Benefits
The most readily-identifiable benefits of active transpor-tation exist in its ability to increase transportation options and access to activity centers for Missoula residents and visitors . Real savings can be estimated from the reduced costs associated with congestion, vehicle crashes, road maintenance, and household vehicle operations .
Using the same annual VMT reduction estimates high-lighted in the health and environmental components, transportation-related cost savings were calculated . By multiplying the amount of VMT reduced by established multipliers for traffic congestion, vehicle collisions, road maintenance, and vehicle operating costs, monetary
Baseline Low Mid High
Total Total Difference Total Difference Total Difference
Annual VMT Reduced
7,473,000 7,848,000 375,000 15,696,000 8,223,000 23,543,000 16,070,000
Reduced Traffic Congestion Costs
$523,000 $549,000 $26,000 $1,099,000 $576,000 $1,648,000 $1,125,000
Reduced Vehicle Crash Costs
$3,736,000 $3,924,000 $188,000 $7,848,000 $4,112,000 $11,772,000 $8,036,000
Reduced Road Maintenance Costs
$1,121,000 $1,177,000 $56,000 $2,354,000 $1,233,000 $3,532,000 $2,411,000
Household Vehicle Operation Cost Savings
$4,259,000 $4,473,000 $214,000 $8,947,000 $4,688,000 $13,420,000 $9,161,000
Total Transportation Benefits
$9,639,000 $10,123,000 $484,000 $20,248,000 $10,609,000 $30,372,000 $20,733,000
Table 3. Estimated Transportation Related Benefits
Baseline Low Mid High
Total Total Difference Total Difference Total Difference
Health Benefits $297,000 $312,000 $15,000 $625,000 $328,000 $937,000 $640,000
Environmental Benefits
$250,000 $263,000 $13,000 $525,000 $275,000 $788,000 $538,000
Transportation Benefits
$9,639,000 $10,123,000 $484,000 $20,248,000 $10,609,000 $30,372,000 $20,733,000
Total Benefits $10,186,000 $10,698,000 $512,000 $21,398,000 $11,212,000 $32,097,000 $21,911,000
Table 4. Estimated Total Bicycle Related Benefits

26 | Activate Missoula: Bicycle Facilities Master Plan26 | Activate Missoula: Bicycle Facilities Master Plan
Bicycle Crash Analysis 2007-2014
Bicycle crashes are typically underreported as many minor collisions that do not involve injury or significant property damage are unlikely to produce a police report . Crash data for the 5-year period of 2007 to 2014 was obtained as part of the Long Range Transportation Plan Update . 394 Bicycle involved crashes were recorded within the five year period. The vast majority of these crashes, 77 percent, occurred along the arterial and collector system . Only 23 percent occurred on local roadways . Of the 394 crashes, 67 percent occurred at or involved an intersection . A summary of the overall crashes is shown in Figures 12 and crashes are visually depicted in Figures 13 and 14 .
The data indicates a that a focus on intersection safety and providing alternative parallel bikeways to many of the major streets enabling Missoulians to get around without using some of the busier streets could help reduce the number of crashes significantly.
394Crashes involving bicylists
99 Incapacitating or Fatal Accidents25% of total bike crashes (3 fatal)
16 Involved impaired drivers4% of total bike crashes
17 Involved failure to yield right-of-way4% of total bike crashes
This “ghost bike” was placed at the location of a bicycle fatality at Mount Avenue and Plymouth Street.

Existing System | 27
2007
2008
2009
2010
2011
2012
2013
2014
Where do Bicycle Crashes Occur?
Arterials
Collectors
56%
12%
Of Crashes
Of Road Miles
Crashes by Year
Crashes by Street
0
10
20
30
40
50
60
70
80
21%
13%
Of Crashes
Of Road Miles
23%
75%
Of Crashes
Of Road Miles
Local Streets
0
10
20
30
40
50
60
Res
erve
St
Bro
adw
ay S
t
Bro
oks
St
Rus
sell
St
Hig
gins
Ave
Ora
nge/
Ste
phen
s
Sou
th A
ve
67% Occured within100 feet of aintersection
Figure 12. Bicycle crash summary
Note: Intersections between streets were counted for both streets

28 | Activate Missoula: Bicycle Facilities Master Plan28 | Activate Missoula: Bicycle Facilities Master Plan
Figure 13. Bike Collision Frequency Map 2010-2014
£¤93
£¤93
UV200
£¤12
£¤12
£¤93
RA
TTLE
SNA
KE
DR
S 7TH ST W
W RAILROAD ST
JOH
NSO
N S
T
RIVER RD
BLUE MOUNTAIN
RD
SCO
TT S
T
ENGLAND
BLVD
NORTH AVE W
TOW
ER
ST
WG
REEN
OU
GH
DR
L OW
ER
MIL
LER CREEK
RD
GR
AN
TC
REE
KRD
S 14TH ST W
EXPRESSWAY
PATTEE
CANYONRD
FLY
NN
LN
GH
AR
RE
TTST
HILL
VI
EWW
AY
23R
DA
VE
WH
ITA
KE
R D
R
UPP
ERM
ILLER
CREEK
RD
SPEEDWAY AVE
MULLAN RD
SWHIGGINS AVE
39TH ST
SOUTH AVE W
CLE
ME
NTS
RD
S 5TH ST WS 6TH ST W
S 3RD ST W
E BROADWAY
HIGHWAY 10 W
S H
IGG
INS
AV
EW
BROA
DW
AY
BROOKSST
NR
ESER
VE
ST
RU
SSE
LLST
RES
ER
VE
ST
¥I-90
¥I-90
BIKE COLLISION FREQUENCY 2010-2014¹0 1 2
MILES
EASTMISSOULA
EXISTING BICYCLE NETWORK
Bicycle Route
Bicycle Lane
Protected Bicycle Lane
Unpaved Trail
Paved Trail
Road
Rail
Water Body
Park
City Limits
OTHER EXISTING FEATURESCOLLISION FREQUENCY
!( 6 - 8
!( 3 - 5
!( 2
!( 1
FIGURE 13

Existing System | 29
Figure 14. Bike Collision Frequency Map Urban Core
£¤93
£¤93
£¤12
£¤12
E SPRUCE ST
LOLO ST
E MAIN STE FRONT ST
MIS
SOU
LA A
VE
GR
EAT
NO
RTH
ER
NAV
E
MOUNT AVE
SPURGIN RD
BA
NC
RO
FT S
T
W RAILROAD ST
JOH
NSO
N S
T
RIVER RD
SCO
TT S
T
ENGLAND BLVD
NORTH AVE W
PAX
SON
ST
PATTEECANYO
ND
R
HIG
H
PARK WAY
WGREEN
OU
GH
DRPHILIPS ST
W SPRUCE ST
PALMER ST
S 7TH ST W
RODGERS ST
CEMETERY RD
N R
USS
ELL
ST
DU
NC
AN
DR
WHIT
AKER DR
RA
TTLE
SNA
KE
DR
MULLAN RD
SWHIGGINS AVE
SOUTH AVE E
39TH ST
S 5TH ST WS 6TH ST W
VAN BUREN ST
SOUTH AVE W
S 3RD ST W
E BROADWAY
AR
TH
UR
AV
E
S H
IGG
INS
AV
E
W BRO
AD
WAY
BROOKS ST
NO
RANG
EST
RU
SSE
LL S
T
RES
ER
VE
ST
SO
RA
NG
EST
S 5TH ST ES 6TH ST E
NR
ESER
VE
ST
STEPHENS
AVE
¥I-90
¥I-90
BIKE COLLISION FREQUENCY 2010-2014 - URBAN CORE¹0 0.5 1
MILES
EASTMISSOULA
EXISTING BICYCLE NETWORK
Bicycle Route
Bicycle Lane
Protected Bicycle Lane
Unpaved Trail
Paved Trail
Road
Rail
Water Body
Park
City Limits
OTHER EXISTING FEATURESCOLLISION FREQUENCY
!( 6 - 8
!( 3 - 5
!( 2
!( 1
FIGURE 14


Section 3: Needs Analysis

32 | Activate Missoula: Bicycle Facilities Master Plan32 | Activate Missoula: Bicycle Facilities Master Plan
Design UsersBicyclists, similar to pedestrians, are much more affected by poor facility design, construction and main-tenance practices than motor vehicle drivers . Bicyclists lack the protection from the elements and roadway hazards provided by an automobile’s structure and safety features .
It is important to consider bicyclists of all skill levels when planning and implementing bikeways . Bicycle infrastructure should accommodate as many user types as possible, with decisions for separate or parallel facili-ties based on providing a comfortable experience for the greatest number of people .
The current AASHTO Guide to the Development of Bicycle Facilities (2012) encourages designers to identify their rider type based on the trip purpose (Recreational vs . Transportation) and on the level of comfort and skill of the rider (Causal vs . Experienced) .
The Four Types of Bicyclists
A more detailed framework for understanding of the US population as a whole, not just existing bicyclists, was developed by planners in Portland, Oregon1, and supported by national research2. This classification provides the following alternative categories to address varying attitudes towards bicycling in the US:
Strong and Fearless: Characterized by bicyclists that will typically ride anywhere regardless of roadway conditions or weather . These bicyclists can ride faster than other user types, prefer direct routes, and will typi-cally choose roadway connections—even if shared with vehicles—over separate bicycle facilities such as shared-use paths .
1 Roger Geller, City of Portland Bureau of Transportation. Four Types of Cyclists. http://www.portlandonline.com/transportation/index.cfm?&a=237507. 2009.2 Dill, J., McNeil, N. Four Types of Cyclists? Testing a Typology to Better Understand Bicycling Behavior and Potential. 2012.
Figure 15. Four types of bicyclists
STRONG & FEARLESS
INTERESTED BUT CONCERNED
NO WAY, NO HOW
ENTHUSED & CONFIDENT
1-3%
%50-60
%5-10
%30

Needs Analysis and Methods | 33
Public Outreach Summary
This Bicycle Facilities Master Plan was produced concurrently with the Missoula MPO’s Long Range Transportation Plan (LRTP) . As such, a robust level of public involvement was included in the planning process . Additionally, outside sources of recent information such as the 2015 Missoula Area Transportation Survey were consulted . The following sections summarize this input; however, they do not include activities or outreach targeted at the overall LRTP .
Missoula Transportation Summit and Bicycle Workshop
The project team, in partnership with the Missoula MPO, held a two-day series of public workshops on November 4 and 5, 2015 . The bicycle network workshop was held at the Missoula Public Library and was attended by over seventy-five members of the public. Attendees were given an overview of bicycle facilities and then released to a series of activities . One activity featured area and city maps for more general bicycle related comments . In this way, the activity mirrored the wikimap format and output available on the project website (described in the following section) . A second activity was also conducted asking participants to form small groups and develop a network of “neighborhood greenways,” which are local streets that are enhanced and prioritized for bicycle and
Enthused and Confident: This user group encom-passes bicyclists who are fairly comfortable riding on all types of bikeways but usually choose low-traffic streets or shared-use paths when available . These bicyclists may deviate from a more direct route in favor of a preferred facility type . This group includes all kinds of bicyclists—commuters, recreational riders, racers, and utilitarian riders .
Interested but Concerned: This user type comprises the bulk of the bicycling population and represents bicyclists who typically only ride on low-traffic streets or shared-use paths under favorable weather condi-tions. These users perceive significant barriers to their increased use of bicycling, specifically traffic and other safety issues, and may become “Enthused and Confident” with encouragement, education, and experience .
No Way, No How: People in this category are not bicyclists, and perceive severe safety issues with riding in traffic. Some people in this group may eventually become more regular cyclists with time and education . A significant portion of these people will not ride a bicycle under any circumstances . This group may also include residents who are physically unable to ride a bicycle .
Women on Bikes
The presence of women riding bicycles is often used as an indicator of how bicycle friendly a community is . In some European countries such as Germany, Denmark and the Netherlands, women take slightly more than half of all the bicycling trips . In the United States this number is approximately 24 percent3 . Data gathered during the Missoula bicycle and pedestrian counts at seventeen locations from 2010 through 2014 showed consistent numbers year over year with women making 35 percent of the bicyclists counted at all stations . This number is higher than the national average but still below what it could be . Comparing data from various US cities and western European cities has indicated some correlation between a city having better bicycle infrastructure and more women bicycling .
3 Pucher & Buehler, City Cycling, Massachusetts Institute of Technology, 2012
Figure 16. Trips by women
WOMEN REPRESENT
Sources: ACS 2013, 1-yr est; NHTS 2009; Missoula Counts
51% population
NATIONALLY IN MISSOULA
51% population 51% walking trips 51% walking trips
24% biking trips 35% biking trips
34 | Activate Missoula: Bicycle Facilities Master Plan34 | Activate Missoula: Bicycle Facilities Master Plan
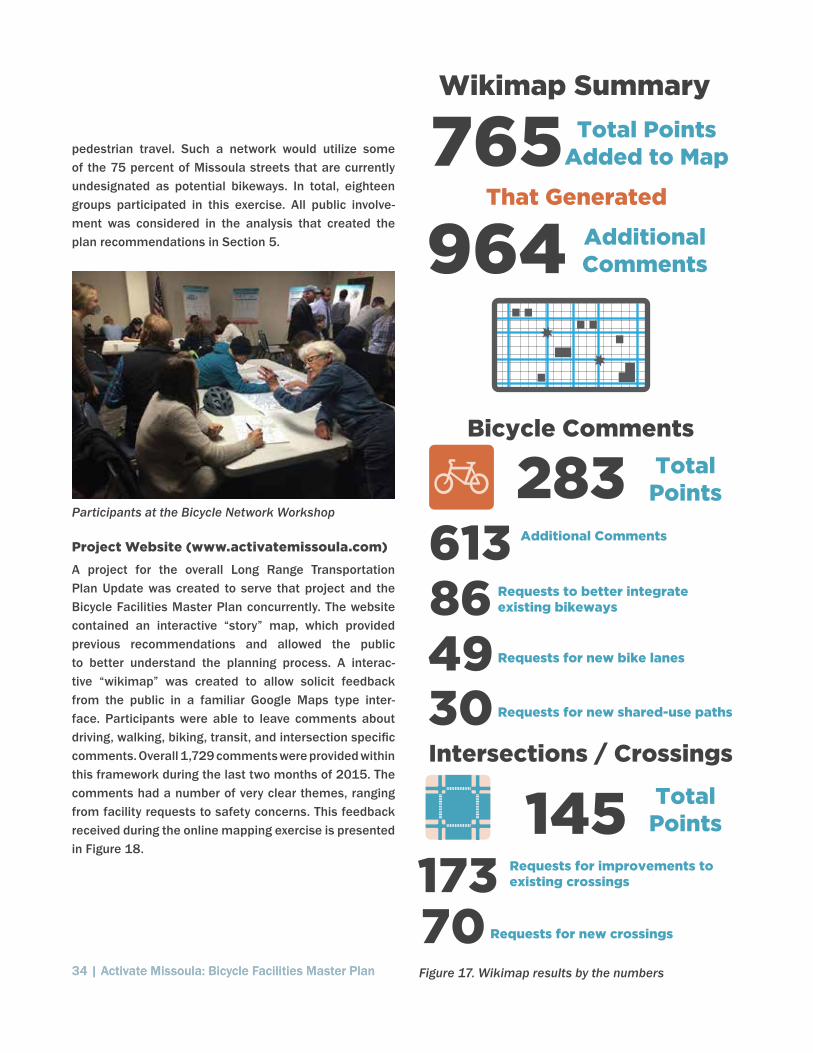
pedestrian travel . Such a network would utilize some of the 75 percent of Missoula streets that are currently undesignated as potential bikeways . In total, eighteen groups participated in this exercise . All public involve-ment was considered in the analysis that created the plan recommendations in Section 5 .
Project Website (www.activatemissoula.com)
A project for the overall Long Range Transportation Plan Update was created to serve that project and the Bicycle Facilities Master Plan concurrently . The website contained an interactive “story” map, which provided previous recommendations and allowed the public to better understand the planning process . A interac-tive “wikimap” was created to allow solicit feedback from the public in a familiar Google Maps type inter-face . Participants were able to leave comments about driving, walking, biking, transit, and intersection specific comments . Overall 1,729 comments were provided within this framework during the last two months of 2015 . The comments had a number of very clear themes, ranging from facility requests to safety concerns . This feedback received during the online mapping exercise is presented in Figure 18 .
283
964
TotalPoints
TotalPoints
AdditionalComments
765 Total PointsAdded to Map
86
That Generated
145
Requests to better integrate existing bikeways
613 Additional Comments
30 Requests for new shared-use paths
49 Requests for new bike lanes
70 Requests for new crossings
173 Requests for improvements to existing crossings
Bicycle Comments
Intersections / Crossings
Wikimap Summary
Participants at the Bicycle Network Workshop
Figure 17. Wikimap results by the numbers
FIGURE 18

Needs Analysis and Methods | 35 Figure 18. Wikimap Results Map
£¤93
£¤93
UV200
£¤12
£¤12
£¤93
RA
TTLE
SNA
KE
DR
GR
EA
TN
OR
THE
RN
AVE
S 7TH ST W
BA
NC
RO
FT S
T
W RAILROAD ST
RIVER RD
BLUE MOUNTAIN
RD
ENGLAND
BLVD
NORTH AVE W
PATTEE CANYON
DR
TOW
ER
ST
L OW
ER
MIL
LER CREEK
RD
GR
AN
TC
REE
KRD
S 14TH ST W
EXPRESSWAY
PATTEE
CANYONRD
FLY
NN
LN
GH
AR
RE
TTST
HILL
VI
EWW
AY
23R
DA
VE
WH
ITA
KE
R D
R
UPP
ERM
ILLER
CREEK
RD
SPEEDWAY
AVE
MULLAN RD
SWHIGGINS AVE
39TH ST
SOUTH AVE W
CLE
ME
NTS
RD
S 3RD ST W
E BROADWAY
HIGHWAY 10 W
AR
TH
UR
AV
E
WBRO
AD
W
AY
NR
ESE
RV
EST
RU
SSE
LLST
RES
ER
VE
ST
STEP
HENSAVE
¥I-90
¥I-90
WIKIMAP RESULTS¹0 1 2
MILES
EASTMISSOULA
EXISTING BICYCLE NETWORK
Bicycle Route
Bicycle Lane
Protected Bicycle Lane
Unpaved Trail
Paved Trail
Road
Rail
Water Body
Park
City Limits
OTHER EXISTING FEATURESCOMMENT TYPE
! Bicycle Facility
! Pedestrian
! Intersection
FIGURE 18

36 | Activate Missoula: Bicycle Facilities Master Plan36 | Activate Missoula: Bicycle Facilities Master Plan
Issues and Themes
Figure 17 provides a high-level summary of public comment with regard to the bicycle network . For bicy-clists, connection between bikeways was critical, with over 211 net likes on comments related to closing gaps between existing trails and on-street pathways or improving access destinations, with requests on extension of the Bitterroot Branch Trail being the most commented-upon topic, with over twenty respondents mentioning it . Safety and maintenance issues were also highly requested, with 36 and 35 net likes on related comments respectively . Street and shoulder width, pave-ment issues on shoulders, and dead-ends of bike lanes without transition were repeated throughout comments . There were also multiple comments about being uncom-fortable sharing lanes with vehicles on busier collector roadways .
Residents also responded with bicycle and pedestrian issues at intersections . Many comments requested roundabouts or praised existing roundabouts, with over 27 net likes . Other common observations were issues with motorist speed at intersections, lack of signals or other treatments to aid crossings of arterial and collector roadways, and line-of-sight concerns .
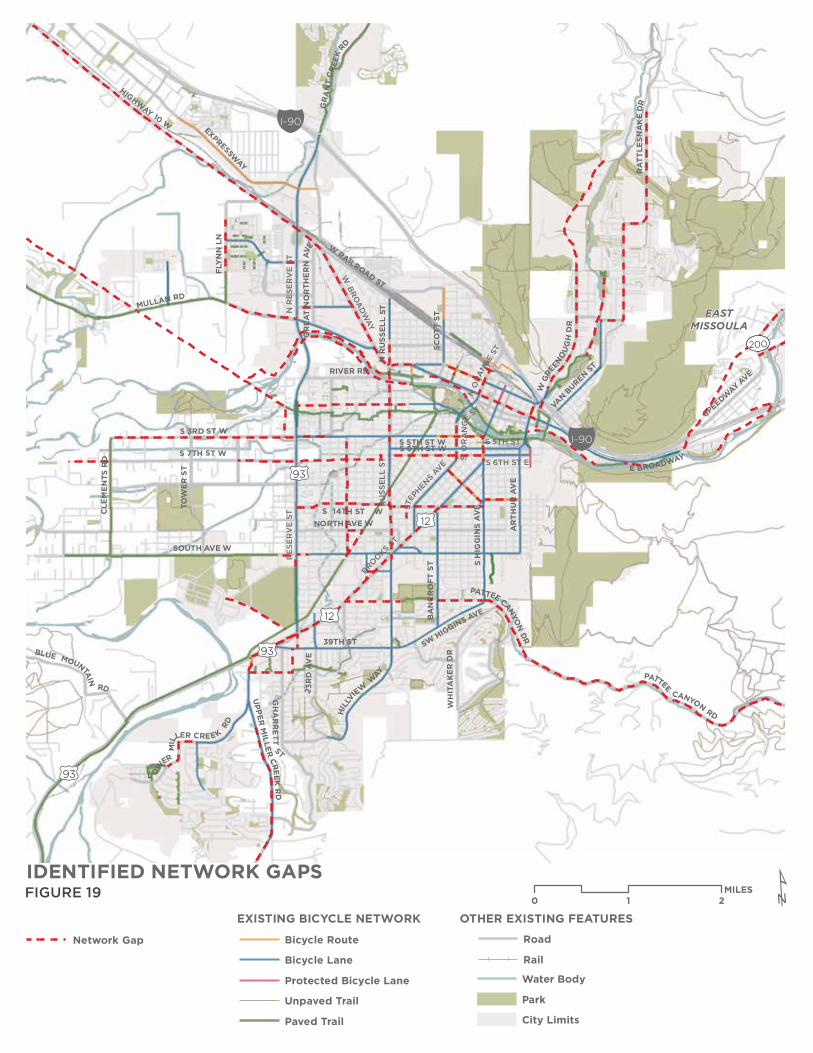
Gaps and Opportunities Analysis
Although the existing bicycling system in Missoula is good by national standards, gaps and needs still exist, many of which are addressed in this plan . Opportunities differ from gaps because they represent the potential for development of facilities that are not necessarily missing segments, An example of this would be an under-utilized right of way that could be used for a new shared-use path or a popular bicycling route that lacks existing facilities . Many of Missoula’s designated bike routes exist only as shared lane markings within the travel lanes of busy arterials and collectors . These routes were designated precisely because they constitute a gap between formal
bikeways . As these treatments do not result in a comfort-able solution for most bicyclists, they are identified as gaps in Figure 19 . While it should not be considered comprehensive, this figure does show many of the more significant opportunities/gaps that exist in Missoula.
South 14th Street is designated as a bike route but carries heavy traffic and is uncomfortable for many bicyclists.
This bicycle crossing treatment along Burton Street across West Broadway Street represents what some of the seventy comments about new crossing treatments may be seeking.
Needs Analysis and Methods | 37
Figure 19. Gaps & Opportunities
£¤93
£¤93
UV200
£¤12
£¤12
£¤93
RA
TTLE
SNA
KE
DR
GR
EA
TN
OR
THE
RN
AVE
S 7TH ST W
BA
NC
RO
FT S
T
W RAILROAD ST
RIVER RD
BLUE MOUNTAIN
RD
SCO
TT S
T
NORTH AVE W
PATTEE CANYON
DR
TOW
ER
ST
WG
REEN
OU
GH
DR
L OW
ER
MIL
LER CREEK
RD
GR
AN
TC
REE
KRD
S 14TH ST W
EXPRESSWAY
PATTEE
CANYONRD
FLY
NN
LN
GH
AR
RE
TTST
N R
USS
ELL
ST
HILL
VI
EWW
AY
23R
DA
VE
WH
ITA
KE
R D
R
UPP
ERM
ILLER
CREEK
RD
SPEEDWAY AVE
MULLAN RD
SWHIGGINS AVE
39TH ST
SOUTH AVE W
CLE
ME
NTS
RD
S 5TH ST WS 6TH ST W
VAN BUREN ST
S 3RD ST W
E BROADWAY
HIGHWAY 10 W
AR
TH
UR
AV
E
S H
IGG
INS
AV
EW
BROA
DW
AY
BROOKS ST
N R
ESE
RV
E ST
NO
RANG
EST
RU
SSEL
LST
RES
ER
VE
ST
SO
RA
NG
E ST
S 5TH ST E
S 6TH ST E
STEP
HENSAVE
¥I-90
¥I-90
IDENTIFIED NETWORK GAPS¹0 1 2
MILES
EASTMISSOULA
EXISTING BICYCLE NETWORK
Bicycle Route
Bicycle Lane
Protected Bicycle Lane
Unpaved Trail
Paved Trail
Road
Rail
Water Body
Park
City Limits
OTHER EXISTING FEATURES
Network Gap
FIGURE 19

38 | Activate Missoula: Bicycle Facilities Master Plan38 | Activate Missoula: Bicycle Facilities Master Plan
Level of Traffic Stress Model
The Level of Traffic Stress (LTS) Analysis was adapted from the 2012 Mineta Transportation Institute Report 11-19: Low-Stress Bicycling and Network Connectivity . A level of comfort for bicyclists is determined based on factors including posted speed limit, traffic volume, street width, and the presence and character of bicycle lanes or shoulders of sufficient width. The combination of this criteria separates the bicycle network into one of four scores:
■ LTS 1: Low-stress roadway suitable for all ages and abilities
■ LTS 2: Roadway comfortably ridden by the main-stream adult population
■ LTS 3: Roadway ridden by “enthused and confident” bicyclists
■ LTS 4: Roadway only ridden by the “strong and fear-less” bicyclists
In general, streets with separated bicycle facilities or streets with extremely low volume and speeds would qualify as a low-stress (LTS 1) bikeway, while roadway shared with motor vehicle traffic operating at high speeds and volumes would receive a higher-stress score . The results of the LTS analysis helps identify existing areas with a high level of service as well as focus areas for improvement. Local streets with low traffic and low volume can be quite comfortable to most bicyclists despite being a shared lane environment . The LTS anal-ysis is specifically focused on the street environment, adjacent shared-use paths (if present) offer a more comfortable facility type that is not reflected it the LTS score . Shared-use paths and trails are shown in Figure 20 for additional context . The City of Missoula assisted with considerable data collection to make this analysis possible . As part of a larger data collection effort, streets with bicycle lanes were measured by hand to determine travel lane width, bicycle lane width, and parking lane width (if present) .
LTS provides an intuitive framework to describe the bene-fits of bicycle infrastructure, and demonstrates that some roadways may require more intervention than others to provide a truly comfortable experience . For example, the only time a standard bike lane is considered all ages and abilities is a 6 foot wide facility on a roadway with posted speed of 30 mph or lower, and the best score achiev-able on a roadway with four or more travel lanes without installing a separated bike lane is LTS 3 .
Figure 21 depicts clusters of streets within Missoula suitable for all ages and abilities that are connected . In general, existing roadways that are considered comfort-able do not provide access across areas . Clusters are fragmented and often break at major roadways . It is possible that enhanced intersections, new crossing opportunities, and improved lineal facilities could link many of these clusters, enabling a larger percentage of Missoula residents to feel comfortable bicycling for transportation and recreation . This analysis leans more heavily on the additional role that shared-use paths and trails can play in low-stress connectivity .
Local streets with low traffic volumes and speeds rank as LTS 1.
LTS 1

Needs Analysis and Methods | 39
Fully separated bike lanes like Higgins Avenue and Maurice Avenue also qualify as LTS 1.
Bicycle lanes with no on-street parking and moderate speeds/volumes can be attractive for the mainstream population, as in this example on North 2nd Street near Greenough Drive).
Bike lanes where traffic speeds and volumes are higher and on-street parking is present can be more stressful and may only be utilized by more experienced bicyclists.
Sharing the traffic lane or riding on streets with high traffic volumes and speeds is not comfortable for the majority of residents.
LTS 1 LTS 2
LTS 3 LTS 4

40 | Activate Missoula: Bicycle Facilities Master Plan40 | Activate Missoula: Bicycle Facilities Master Plan
Figure 20. Level of Traffic Stress Model
£¤93
£¤93
UV200
£¤12
£¤12
£¤93
RA
TTLE
SNA
KE
DR
GR
EA
TN
OR
THE
RN
AVE
S 7TH ST W
BA
NC
RO
FT S
T
W RAILROAD ST
RIVER RD
BLUE MOUNTAIN
RD
SCO
TT S
T
NORTH AVE W
PATTEE CANYON
DR
TOW
ER
ST
WG
REEN
OU
GH
DR
L OW
ER
MIL
LER CREEK
RD
GR
AN
TC
REE
KRD
S 14TH ST W
EXPRESSWAY
PATTEE
CANYONRD
FLY
NN
LN
GH
AR
RE
TTST
N R
USS
ELL
ST
HILL
VI
EWW
AY
23R
DA
VE
WH
ITA
KE
R D
R
UPP
ERM
ILLER
CREEK
RD
SPEEDWAY AVE
MULLAN RD
SWHIGGINS AVE
39TH ST
SOUTH AVE W
CLE
ME
NTS
RD
S 5TH ST WS 6TH ST W
VAN BUREN ST
S 3RD ST W
E BROADWAY
HIGHWAY 10 W
AR
TH
UR
AV
E
S H
IGG
INS
AV
E
W BRO
AD
WAY
BROOKS ST
N R
ESE
RV
E ST
NO
RANG
EST
RU
SSEL
LST
RES
ER
VE
ST
SO
RA
NG
E ST
S 5TH ST E
S 6TH ST E
STEP
HENSAVE
¥I-90
¥I-90
BICYCLE LEVEL OF TRAFFIC STRESS¹0 1 2
MILES
EASTMISSOULA
Road
Rail
Water Body
Park
City Limits
OTHER EXISTING FEATURES
1: All Ages and Abilities
2: Average Adult
3: Intrepid Adult
4: Not Comfortable
FIGURE 20

Needs Analysis and Methods | 41
Figure 21. Level of Traffic Stress Connectivity Clusters
SSS 33 WWWWWWWWWWWWW
BBBBBBBBRRRRRRRRRRROOOOOOOOOOOOKKKKKKKKKKKKKSSSSTTTTTTTTTTTTTT
RRUUUUUUU
SSSSSSSSSSSSSS
EEEELLLLLLLLLLLLLL
LLLLLLLLLLLLLLLLLLLLLLLLLLLLLLLLLLLLLLLLLLLLLLLLLLLLLLLLLLLLLLLLLLLLLLLLLLLLLLLLSSSSSSSS
TTTTTTTT
RRRRREEEEEEEEEEEEEEEEE
SSSSSSSSSSSEEEEEEEEEEEEEEEE
RRRVVVVVVVVVVVVVVVVVVVVV
EESSSSSSSSS
TTTTTTTT
SSHHHHHHH
IIGGGGGGGGGGGGGGGGGGGGGGGGG
IINNNNNNNNNNNNSSSSSSS
AAAAAAAAVVVVVVVVVVV
AV
AAV
AAV
AAV
AAV
AEEEEEEEEEEEEEEEEEEEEEEEEEEEEEEEEEEE
SSSSSSPPPPPPUUUURRRRGGGIIINNN RRRDDDDDD
EEEEEEEEEEEE BBBBBBBBBBBBBBBBBBBRRRRRRRRRRROOO
YYY
DDDDDWWWWWWWWWWAAAAAAAAAAAAAAAAWAWWAWWAWYYYYAYAAYA
PPPPPPPPPAAAAAAAARRRRRRRRRRRR
KKKKKKKKKKKKKKKSSSS
TTTTTTTTTTTTTTT
SSSCCCCC
AAATTT
LLLIIIIIIIIIIIIINNN
SSSSSSSSSSTT
AAAAAAAAAAAAARRRRRRRRRRR
TTTTTTTTTTTTTTTHHHHHHHHHHHHH
UUUUUUURR
AAAAAAAAAAVVV
AV
AAV
AEEEE
WWWWWWWWWWWWWWWWWWWWWWWWWWWWWW CCCCCCCCCCCCEEENNNTTTTTTTTTTRRRRRRRRRRRRRRRAAAAAAAAAAALLLLLLL AAAAAAAAAAAAAAAAAAAAAVVVVVVVVVVVVVVVAVAAVAAVAAVA EEEEEE
UUUUUUUUUNNNNNNNNNNNNNNNTTTTTTTTTTTTTTT AAAAAAAAAAAAAAAAAAVVVVVVVVVVVAVAAVAAVAAVA EEEEEEEEEEEEEEEEEEEE
WWWWWWWYYYYYYYOOOOOOOOOOOOOOOOMMMMMMMMMMMMMMMMIIIIIINNNNNNNNNNNNNGGGG
BBBBBBBBBBBBBBBBBBBBBBBAAA
NNNNNNNNNCCC
RRRRRRROOOOOOO
FFFFTTTT
SSTTTTTTT
TTTTTTTTTTTTTTTTTTT
TTTTTTTTTTTTTTTTTTTTTT
PPPPPPPPPPPPHHHHHHHHHHHHHIILLLLLLLLLLLLIIPPPPPPPPPPSS
EEEEEEEEEEEEEEEEEEELLLLLLLLLL
LLSSSSSSSS
TTTTTTTT
CCCCCCCLLLLLLL
AAAAAAARRRRRRR
KKKKKSSSSS
TTTTTTT
LLLLOOOOOOOOOOOOOOOOOLLLLLLLOOOOOOOOOOOOOOO SSSSSSTTT
SSSSSSSSSSSSS 6666666666666TTTTTTTTTTTTTHH SSTTTTTTTTTTT EE
RRRRRRRRRRROOOOOOOOOOOOOLLLLLLLLLLLLLLLLLIIINNNNNNNNNNSSSSSSSSS
SSSSSSTTTTTTTTTTTTT
RRRRRRREENNNSSSSSTTTTTTTTTTTTTTTTTTTT
WWWWSSSSSSSSSSSSSSSPPPPPPPPPPPPPPRRRUUUUUUUUUUUUUUUCCCCCCCCCCCCCCEE
TTTT
MMMMMMMMMMMMMMMUUUUUUULLLLLLLLLLLLLLLLLLLLLLLLLLLLLLLLLLLLAAAAANNNNNNNNNNNNNNNNN RRRRRDDDD
TTT
NNNNNNNNNNNNNNOOOOOOOOOOORRRRRRRRTTTTTTTHHHHHHHHHHHHHHHHHHHHHHH AAVVVVVVVVVAVAAVA EEEEEEE WWWWWWWWWWWWW
NNNNNN2222222NNNNNNNNNNNNN
DDDDD
HHHHHHHHHAAAAAAAAAAAAAA
SSSSSSSSSSSSSSS TTTTTTTTTTTTTTTTTTTTT WWWWWWWWWWWWWWWWWWWWWWWWWWWWWWWW
RRRROOOO
VVVVVEEEE
SSSSTTTTTTTTT SSSSSSSTTTTTT
RRIIVVEEEEEEEEEEE
¥I-90
SSS 3333RRRRRRRRDDDDDDDDDDDDD SSSSSSSSSSSSSSSTTTTTTT WWWWWWWWWWWWWSS 77TTTTTTTTTTTTHH SSSSTTTTTTT WWWWWWWW
BBBBBBBBRRRRRRRRRRRROOOOKKKKKKKKKKKKKKSSSSTTTTTTTTTTTTTT
RRUUUUUUU
SSSSSSSSSSSSSSS
EEEEEEEEEEEEELLLLLLL
LLLLLLLLLLLLLSS
TTTTTTTT
RRREEEEEEEEEEEEEEEE
SSSSSSSSSEEEEEEEEEEEEEEE
RRRVVVVVVVVVVV
ES
TTSSSSSSSSSSSSS 555555555555TTTTTTHHHHHHH SSSSSTTTTTTTTTTTTT WWWWWWWWWWWWWWWWWWWWWWWW
EEAA
TTA
TA
OOOOOONN
SSTT
SSHHHHHHHHHH
IIGGGGGGGGGGGGGGGGGGGGGGGGG
IINNNNNNNSSS
AAAAAAAAVVVVVV
AV
AAV
AAV
AAV
AAV
AAV
AAV
AAV
AAV
AAV
AEEEEEEEEEEEEEE
SSSSSSPPPPUUUURRRGGGIIINNN RRRRRRRRRDDDDDDDDDD
EEEEEEEEEEEEE BBBBBBBBBBBBBBRRRRRRRRRRROOOOOOOOAAAAAAAAAAAAAAAAAAAAAAADDDDDDWWWWWWWWWWWWWWWWWAAAYYYYYYYYYYYYAYAAYA
WWWWWWWWWWWWWWWWWWWWWWWWWWWWWWWBBBBBRRRRRRRRRROOOOOOOOOOOOOOOOOOOOOOOOOOOOOAAAAAAAAAAAAAAADDDDDDDDDDWWWWWWWWWWAAAAAAAAAAAAAAAAAAAAAAAAAAAAAAAAAAAAAAAWAWWAWWAWWAWWAWWAWWAW
YYYYYYYYYYAYAAYA
PPAARR
KKSS
TT
SSCC
AATT
LLLIIIIIIIIIIIIINNN
SSSSSTT
AAAAAAAAAAARRRRRRRRRRR
TTTTTTTTTTTTTTHHHHHHHHHHH
UUUUUUUUUUURR
AAAAAAAAVVV
AV
AAV
AEE
WWWWWW CCCEENNTTRRAAAALLLLLLLLLLL AAAAAAAAAAAAAAAAAAAAAAVVVVVVVVVVVVVVAVAAVAAVA EEEEEEE
NNNTTTTTTTTTTTTTTTT AAAAAAAAAAAAAAAAAVVVVVVVVAVAAVAAVA EEEEEEEEEEEEEEE
WWWWWWWWWWWYYOOOOOOOOOOOOOOOOOOOOMMMMMMMMMMMMMIIIIIIIIIIIIIIIIIIIINNNNNNNNNNNNNNGGGG SSTTTTTTTTTTTTTT
EEEEEDDDDIIIIITTTTHHHH
SSSSSTTTT
AAANNNNNNNNNNNNNN
CCCRRRRRRRRR
OOOOOOOOFFFF
TTTTTTTTSSSSSSSSSSSSSS
TT
NNNNNNNNNRRRRRRRRRRRRRRRRRRRRRRR
UUUUUUUSSSS
SSSSSSSSSSSSSSSSSSSSSSSSSSSSEEEEEEEEEEEEEEE
LLLLLLLLLLLLLLLLLLLLLL
SSSSSSSSSSTTTTTTTT PPHHIIIIIIIIIIIIILLIIIIIIIIIIIPPSSSSSSSSSS
SSTTTT
LLLLLLLLLLOOOOOOOOOOOOOOLLLLLLLLLLLLLLOOOOOOOOOOOO SSSSSSSST
SSSSSSS 6666666666666TTTTTTTTTTTTTHHH SSTTTTTTTTTTTTTTTTTT EE
RRRROOOOLLLLLLIIINNNSSSSS
SSSSSSTTTTTTTTTTT
VVVVVVVVVVVVVVVVAAAAAAAAAAAAAAVAVVAVNNNNNNNNNNN
BBBUUURRRRRRREEEEEEEEEEEEEENNSSSSTTTTTTTTTTTTTTT
MMMMMUUUUUUUUUUUULLLLLLLLAAAAAAAAAAAAAAAAAAAAAAAAAAANNNN RRRRRRRRRRRRRRRRRRRRRRRDDD
WWWWWWWWWWWWWWWWWWSSSSSSSSSSSSSPPPPPPPPPPPPPRRUUUUUUUUUUUUUUCCCCCCCCCCCCCEE SSSTTTT
2222222NNNNNNNNNNNN
NNNNNNNNNOOOOOOOOOOORRRRRRRRRTTTTHHHHHHHHHHHHHHHHHHHHHHHHHHHHHH AAVVVVVVVVVVVVAVAAVA EEEEEEEEE WWWWWWWWWWWWWW
HHHHAAAAAAAAAAAAAAA
ZZZZZZZZZZZZZZZEEEEE
LLLLLLLLLLLLLSSSSSS
TTTTTT
SSSSSSSSS 666TTHHHHHH SSSSSSTTTTTTTTTTTTTT WWWWWWWWWWWWWWWTTTTTTTTT
111111SSSSSSSSSSSSSSSSSSSSSSSSSSSSSSTTTTTTTTTTTTTTTT SSSSSSSSSSRRRRRRRIIVVEEEEEEEEEEEEEERRRRRRRRRRRRR RRRRRRRRRDDDDDDDDDDDD
¥I-90
0 0.5 1MILES ¹
LOW-STRESS NETWORK CONNECTIVITYConnectivity clusters depict connectivity of roadways classified as suitable for all ages. The top map depicts only public roadways that score as an LTS 1. The bottom map includes paved trails in addition to the LTS 1 roadways. Trails increase network connectivity and result in fewer disconnected islands of facilities that serve all ages and abilities.
FIGURE X.X
LTS 1 ROADWAYS
LTS 1 ROADWAYS +PAVED TRAILS
FIGURE 21Connectivity clusters depict connectivity of roadways classified as suitible for all ages and abilities (LTS1). Clusters isolated from each other are identified through different colors. The top map depicts only public roadways that score as LTS 1. The bottom map includes paved shared use paths in addition to the LTS 1 roadways. Trails increase netowrk connectivity and result in fewer disonnected clusters.

42 | Activate Missoula: Bicycle Facilities Master Plan42 | Activate Missoula: Bicycle Facilities Master Plan
Facility Selection
Selecting the best bikeway facility type for a given roadway can be challenging, due to the range of factors that influence bicycle users’ comfort and safety. One of the most important factors to consider when designing for bicyclists is determining the type of bicycle user the facility is meant to attract . User preference varies with bicyclist’s skill level, trip purpose, and individual char-acteristics, and no simple rule exists for determining what users prefer . Nationwide, there is an increasing trend toward reducing the stress level of bicycling, thereby making it a more attractive activity for a larger percentage of the population .
There is no standard national approach for formulaic bicycle facility selection . Figure 22 demonstrates how multiple bicycle facility types are typically possible within the same amount of road space . Most agencies work to craft a customized set of criteria unique to local conditions .
Figure 23 represents a broad overview whereby roadway speed, volume and the number of vehicle travel lanes can provide some insight into what types of bicycle facility may be appropriate. This figure is based on collaboration with many US cities and subject matter experts. Additional factors may influence the decision to select one facility type over another beyond looking at speed and volume characteristics by themselves . For example, high frequency bus service could suggest that an alternate corridor be considered . Similarly, under utilized curb parking, or curb parking adjacent to large surface parking lots could be substituted for bike lanes if sufficient space does not exist to add bike lanes on their own . Bicycle facilities can be upgraded over time as opportunities arise to provide a greater level of comfort .
Figure 22. Example Bikeway Configuration Alternatives
8 feet
8 feet
A parking buffered bike lane (above) consumes the same amount of road space as a parking protected separated bike lane (below). Bike facilities can be upgraded over time as local resources increase in sophistication and resources.

Needs Analysis and Methods | 43
Figure 23. Facility Selection Chart
AVERAGE ANNUAL DAILY TRAFFIC (1,000 veh/day or 100 veh/peak hr)
NEIGHBORHOOD GREENWAYLTS 1 ‒ 2
LTS 1 ‒ 4
LTS 2 ‒ 4
LTS 2 ‒ 3
LTS 1 ‒ 2
LTS 1 ‒ 2
Comfortable and attractive bicycling environment without utilizing physical separation; typically employs techniques to prioritize and improve safety for people bicycling and walking. The lower the speed and volume, the lower the stress level.
Marking that is applicable on roadways where speed differential between motorists and bicyclists is low and/or to fill short gaps in the bikeway network. Bike routes identified on higher speedcollectors and arterials can be uncomfortable for most users.
Exclusive space for bicyclists through the use of pavement markings and signage (without buffers or barriers). Bike lanes on higher speed and volume streets result in greater traffic stress.
Traditional bike lane separated by painted buffer to vehicle travel lanes and/or parking lanes. Buffered Bike lanes on higher speed and volume streets result in greater traffic stress.
Physically separated bikeway with a vertical element. Could be one or two way and separated by a variety of techniques. The quality of Intersection treatments impacts user stress.
Completely separated from roadway, typically shared with pedestrians. The quality of Intersection treatments impacts user stress.
BIKE ROUTE
BIKE LANE
BUFFERED BIKE LANE
SEPARATED BIKE LANE
SHARED-USE PATH
FACILITY TYPE
BICYCLE FACILITY CONTEXTUAL GUIDANCE
POSTED TRAVEL SPEED (mph)
20 30 40 5025 35 45 5515 60+
1062 15+ 25+4 80
0 2 3 4 5 6 7 8 9 10+
20+ 30+
# of Lanes
# of Lanes
Speed
Volume
Speed
Volume
Speed
Volume
Speed
Volume
Speed
Volume
Speed
Volume
# of Lanes
# of Lanes
# of Lanes
# of Lanes
# of Lanes
SPEED
max
max
min
min
VOLUME
maxmin LANESLevel of Traffic Stress (LTS)
LTS 4 - Strong & Fearless AdultLTS 3 - Intrepid AdultLTS 2 - Average AdultLTS 1 - All Ages & Abilities
LEGEND
Desired AcceptableAcceptable
FACILITY SELECTION CHARTFIGURE 23


Section 4: Recommendations

46 | Activate Missoula: Bicycle Facilities Master Plan46 | Activate Missoula: Bicycle Facilities Master Plan
RecommendationsPeople who ride bicycles vary in their physical abilities, experience levels and the types of bicycles that they ride much more than users of other modes of transportation . A network of bicycle facilities designed in a way that accommodates these different types of bicyclists will result in a more connected city with higher bicycle use for all trip types .
This plan’s proposed bicycle network seeks to provide Missoula residents and visitors with viable, convenient, safe, and healthy transportation choices .
Recommendations Development
The recommendations provided in this chapter are based on a number of sources that include:
■ Analysis and validation/modification of recom-mendations contained in the 2012 Long Range Transportation Plan
■ Analysis and validation/modification of recommen-dations contained in the 2011 Active Transportation Master Plan
■ Public input for the 2016 Long Range Transportation (public meetings and online feedback)
■ Stakeholder Input . Projects were vetted with City, County and MPO staff . System ideas, concerns and preferences were also collected during other meet-ings and stakeholder interviews .
■ Field Analysis . Field work was conducted throughout the planning process by project consultants and MPO staff .
■ Connectivity/Gap analysis contained in the Needs Analysis Chapter
■ Level of Traffic Stress. Recommendations were gener-ated with the intent of making more of the Missoula area accessible by a larger portion of residents .
■ Other recent planning efforts such as the Mall rede-velopment plans and the North Reserve / Scott Street Master Plan .
■ National Bicycle Facility Design Guides such as the AASHTO Guide for the Development of Bicycle Facilities and the NACTO Urban Bikeway Design Guide
In many cases the project descriptions in Appendix A list multiple options for implementation which could have varying levels of comfort . For example a bike lane could be implemented conventionally, or with lane narrowing or parking reconfiguration could be buffered or separated.
Figure 24. Mileage of Existing and Proposed Facilities in the Missoula Urban Area
49.5
37
0
11.7
0.4
101
88.1
31
2.5 1.20
20
40
60
80
100
120
Shared Use Paths Bike Lane NeighborhoodGreenways
Bike Routes Separated Bike Lane*
Mile
s
2015 2045 (Buildout)
* Many bike lanes may be configured as separated bike lanes
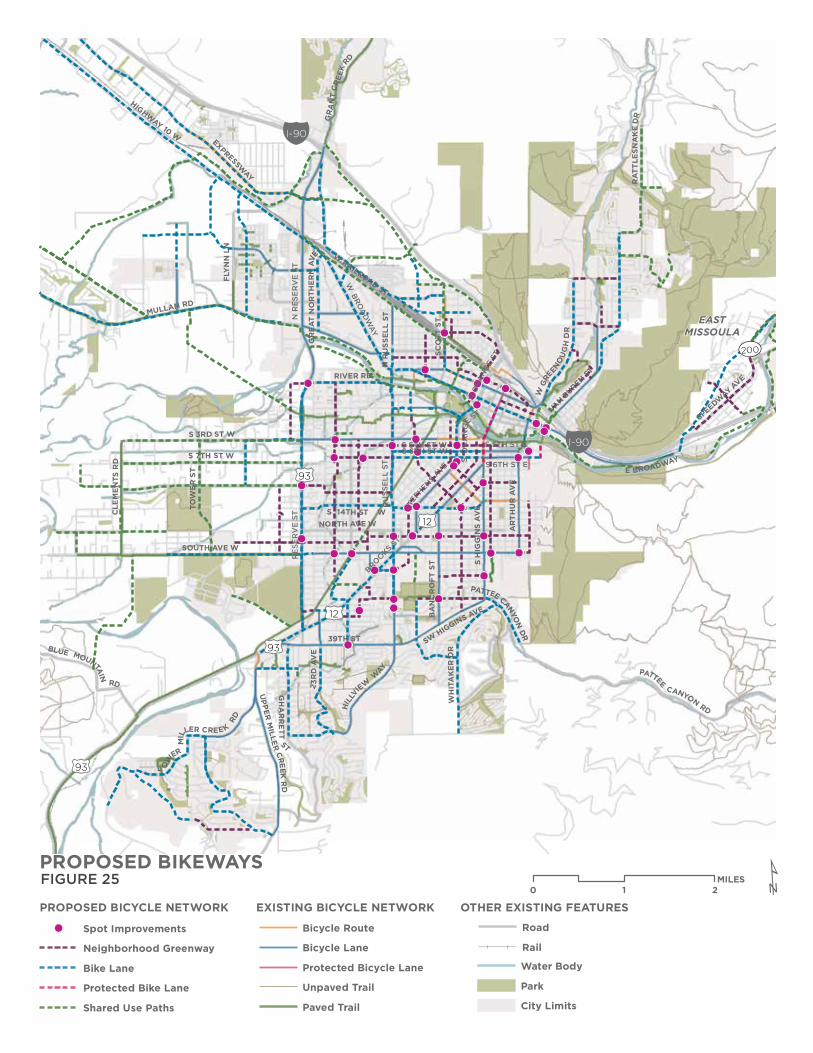
Recommendations | 47
Figure 25. Proposed Bikeways
!(
!(
!( !(
!(
!(!(
!(
!(
!(!(
!(
!(
!(
!(
!(
!(
!( !(
!( !(
!(!(
!(
!(
!(
!(
!(
!(
!(
!(
!(
!(!(
!(!(!(
!(!(
!(!(
!(
!( !(
!(
£¤93
£¤93
UV200
£¤12
£¤12
£¤93
RA
TTLE
SNA
KE
DR
GR
EA
TN
OR
THE
RN
AVE
S 7TH ST W
BA
NC
RO
FT S
T
W RAILROAD ST
RIVER RD
BLUE MOUNTAIN
RD
SCO
TT S
T
NORTH AVE W
PATTEE CANYON
DR
TOW
ER
ST
WG
REEN
OU
GH
DR
L OW
ER
MIL
LER CREEK
RD
GR
AN
TC
REE
KRD
S 14TH ST W
EXPRESSWAY
PATTEE
CANYONRD
FLY
NN
LN
GH
AR
RE
TTST
N R
USS
ELL
ST
HILL
VI
EWW
AY
23R
DA
VE
WH
ITA
KE
R D
R
UPP
ERM
ILLER
CREEK
RD
SPEEDWAY AVE
MULLAN RD
SWHIGGINS AVE
39TH ST
SOUTH AVE W
CLE
ME
NTS
RD
S 5TH ST WS 6TH ST W
VAN BUREN ST
S 3RD ST W
E BROADWAY
HIGHWAY 10 W
AR
TH
UR
AV
E
S H
IGG
INS
AV
EW
BROA
DW
AY
BROOKS ST
N R
ESE
RV
E ST
NO
RANG
EST
RU
SSEL
LST
RES
ER
VE
ST
SO
RA
NG
E ST
S 5TH ST E
S 6TH ST E
STEP
HENSAVE
¥I-90
¥I-90
PROPOSED BIKEWAYS¹0 1 2
MILES
EASTMISSOULA
EXISTING BICYCLE NETWORK
Bicycle Route
Bicycle Lane
Protected Bicycle Lane
Unpaved Trail
Paved Trail
Road
Rail
Water Body
Park
City Limits
OTHER EXISTING FEATURESPROPOSED BICYCLE NETWORK
!( Spot Improvements
Neighborhood Greenway
Bike Lane
Protected Bike Lane
Shared Use Paths
FIGURE 25

48 | Activate Missoula: Bicycle Facilities Master Plan48 | Activate Missoula: Bicycle Facilities Master PlanFigure 26. Proposed Bikeways - Urban Core
!(
!(
!( !(
!(
!(
!(
!(
!(
!(!(
!(
!(
!(
!(
!(
!(
!( !(
!( !(
!(
!(
!(
!(
!(
!(
!(
!(
!(
!(
!(
!(
!(
!(!(
!(
!(
!(
!(!(
!(
!( !(
!(
£¤93
£¤93
£¤12
£¤12
E SPRUCE ST
LOLO ST
E MAIN ST
TOOLE AVE
E FRONT ST
MIS
SOU
LA A
VE
GR
EA
T N
OR
THE
RN
AV
E
MOUNT AVE
SPURGIN RD
BA
NC
RO
FT S
T
W RAILROAD ST
JOH
NSO
N S
T
RIVER RD
SCO
TT S
T
ENGLAND BLVD
NORTH AVE W
PAX
SON
ST
PATTEECANYO
ND
R
HIG
H
PARK WAY
WGREEN
OU
GH
DRPHILIPS ST
E BECKWITH AVE
W SPRUCE ST
PALMER ST
S 7TH ST W
RODGERS ST
CEMETERY RD
N R
USS
ELL
ST
DU
NC
AN
DR
WHIT
AKER DR
WFRONT
ST
RA
TTLE
SNA
KE
DR
SWHIGGINS AVE
SOUTH AVE E
39TH ST
S 5TH ST WS 6TH ST W
VAN BUREN ST
SOUTH AVE W
S 3RD ST W
E BROADWAY
MULLAN RD
AR
TH
UR
AV
E
S H
IGG
INS
AV
E
W BRO
AD
WAY
BROOKS ST
NO
RANG
EST
RU
SSE
LL S
T
RES
ER
VE
ST
SO
RA
NG
EST
S 5TH ST ES 6TH ST E
NR
ESER
VE
ST
STEPHENS
AVE
¥I-90
¥I-90
1
2
3 4
5
6 7
8
9
10
11
12
13
14
15
16
17
1819
20 21 23
24
25
26
27
28
29
30
31
32
3334
35
3637
38
39
4041
42
4344
45
PROPOSED BIKEWAYS - URBAN CORE¹0 0.5 1
MILES
EASTMISSOULA
EXISTING BICYCLE NETWORK
Bicycle Route
Bicycle Lane
Protected Bicycle Lane
Unpaved Trail
Paved Trail
Road
Rail
Water Body
Park
City Limits
OTHER EXISTING FEATURESPROPOSED BICYCLE NETWORK
!( Spot Improvements
Neighborhood Greenway
Bike Lane
Protected Bike Lane
Shared Use Paths
FIGURE 26

Recommendations | 49
Some recommendations; however, are more conceptual and additional coordination will be needed for implemen-tation . All recommendations are subject to change and refinement as site conditions and development patterns change and as other adjacent or intersecting projects are implemented . Some projects may require feasibility studies to verify routing or applicability .
Many of this plan’s recommendations focus on routine pavement preservation operations as the mechanism for on-street bikeway striping improvements . In the case of capital roadway projects the highest possible level of pedestrian and bicycle comfort should be incorporated into the design. For streets meant to carry traffic at higher speeds, a separated shared use path should be provided in rural contexts and separated bike lanes and sidewalks should be provided in urban contexts . Such opportunities may supercede the recommendations contained in this plan and be evaluated on a case-by-case basis .
Bicycle Facility Recommendations
Overall recommendations are classified into several categories and sub-categories:
Off-Street – Includes shared-use paths and neigh-borhood connections . Within this category, off-street facilities are classified whether they may be imple-mented as:
■ Part of a complete street or reconstruction project . ■ A stand-alone project that will require specific project funding and support for implementation .
On-Street – Includes bike lanes, buffered bike lanes, separated bike lanes and neighborhood greenways . Within the bike lane category (includes conventional buff-ered and separated), projects are further distinguished in two sub-categories:
■ Project to be completed as part of more extensive complete street or reconstruction project or as part of existing pavement preservation program .
■ Stand-alone on-street project that requires bicycle specific funding and support for implementation
Spot Improvements – Intersection and crossing improvements that may include signals, beacons, grade separation, bridges, or tunnels . Spot improvements will be needed to support existing bikeways as well as improve travel along new bikeways . Crash analysis showed that 67 percent of crashes involving bicycles took place within 100 feet of intersections . Improving safety network-wide will require additional safety improvements and the utilization of national best practices . Common design principles leading to comfortable and safe intersections for bicyclists include the following:
■ Increase Conspicuity - of bicyclists, by positioning them in highly visible locations .
■ Increase Awareness - of potential conflicts through defined conflict areas, markings and signs
■ Isolate Conflicts - so that they can be negotiated separately from the intersection itself . Also, Reduce or remove conflicts through geometry, signaling and other treatments
■ Clearly Assign Priority - so that all road users under-stand who has the right-of-way
■ Minimize Speed - to increase reaction times and reduce the consequences of mistakes .
A table detailing the recommended improvements and associated planning level cost estimates can be found in Appendix A .
Diagram of various right turn conflicts between turning vehicles and through moving bicyclists.

50 | Activate Missoula: Bicycle Facilities Master Plan50 | Activate Missoula: Bicycle Facilities Master Plan
Neighborhood Greenway Network
Throughout the planning process one of the facility types with the highest potential to quickly and cost effectively expand the low-stress bikeway network is a system of Neighborhood Greenways .
Neighborhood Greenways are streets with low motorized traffic volumes and speeds, designated and designed to give bicycle and pedestrian travel priority . Neighborhood Greenways use signs, pavement markings, and speed and volume management measures to discourage through trips by motor vehicles and create safe, conve-nient crossings of busy arterial streets .
Many local streets with low existing speeds and volumes offer the basic components of a safe bicycling and walking environment . These streets can be enhanced using a range of design treatments, tailored to existing conditions and desired outcomes . As the streets them-selves are not expensive to designate as neighborhood greenways, it is recommended that the City of Missoula designate the entire (or vast majority of the) recom-mended network as a single project . The city can then continue to improve the network through implementation of many of the spot improvements as resources permit .
Metrics
It is recommended that the City of Missoula adopt perfor-mance metrics such that the 85th percentile speeds along neighborhood greenways do not exceed 25 mph, and that the number of vehicles per day travelling over them does not exceed 1,500 . The City should periodically conduct observations to check if these conditions are met . If speeds and volumes exceed the desired range, the city should explore implementation of various speed and volume management treatments to ‘correct’ the conditions so that they provide a high-quality experience for bicyclists and pedestrians .
Needed City Policy Changes
Creating a network of neighborhood greenways requires a series of changes to City policies . The following actions may be required before work can begin on design and construction of the greenway network .
Modification of Administrative Rule No. 415. This rule established by the Engineering Division provides good guidance on adding bicycle facilities to collector and arterial roadways . However, there is currently no mention of local streets being designated as bike routes, or, as is recommended here, Neighborhood Greenways . This rule should be modified to include guidelines for the addition of bike facilities to local streets along the neighborhood greenway network or that fulfill a short connection with other advantages to the bikeway network .
This spot treatment in Palo Alto, CA allows bicyclists to cross a major street without allowing through vehicle traffic on the local street network.
Existing speed hump along Pattee Creek Drive

Recommendations | 51 Figure 27. Proposed Neighborhood Greenway Network
!(
!(
!( !(
!(
!(
!(
!(
!(
!(!(
!(
!(
!(
!(
!(
!(
!( !(
!( !(
!(
!(
!(
!(
!(
!(
!(
!(
!(
!(
!(
!(
!(
!(!(
!(
!(
!(
!(!(
!(
!( !(
!(
£¤93
£¤93
£¤12
£¤12
E SPRUCE ST
LOLO ST
E MAIN ST
TOOLE AVE
E FRONT ST
MIS
SOU
LA A
VE
GR
EA
T N
OR
THE
RN
AV
E
MOUNT AVE
SPURGIN RD
BA
NC
RO
FT S
T
W RAILROAD ST
JOH
NSO
N S
T
RIVER RD
SCO
TT S
T
ENGLAND BLVD
NORTH AVE W
PAX
SON
ST
PATTEECANYO
ND
R
HIG
H
PARK WAY
WGREEN
OU
GH
DRPHILIPS ST
E BECKWITH AVE
W SPRUCE ST
PALMER ST
S 7TH ST W
RODGERS ST
CEMETERY RD
N R
USS
ELL
ST
DU
NC
AN
DR
WHIT
AKER DR
WFRONT
ST
RA
TTLE
SNA
KE
DR
SWHIGGINS AVE
SOUTH AVE E
39TH ST
S 5TH ST WS 6TH ST W
VAN BUREN ST
SOUTH AVE W
S 3RD ST W
E BROADWAY
MULLAN RD
AR
TH
UR
AV
E
S H
IGG
INS
AV
E
W BRO
AD
WAY
BROOKS ST
NO
RANG
EST
RU
SSE
LL S
T
RES
ER
VE
ST
SO
RA
NG
EST
S 5TH ST ES 6TH ST E
NR
ESER
VE
ST
STEPHENS
AVE
¥I-90
¥I-90
1
2
3 4
5
6 7
8
9
10
11
12
13
14
15
16
17
1819
20 21 23
24
25
26
27
28
29
30
31
32
3334
35
3637
38
39
4041
42
4344
45
PROPOSED NEIGHBORHOOD GREENWAY NETWORK¹0 0.5 1
MILES
EASTMISSOULA
EXISTING BICYCLE NETWORK
Bicycle Route
Bicycle Lane
Protected Bicycle Lane
Unpaved Trail
Paved Trail
Road
Rail
Water Body
Park
City Limits
OTHER EXISTING FEATURESPROPOSED BICYCLE NETWORK
!( Spot Improvements
Neighborhood Greenway
Bike Lane
Protected Bike Lane
Shared Use Paths
FIGURE 27

52 | Activate Missoula: Bicycle Facilities Master Plan52 | Activate Missoula: Bicycle Facilities Master Plan
Neighborhood Greenway Speed Limit. National best practice for neighborhood greenway implementation attempts to reduce the speed limit along streets with this designation . It is recommended that the City of Missoula establish an official designation for neighborhood green-ways which allows a 20 mph statutory speed .
Wayfinding System
In 2015, Destination Missoula in association with the City and other stakeholders, completed a extensive planning process that covered development of a wide variety of wayfinding sign types and purposes. Within this effort trail and on-street bikeway sign family types were completed . These signs ultimately should be a familiar component of the entire Missoula bikeway network . These signs have particular utility along the neighborhood greenway network as many residents are not familiar navigating the city on local streets .
Approved Missoula On-Street Bikeway Wayfinding Sign Types
In Oregon, a bill was passed at the state legislature allowing 20 mph local street designations

Recommendations | 53
3 . Sign Placement Guidelines - Consistency is impor-tant so that signs are located in a consistent manner which creates a familiar experience along any signed route .
4 . Sign Programming - This phase identifies the custom destinations to be included on each sign .
The existing ‘Missoula bike system’ signs should be removed as they do not serve a significant functional purpose and will conflict with the design of the wayfinding signs as they are installed . Bike lane signs are also now optional and may be removed if desired .
Additional wayfinding elements integrated into the neighborhood greenway network could include direc-tional shared lane markings which use their chevrons to indicate the intended direction of travel .
Implementation
Bicycle wayfinding sign designs were created; however, no destination lists were created or signs located . Implementing a wayfinding system typically has several key steps:
1 . Create Destination Hierarchy - Destinations for inclusion in the system must be selected . Typically destinations must be open to the public and should not for profit. Tiers of destinations are typically defined to help guide the process.
2 . Route Prioritization - A potential first phase of implementation could be in conjunction with the neighborhood greenway network . The supple-mental identifier sign of an adult bicyclist pulling a trailer was intended to identify ‘family friendly’ routes . These signs should be a part of every future bikeway project and be retrofitted to existing bike-ways as resources allow . Additional phases could include other on-street bikeways .
Existing bicycle system signage should be removed and replaced with wayfinding signs
Directional shared lane markings in Jackson, WY link this neighborhood bike route to a trailhead.

54 | Activate Missoula: Bicycle Facilities Master Plan54 | Activate Missoula: Bicycle Facilities Master Plan
Phasing out the manual count program for a system of automatic counters is recommended so that data can be better compared year-over-year, and not skewed by a single storm or poor air quality .
Additional Trail Counters
Additional counters should be installed throughout Missoula . High value locations include the Milwaukee Road Trail, the Grant Creek Trail, the Bitterroot Branch Trail and the Riverfront Trails .
On-Street Counters
While off-street trail counters yield reliable count data for years in a controlled environment, little equivalent data exists for the on-street bikeway network beyond a snapshot two-hour manual count, or specific traffic study . Fortunately there are a variety of technologies that have come to market that make counting bicyclists and pedestrians using the street cheaper and more user friendly . There are two families of automatic counters .
Temporary Installations involve a counter installed for a short period of time . This family includes pneumatic tube counters, video, radio, and infrared devices . Such devices can be set up for a week or more at a time on a regular schedule to better understand usage over time .
Program Recommendations
Education, Outreach and Enforcement Initiatives are provided in Chapter 7 of the 2011 Active Transportation Plan . This Bicycle Facilities Master Plan supports those recommendations and focuses on achieving a more complete physical network .
Evaluation
Historically, Missoula has been proactive with regards to monitoring bicycle and pedestrian usage of the system . The six permanent automatic counters along various shared use paths along with the semi-annual manual count programs have produced a useful information . These sources should be expanded upon with additional full time counters both on and off-street . Full time auto-matic counters will provide the City and MPO with a continuous data stream to better appreciate seasonality of system usage and changes over time . As new routes are added or improvements are made usage of the system will change as bicyclists seek out safer and more comfortable routes . For example, if the full network of neighborhood greenways is implemented, bicycle circu-lation throughout the area will likely change significantly. As the 2014 and 2015 manual counts have shown, weather has a significant impact on bicyclist usage.
Temporary pneumatic tube counter with optional LED screen (www.waycount.com)
Traffic signal with video detection upgraded to detect and count bicyclists. SmartCycle software shown (www.iteris.com)

Recommendations | 55
Missoula should stay aware of additional technological advancements in counting technologies, which may lower the cost and expand the abilities of the city to collect meaningful data . A 2016 resource summarizing the state of the practice can be found online1 .
Future Network Accessibility
Section 3 - Needs Assessment introduced the different types of Missoula area residents and the value of a low-stress bikeway network, which includes trails, neigh-borhood greenways and separated bike lanes . The reach of this bikeway network is one critical measurement of how well the physical bikeway network serves Missoula’s residents and visitors . Figures 28 and 29 show the 2015 low-stress bikeway network and the ultimate buildout of this plan . It is evident that as projects are completed the accessibility of the network to less confident bicyclists will improve . The proposed network of neighborhood greenways and associated spot improvements will have a substantial impact on the connectivity of the low-stress network . Key shared use path connections will also allow isolated communities such as East Missoula, Rattlesnake Canyon and other more isolated residential areas to join the low-stress network .
Low-stress connectivity can be monitored over time as one metric to evaluate the success of bikeway implementation .
1 http://altaplanning.com/wp-content/uploads/Innovative-Ped-and-Bike-Counts-White-Paper-Alta.pdf
Because the installation is temporary, the same hard-ware can be used to count dozens of on-street locations per year at a lower cost .
Permanent Installations are intended to collect data continuously year-round . These technologies include inductive loops, in-ground radar, stand alone additions to and in some cases potential modifications to a range of existing city traffic detection equipment with a simple software update . Based on the supplier of video detec-tion utilized within the City of Missoula, the technology compatible with this upgrade and could be used to detect and count bicyclists .
In Boulder, this permanent counter displays the number of bicyclists per day and for the year to showcase the level of bicycling in its downtown. Higgins Avenue could be a potential location for a similar device.

56 | Activate Missoula: Bicycle Facilities Master Plan56 | Activate Missoula: Bicycle Facilities Master Plan
Figure 28. Bicycle LTS: Existing Conditions
£¤93
£¤93
UV200
£¤12
£¤12
£¤93
RAT
TLES
NAK
E D
R
SPURGIN RD
GR
EAT
NO
RTH
ERN
AVE
S 7TH ST W
BAN
CR
OFT
ST
W RAILROAD ST
RIVER RD
BLUE MOUNTAIN
RD
SCO
TT S
T
NORTH AVE W
PATTEECANYONDR
WG
REENOUG
HD
R
L OWER
MIL
LER CREEK
RD
GRA
NT
CREE
KRD
S 14TH ST W
EXPRESSWAY
PATTEE
CANYON RD
FLYN
N L
N
GH
ARR
ETT
ST
N R
USS
ELL
ST
HILL
VIEWWAY
23R
D A
VE
WH
ITAK
ER D
R
UPPER
MILLE
RCREEK
RD
SPEEDWAY AVE
MULLAN RD
SW HIGGINS AVE
39TH ST
SOUTH AVE W
CLE
MEN
TS R
D
S 5TH ST WS 6TH ST W
VAN BUREN ST
S 3RD ST W
E BROADWAY
HIGHWAY 10 W
ARTH
UR
AVE
SH
IGG
INS
AVE
W BRO
ADWAY
BROOKS ST
N R
ESER
VE S
T
NO
RANG
EST
RU
SSEL
LST
RES
ERVE
ST
SO
RA N
GE
ST
S 5TH ST ES 6TH ST E
STEPHENS AV
E
¥I-90
¥I-90
BICYCLE LEVEL OF TRAFFIC STRESS: EXISTING CONDITIONS ¹0 1 2
MILES
EASTMISSOULA
Road
Rail
Water Body
Park
City Limits
FIGURE 28Connectivity clusters depict connectivity of roadways classified as suitible for all ages and abilities (LTS1). Clusters isolated from each other are identified through different colors. This map includes existing paved shared use paths in addition to the existing LTS 1 road-ways. Trails increase network connectivity and result in fewer disonnected clusters.
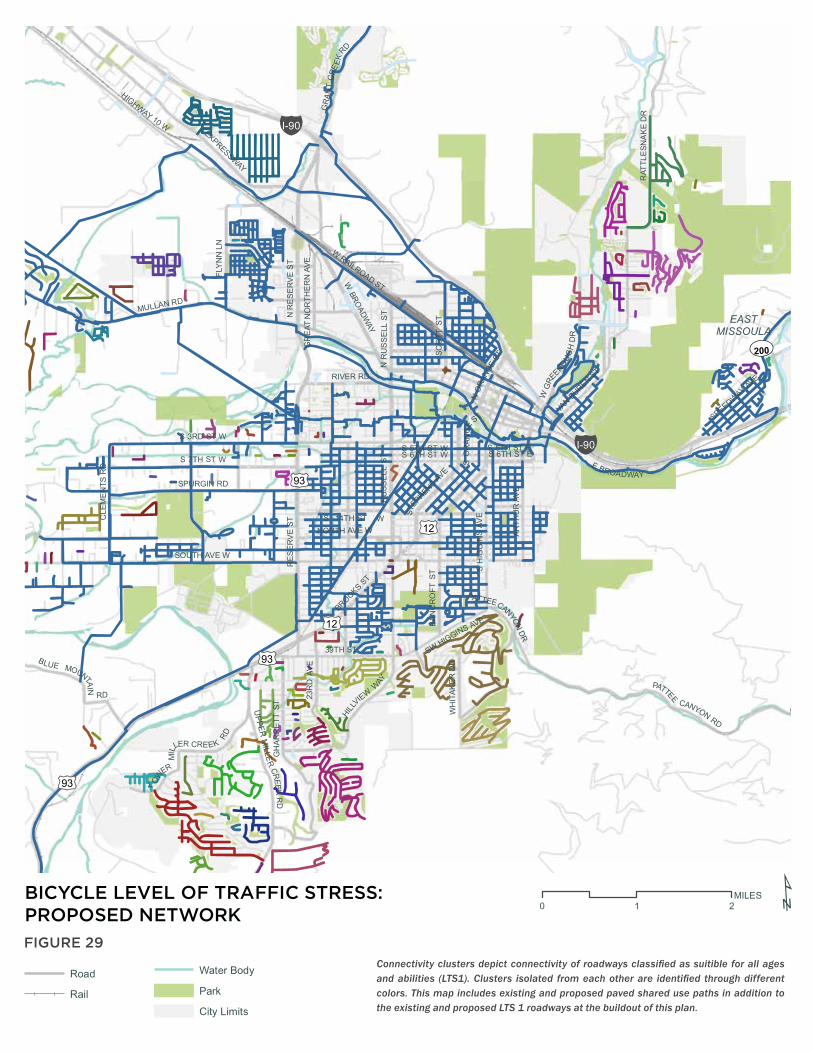
Recommendations | 57
£¤93
£¤93
UV200
£¤12
£¤12
£¤93
RAT
TLES
NAK
E D
R
SPURGIN RD
GR
EAT
NO
RTH
ERN
AVE
S 7TH ST W
BAN
CR
OFT
ST
W RAILROAD ST
RIVER RD
BLUE MOUNTAIN
RD
SCO
TT S
T
NORTH AVE W
PATTEECANYONDR
WG
REENOUG
HD
R
L OWER
MIL
LER CREEK
RD
GRA
NT
CREE
KRD
S 14TH ST W
EXPRESSWAY
PATTEE
CANYON RD
FLYN
N L
N
GH
ARR
ETT
ST
N R
USS
ELL
ST
HILL
VIEWWAY
23R
D A
VE
WH
ITAK
ER D
R
UPPER
MILLE
RCREEK
RD
SPEEDWAY AVE
MULLAN RD
SW HIGGINS AVE
39TH ST
SOUTH AVE W
CLE
MEN
TS R
D
S 5TH ST WS 6TH ST W
VAN BUREN ST
S 3RD ST W
E BROADWAY
HIGHWAY 10 W
ARTH
UR
AVE
SH
IGG
INS
AVE
W BRO
ADWAY
BROOKS ST
N R
ESER
VE S
T
NO
RANG
EST
RU
SSEL
LST
RES
ERVE
ST
SO
RA N
GE
ST
S 5TH ST ES 6TH ST E
STEPHENS AV
E
¥I-90
¥I-90
BICYCLE LEVEL OF TRAFFIC STRESS: EXISTING CONDITIONS ¹0 1 2
MILES
EASTMISSOULA
Road
Rail
Water Body
Park
City Limits Figure 29. Bicycle LTS: Proposed Network
£¤93
£¤93
UV200
£¤12
£¤12
£¤93
RAT
TLES
NAK
E D
R
SPURGIN RD
GR
EAT
NO
RTH
ERN
AVE
S 7TH ST W
BAN
CR
OFT
ST
W RAILROAD ST
RIVER RD
BLUE MOUNTAIN
RD
SCO
TT S
T
NORTH AVE W
PATTEECANYONDR
WG
REENOUG
HD
R
L OWER
MIL
LER CREEK
RD
GRA
NT
CREE
KRD
S 14TH ST W
EXPRESSWAY
PATTEE
CANYON RD
FLYN
N L
N
GH
ARR
ETT
ST
N R
USS
ELL
ST
HILL
VIEWWAY
23R
D A
VE
WH
ITAK
ER D
R
UPPER
MILLE
RCREEK
RD
SPEEDWAY AVE
MULLAN RD
SW HIGGINS AVE
39TH ST
SOUTH AVE W
CLE
MEN
TS R
D
S 5TH ST WS 6TH ST W
VAN BUREN ST
S 3RD ST W
E BROADWAY
HIGHWAY 10 W
ARTH
UR
AVE
SH
IGG
INS
AVE
W BRO
ADWAY
BROOKS ST
N R
ESER
VE S
T
NO
RANG
EST
RU
SSEL
LST
RES
ERVE
ST
SO
RA N
GE
ST
S 5TH ST ES 6TH ST E
STEPHENS AV
E
¥I-90
¥I-90
BICYCLE LEVEL OF TRAFFIC STRESS: PROPOSED NETWORK ¹0 1 2
MILES
EASTMISSOULA
Road
Rail
Water Body
Park
City Limits
FIGURE 29Connectivity clusters depict connectivity of roadways classified as suitible for all ages and abilities (LTS1). Clusters isolated from each other are identified through different colors. This map includes existing and proposed paved shared use paths in addition to the existing and proposed LTS 1 roadways at the buildout of this plan.


Section 5: Implementation

60 | Activate Missoula: Bicycle Facilities Master Plan60 | Activate Missoula: Bicycle Facilities Master Plan
ImplementationThe projects, programs and policies recommended in Chapters 5, and the appendices of this document repre-sent a visionary plan for Missoula and the surrounding area . All of these improvements cannot be made quickly; moreover, it will take many years of steady incremental progress to achieve this vision .
Implementation Goals
The 2016 Long Range Transportation Plan establishes the first mode share goals as a part of transportation planning in Missoula . In the year 2045, this goal calls for a reduction in drive-alone commuting from 70 to 34
percent of commute trips while generally tripling bike, walk and transit commute mode shares . Implementation of the Bicycle Facilities Master Plan will play a significant role in achieving this goal along with programmatic recommendations contained in the 2011 Active Transportation Plan .
To support the mode share goal, the 2016 LRTP recom-mends a funding scenario which distributes discretionary transportation funding sources more evenly between all modes . This funding scenario, in theory, contains substantial increases in non-motorized transporta-tion, complete streets and transit improvements . Sources of funding include city impact fees, Missoula Redevelopment Authority (MRA) funding and other local
Missoula’s 2045 transportation goals and funding priorities support a diverse transportation system

Implementation | 61
sources; however, prior commitments and uncertainty in federal funding will mean that the proposed level of funding alone will not achieve the mode share goals .
Implementation Strategies
Implementation of this Plan will take place in small steps over many years and involve a number of critical partners . The City of Missoula, Missoula County, MDT, MRA and the private development community will all make critical contributions to the bicycle network . As a companion document to the 2016 Long Range Transportation Plan, each of this Plan’s recommended projects has been prior-itized within a common framework with other complete streets projects, transit projects and other roadway proj-ects . Using these prioritization results should only be one of several factors that may determine the order of project implementation . Bikeway implementation can often be based on opportunities, which should not be overlooked even if they did not rate near the top of the scoring
exercise . The following strategies and actions can guide Missoula toward completing the vision network identi-fied in the Plan.
Complete Inexpensive ‘Low-Hanging Fruit”
Many projects in this Plan may be accomplished with relative value without major roadway reconstruction or resurfacing . Potential projects should be reviewed annually to determine how many of these projects can be completed . Projects that may be low-hanging fruit include, bike lanes that require striping only to complete, wayfinding, and the neighborhood greenway network.
Leverage Resurfacing Projects
Missoula streets are subjected to hundreds of freeze-thaw cycles annually, snow tires, heavy vehicles, plowing operations and other stresses. These influences reduce the life of the pavement surface requiring more frequent pavement surface preservation than in other US Cities . Each chip seal, or mill and overlay project should refer-ence relevant transportation plan documents and serve as an opportunity to implement bike lanes with little incremental cost .
Leverage Other Roadway Projects
Projects such as the Russell Street reconstruction and other future City, County and MDT projects should include bicycle, pedestrian, transit and crossing improvements called for in the various local plans .
Pursue Visionary Projects
In the 2012 Long Range Transportation Plan the Missoula to Lolo Trail was classified as an ‘illustrative’ project with no funding prospects over the planning horizon . Just four years later, the project is complete thanks to a federal TIGER grant and partnership with the Missoula Redevelopment Authority, which funded a signature over-pass of Reserve Street .
Establish Dedicated Local Funding
Bikeway funding in Missoula is typically an opportu-nistic mix of funding sources from the Federal, State
0
2%
4%
6%
8%
10%
12%
14%
16%
18%
20%BI
CYCL
E CO
MM
UTE
MOD
E SH
ARE
216%INCREASE
OVER AVERAGE
+/- 4%
+/- 1.4%6%
18%
13%
TRIPLE2015
BASELINE
EXISTING MODE SHARE
(ACS) ANNUAL
AVERAGE
MISSOULA AREA
TRANSPORTA-TION SURVEY
SEPT-OCT 2015
LRTP BICYCLE
COMMUTE MODE
SHARE GOAL
2014-15 2045
Figure 30. LRTP bicycle commute mode share goal
62 | Activate Missoula: Bicycle Facilities Master Plan62 | Activate Missoula: Bicycle Facilities Master Plan
and Local levels . In recent years with the passage of the Federal transportation bills, MAP-21 and the FAST Act, dedicated funding for non-motorized transporta-tion has been reduced and become more competitive with other Montana communities . The Missoula area has received only one Transportation Alternatives grant from 2012-2016 versus annual dedicated funding under the previous transportation bill through the Community Transportation Enhancements Program (CTEP) . Missoula County also has a Trail Bond Program, which provides $3 million for trail projects .
It is recommended that the City of Missoula establish a sustainable annual source of local funding to imple-ment the Bicycle Facilities Master Plan, support the mode share goals of the region and supplement existing sources of discretionary transportation funding . This can be accomplished in a number of different ways .
■ Creation of City Bicycle Account with the objective of safety improvements, enhancements and targeted expansions of the city’s bikeway network . The bicycle account could be similar in scope to the side-walk subsidy (up to $600,000 per year) being used to subsidize repairs and expand sidewalk coverage in the area on an individual property owner basis . The bicycle account funding would need to be allo-cated as an amount within the City’s annual budget . Likely candidate projects would include intersection improvements, or short sections of trail or bike lane that could not be implemented through road or resur-facing projects .
■ Pursue Non-Motorized Transportation District . This would be a voter approved initiative that would provide annual funding towards pedestrian and bicycle improvements .
■ Pursue increase in local gas tax with portion of proceeds going to non-motorized projects . The 2015 Missoula Area Transportation Survey found that over 40 percent of area respondents were supportive of increasing the gas tax, and additional 18 percent
were favorable towards increases in development fees . These results show a greater willingness to fund improvements locally by expanding financial contribu-tions beyond local property owners . An increase in the gas tax would also generate revenue from students, renters and visitors to the area .
Cost Estimates
Planning level construction cost estimates for each project are provided in Appendix A . As unknowns are still high a range of potential cost from low to high is provided . This broad range of potential costs is appropriate given the level of uncertainty in the design at this point in the implementation process . Engineering costs and any property acquisition costs (if applicable) are not included in the cost estimate . The following provides greater detail on some of the associated costs .
Shared Use Paths
Path construction can require a high level of prepara-tion – purchasing property, engineering design, and coordination with many stakeholders . Costs for a new shared use path typically range from $80-$140 per linear foot, depending on complexity . Projects that just need minimal grading and pavement will run at the lower end of the range, where projects that require culverts, bridges, retaining walls or other expensive amenities will fall toward the upper end of the estimate .
Neighborhood Greenways
The costs assume that the project consists of wayfinding signs every quarter-mile and roadway markings about every 200 feet . At about $400 per installed sign and $200 per marking, the per mile cost is roughly $17,000 . Thermoplastic markings are recommended as paint markings will typically wear out completely in less than one year . Intersection improvements are estimated based on the level of complexity . In general, the more concrete and signal work is required, the more expensive the improvement .

Implementation | 63
Bicycle Lanes
Painting a bicycle lane on a road with sufficient width costs roughly $10,000 per linear mile ($5,000 in one direction) for paint striping and thermoplastic stencils . For such retrofit projects, some may require few or no other changes to the roadway configuration, however some may require lane configuration or orientation changes. This can be done by removing the existing road markings and applying new ones, or it also may be included as part of a routine resurfacing . When bike lanes are added as part of a resurfacing project . Additional features such as buffers or separated bike lanes increase the cost further .
Rectangular Rapid Flash Beacons (RRFBs)
These cost about $15,000 for a pair of solar powered beacons and pedestrian buttons .
Median Refuges
Median cost will vary depending on the overall design, Typically a Bicycle crossing median with pedestrian accommodations will range from $8,000 to $25,000 .
Curb Extensions
Curb Extensions vary depending on size, however a good rule of thumb amounts to approximately $5,000 per extension in each direction .
Hybrid Beacons
Hybrid Beacons cost substantially more than a RRFB, however less than a full signal . Costs can range from $40,000 to $70,000 for a Hybrid Beacon .
Performance Measures
It is recommended that the Missoula MPO create a bi-annual Bikeways and Trails Report Card document that reviews key metrics and evaluates progress over time in implementing the bikeway network and also the mode share goals established in the LRTP . This could be an overall complete streets report card to expand into other transit and pedestrian metrics as well . From a bicycle perspective, the key data to include is mileage of facilities added, a summary of the count program (which has historically been done by the MPO), results from statistically valid local travel survey (if repeated at regular intervals), low-stress network connectivity, bicycle involved crash analysis, and any other relevant local data . This report card should be shared with funders, stakeholders, decision makers the media and the general public .
Plan Adoption
Adoption involves review by partner local, state and federal agencies, the TTAC and TPCC, as well as the conclusion of the successful community involvement process . Once adopted, this plan should become a docu-ment referenced in association with the Long Range Transportation Plan to guide future roadway mainte-nance and construction/reconstruction planning . City and County planning and engineering staff will refer to the Bicycle Facilities Master Plan during any develop-ment review process . Deviations from this plan should conform to the exceptions process contained within the Missoula Complete Streets Policy . This plan should be updated periodically, ideally every five years.
Bike lanes, if applied during routine pavement preserva-tion projects or reconstructions carry very little cost

WOMEN REPRESENT
Sources: ACS 2013, 1-yr est; NHTS 2009; Missoula Counts
51% population
NATIONALLY IN MISSOULA
51% population 51% walking trips 51% walking trips
24% biking trips 35% biking trips

Appendix - Project Tables

66 | Activate Missoula: Bicycle Facilities Master Plan66 | Activate Missoula: Bicycle Facilities Master Plan
ID Type Name From To Dist (ft)
Comments Cost (low)
Cost (high)
1 Neighborhood Greenway
Plymouth St Neighborhood Greenway
Mt Ave S Higgins Ave
1942 $5,000 $6,000
2 Neighborhood Greenway
University Ave Neighborhood Greenway
S Higgins Ave Arthur Ave 2053 $5,000 $6,000
3 Neighborhood Greenway
Park St Neighborhood Greenway
SW Higgins Ave
Mt Ave 6274 $16,000 $18,000
4 Neighborhood Greenway
Florence/ Cottonwood St Neighborhood Greenway
Plymouth St River St 4642 $12,000 $13,000
5 Neighborhood Greenway
4th St Neighborhood Greenway
Shilling St Toole Park 9808 $24,000 $28,000
6 Neighborhood Greenway
Grant St Neighborhood Greenway
North Ave W S 3rd St W 5318 $13,000 $15,000
7 Neighborhood Greenway
Franklin St Neighborhood Greenway
Plymouth St Marshall St 3439 $9,000 $10,000
8 Neighborhood Greenway
Ivy St Neighborhood Greenway
Marshall St S 3rd St W 1523 $4,000 $5,000
9 Neighborhood Greenway
California St Neighborhood Greenway
S 3rd St W Dakota St 1400 $4,000 $4,000
10 Neighborhood Greenway
Maurice Ave Neighborhood Greenway
Arthur Ave E Beckwith Ave
3585 $9,000 $11,000
11 Neighborhood Greenway
Myrtle/Woodford St Neighborhood Greenway
Mt Ave S 3rd St W 5022 $13,000 $15,000
12 Neighborhood Greenway
S 3rd St W South Ave E S 4th St E 6259 $16,000 $18,000
13 Neighborhood Greenway
Pattee Creek Neighborhood Greenway
Stephens Ave S
S Higgins Ave
3922 $10,000 $11,000
14 Neighborhood Greenway
Ernest/McDonald Neighborhood Greenway
Brooks St S Russell St 4516 $11,000 $13,000
15 Neighborhood Greenway
Fair Way Neighborhood Greenway
S Russell St South Ave W 1546 $4,000 $5,000
Table 5. Lineal Improvements

Appendix | 67
ID Type Name From To Dist (ft)
Comments Cost (low)
Cost (high)
16 Neighborhood Greenway
Benton Ave Neighborhood Greenway
Bancroft St S Higgins Ave
2603 $7,000 $8,000
17 Neighborhood Greenway
Curtis St Neighborhood Greenway
S 3rd St W River Rd 3308 $8,000 $10,000
18 Neighborhood Greenway
Schilling St Neighborhood Greenway
Benton Ave S 3rd St W 8255 $20,000 $24,000
19 Neighborhood Greenway
Central Ave Neighborhood Greenway
S Reserve St S Garfield St 3818 $10,000 $11,000
20 Neighborhood Greenway
Central Ave (county) Neighborhood Greenway
31st Ave S Reserve St 3980 $10,000 $12,000
21 Neighborhood Greenway
Garfield St Neighborhood Greenway
South Ave W North Ave W 1292 $4,000 $4,000
22 Neighborhood Greenway
Kent Ave Neighborhood Greenway
S Garfield St Maurice Ave 9378 $23,000 $27,000
23 Neighborhood Greenway
6th St W Neighborhood Greenway Extension
Schilling St Russell St 3370 $9,000 $10,000
24 Neighborhood Greenway
Spurgin/ 12th St Neighborhood Greenway
S Reserve St Bitterroot Trail
5554 $14,000 $16,000
25 Neighborhood Greenway
Burton St Neighborhood Greenway
Beaver St Stoddard St 2787 $7,000 $8,000
26 Neighborhood Greenway
Sherwood / Alder Neighborhood Greenway
N Russell St E Pine St 9552 $23,000 $27,000
27 Neighborhood Greenway
Owen St Neighborhood Greenway
Milwaukee Trail
Toole Ave 2041 $5,000 $6,000
28 Neighborhood Greenway
Pine St Neighborhood Greenway
N Higgins Ave Monroe St 2202 $6,000 $7,000
29 Neighborhood Greenway
Jackson / Holly Neighborhood Greenway
N Van Buren St
Monroe St 1079 $3,000 $4,000
30 Neighborhood Greenway
Waverly St Neighborhood Greenway
Defoe St Turner St 1498 $4,000 $5,000
31 Neighborhood Greenway
Wylie Ave Neighborhood Greenway
Lolo St 1215 $3,000 $4,000
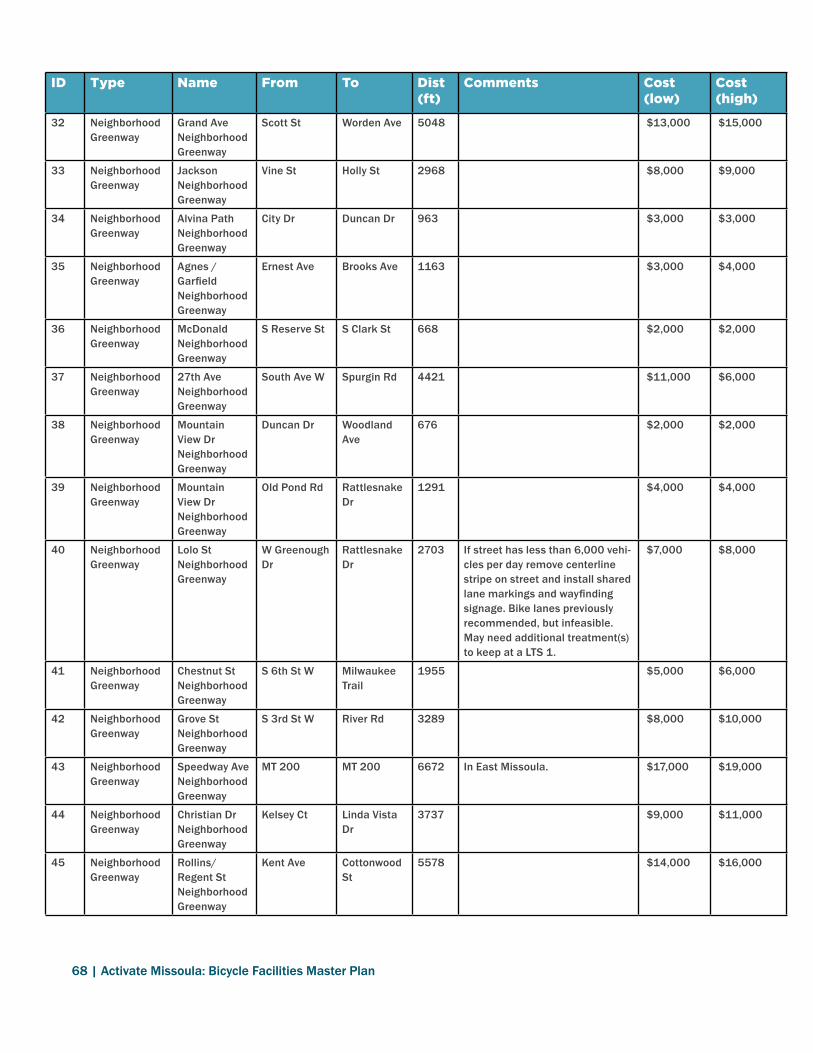
68 | Activate Missoula: Bicycle Facilities Master Plan68 | Activate Missoula: Bicycle Facilities Master Plan
ID Type Name From To Dist (ft)
Comments Cost (low)
Cost (high)
32 Neighborhood Greenway
Grand Ave Neighborhood Greenway
Scott St Worden Ave 5048 $13,000 $15,000
33 Neighborhood Greenway
Jackson Neighborhood Greenway
Vine St Holly St 2968 $8,000 $9,000
34 Neighborhood Greenway
Alvina Path Neighborhood Greenway
City Dr Duncan Dr 963 $3,000 $3,000
35 Neighborhood Greenway
Agnes / Garfield Neighborhood Greenway
Ernest Ave Brooks Ave 1163 $3,000 $4,000
36 Neighborhood Greenway
McDonald Neighborhood Greenway
S Reserve St S Clark St 668 $2,000 $2,000
37 Neighborhood Greenway
27th Ave Neighborhood Greenway
South Ave W Spurgin Rd 4421 $11,000 $6,000
38 Neighborhood Greenway
Mountain View Dr Neighborhood Greenway
Duncan Dr Woodland Ave
676 $2,000 $2,000
39 Neighborhood Greenway
Mountain View Dr Neighborhood Greenway
Old Pond Rd Rattlesnake Dr
1291 $4,000 $4,000
40 Neighborhood Greenway
Lolo St Neighborhood Greenway
W Greenough Dr
Rattlesnake Dr
2703 If street has less than 6,000 vehi-cles per day remove centerline stripe on street and install shared lane markings and wayfinding signage . Bike lanes previously recommended, but infeasible . May need additional treatment(s) to keep at a LTS 1 .
$7,000 $8,000
41 Neighborhood Greenway
Chestnut St Neighborhood Greenway
S 6th St W Milwaukee Trail
1955 $5,000 $6,000
42 Neighborhood Greenway
Grove St Neighborhood Greenway
S 3rd St W River Rd 3289 $8,000 $10,000
43 Neighborhood Greenway
Speedway Ave Neighborhood Greenway
MT 200 MT 200 6672 In East Missoula . $17,000 $19,000
44 Neighborhood Greenway
Christian Dr Neighborhood Greenway
Kelsey Ct Linda Vista Dr
3737 $9,000 $11,000
45 Neighborhood Greenway
Rollins/Regent St Neighborhood Greenway
Kent Ave Cottonwood St
5578 $14,000 $16,000

Appendix | 69
ID Type Name From To Dist (ft)
Comments Cost (low)
Cost (high)
46 Shared use Paths with Road Projects
Otis St Shared Use Path
Otis Scott St 1492 As proposed in the North Reserve / Scott Street Master Plan .
n/a n/a
47 Shared use Paths with Road Projects
Future Shared Use Path
Van Buren St Monroe St 707 With MDT roundabout Van Buren Project .
n/a n/a
48 Shared use Paths with Road Projects
South Ave Shared Use Path
Old Fort Rd Reserve St 984 Missing link to reserve . n/a n/a
49 Shared use Paths with Road Projects
North End of Orange Street Bridge to the Bike Trail on the River (Signage)
Trail W Front St 286 North End of Orange Street Bridge to the Bike Trail on the River . Final project to be as part of develop-ment agreements between the City and the developer .
n/a n/a
50 Shared use Paths with Road Projects
Van Burren westside St Shared Use Path
RUX Trail Poplar St 740 As part of future MDT interchange improvements .
n/a n/a
51 Shared use Paths with Road Projects
Howard Raser Ave Connector Shared Use Path
Grant Creek Trail 4895 Connects Grant Creek to other trails and as proposed in the North Reserve / Scott Street Master Plan . May include a grade separated crossing of reserve at Howard Raser Ave/Expressway .
n/a n/a
52 Shared use Paths with Road Projects
Howard Raser Greenway Shared Use Path
N Reserve St Otis St 10972 As proposed in the North Reserve / Scott Street Master Plan . Will require a undercrossing of the interstate near the Reserve St interchange .
n/a n/a
53 Shared use Paths with Road Projects
Van Burren St eastside Shared Use Path
E Broadway St
Poplar St 1008 As designed per MDT interchange improvements .
n/a n/a
54 Shared use Paths with Road Projects
Northside Greenway Extension
Waverly St Cooley St 758 Incorporate into Scott Street Underpass Improvements .
n/a n/a
55 Shared use Paths with Road Projects
Southbank Riverfront, Russell to Reserve Shared Use Path
N Reserve St N California St
6720 Assumes that the MonRock Site is acquired by the City as a public park .
n/a n/a
56 Shared use Paths with Road Projects
Mullan Rd Shared Use Path
Flynn St N Reserve St 4421 Construct 10' shared use path to connect existing and future shared use paths .
n/a n/a
57 Shared use Paths with Road Projects
Raser Dr Shared Use Path
Rodgers St Spurlock Rd 4627 Extension of Raser Dr proposed in North Reserve / Scott Street Master Plan . Would include a side path .
n/a n/a
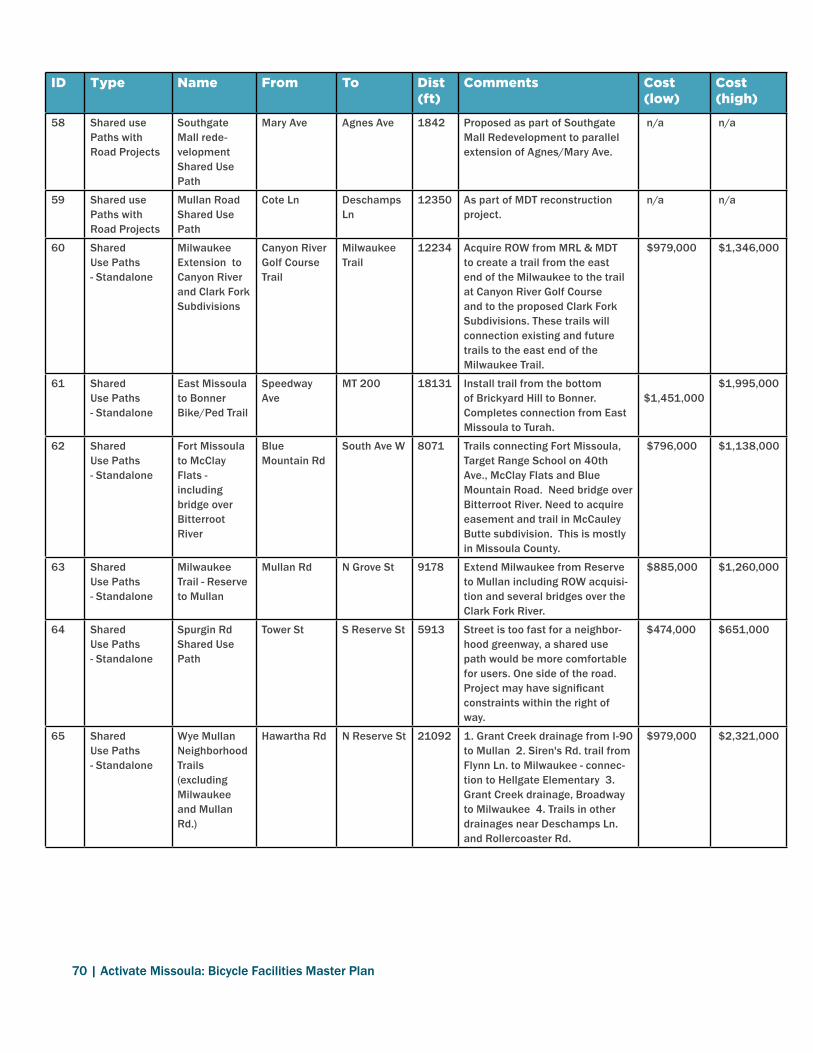
70 | Activate Missoula: Bicycle Facilities Master Plan70 | Activate Missoula: Bicycle Facilities Master Plan
ID Type Name From To Dist (ft)
Comments Cost (low)
Cost (high)
58 Shared use Paths with Road Projects
Southgate Mall rede-velopment Shared Use Path
Mary Ave Agnes Ave 1842 Proposed as part of Southgate Mall Redevelopment to parallel extension of Agnes/Mary Ave .
n/a n/a
59 Shared use Paths with Road Projects
Mullan Road Shared Use Path
Cote Ln Deschamps Ln
12350 As part of MDT reconstruction project .
n/a n/a
60 Shared Use Paths - Standalone
Milwaukee Extension to Canyon River and Clark Fork Subdivisions
Canyon River Golf Course Trail
Milwaukee Trail
12234 Acquire ROW from MRL & MDT to create a trail from the east end of the Milwaukee to the trail at Canyon River Golf Course and to the proposed Clark Fork Subdivisions . These trails will connection existing and future trails to the east end of the Milwaukee Trail .
$979,000 $1,346,000
61 Shared Use Paths - Standalone
East Missoula to Bonner Bike/Ped Trail
Speedway Ave
MT 200 18131 Install trail from the bottom of Brickyard Hill to Bonner . Completes connection from East Missoula to Turah .
$1,451,000
$1,995,000
62 Shared Use Paths - Standalone
Fort Missoula to McClay Flats - including bridge over Bitterroot River
Blue Mountain Rd
South Ave W 8071 Trails connecting Fort Missoula, Target Range School on 40th Ave ., McClay Flats and Blue Mountain Road . Need bridge over Bitterroot River . Need to acquire easement and trail in McCauley Butte subdivision . This is mostly in Missoula County .
$796,000 $1,138,000
63 Shared Use Paths - Standalone
Milwaukee Trail - Reserve to Mullan
Mullan Rd N Grove St 9178 Extend Milwaukee from Reserve to Mullan including ROW acquisi-tion and several bridges over the Clark Fork River .
$885,000 $1,260,000
64 Shared Use Paths - Standalone
Spurgin Rd Shared Use Path
Tower St S Reserve St 5913 Street is too fast for a neighbor-hood greenway, a shared use path would be more comfortable for users . One side of the road . Project may have significant constraints within the right of way .
$474,000 $651,000
65 Shared Use Paths - Standalone
Wye Mullan Neighborhood Trails (excluding Milwaukee and Mullan Rd .)
Hawartha Rd N Reserve St 21092 1 . Grant Creek drainage from I-90 to Mullan 2 . Siren's Rd . trail from Flynn Ln . to Milwaukee - connec-tion to Hellgate Elementary 3 . Grant Creek drainage, Broadway to Milwaukee 4 . Trails in other drainages near Deschamps Ln . and Rollercoaster Rd .
$979,000 $2,321,000

Appendix | 71
ID Type Name From To Dist (ft)
Comments Cost (low)
Cost (high)
66 Shared Use Paths - Standalone
Ron's River Trail
N Reserve St N Russell St 5630 Acquire ROW from landowners along the riverfront as neces-sary, construct a 10' paved trail between the proposed Russell St . Bridge undercrossing and Reserve St . Include a connection from the Reserve St . bike lanes and sidewalks to the trail .
$451,000 $620,000
67 Shared Use Paths - Standalone
Milwaukee Trail Mullan to Deschamps Ln .
Deschamps Ln
Mullan St 20973 Milwaukee Trail Mullan to Deschamps Ln .
$1,678,000
$2,308,000
68 Shared Use Paths - Standalone
Bitterroot Trail Extension
Livingston Rd North Ave W 2003 Closure of critical gap in Bitterroot Branch Trail . Will occur in two stages, from Livingston Ave to South Ave and from South Ave to North Ave .
$161,000 $221,000
69 Shared Use Paths - Standalone
Ron's River Trail per West Broadway Corridor Plan
Burton St Owen St 2905 Create trails that extend the Shady Grove Trail west Burton to the Fox Site . Keep trail along the riverfront as much as possible . Some use of widened sidewalk may be necessary . Develop trails and river access points on the island in the river .
$233,000 $320,000
70 Shared Use Paths - Standalone
Emma Dickinson Learning Center-Council Grove Apartments bike-ped connection
Augusta Dr S Johnson St 985 Provide a shared use path between the Emma Dickinson Learning Center, the Council Grove Apartments, and a future segment of Johnson Street if and when Johnson is extended north from Third Street .
$79,000 $109,000
71 Shared Use Paths - Standalone
3rd St W Clements Rd Hiberta St 7125 Boulevard separated shared use path
$570,000 $784,000
72 Shared Use Paths - Standalone
Spurgin Rd Shared Use Path
Clements Rd Tower St 4587 Street is too fast for a neighbor-hood greenway, a shared use path would be more comfortable for users . One side of the road . Project may have significant constraints within the right of way .
$367,000 $505,000
73 Shared Use Paths - Standalone
Clements Rd North Ave W Mt Ave 1296 Duplicate shared use pathway to reduce crossings for school age students .
$104,000 $143,000
74 Shared Use Paths - Standalone
North Ave Shared Use Path
Clements Rd 37th Ave 2589 Connects Clements Rd paths to trails .
$208,000 $285,000
75 Shared Use Paths - Standalone
33rd Ave & Tower St Shared Use Path
South Ave W S 3rd St W 6850 Connects South Ave to 3rd St . $548,000 $754,000

72 | Activate Missoula: Bicycle Facilities Master Plan72 | Activate Missoula: Bicycle Facilities Master Plan
ID Type Name From To Dist (ft)
Comments Cost (low)
Cost (high)
76 Shared Use Paths - Standalone
Madison St . underbridge to Arthur Street Shared Use Path
Arhur Ave Trail 531 Connection from underbridge to Arthur St . (Southbound)
$43,000 $59,000
77 Shared Use Paths - Standalone
Ron's River Trail - west side
Eastgate Easy St 3427 Complete Ron's River Trail from Eastgate to Easy St .
$275,000 $377,000
78 Shared Use Paths - Standalone
Ron's River Trail - east side
Eastgate Easy St 1160 Complete Ron's Riverfront Trail from Eastgate to Easy St .
$93,000 $128,000
79 Shared Use Paths - Standalone
Westside Railroad Shared Use Path
Cooper St N Reserve St 12218 Westside Greenway System . There is minimal existing space along the tracks in some sections and many properties have struc-tures abutting the railroad . Route will be challenging to develop and will require significant coopera-tion of Montana Rail Link . Could be a more feasible project if the rail yard is ever redeveloped . Will also connect to Grant Creek Trail via Reserve St .
$978,000 $1,344,000
80 Shared Use Paths - Standalone
Northside Shared Use Path
Toole Ave Northside Overpass
1890 Protected bikeway or shared use path along the northside of the railway connecting with the northshore Bitterroot trail exten-sion to the west and Van Buren foot bridge . this portion of the Northside Greenway may not be limited to the redevelopment of the railyards and could be imple-mented as a stand alone project .
$152,000 $208,000
81 Shared Use Paths - Standalone
Greenough Park Connector
Trail Vine St 808 Could close gap between Greenough Park paths and the RUX trail .
$65,000 $89,000
82 Shared Use Paths - Standalone
Grant Creek Share Use Path
Grant Creek Rd
Snow Bowl Road
6852 Extension of recently completed trail to Snow Bowl Road .
$549,000 $754,000
83 Shared Use Paths - Standalone
Tamarak Shared Use Path
Rattlesnake Dr
Lincoln Hills Dr
1131 As detailed in the 2011 Active Transportation Plan .
$91,000 $125,000
84 Shared Use Paths - Standalone
Rattlesnake Dr Shared Use Path
Rattlesnake Dr
Wildcat Rd 7260 As outlined in 2011 Active Transportation Plan . Improve single track trail into paved shared use path for the majority of the route .
$581,000 $799,000
85 Shared Use Paths - Standalone
Lincoln Hills Dr Shared Use Path
Rattlesnake Dr
Lincoln Hills Pt
5996 As noted in the 2011 Active Transportation Plan . This project will be extremely challenging due to grades and right of way, may not be consistent from one end to end . May take form of small asphalt sidewalk and sharrows .
$480,000 $660,000

Appendix | 73
ID Type Name From To Dist (ft)
Comments Cost (low)
Cost (high)
86 Shared Use Paths - Standalone
Northside Park Greenway Loop Shared Use Path
Phillips St Butte Ave 7780 Interstate greenway system between Northside Park and Scott Street on the south side of I-90 with connecting access to the North Hills via Coal Mine Road . A loop trail system could be created depending on cooperation of property owners . This project will be difficult to implement due to grades, private property and Interstate access management . Overpass inclu-sion was proposed in the North Reserve / Scott Street Master Plan .
$623,000 $856,000
87 Shared Use Paths - Standalone
Rattlesnake Greenway Shared Use Path
River E Front St 314 Last missing segment to Clark Fork River . Would make sense only if Ron's River Trail were completed first or with this project .
$26,000 $35,000
88 Shared Use Paths - Standalone
Orange Street Shared Use Path
S Orange St Milwaukee Trail
366 Connector from Milwaukee Trail to southbound Orange bike lanes .
$30,000 $41,000
89 Shared Use Paths - Standalone
Railroad Overcrossing
Palmer St Rodgers St 528 Bike/Ped overcrossing proposed in the North Reserve / Scott Street Master Plan .
$193,000 $309,000
90 Shared Use Paths - Standalone
Ron's Riverfront Trail
Madison St Pedestrian Walkway
780 If hotel is ever redeveloped or if trail can be installed elevated .
$63,000 $59,000
91 Shared Use Paths - Standalone
Bitterroot Trail Shared Use Path
W Pine St Alley 175 Missing link on north side of river . $14,000 $20,000
92 Shared Use Paths - Standalone
East Missoula Riverfront Shared Use Path
Trail Sommers St 5860 Would be part of an alternate connection between East Missoula and Missoula along the Clark Fork River avoiding Highway 200 .
$469,000 $645,000
93 Shared Use Paths - Standalone
Milwaukee Trail Extension to Confluence State Park
Deer Creek Rd
Confluence State Park
9666 Will require new bridge over Clark Fork River and utilization of Milwaukee Road Railroad alignment .
$924,000 $1,314,000
94 Shared Use Paths - Standalone
Fairgrounds Connector Shared Use Path
Trail South Ave W 1775 links existing trails to the north side of the fairgrounds .
$142,000 $1,064,000
95 Shared Use Paths - Standalone
Reserve St Shared Use Path
Briggs St Floral Ct 475 South Hills trail which exists, but is currently gravel . This project would pave it and improve usability for a safe route to school to Meadow Hill Middle School .
$38,000 $48,000
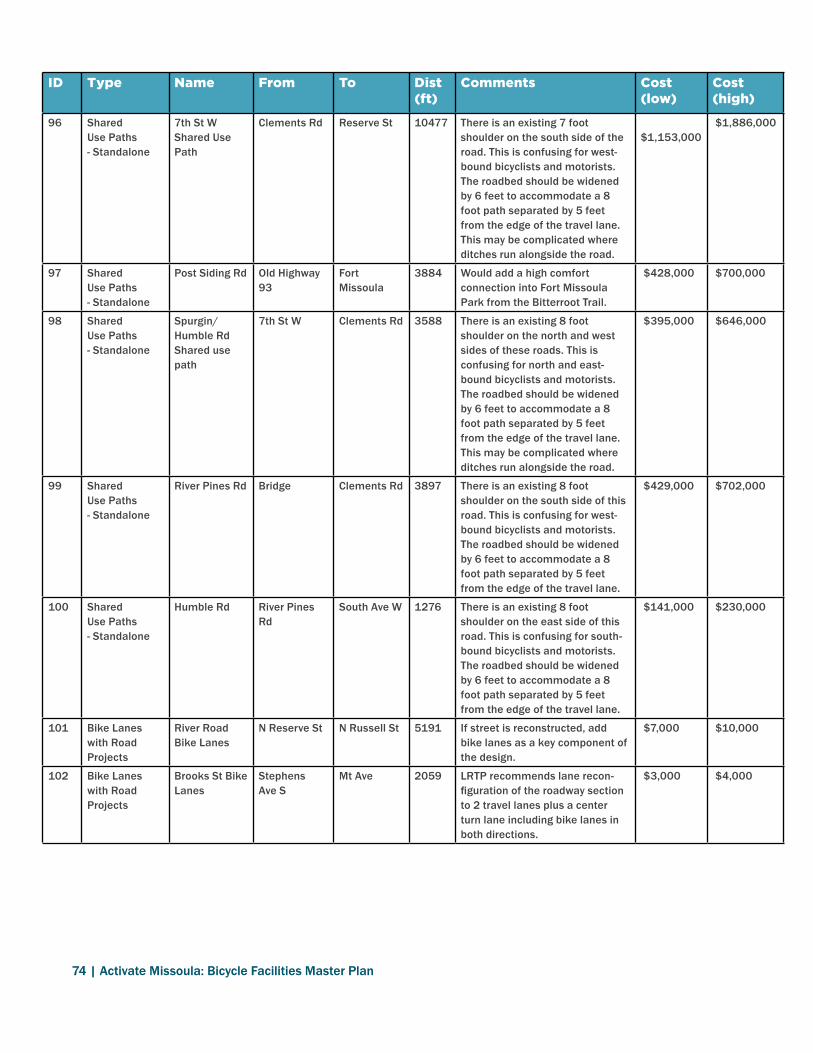
74 | Activate Missoula: Bicycle Facilities Master Plan74 | Activate Missoula: Bicycle Facilities Master Plan
ID Type Name From To Dist (ft)
Comments Cost (low)
Cost (high)
96 Shared Use Paths - Standalone
7th St W Shared Use Path
Clements Rd Reserve St 10477 There is an existing 7 foot shoulder on the south side of the road . This is confusing for west-bound bicyclists and motorists . The roadbed should be widened by 6 feet to accommodate a 8 foot path separated by 5 feet from the edge of the travel lane . This may be complicated where ditches run alongside the road .
$1,153,000
$1,886,000
97 Shared Use Paths - Standalone
Post Siding Rd Old Highway 93
Fort Missoula
3884 Would add a high comfort connection into Fort Missoula Park from the Bitterroot Trail .
$428,000 $700,000
98 Shared Use Paths - Standalone
Spurgin/ Humble Rd Shared use path
7th St W Clements Rd 3588 There is an existing 8 foot shoulder on the north and west sides of these roads . This is confusing for north and east-bound bicyclists and motorists . The roadbed should be widened by 6 feet to accommodate a 8 foot path separated by 5 feet from the edge of the travel lane . This may be complicated where ditches run alongside the road .
$395,000 $646,000
99 Shared Use Paths - Standalone
River Pines Rd Bridge Clements Rd 3897 There is an existing 8 foot shoulder on the south side of this road . This is confusing for west-bound bicyclists and motorists . The roadbed should be widened by 6 feet to accommodate a 8 foot path separated by 5 feet from the edge of the travel lane .
$429,000 $702,000
100 Shared Use Paths - Standalone
Humble Rd River Pines Rd
South Ave W 1276 There is an existing 8 foot shoulder on the east side of this road . This is confusing for south-bound bicyclists and motorists . The roadbed should be widened by 6 feet to accommodate a 8 foot path separated by 5 feet from the edge of the travel lane .
$141,000 $230,000
101 Bike Lanes with Road Projects
River Road Bike Lanes
N Reserve St N Russell St 5191 If street is reconstructed, add bike lanes as a key component of the design .
$7,000 $10,000
102 Bike Lanes with Road Projects
Brooks St Bike Lanes
Stephens Ave S
Mt Ave 2059 LRTP recommends lane recon-figuration of the roadway section to 2 travel lanes plus a center turn lane including bike lanes in both directions .
$3,000 $4,000
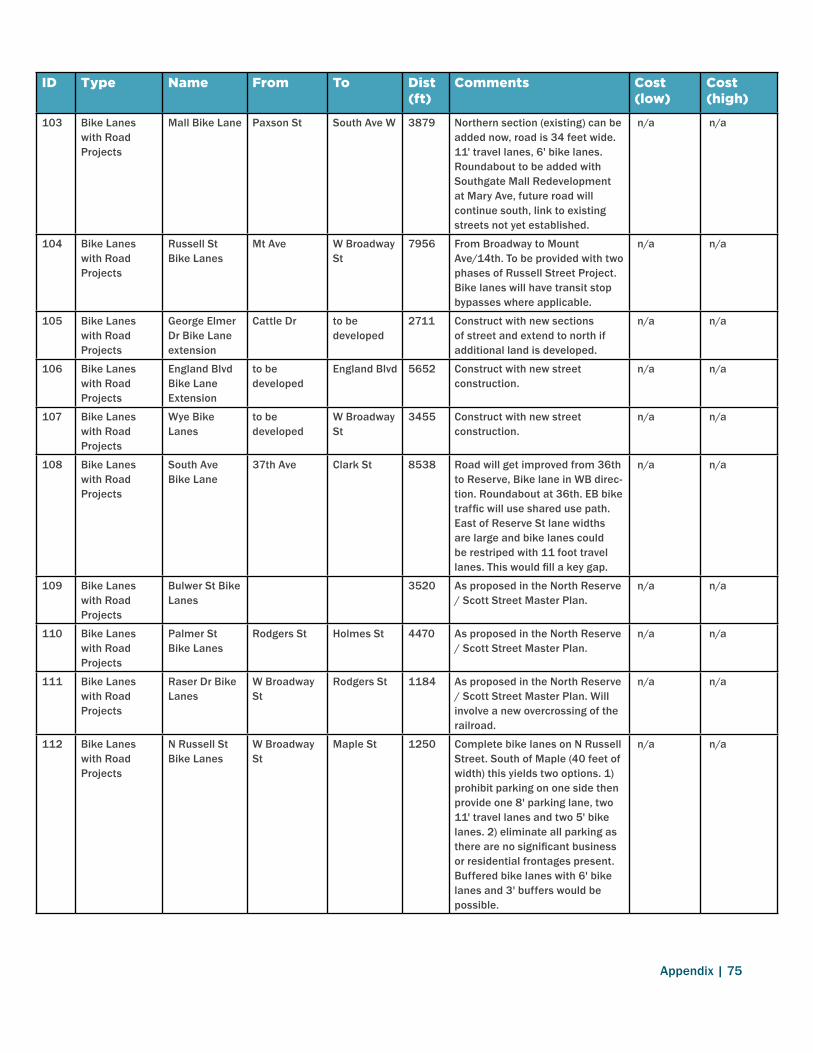
Appendix | 75
ID Type Name From To Dist (ft)
Comments Cost (low)
Cost (high)
103 Bike Lanes with Road Projects
Mall Bike Lane Paxson St South Ave W 3879 Northern section (existing) can be added now, road is 34 feet wide . 11' travel lanes, 6' bike lanes . Roundabout to be added with Southgate Mall Redevelopment at Mary Ave, future road will continue south, link to existing streets not yet established .
n/a n/a
104 Bike Lanes with Road Projects
Russell St Bike Lanes
Mt Ave W Broadway St
7956 From Broadway to Mount Ave/14th . To be provided with two phases of Russell Street Project . Bike lanes will have transit stop bypasses where applicable .
n/a n/a
105 Bike Lanes with Road Projects
George Elmer Dr Bike Lane extension
Cattle Dr to be developed
2711 Construct with new sections of street and extend to north if additional land is developed .
n/a n/a
106 Bike Lanes with Road Projects
England Blvd Bike Lane Extension
to be developed
England Blvd 5652 Construct with new street construction .
n/a n/a
107 Bike Lanes with Road Projects
Wye Bike Lanes
to be developed
W Broadway St
3455 Construct with new street construction .
n/a n/a
108 Bike Lanes with Road Projects
South Ave Bike Lane
37th Ave Clark St 8538 Road will get improved from 36th to Reserve, Bike lane in WB direc-tion . Roundabout at 36th . EB bike traffic will use shared use path. East of Reserve St lane widths are large and bike lanes could be restriped with 11 foot travel lanes. This would fill a key gap.
n/a n/a
109 Bike Lanes with Road Projects
Bulwer St Bike Lanes
3520 As proposed in the North Reserve / Scott Street Master Plan .
n/a n/a
110 Bike Lanes with Road Projects
Palmer St Bike Lanes
Rodgers St Holmes St 4470 As proposed in the North Reserve / Scott Street Master Plan .
n/a n/a
111 Bike Lanes with Road Projects
Raser Dr Bike Lanes
W Broadway St
Rodgers St 1184 As proposed in the North Reserve / Scott Street Master Plan . Will involve a new overcrossing of the railroad .
n/a n/a
112 Bike Lanes with Road Projects
N Russell St Bike Lanes
W Broadway St
Maple St 1250 Complete bike lanes on N Russell Street . South of Maple (40 feet of width) this yields two options . 1) prohibit parking on one side then provide one 8' parking lane, two 11' travel lanes and two 5' bike lanes . 2) eliminate all parking as there are no significant business or residential frontages present . Buffered bike lanes with 6' bike lanes and 3' buffers would be possible .
n/a n/a

76 | Activate Missoula: Bicycle Facilities Master Plan76 | Activate Missoula: Bicycle Facilities Master Plan
ID Type Name From To Dist (ft)
Comments Cost (low)
Cost (high)
113 Bike Lanes with Road Projects
Rodgers/ Raser/ Grant Creek Rd Bike Lanes
N Reserve St Scott St 12927 If/when the County improves Rodgers St ., ridable shoulders/bike lanes should be installed . this is a popular route and there are concerns with heavy vehicles and the current width of the road .
n/a n/a
114 Bike Lanes with Road Projects
Mary Jane Blvd Bike Lanes
Mullan Rd W Broadway St
7254 TO be constructed as a part of full road construction .
n/a n/a
115 Bike Lanes with Road Projects
Linda Vista Blvd Bike Lanes
Upper Miller Creek Rd
Lower Miller Creek Rd
9582 From Lower Miller Creek to Paul Ln a resurfacing project can provide the bike lanes . Parking is recommended to be removed from the west side of the street . Street is 40 feet wide . 8 foot parking lane on one side, 5 foot bike lanes and 11 foot travel lanes .
n/a n/a
116 Bike Lanes with Road Projects
California St River Rd Dakota St 1604 To be constructed as a part of full road reconstruction that MRA is coordinating .
n/a n/a
117 Bike Lanes with Road Projects
Lower Miller Creek Rd Bike Lanes
Linda Vista Blvd
City Limit 9085 "Part of corridor requires reconstruction, part can be imple-mented through restriping . Between Jordan Ct and Avon Ln the street can be restriped . The street is 36 feet in width . Option A) A parking lane may be maintained on the south side with downhill shared lane markings and an uphill bike lane on the north side of the street . Option B) All parking is removed and 7 foot buffered or conventional bike lanes be striped . "
n/a n/a
118 Bike Lanes with Road Projects
Christian Dr Bike Lanes
Lower Miller Creek Road
Kelsey Ct 4564 This street is not yet constructed . n/a n/a
119 Bike Lanes with Road Projects
Wyoming Street Bike Lanes
Russell St California St 1094 Retrofit 3 blocks between California to Russell . Will tie into Russel Street Reconstruction .
n/a n/a
120 Bike Lanes with Road Projects
3rd St Hiberta St Reserve St 3285 Bike lanes will be constructed as part of a complete streets project .
n/a n/a

Appendix | 77
ID Type Name From To Dist (ft)
Comments Cost (low)
Cost (high)
121 Distinct Bike Projects
England Blvd Bike Lanes
Tina Ave Great Northern Ave
1726 Extend to and through Reserve Street . On the west, this will include narrowing travel and turning lanes, 44 feet available, provide 6 foot bike lanes, 11 foot travel lanes and a 10 foot turn lane . On the east side of Reserve, sharrows may be the only feasible option at the intersection however once the 3-lane cross-section returns bike lanes can be added as on the west side .
n/a n/a
122 Distinct Bike Projects
Expressway Bike Lanes
Butler Creek Rd
Grant Creek Rd
18384 Part of this long corridor is currently designated as a 'bike route' however it could be improved through a continuous and designated facility . Expressway links many areas of housing and jobs and offers a less busy alternative to Broadway . It is recommended that parking be prohibited for the entirety of the route as all existing busi-nesses and uses have substantial off-street lots . This approach would allow for buffered bike lanes to be feasible for the majority of the route .
$48,000 $59,000
123 Distinct Bike Projects
McDonald Bike Lanes
S Clark St Brooks St 1272 All businesses have surface parking, remove on-street parking to add bike lanes . Street is 40 feet wide . 12 ' travel lanes, 6'ef bike lanes with 3 foot buffers .
$4,000 $5,000
124 Distinct Bike Projects
Highway 200 Bike Lanes
N Easy St W Riverside Dr
1974 The railroad underpass is narrow and should include widening for bike and pedestrian facilities if it is ever improved . consider reducing lane with at this location to achieve as large of a shoulder as possible . Place warning signs at this location .
$5,000 $6,000
125 Distinct Bike Projects
Whitiker Dr Bike Lanes
Spanish Peak Dr
Fas 533 8579 From Spanish Peak Dr to 500 feet north of Ben Hogan Dr the street is 36 feet wide . Wide 7' bike lanes are possible in this section . North of this location homes have large driveways, and the street is not wide enough to maintain car parking and bike lanes . There are two options here, 1) prohibit all on-street parking and continue the bike lanes, or 2) provide bike lane in uphill direction only and have downhill bicyclists share the lane where the speed differential is lower .
$17,000 $19,000

78 | Activate Missoula: Bicycle Facilities Master Plan78 | Activate Missoula: Bicycle Facilities Master Plan
ID Type Name From To Dist (ft)
Comments Cost (low)
Cost (high)
126 Distinct Bike Projects
Spruce Street Bike Lanes
Scott St N Orange St 2616 Spruce Street is 40 feet curb to curb with parking on both sides . To add bike lanes a lane or parking will need to be removed . The resultant cross-section should be 8 foot parking lane, 6 foot bike lane, two 10 .5 foot travel lanes and a 5 foot bike lane . At Nora Street a pedestrian bulb out will need to be removed to allow for bicycle passage .
$9,000 $10,000
127 Distinct Bike Projects
Mulan Road Bike Lanes
Cote Ln Clark Fork Ln
17066 Short Term - Install bike pave-ment symbols where shoulder width is sufficient, if possible improve cross street approaches to maintain width . Long Term - If Mulan Rd is improved to a 3-lane section, formalize bike lanes in the design .
$11,000 Part of road expansion project (n/a)
128 Distinct Bike Projects
Paxon St Bike Lanes
39th St Ernest Ave 2657 Paxon Street is 40 feet wide, bike lanes will be provided by removing the eastern lane of parking . The proposed cross section will be an 8 foot parking lane, a 6 foot bike lane, two 10 .5 foot travel lanes and a 5 foot bike lane on the east side of the street .
$6,000 $6,000
129 Distinct Bike Projects
High Park Rd Bike Lanes
SW Higgins Ave
Whitaker Dr 3233 High Park Road is a steep residential collector that is 34 feet wide . There are two options: Option 1: provide 11 foot travel lanes and 6 foot bike lanes in both directions . Option 2: provide a 7 foot bike lane with frequent markings and no parking signs in the uphill direction with shared lane markings in the downhill direction .
$8,000 $12,000
130 Distinct Bike Projects
23rd Ave Bike Lanes
Hillview Way 39th St 6346 Street is 38 feet wide . There are three options, 1) 8 foot parking lane on one side, 5 foot bike lanes and 10 foot travel lanes; 2) Remove parking and install buffered bike lanes; 3) Install uphill bike lane and downhill sharrow, parking remains on one side- uphill bike lane should be 7 feet wide .
$16,000 $23,000
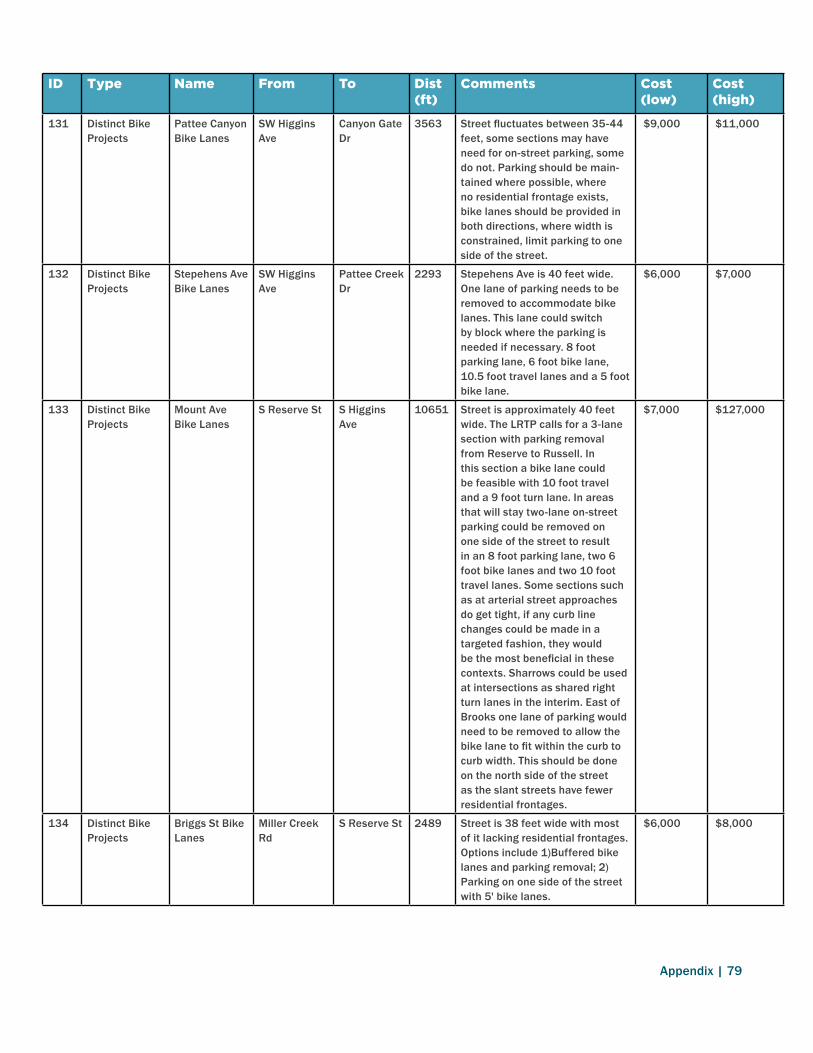
Appendix | 79
ID Type Name From To Dist (ft)
Comments Cost (low)
Cost (high)
131 Distinct Bike Projects
Pattee Canyon Bike Lanes
SW Higgins Ave
Canyon Gate Dr
3563 Street fluctuates between 35-44 feet, some sections may have need for on-street parking, some do not . Parking should be main-tained where possible, where no residential frontage exists, bike lanes should be provided in both directions, where width is constrained, limit parking to one side of the street .
$9,000 $11,000
132 Distinct Bike Projects
Stepehens Ave Bike Lanes
SW Higgins Ave
Pattee Creek Dr
2293 Stepehens Ave is 40 feet wide . One lane of parking needs to be removed to accommodate bike lanes . This lane could switch by block where the parking is needed if necessary . 8 foot parking lane, 6 foot bike lane, 10 .5 foot travel lanes and a 5 foot bike lane .
$6,000 $7,000
133 Distinct Bike Projects
Mount Ave Bike Lanes
S Reserve St S Higgins Ave
10651 Street is approximately 40 feet wide . The LRTP calls for a 3-lane section with parking removal from Reserve to Russell . In this section a bike lane could be feasible with 10 foot travel and a 9 foot turn lane . In areas that will stay two-lane on-street parking could be removed on one side of the street to result in an 8 foot parking lane, two 6 foot bike lanes and two 10 foot travel lanes . Some sections such as at arterial street approaches do get tight, if any curb line changes could be made in a targeted fashion, they would be the most beneficial in these contexts . Sharrows could be used at intersections as shared right turn lanes in the interim . East of Brooks one lane of parking would need to be removed to allow the bike lane to fit within the curb to curb width . This should be done on the north side of the street as the slant streets have fewer residential frontages .
$7,000 $127,000
134 Distinct Bike Projects
Briggs St Bike Lanes
Miller Creek Rd
S Reserve St 2489 Street is 38 feet wide with most of it lacking residential frontages . Options include 1)Buffered bike lanes and parking removal; 2)Parking on one side of the street with 5' bike lanes .
$6,000 $8,000

80 | Activate Missoula: Bicycle Facilities Master Plan80 | Activate Missoula: Bicycle Facilities Master Plan
ID Type Name From To Dist (ft)
Comments Cost (low)
Cost (high)
135 Distinct Bike Projects
Charrett St Bike Lanes
Briggs St 55th St 5322 Street is 38 feet wide . There are two options, 1) 8 foot parking lane on one side, 5 foot bike lanes and 10 foot travel lanes; 2) Remove parking and install buffered bike lanes .
$12,000 $18,000
136 Distinct Bike Projects
Hiberta St Bike Lanes
Spurgin Rd S 3rd St W 2644 Pavement width inconsistent and averages 26 feet . Bike lanes cannot be installed in both directions without an advisory bike lane configuration (shared two-way travel lane with no centerline in the middle) could work, or widening would be needed .
$5,000 $5,000
137 Distinct Bike Projects
Great Northern Ave Bike Lanes
Mullan Rd W Broadway St
4577 Street is 44 feet wide and all destinations have off-street lots . A parallel alternative to Reserve could be established as a buffered bike lane . Option 1: Buffered bike lane . 12 foot travel lanes and 7 foot bike lanes with 3' buffers . Option 2: Parking on one side . 6 .5 foot bike lanes and 11 foot travel lanes .
$10,000 $15,000
138 Distinct Bike Projects
Palmer St Bike Lanes
W Broadway St
N Travois 730 Street is massive on the west end . There is room for substantial buffered lanes on the west end and a single bike lane on S Palmer St going eastbound and a single bike lane going westbound on N Palmer .
$2,000 $4,000
139 Distinct Bike Projects
Duncan Dr Bike Lanes
Minckler Loop
Mountain View Dr
7084 Formally designate shoulders as bike lanes, where on-street parking is absolutely necessary, explore opportunities to increase cross-section width at those loca-tions only .
$9,000 $13,000
140 Distinct Bike Projects
Broadway Bike Lane Upgrade
N California St
Butler Creek Rd
28516 Most of Broadway out to the airport has 12 foot wide shoul-ders . This project would add a 4-5 foot buffer and establish a formal bike lane . Due to the high speeds, driveways should be treated with a dashed bike lane extension line and warning signage to raise awareness . This project can be accomplished without a restriping project .
$55,000 $63,000
141 Distinct Bike Projects
6th St Bike Lanes
Russell St S Higgins Ave
5270 Provide buffered bike lanes by removing a travel lane .
$11,000 $12,000

Appendix | 81
ID Type Name From To Dist (ft)
Comments Cost (low)
Cost (high)
142 Distinct Bike Projects
Broadway Bike Lanes
N Orange St Madison St 3490 This section of Broadway through Downtown is very difficult to get bike lanes accommodated . The only two options are for parking removal on at least one side of the street, or to convert the street to a 3-lane section to provide space for a bike lane, buffered bike lane or protected bike lane . Existing volumes are in the upper limits of consideration for a 3-lane section .
$7,000 $12,000
143 Distinct Bike Projects
Brooks St Buffered Bike Lanes
Miller Creek Rd
Dixon Ave 5821 Eliminate underutilized on-street parking and provide buffered bike lanes where possible . Minor striping and stenciling changes . Shoulder/parking lanes are currently approximately 10 feet wide, provide a 7 foot bike lane and 3' buffer . Dash lane line across minor side streets .
$16,000 $19,000
144 Distinct Bike Projects
5th St Buffered Bike Lanes
Russell St S Higgins Ave
5272 Provide Buffered Bike Lanes by removing a travel lane .
$17,000 $19,000
145 Distinct Bike Projects
Brooks St Bike Lanes
Dixon Ave S Russell St 4103 This section of Brookes through Midtown is very difficult to get bike lanes accommodated . The only two options are for a full roadway reconstruction that would likely require acquiring right of way, or to remove a travel lane in each direction to provide space for a bike lane, buffered bike lane or protected bike lane . Based on the existing volumes this would be difficult to justify.
unknown unknown
146 Distinct Bike Projects
Russell St Buffered Bike Lanes
W Kent Ave S 14th St W 1669 From 14th to Kent, MDT traffic counts show 12,000 ADT north of Brooks and 13,000 ADT south of Brooks . These volumes would likely function well with a 3-lane section . Three lane sections function well up to 18,000 ADT with some examples exceeding 20,000 ADT . Buffered bike lanes can be designated in the current outside lanes . Shared bike lane/turn lanes can be added where right turns warrant a separate lane .
$4,000 $4,000
147 Distinct Bike Projects
Russell Street Bike Lanes
Livingston Rd W Kent Ave 1317 Russell is 4 lanes from Kent Ave to Brooks St . Street is 50 feet wide, so 5 foot bike lanes are possible with 10 foot travel lanes .
$2,000 $3,000

82 | Activate Missoula: Bicycle Facilities Master Plan82 | Activate Missoula: Bicycle Facilities Master Plan
ID Type Name From To Dist (ft)
Comments Cost (low)
Cost (high)
148 Distinct Bike Projects
Rattlesnake Drive Bike Lanes
Missoula Ave Creek Crossing Rd
8610 Convert the shoulders to formal bike lanes, where parking is absolutely necessary, explore opportunities for increasing cross-section width just at those locations .
$11,000 $16,000
149 Distinct Bike Projects
Birch St Bike Lanes
W Broadway St
N Russell St 810 Street is 40 feet wide . Heavy parking demand at industrial site on south side of street . Recommend removing parking on north side of the street, or shifting the parking lane from industrial (south) to residential (north)l half way down the street . 8 foot parking lane, 6 foot bike lane, two 10 .5 foot travel lanes and a 5 foot bike lane .
$2,000 $2,000
150 Distinct Bike Projects
55th St Bike Lanes
Charrett Ave 23rd Ave 2570 Street is 40 feet wide . There are two options, 1) 8 foot parking lane on one side, 5 or 6 foot bike lanes and 10 or 11 foot travel lanes; 2) Remove all parking and install buffered bike lanes .
$5,000 $6,000
151 Bike Lane Upgrades
Russell Street Bike Lane upgrade
Ernest Ave Livingston Ave
2985 From Brooks south to Ernst Ave, Russell is a 3-lane configuration with on-street parking . The street is 64 feet wide . With 8 foot parking lanes, 11 foot travel and turn lanes, 7 .5 feet is left for bike lanes in both directions . Add 2 .5' buffer to travel lane and narrow center turn lane . From Ernst Ave to McDonald, the curb to curb width is 62 feet . 7 .5 foot bike lane areas could be maintained if travel lanes and parking lanes narrow by half a foot on each side . This last block would be nice to have due to Russell School .
$6,000 $12,000
152 Bike Lane Upgrades
Reserve St Bike lane Upgrades
Brooks St River Rd 14446 This section of Reserve from approximately River Road to Brooks Street has extremely wide 10 foot bike lanes . These will need stencils removed and replaced by the curb and 3' buffers added . Add dashed lane lines across minor street intersections .
$28,000 $32,000
153 Bike Lane Upgrades
Fairview Ave Bike Lane Upgrade
S Catlin St Russell St 913 Street has narrow bike lanes and a wide center turn lane . When resurfaced it should balance out better to provide at least 5 .5' bike lanes .
$2,000 $2,000
154 Bike Lane Upgrades
Scott St Bike Lane Upgrade
Toole Ave Philips St 953 Parking lanes are 9 feet . Provide a 2' buffer stripe between parking and the bike lane .
$3,000 $4,000

Appendix | 83
ID Type Name From To Dist (ft)
Comments Cost (low)
Cost (high)
155 Bike Lane Upgrades
Broadway Bike Lane Upgrade
N California St
May St 2418 The previous road diet has left the bike lane/shoulder area at 10-11 feet . Curb extensions have narrowed the section at several points . The bike lane should be buffered to the travel lane at 7 feet with a 3-4 foot buffer . where the section narrows due to curb extensions, the bike lane should shift to the left to return to it's current location .
$5,000 $6,000
156 Bike Lane Upgrades
Broadway Bike Lane Upgrade
May St N Orange St 1711 Short term: A second white line should be added to buffer the parking lane from the bike lane . The current parking lanes are approximately 9-10 feet in width . Stripe parking lanes at 7 feet with the remainder consisting of a buffer . Long term: If the street is resurfaced narrow the 14 center turn lane to 12 feet from over 14 feet and provide a small travel lane buffer as well .
$6,000 $7,000
157 Bike Lane Upgrades
Wyoming Street Bike Lane Upgrade
N California St
Milwaukee Trail
658 For this short two-block section, bike lanes were installed connected to front-in angled parking. This configuration is not recommended by AASHTO . Parking stalls should be repainted to convert to reverse or back-in angled parking .
$11,000 $15,000
158 Bike Lane Upgrades
Cregg Ln Bike Lane Upgrade
Hickory St S Orange St 1062 Current city bike maps show Cregg Ln as a bike lane, however it does not have bike lanes . The intersection with Hickory St narrows and blocks bicycle traffic. Eastbound bike traffic must merge with the travel lane within the Hickory St intersection . Where the section stabilizes again it is 44 feet from curb to curb . This represents a minimal dimensions where bike lanes can be added with 7' parking, 5' bike lanes and 10' travel lanes . If parking can be eliminated from the south side of the roadway dimensions can relax and become wider .
$2,000 $4,000

84 | Activate Missoula: Bicycle Facilities Master Plan84 | Activate Missoula: Bicycle Facilities Master Plan
ID Type Name From To Dist (ft)
Comments Cost (low)
Cost (high)
159 Bike Lane Upgrades
Orange St Bike Lane Upgrade
S 1st St W Front St 1710 In this section travel lanes are 12 feet with 5 foot bike lanes . 12' travel lanes are wider than needed in an urban context . If these lanes could be narrowed to 11 feet the bike lane could be better accommodated . Improve with future restriping project .
No addi-tional cost if done with resurfacing
$33,000
160 Bike Lane Upgrades
6th St Bike Lane Improvements
Maurice Ave S Van Buren Ave
656 Convert front-in angled parking to back-in angled parking . This was done on Harrison St in Bozeman at MSU in recent years .
$9,000 $12,000
161 Bike Lane Upgrades
Orange Street BIke Lane Upgrade
Tremont St S 1st St 2071 Street is 60 feet curb to curb with small shoulders currently . This is creating confusion with bicyclists and motorists as the shoulder is not wide enough to be a bike lane . Restripe with 10 foot travel lanes and turn lane and AASHTO MUTCD compliant 5' bike lanes .
No addi-tional cost if done with resurfacing
$18,000 if existing markings are removed and replaced
162 Protected Bike Lane
Higgins Protected Bike Lane
Brooks St E Broadway St
3500 Extend protected bike lane to the Hip Strip over the Clark Fork River .
$2,400,000 includes streetscape portion similar to existing sections,
$3,100,000
163 Protected Bike Lane
S Van Burren Ave Protected Bike Lane
S 6th St E Milwaukee Trail
798 Some recent improvements with U of M . Additional improvements would include curb changes, striping, bollards, raised medians etc to formalize more secure path .
$44,000 $60,000

Appendix | 85
ID Location Name Comments Cost (low)
Cost (high)
1 McDonald & Russell St
Convert Signal to RRFB
Convert full signal to RRFB and install median refuge . $20,000 $35,000
2 6th St W & Schilling St
Greenway Intersection Improvement
Improve bike access at ramps $6,000 $15,000
3 Kent Ave & Russell St
Greenway Intersection Improvement
Add RRFBs and bike cut throughs . $30,000 $40,000
4 Kent Ave & Brooks St
Greenway Intersection Improvement
Could be RRFB or Hawk, provide short shared use paths on NW and SE Corners and connect through new crosswalk using median as refuge . Provide curb exention on SW corner of Stephens as part of this project .
$50,000 $150,000
5 6th St W & Creek west of Garfield St
New bridge Would extend 6th St bikeway $50,000 $150,000
6 Alder St & Orange St
Greenway Intersection Improvement
New RRFB with bicycle median refuge and center waiting areas on Alder St . Consider making the elevated portion of Orange St a right only onto Alder St .
$20,000 $40,000
7 Alder St & Higgins Ave
Greenway Intersection Improvement
Install bike ramps and a through bike lane in the both directions on Alder St to the left of the splitter island .
$9,000 $12,000
8 Higgins Ave & University Ave
Greenway Intersection Improvement
Expand corner at slant streets to align with south leg of University Ave . Make bike mountable . RRFB optional .
$15,000 $25,000
9 Kent Ave & Higgins Ave
Greenway Intersection Improvement
Add corner curb extensions on all four corners . Provide bicycle forward stop bars on greenway at edge of bike lane .
$25,000 $34,000
10 Arthur Ave & South Ave
Greenway Intersection Improvement
Bus Stop and free right from Arthur causes difficulty for peds and bikes. Create protected intersection on north leg of intersection by taking partial parking lane . This could give WB bikes and peds on the north leg priority over the free right while still stopping WB cars .
$25,000 $35,000
11 Gerald Ave & South Ave
Greenway Intersection Improvement
Bus stop on NE corner . Make bus stop in-lane . Add a porkchop to force SB traffic into a right turn, make the porkchop mountable by bikes and peds to align them with the parking lot on the far side . Align face of porkchop with edge of parking lane to reduce crossing distance . Add pedestrian bulbout on NW corner and add ped crossing on west leg .
$25,000 $35,000
12 Kent Ave & Bancroft St
Greenway Intersection Improvement
Add high visibility crosswalks on north and south legs with bike/ped warning signs .
$4,000 $5,000
13 Pattee Creek Dr & Bancroft St
Greenway Intersection Improvement
Add curb extensions on each corner with diagonal bicycle ramps up to them . Provide a RRFB for crossings that can be activated by bikes or peds on the curb extension .
$41,000 $69,000
14 Fairview Ave & Russell St
Greenway Intersection Improvement
Add bulbouts to shorten pedestrian crossing distance, add crosswalks . Add a through bicycle lane in the east-west direction for bicycles only .
$25,000 $30,000
15 Ernest Ave & Russell St
Greenway Intersection Improvement
Establish bike-ped crossing on south leg of intersection . Widen sidewalk on SW corner with advance bike ramp . RRFB recommended for school crossing, as a school crossing this will compliment crossing to the south .
$30,000 $40,000
16 McDonald Ave & Brooks St
Greenway Intersection Improvement
If no signal is developed with Mall, make cross-street right in-right out with a full traffic signal. Establish new crosswalk in porkchop island. Signal could be conventional signal or be a hybrid beacon .
$65,000 $85,000
Table 6. Spot Improvements

86 | Activate Missoula: Bicycle Facilities Master Plan86 | Activate Missoula: Bicycle Facilities Master Plan
ID Location Name Comments Cost (low)
Cost (high)
17 39th St & Paxson St
Bikeway Intersection Improvement
Accommodation for SB bikes is difficult due to bus stop and turn bay loca-tions . Could provide ramp up onto sidewalk in SB direction to allow bikes to dismount and orient to existing crossing with median refuge .
$8,000 $12,000
18 South Ave & Schilling St
Greenway Intersection Improvement
If turning volumes from South Ave are low, a Minneapolis style median treatment could be applied . This involves a raised median consuming the turn lane with pedestrian crossings on both the east and west legs . The raised median would return to grade through the middle of the intersec-tion, bicyclists would use the medians as refuges, but be on the sides of them . A single vehicle could still queue in the turn area and not block through traffic.
$20,000 $25,000
19 South Ave & Johnson St
Trail Crossing Improvement
Provide diagonal trail crossing parallel to tracks and use bicycle signal . Peds would cross as they do now .
$15,000 $20,000
20 3rd St W & Schilling St
Greenway Intersection Improvement
Add new bike/ped crossing in small area of opportunity between T Intersections . There is a drainage inlet on the north side that will need to be moved . Sidewalks on the west side of Curtis and the east side of Schilling St should be widened to 8-10 feet . Bikes would cross the centerline of each street to access the wide sidewalk, cross 3rd and then resume in-street . RRFB is recommended .
$50,000 $70,000
21 3rd St W & California St
Greenway Intersection Improvement
Add curb extensions into parking lane with bicycle forward stop bars just prior to bike lanes on 3rd . One of the two T-intersections should have a pedestrian crossing installed as well .
$25,000 $30,000
22 5th St W & Ivy St
Direct users to BBT crossing improvements
Install wayfinding $1,000 $1,500
23 4th St W & Orange St .
Greenway Intersection Improvement
Challenging intersection due to 3 adjacent signals . Recommend studying feasibility of new bike/ped only signal here with east-west traffic being forced right onto Orange St . Signal would need to be coordinated with adjacent signals . Alternate option is to create a solid raised median and use RRFBs to cross each direction of Orange .
$40,000 $120,000
24 Mt Ave & Park St
Greenway Intersection Improvement
Difficult to make geometric changes here due to fire station on the SE corner . Install pedestrian crosswalks on all four legs with high visibility crossing MT Ave . Place bike/ped warning signs .
$9,000 $15,000
25 Toole Ave & Burton St
Greenway Intersection Improvement
Install curb extensions at all four corners to reduce crossing distances . Install pedestrian crossings and bike/ped warning signs .
$28,000 $40,000
26 Benton Ave & Higgins Ave
Greenway Intersection Improvement
Curb extensions on west leg, crosswalks and warning signage . $25,000 $32,000
27 McDonald Ave & Grant St
Greenway Intersection Improvement
Complete sidewalk at SW corner, provide pedestrian crossings and bike/ped warning signs .
$9,000 $12,000
28 Spurgin Rd & Reserve St
Greenway Intersection Improvement
Past plans have called for at-grade intersection improvements here including suggesting grade separation . Crossing would need to be signal-ized to offer a safe bike-ped crossing . It is possible that a refuge island on both sides could be created between a right turn and left turn only . Through crossings across Reserve would be prohibited .
$100,000 $150,000
29 4th St W & Russell St
Greenway Intersection Improvement
Hybrid Beacon or Signal to assist bicyclists and pedestrians crossing Russell . May be coordinated with adjacent signals . To be integrated with Russell phase II improvements .
$50,000 $90,000
30 Stoddard St & Scott St
Scott Street Underpass Improvements
Improve lighting to LED, paint murals and color up the underpass area, improve bike/ped connections to scott street . Develop recreational or park like features to make underpass more inviting . Add surveillance cameras . Remove junk and stored materials .
$25,000 $10,000
31 Fairview Ave & Brooks St
Add Sharrows On west leg of intersection bike lane drops . Add several sharrows in the outside lane in both directions to maintain continuity .
$2,500 $2,500

Appendix | 87
ID Location Name Comments Cost (low)
Cost (high)
32 Mt Ave & Stephens
Add Sharrows Bike lanes drop along Orange/Stephens at the intersection with Mt Ave . The street is 60' wide with 5 travel lanes present . If 10' lanes were used bike lanes can be added . If this is not supported, add sharrows spaced at 75' within areas where bike lanes are absent and bikes may use full lane signage .
$5,000 $15,000
33 6th St & Arthur Ave
On-Street Improvement
Remove Bike Box and install two stage turn box to facilitate SB to EB turns .
$2,500 $6,000
34 Campus Dr and Maurice Ave
On-Street Improvement
Install Two Stage Turn Box to facilitate NB and SB to WB turns at 5th . $1,500 $2,000
35 Broadway St & Van Buren St
Intersection Improvements
Provide leading pedestrian interval for RUX trail users to get them out in front of turning traffic. Include Blank-out sign for cars to reinforce no right turn when leading interval is active . Leading interval should be at least 7 seconds .
$3,000 $5,000
36 Front St & Van Buren St
Intersection Improvement
RUX transition here needs redesign . Stop sign to be restored in the EB direction . Better crossing markings installed . Ideally some geometry would be improved to better match existing use .
$1,500 $15,000
37 Broadway & Monroe St
Bike/Ped Crossing
Mid-block crossing for pedestrians and bicyclists to use to link existing sections of pathway along Rattlesnake creek . Likely would be Hybrid Beacon that could be coordinated with adjacent signals .
$45,000 $60,000
38 Front St & Orange St
Intersection Improvement
For northbound bikes, add two stage left turn box at intersection to direct to Front St and eventually Owen St. Add wayfinding to support this movement .
$2,500 $4,000
39 Broadway St & Owen St
Greenway Intersection Improvement
Force right turn for cars along Owen St, create through bike lane pocket that extends into the shadow of the parking lane along Broadway on the south side and to the bulb out edge on the north side . this will shorten crossing distance and reduce conflicts. Add warning signs for bikes/peds.
$15,000 $20,000
40 Stephens Ave & Tremont St
Spot Improvement
Stripe bike lane through corner short term . Long term make curb line adjustments to provide additional room . If bike lane can be raised through corner to protect it before dropping back to street level that would be a desirable design .
$2,000 $30,000
41 Stephens Ave & Florence St
Greenway Intersection Improvement
Create pass through in median for bikes . Provide through bike lanes on approaches, warning signage and pedestrian crosswalks .
$15,000 $20,000
42 Reserve St & CS Porter Middle School
Crossing Improvement
Study should be undertaken to examine performance of this pedestrian signal . Review signal coordination with adjacent signals, crossing timing and safety . Consider converting to a Pedestrian Hybrid Beacon with on-demand actuation .
$7,500 $15,000
43 River Rd & Reserve St
Greenway Intersection Improvement
Full signal with pedestrian crossings $250,000 $500,000
44 Spruce St & Owen St
Greenway Intersection Improvement
Add RRFBs for Owen crossing $15,000 $25,000
45 Mt Ave & Regent St
Greenway Intersection Improvement
Use left side of Regent St center turn lane for refuge, add RRFBs . Also construct 10 foot path along north side of Mt . Ave to Rollins St .
$75,000 $125,000
46 n/a Riverfront Triangle Bike/Ped Bridge
With improvements associated with Riverfront Triangle project . $1,500,000 $3,000,000
47 n/a Bike/Ped Bridge
Add a bicycle/pedestrian bridge from Mullan Road over the Clark Fork River to the Missoula Ready Mix site, preferably somewhere about halfway between Reserve and Russell Streets . The exact location of the bridge will depend on development and design
$1,500,000 $3,000,000

88 | Activate Missoula: Bicycle Facilities Master Plan88 | Activate Missoula: Bicycle Facilities Master Plan
ID Location Name Comments Cost (low)
Cost (high)
48 n/a Missoula College Shared Use Path Bridge
Bike/Ped bridge over Clark Fork River from Missoula College to the Kim Williams Trail and the University of Montana .
$1,500,000 $3,000,000
49 n/a Bitterroot Branch Trail River Crossing
Bitterroot Branch Trail Bike/Pedestrian Crossing – On or next to existing RR Bridge .
$250,000 $3,000,000

Appendix | 89