BEST SURVEY 2007
68
BEST SURVEY 2007 Report Vienna 2007
-
Upload
jaime-gilmore -
Category
Documents
-
view
15 -
download
1
description
BEST SURVEY 2007. Report Vienna 2007. Contents. About the survey Participants Sample Method How to read the graphs Overall results Quality dimension indexes, individual questions Satisfaction and impact Appendix Quality dimensions and indexes for subgroups Background information. - PowerPoint PPT Presentation
Transcript of BEST SURVEY 2007
BEST SURVEY 2007
Report
Vienna 2007
BEST 2007
2 BEST Survey 2007
Contents
About the survey
Participants
Sample
Method
How to read the graphs
Overall results
Quality dimension indexes, individual questions
Satisfaction and impact
Appendix
Quality dimensions and indexes for subgroups
Background information
BEST 2007
3 BEST Survey 2007
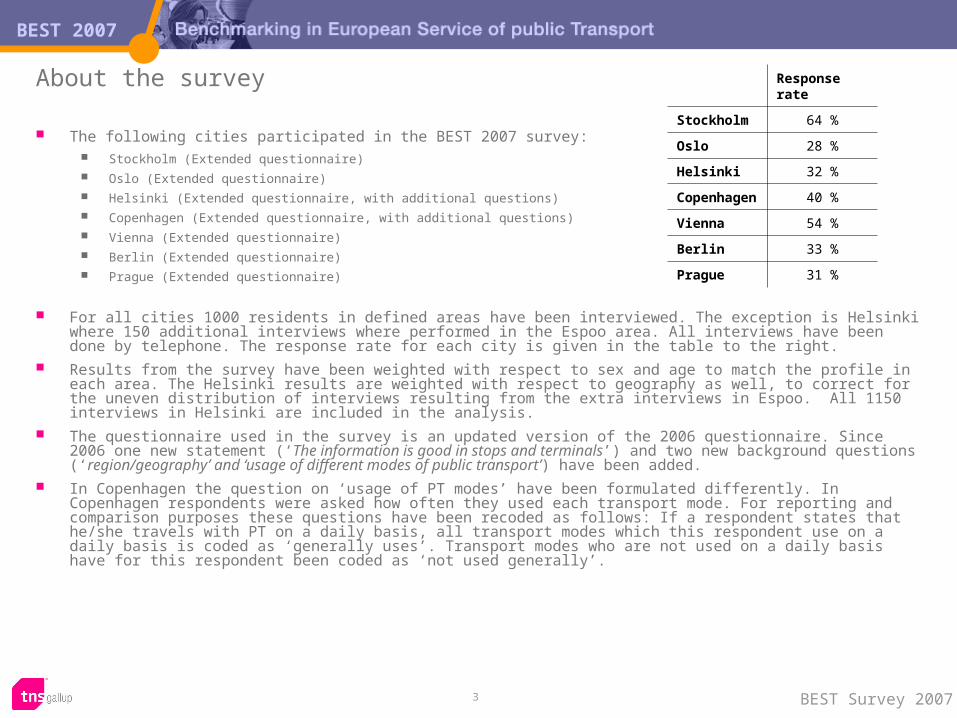
About the survey
The following cities participated in the BEST 2007 survey: Stockholm (Extended questionnaire) Oslo (Extended questionnaire) Helsinki (Extended questionnaire, with additional questions) Copenhagen (Extended questionnaire, with additional questions) Vienna (Extended questionnaire) Berlin (Extended questionnaire) Prague (Extended questionnaire)
For all cities 1000 residents in defined areas have been interviewed. The exception is Helsinki where 150 additional interviews where performed in the Espoo area. All interviews have been done by telephone. The response rate for each city is given in the table to the right.
Results from the survey have been weighted with respect to sex and age to match the profile in each area. The Helsinki results are weighted with respect to geography as well, to correct for the uneven distribution of interviews resulting from the extra interviews in Espoo. All 1150 interviews in Helsinki are included in the analysis.
The questionnaire used in the survey is an updated version of the 2006 questionnaire. Since 2006 one new statement (‘The information is good in stops and terminals’) and two new background questions (‘region/geography’ and ‘usage of different modes of public transport’) have been added.
In Copenhagen the question on ‘usage of PT modes’ have been formulated differently. In Copenhagen respondents were asked how often they used each transport mode. For reporting and comparison purposes these questions have been recoded as follows: If a respondent states that he/she travels with PT on a daily basis, all transport modes which this respondent use on a daily basis is coded as ‘generally uses’. Transport modes who are not used on a daily basis have for this respondent been coded as ‘not used generally’.
Response rate
Stockholm 64 %
Oslo 28 %
Helsinki 32 %
Copenhagen 40 %
Vienna 54 %
Berlin 33 %
Prague 31 %
BEST 2007
4 BEST Survey 2007
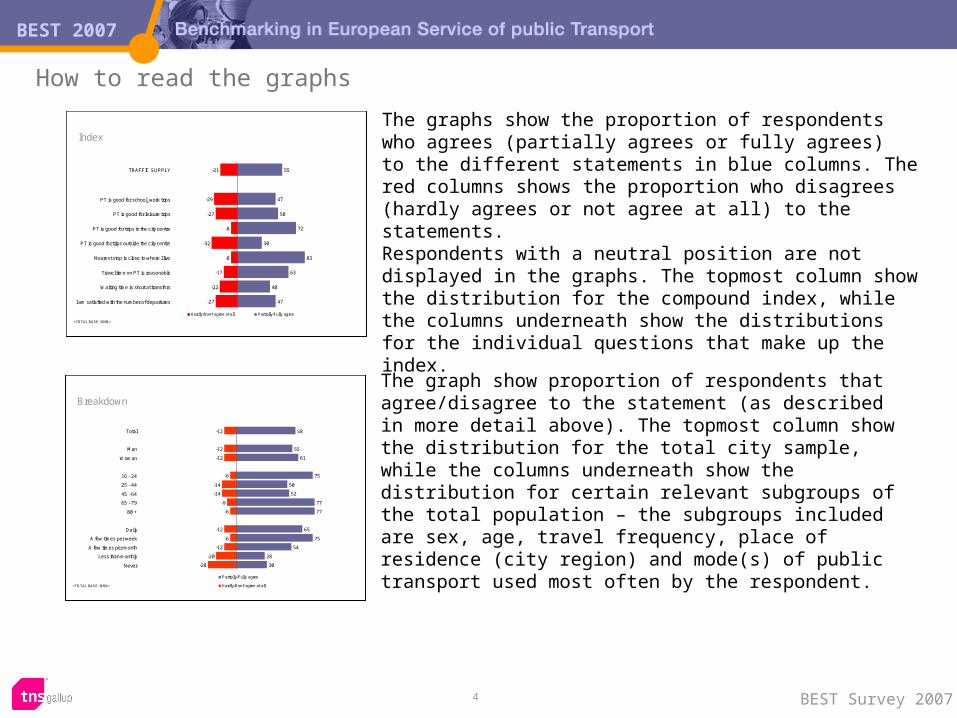
How to read the graphs
Breakdown
<TOTAL BASE: NNN>
58
55
61
75
50
52
77
77
65
75
54
28
30
-12
-12
-12
-6
-14
-14
-9
-6
-12
-6
-12
-20
-28
Total
Man
Woman
16 - 24
25 - 44
45 - 64
65 - 79
80 +
Daily
A few times per week
A few times per month
Less than monthly
Never
Partially/Fully agree
Hardly/Don't agree at all
Index
<TOTAL BASE: NNN>
-21
-29
-27
-8
-32
-8
-17
-22
-27
55
47
50
72
30
83
63
40
47
TRAFFIC SUPPLY
PT is good for school_work trips
PT is good for leisure trips
PT is good for trips in the city centre
PT is good for trips outside the city centre
Nearest stop is close to where I live
Travel time on PT is reasonable
Waiting time is short at transfers
I am satisfied with the number of departures
Hardly/Don't agree at all Partially/Fully agree
The graphs show the proportion of respondents who agrees (partially agrees or fully agrees) to the different statements in blue columns. The red columns shows the proportion who disagrees (hardly agrees or not agree at all) to the statements.Respondents with a neutral position are not displayed in the graphs. The topmost column show the distribution for the compound index, while the columns underneath show the distributions for the individual questions that make up the index.
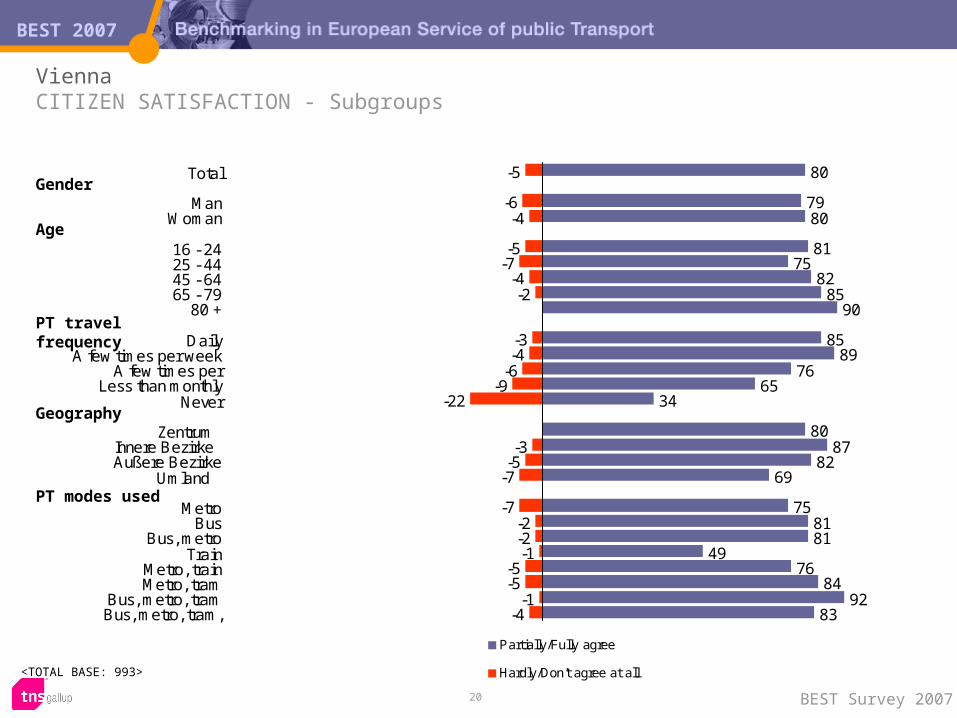
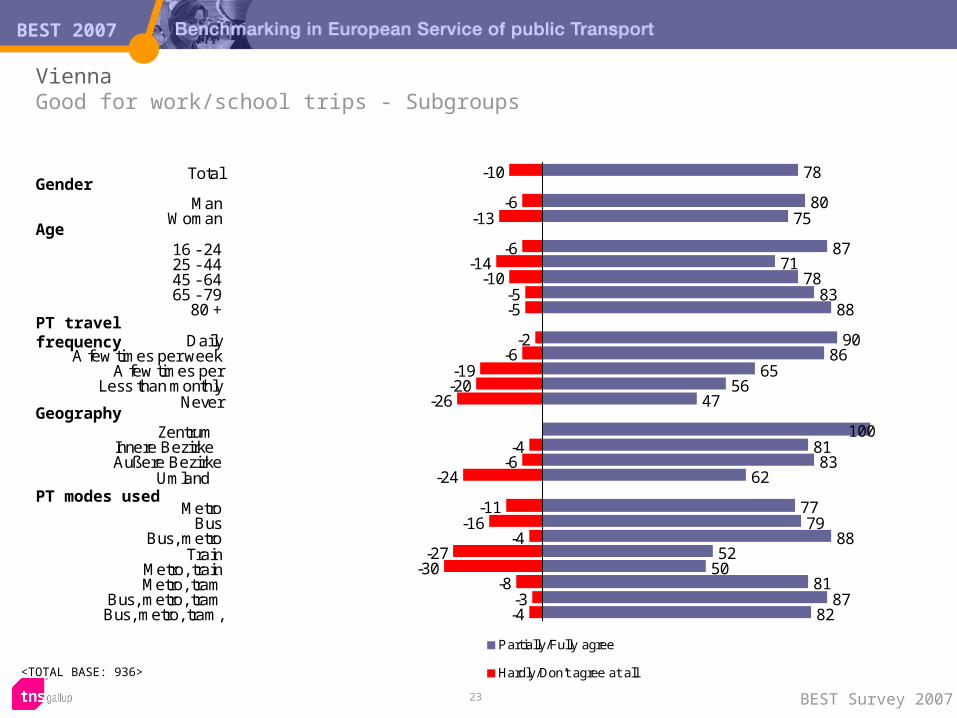
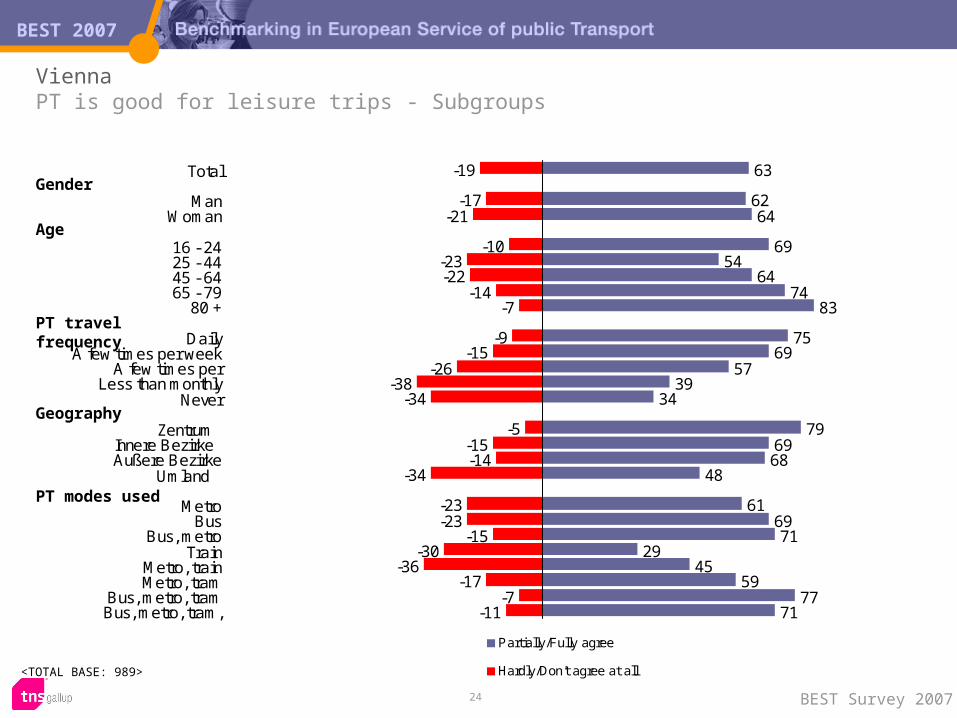
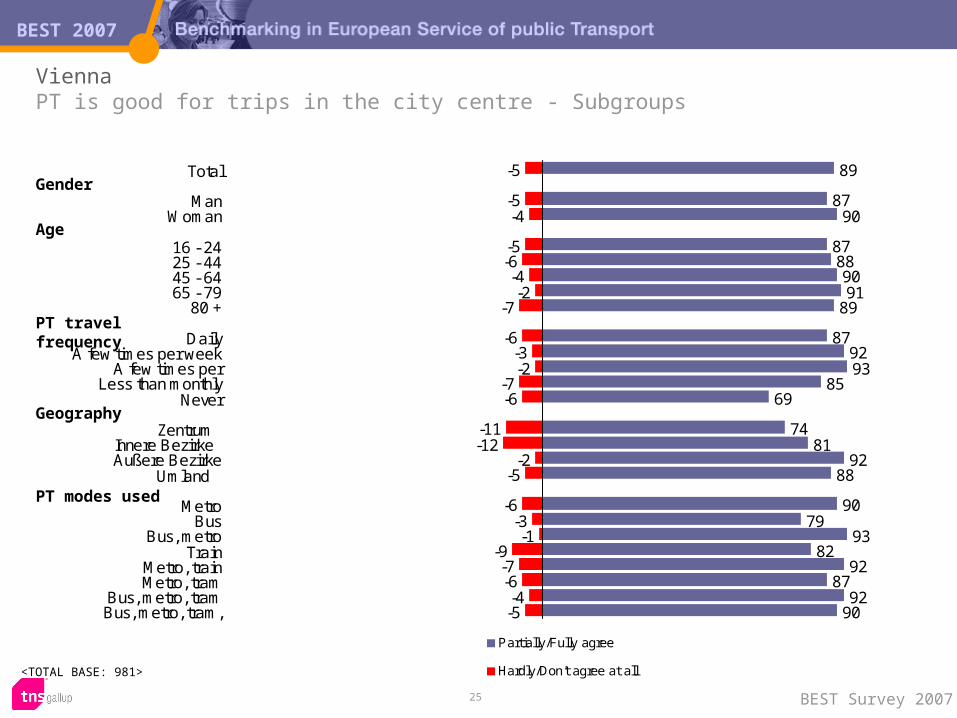
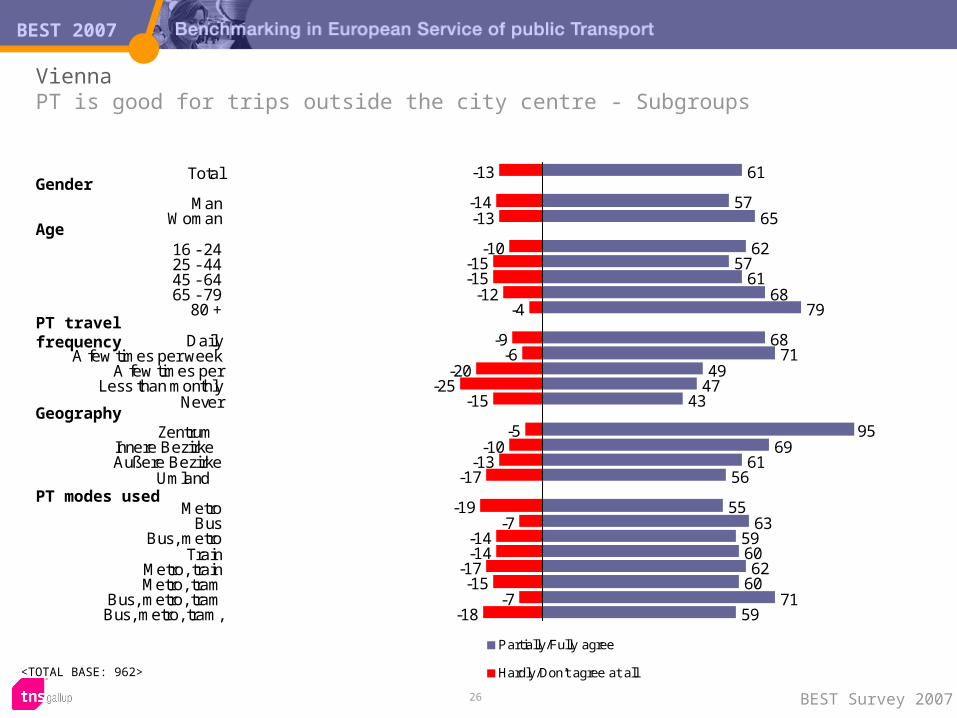
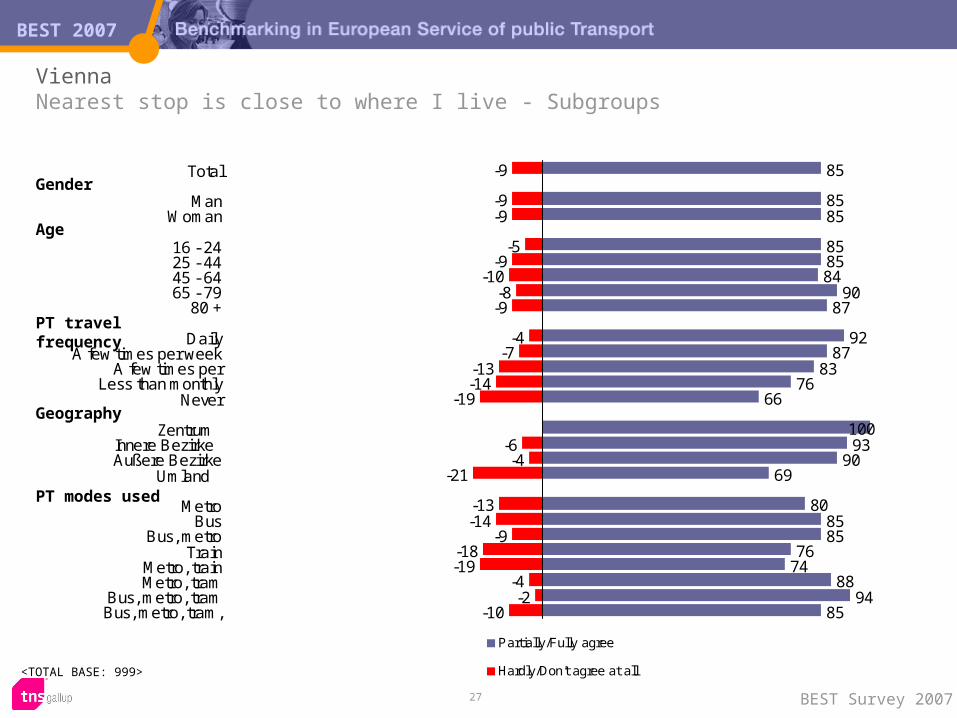
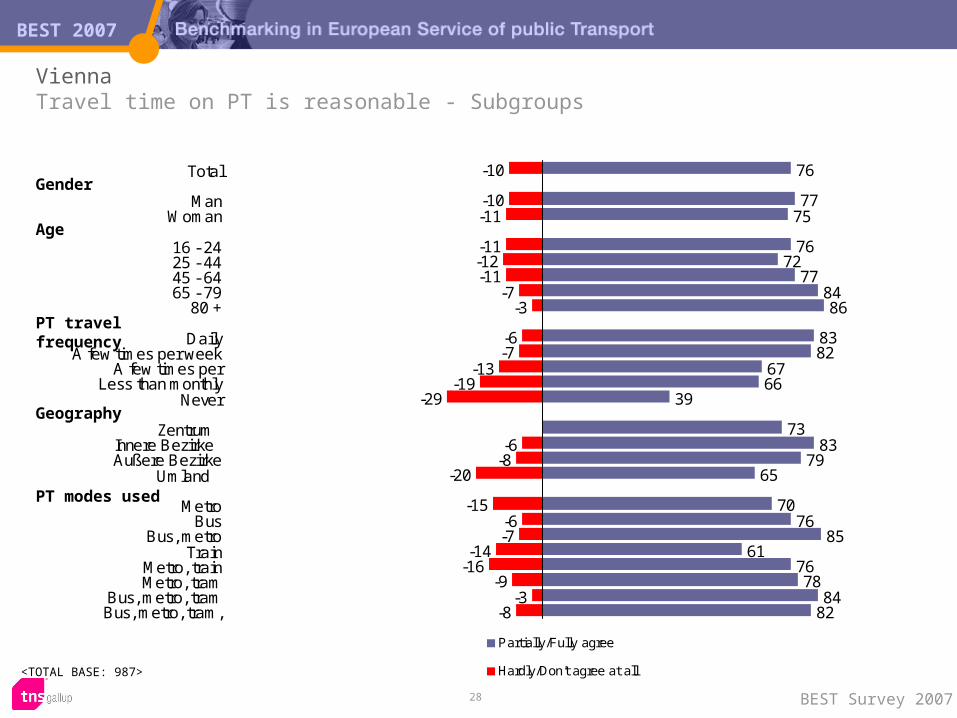
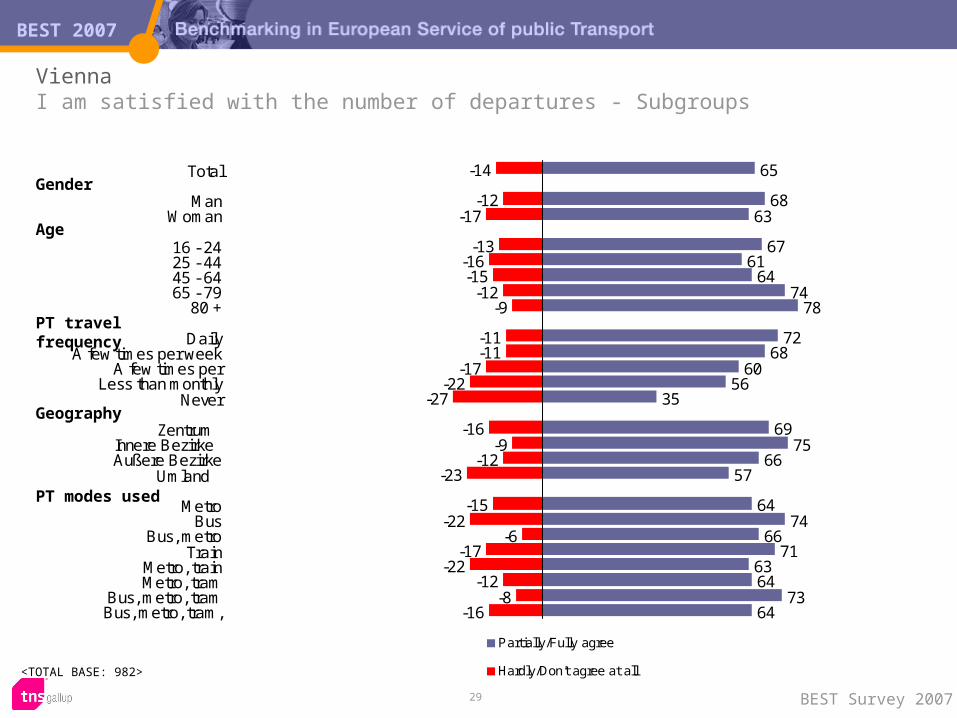
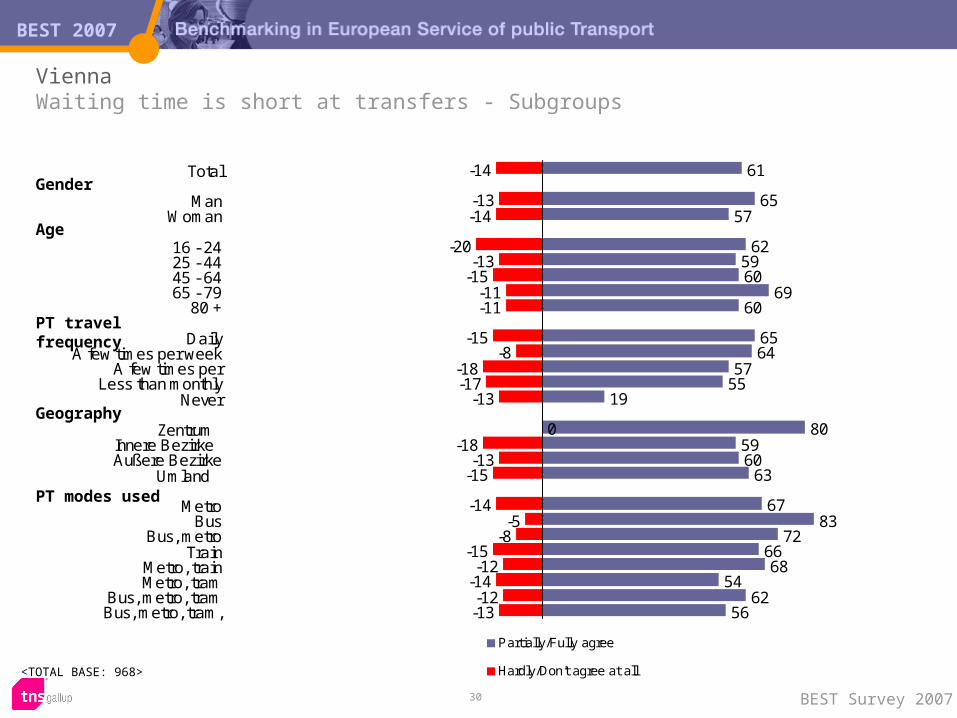
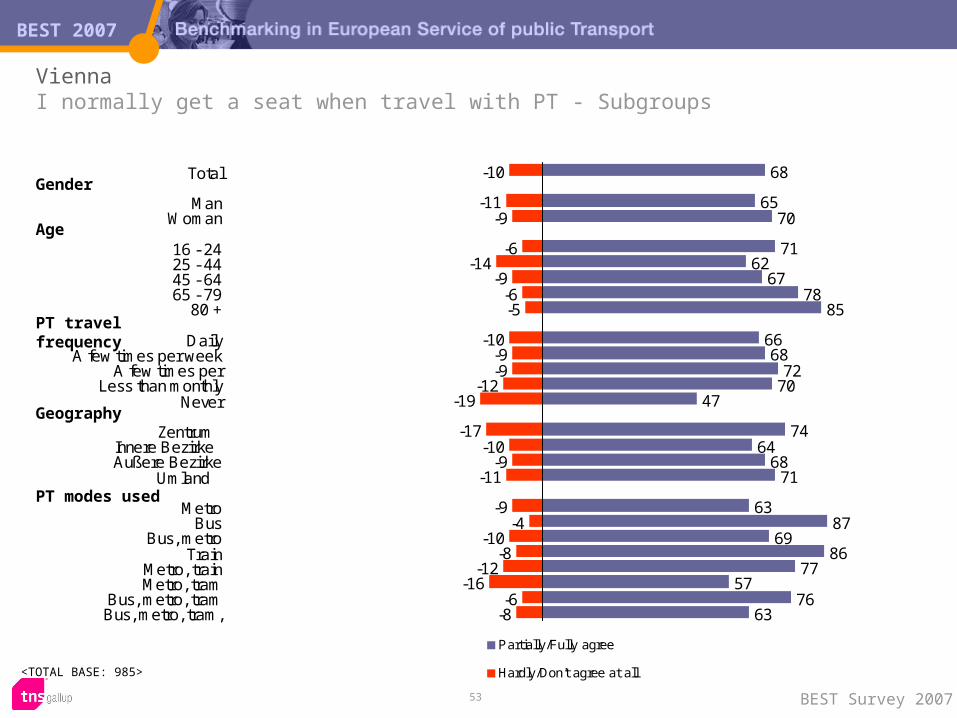
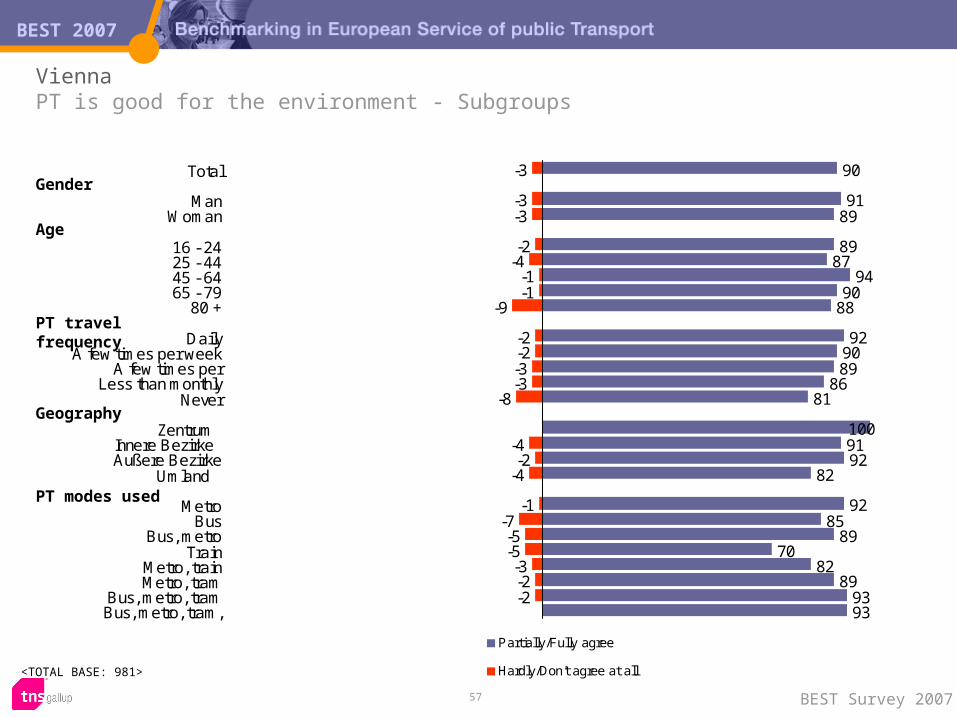
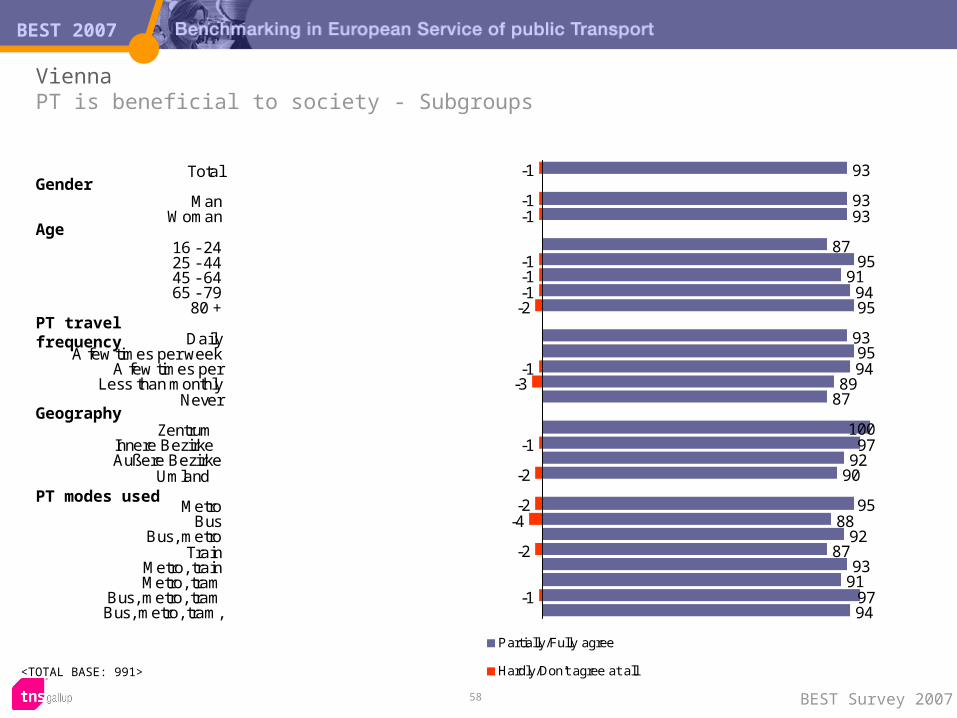
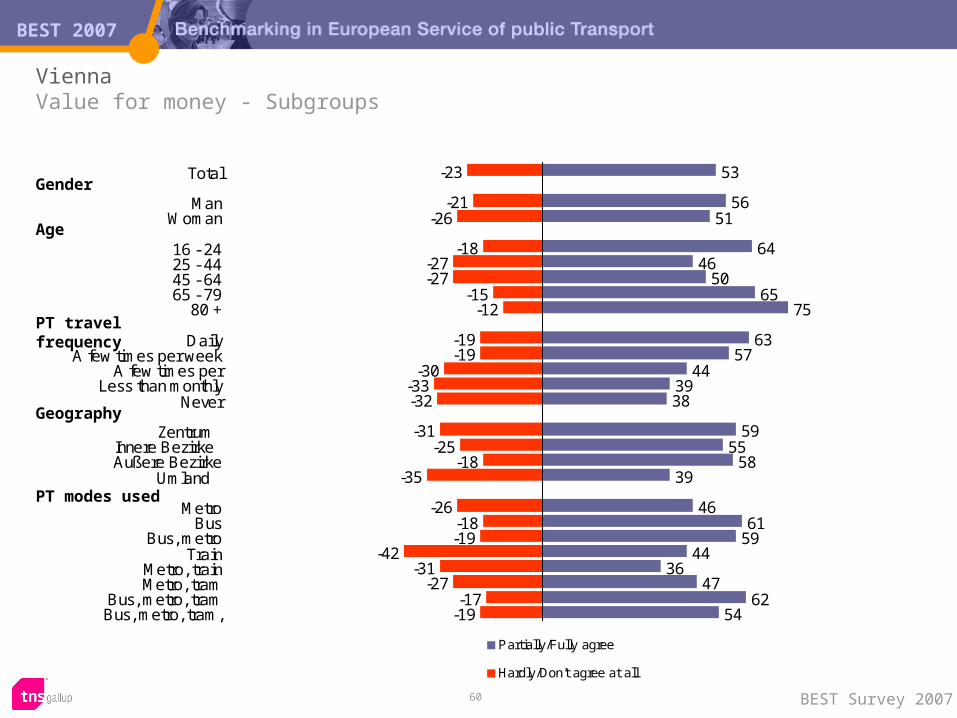
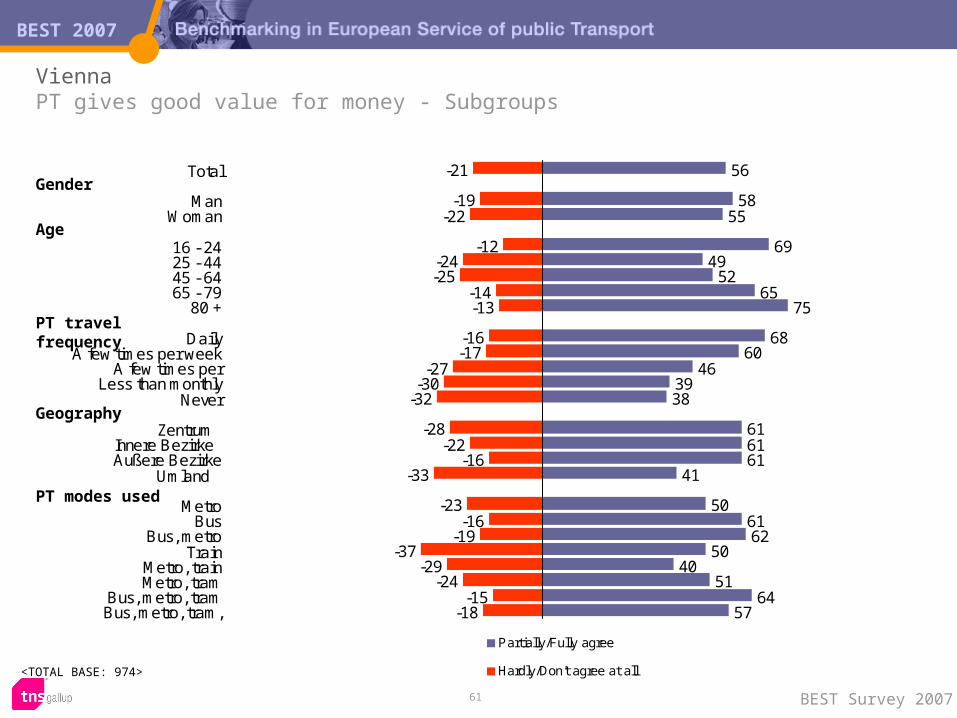
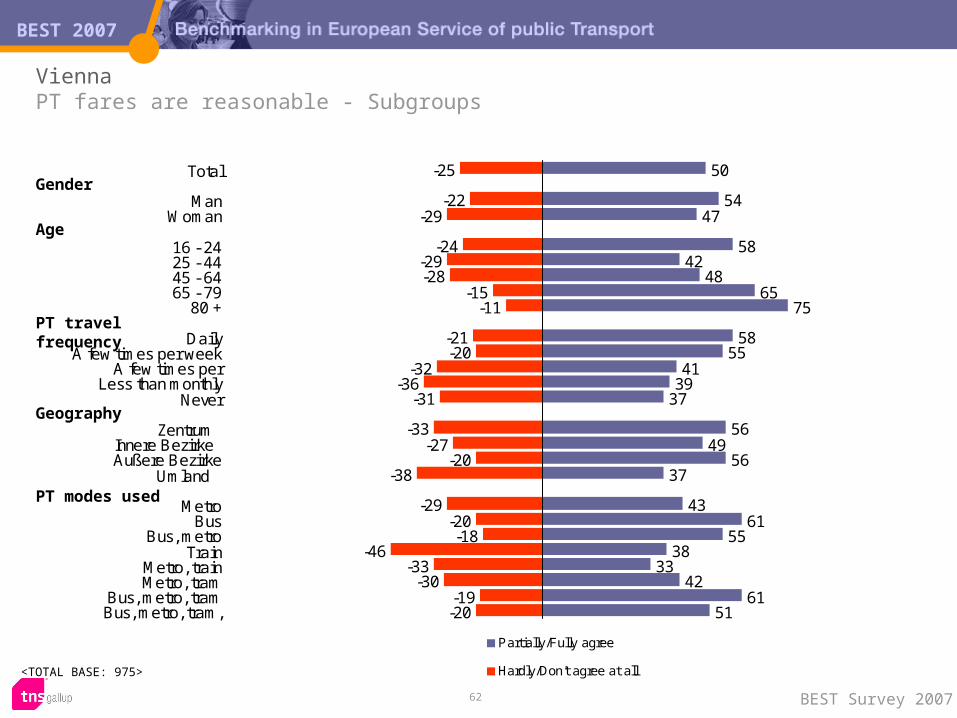
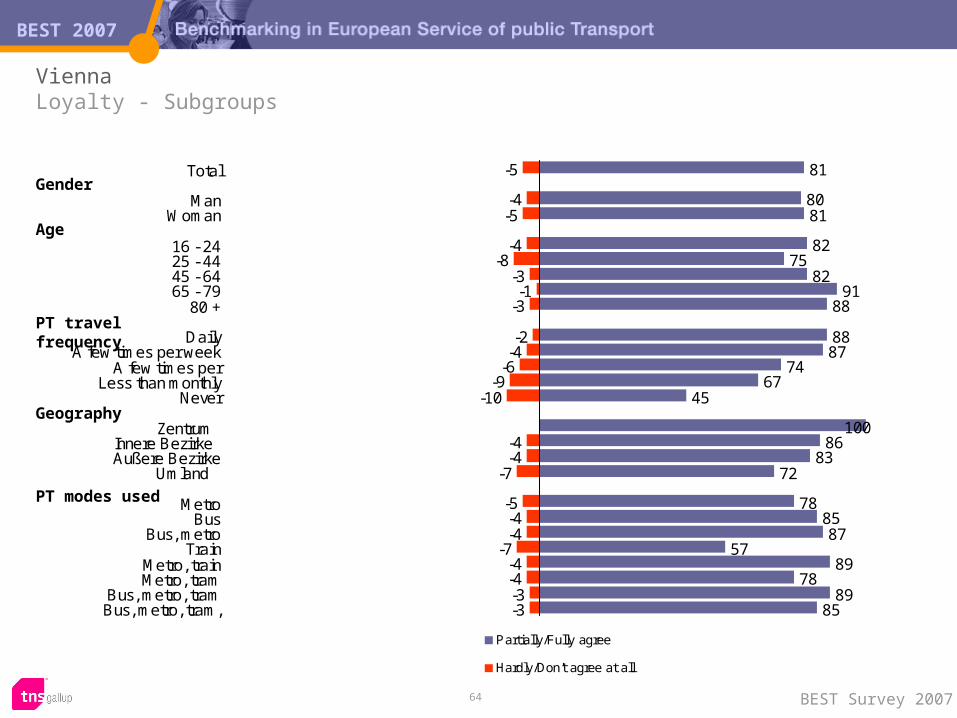
The graph show proportion of respondents that agree/disagree to the statement (as described in more detail above). The topmost column show the distribution for the total city sample, while the columns underneath show the distribution for certain relevant subgroups of the total population – the subgroups included are sex, age, travel frequency, place of residence (city region) and mode(s) of public transport used most often by the respondent.
Results 2007
BEST 2007
6 BEST Survey 2007
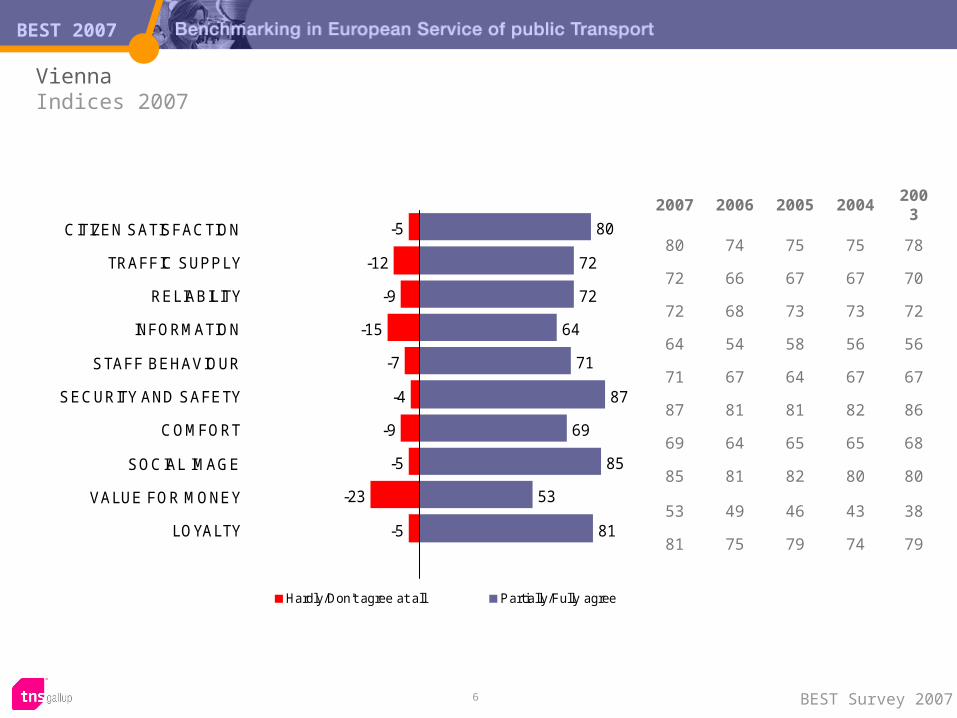
Vienna Indices 2007
-5
-12
-9
-15
-7
-4
-9
-5
-23
-5
80
72
72
64
71
87
69
85
53
81
CITIZEN SATISFACTION
TRAFFIC SUPPLY
RELIABILITY
INFORMATION
STAFF BEHAVIOUR
SECURITY AND SAFETY
COMFORT
SOCIAL IMAGE
VALUE FOR MONEY
LOYALTY
Hardly/Don't agree at all Partially/Fully agree
2007 2006 2005 2004 2003
80 74 75 75 78
72 66 67 67 70
72 68 73 73 72
64 54 58 56 56
71 67 64 67 67
87 81 81 82 86
69 64 65 65 68
85 81 82 80 80
53 49 46 43 38
81 75 79 74 79
Vienna 2007
Quality dimensions
BEST 2007
8 BEST Survey 2007
-12
-10
-19
-5
-13
-9
-10
-14
-14
72
78
63
89
61
85
76
61
65
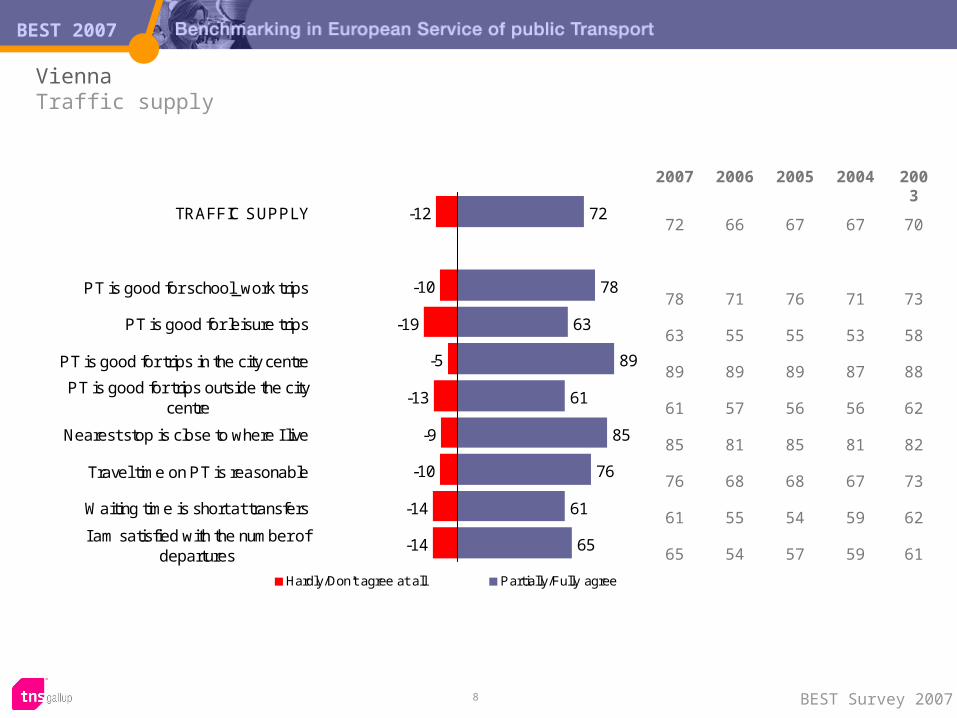
TRAFFIC SUPPLY
PT is good for school_work trips
PT is good for leisure trips
PT is good for trips in the city centre
PT is good for trips outside the citycentre
Nearest stop is close to where I live
Travel time on PT is reasonable
Waiting time is short at transfers
I am satisfied with the number ofdepartures
Hardly/Don't agree at all Partially/Fully agree
Vienna Traffic supply
2007 2006 2005 2004 2003
72 66 67 67 70
78 71 76 71 73
63 55 55 53 58
89 89 89 87 88
61 57 56 56 62
85 81 85 81 82
76 68 68 67 73
61 55 54 59 62
65 54 57 59 61
BEST 2007
9 BEST Survey 2007
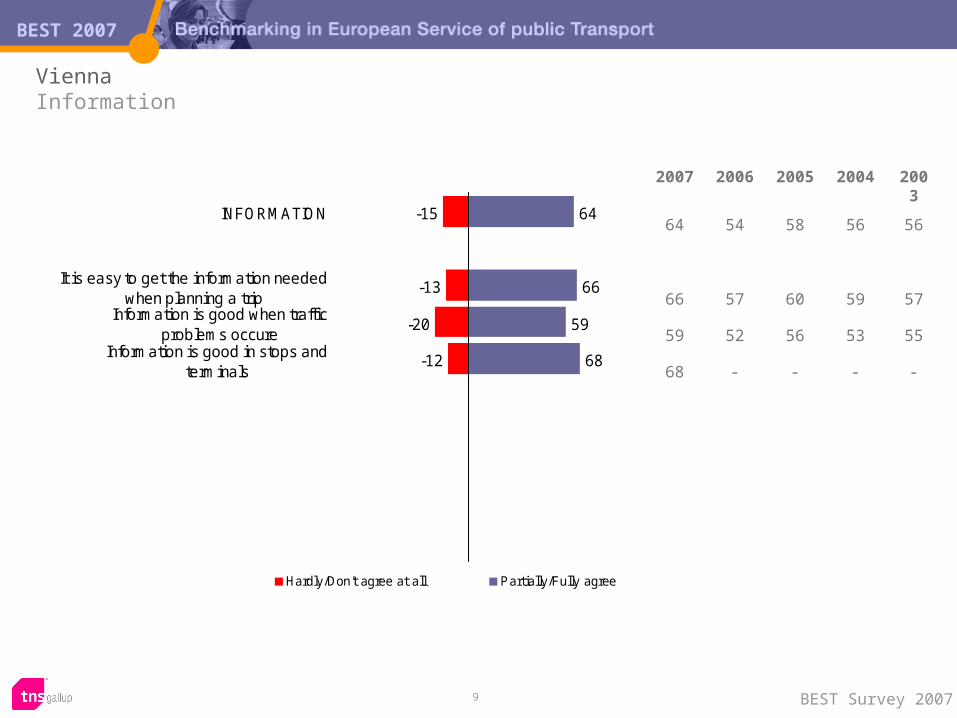
Vienna Information
-15
-13
-20
-12
64
66
59
68
INFORMATION
It is easy to get the information neededwhen planning a trip
Information is good when trafficproblems occure
Information is good in stops andterminals
Hardly/Don't agree at all Partially/Fully agree
2007 2006 2005 2004 2003
64 54 58 56 56
66 57 60 59 57
59 52 56 53 55
68 - - - -
BEST 2007
10 BEST Survey 2007
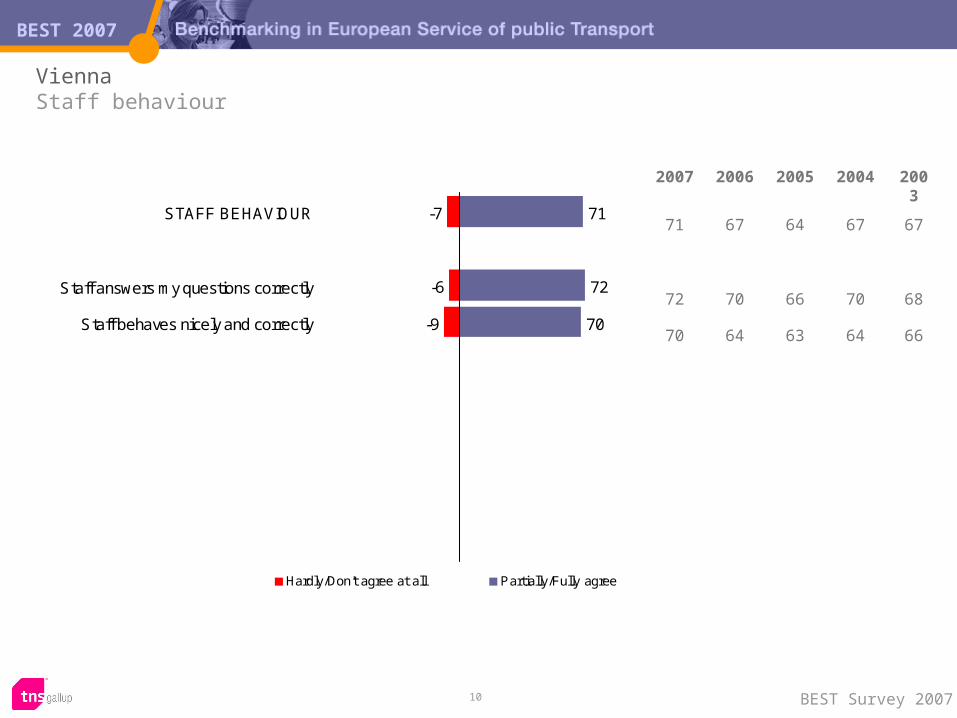
Vienna Staff behaviour
-7
-6
-9
71
72
70
STAFF BEHAVIOUR
Staff answers my questions correctly
Staff behaves nicely and correctly
Hardly/Don't agree at all Partially/Fully agree
2007 2006 2005 2004 2003
71 67 64 67 67
72 70 66 70 68
70 64 63 64 66
BEST 2007
11 BEST Survey 2007
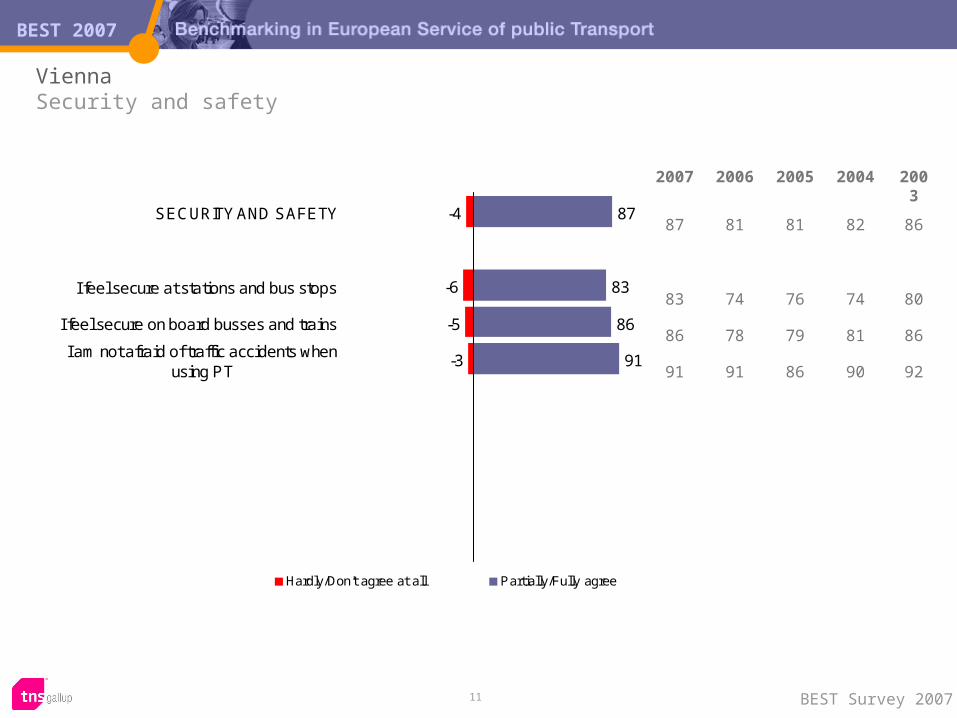
Vienna Security and safety
-4
-6
-5
-3
87
83
86
91
SECURITY AND SAFETY
I feel secure at stations and bus stops
I feel secure on board busses and trains
I am not afraid of traffic accidents whenusing PT
Hardly/Don't agree at all Partially/Fully agree
2007 2006 2005 2004 2003
87 81 81 82 86
83 74 76 74 80
86 78 79 81 86
91 91 86 90 92
BEST 2007
12 BEST Survey 2007
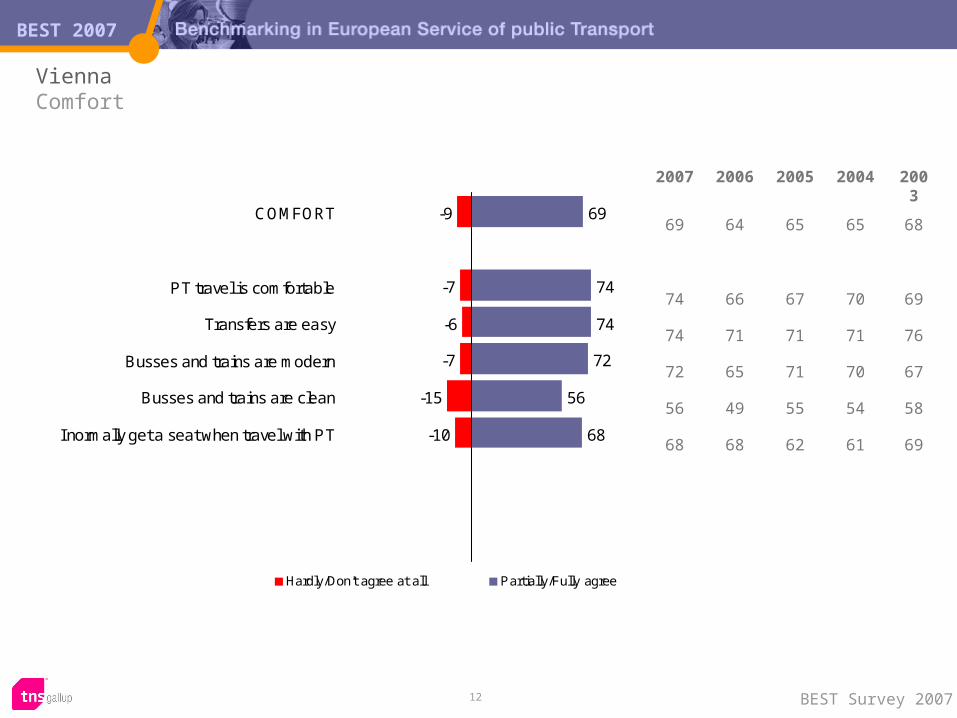
Vienna Comfort
-9
-7
-6
-7
-15
-10
69
74
74
72
56
68
COMFORT
PT travel is comfortable
Transfers are easy
Busses and trains are modern
Busses and trains are clean
I normally get a seat when travel with PT
Hardly/Don't agree at all Partially/Fully agree
2007 2006 2005 2004 2003
69 64 65 65 68
74 66 67 70 69
74 71 71 71 76
72 65 71 70 67
56 49 55 54 58
68 68 62 61 69
BEST 2007
13 BEST Survey 2007
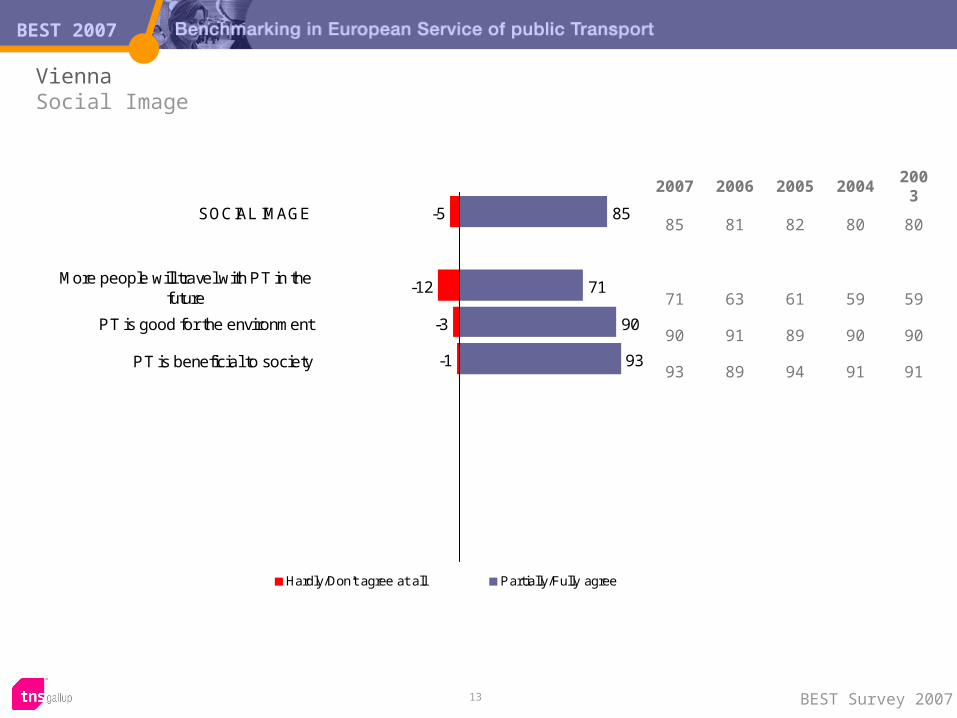
-5
-12
-3
-1
85
71
90
93
SOCIAL IMAGE
More people will travel with PT in thefuture
PT is good for the environment
PT is beneficial to society
Hardly/Don't agree at all Partially/Fully agree
Vienna Social Image
2007 2006 2005 2004 2003
85 81 82 80 80
71 63 61 59 59
90 91 89 90 90
93 89 94 91 91
BEST 2007
14 BEST Survey 2007
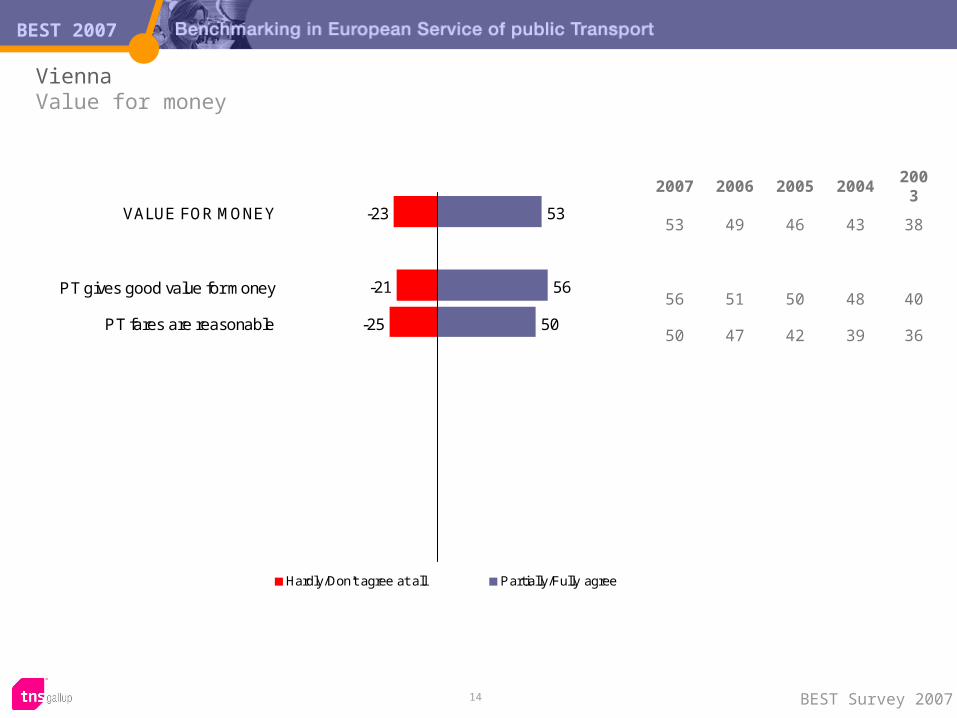
Vienna Value for money
-23
-21
-25
53
56
50
VALUE FOR MONEY
PT gives good value for money
PT fares are reasonable
Hardly/Don't agree at all Partially/Fully agree
2007 2006 2005 2004 2003
53 49 46 43 38
56 51 50 48 40
50 47 42 39 36
Vienna 2007
Satisfaction and impact
BEST 2007
16 BEST Survey 2007
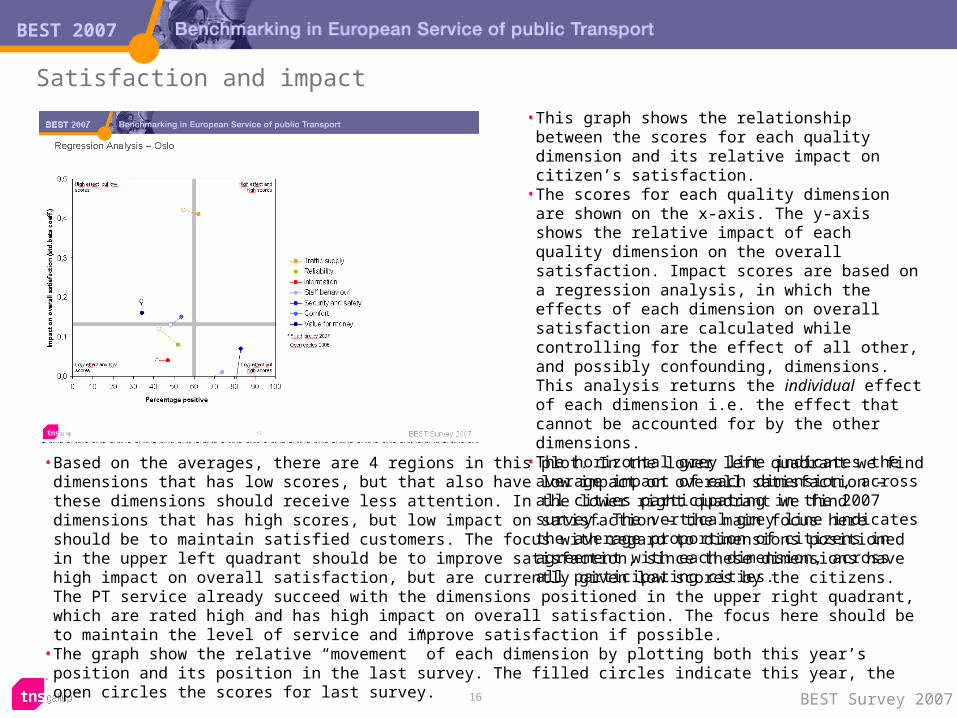
Satisfaction and impact
• This graph shows the relationship between the scores for each quality dimension and its relative impact on citizen’s satisfaction.
• The scores for each quality dimension are shown on the x-axis. The y-axis shows the relative impact of each quality dimension on the overall satisfaction. Impact scores are based on a regression analysis, in which the effects of each dimension on overall satisfaction are calculated while controlling for the effect of all other, and possibly confounding, dimensions. This analysis returns the individual effect of each dimension i.e. the effect that cannot be accounted for by the other dimensions.
• The horizontal grey line indicates the average impact of each dimension, across all cities participating in the 2007 survey. The vertical grey line indicates the average proportion of citizens in agreement with each dimension, across all participating cities.
• Based on the averages, there are 4 regions in this plot. In the lower left quadrant we find dimensions that has low scores, but that also have low impact on overall satisfaction – these dimensions should receive less attention. In the lower right quadrant we find dimensions that has high scores, but low impact on satisfaction – the main focus here should be to maintain satisfied customers. The focus with regard to dimensions positioned in the upper left quadrant should be to improve satisfaction, since these dimensions have high impact on overall satisfaction, but are currently given low scores by the citizens. The PT service already succeed with the dimensions positioned in the upper right quadrant, which are rated high and has high impact on overall satisfaction. The focus here should be to maintain the level of service and improve satisfaction if possible.
• The graph show the relative “movement” of each dimension by plotting both this year’s position and its position in the last survey. The filled circles indicate this year, the open circles the scores for last survey.
BEST 2007
17 BEST Survey 2007
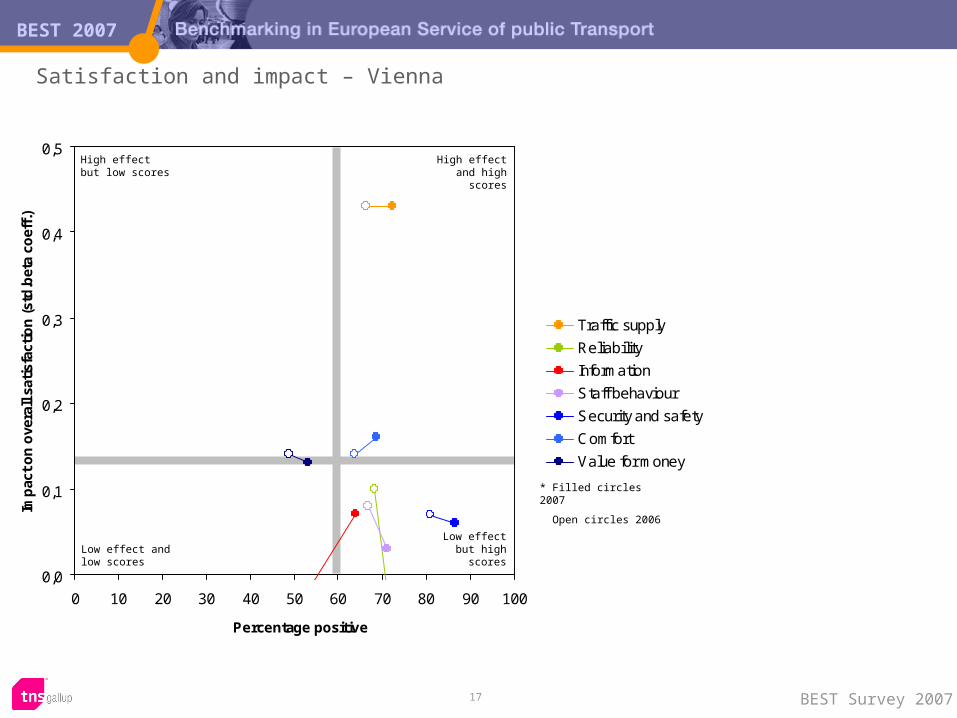
Satisfaction and impact – Vienna
0,0
0,1
0,2
0,3
0,4
0,5
0 10 20 30 40 50 60 70 80 90 100
Percentage positive
Imp
act
on
ove
rall
sati
sfac
tio
n (
std
.bet
a co
eff.
)
Traffic supply
Reliability
Information
Staff behaviour
Security and safety
Comfort
Value for money
Low effect and low scores
Low effect but high scores
High effect and high scores
High effect but low scores
* Filled circles 2007
Open circles 2006
Vienna 2007
Appendix
Vienna 2007
Citizen satisfaction
BEST 2007
20 BEST Survey 2007
Vienna CITIZEN SATISFACTION - Subgroups
80
7980
8175
8285
90
8589
7665
34
8087
8269
758181
4976
8492
83
-5
-6-4
-5-7
-4-2
-3-4
-6-9
-22
-3-5
-7
-7-2-2-1
-5-5
-1-4
Total
ManWoman
16 - 2425 - 4445 - 6465 - 79
80 +
DailyA few times per week
A few times perLess than monthly
Never
Zentrum Innere Bezirke Außere Bezirke
Umland
MetroBus
Bus, metroTrain
Metro, trainMetro, tram
Bus, metro, tramBus, metro, tram,
Partially/Fully agree
Hardly/Don't agree at all<TOTAL BASE: 993>
Gender
Age
PT travel frequency
Geography
PT modes used
Vienna 2007
Traffic supply in subgroups

BEST 2007
22 BEST Survey 2007
Vienna Traffic supply - Subgroups
72
7372
7468
727981
7977
6760
45
837675
63
717677
6266
7180
74
-12
-11-13
-10-13-13
-9-7
-8-8
-16-20-21
-5-10
-9-20
-14-12
-8-18
-20-11
-6-11
Total
ManWoman
16 - 2425 - 4445 - 6465 - 79
80 +
DailyA few times per week
A few times perLess than monthly
Never
Zentrum Innere Bezirke Außere Bezirke
Umland
MetroBus
Bus, metroTrain
Metro, trainMetro, tram
Bus, metro, tramBus, metro, tram,
Partially/Fully agree
Hardly/Don't agree at all
Gender
Age
PT travel frequency
Geography
PT modes used
BEST 2007
23 BEST Survey 2007
Vienna Good for work/school trips - Subgroups
<TOTAL BASE: 936>
78
8075
8771
7883
88
9086
6556
47
1008183
62
7779
8852
5081
8782
-10
-6-13
-6-14
-10-5-5
-2-6
-19-20
-26
-4-6
-24
-11-16
-4-27
-30-8
-3-4
Total
ManWoman
16 - 2425 - 4445 - 6465 - 79
80 +
DailyA few times per week
A few times perLess than monthly
Never
Zentrum Innere Bezirke Außere Bezirke
Umland
MetroBus
Bus, metroTrain
Metro, trainMetro, tram
Bus, metro, tramBus, metro, tram,
Partially/Fully agree
Hardly/Don't agree at all
Gender
Age
PT travel frequency
Geography
PT modes used
BEST 2007
24 BEST Survey 2007
Vienna PT is good for leisure trips - Subgroups
<TOTAL BASE: 989>
63
6264
6954
6474
83
7569
5739
34
796968
48
616971
2945
5977
71
-19
-17-21
-10-23-22
-14-7
-9-15
-26-38
-34
-5-15-14
-34
-23-23
-15-30
-36-17
-7-11
Total
ManWoman
16 - 2425 - 4445 - 6465 - 79
80 +
DailyA few times per week
A few times perLess than monthly
Never
Zentrum Innere Bezirke Außere Bezirke
Umland
MetroBus
Bus, metroTrain
Metro, trainMetro, tram
Bus, metro, tramBus, metro, tram,
Partially/Fully agree
Hardly/Don't agree at all
Gender
Age
PT travel frequency
Geography
PT modes used
BEST 2007
25 BEST Survey 2007
Vienna PT is good for trips in the city centre - Subgroups
<TOTAL BASE: 981>
89
8790
87889091
89
879293
8569
7481
9288
9079
9382
9287
9290
-5
-5-4
-5-6-4-2
-7
-6-3-2
-7-6
-11-12
-2-5
-6-3-1
-9-7-6-4-5
Total
ManWoman
16 - 2425 - 4445 - 6465 - 79
80 +
DailyA few times per week
A few times perLess than monthly
Never
Zentrum Innere Bezirke Außere Bezirke
Umland
MetroBus
Bus, metroTrain
Metro, trainMetro, tram
Bus, metro, tramBus, metro, tram,
Partially/Fully agree
Hardly/Don't agree at all
Gender
Age
PT travel frequency
Geography
PT modes used
BEST 2007
26 BEST Survey 2007
Vienna PT is good for trips outside the city centre - Subgroups
<TOTAL BASE: 962>
61
5765
6257
6168
79
6871
4947
43
9569
6156
5563
596062
6071
59
-13
-14-13
-10-15-15
-12-4
-9-6
-20-25
-15
-5-10
-13-17
-19-7
-14-14
-17-15
-7-18
Total
ManWoman
16 - 2425 - 4445 - 6465 - 79
80 +
DailyA few times per week
A few times perLess than monthly
Never
Zentrum Innere Bezirke Außere Bezirke
Umland
MetroBus
Bus, metroTrain
Metro, trainMetro, tram
Bus, metro, tramBus, metro, tram,
Partially/Fully agree
Hardly/Don't agree at all
Gender
Age
PT travel frequency
Geography
PT modes used
BEST 2007
27 BEST Survey 2007
Vienna Nearest stop is close to where I live - Subgroups
<TOTAL BASE: 999>
85
8585
858584
9087
9287
8376
66
10093
9069
808585
7674
8894
85
-9
-9-9
-5-9
-10-8-9
-4-7
-13-14
-19
-6-4
-21
-13-14
-9-18-19
-4-2
-10
Total
ManWoman
16 - 2425 - 4445 - 6465 - 79
80 +
DailyA few times per week
A few times perLess than monthly
Never
Zentrum Innere Bezirke Außere Bezirke
Umland
MetroBus
Bus, metroTrain
Metro, trainMetro, tram
Bus, metro, tramBus, metro, tram,
Partially/Fully agree
Hardly/Don't agree at all
Gender
Age
PT travel frequency
Geography
PT modes used
BEST 2007
28 BEST Survey 2007
Vienna Travel time on PT is reasonable - Subgroups
<TOTAL BASE: 987>
76
7775
7672
778486
8382
6766
39
7383
7965
7076
8561
7678
8482
-10
-10-11
-11-12-11
-7-3
-6-7
-13-19
-29
-6-8
-20
-15-6-7
-14-16
-9-3
-8
Total
ManWoman
16 - 2425 - 4445 - 6465 - 79
80 +
DailyA few times per week
A few times perLess than monthly
Never
Zentrum Innere Bezirke Außere Bezirke
Umland
MetroBus
Bus, metroTrain
Metro, trainMetro, tram
Bus, metro, tramBus, metro, tram,
Partially/Fully agree
Hardly/Don't agree at all
Gender
Age
PT travel frequency
Geography
PT modes used
BEST 2007
29 BEST Survey 2007
Vienna I am satisfied with the number of departures - Subgroups
<TOTAL BASE: 982>
65
6863
6761
6474
78
7268
6056
35
6975
6657
6474
6671
6364
7364
-14
-12-17
-13-16-15
-12-9
-11-11
-17-22
-27
-16-9
-12-23
-15-22
-6-17
-22-12
-8-16
Total
ManWoman
16 - 2425 - 4445 - 6465 - 79
80 +
DailyA few times per week
A few times perLess than monthly
Never
Zentrum Innere Bezirke Außere Bezirke
Umland
MetroBus
Bus, metroTrain
Metro, trainMetro, tram
Bus, metro, tramBus, metro, tram,
Partially/Fully agree
Hardly/Don't agree at all
Gender
Age
PT travel frequency
Geography
PT modes used
BEST 2007
30 BEST Survey 2007
Vienna Waiting time is short at transfers - Subgroups
<TOTAL BASE: 968>
61
6557
625960
6960
6564
5755
19
805960
63
6783
726668
5462
56
-14
-13-14
-20-13
-15-11-11
-15-8
-18-17
-13
0-18
-13-15
-14-5
-8-15
-12-14-12-13
Total
ManWoman
16 - 2425 - 4445 - 6465 - 79
80 +
DailyA few times per week
A few times perLess than monthly
Never
Zentrum Innere Bezirke Außere Bezirke
Umland
MetroBus
Bus, metroTrain
Metro, trainMetro, tram
Bus, metro, tramBus, metro, tram,
Partially/Fully agree
Hardly/Don't agree at all
Gender
Age
PT travel frequency
Geography
PT modes used
Vienna 2007
Reliability in subgroups
BEST 2007
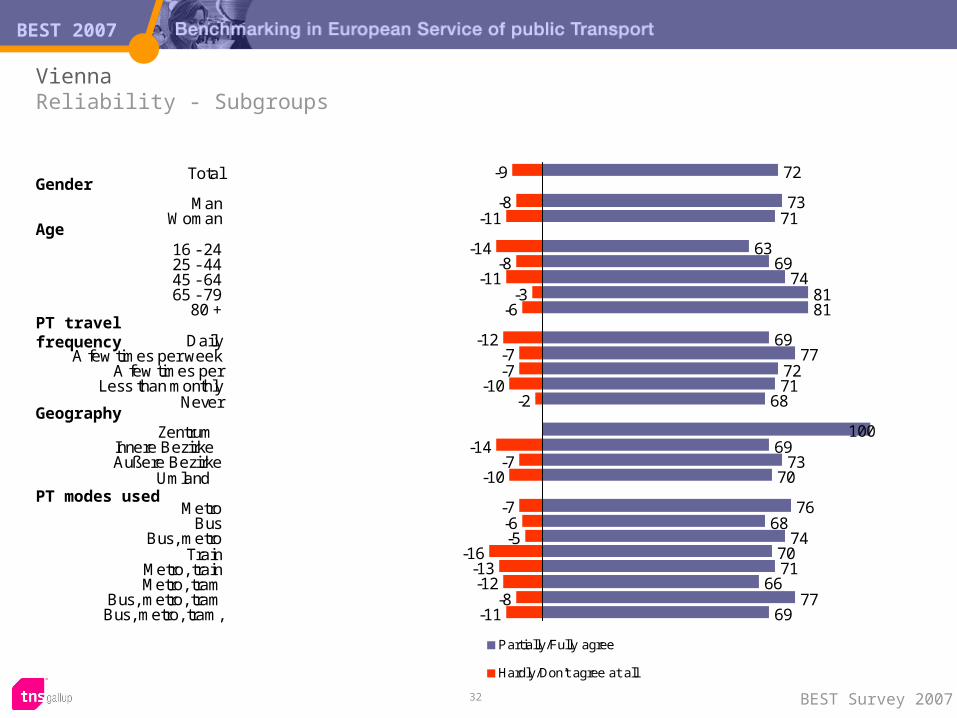
32 BEST Survey 2007
Vienna Reliability - Subgroups
72
7371
6369
748181
6977
7271
68
10069
7370
7668
747071
6677
69
-9
-8-11
-14-8
-11-3
-6
-12-7-7
-10-2
-14-7
-10
-7-6-5
-16-13-12
-8-11
Total
ManWoman
16 - 2425 - 4445 - 6465 - 79
80 +
DailyA few times per week
A few times perLess than monthly
Never
Zentrum Innere Bezirke Außere Bezirke
Umland
MetroBus
Bus, metroTrain
Metro, trainMetro, tram
Bus, metro, tramBus, metro, tram,
Partially/Fully agree
Hardly/Don't agree at all
Gender
Age
PT travel frequency
Geography
PT modes used
Vienna 2007
Information in subgroups
BEST 2007
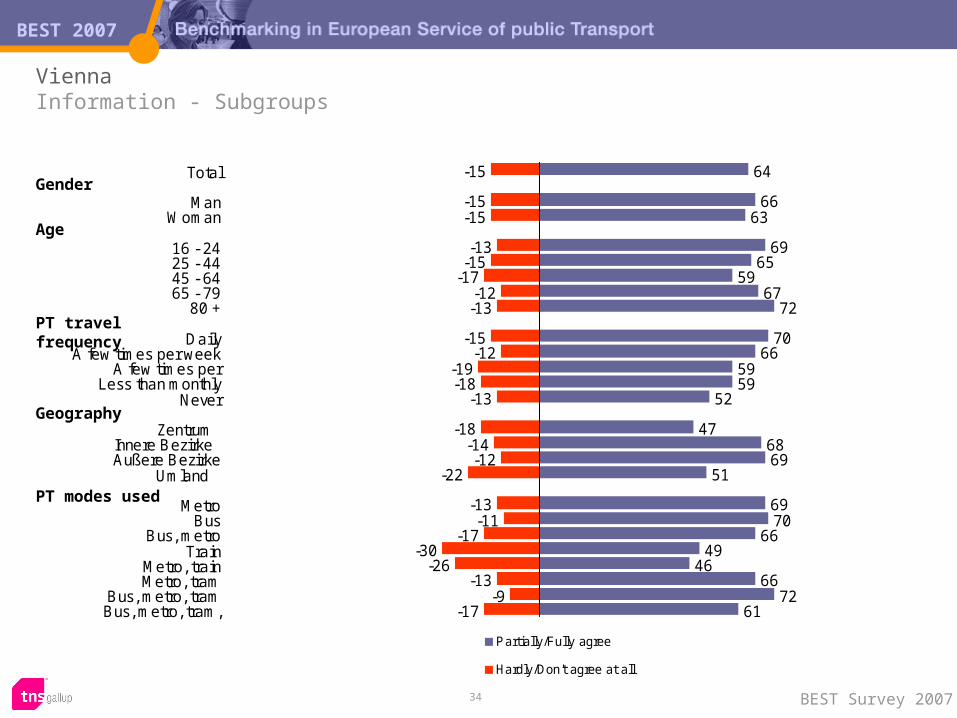
34 BEST Survey 2007
64
6663
6965
5967
72
7066
5959
52
476869
51
6970
6649
4666
7261
-15
-15-15
-13-15
-17-12-13
-15-12
-19-18
-13
-18-14-12
-22
-13-11
-17-30
-26-13
-9-17
Total
ManWoman
16 - 2425 - 4445 - 6465 - 79
80 +
DailyA few times per week
A few times perLess than monthly
Never
Zentrum Innere Bezirke Außere Bezirke
Umland
MetroBus
Bus, metroTrain
Metro, trainMetro, tram
Bus, metro, tramBus, metro, tram,
Partially/Fully agree
Hardly/Don't agree at all
Vienna Information - Subgroups
Gender
Age
PT travel frequency
Geography
PT modes used
BEST 2007
35 BEST Survey 2007
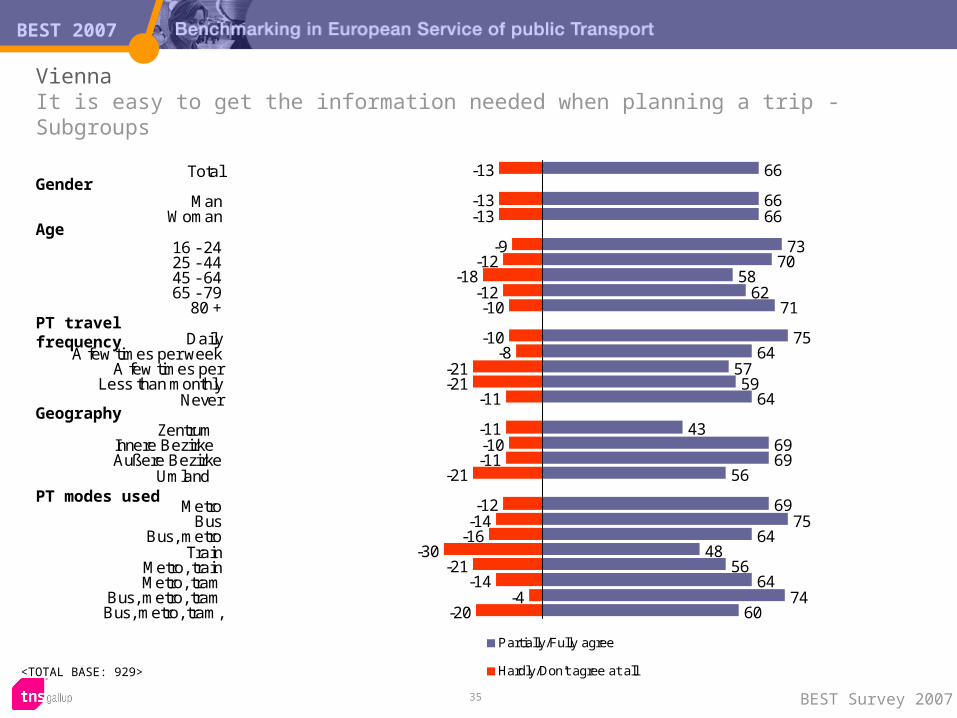
Vienna It is easy to get the information needed when planning a trip - Subgroups
<TOTAL BASE: 929>
66
6666
7370
5862
71
7564
5759
64
436969
56
6975
6448
5664
7460
-13
-13-13
-9-12
-18-12-10
-10-8
-21-21
-11
-11-10-11
-21
-12-14
-16-30
-21-14
-4-20
Total
ManWoman
16 - 2425 - 4445 - 6465 - 79
80 +
DailyA few times per week
A few times perLess than monthly
Never
Zentrum Innere Bezirke Außere Bezirke
Umland
MetroBus
Bus, metroTrain
Metro, trainMetro, tram
Bus, metro, tramBus, metro, tram,
Partially/Fully agree
Hardly/Don't agree at all
Gender
Age
PT travel frequency
Geography
PT modes used
BEST 2007
36 BEST Survey 2007
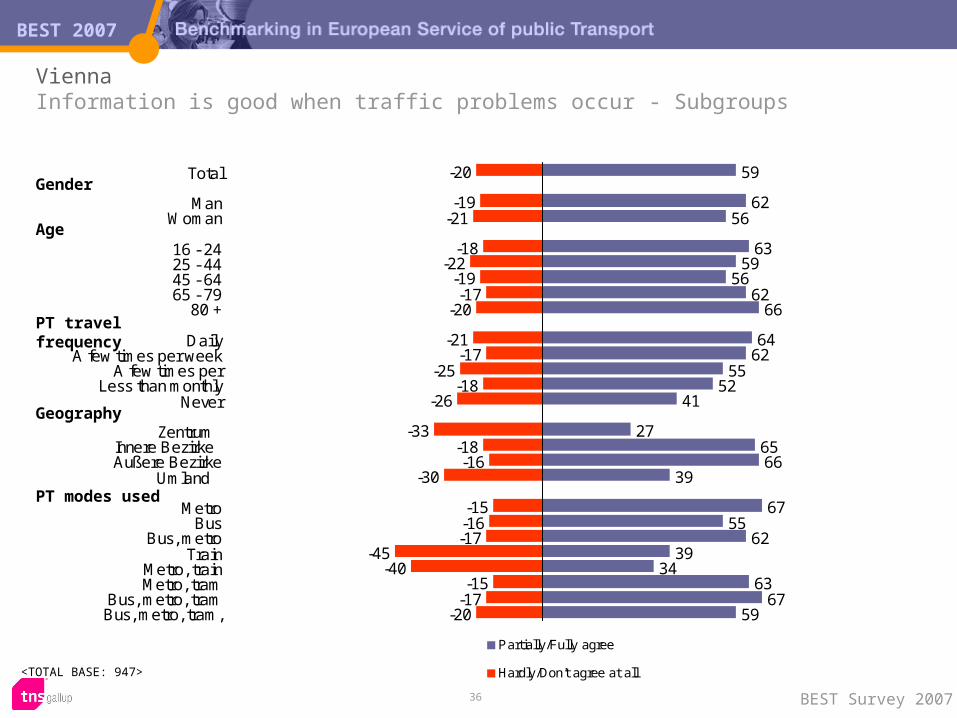
Vienna Information is good when traffic problems occur - Subgroups
<TOTAL BASE: 947>
59
6256
6359
5662
66
6462
5552
41
276566
39
6755
6239
3463
6759
-20
-19-21
-18-22
-19-17
-20
-21-17
-25-18
-26
-33-18-16
-30
-15-16-17
-45-40
-15-17
-20
Total
ManWoman
16 - 2425 - 4445 - 6465 - 79
80 +
DailyA few times per week
A few times perLess than monthly
Never
Zentrum Innere Bezirke Außere Bezirke
Umland
MetroBus
Bus, metroTrain
Metro, trainMetro, tram
Bus, metro, tramBus, metro, tram,
Partially/Fully agree
Hardly/Don't agree at all
Gender
Age
PT travel frequency
Geography
PT modes used
BEST 2007
37 BEST Survey 2007
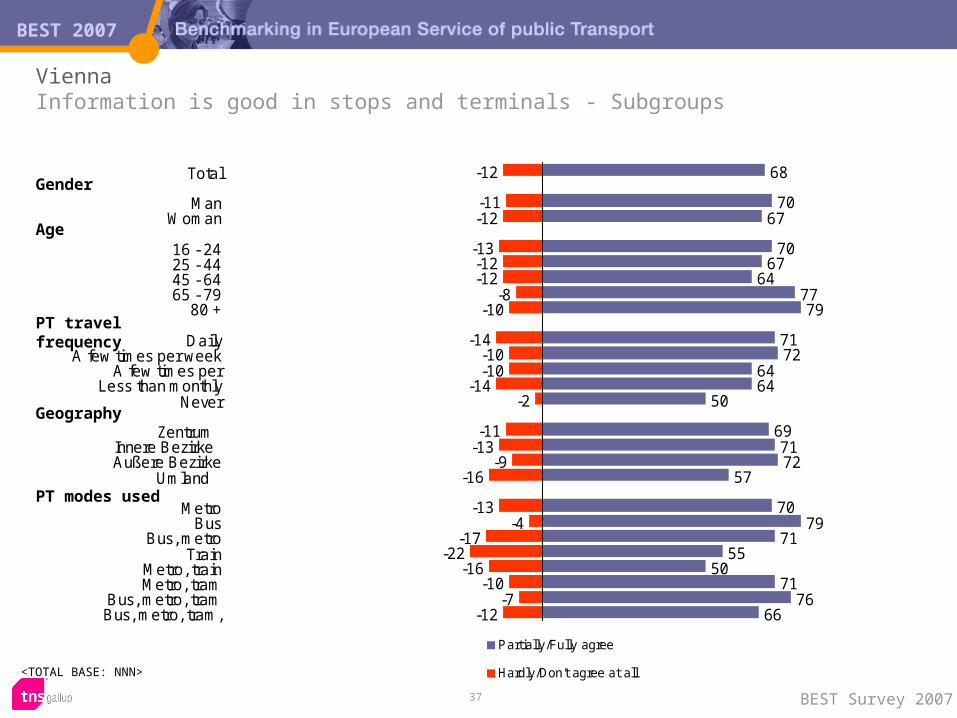
Vienna Information is good in stops and terminals - Subgroups
<TOTAL BASE: NNN>
Gender
Age
PT travel frequency
Geography
PT modes used
68
7067
7067
647779
7172
6464
50
697172
57
7079
7155
5071
7666
-12
-11-12
-13-12-12
-8-10
-14-10-10
-14-2
-11-13
-9-16
-13-4
-17-22
-16-10
-7-12
Total
ManWoman
16 - 2425 - 4445 - 6465 - 79
80 +
DailyA few times per week
A few times perLess than monthly
Never
Zentrum Innere Bezirke Außere Bezirke
Umland
MetroBus
Bus, metroTrain
Metro, trainMetro, tram
Bus, metro, tramBus, metro, tram,
Partially/Fully agree
Hardly/Don't agree at all
Vienna 2007
Staff behaviour in subgroups
BEST 2007
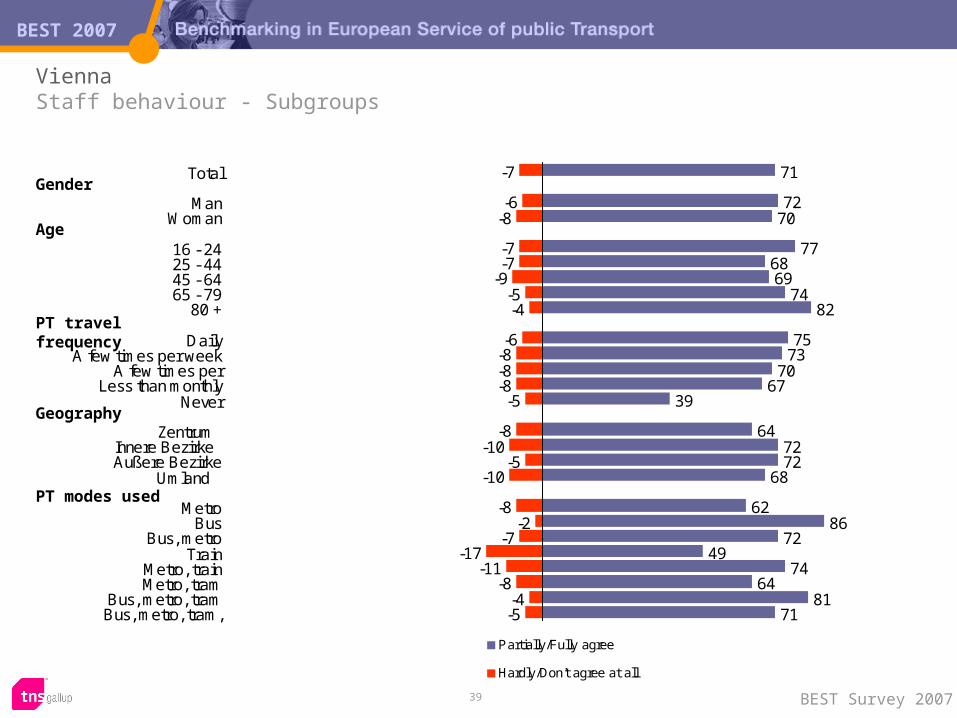
39 BEST Survey 2007
Vienna Staff behaviour - Subgroups
71
7270
776869
7482
7573
7067
39
647272
68
6286
7249
7464
8171
-7
-6-8
-7-7
-9-5-4
-6-8-8-8
-5
-8-10
-5-10
-8-2
-7-17
-11-8
-4-5
Total
ManWoman
16 - 2425 - 4445 - 6465 - 79
80 +
DailyA few times per week
A few times perLess than monthly
Never
Zentrum Innere Bezirke Außere Bezirke
Umland
MetroBus
Bus, metroTrain
Metro, trainMetro, tram
Bus, metro, tramBus, metro, tram,
Partially/Fully agree
Hardly/Don't agree at all
Gender
Age
PT travel frequency
Geography
PT modes used
BEST 2007
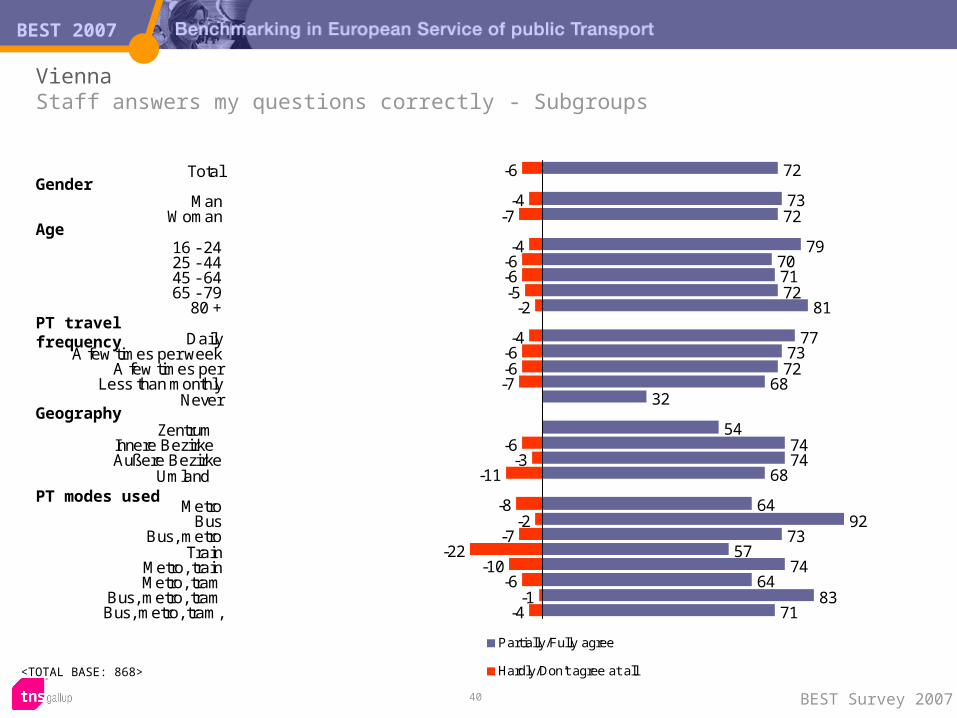
40 BEST Survey 2007
Vienna Staff answers my questions correctly - Subgroups
<TOTAL BASE: 868>
72
7372
79707172
81
777372
6832
547474
68
6492
7357
7464
8371
-6
-4-7
-4-6-6-5
-2
-4-6-6-7
-6-3
-11
-8-2
-7-22
-10-6
-1-4
Total
ManWoman
16 - 2425 - 4445 - 6465 - 79
80 +
DailyA few times per week
A few times perLess than monthly
Never
Zentrum Innere Bezirke Außere Bezirke
Umland
MetroBus
Bus, metroTrain
Metro, trainMetro, tram
Bus, metro, tramBus, metro, tram,
Partially/Fully agree
Hardly/Don't agree at all
Gender
Age
PT travel frequency
Geography
PT modes used
BEST 2007
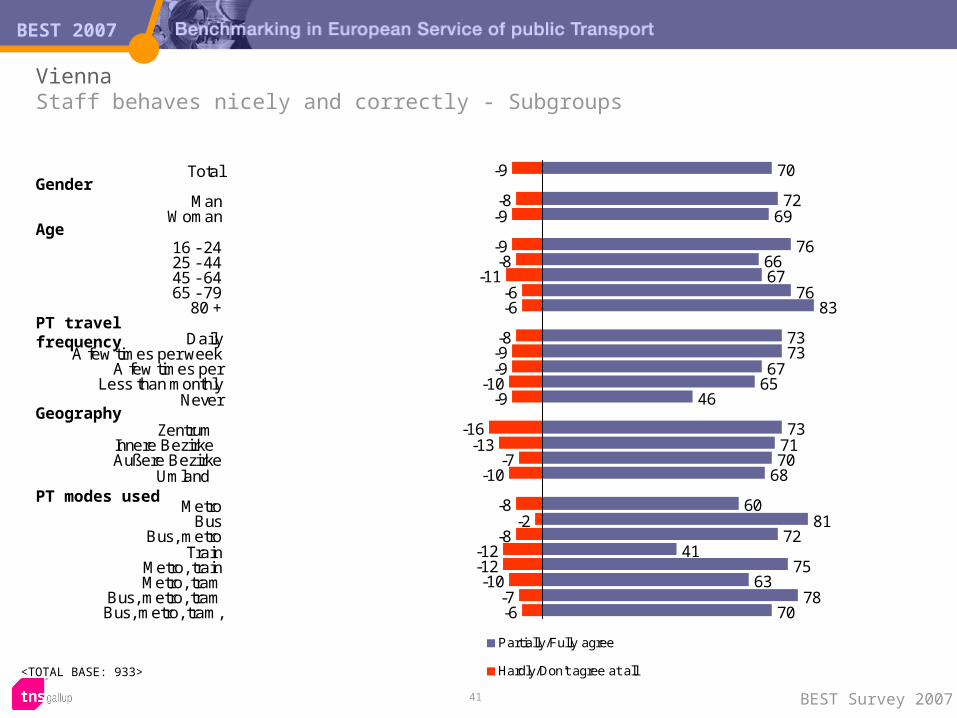
41 BEST Survey 2007
Vienna Staff behaves nicely and correctly - Subgroups
<TOTAL BASE: 933>
70
7269
766667
7683
7373
6765
46
737170
68
6081
7241
7563
7870
-9
-8-9
-9-8
-11-6-6
-8-9-9
-10-9
-16-13
-7-10
-8-2
-8-12-12-10
-7-6
Total
ManWoman
16 - 2425 - 4445 - 6465 - 79
80 +
DailyA few times per week
A few times perLess than monthly
Never
Zentrum Innere Bezirke Außere Bezirke
Umland
MetroBus
Bus, metroTrain
Metro, trainMetro, tram
Bus, metro, tramBus, metro, tram,
Partially/Fully agree
Hardly/Don't agree at all
Gender
Age
PT travel frequency
Geography
PT modes used
Vienna 2007
Security and safety in subgroups

BEST 2007
43 BEST Survey 2007
Vienna Security and safety - Subgroups
87
8984
9086878687
9089
8680
66
8992
8683
8489
878585
9090
87
-4
-3-6
-3-4-4
-6-6
-3-3-4
-9-13
-2-2
-5-6
-6-1
-5-6-5-3-4-3
Total
ManWoman
16 - 2425 - 4445 - 6465 - 79
80 +
DailyA few times per week
A few times perLess than monthly
Never
Zentrum Innere Bezirke Außere Bezirke
Umland
MetroBus
Bus, metroTrain
Metro, trainMetro, tram
Bus, metro, tramBus, metro, tram,
Partially/Fully agree
Hardly/Don't agree at all
Gender
Age
PT travel frequency
Geography
PT modes used
BEST 2007
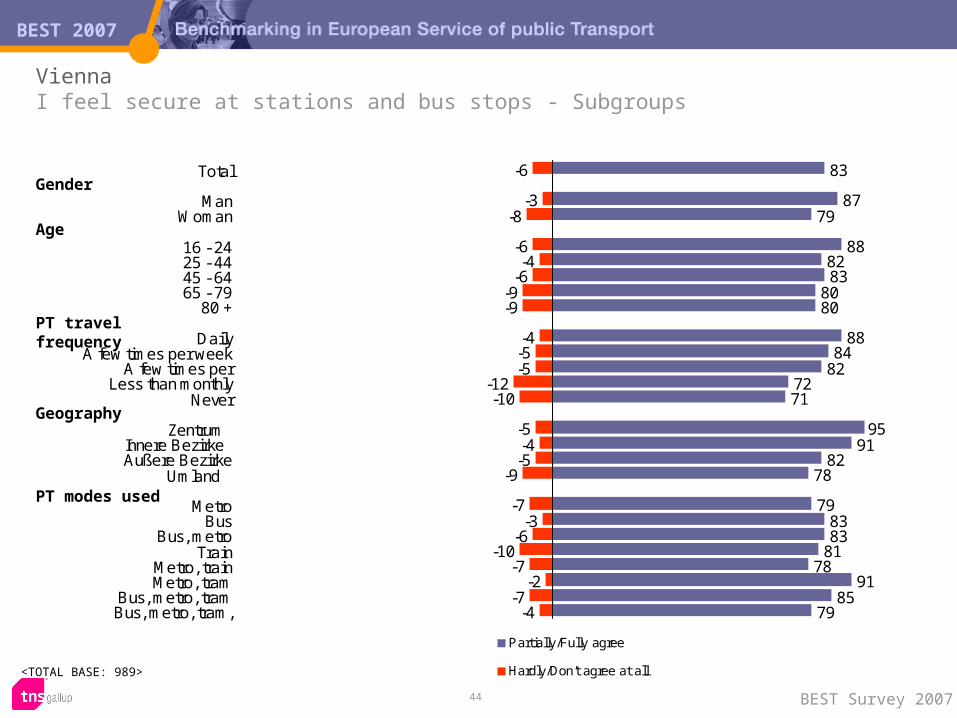
44 BEST Survey 2007
Vienna I feel secure at stations and bus stops - Subgroups
<TOTAL BASE: 989>
83
8779
888283
8080
8884
827271
9591
8278
798383
8178
9185
79
-6
-3-8
-6-4
-6-9-9
-4-5-5
-12-10
-5-4-5
-9
-7-3
-6-10
-7-2
-7-4
Total
ManWoman
16 - 2425 - 4445 - 6465 - 79
80 +
DailyA few times per week
A few times perLess than monthly
Never
Zentrum Innere Bezirke Außere Bezirke
Umland
MetroBus
Bus, metroTrain
Metro, trainMetro, tram
Bus, metro, tramBus, metro, tram,
Partially/Fully agree
Hardly/Don't agree at all
Gender
Age
PT travel frequency
Geography
PT modes used

BEST 2007
45 BEST Survey 2007
Vienna I feel secure on board busses and trains - Subgroups
<TOTAL BASE: 994>
86
8883
9285858483
9088
8478
59
7294
8681
8793
8687
8088
9188
-5
-3-7
-3-5-3
-8-8
-4-3-3
-10-10
-1-6-6
-7
-5-5-5-4-5-3
Total
ManWoman
16 - 2425 - 4445 - 6465 - 79
80 +
DailyA few times per week
A few times perLess than monthly
Never
Zentrum Innere Bezirke Außere Bezirke
Umland
MetroBus
Bus, metroTrain
Metro, trainMetro, tram
Bus, metro, tramBus, metro, tram,
Partially/Fully agree
Hardly/Don't agree at all
Gender
Age
PT travel frequency
Geography
PT modes used
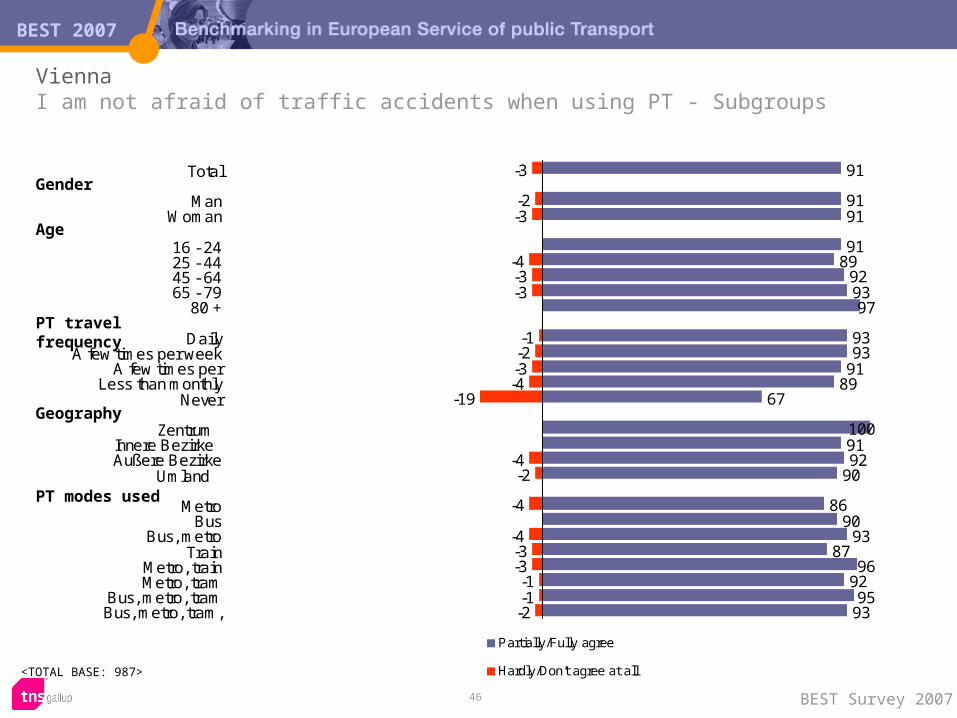
BEST 2007
46 BEST Survey 2007
Vienna I am not afraid of traffic accidents when using PT - Subgroups
<TOTAL BASE: 987>
91
9191
9189
929397
9393
9189
67
1009192
90
8690
9387
969295
93
-3
-2-3
-4-3-3
-1-2-3-4
-19
-4-2
-4
-4-3-3-1-1-2
Total
ManWoman
16 - 2425 - 4445 - 6465 - 79
80 +
DailyA few times per week
A few times perLess than monthly
Never
Zentrum Innere Bezirke Außere Bezirke
Umland
MetroBus
Bus, metroTrain
Metro, trainMetro, tram
Bus, metro, tramBus, metro, tram,
Partially/Fully agree
Hardly/Don't agree at all
Gender
Age
PT travel frequency
Geography
PT modes used
Vienna 2007
Comfort in subgroups
BEST 2007
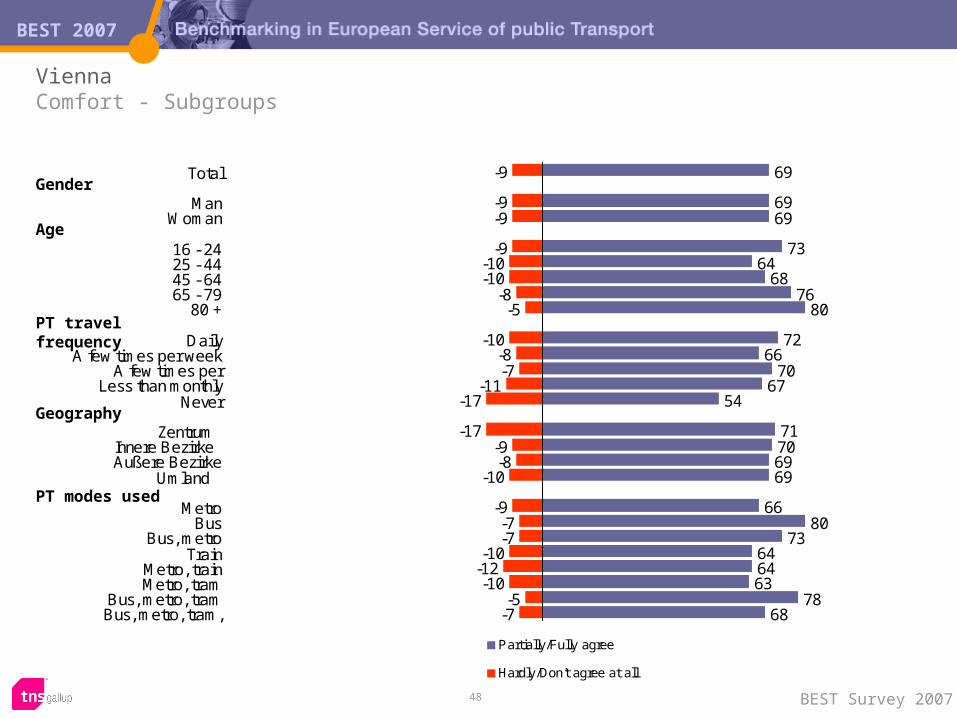
48 BEST Survey 2007
Vienna Comfort - Subgroups
69
6969
7364
6876
80
7266
7067
54
71706969
6680
73646463
7868
-9
-9-9
-9-10-10
-8-5
-10-8-7
-11-17
-17-9-8
-10
-9-7-7
-10-12-10
-5-7
Total
ManWoman
16 - 2425 - 4445 - 6465 - 79
80 +
DailyA few times per week
A few times perLess than monthly
Never
Zentrum Innere Bezirke Außere Bezirke
Umland
MetroBus
Bus, metroTrain
Metro, trainMetro, tram
Bus, metro, tramBus, metro, tram,
Partially/Fully agree
Hardly/Don't agree at all
Gender
Age
PT travel frequency
Geography
PT modes used
BEST 2007
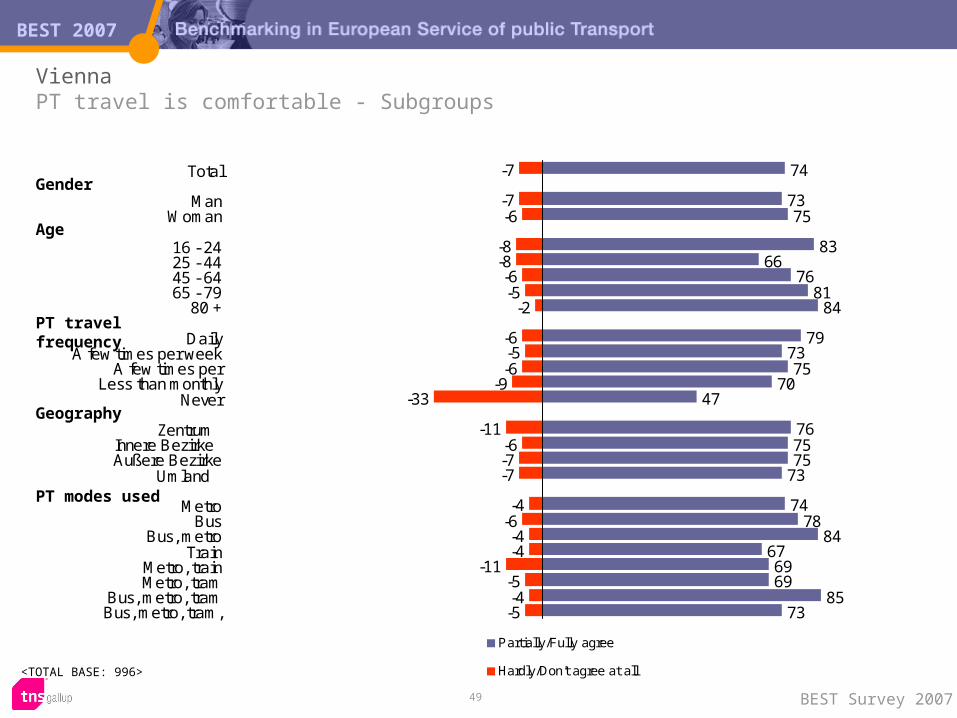
49 BEST Survey 2007
Vienna PT travel is comfortable - Subgroups
<TOTAL BASE: 996>
74
7375
8366
7681
84
797375
7047
767575
73
7478
84676969
8573
-7
-7-6
-8-8-6-5
-2
-6-5-6
-9-33
-11-6-7-7
-4-6-4-4
-11-5-4-5
Total
ManWoman
16 - 2425 - 4445 - 6465 - 79
80 +
DailyA few times per week
A few times perLess than monthly
Never
Zentrum Innere Bezirke Außere Bezirke
Umland
MetroBus
Bus, metroTrain
Metro, trainMetro, tram
Bus, metro, tramBus, metro, tram,
Partially/Fully agree
Hardly/Don't agree at all
Gender
Age
PT travel frequency
Geography
PT modes used
BEST 2007
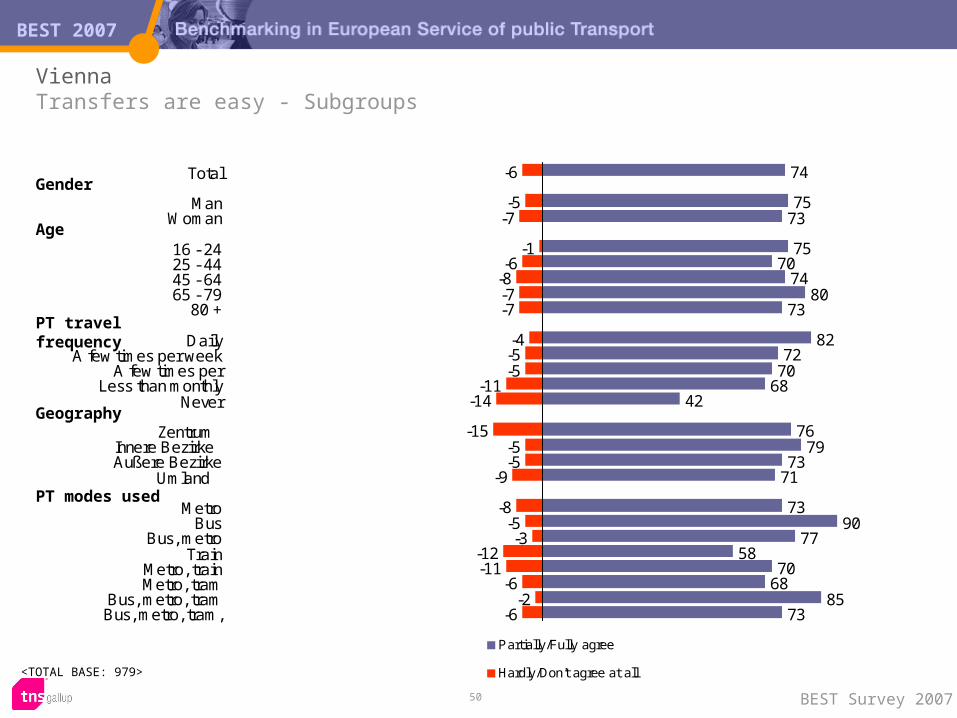
50 BEST Survey 2007
Vienna Transfers are easy - Subgroups
<TOTAL BASE: 979>
74
7573
7570
7480
73
8272
7068
42
7679
7371
7390
7758
7068
8573
-6
-5-7
-1-6
-8-7-7
-4-5-5
-11-14
-15-5-5
-9
-8-5-3
-12-11
-6-2
-6
Total
ManWoman
16 - 2425 - 4445 - 6465 - 79
80 +
DailyA few times per week
A few times perLess than monthly
Never
Zentrum Innere Bezirke Außere Bezirke
Umland
MetroBus
Bus, metroTrain
Metro, trainMetro, tram
Bus, metro, tramBus, metro, tram,
Partially/Fully agree
Hardly/Don't agree at all
Gender
Age
PT travel frequency
Geography
PT modes used
BEST 2007
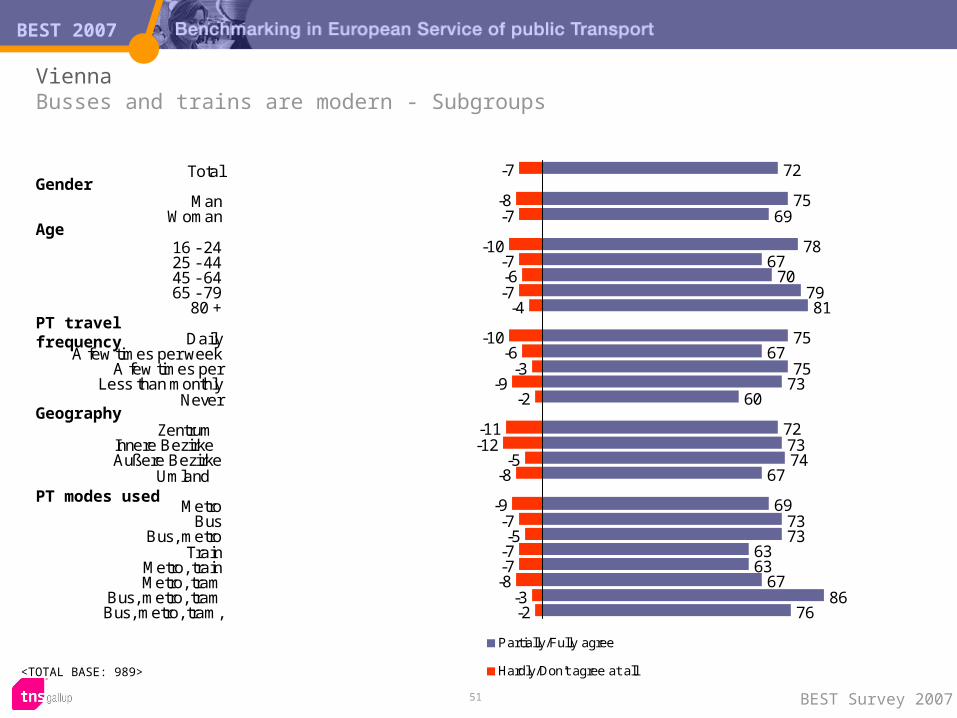
51 BEST Survey 2007
Vienna Busses and trains are modern - Subgroups
<TOTAL BASE: 989>
72
7569
7867
707981
7567
7573
60
727374
67
697373
6363
6786
76
-7
-8-7
-10-7-6-7
-4
-10-6
-3-9
-2
-11-12
-5-8
-9-7-5
-7-7-8
-3-2
Total
ManWoman
16 - 2425 - 4445 - 6465 - 79
80 +
DailyA few times per week
A few times perLess than monthly
Never
Zentrum Innere Bezirke Außere Bezirke
Umland
MetroBus
Bus, metroTrain
Metro, trainMetro, tram
Bus, metro, tramBus, metro, tram,
Partially/Fully agree
Hardly/Don't agree at all
Gender
Age
PT travel frequency
Geography
PT modes used
BEST 2007
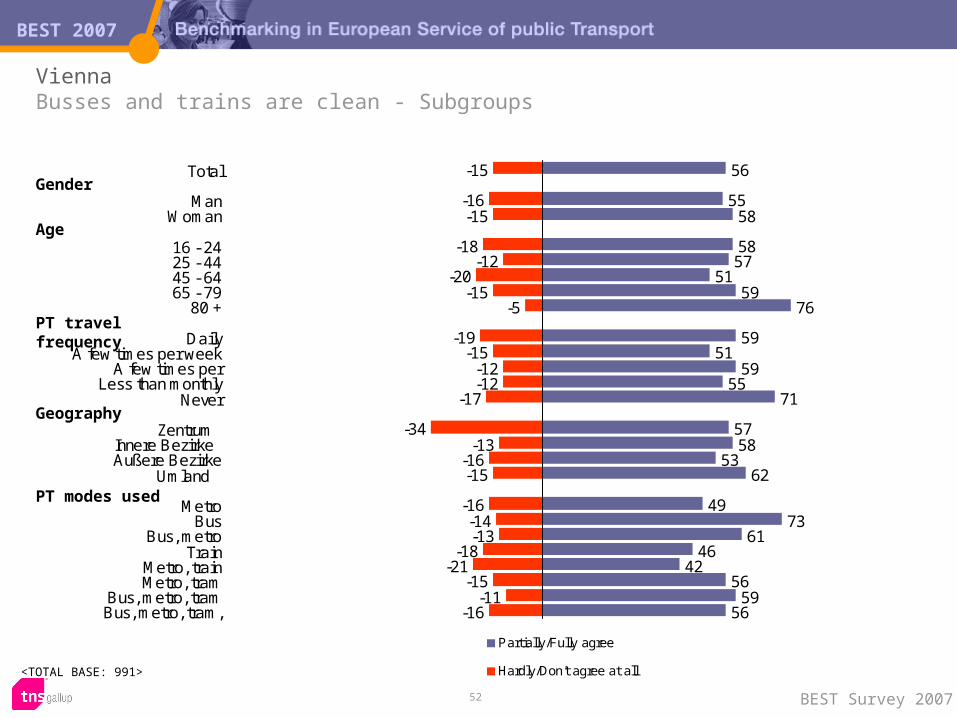
52 BEST Survey 2007
Vienna Busses and trains are clean - Subgroups
<TOTAL BASE: 991>
56
5558
5857
5159
76
5951
5955
71
5758
5362
4973
6146
4256
5956
-15
-16-15
-18-12
-20-15
-5
-19-15
-12-12
-17
-34-13
-16-15
-16-14-13
-18-21
-15-11
-16
Total
ManWoman
16 - 2425 - 4445 - 6465 - 79
80 +
DailyA few times per week
A few times perLess than monthly
Never
Zentrum Innere Bezirke Außere Bezirke
Umland
MetroBus
Bus, metroTrain
Metro, trainMetro, tram
Bus, metro, tramBus, metro, tram,
Partially/Fully agree
Hardly/Don't agree at all
Gender
Age
PT travel frequency
Geography
PT modes used
BEST 2007
53 BEST Survey 2007
Vienna I normally get a seat when travel with PT - Subgroups
<TOTAL BASE: 985>
68
6570
7162
6778
85
6668
7270
47
7464
6871
6387
6986
7757
7663
-10
-11-9
-6-14
-9-6-5
-10-9-9
-12-19
-17-10
-9-11
-9-4
-10-8
-12-16
-6-8
Total
ManWoman
16 - 2425 - 4445 - 6465 - 79
80 +
DailyA few times per week
A few times perLess than monthly
Never
Zentrum Innere Bezirke Außere Bezirke
Umland
MetroBus
Bus, metroTrain
Metro, trainMetro, tram
Bus, metro, tramBus, metro, tram,
Partially/Fully agree
Hardly/Don't agree at all
Gender
Age
PT travel frequency
Geography
PT modes used
Vienna 2007
Social image in subgroups
BEST 2007
55 BEST Survey 2007
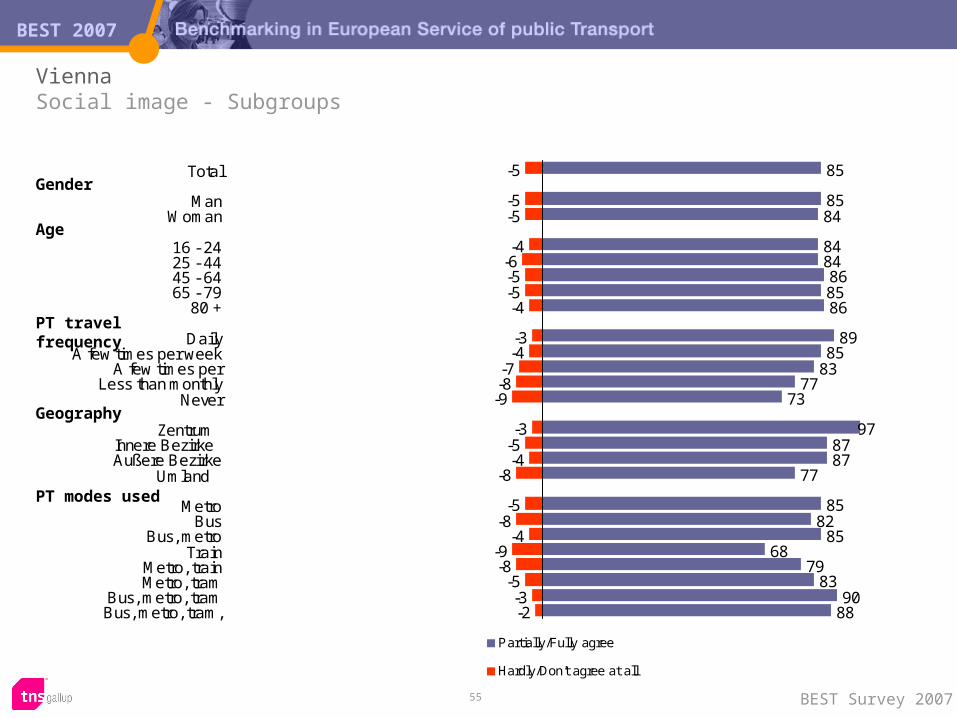
Vienna Social image - Subgroups
85
8584
8484868586
8985
8377
73
978787
77
8582
8568
7983
9088
-5
-5-5
-4-6-5-5-4
-3-4
-7-8-9
-3-5-4
-8
-5-8
-4-9-8
-5-3-2
Total
ManWoman
16 - 2425 - 4445 - 6465 - 79
80 +
DailyA few times per week
A few times perLess than monthly
Never
Zentrum Innere Bezirke Außere Bezirke
Umland
MetroBus
Bus, metroTrain
Metro, trainMetro, tram
Bus, metro, tramBus, metro, tram,
Partially/Fully agree
Hardly/Don't agree at all
Gender
Age
PT travel frequency
Geography
PT modes used
BEST 2007
56 BEST Survey 2007
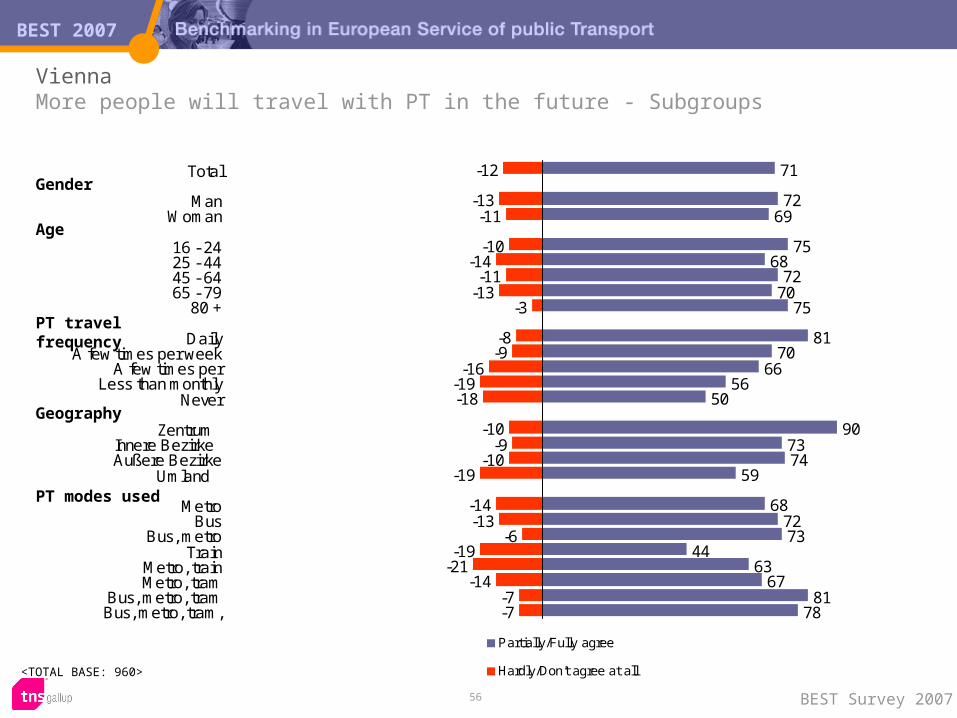
Vienna More people will travel with PT in the future - Subgroups
<TOTAL BASE: 960>
71
7269
7568
7270
75
8170
6656
50
907374
59
687273
4463
6781
78
-12
-13-11
-10-14
-11-13
-3
-8-9
-16-19-18
-10-9
-10-19
-14-13
-6-19
-21-14
-7-7
Total
ManWoman
16 - 2425 - 4445 - 6465 - 79
80 +
DailyA few times per week
A few times perLess than monthly
Never
Zentrum Innere Bezirke Außere Bezirke
Umland
MetroBus
Bus, metroTrain
Metro, trainMetro, tram
Bus, metro, tramBus, metro, tram,
Partially/Fully agree
Hardly/Don't agree at all
Gender
Age
PT travel frequency
Geography
PT modes used
BEST 2007
57 BEST Survey 2007
Vienna PT is good for the environment - Subgroups
<TOTAL BASE: 981>
90
9189
8987
9490
88
929089
8681
1009192
82
9285
8970
8289
9393
-3
-3-3
-2-4
-1-1
-9
-2-2-3-3
-8
-4-2
-4
-1-7-5-5-3-2-2
Total
ManWoman
16 - 2425 - 4445 - 6465 - 79
80 +
DailyA few times per week
A few times perLess than monthly
Never
Zentrum Innere Bezirke Außere Bezirke
Umland
MetroBus
Bus, metroTrain
Metro, trainMetro, tram
Bus, metro, tramBus, metro, tram,
Partially/Fully agree
Hardly/Don't agree at all
Gender
Age
PT travel frequency
Geography
PT modes used
BEST 2007
58 BEST Survey 2007
Vienna PT is beneficial to society - Subgroups
<TOTAL BASE: 991>
93
9393
8795
919495
939594
8987
10097
9290
9588
9287
9391
9794
-1
-1-1
-1-1-1-2
-1-3
-1
-2
-2-4
-2
-1
Total
ManWoman
16 - 2425 - 4445 - 6465 - 79
80 +
DailyA few times per week
A few times perLess than monthly
Never
Zentrum Innere Bezirke Außere Bezirke
Umland
MetroBus
Bus, metroTrain
Metro, trainMetro, tram
Bus, metro, tramBus, metro, tram,
Partially/Fully agree
Hardly/Don't agree at all
Gender
Age
PT travel frequency
Geography
PT modes used

Vienna 2007
Value for money in subgroups
BEST 2007
60 BEST Survey 2007
Vienna Value for money - Subgroups
53
5651
6446
5065
75
6357
443938
5955
5839
4661
5944
3647
6254
-23
-21-26
-18-27-27
-15-12
-19-19
-30-33-32
-31-25
-18-35
-26-18-19
-42-31
-27-17
-19
Total
ManWoman
16 - 2425 - 4445 - 6465 - 79
80 +
DailyA few times per week
A few times perLess than monthly
Never
Zentrum Innere Bezirke Außere Bezirke
Umland
MetroBus
Bus, metroTrain
Metro, trainMetro, tram
Bus, metro, tramBus, metro, tram,
Partially/Fully agree
Hardly/Don't agree at all
Gender
Age
PT travel frequency
Geography
PT modes used
BEST 2007
61 BEST Survey 2007
Vienna PT gives good value for money - Subgroups
<TOTAL BASE: 974>
56
5855
6949
5265
75
6860
463938
616161
41
506162
5040
5164
57
-21
-19-22
-12-24-25
-14-13
-16-17
-27-30
-32
-28-22
-16-33
-23-16
-19-37
-29-24
-15-18
Total
ManWoman
16 - 2425 - 4445 - 6465 - 79
80 +
DailyA few times per week
A few times perLess than monthly
Never
Zentrum Innere Bezirke Außere Bezirke
Umland
MetroBus
Bus, metroTrain
Metro, trainMetro, tram
Bus, metro, tramBus, metro, tram,
Partially/Fully agree
Hardly/Don't agree at all
Gender
Age
PT travel frequency
Geography
PT modes used
BEST 2007
62 BEST Survey 2007
Vienna PT fares are reasonable - Subgroups
<TOTAL BASE: 975>
50
5447
5842
4865
75
5855
4139
37
5649
5637
4361
5538
3342
6151
-25
-22-29
-24-29-28
-15-11
-21-20
-32-36
-31
-33-27
-20-38
-29-20-18
-46-33
-30-19-20
Total
ManWoman
16 - 2425 - 4445 - 6465 - 79
80 +
DailyA few times per week
A few times perLess than monthly
Never
Zentrum Innere Bezirke Außere Bezirke
Umland
MetroBus
Bus, metroTrain
Metro, trainMetro, tram
Bus, metro, tramBus, metro, tram,
Partially/Fully agree
Hardly/Don't agree at all
Gender
Age
PT travel frequency
Geography
PT modes used
Vienna 2007
Loyalty in subgroups
BEST 2007
64 BEST Survey 2007
Vienna Loyalty - Subgroups
81
8081
8275
8291
88
8887
7467
45
10086
8372
788587
5789
7889
85
-5
-4-5
-4-8
-3-1
-3
-2-4
-6-9
-10
-4-4
-7
-5-4-4
-7-4-4-3-3
Total
ManWoman
16 - 2425 - 4445 - 6465 - 79
80 +
DailyA few times per week
A few times perLess than monthly
Never
Zentrum Innere Bezirke Außere Bezirke
Umland
MetroBus
Bus, metroTrain
Metro, trainMetro, tram
Bus, metro, tramBus, metro, tram,
Partially/Fully agree
Hardly/Don't agree at all
Gender
Age
PT travel frequency
Geography
PT modes used
Vienna 2007
Background information in subgroups
BEST 2007
66 BEST Survey 2007
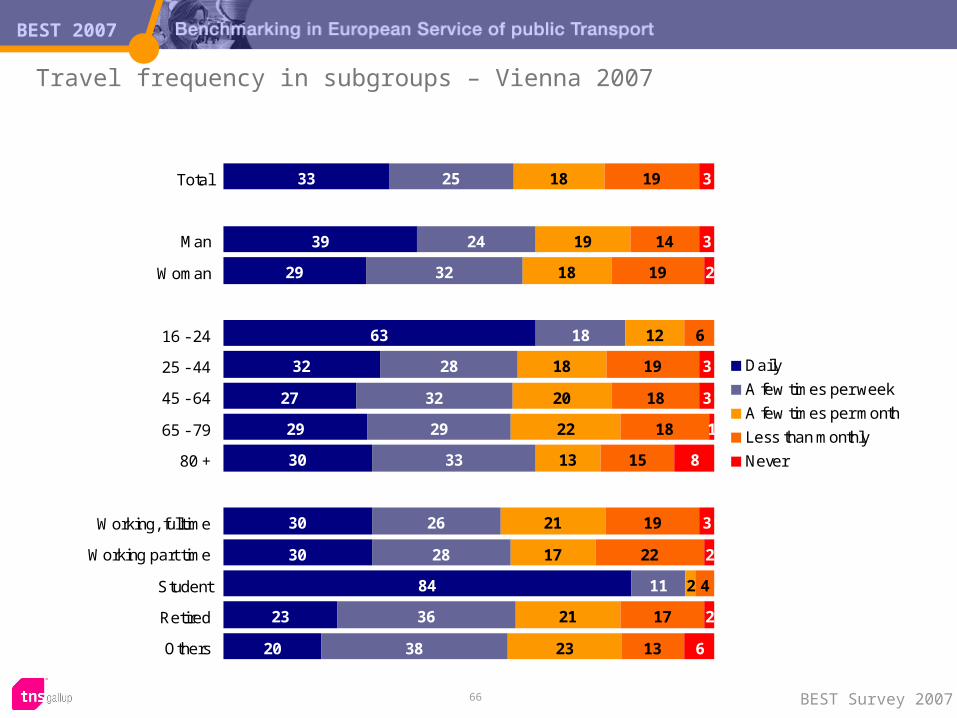
Travel frequency in subgroups – Vienna 2007
33
39
29
63
32
27
29
30
30
30
84
23
20
25
24
32
18
28
32
29
33
26
28
11
36
38
18
19
18
12
18
20
22
13
21
17
2
21
23
19
14
19
6
19
18
18
15
19
22
4
17
13
3
3
2
3
3
1
8
3
2
2
6
Total
Man
Woman
16 - 24
25 - 44
45 - 64
65 - 79
80 +
Working, fulltime
Working part time
Student
Retired
Others
Daily
A few times per week
A few times per month
Less than monthly
Never
BEST 2007
67 BEST Survey 2007
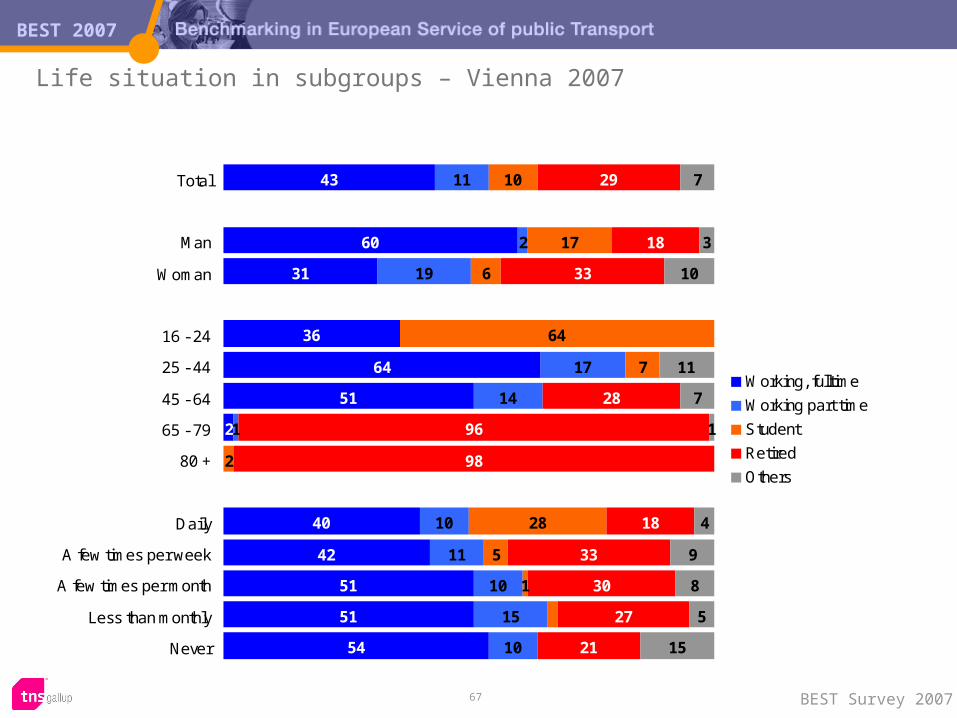
Life situation in subgroups – Vienna 2007
43
60
31
36
64
51
2
40
42
51
51
54
11
2
19
17
14
1
10
11
10
15
10
10
17
6
64
7
2
28
5
1
29
18
33
28
96
98
18
33
30
27
21
7
3
10
11
7
1
4
9
8
5
15
Total
Man
Woman
16 - 24
25 - 44
45 - 64
65 - 79
80 +
Daily
A few times per week
A few times per month
Less than monthly
Never
Working, fulltime
Working part time
Student
Retired
Others
Results 2007 – other available reports
at best2005.net