Bellin Health Lessons from a Successful Medicare Pioneer ACO · 1 Bellin Health Lessons from a...
22
1 Bellin Health Lessons from a Successful Medicare Pioneer ACO March 31, 2016 2 Table of Contents I. We Are Doing Some Good Things – Rating Agency Actions II. Who We Are – Bellin Health’s Platform Organizational Structure Market and Scorecard Measures II. Lessons From A Top Performing Medicare Pioneer ACO
Transcript of Bellin Health Lessons from a Successful Medicare Pioneer ACO · 1 Bellin Health Lessons from a...

1
Bellin HealthLessons from a Successful Medicare Pioneer ACO
March 31, 2016
2
Table of Contents
I. We Are Doing Some Good Things – Rating Agency Actions
II. Who We Are – Bellin Health’s Platform
Organizational Structure
Market and Scorecard Measures
II. Lessons From A Top Performing Medicare Pioneer ACO

2
3
Strategic Initiatives
We Are Doing Some Good Things –Bellin Health’s Ratings Actions
Continued Very Strong Financial Performance• Operating performance measures continue to strengthen in 2014
• Results are ahead of budget for first fiscal quarter of fiscal 2015.
• Liquidity has also improved due to positive performance and capital structure and debt service ratios are
very strong.
4

3
5
Bellin Started at BBB+6/04
Bellin Upgraded
to A‐6/06
Bellin Upgraded
to A10/10
Bellin Affirmed A
4/14
Bellin Upgraded to A+3/15
Data as of Dec. 31, 2014.
© Standard & Poor’s 2015.
6
Initial Rating Assigned
BBB+ Stable 9/01
RatingAffirmed
8/05
BellinUpgraded
to A34/06
RatingAffirmed
11/03
RatingAffirmed
10/08
OutlookRevisedto A3
Positive6/10
BellinUpgraded
to A212/11
Affirmed
A2Rating3/13
Affirmed
A2Rating6/14
Affirmed
A2Rating3/15
Source: Moody’s
4
7
Strategic Initiatives
Who We Are –Bellin Health’s Platform
8

5
Our Corporate Structure
9
Bellin Health Systems, Inc.501(c)(3)
Lake Michigan Health Care Services, Inc.
501(c)(3)
Bel-Regional Home Medical, Inc..
Taxable
D1 Sports Training of Green Bay, LLC
Taxable
Bellin College, Inc.
501(c)(3)
Bellin Foundation, Inc.
501(c)(3)
Bellin Psychiatric Center, Inc.
501(c)(3)
Bellin Memorial Hospital, Inc.
501(c)(3)
Oconto Hospital and Medical Center, Inc.
501(c)(3)
Bellin-ThedaCare Healthcare Partners,
Inc. Taxable
Unity Limited Partnership
501(c)(3)
Bellin Orthopedic Surgery Center, LLC
Taxable
NorthReach Healthcare, LLC
501(c)(3)
Bellin Health Partners, Ltd.
Taxable
AboutHealth, LLC
Taxable
Obligated Group Member
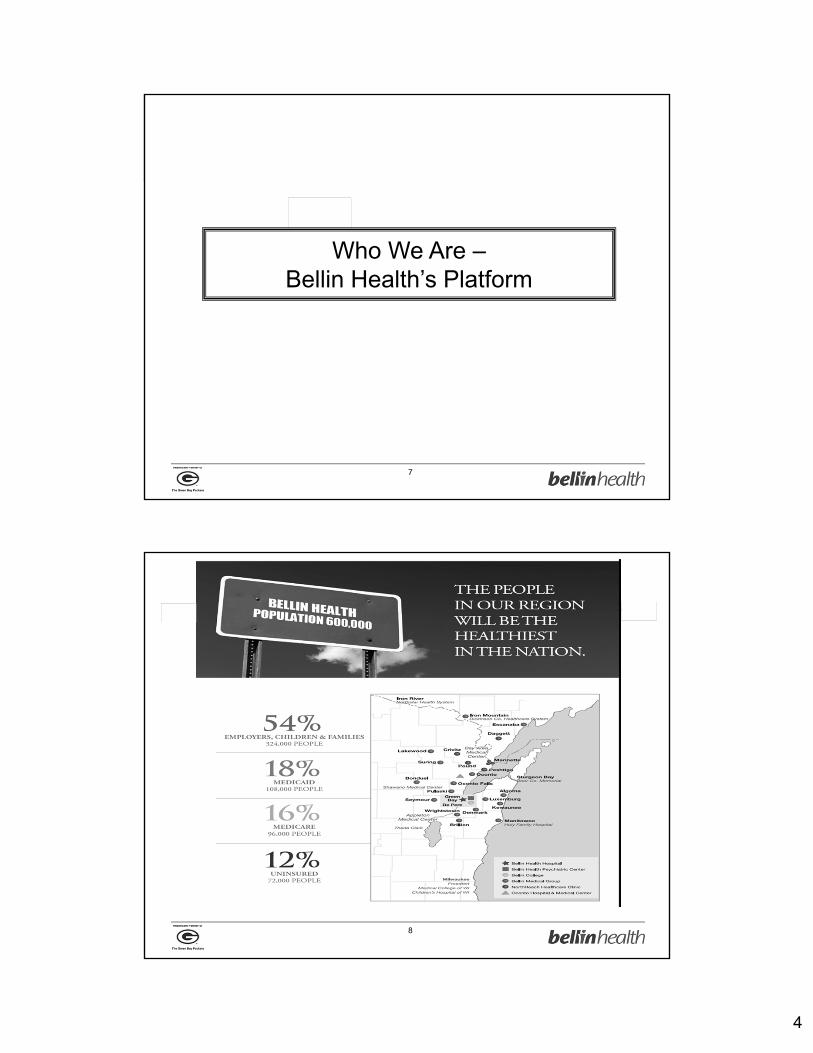
Who We Are
10
Bellin Health provides quality healthcare to the residents of a 12-county area covering northeastern Wisconsin and the Upper Peninsula of Michigan. Strong and long-standing relationships with physicians
73% of our revenue is derived from outpatient services
BELLIN MEMORIAL HOSPITAL 71-bed acute care multi-specialty hospital; known as
the region’s heart center, it was the first hospital in the area to offer a comprehensive heart program
BELLIN HEALTH OCONTO HOSPITAL 10-bed critical access hospital
BELLIN PSYCHIATRIC CENTER 65-bed freestanding hospital; the Center’s team of
professionals treats children, adolescents, and adults with emotional and/or addictive disorders
BELLIN MEDICAL GROUP Employs 151 physicians in 38 locations Continued increases in visits
NORTHREACH HEALTHCARE 14 physicians and 14 midlevel providers
BELLIN HEALTH FOUNDATION $5.2 million in assets as of September 30, 2015 for
the benefit of the organization
BELLIN COLLEGE Offers a four-year degree for students pursuing a Bachelor of
Science in Nursing, Master of Science in Nursing, and a Bachelor of Science in Radiologic Technology
Medical College of Wisconsin now on Bellin College Campus
ABOUTHEALTH Statewide network involving six other healthcare organizations:
Aspirus, Aurora Health Care, Gundersen Health System, Marshfield Clinic, ProHealth Care, ThedaCare, and University of Wisconsin Hospital & Clinics developed to build upon and advance the clinical quality, efficiency, and customer appreciation
BELLIN-THEDACARE HEALTHCARE PARTNERS Pioneer Accountable Care Organization (“ACO”) Model
comprised of the Hospital, ThedaCare, and approximately 700 independent and employed physicians, providing services throughout Northeastern Wisconsin and the Upper Peninsula of Michigan
BELLIN HEALTH PARTNERS Locally, clinically integrated network Participating in Next Generation Medical ACO

6
Our Scorecards Follow and Measure Our Strategies
• Bellin has a System Scorecard that is
driven by individual Brand Scorecards to
define and measure progress toward
achieving our Strategies.
• Focus of measures involves primary care
growth, physician and staff engagement,
improving the health of the population,
including clinical quality which impacts
financial performance and financial
measures.
• The System Scorecard drills down to the
department level to show clear
accountability.
11
12
Utilization Data

7
13
Strategic Initiatives
Lessons from a Top Performing Medicare ACO in the Country
14
SYSTEM RESOURCES
• 715 Physicians
• 57 Primary Care Locations
• 3 Tertiary Hospitals
• 4 Critical Access Hospitals
• 1 Psychiatric Hospital with full-service Behavioral Health Clinic
• Hospice & Palliative Care Services
• Skilled Nursing Facilities (1 system-owned)
POPULATION SEGMENTS
• Employees, Children & Families 540,000 people
• Medicare160,000 people
• Medicaid 180,000 people
• Uninsured 120,000 people
• Total Population 1,000,000 people
Bellin-ThedaCare Healthcare Partners

8
15
Bellin Health-ThedaCare Relationship Characteristics
• Contiguous markets with similar demographics and economic base
• Early adopters of process improvement theory
• Similar governance
• Common competitors
• Operated a joint venture, provider-based health plan for 10 years (1995-2005)
• Share an enterprise-wide medical record based on Epic software
• In 2006 - established a clinically integrated delivery system, know today as Bellin-ThedaCare Healthcare Partners
BTHP
2 Hospital Systems740 Physicians1.2 Million Population20k Pioneer Pts.
Pioneer
16

9
Pioneer Recap
17
Attribution• 20,000 Medicare fee-for-service beneficiaries• Primarily PCP attribution
Financial Accountability• Medicare Parts A&B (not Part D)• ALL claim files for our population• Baseline expenditure vs. National Baseline expenditure
Quality Accountability• 33 quality metrics• National comparison
Bellin-ThedaCare Pioneer ACO
18
10
Generate savings/lossesCMS
BTHP
Quality Score
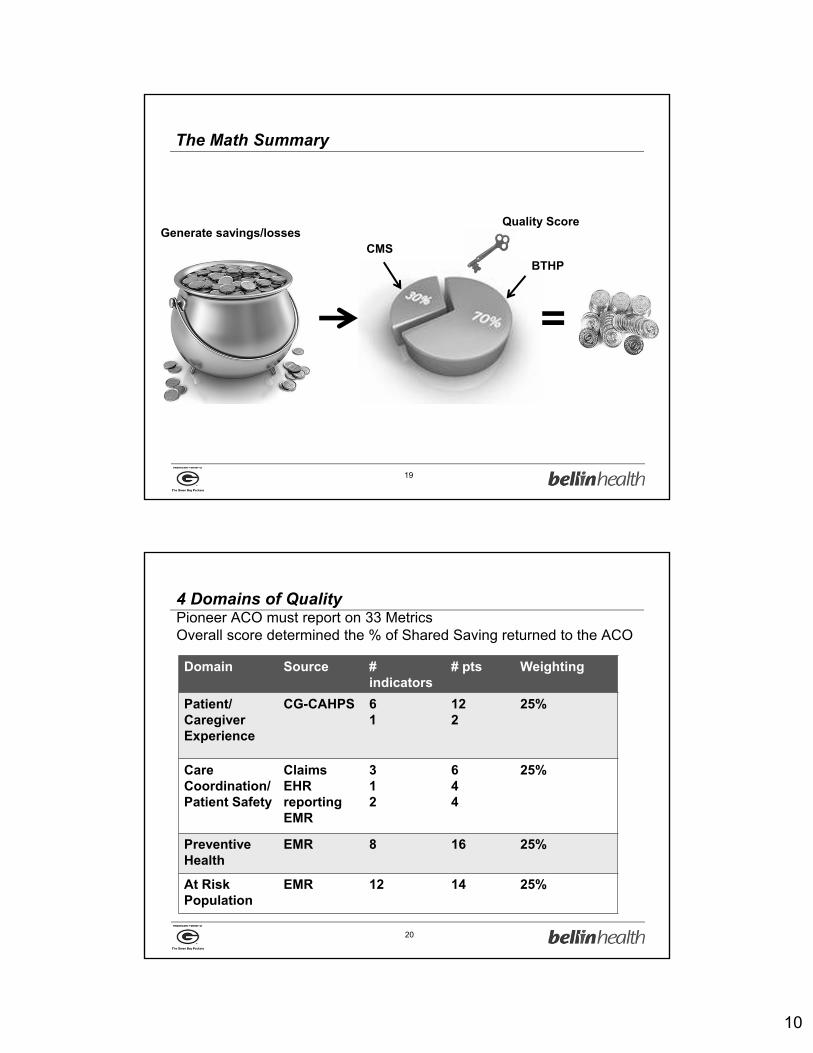
The Math Summary
19
4 Domains of QualityPioneer ACO must report on 33 MetricsOverall score determined the % of Shared Saving returned to the ACO
20
Domain Source # indicators
# pts Weighting
Patient/Caregiver Experience
CG-CAHPS 61
122
25%
Care Coordination/Patient Safety
ClaimsEHRreportingEMR
312
644
25%
Preventive Health
EMR 8 16 25%
At Risk Population
EMR 12 14 25%
11
$7,500
$8,000
$8,500
$9,000
$9,500
$10,000
$10,500
$11,000
$11,500
Baseline Year 1 Year 2
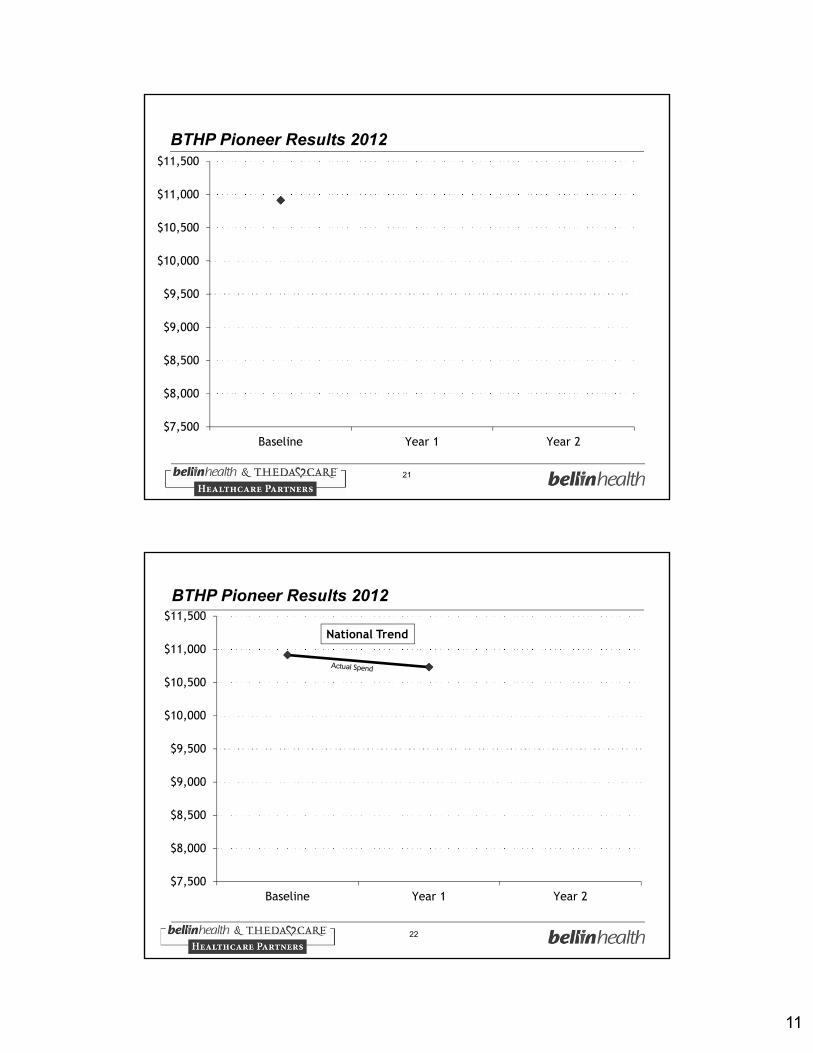
BTHP Pioneer Results 2012
21
$7,500
$8,000
$8,500
$9,000
$9,500
$10,000
$10,500
$11,000
$11,500
Baseline Year 1 Year 2
BTHP Pioneer Results 2012
National Trend
22

12
$7,500
$8,000
$8,500
$9,000
$9,500
$10,000
$10,500
$11,000
$11,500
Baseline Year 1 Year 2
BTHP Pioneer Results 2012
National Trend
BTHP
23
$7,500
$8,000
$8,500
$9,000
$9,500
$10,000
$10,500
$11,000
$11,500
Baseline Year 1 Year 2
Expected Target
BTHP Pioneer Results 2012
National Trend
BTHP
24

13
$7,500
$8,000
$8,500
$9,000
$9,500
$10,000
$10,500
$11,000
$11,500
Baseline Year 1 Year 2
Expected Target
BTHP Pioneer Results 2012
National Trend
BTHP
25
$7,500
$8,000
$8,500
$9,000
$9,500
$10,000
$10,500
$11,000
$11,500
Baseline Year 1 Year 2
Expected Target
BTHP Pioneer Results 2012
National Trend
BTHP
Savings: $389 per bene
Savings
26
14
$7,500
$8,000
$8,500
$9,000
$9,500
$10,000
$10,500
$11,000
$11,500
Baseline Year 1 Year 2
Expected Target
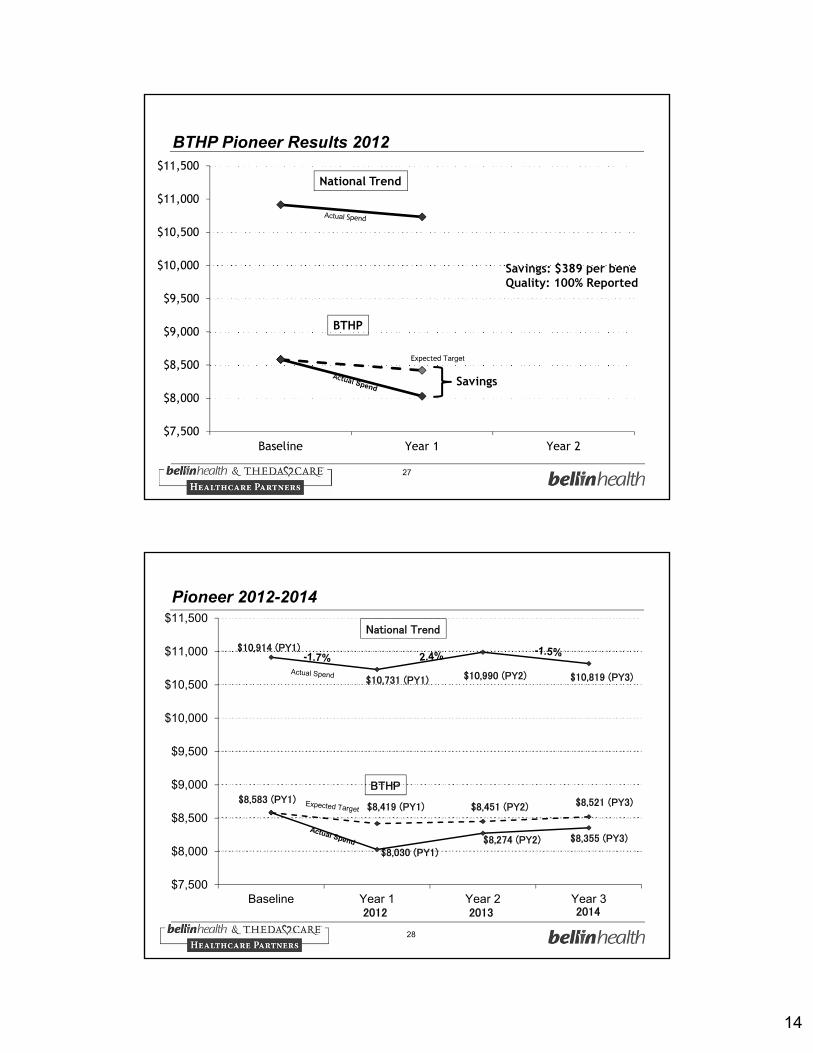
BTHP Pioneer Results 2012
National Trend
BTHP
Savings: $389 per beneQuality: 100% Reported
Savings
27
$7,500
$8,000
$8,500
$9,000
$9,500
$10,000
$10,500
$11,000
$11,500
Baseline Year 1 Year 2 Year 3
Pioneer 2012-2014
National Trend
$10,914 (PY1)
$10,731 (PY1) $10,990 (PY2)
$8,419 (PY1)$8,583 (PY1)
$8,030 (PY1)
$8,451 (PY2)
$8,274 (PY2)
BTHP
20132012
$10,819 (PY3)
$8,355 (PY3)
$8,521 (PY3)
2014
28
15
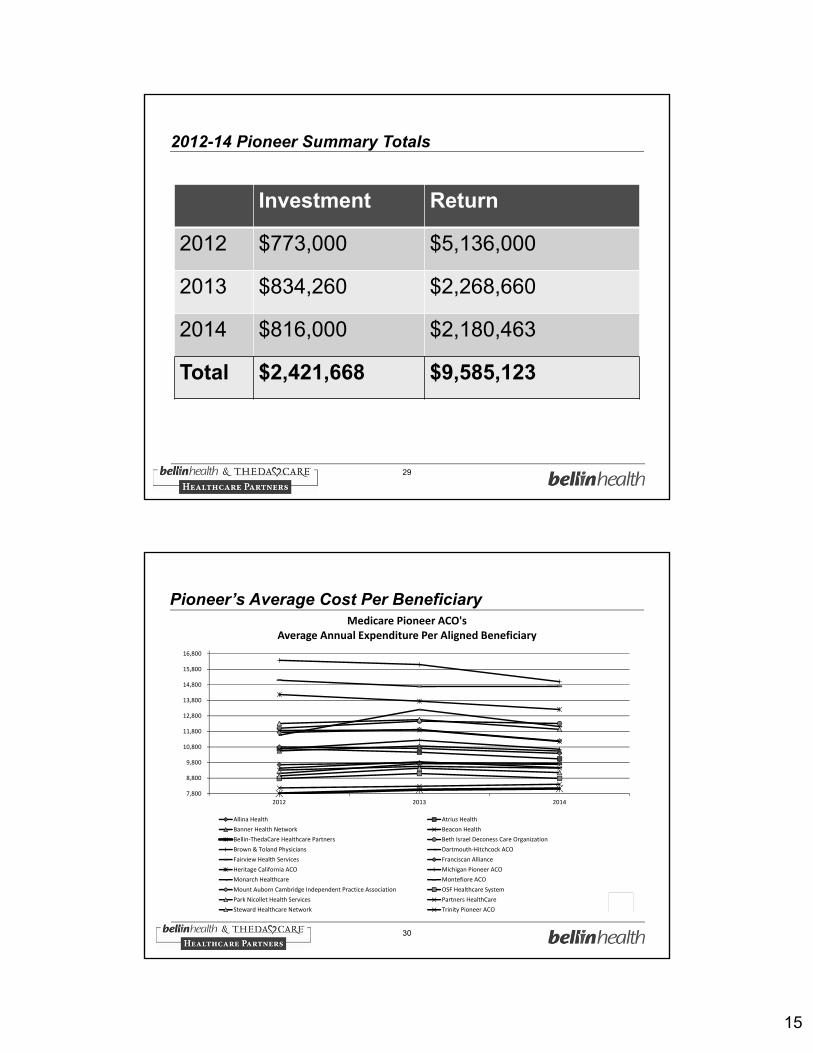
2012-14 Pioneer Summary Totals
Investment Return
2012 $773,000 $5,136,000
2013 $834,260 $2,268,660
2014 $816,000 $2,180,463
Total $2,421,668 $9,585,123
29
Pioneer’s Average Cost Per Beneficiary
7,800
8,800
9,800
10,800
11,800
12,800
13,800
14,800
15,800
16,800
2012 2013 2014
Medicare Pioneer ACO'sAverage Annual Expenditure Per Aligned Beneficiary
Allina Health Atrius Health
Banner Health Network Beacon Health
Bellin‐ThedaCare Healthcare Partners Beth Israel Deconess Care Organization
Brown & Toland Physicians Dartmouth‐Hitchcock ACO
Fairview Health Services Franciscan Alliance
Heritage California ACO Michigan Pioneer ACO
Monarch Healthcare Montefiore ACO
Mount Auborn Cambridge Independent Practice Association OSF Healthcare System
Park Nicollet Health Services Partners HealthCare
Steward Healthcare Network Trinity Pioneer ACO
30

16
Pioneer’s Quality Results
68.00%
70.00%
72.00%
74.00%
76.00%
78.00%
80.00%
82.00%
84.00%
86.00%
88.00%
90.00%
92.00%
94.00%
96.00%
2013 2014
Medicare Pioneer ACO's Overall Quality Score
Allina Health Atrius Health
Banner Health Network Beacon Health
Bellin‐ThedaCare Healthcare Partners Beth Israel Deconess Care Organization
Brown & Toland Physicians Dartmouth‐Hitchcock ACO
Fairview Health Services Franciscan Alliance
Heritage California ACO Michigan Pioneer ACO
Monarch Healthcare Montefiore ACO
Mount Auborn Cambridge Independent Practice Association OSF Healthcare System
Park Nicollet Health Services Partners HealthCare
Steward Healthcare Network Trinity Pioneer ACO
31
32
Pioneer Quality Results
17
33
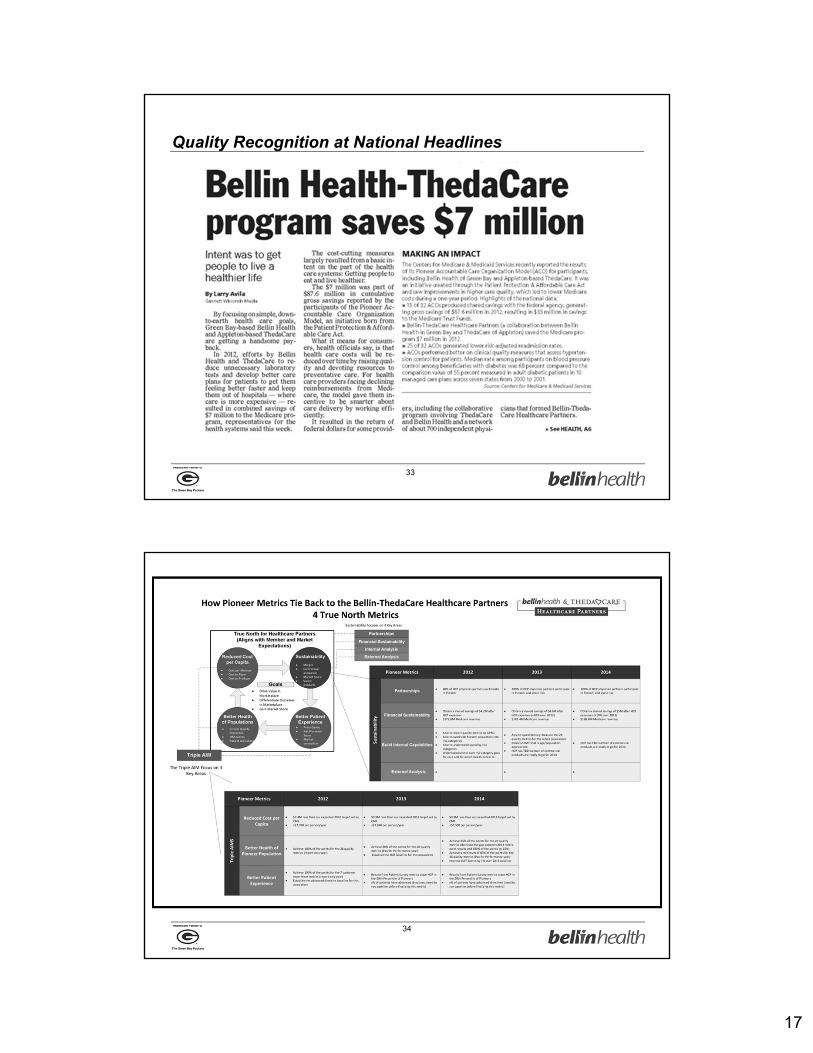
Quality Recognition at National Headlines
34

18
35
Pioneer – Defining Which Projects to Target by Creating a Driver Diagram
36

19
Pioneer – Defining Which Projects to Target by Creating a Driver Diagram (closer look)
37
Defined criteria to subdivide the Pioneer population
• Broke Pioneer population into 4 subsets based on spend and chronic diseases
Purpose
• To identify how the subsets varied from one another
• To identify how to best manage the health and experience for each subset
• To identify the largest areas for opportunity to make improvements for the population
Pioneer – Examining a Subset of the Pioneer Population
38

20
Pioneer Strategy
Strategy#1:PrimaryCareStrategy100% of our Pioneer population
1. Leverage our existing and Primary Care system
2. Medicare Annual Wellness visit
3. Pioneer metrics
4. Patients with chronic conditions are well managed and in control
Strategy#2:SuperUserStrategy3% who spend 30% of the costs
1. Predictive modeling
2. Identify barriers (physical, psychosocial, cultural)
3. Care coordination
39
1) Continuation of trend2) Rigorous systems of improvement3) New initiatives spurred by financial
construct4) Leveraged primary care and common EMR5) Spread Risk6) Hearts and Minds
Pioneer Success Factors
40
21
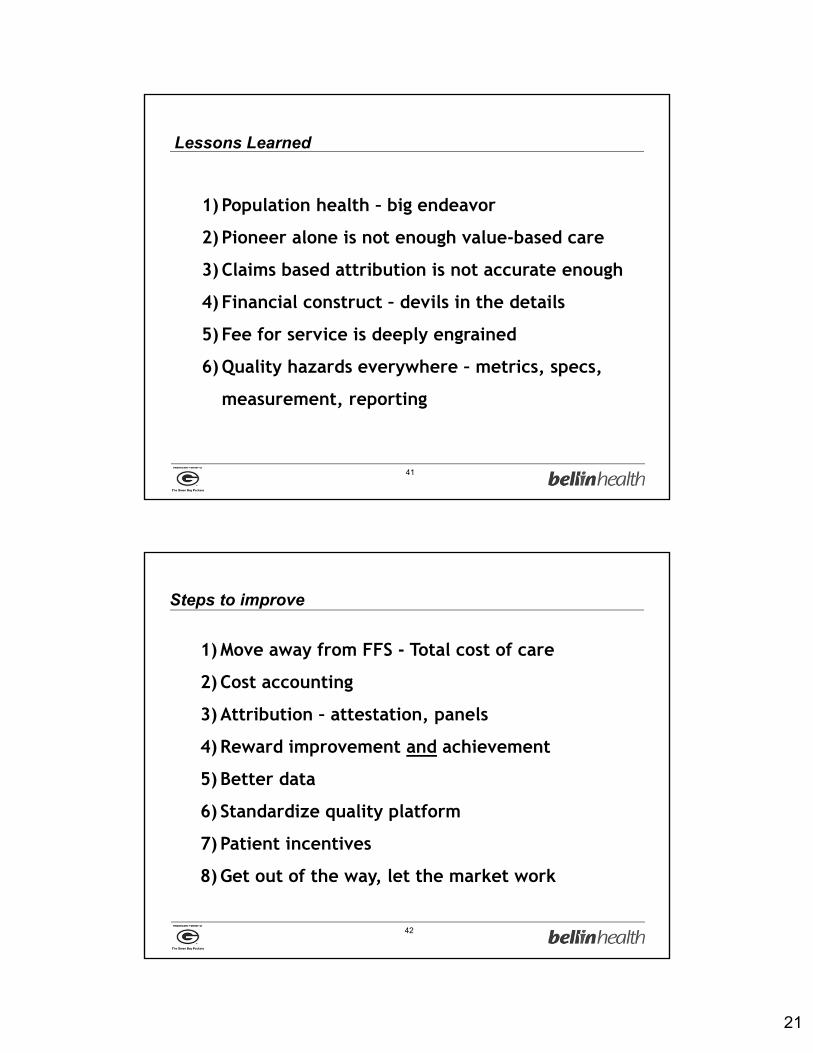
Lessons Learned
1) Population health – big endeavor
2) Pioneer alone is not enough value-based care
3) Claims based attribution is not accurate enough
4) Financial construct – devils in the details
5) Fee for service is deeply engrained
6) Quality hazards everywhere – metrics, specs,
measurement, reporting
41
Steps to improve
1) Move away from FFS - Total cost of care
2) Cost accounting
3) Attribution – attestation, panels
4) Reward improvement and achievement
5) Better data
6) Standardize quality platform
7) Patient incentives
8) Get out of the way, let the market work
42

22
Manage Populations to Achieve the Triple Aim– Driver Diagram
43
Future Direction
1) >50% revenue in value based contracts
2) Participating in CMMI Next Generation ACO
3) Payment to front line aligned with goals
4) Data to the point of care
5) Redesign of care systems around the patient
6) Shared responsibility – patient, provider,
payer
7) Partnership across community
44