Beata Javorcik and Naotaka Sawada - University of Oxford
27
1 The ISO 9000 Certification: Little Pain, Big Gain? Beata Javorcik and Naotaka Sawada forthcoming in the European Economic Review Abstract This paper examines the effect of obtaining an ISO 9000 certification on various aspects of business performance using firm-level panel data from Slovenia covering the period 1987-2006. To control for the possible endogeneity of obtaining the certification propensity score matching is combined with a difference-in-differences approach. The results indicate that an ISO 9000 certification boost the certified firm’s sales, exports and employment. It also has a positive effect on profits, profitability ratio, labor productivity and wages, though these effects appear with a delay and the latter two are less robust. Keywords: ISO 9000, management, firm performance JEL classification: M10, M31, F16, J31, O52 1. Introduction Until recently the quality of management practices has not received much attention in the economics profession. Yet, management matters. Management heterogeneity can explain a significant amount of variation in investment, financial, and organizational practices of firms (Bertrand and Schoar 2003). Measures of managerial practice are strongly associated with firm-level productivity, profitability, Tobin’s Q, and survival rates. Management practices also display significant cross-country differences University of Oxford and CEPR, Department of Economics, Manor Road Building, Manor Road, Oxford OX1 3UQ, United Kingdom. Email: [email protected]. Retired. No affiliation. .
Transcript of Beata Javorcik and Naotaka Sawada - University of Oxford
1
The ISO 9000 Certification: Little Pain, Big Gain?
Beata Javorcik and Naotaka Sawada
forthcoming in the European Economic Review
Abstract
This paper examines the effect of obtaining an ISO 9000 certification on various aspects
of business performance using firm-level panel data from Slovenia covering the period
1987-2006. To control for the possible endogeneity of obtaining the certification
propensity score matching is combined with a difference-in-differences approach. The
results indicate that an ISO 9000 certification boost the certified firm’s sales, exports and
employment. It also has a positive effect on profits, profitability ratio, labor productivity
and wages, though these effects appear with a delay and the latter two are less robust.
Keywords: ISO 9000, management, firm performance
JEL classification: M10, M31, F16, J31, O52
1. Introduction
Until recently the quality of management practices has not received much attention in the economics
profession. Yet, management matters. Management heterogeneity can explain a significant amount of
variation in investment, financial, and organizational practices of firms (Bertrand and Schoar 2003).
Measures of managerial practice are strongly associated with firm-level productivity, profitability,
Tobin’s Q, and survival rates. Management practices also display significant cross-country differences
University of Oxford and CEPR, Department of Economics, Manor Road Building, Manor Road, Oxford OX1 3UQ, United Kingdom.
Email: [email protected]. Retired. No affiliation. .
2
and significant within-country differences (Bloom and Van Reenen 2007; 2010). Improvements in
management practices translate into better performance within months (Bloom et al. 2013).
Given that better management leads to better firm-level outcomes, how can firms improve their
management practices? This study argues that obtaining an ISO certification offers a route to better
management. It is also likely to reduce information asymmetries between business partners. We
investigate this issue in the context of Slovenia, which due to its socialist legacy found itself lagging in
term of management practices at the beginning of its transition process (Svejnar 2002). Slovenia has
made tremendous progress in reforming its economy and in March 2004 became the first transition
country to graduate from a borrower status to a donor partner at the World Bank. If ISO certifications
really lead to better outcomes, the effect should be more pronounced in Slovenia than in industrialized
countries.
The International Organization for Standardization (ISO) 9000 series of quality management system
has seen a spectacular increase in its popularity during the past two decades. The number of certifications
increased more than 20 fold from 46,571 in 1993 to 1,109,905 as of the end of 2010 (ISO 2011). The
certification process aims to improve performance of certified firms by helping their managers follow
eight principles: customer focus, leadership, involvement of people, process approach, system approach
to management, continual improvement, factual approach to decision making, and mutual beneficial
supplier relationships.1 Surveys of certified firms suggest that expected boosts to profits, process
improvements and marketing benefits are the key drivers behind certification applications (Buttle 1997).
There exists a large body of anecdotal, survey and econometric results suggesting that certified firms
1 See the ISO home page, quality management practices, http://www.iso.org/iso/qmp, and the standards, ISO 9000:2005 and
ISO 9004: 2000.
The purpose of the ISO 9000 quality standards is to ensure consistent quality of production rather than production of high
quality products (see Arora and Asundi 1999). Its philosophy can be described as “document what you do, do what you
document, and verify that you are doing it” (unnamed manager quoted in Cole 1999: 156).
3
perform better, but the existing evidence cannot prove causality in a convincing way across a range of
sectors.2
To assess the effect of ISO certification on firm performance, our analysis combines propensity score
matching with a difference-and-differences approach. Matching is done within industry-year cells. We
use information on 38,495 Slovenian firms, 668 of which obtained an ISO certification during the period
covered by our data. Of these, 234 firms are observed at least a year prior to as well as four years after
the certification thus lending themselves to our empirical exercise. The analysis indicates that better
performers (larger and more profitable firms as well as exporters) are more likely to obtain an ISO
certification. More interestingly, our results are consistent with ISO 9000 certifications leading to an
improved firm performance in terms of sales, exports, labor productivity and profits. While the effects
on the former variables materialize very quickly, the boost to labor productivity and profits seems to take
place with a delay. We also find that certified firms experience greater employment and real wage
increases relative to the control group, though the wage effect is less robust.
The results of our analysis suggest that the quality of management practices matters. The view, while
obvious to business practitioners, until recently has received little support in the economics profession.
Our results further suggest that international certification standards are an effective mechanism for
transferring best management practices to emerging markets and developing countries which for various
reasons may lag in this area.
2 In an unpublished study, Arora and Asundi (1999) focus on 95 Indian software firms and conclude that an ISO
certification serves as a signal to potential customers and leads to a modest increase in employment growth. The authors
instrument for the endogeneity of the decision to obtain a certification using a dummy for firms established prior to 1992
and a dummy for publicly traded firms. Corbett et al. (2005) apply the event study approach to the data on ISO 9000
certified US manufacturing firms observed between 1987 and 1997 to analyze the impact of the certifications on financial
performance. They find that three years after certification the certified firms display better performance in terms of the
return on assets and that better performing firms are more likely to get certified. Terlaak and King (2006) show that ISO
certified firms in the US grow faster after obtaining a certification. The authors do not explicitly address the endogeneity
problem, though in a robustness check they show that adjusting for the average growth rate in the same industry does not
affect the results.
4
This paper is structured as follows: The next section provides a brief overview of the ISO 9000
certification. Section 3 describes the data used and presents some exploratory results. The main empirical
analysis on the impact of ISO certification on various performance indicators is contained in Section 4.
Conclusions are presented in the last section.
2. Overview of ISO 9000 certifications
Formalized quality assurance originated in response to the needs of the defense industry for standards
but later spread beyond the military giving rise to various national standards. In 1987, the British
government persuaded the International Organization for Standardization (ISO) to adapt British
Standards (BS) 5760 as an international standard. BS 5760 was developed as a management standard
that specified how the manufacturing process was to be conducted, rather than what to manufacture. The
ISO 9000 standard was revised 1994 to emphasize quality assurance through preventive actions, instead
of checking just the final product, reflecting Japanese approach of total quality management. The 2000
revision of the standard (ISO 9001) placed greater emphasis on management system effectiveness
through process performance measures. It also made explicit expectations of continual process
improvement and tracking customer satisfaction. A minor amendment to the standard was made in 2008.
The key ideas behind the ISO 9001 standard involve having a formal quality policy, closely linked
to the business and marketing plan and customer needs. Employees at all levels are expected to
understand and follow the quality policy and to work towards measurable objectives. Decisions about
the quality system are based on recorded data. The quality system is regularly audited and evaluated for
compliance and effectiveness. Records of how and where raw materials and products are processed are
kept to allow products and problems to be traced to the source. There are formalized systems for
communicating with customers about product information, inquiries, contracts, orders, feedback and
complaints. When new products are being developed, plans for all stages of the development process
involve testing and document whether the product meets design requirements, regulatory requirements
5
and user needs. The firm performance is regularly reviewed through internal audits to determine whether
the quality system is working and what improvements can be made. There are formal procedures for
dealing with actual and potential problems involving suppliers, customers or internal issues.
An ISO 9000 certification is awarded by an accredited certification body to a firm or a plant where a
quality management system has been established. The award process requires a detailed review and
documentation of the firm’s production and service processes to ensure they are in accordance with ISO
9000 standard requirements. In order to maintain the status of the certification, the system is reviewed
periodically for compliance to the ISO 9000 standards by certified auditors. Every three years, the
certification must be renewed with a full audit.
ISO 9000 standards play a central role in diffusing knowledge in those industries, where products
and processes supplied by various providers must interact with one another. The adoption of international
standards through ISO certification may create productivity benefits going beyond the transfer of new
productivity-enhancing knowledge embodied in standards. Obtaining an ISO certification may boost the
ability of its recipient to enter global supply chains and thus benefit from economies of scale and transfer
of technical and organizational knowledge from technologically advanced buyers, usually multinational
corporations.
Firms invest in an ISO certification in order to improve their chances in tenders, obtain a preferred
supplier status, enhance customer satisfaction and increase profitability. For instance, 17 percent of
Czech companies surveyed by the World Bank reported getting a quality certification (e.g., ISO 9000)
in order to become suppliers to multinationals. These firms constituted 40 percent of all companies
reporting having such a certification (Javorcik and Spatareanu 2009). Thus, an ISO 9000 certification
can have three types of impact on its recipient: (i) a reputational effect, which may be particularly
important to smaller firms or firm from countries (such as Slovenia) which traditionally have not served
as suppliers to global businesses, (ii) improvements to performance (direct channel) resulting directly
6
from making the firm compliant with the ISO 9000 requirement; (iii) improvements to performance
(indirect channel) resulting from doing business with world class companies, where these new business
relationships were facilitated by obtaining an ISO certification.3
3. Data and Exploratory Analysis
3.1 Data
Our data set was provided by the Slovenian Statistical Office. It includes information on 38,495 firms
active in manufacturing and services industries. The data base contains company accounts, including
profit and loss statements and balance sheets from 1987 to 2006. All figures are expressed in real terms
using industry-specific producer price indices obtained from the Slovenian Statistical Office.4
Information on holders of ISO certifications and the year of the award was obtained from ISO
accredited certification institutions in Slovenia: Slovenian Institute of Quality and Metrology (SIQ);
Bureau Veritas (BVQI); TÜV Management Service GmbH; and British Standards Institute (BSI). There
are 668 certified firms in our database which corresponds to 80 percent of certified firms in Slovenia.
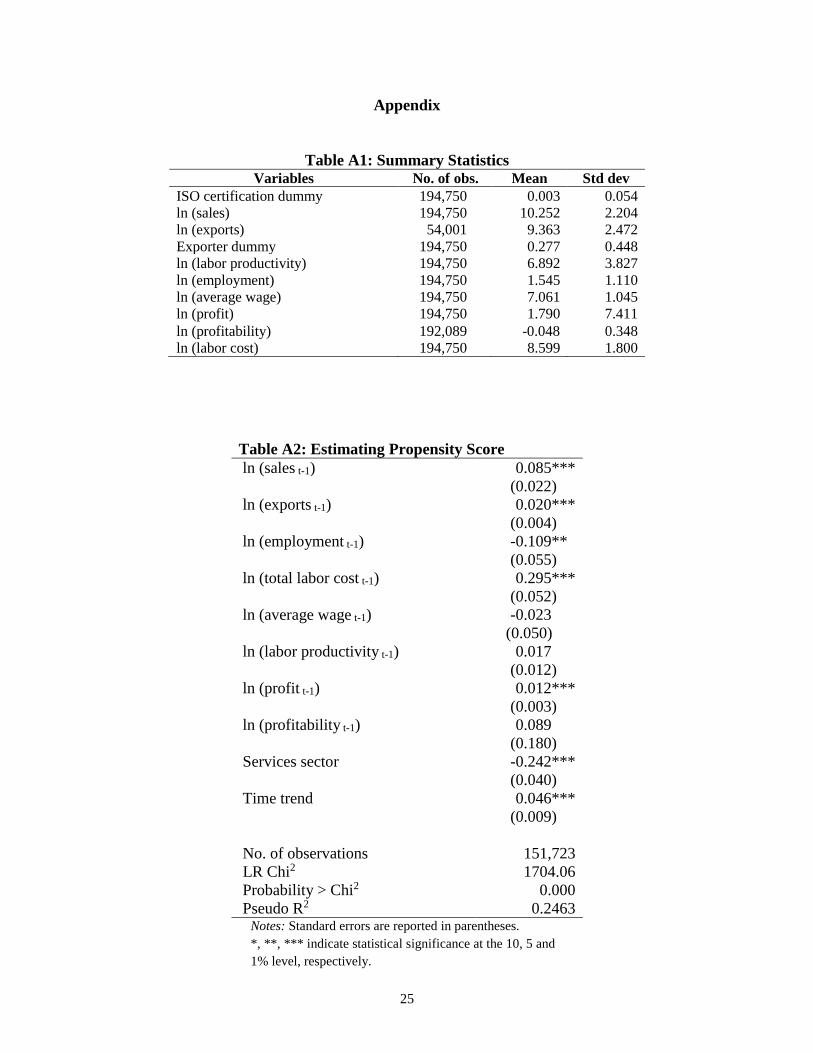
Summary statistics are presented in Appendix Table A1.
3.2 Exploratory estimation
We take the first look at the data by estimating a naïve OLS regression:
ln(𝑂𝑢𝑡𝑐𝑜𝑚𝑒𝑖𝑠𝑡) = 𝛼 + 𝛽1 𝐹𝑖𝑟𝑚 𝑐𝑒𝑟𝑡𝑖𝑓𝑖𝑒𝑑𝑖𝑠𝑡(+𝛽2 𝐹𝑖𝑟𝑚 𝑤𝑖𝑙𝑙 𝑏𝑒 𝑐𝑒𝑟𝑡𝑖𝑓𝑖𝑒𝑑 𝑤𝑖𝑡ℎ𝑖𝑛 3 𝑦𝑟𝑠𝑖𝑠𝑡) + 휀𝑖𝑠𝑡 (1)
where the dependent variable represents various outcomes related to firm i observed in year t; Firm
certified is an indicator variable equal to one if firm i holds an ISO certification in year t, and zero
3 See the literature documenting productivity spillovers from multinationals to their suppliers (Javorcik 2004, Javorcik and
Spatareanu 2008 and 2009b; Blalock and Gertler 2008) and the literature providing evidence on learning through exporting
(van Biesebroeck 2005; De Loecker 2007). 4 2000 is the base year.
7
otherwise; Firm will certified within 3 yrs is another indicator taking on the value of 1 if firm i does not
hold an ISO certification in year t but will obtain one in year t+1, t+2 or t+3. The indicator takes on a
value of zero for firms that already have a certification and for firms that do not have a certification and
will not receive one within the three-year timeframe.
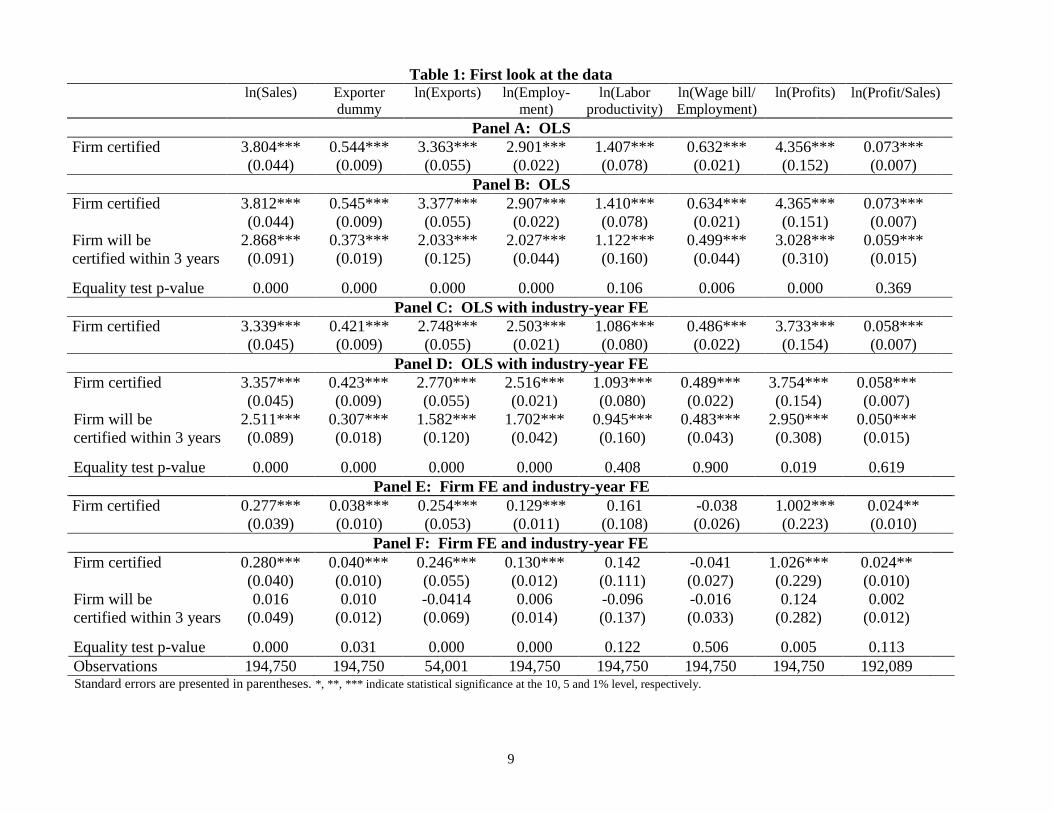
As evident from Panel A of Table 1 below, firms holding an ISO certification outperform other firms
in terms of all the criteria considered. They are much larger in terms of sales and employment, they are
more likely to export and tend to have a higher volume of exports, they enjoy higher profitability and
labor productivity and tend to pay higher wages. All of these estimates are statistically significant at the
one percent level.
The results from Panel B indicate that better performers self-select into obtaining ISO certifications.
Put differently, firms that will be awarded an ISO certification within the next three years already enjoy
a premium in terms of size, exports, profitability, productivity and average wage. Interestingly, obtaining
a certification helps firms boost this advantage, as the premium associated with having a certification is
larger than the premium enjoyed by future certification holders. All of these estimates are statistically
significant at the one percent level, and the difference between the two coefficients is statistically
significant in all cases except for labor productivity and profitability (profits/sales).
One may be concerned that the results so far are driven by ISO certifications being more prevalent in
export-oriented industries or industries with a larger minimum efficient scale of production. Therefore,
we add (2-digit NACE) industry-year fixed effects (αst) so that we compare certified firms to other firm
operating in the same industry in the same year. Our empirical specification now becomes:
ln(𝑂𝑢𝑡𝑐𝑜𝑚𝑒𝑖𝑠𝑡) = 𝜃1 𝐹𝑖𝑟𝑚 𝑐𝑒𝑟𝑡𝑖𝑓𝑖𝑒𝑑𝑖𝑠𝑡(+𝜃2 𝐹𝑖𝑟𝑚 𝑤𝑖𝑙𝑙 𝑏𝑒 𝑐𝑒𝑟𝑡𝑖𝑓𝑖𝑒𝑑 𝑤𝑖𝑡ℎ𝑖𝑛 3 𝑦𝑟𝑠𝑖𝑠𝑡) + 𝛼𝑠𝑡 + 𝜖𝑖𝑠𝑡 (2)
The results, presented in Panels C and D, indeed suggest that certified firms are not uniformly
distributed across industries. Making comparisons within-industry-year cells leads to a slight decline in
the magnitude of the estimates, which nevertheless remain statistically significant at the one percent

8
level. The results now suggest self-selection in terms of all variables considered as well as a positive
impact of the certification in terms of sales, exports, employment and profits.
In the final exploratory regression, we account for unobservable firm heterogeneity by adding firm
fixed effects:
ln(𝑂𝑢𝑡𝑐𝑜𝑚𝑒𝑖𝑠𝑡) = 𝛿1 𝐹𝑖𝑟𝑚 𝑐𝑒𝑟𝑡𝑖𝑓𝑖𝑒𝑑𝑖𝑠𝑡(+𝛿2 𝐹𝑖𝑟𝑚 𝑤𝑖𝑙𝑙 𝑏𝑒 𝑐𝑒𝑟𝑡𝑖𝑓𝑖𝑒𝑑 𝑤𝑖𝑡ℎ𝑖𝑛 3 𝑦𝑟𝑠𝑖𝑠𝑡) + 𝛼𝑖 + 𝛼𝑠𝑡 + 𝜖𝑖𝑠𝑡 (3)
Doing so has a dramatic impact on the results (see Panels E and F). The certification premium remains
positive and statistically significant at the one percent level in all but two cases (average wage and labor
productivity), but the size of the estimates goes down by an order of magnitude. We take away two
messages from these results. First, having a certification seems to boost a firm’s performance in a variety
of ways. Second, firm characteristics affect the choice of becoming certified and hence addressing the
self-selection in a convincing way is of key importance.
Although including firm fixed effects helps capture some factors driving self-selection, this is not a
fully convincing approach because our panel spans a period of 20 years and firm characteristics may
evolve differently over time and affect the choice of applying for a certification. In the next section we
discuss our preferred empirical strategy addressing the selection issue.
9
Table 1: First look at the data ln(Sales) Exporter
dummy
ln(Exports) ln(Employ-
ment)
ln(Labor
productivity)
ln(Wage bill/
Employment)
ln(Profits)
ln(Profit/Sales)
Panel A: OLS
Firm certified 3.804*** 0.544*** 3.363*** 2.901*** 1.407*** 0.632*** 4.356*** 0.073***
(0.044) (0.009) (0.055) (0.022) (0.078) (0.021) (0.152) (0.007)
Panel B: OLS
Firm certified 3.812*** 0.545*** 3.377*** 2.907*** 1.410*** 0.634*** 4.365*** 0.073***
(0.044) (0.009) (0.055) (0.022) (0.078) (0.021) (0.151) (0.007)
Firm will be 2.868*** 0.373*** 2.033*** 2.027*** 1.122*** 0.499*** 3.028*** 0.059***
certified within 3 years (0.091) (0.019) (0.125) (0.044) (0.160) (0.044) (0.310) (0.015)
Equality test p-value 0.000 0.000 0.000 0.000 0.106 0.006 0.000 0.369
Panel C: OLS with industry-year FE
Firm certified 3.339*** 0.421*** 2.748*** 2.503*** 1.086*** 0.486*** 3.733*** 0.058***
(0.045) (0.009) (0.055) (0.021) (0.080) (0.022) (0.154) (0.007)
Panel D: OLS with industry-year FE
Firm certified 3.357*** 0.423*** 2.770*** 2.516*** 1.093*** 0.489*** 3.754*** 0.058***
(0.045) (0.009) (0.055) (0.021) (0.080) (0.022) (0.154) (0.007)
Firm will be 2.511*** 0.307*** 1.582*** 1.702*** 0.945*** 0.483*** 2.950*** 0.050***
certified within 3 years (0.089) (0.018) (0.120) (0.042) (0.160) (0.043) (0.308) (0.015)
Equality test p-value 0.000 0.000 0.000 0.000 0.408 0.900 0.019 0.619
Panel E: Firm FE and industry-year FE
Firm certified 0.277*** 0.038*** 0.254*** 0.129*** 0.161 -0.038 1.002*** 0.024**
(0.039) (0.010) (0.053) (0.011) (0.108) (0.026) (0.223) (0.010)
Panel F: Firm FE and industry-year FE
Firm certified 0.280*** 0.040*** 0.246*** 0.130*** 0.142 -0.041 1.026*** 0.024**
(0.040) (0.010) (0.055) (0.012) (0.111) (0.027) (0.229) (0.010)
Firm will be 0.016 0.010 -0.0414 0.006 -0.096 -0.016 0.124 0.002
certified within 3 years (0.049) (0.012) (0.069) (0.014) (0.137) (0.033) (0.282) (0.012)
Equality test p-value 0.000 0.031 0.000 0.000 0.122 0.506 0.005 0.113
Observations 194,750 194,750 54,001 194,750 194,750 194,750 194,750 192,089 Standard errors are presented in parentheses. *, **, *** indicate statistical significance at the 10, 5 and 1% level, respectively.
10
4. Impact of ISO 9000 Certification on Firm Performance: Main Analysis
4.1 Econometric strategy
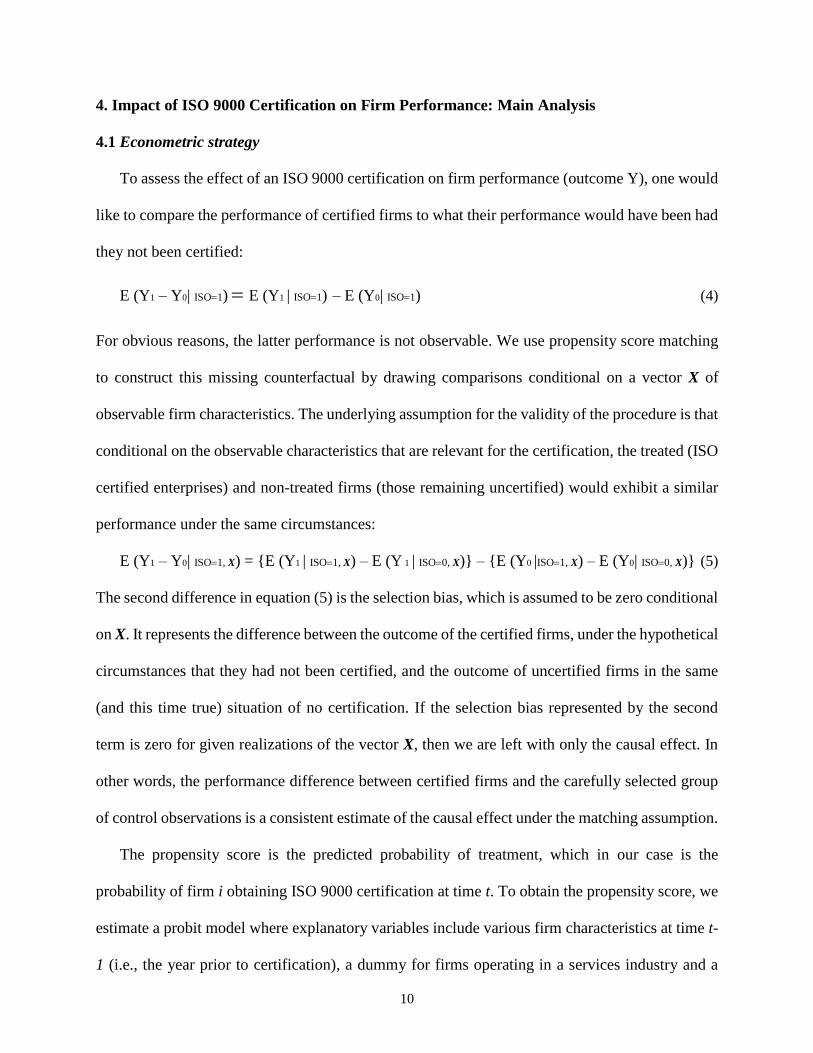
To assess the effect of an ISO 9000 certification on firm performance (outcome Y), one would
like to compare the performance of certified firms to what their performance would have been had
they not been certified:
E (Y1 – Y0| ISO1) E (Y1 | ISO1)– E (Y0| ISO1) (4)
For obvious reasons, the latter performance is not observable. We use propensity score matching
to construct this missing counterfactual by drawing comparisons conditional on a vector X of
observable firm characteristics. The underlying assumption for the validity of the procedure is that
conditional on the observable characteristics that are relevant for the certification, the treated (ISO
certified enterprises) and non-treated firms (those remaining uncertified) would exhibit a similar
performance under the same circumstances:
E (Y1 – Y0| ISO1, X) = {E (Y1 | ISO1, X) – E (Y 1 | ISO0, X)} – {E (Y0 |ISO1, X) – E (Y0| ISO0, X)}(5)
The second difference in equation (5) is the selection bias, which is assumed to be zero conditional
on X. It represents the difference between the outcome of the certified firms, under the hypothetical
circumstances that they had not been certified, and the outcome of uncertified firms in the same
(and this time true) situation of no certification. If the selection bias represented by the second
term is zero for given realizations of the vector X, then we are left with only the causal effect. In
other words, the performance difference between certified firms and the carefully selected group
of control observations is a consistent estimate of the causal effect under the matching assumption.
The propensity score is the predicted probability of treatment, which in our case is the
probability of firm i obtaining ISO 9000 certification at time t. To obtain the propensity score, we
estimate a probit model where explanatory variables include various firm characteristics at time t-
1 (i.e., the year prior to certification), a dummy for firms operating in a services industry and a

11
time trend. We include firm characteristics that, according to our exploratory regressions, matter
for the likelihood of being certified in the future. The estimation results are presented in Appendix
Table A2. They suggest that firms with larger sales, exports and profits are more likely to receive
a certification. Firms in services are less likely to do so. More certifications appear to be awarded
over time.5
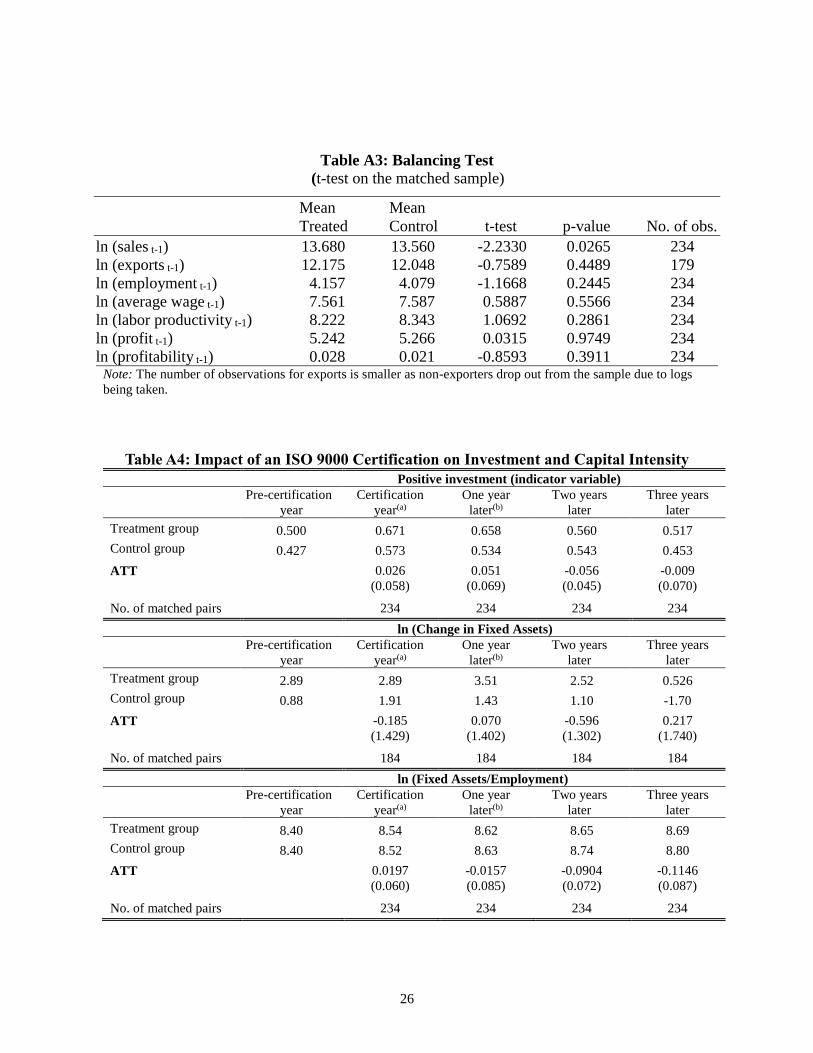
We use the nearest neighbor matching procedure and additionally restrict the control
observations to those coming from within the same 2-digit NACE industry-year cell. Our matching
procedure performs quite well. The average difference in propensity score between the matched
observations is 0.003. The test of the balancing hypothesis performed within blocks grouping
observations with similar propensity score is satisfied. A simple t-test comparing the treated and
the control group cannot reject the equality of means of exports, employment, labor productivity,
profits, profitability, total labor cost and average wage prior to the treatment. Sales are an exception
as the test suggests that future ISO recipients are slightly larger. See Appendix Table A3.
As unobservable heterogeneity, such as presence of a good manager or the geographic location,
is likely to play a role in obtaining a certification, we apply the difference-in-differences approach
to our matched sample. This means that we look for divergence in the performance paths of the
certified firms and the matched control firms that had similar characteristics in the pre-certified
year in the same industry and the same year. The performance analysis begins in the pre-certified
period and focuses on the (cumulative) change in performance over the following year and then
each of the subsequent three years. This allows us not only to comment on the magnitude of the
5 The estimation sample excludes industries where no certifications were awarded during the period under study.
These are: Fishing, Fish farming, and related service activities (NACE 5), Mining of uranium and thorium ores
(NACE 12), Mining of metal ores (NACE 13), Manufacturing of tobacco products (NACE 16), Recycling (NACE
37), Water Transport (NACE 61), Air Transport (NACE 62), Insurance and pension funding, except compulsory
social security (NACE 66), Renting of machinery and equipment without operator and of personal and household
goods (NACE 71), Public administration and defense; compulsory social security (NACE 75), Activities of
membership organizations n.e.c. (NACE 91).
12
changes but also to analyze how soon these changes have taken place. This means, however, that
we can focus only on firms who report the relevant variables in the year prior to being certified
and in each of the three years following the certification. This leaves us with 234 certified firms.
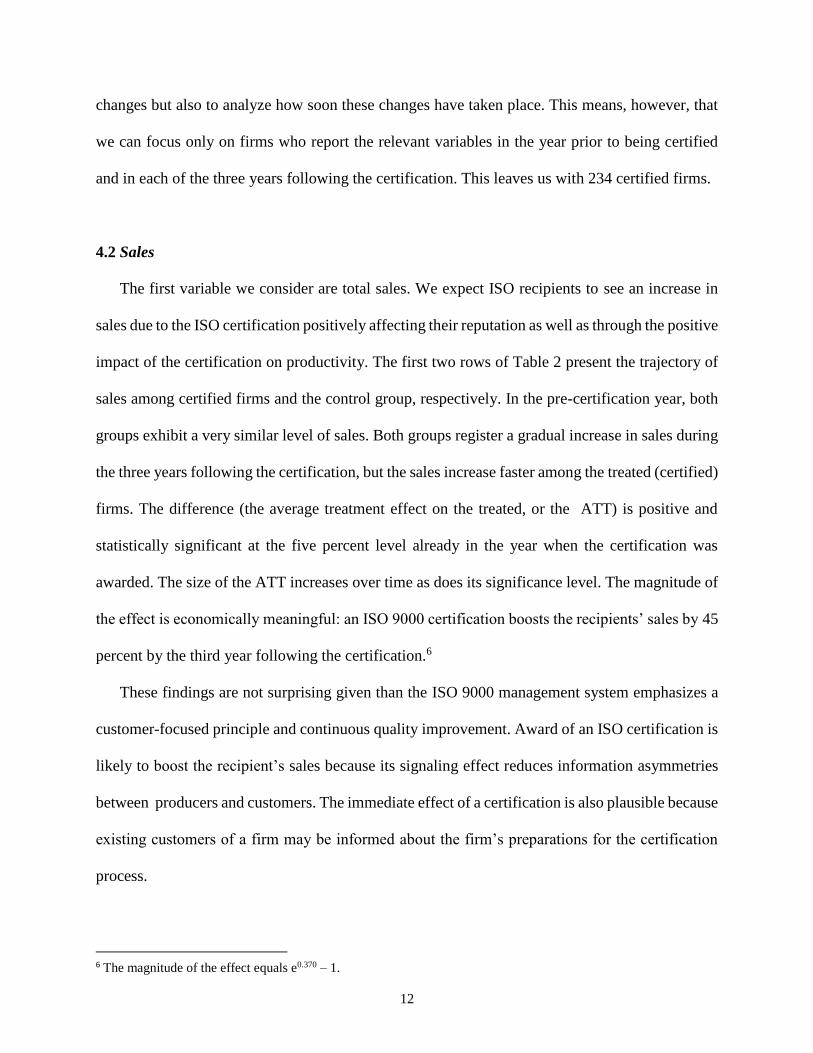
4.2 Sales
The first variable we consider are total sales. We expect ISO recipients to see an increase in
sales due to the ISO certification positively affecting their reputation as well as through the positive
impact of the certification on productivity. The first two rows of Table 2 present the trajectory of
sales among certified firms and the control group, respectively. In the pre-certification year, both
groups exhibit a very similar level of sales. Both groups register a gradual increase in sales during
the three years following the certification, but the sales increase faster among the treated (certified)
firms. The difference (the average treatment effect on the treated, or the ATT) is positive and
statistically significant at the five percent level already in the year when the certification was
awarded. The size of the ATT increases over time as does its significance level. The magnitude of
the effect is economically meaningful: an ISO 9000 certification boosts the recipients’ sales by 45
percent by the third year following the certification.6
These findings are not surprising given than the ISO 9000 management system emphasizes a
customer-focused principle and continuous quality improvement. Award of an ISO certification is
likely to boost the recipient’s sales because its signaling effect reduces information asymmetries
between producers and customers. The immediate effect of a certification is also plausible because
existing customers of a firm may be informed about the firm’s preparations for the certification
process.
6 The magnitude of the effect equals e0.370 – 1.
13
Table 2: Impact of an ISO 9000 Certification on Sales
ln (Sales)
Pre-certification
year
Certification
year(a)
One year
later(b)
Two years
later
Three years
later
Treatment group 13.68 13.79 13.90 13.95 14.02
Control group 13.56 13.58 13.60 13.55 13.53
ATT 0.091** 0.181*** 0.282*** 0.370***
(0.037) (0.052) (0.072) (0.077)
No. of matched pairs 234 234 234 234
The first two rows present the average outcomes observed in the given time period. ATT stands for the Average Treatment
Effect on the Treated. Bootstrapped standard errors are reported in parentheses. *, **, *** indicate statistical significance at
the 10, 5 and 1% level, respectively.
(a) ATT = nn
nn 1
control
yearion certificat-pre
treated
yearion certificat-pre 1
control
yearon cerificati
treated
yearion certificat Salesln -Salesln 1
Salesln -Salesln 1
(b) ATT =
nn
nn 1
control
yearion certificat-pre
treated
yearion certificat-pre 1
control
1yearion certificat
treated
1yearion certificat Salesln -Salesln 1
Salesln -Salesln 1
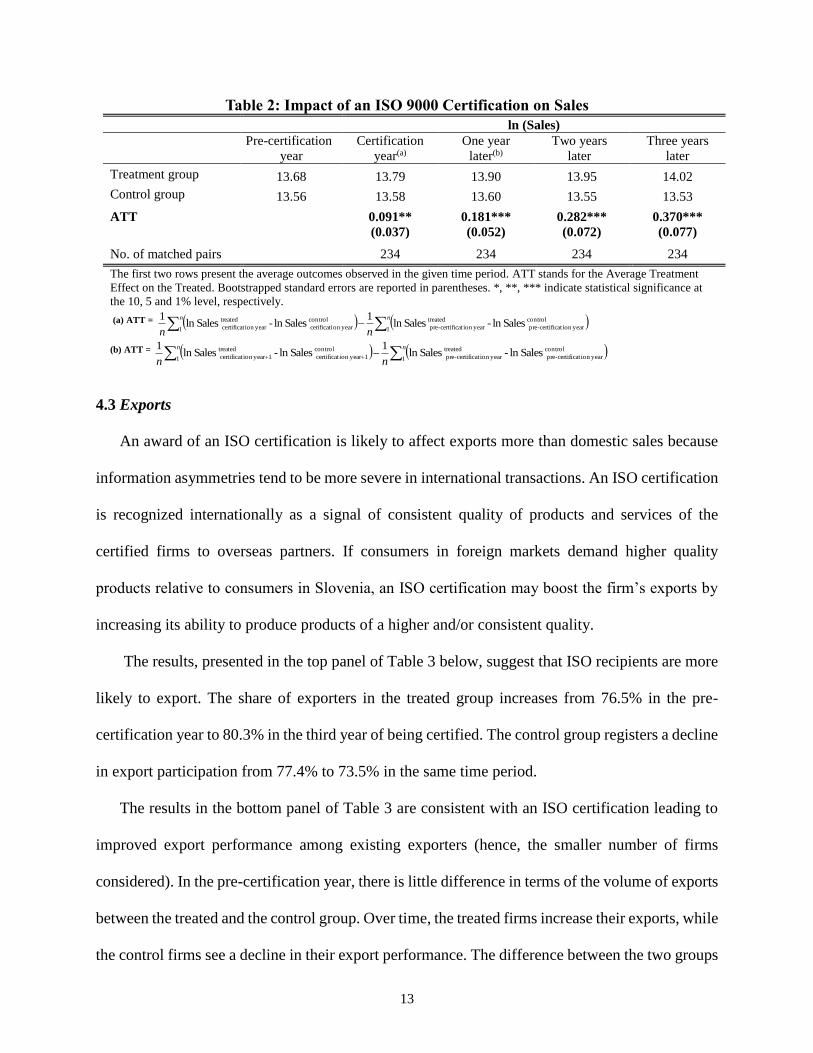
4.3 Exports
An award of an ISO certification is likely to affect exports more than domestic sales because
information asymmetries tend to be more severe in international transactions. An ISO certification
is recognized internationally as a signal of consistent quality of products and services of the
certified firms to overseas partners. If consumers in foreign markets demand higher quality
products relative to consumers in Slovenia, an ISO certification may boost the firm’s exports by
increasing its ability to produce products of a higher and/or consistent quality.
The results, presented in the top panel of Table 3 below, suggest that ISO recipients are more
likely to export. The share of exporters in the treated group increases from 76.5% in the pre-
certification year to 80.3% in the third year of being certified. The control group registers a decline
in export participation from 77.4% to 73.5% in the same time period.
The results in the bottom panel of Table 3 are consistent with an ISO certification leading to
improved export performance among existing exporters (hence, the smaller number of firms
considered). In the pre-certification year, there is little difference in terms of the volume of exports
between the treated and the control group. Over time, the treated firms increase their exports, while
the control firms see a decline in their export performance. The difference between the two groups
14
becomes statistically significant one year after the certification is awarded. An ISO certification
seems to have a level effect. The certified firms see their exports boosted by 142 percent in the
year following the certification, after which both their level of exports and the ATT remain roughly
unchanged.
Table 3: Impact of an ISO 9000 Certification on Export Participation
Exporter dummy
Pre-certification
Year
Certification
year
One year
later
Two years
later
Three years
later
Treatment group 0.765 0.769 0.803 0.808 0.803
Control group 0.774 0.774 0.756 0.765 0.735
ATT 0.0043 0.0556* 0.0769** 0.0769**
(0.025) (0.034) (0.031) (0.031)
No. of matched pairs 234 234 234 234
ln (Exports)
Treatment group 12.17 11.84 12.22 12.16 12.18
Control group 12.05 12.17 11.21 11.02 11.06
ATT 0.177 0.883*** 1.010*** 0.994***
(0.239) (0.295) (0.310) (0.320)
No. of matched pairs 179 179 179 179
The first two rows in each panel present the average outcomes observed in the given time period. ATT stands for the Average
Treatment Effect on the Treated. Bootstrapped standard errors are reported in parentheses. *, **, *** indicate statistical
significance at the 10, 5 and 1% level, respectively.
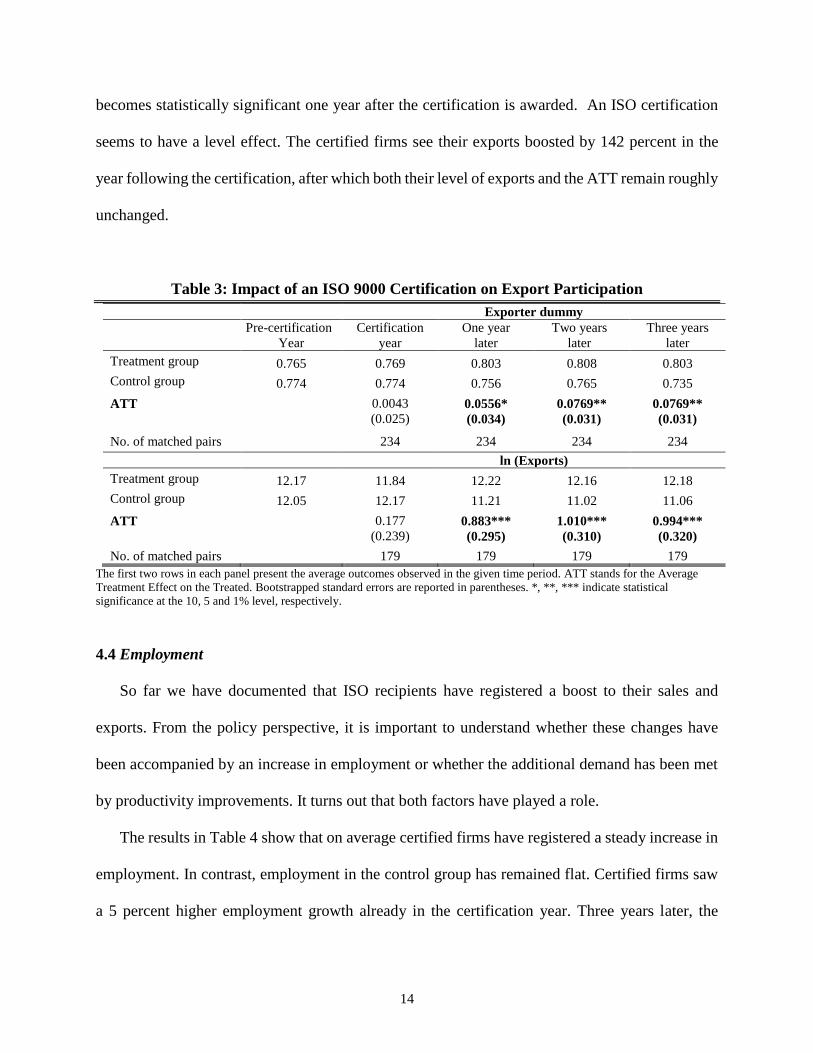
4.4 Employment
So far we have documented that ISO recipients have registered a boost to their sales and
exports. From the policy perspective, it is important to understand whether these changes have
been accompanied by an increase in employment or whether the additional demand has been met
by productivity improvements. It turns out that both factors have played a role.
The results in Table 4 show that on average certified firms have registered a steady increase in
employment. In contrast, employment in the control group has remained flat. Certified firms saw
a 5 percent higher employment growth already in the certification year. Three years later, the
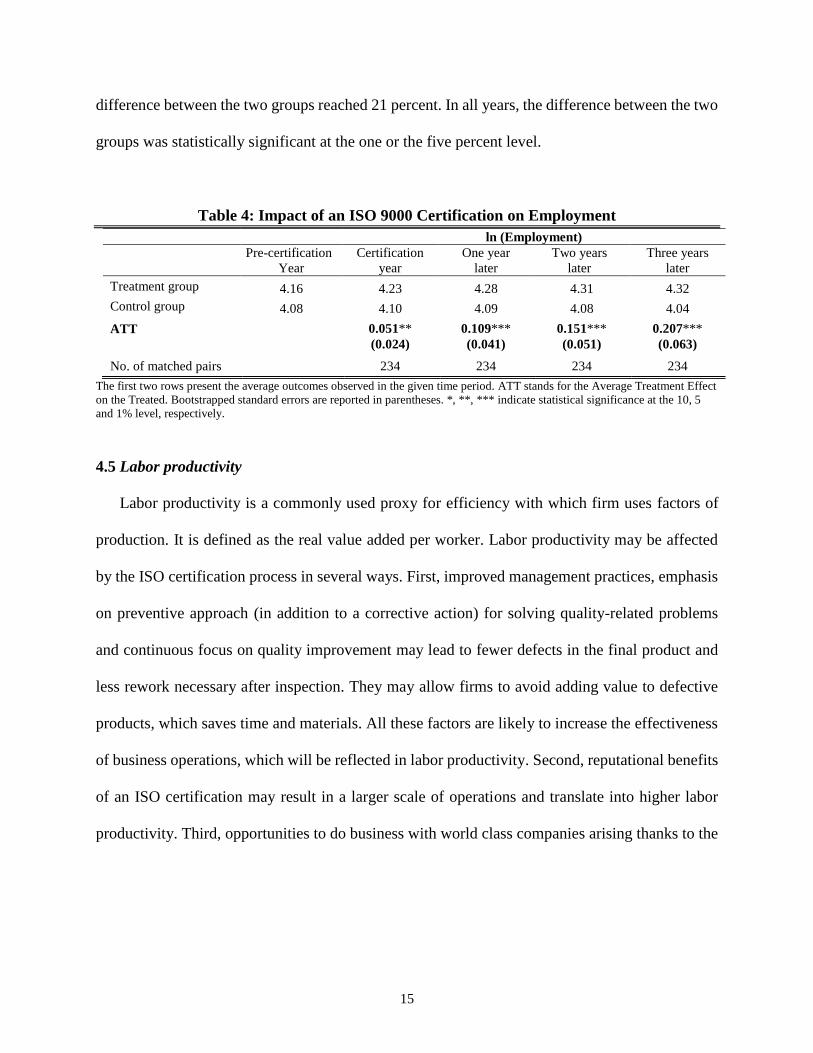
15
difference between the two groups reached 21 percent. In all years, the difference between the two
groups was statistically significant at the one or the five percent level.
Table 4: Impact of an ISO 9000 Certification on Employment
ln (Employment)
Pre-certification
Year
Certification
year
One year
later
Two years
later
Three years
later
Treatment group 4.16 4.23 4.28 4.31 4.32
Control group 4.08 4.10 4.09 4.08 4.04
ATT 0.051** 0.109*** 0.151*** 0.207***
(0.024) (0.041) (0.051) (0.063)
No. of matched pairs 234 234 234 234
The first two rows present the average outcomes observed in the given time period. ATT stands for the Average Treatment Effect
on the Treated. Bootstrapped standard errors are reported in parentheses. *, **, *** indicate statistical significance at the 10, 5
and 1% level, respectively.
4.5 Labor productivity
Labor productivity is a commonly used proxy for efficiency with which firm uses factors of
production. It is defined as the real value added per worker. Labor productivity may be affected
by the ISO certification process in several ways. First, improved management practices, emphasis
on preventive approach (in addition to a corrective action) for solving quality-related problems
and continuous focus on quality improvement may lead to fewer defects in the final product and
less rework necessary after inspection. They may allow firms to avoid adding value to defective
products, which saves time and materials. All these factors are likely to increase the effectiveness
of business operations, which will be reflected in labor productivity. Second, reputational benefits
of an ISO certification may result in a larger scale of operations and translate into higher labor
productivity. Third, opportunities to do business with world class companies arising thanks to the
16
award of an ISO certification may benefit the recipient firms through productivity spillovers from
the new customers (multinational firms operating in Slovenia or export partners abroad).7
ISO 9000 management system requires appropriate worker training and internalizing the eight
management principles. Both processes may take time, therefore, it is reasonable to expect the
benefits of a certification will manifest themselves with a lag.
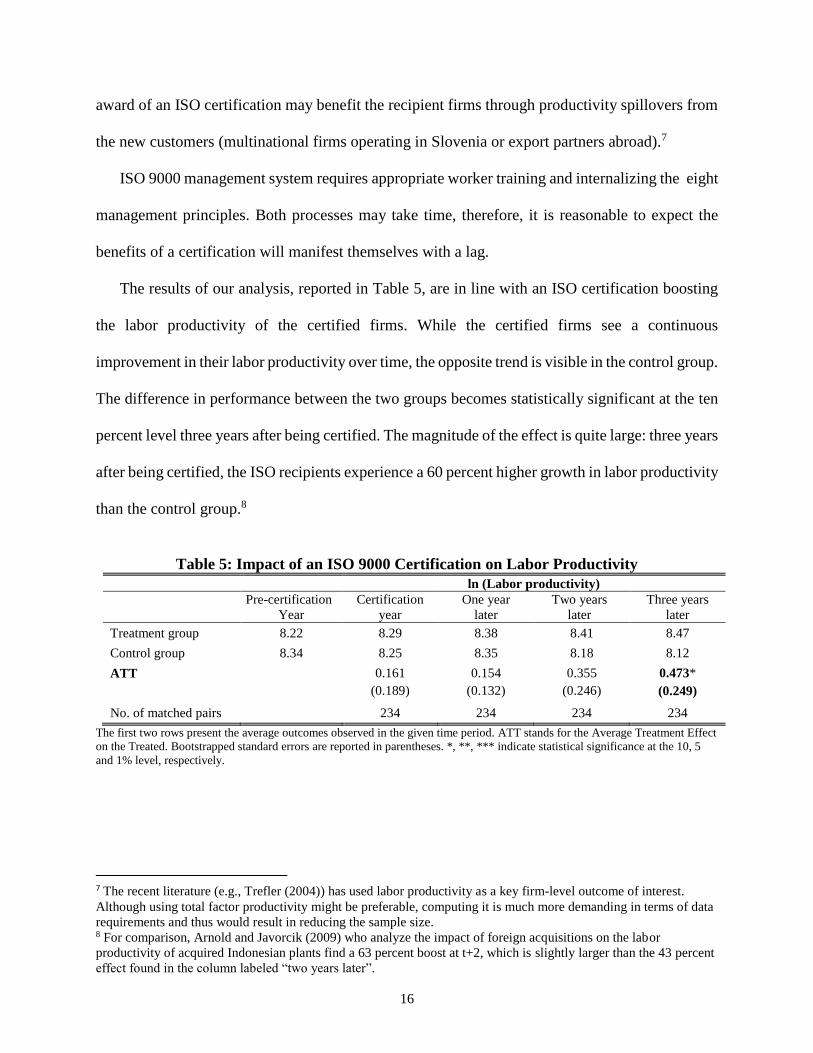
The results of our analysis, reported in Table 5, are in line with an ISO certification boosting
the labor productivity of the certified firms. While the certified firms see a continuous
improvement in their labor productivity over time, the opposite trend is visible in the control group.
The difference in performance between the two groups becomes statistically significant at the ten
percent level three years after being certified. The magnitude of the effect is quite large: three years
after being certified, the ISO recipients experience a 60 percent higher growth in labor productivity
than the control group.8
Table 5: Impact of an ISO 9000 Certification on Labor Productivity
ln (Labor productivity)
Pre-certification
Year
Certification
year
One year
later
Two years
later
Three years
later
Treatment group 8.22 8.29 8.38 8.41 8.47
Control group 8.34 8.25 8.35 8.18 8.12
ATT 0.161 0.154 0.355 0.473*
(0.189) (0.132) (0.246) (0.249)
No. of matched pairs 234 234 234 234
The first two rows present the average outcomes observed in the given time period. ATT stands for the Average Treatment Effect
on the Treated. Bootstrapped standard errors are reported in parentheses. *, **, *** indicate statistical significance at the 10, 5
and 1% level, respectively.
7 The recent literature (e.g., Trefler (2004)) has used labor productivity as a key firm-level outcome of interest.
Although using total factor productivity might be preferable, computing it is much more demanding in terms of data
requirements and thus would result in reducing the sample size. 8 For comparison, Arnold and Javorcik (2009) who analyze the impact of foreign acquisitions on the labor
productivity of acquired Indonesian plants find a 63 percent boost at t+2, which is slightly larger than the 43 percent
effect found in the column labeled “two years later”.
17
4.6 Average wage
We expect improvements in labor productivity to be closely linked to increases in the average
wage. There may be changes in labor composition (a shift towards more skilled or more motivated
employees) and existing workers may be rewarded for better performance.9
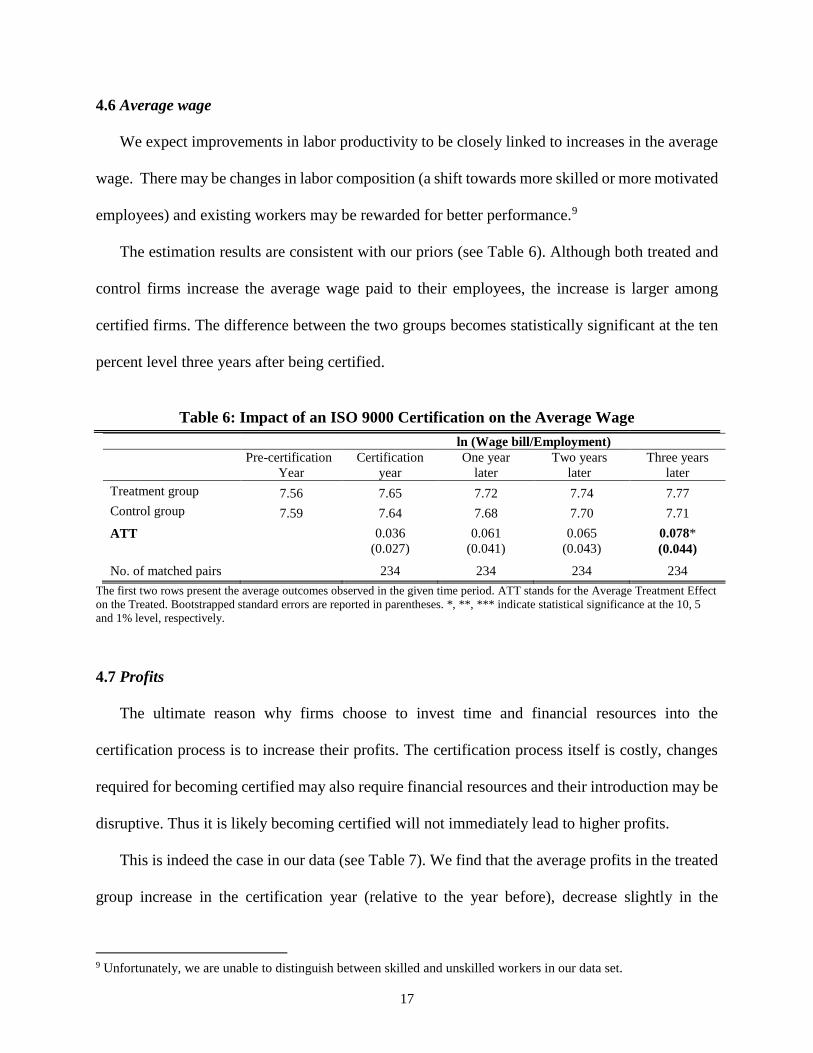
The estimation results are consistent with our priors (see Table 6). Although both treated and
control firms increase the average wage paid to their employees, the increase is larger among
certified firms. The difference between the two groups becomes statistically significant at the ten
percent level three years after being certified.
Table 6: Impact of an ISO 9000 Certification on the Average Wage
ln (Wage bill/Employment)
Pre-certification
Year
Certification
year
One year
later
Two years
later
Three years
later
Treatment group 7.56 7.65 7.72 7.74 7.77
Control group 7.59 7.64 7.68 7.70 7.71
ATT 0.036 0.061 0.065 0.078*
(0.027) (0.041) (0.043) (0.044)
No. of matched pairs 234 234 234 234
The first two rows present the average outcomes observed in the given time period. ATT stands for the Average Treatment Effect
on the Treated. Bootstrapped standard errors are reported in parentheses. *, **, *** indicate statistical significance at the 10, 5
and 1% level, respectively.
4.7 Profits
The ultimate reason why firms choose to invest time and financial resources into the
certification process is to increase their profits. The certification process itself is costly, changes
required for becoming certified may also require financial resources and their introduction may be
disruptive. Thus it is likely becoming certified will not immediately lead to higher profits.
This is indeed the case in our data (see Table 7). We find that the average profits in the treated
group increase in the certification year (relative to the year before), decrease slightly in the
9 Unfortunately, we are unable to distinguish between skilled and unskilled workers in our data set.
18
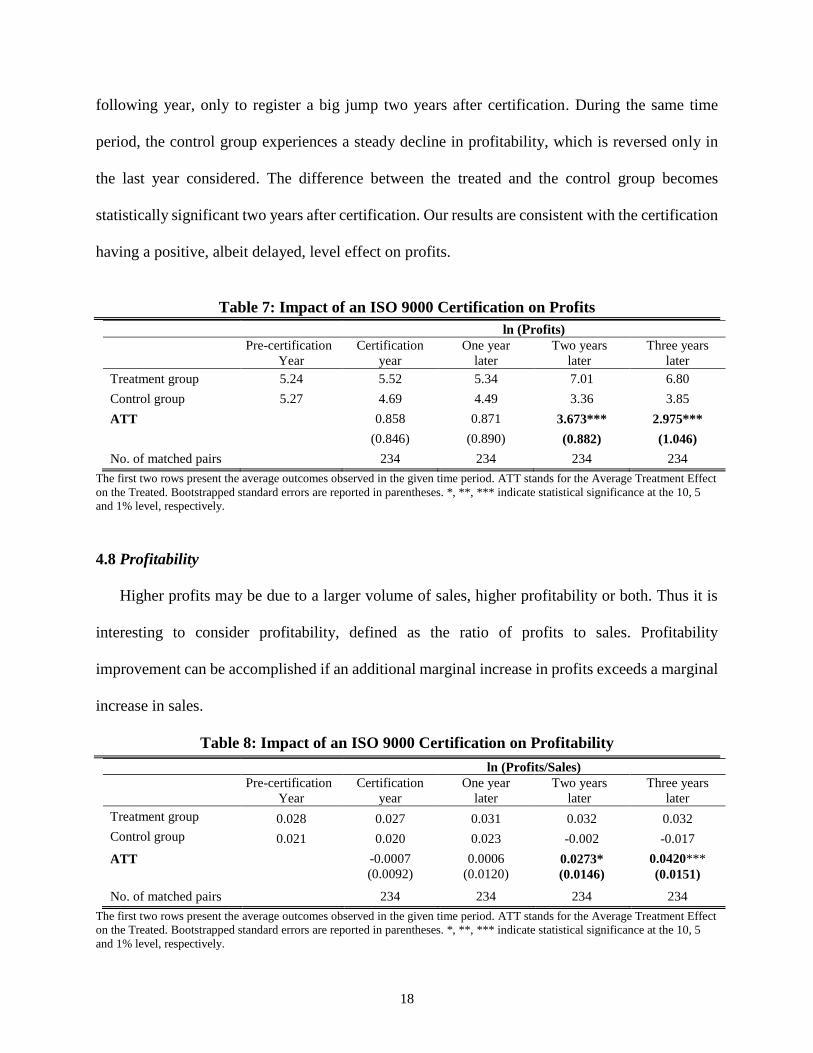
following year, only to register a big jump two years after certification. During the same time
period, the control group experiences a steady decline in profitability, which is reversed only in
the last year considered. The difference between the treated and the control group becomes
statistically significant two years after certification. Our results are consistent with the certification
having a positive, albeit delayed, level effect on profits.
Table 7: Impact of an ISO 9000 Certification on Profits
ln (Profits)
Pre-certification
Year
Certification
year
One year
later
Two years
later
Three years
later
Treatment group 5.24 5.52 5.34 7.01 6.80
Control group 5.27 4.69 4.49 3.36 3.85
ATT 0.858 0.871 3.673*** 2.975***
(0.846) (0.890) (0.882) (1.046)
No. of matched pairs 234 234 234 234
The first two rows present the average outcomes observed in the given time period. ATT stands for the Average Treatment Effect
on the Treated. Bootstrapped standard errors are reported in parentheses. *, **, *** indicate statistical significance at the 10, 5
and 1% level, respectively.
4.8 Profitability
Higher profits may be due to a larger volume of sales, higher profitability or both. Thus it is
interesting to consider profitability, defined as the ratio of profits to sales. Profitability
improvement can be accomplished if an additional marginal increase in profits exceeds a marginal
increase in sales.
Table 8: Impact of an ISO 9000 Certification on Profitability
ln (Profits/Sales)
Pre-certification
Year
Certification
year
One year
later
Two years
later
Three years
later
Treatment group 0.028 0.027 0.031 0.032 0.032
Control group 0.021 0.020 0.023 -0.002 -0.017
ATT -0.0007 0.0006 0.0273* 0.0420***
(0.0092) (0.0120) (0.0146) (0.0151)
No. of matched pairs 234 234 234 234
The first two rows present the average outcomes observed in the given time period. ATT stands for the Average Treatment Effect
on the Treated. Bootstrapped standard errors are reported in parentheses. *, **, *** indicate statistical significance at the 10, 5
and 1% level, respectively.
19
The results in Table 8 suggest that certified firms see a slight, though gradual, increase in their
profitability, while the control firms see a decline in their profitability. The ATT effect is
statistically significant at the 10 percent level two years after the certification and at the one
percent level in the following year. Thus the results are suggestive of the certification increasing
the recipients’ profitability, though this effect is not immediate.
4.9 Channels
As discussed earlier, obtaining an ISO 9000 certification may: (i) enhance the reputation of
the recipient and thus lead to new or larger contracts with domestic and/or foreign partners; (ii)
directly boost the recipient’s performance thanks to implementation of the continuous
improvement principle; (iii) improve the recipient’s performance indirectly due to new (or more
intense) business links with world class companies which result in new knowledge and additional
pressure to improve performance.
The fact that we observe an immediate impact of the certification on sales and exports supports
the view that a certification brings reputational benefits. The findings indicating the impact of a
certification on labor productivity, profitability and average wage, which happen with a two to
three year delay, are supportive on the continuous improvement channel. The large boost to exports
experienced by the certified firms also makes the business links channel quite plausible.
One may wonder whether the efforts to obtain an ISO certification coincide with modernization
of the production process. This does not seem to be the case. As visible in the Appendix Table
A4, certified firms are not more likely to register a positive investment, increase their fixed assets
or boost their capital intensity.
Instead, our results point towards improvements in management practices translating into
better performance. This is consistent with the findings from a randomized controlled trial
20
conducted by Bloom et al. (2013). These authors provided free management consulting to a set of
randomly selected textile plants outside Mumbai to help them adopt modern management practices
and compared the recipients’ performance to another randomly chosen set of control plants. The
experiment revealed that over several months as the firms slowly adopted modern management
practices they experienced large increases in productivity.
One may be concerned about existence of time-varying firm-specific confounding factors, such
as prospects of obtaining a lucrative contract whose timing coincides with the award of an ISO
certification. Or a lucrative contract being conditional on obtaining an ISO certification. Our
estimation strategy does not allow us to rule out such a possibility, but we draw comfort from the
fact that some of the certification impacts take place with a three year delay, which make it unlikely
that all of the effects would be due to a single contract.
4.10 External validity
One may be concerned about external validity of the results. Slovenia emerged as an
independent state after the split of Yugoslavia in 1991, went through an economic transition and
joined the European Union in 2004. Therefore, one may wonder whether the experience of
Slovenian firms is informative for firms in other countries. We believe this is the case for two
reasons.
First, given the requirements we impose in the matching procedure (i.e., that a firm must report
the key variables in the year prior to obtaining a certification and for four years afterwards and that
a suitable control firm exists), means that in practice our analysis focuses on ISO certifications
awarded during the 1995-2002 period and outcomes pertaining to 1995-2005. Thus we will not be
capturing the shock associated with the early years of Slovenian independence. It is also worth
21
highlighting that we perform matching within industry-year cell, thus both the treated and the
control observations are subject to the same shocks.
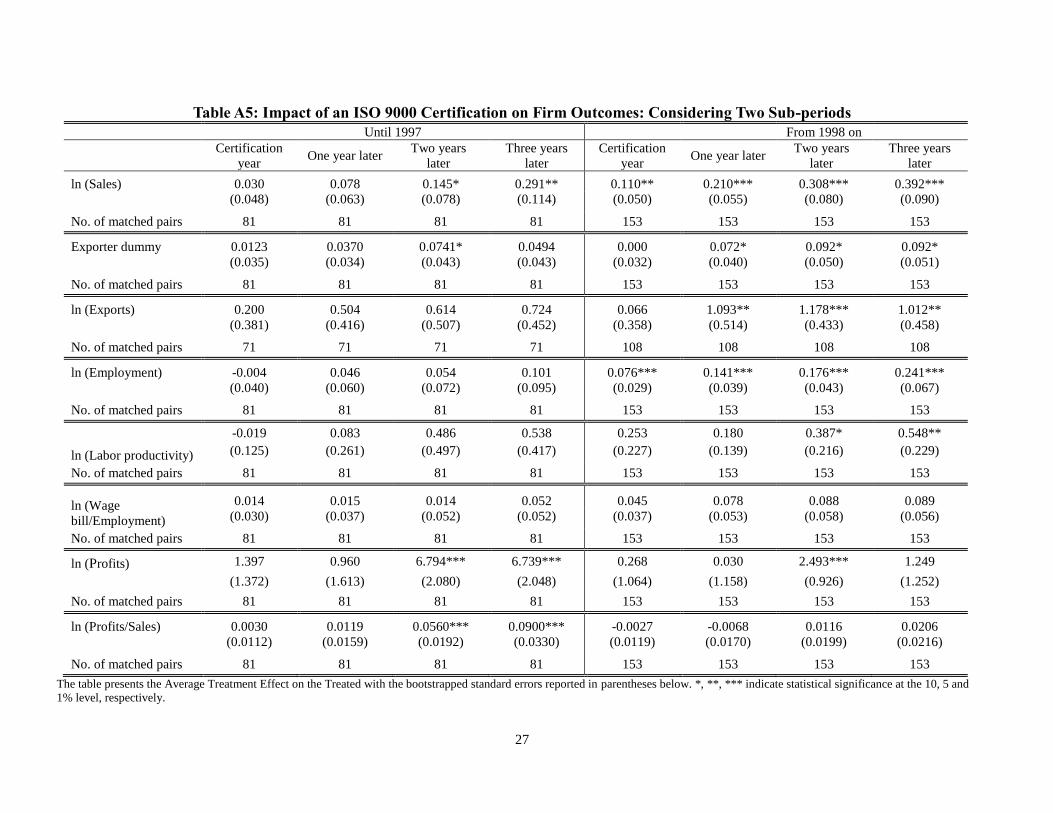
Second, we split the sample into two subperiods covering outcomes in 1995-97 vs 1998-2005
(see Appendix Table A4). This exercise indicates that our findings are not driven by observations
from a particular sub-period, though given a much smaller sample size the results are less precisely
estimated.
5. Conclusions
Policy makers around the world strive to find ways of boosting the economic growth of their
countries. Our study suggests that importing state-of-the-art management practices may serve as a
driver of productivity growth in emerging markets, particularly those which lag in this area.
Our analysis focuses on the effect of obtaining an ISO 9000 certification on firm performance.
The ISO 9000 standard codifies international standards of best management practices and
emphasizes quality assurance through preventive actions, process of continuous improvement and
tracking customer satisfaction. While obtaining an ISO 9000 certification is costly in financial and
management effort terms, it can help firms improve their performance, enhance their reputation
and join global supply chains.
We analyze the effect of being ISO certified in the context of Slovenia, a transition country
that due its socialist legacy lagged behind international standards in terms of management
practices. To address the issue of firms self selecting to become certified our empirical analysis
relies on propensity-score-matching combined with a difference-in-differences approach.
We indeed find that best performing firms self-select into receiving ISO certification. More
importantly, we show that obtaining an ISO 9000 certification boosts the performance of certified
firms in terms of sales, exports, labor productivity, profits, profitability, employment and wages.
22
While most of these effects are felt almost immediately, the increase in labor productivity,
profitability and wages takes place only after a few years.
A limitation of our study is that we are unable to determine whether the increase in the value
of sales is driven by a larger quantity sold, higher quality (for instance, due to a lower number of
faulty products per million or to increased product reliability) or a higher markup that ISO certified
firms are able to charge. We hope that future research will be able to shed some light on this issue.
23
REFERENCES
Arnold, Jens and Beata S. Javorcik, 2009. "Gifted Kids or Pushy Parents? Foreign Direct
Investment and Plant Productivity in Indonesia" Journal of International Economics, 79(1),
42-53
Arora, Ashish and Jai Asundi, 1999, “Quality Certification and the Economics of Contract
Software Development: A Study of the Indian Software Industry” National Bureau of
Economic Research, Working Paper 7260, July
Bertrand, Marianne and Antoinette Schoar 2003, “Managing with Style: The Effect of Managers on
Firm Policies” Quarterly Journal of Economics, 118(4), 1169-1208
Blalock, Garrick and Paul J. Gertler, 2008. “Welfare Gains from Foreign Direct Investment
through Technology Transfer to Local Suppliers" Journal of International Economics, 74(2),
402-421
Bloom, Nicholas and John Van Reenen, 2007, “Measuring and Explaining Management
Practices across Firms and Countries” Quarterly Journal of Economics, 122(4), 1357-1401
Bloom, Nicholas and John Van Reenen, 2010, “Why Do Management Practices Differ across
Firms and Countries?” Journal of Economic Perspective, 24 (1), 203-224
Bloom, Nicholas, Benn Eifert, Aprajit Mahajan, David McKenzie and John Roberts, 2013,
“Does Management Matter? Evidence from India” Quarterly Journal of Economics, 121: 1-51
Buttle, Francis, 1997, “ISO 9000: Marketing motivations and benefits” International Journal of
Quality and Reliability Management, 14 (9), 936-947
Clougherty, J.A. and M. Grajek, 2008, “The Impact of ISO 9000 Diffusion on Trade and FDI: A
New Institutional Analysis” Journal of International Business Studies, 39 (4), 613-633
Cole, Robert, 1999, Managing quality Fads, Oxford University Press, New York
Corbett, Charles J., María J. Montes-Sancho, and David A. Kirsch, 2005, “The Financial Impact
of ISO 9000 Certification in the United States: An Empirical Analysis” Management Science,
51 (7), 1046-1059
De Loecker, Jan, 2007 “Do Exports Generate Higher Productivity? Evidence from Slovenia”
Journal of International Economics, 73: 69–98
Guler, Isin, Mauro F. Guillen, and John Muir Macpherson, 2002, “Global Competitions, and the
Diffusion of Organizational Practices: The International Spread of ISO 9000 Quality
Certificates” Administrative Science Quarterly, 47 (2), 207-232
International Organization for Standardization (ISO), 2011, “The ISO Surveys of Certifications
2010” http://www.iso.org/iso/iso-survey2010.pdf, Geneva
24
International Organization for Standardization (ISO), 2009, “The ISO Survey - 2008”
http://www.iso.org/iso/survey2008.pdf , Geneva
International Organization for Standardization (ISO), 2001, “The ISO Survey of ISO 9000 and
ISO 14000 Certificates – Tenth cycle” http://www.iso.org/iso/survey10thcycle.pdf, Geneva
Javorcik Beata S. 2004. “Does Foreign Direct Investment Increase the Productivity of Domestic
Firms? In Search of Spillovers through Backward Linkages” American Economic Review,
94(3), 605-627
Javorcik, Beata S. and Mariana Spatareanu, 2008. “To Share or Not to Share: Does Local
Participation Matter for Spillovers from FDI?” Journal of Development Economics, 85(1-2),
194-217
Javorcik, Beata S. and Mariana Spatareanu, 2009. “Tough Love: Do Czech Suppliers Learn from
Their Relationships with Multinationals?” Scandinavian Journal of Economics, 85(1-2), 194-
217
Kim, S.J. and K.A. Reinert, 2009, “Standards and Institutional Capacity: An Examination of
Trade in Food and Agricultural Products” International Trade Journal, 23 (1), 54-77
Svejnar, Jan, 2002, “Transition Economies: Performance and Challenges” Journal of Economic
Perspectives, 16 (1), 3-28
Terlaak, Ann and Andrew A. King, 2006, “The effect of certification with the ISO 9000 Quality
Management System Standard: A Signaling Approach” Journal of Economic Behavior and
Organization, 60 (4), 579-602
Trefler, Daniel, 2004, “The Long and Short of the Canada-U.S. Free Trade Agreement”
American Economic Review 94(4): 870-895
Van Biesebroeck, Johannes, 2005, “Exporting Raises Productivity in Sub-Saharan African
Manufacturing Firms” Journal of International Economics, 67, 373–391
25
Appendix
Table A1: Summary Statistics Variables No. of obs. Mean Std dev
ISO certification dummy 194,750 0.003 0.054
ln (sales) 194,750 10.252 2.204
ln (exports) 54,001 9.363 2.472
Exporter dummy 194,750 0.277 0.448
ln (labor productivity) 194,750 6.892 3.827
ln (employment) 194,750 1.545 1.110
ln (average wage) 194,750 7.061 1.045
ln (profit) 194,750 1.790 7.411
ln (profitability) 192,089 -0.048 0.348
ln (labor cost) 194,750 8.599 1.800
Table A2: Estimating Propensity Score
ln (sales t-1) 0.085***
(0.022)
ln (exports t-1) 0.020***
(0.004)
ln (employment t-1) -0.109**
(0.055)
ln (total labor cost t-1) 0.295***
(0.052)
ln (average wage t-1) -0.023
(0.050)
ln (labor productivity t-1) 0.017
(0.012)
ln (profit t-1) 0.012***
(0.003)
ln (profitability t-1) 0.089
(0.180)
Services sector -0.242***
(0.040)
Time trend 0.046***
(0.009)
No. of observations 151,723
LR Chi2 1704.06
Probability > Chi2 0.000
Pseudo R2 0.2463 Notes: Standard errors are reported in parentheses.
*, **, *** indicate statistical significance at the 10, 5 and
1% level, respectively.
26
Table A3: Balancing Test
(t-test on the matched sample)
Mean Mean
Treated Control t-test p-value No. of obs.
ln (sales t-1) 13.680 13.560 -2.2330 0.0265 234
ln (exports t-1) 12.175 12.048 -0.7589 0.4489 179
ln (employment t-1) 4.157 4.079 -1.1668 0.2445 234
ln (average wage t-1) 7.561 7.587 0.5887 0.5566 234
ln (labor productivity t-1) 8.222 8.343 1.0692 0.2861 234
ln (profit t-1) 5.242 5.266 0.0315 0.9749 234
ln (profitability t-1) 0.028 0.021 -0.8593 0.3911 234 Note: The number of observations for exports is smaller as non-exporters drop out from the sample due to logs
being taken.
Table A4: Impact of an ISO 9000 Certification on Investment and Capital Intensity
Positive investment (indicator variable)
Pre-certification
year
Certification
year(a)
One year
later(b)
Two years
later
Three years
later
Treatment group 0.500 0.671 0.658 0.560 0.517
Control group 0.427 0.573 0.534 0.543 0.453
ATT 0.026 0.051 -0.056 -0.009
(0.058) (0.069) (0.045) (0.070)
No. of matched pairs 234 234 234 234
ln (Change in Fixed Assets)
Pre-certification
year
Certification
year(a)
One year
later(b)
Two years
later
Three years
later
Treatment group 2.89 2.89 3.51 2.52 0.526
Control group 0.88 1.91 1.43 1.10 -1.70
ATT -0.185 0.070 -0.596 0.217
(1.429) (1.402) (1.302) (1.740)
No. of matched pairs 184 184 184 184
ln (Fixed Assets/Employment)
Pre-certification
year
Certification
year(a)
One year
later(b)
Two years
later
Three years
later
Treatment group 8.40 8.54 8.62 8.65 8.69
Control group 8.40 8.52 8.63 8.74 8.80
ATT 0.0197 -0.0157 -0.0904 -0.1146
(0.060) (0.085) (0.072) (0.087)
No. of matched pairs 234 234 234 234
27
Table A5: Impact of an ISO 9000 Certification on Firm Outcomes: Considering Two Sub-periods
Until 1997 From 1998 on
Certification
year One year later
Two years
later
Three years
later
Certification
year One year later
Two years
later
Three years
later
ln (Sales) 0.030 0.078 0.145* 0.291** 0.110** 0.210*** 0.308*** 0.392***
(0.048) (0.063) (0.078) (0.114) (0.050) (0.055) (0.080) (0.090)
No. of matched pairs 81 81 81 81 153 153 153 153
Exporter dummy 0.0123 0.0370 0.0741* 0.0494 0.000 0.072* 0.092* 0.092*
(0.035) (0.034) (0.043) (0.043) (0.032) (0.040) (0.050) (0.051)
No. of matched pairs 81 81 81 81 153 153 153 153
ln (Exports) 0.200 0.504 0.614 0.724 0.066 1.093** 1.178*** 1.012**
(0.381) (0.416) (0.507) (0.452) (0.358) (0.514) (0.433) (0.458)
No. of matched pairs 71 71 71 71 108 108 108 108
ln (Employment) -0.004 0.046 0.054 0.101 0.076*** 0.141*** 0.176*** 0.241***
(0.040) (0.060) (0.072) (0.095) (0.029) (0.039) (0.043) (0.067)
No. of matched pairs 81 81 81 81 153 153 153 153
ln (Labor productivity)
-0.019 0.083 0.486 0.538 0.253 0.180 0.387* 0.548**
(0.125) (0.261) (0.497) (0.417) (0.227) (0.139) (0.216) (0.229)
No. of matched pairs 81 81 81 81 153 153 153 153
ln (Wage
bill/Employment)
0.014 0.015 0.014 0.052 0.045 0.078 0.088 0.089
(0.030) (0.037) (0.052) (0.052) (0.037) (0.053) (0.058) (0.056)
No. of matched pairs 81 81 81 81 153 153 153 153
ln (Profits) 1.397 0.960 6.794*** 6.739*** 0.268 0.030 2.493*** 1.249
(1.372) (1.613) (2.080) (2.048) (1.064) (1.158) (0.926) (1.252)
No. of matched pairs 81 81 81 81 153 153 153 153
ln (Profits/Sales) 0.0030 0.0119 0.0560*** 0.0900*** -0.0027 -0.0068 0.0116 0.0206
(0.0112) (0.0159) (0.0192) (0.0330) (0.0119) (0.0170) (0.0199) (0.0216)
No. of matched pairs 81 81 81 81 153 153 153 153
The table presents the Average Treatment Effect on the Treated with the bootstrapped standard errors reported in parentheses below. *, **, *** indicate statistical significance at the 10, 5 and
1% level, respectively.