Amiti and Smarzynska Javorcik (2008)_Trade Cost and Location of Foreign Firms in China
21
Trade costs and location of foreign firms in China Mary Amiti a, ⁎ , Beata Smarzynska Javorcik b,1 a Federal Reserve Bank of New York, 33 Liberty Street, New York, NY 10045, United States b The World Bank, 1818 H Street, N.W., MSN MC3-303, Washington, DC 20433, United States Received 10 March 2005; received in revised form 16 March 2006; accepted 10 June 2006 Abstract This study examines the determinants of entry by foreign firms, using information on 515 Chinese industries at the provincial level during 1998 –2001. The analysis is based on new economic geography theory and thus focuses on market and supplier access within and outside the province of entry, as well as production and trade costs. The results indicate that market and supplier access are the most important factors affecting foreign entry. Access to markets and suppliers in the province of entry matters more than access to the rest of China, which is consistent with market fragmentation due to underdeveloped transport infrastructure and informal trade barriers. © 2006 Elsevier B.V. All rights reserved. JEL classification: F1; F23 Keywords: Foreign direct investment; Trade costs; Market access; Supplier access 1. Introduction Governments all over the world spend large sums of money to entice foreign direct investment (FDI), usuall y off eri ng generous tax incenti ves. It is oft en expected that for eign firms will generate positi ve ext ernali ties on domest ic firms, par ticular ly in developing countr ies. For example, Javor cik (2004) provides evi dence consist ent wit h the exi stence of positi ve int er- industry spillovers from foreign firms in Lithuania. However, the evidence on the success of tax incentives in attracting FDI is rather mixed (see Desai et al., 2004), which raises the question of what factors in fact influence where foreign firms locate. Journal of Development Economics 85 (2008) 129 –149 www.elsevier.com/locate/econbase ⁎ Corresponding author. Tel.: +1 212 720 6396. E-mail addresses: [email protected] (M. Amiti), bjavorcik@wor ldbank.org (B. Smarzynska Javorcik). 1 Tel.: +1 202 458 8485. 0304-3878/$ - see front matter © 2006 Elsevier B.V. All rights reserved. doi:10.1016/j.jdeveco.2006.06.001
-
Upload
tan-jiunn-woei -
Category
Documents
-
view
221 -
download
0
Transcript of Amiti and Smarzynska Javorcik (2008)_Trade Cost and Location of Foreign Firms in China

7/26/2019 Amiti and Smarzynska Javorcik (2008)_Trade Cost and Location of Foreign Firms in China
http://slidepdf.com/reader/full/amiti-and-smarzynska-javorcik-2008trade-cost-and-location-of-foreign-firms 1/21
Trade costs and location of foreign firms in China
Mary Amiti a,⁎, Beata Smarzynska Javorcik b,1
a Federal Reserve Bank of New York, 33 Liberty Street, New York, NY 10045, United States b The World Bank, 1818 H Street, N.W., MSN MC3-303, Washington, DC 20433, United States
Received 10 March 2005; received in revised form 16 March 2006; accepted 10 June 2006
Abstract
This study examines the determinants of entry by foreign firms, using information on 515 Chinese
industries at the provincial level during 1998–2001. The analysis is based on new economic geography
theory and thus focuses on market and supplier access within and outside the province of entry, as well as
production and trade costs. The results indicate that market and supplier access are the most important
factors affecting foreign entry. Access to markets and suppliers in the province of entry matters more than
access to the rest of China, which is consistent with market fragmentation due to underdeveloped transport infrastructure and informal trade barriers.
© 2006 Elsevier B.V. All rights reserved.
JEL classification: F1; F23
Keywords: Foreign direct investment; Trade costs; Market access; Supplier access
1. Introduction
Governments all over the world spend large sums of money to entice foreign direct investment (FDI), usually offering generous tax incentives. It is often expected that foreign firms will
generate positive externalities on domestic firms, particularly in developing countries. For
example, Javorcik (2004) provides evidence consistent with the existence of positive inter-
industry spillovers from foreign firms in Lithuania. However, the evidence on the success of tax
incentives in attracting FDI is rather mixed (see Desai et al., 2004), which raises the question of
what factors in fact influence where foreign firms locate.
Journal of Development Economics 85 (2008) 129–149
www.elsevier.com/locate/econbase
⁎ Corresponding author. Tel.: +1 212 720 6396.
E-mail addresses: [email protected] (M. Amiti), [email protected] (B. Smarzynska Javorcik).1 Tel.: +1 202 458 8485.
0304-3878/$ - see front matter © 2006 Elsevier B.V. All rights reserved.
doi:10.1016/j.jdeveco.2006.06.001

7/26/2019 Amiti and Smarzynska Javorcik (2008)_Trade Cost and Location of Foreign Firms in China
http://slidepdf.com/reader/full/amiti-and-smarzynska-javorcik-2008trade-cost-and-location-of-foreign-firms 2/21
New economic geography theories on firm location emphasize a tension between production
costs and access to large final goods markets and input suppliers. Krugman and Venables (1995)
and Markusen and Venables (1998, 2000) show that while market size is an important
consideration for firms, the larger the market is, the higher is the cost of immobile factors. And therelative strength of these factors in determining location depends critically on trade costs.
Building on these predictions, this study examines the relative importance of market access,
supplier access, trade costs and factor costs for the entry of foreign firms into China.
While FDI determinants have been analyzed extensively (for example, see Caves, 1982;
Markusen, 1995), little attention has been paid to the new economic geography aspects of the
investment decision.2 Notable exceptions are studies by Head and Mayer (2004) and Head and
Ries (1996). The former study focuses on market access and finds a positive correlation between
entry of Japanese firms into the European Union (EU) and market potential measures. The latter
study takes into account market and supplier access as determinants of foreign entry into China,
but does not incorporate any spatial aspects.3
Our analysis extends the literature in several dimensions. First, we consider the importance of both
market and supplier access in determining foreign entry, taking into account spatial aspects. We allow
for the possibility that firms purchase inputs not only from within their own province, but also from
other provinces within China. Second, our measures of market and supplier access take into account
the varying degrees of inter-industry linkages. For example, proximity to a steel plant is likely to be
more valuable to a car producer than a textile manufacturer. Third, by incorporating all the key factors
highlighted in the new economic geography literature, we are able to provide an assessment of the
relative importance of production costs and market size effects in attracting new entry.
China is a particularly interesting country in which to analyze FDI flows. It was among the top
FDI recipients in the world during the period under study, receiving US$165 billion of direct investment flows between 1998 and 2001.4 With over 90% of foreign investment going to the
coastal regions, the influx of FDI has widened regional disparities between coastal and central
regions within China.5 By providing an assessment of the importance of market size relative to
production costs, this study provides some guidance on the kinds of policy instruments that would
be most successful in attracting FDI to disadvantaged regions. Our study also sheds some light on
the economic impact of inter-provincial barriers to trade. Evidence suggesting that local
governments in China are erecting provincial trade barriers to protect industries from competition
is provided in Kumar (1994) and Young (2000).6 Unfortunately, it is not possible to directly
measure such barriers. As it is illegal to impose trade restrictions, the measures adopted to protect
2 Other aspects of new economic geography have been addressed in the empirical literature. The relationship between
wages and market potential was studied in a seminal paper by Hanson (2005). Building on Hanson's work, Redding and
Venables (2004) and Amiti and Cameron (in press) related wages to both market access and supplier access measures.
The home market effect was examined by Davis and Weinstein (1999, 2003), Feenstra et al. (2001), Head and Ries
(1991), and Hanson and Xiang (2004). All of these studies found results consistent with theory, however, none of them
analyzed the link between foreign entry decision and new economic geography variables.3 Head and Ries (1996) assume that firms buy all their inputs locally and they do not distinguish in their analysis
between various degrees of input availability in different industries.4 See World Investment Report, 2002, Annex Table B3.5 See Amiti and Wen (2001) for a discussion on regional inequality in China.6 This is also consistent with anecdotal evidence. For instance, a manager of a medical manufacturing plant reported
that the shipments to other provinces are occasionally stopped by local rail officials for 2 to 4 weeks for no apparent
reason. The administrative units of industry and commerce department were reportedly obstructing access to markets
through audits or local registration requirements. This information is drawn from unpublished interviews with firms and
government officials in five different provinces conducted by Amiti as part of a World Bank mission in October 2001.
130 M. Amiti, B. Smarzynska Javorcik / Journal of Development Economics 85 (2008) 129 – 149

7/26/2019 Amiti and Smarzynska Javorcik (2008)_Trade Cost and Location of Foreign Firms in China
http://slidepdf.com/reader/full/amiti-and-smarzynska-javorcik-2008trade-cost-and-location-of-foreign-firms 3/21
local industries from competition are usually more subtle than a direct border tax. Thus the only
way to assess the significance of such barriers is indirectly, as is the case in our study. 7
Our analysis is based on a comprehensive data set that covers nearly all manufacturing
industries at a highly disaggregated level (515 industries) in 29 Chinese provinces during the period 1998–2001.8 Using the information on the value of output by industry and province, the
national input/output table and inter-provincial distances we construct measures of market access
and supplier access, which we relate to the change in the number of foreign firms in each province
and industry. We also control for a variety of provincial characteristics: proxies for trade costs
include transport infrastructure, and proxies for production costs include provincial wages and
electricity prices. We consider separately market access and supplier access within and outside the
province of foreign entry. A lower magnitude of the coefficients pertaining to trade outside the
province of entry relative to trade within the province would suggest that the internal trade barriers
may be restricting access of foreign investors to suppliers and customers in other provinces.
The results indicate that market access and supplier access are the most important factorsaffecting FDI inflows. Increasing supplier access by one standard deviation is associated with a
20% increase in entry of foreign firms, and increasing market access by one standard deviation is
associated with a 13% increase. Further, the presence of customers and suppliers in the province
of entry matters much more than market and supplier access to the rest of China, which is
consistent with the presence of inter-provincial barriers to trade. The analysis also suggests that
the availability of infrastructure is positively correlated with foreign entry. Although production
costs also play a significant role in determining the location of foreign investment, the magnitude
of these effects is around a quarter of that of the market and supplier access effects. An increase of
wages or electricity prices by one standard deviation reduces entry of foreign firms by between
2% and 4%, respectively. Thus, our results suggest that local governments may do well byreducing inter-provincial barriers, and hence increasing the extent of market and supplier access
in surrounding provinces in order to attract foreign investment.
The rest of the paper is organized as follows. Section 2 develops the formal model. Section 3
provides background information on China and details of the data sources. Section 4 presents the
results, and Section 5 concludes.
2. Theory
We derive our estimating equation from a new economic geography model, based on Krugman
and Venables (1995).9 Firms are assumed to compete in a monopolistically competitiveenvironment, with each firm producing a differentiated variety. We model China as consisting of
P provinces, with profits of a single representative firm in industry i in province p given by
pi p ¼ pi
p xi p−wai
p r bi
p ju
ð P u pÞlui
½ci xi p− F i: ð2:1Þ
7 A number of researchers have tried to estimate the size of these provincial trade barriers using indirect measures (see
Poncet, 2003, 2005; Naughton, 2003; Huang and Wei, 2002; Bai et al., 2004). Although there is some disagreement about
the direction of change in these barriers, none of the studies deny the existence of provincial border barriers in China.8 Other studies on the determinants of FDI in China rely either on information on provincial FDI stocks (Cheng and
Kwan, 2000) or on the Almanac of China's Foreign Economic Relations and Trade which lists entry of individual firms
(Head and Ries, 1996; Dean et al., 2002). The latter data set is, however, limited in coverage as it includes only about
10% of new foreign firms, focuses exclusively on joint ventures and stopped being published in 1996.9 We also extend it to incorporate more than one factor of production as in Amiti (2005).
131 M. Amiti, B. Smarzynska Javorcik / Journal of Development Economics 85 (2008) 129 – 149
7/26/2019 Amiti and Smarzynska Javorcik (2008)_Trade Cost and Location of Foreign Firms in China
http://slidepdf.com/reader/full/amiti-and-smarzynska-javorcik-2008trade-cost-and-location-of-foreign-firms 4/21
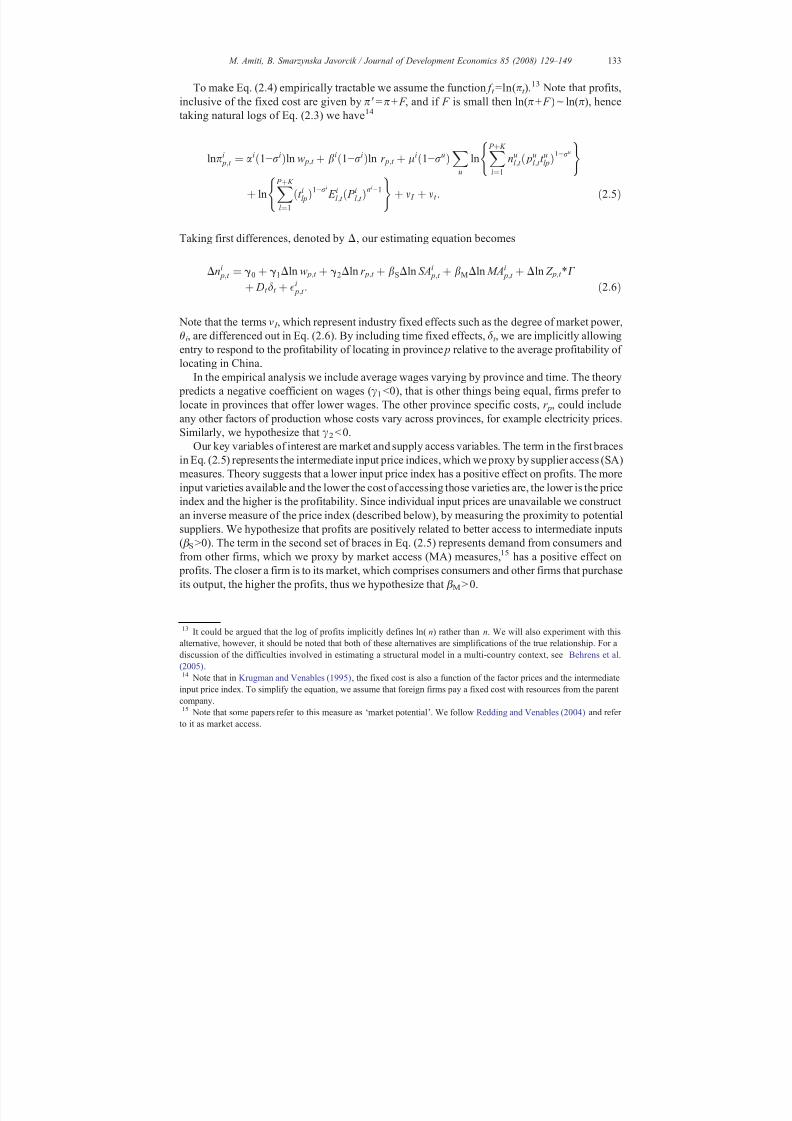
The total cost function comprises a fixed cost, F , a variable cost, ci, which can be omitted by
appropriate choice of units for measuring output, x pi ; and factor prices, where w p is the wage and
r p is the price of capital or any other factor of production in province p, and P pu is the intermediate
input price index of each upstream industry u that supplies inputs to industry i. It is defined as
P u p ¼X P
l ¼1
nul ð p
ul t
ulpÞ1−ru
" # 11−ru
; ð2:2Þ
assuming that all n varieties of industry u products enter symmetrically. The transport cost, t lpu of
shipping a good from province l to p is modelled as Samuelsonian iceberg costs, where t ≥1 units
must be shipped to deliver one unit of a good.
Expenditure, E l i, on industry i output produced in province p, x p
i , comes from consumers and
firms located within province p, from other provinces within China, and from the rest of theworld, which consists of K countries. Summing across all locations within China and the rest of
the world, setting demand equal to supply, and substituting in the product market clearing
condition and the profit maximizing price into the profit function (2.1) gives
pi p ¼ wai
p r bi
p ju
ð P u pÞlui
1−ri
ðhi−1ÞðhiÞ1−ri X P þ K
l ¼1
ðt i pl Þ1−ri
E il ð P il Þri−1
( )" #− F : ð2:3Þ
The mark-up over marginal cost, θi, depends on the elasticity of substitution, hi ¼ ri
ri1. It is
assumed that there is free entry and exit of firms and instantaneous adjustment, thus we set Eq.
(2.3) equal to zero.10 This implicitly defines the optimal number of firms in each industry in each
province, so n p,t i = f t (π p,t
i ), for each period t . Taking first differences,
Dni p;t ¼ ni
p;t −ni p;t −1 ¼ f t ðp
i p;t Þ− f t −1ðpi
p;t −1Þ: ð2:4Þ
Given the nonlinearities in Eq. (2.3), it is not possible to get an explicit reduced form solution for
the equilibrium number of firms in each period. However, if there is an exogenous change in a
variable, such as trade costs, that affects the profits of incumbent firms, this leads to further entry
or exit until profits are driven to zero.
An increase in the number of firms in province p bids up the wage rate as we assume a fixedlabor force in each province. Our assumption that workers are immobile between provinces and
mobile between industries within a province means that we are treating each province
analogously to a country in the theoretical model. This assumption is a reasonable approximation
in China, given the hukou system.11 Further, we assume that the number of entrants in each
industry i in each province p is too small relative to the total province size to affect the wage so
new entrants in each industry take the provincial wage as given.12
10 However, in the empirical specification we allow for adjustment that is not instantaneous, as for example in the
presence of barriers to entry. In this case we could suppose that firms enter the most profitable industry/province first,
hence entry would be a function of profits in each industry/province relative to some benchmark, say, average for China.
The results are not sensitive with respect to either the assumption of free or costly entry and exit.11 The hukou is a system of residence permits that regulates the movement of labor. Adding labor mobility would
complicate the model without changing the hypotheses. See Puga (1999).12 We will examine the robustness of our results with respect to this assumption.
132 M. Amiti, B. Smarzynska Javorcik / Journal of Development Economics 85 (2008) 129 – 149
7/26/2019 Amiti and Smarzynska Javorcik (2008)_Trade Cost and Location of Foreign Firms in China
http://slidepdf.com/reader/full/amiti-and-smarzynska-javorcik-2008trade-cost-and-location-of-foreign-firms 5/21
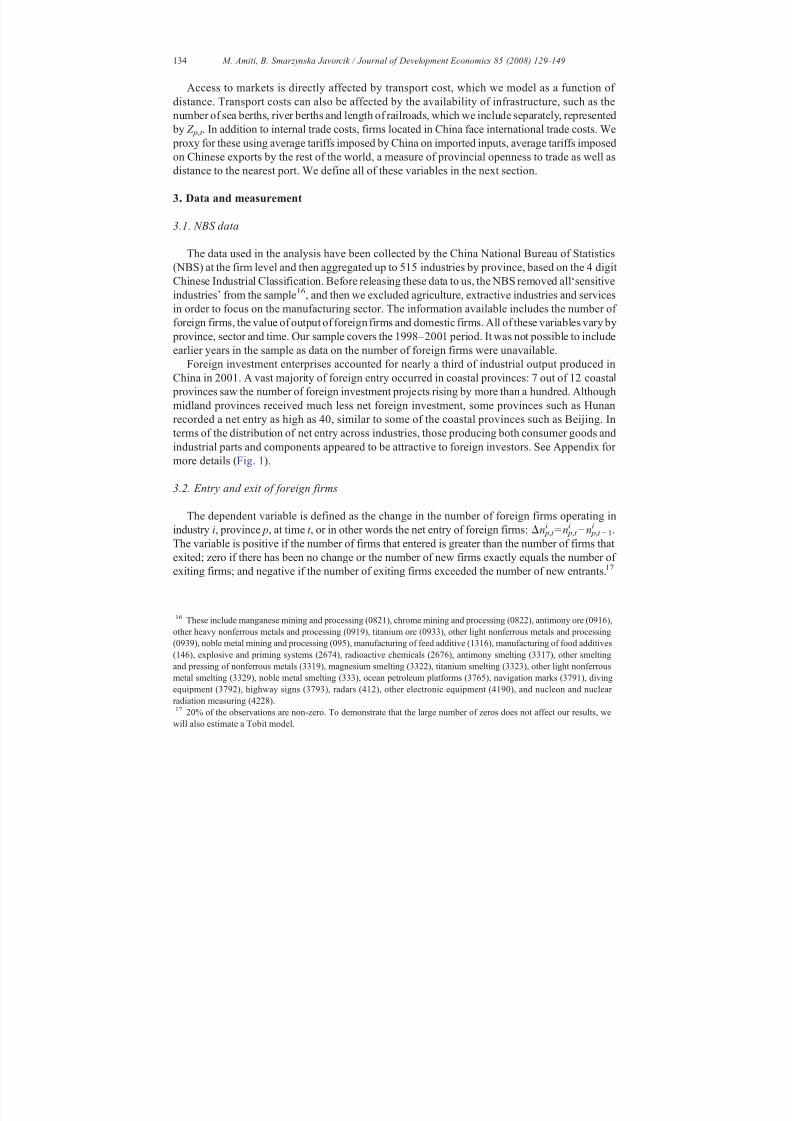
To make Eq. (2.4) empirically tractable we assume the function f t =ln(πt ).13 Note that profits,
inclusive of the fixed cost are given by π′=π+ F , and if F is small then ln(π+ F )≃ ln(π), hence
taking natural logs of Eq. (2.3) we have14
lnpi p;t ¼ aið1−riÞln w p;t þ bið1−riÞln r p;t þ lið1−ruÞ
Xu
lnX P þ K
l ¼1
nul ;t ð pu
l ;t t ulpÞ1−ru
( )
þ lnX P þ K
l ¼1
ðt ilpÞ1−ri
E il ;t ð P il ;t Þri−1
( )þ m I þ mt : ð2:5Þ
Taking first differences, denoted by Δ, our estimating equation becomes
Dni p;t ¼ g0 þ g1Dln w p;t þ g2Dln r p;t þ bSDln SAi p;t þ bMDln MAi p;t þ Dln Z p;t 4Cþ Dt dt þ
i p;t : ð2:6Þ
Note that the terms ν I , which represent industry fixed effects such as the degree of market power,
θi, are differenced out in Eq. (2.6). By including time fixed effects, δt , we are implicitly allowing
entry to respond to the profitability of locating in province p relative to the average profitability of
locating in China.
In the empirical analysis we include average wages varying by province and time. The theory
predicts a negative coefficient on wages (γ1<0), that is other things being equal, firms prefer to
locate in provinces that offer lower wages. The other province specific costs, r p, could includeany other factors of production whose costs vary across provinces, for example electricity prices.
Similarly, we hypothesize that γ2< 0.
Our key variables of interest are market and supply access variables. The term in the first braces
in Eq. (2.5) represents the intermediate input price indices, which we proxy by supplier access (SA)
measures. Theory suggests that a lower input price index has a positive effect on profits. The more
input varieties available and the lower the cost of accessing those varieties are, the lower is the price
index and the higher is the profitability. Since individual input prices are unavailable we construct
an inverse measure of the price index (described below), by measuring the proximity to potential
suppliers. We hypothesize that profits are positively related to better access to intermediate inputs
(β S>0). The term in the second set of braces in Eq. (2.5) represents demand from consumers andfrom other firms, which we proxy by market access (MA) measures,15 has a positive effect on
profits. The closer a firm is to its market, which comprises consumers and other firms that purchase
its output, the higher the profits, thus we hypothesize that β M> 0.
13 It could be argued that the log of profits implicitly defines ln( n) rather than n. We will also experiment with this
alternative, however, it should be noted that both of these alternatives are simplifications of the true relationship. For a
discussion of the difficulties involved in estimating a structural model in a multi-country context, see Behrens et al.
(2005).14 Note that in Krugman and Venables (1995), the fixed cost is also a function of the factor prices and the intermediate
input price index. To simplify the equation, we assume that foreign firms pay a fixed cost with resources from the parent
company.15 Note that some papers refer to this measure as ‘market potential’. We follow Redding and Venables (2004) and refer
to it as market access.
133 M. Amiti, B. Smarzynska Javorcik / Journal of Development Economics 85 (2008) 129 – 149
7/26/2019 Amiti and Smarzynska Javorcik (2008)_Trade Cost and Location of Foreign Firms in China
http://slidepdf.com/reader/full/amiti-and-smarzynska-javorcik-2008trade-cost-and-location-of-foreign-firms 6/21
Access to markets is directly affected by transport cost, which we model as a function of
distance. Transport costs can also be affected by the availability of infrastructure, such as the
number of sea berths, river berths and length of railroads, which we include separately, represented
by Z p,t . In addition to internal trade costs, firms located in China face international trade costs. We proxy for these using average tariffs imposed by China on imported inputs, average tariffs imposed
on Chinese exports by the rest of the world, a measure of provincial openness to trade as well as
distance to the nearest port. We define all of these variables in the next section.
3. Data and measurement
3.1. NBS data
The data used in the analysis have been collected by the China National Bureau of Statistics
(NBS) at the firm level and then aggregated up to 515 industries by province, based on the 4 digit Chinese Industrial Classification. Before releasing these data to us, the NBS removed all ‘sensitive
industries’ from the sample16, and then we excluded agriculture, extractive industries and services
in order to focus on the manufacturing sector. The information available includes the number of
foreign firms, the value of output of foreign firms and domestic firms. All of these variables vary by
province, sector and time. Our sample covers the 1998–2001 period. It was not possible to include
earlier years in the sample as data on the number of foreign firms were unavailable.
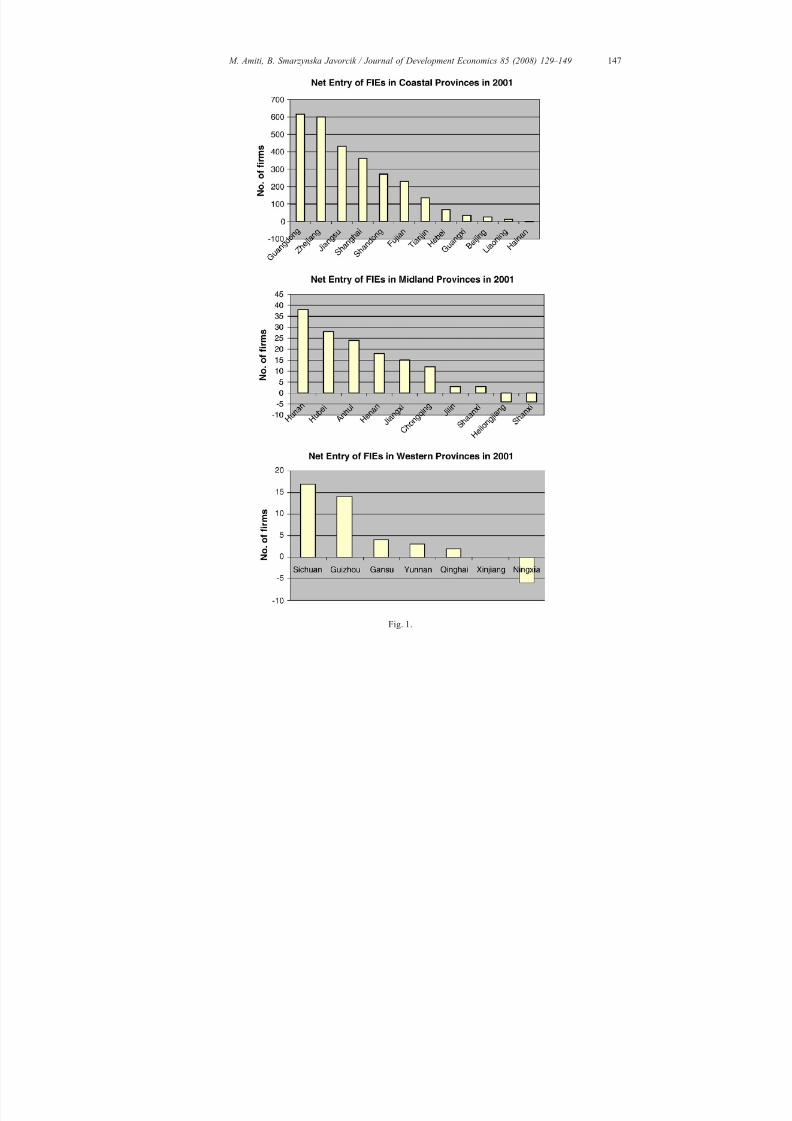
Foreign investment enterprises accounted for nearly a third of industrial output produced in
China in 2001. A vast majority of foreign entry occurred in coastal provinces: 7 out of 12 coastal
provinces saw the number of foreign investment projects rising by more than a hundred. Although
midland provinces received much less net foreign investment, some provinces such as Hunanrecorded a net entry as high as 40, similar to some of the coastal provinces such as Beijing. In
terms of the distribution of net entry across industries, those producing both consumer goods and
industrial parts and components appeared to be attractive to foreign investors. See Appendix for
more details (Fig. 1).
3.2. Entry and exit of foreign firms
The dependent variable is defined as the change in the number of foreign firms operating in
industry i, province p, at time t , or in other words the net entry of foreign firms: Δn p,t i = n p,t
i−n p,t −1
i .
The variable is positive if the number of firms that entered is greater than the number of firms that exited; zero if there has been no change or the number of new firms exactly equals the number of
exiting firms; and negative if the number of exiting firms exceeded the number of new entrants.17
16 These include manganese mining and processing (0821), chrome mining and processing (0822), antimony ore (0916),
other heavy nonferrous metals and processing (0919), titanium ore (0933), other light nonferrous metals and processing
(0939), noble metal mining and processing (095), manufacturing of feed additive (1316), manufacturing of food additives
(146), explosive and priming systems (2674), radioactive chemicals (2676), antimony smelting (3317), other smelting
and pressing of nonferrous metals (3319), magnesium smelting (3322), titanium smelting (3323), other light nonferrous
metal smelting (3329), noble metal smelting (333), ocean petroleum platforms (3765), navigation marks (3791), diving
equipment (3792), highway signs (3793), radars (412), other electronic equipment (4190), and nucleon and nuclear
radiation measuring (4228).17 20% of the observations are non-zero. To demonstrate that the large number of zeros does not affect our results, we
will also estimate a Tobit model.
134 M. Amiti, B. Smarzynska Javorcik / Journal of Development Economics 85 (2008) 129 – 149

7/26/2019 Amiti and Smarzynska Javorcik (2008)_Trade Cost and Location of Foreign Firms in China
http://slidepdf.com/reader/full/amiti-and-smarzynska-javorcik-2008trade-cost-and-location-of-foreign-firms 7/21
3.3. Market and supplier access
The size of the market crucially depends on trade costs. Firms sell their output within their
province, to other provinces and to the rest of the world. Similarly, firms buy inputs from withintheir province, other provinces and the rest of the world. Inter-provincial demand depends on
internal trade costs, such as freight charges and provincial border barriers. Trade costs have
generally been proxied as some function of distance. The simplest approach is the inverse
distance rule as in Harris (1954). In that formulation market potential is proxied as the sum of
regional income divided by the distance to that region. As an alternative, Hanson (2005) models
the trade costs in the market potential as a function of the exponential of distance and estimates the
coefficient on distance using non-linear estimation.18 Redding and Venables (2004) use exporter
and importer dummies from a gravity equation of trade flows between different countries to proxy
for market and supplier access (inclusive of trade costs), respectively. We are unable to follow the
gravity approach because inter-provincial trade data are unavailable for China. In our specifications, we adopt the Harris approach which assumes the exponent on distance is equal
to −1.19
3.3.1. Supplier access
The supplier access effect comes through the price indices of intermediate inputs. Since
individual input prices are unavailable we approximate this effect using value of output data. Our
measure of supplier access comprises two parts: (i) inner province supply access, denoted by SA
( I ), measuring the availability of inputs within the province in which the firm is located; and (ii)
outer supply access, denoted by SA(O), measuring proximity to inputs available in other
provinces. The availability of inputs within a province that are used by industry i in province p isdefined as
SAð I Þi p;t ¼
X J
j ¼1
aij 4/ j p;t 4 D
−1 pp ; where / j
p;t ¼ Y
j p;t
Y j CHINA;t
: ð3:1Þ
The term ϕ p,t j is output of industry j produced in province p at time t , Y p,t
j , as a share of the total
output of industry j produced in China. Since industries use more than one intermediate input,
these output shares are weighted by aij , the coefficients from the China national input/output ( I / O)
table for 1997, which is the most recent I / O table available. Even though individual prices are
unavailable, the effects should still be well represented since the price index is lower the higher the share of intermediate inputs produced in close proximity. There are 68 manufacturing I / O
codes, which we concord with the industrial data. Thus, while we analyze entry for 515 industries,
our proxies for supplier access are defined for 68 I / O codes. There is variation in the supplier
access variables due to entry and exit of firms and changes in output. In order to make this
variable comparable with the proxy for input availability in other provinces we adjust it for the
within province distance, D pp, assuming the provinces are circular, as in Leamer (1997),
D pp ¼ ffiffiffiffiffiffiffiffiffiffiffiffi
Area p
p
r .
18 This coefficient indicates the geographic spread of externalities, which is not the focus of our study.19 Applying this same exponent for all industries may seem unduly restrictive given that transport costs vary by industry.
However, we found that incorporating distance elasticities that vary by industry, estimated from a gravity equation in
Berthelon and Freund (2004), does not affect our results.
135 M. Amiti, B. Smarzynska Javorcik / Journal of Development Economics 85 (2008) 129 – 149
7/26/2019 Amiti and Smarzynska Javorcik (2008)_Trade Cost and Location of Foreign Firms in China
http://slidepdf.com/reader/full/amiti-and-smarzynska-javorcik-2008trade-cost-and-location-of-foreign-firms 8/21
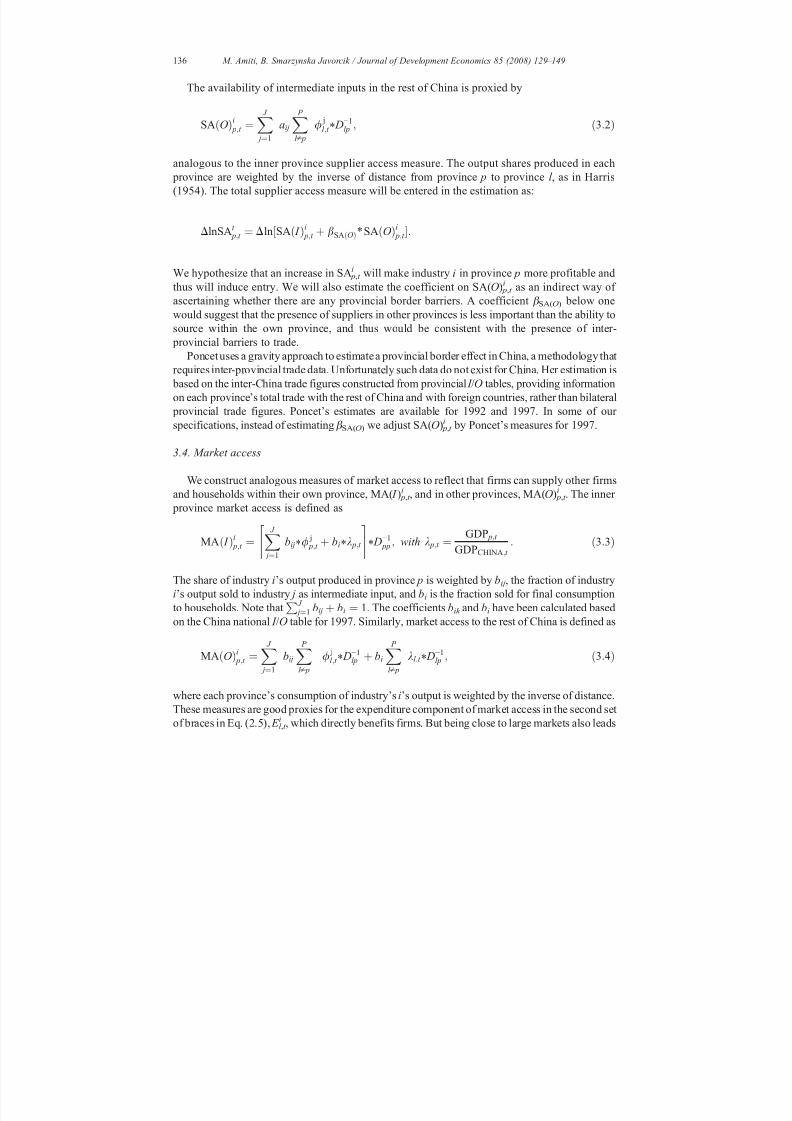
The availability of intermediate inputs in the rest of China is proxied by
SAðOÞi p;t ¼ X
J
j ¼1
aij X P
l p p
/ jl ;t 4 D
−1lp ; ð3:2Þ
analogous to the inner province supplier access measure. The output shares produced in each
province are weighted by the inverse of distance from province p to province l , as in Harris
(1954). The total supplier access measure will be entered in the estimation as:
DlnSAt p;t ¼ Dln½SAð I Þi
p;t þ bSAðOÞ4SAðOÞi p;t :
We hypothesize that an increase in SA p,t i will make industry i in province p more profitable and
thus will induce entry. We will also estimate the coefficient on SA(O) p,t i as an indirect way of
ascertaining whether there are any provincial border barriers. A coefficient β SA(O) below one
would suggest that the presence of suppliers in other provinces is less important than the ability to
source within the own province, and thus would be consistent with the presence of inter-
provincial barriers to trade.
Poncet uses a gravity approach to estimate a provincial border effect in China, a methodology that
requires inter-provincial trade data. Unfortunately such data do not exist for China. Her estimation is
based on the inter-China trade figures constructed from provincial I / O tables, providing information
on each province's total trade with the rest of China and with foreign countries, rather than bilateral
provincial trade figures. Poncet's estimates are available for 1992 and 1997. In some of our
specifications, instead of estimating β SA(O) we adjust SA(O) p,t i by Poncet's measures for 1997.
3.4. Market access
We construct analogous measures of market access to reflect that firms can supply other firms
and households within their own province, MA( I ) p,t i , and in other provinces, MA(O) p,t
i . The inner
province market access is defined as
MAð I Þi p;t ¼X J
j ¼1
bij 4/ j p;t þ bi4k p;t " #
4 D−1 pp ; with k p;t ¼ GDP p;t GDPCHINA;t
: ð3:3Þ
The share of industry i's output produced in province p is weighted by bij , the fraction of industry
i's output sold to industry j as intermediate input, and bi is the fraction sold for final consumption
to households. Note that P J
j ¼1 bij þ bi ¼ 1. The coefficients bik and bi have been calculated based
on the China national I / O table for 1997. Similarly, market access to the rest of China is defined as
MAðOÞi p;t ¼ X
J
j ¼1
bij X P
l p p
/ jl ;t 4 D
−1lp þ bi X
P
l p p
kl ;t 4 D−1lp ; ð3:4Þ
where each province's consumption of industry's i's output is weighted by the inverse of distance.
These measures are good proxies for the expenditure component of market access in the second set
of braces in Eq. (2.5), E l ,t i , which directly benefits firms. But being close to large markets also leads
136 M. Amiti, B. Smarzynska Javorcik / Journal of Development Economics 85 (2008) 129 – 149

7/26/2019 Amiti and Smarzynska Javorcik (2008)_Trade Cost and Location of Foreign Firms in China
http://slidepdf.com/reader/full/amiti-and-smarzynska-javorcik-2008trade-cost-and-location-of-foreign-firms 9/21
to a competition effect, via the price index ( P l ,t i )σ
i−1 in Eq. (2.5). The lower the price of substitute
goods, the lower the demand for that firm's output. In robustness checks, we include the consumer
price index by province and time to take account of this competition effect. Ideally, this measure
would be industry specific but price indices by province at this level are unavailable.
20
In our basic specification, the total market access measure will be entered as
DlnMAt p;t ¼ Dln½MAð I Þi
p;t þ bMAðOÞ4MAðOÞi p;t :
We hypothesize that profits are increasing in market access, and we estimate the coefficient
β MA(O) as an indirect way of ascertaining the existence of provincial border barriers. If β MA(O)<
1 this implies the existence of provincial border barriers or differences in provincial transport and
distribution networks. Note that it is possible for β MA(O) to differ from β SA(O) since provincial
governments may not necessarily protect all goods in the same way.
3.5. International trade
Treating international demand and supply in the same way as their domestic counterparts
would require detailed production and trade data for all countries that trade or could potentially
trade with China. These data are unavailable at a sufficiently disaggregated level so instead we
add a number of controls to proxy for international trade costs.
The cost of accessing intermediate inputs from the rest of the world is proxied by trade
weighted tariffs imposed by China on imported intermediate inputs, weighted by the I / O
coefficient aij , to reflect that the relative importance of inputs varies by industry,
inverse china tariff it ¼XJ
j¼1
aij * ð1 þ tariffs CHINA;t j
Þ−1: ð3:5Þ
The information on trade weighted tariffs on products corresponding to the I / O codes comes from
the World Bank's WITS database. It should be noted that many industries in China have access to
duty free intermediate inputs through duty drawbacks and hence would not be affected by tariffs
on intermediate inputs. Nonetheless, there are many industries that do pay these tariffs and thus it
is important to include this variable in the estimation.21
Similarly, the cost of exporting goods abroad is proxied by
inverse world tariff it ¼ 1 þ 1
K
XK
k ¼1
tariff ik ;t
!−1
; ð3:6Þ
where tariff k ,t i is the trade weighted tariff imposed on Chinese exports of good i to country k at time t .
Thus this variable captures the average tariff faced by Chinese exports of good i in the world. We also
include a measure of the degree of openness of a province, defined as the share of provincial imports
and exports to GDP, constructed using international trade data from the Chinese Customs Office.
21 Approximately 40% of imports are subject to tariffs.
20 In other studies, such as Redding and Venables (2004), this effect is incorporated in the exporter dummies from the
gravity equation. Head and Mayer (2004) compare results obtained using exporter and importer dummies with the more
simple Harris formulation and conclude that Harris' assumption of an inverse rule is a rough but reasonable
approximation and ‘outperforms’ the alternative. Hanson (2005) uses the housing stock and wages at the US county level
to proxy for the price index, and he finds that this approach results in a lower coefficient on market potential but a higher
coefficient on distance and provides a better fit than the Harris specification.
137 M. Amiti, B. Smarzynska Javorcik / Journal of Development Economics 85 (2008) 129 – 149

7/26/2019 Amiti and Smarzynska Javorcik (2008)_Trade Cost and Location of Foreign Firms in China
http://slidepdf.com/reader/full/amiti-and-smarzynska-javorcik-2008trade-cost-and-location-of-foreign-firms 10/21
3.6. Provincial characteristics
In addition to using distance as a proxy for internal trade costs, we include in the estimation the
number of river and sea berths and length of railroads, reported in the China Annual StatisticalYearbooks. The production cost variables at the provincial level include electricity prices and wages
obtained from the NBS. Wages are calculated as the ratio of the total wage bill to employment by
province and year. We also control for the size of the province with population. And as another measure
of the attractiveness of a province, in some specifications we add the total number of firms at the
provincial level, lagged one period. We include all locations in China except Tibet and Inner Mongolia,
which have very little industrial activity. This gives us 29 locations comprising 25 provinces and 4
directly administered cities: Shanghai, Beijing, Tianjin and Chongqing. Table 1 provides summary
statistics of all the variables.
Table 1
Summary statistics (1998–2001)
Variable No. of observations Mean SD Min Max
(n) pt i 59,740 1.83 11.89 0.00 922.00
Δ(n) pt i 44,805 0.11 1.57 −116.00 101.00
ln(1+ n) pt i 59,740 1.42 0.79 0.00 6.83
Δln(1+ n) pt i 44,805 0.01 0.23 −2.40 2.08
MA( I ) pt i 59,740 0.0002 0.0004 0.0000 0.0057
Δln(MA( I )) pt i 44,805 −0.0133 0.1125 −2.7159 1.6639
MA(O) pt i 59,740 0.0011 0.0005 0.0001 0.0036
SA( I ) pt i 59,740 0.0002 0.0004 0.0000 0.0032
Δln(SA( I )) pt i 44,805 −0.0182 0.1201 −1.5659 1.5223
SA(O) pt i 59,740 0.0011 0.0005 0.0001 0.0043
MA(Poncet border barriers) pt i 59,740 0.0003 0.0004 0.0000 0.0059
ΔlnMA(Poncet border barriers) pt i 44,805 −0.0031 0.0490 −1.6011 0.5141
SA(Poncet border barriers) pt i 51,500 0.0003 0.0005 0.0000 0.0035
ΔlnSA(Poncet border barriers) pt i 38,625 −0.0059 0.0649 −0.6964 1.2420
ln(inv_china_tariff)t i 59,740 0.0033 0.0078 0.0001 0.0473
Δln(inv_china_tariff)t i 44,805 0.0012 0.0127 −0.1852 0.0390
ln(inv_world_tariff)t i 59,740 0.0036 0.0086 0.0001 0.0506
Δln(inv_world_tariff)t
i 44,805 −0.0052 0.0295 −0.3102 0.1969
(wage) pt 59,740 8.32 2.52 4.70 17.72
Δln(wage) pt 44,805 0.12 0.10 −0.06 0.85
(elect_price) pt 59,740 490.73 311.00 38.17 1480.07
Δln(elect_price) pt 44,805 0.01 0.04 −0.13 0.14
(population) pt 59,740 41.86 25.28 4.82 93.90
Δln(population) pt 44,805 0.0007 0.04 −0.07 0.21
(seaberths) pt 59,740 31.42 63.67 0.00 272.00
Δ(seaberths) pt 44,805 0.92 4.81 −10.00 31.00
(riverberths) pt 59,740 34.37 96.89 0.00 594.00
Δ(riverberths) pt 44,805 −9.52 57.61 −337.00 170.00
(rail) pt 59,740 1923 1161 219 5503
Δln(rail) pt 44,805 0.07 0.15 −0.20 1.02Distance_port pt 59,740 1024 1611 20 9,047
(openness) pt 59,740 0.25 0.30 0.04 1.50
Δln(openness) pt 44,805 0.04 0.20 −0.55 0.56
ln(total foreign firms) p,t − 1 44,805 5.61 1.63 1.79 9.00
138 M. Amiti, B. Smarzynska Javorcik / Journal of Development Economics 85 (2008) 129 – 149
7/26/2019 Amiti and Smarzynska Javorcik (2008)_Trade Cost and Location of Foreign Firms in China
http://slidepdf.com/reader/full/amiti-and-smarzynska-javorcik-2008trade-cost-and-location-of-foreign-firms 11/21
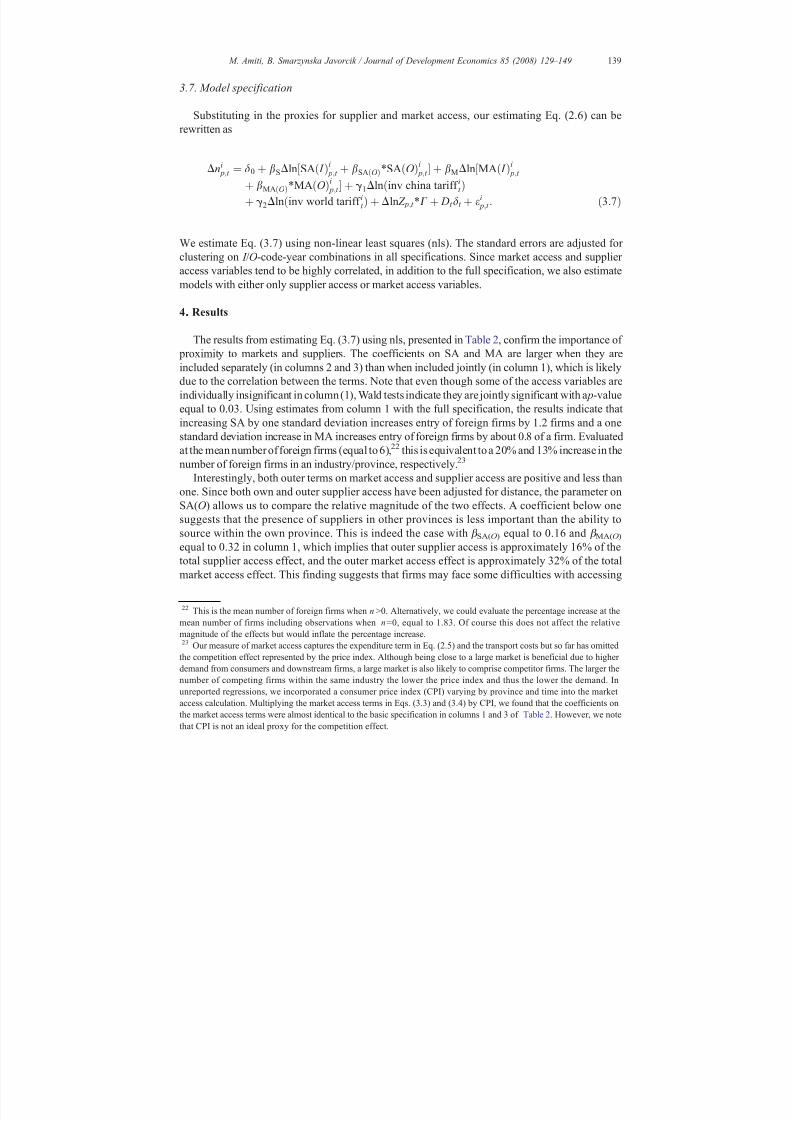
3.7. Model specification
Substituting in the proxies for supplier and market access, our estimating Eq. (2.6) can be
rewritten as
Dni p;t ¼ d0 þ bSDln½SAð I Þi
p;t þ bSAðOÞ4SAðOÞi p;t þ bMDln½MAð I Þi
p;t
þ bMAðOÞ4MAðOÞi p;t þ g1Dlnðinv china tariff it Þ
þ g2Dlnðinv world tariff it Þ þ Dln Z p;t 4C þ Dt dt þ ei p;t : ð3:7Þ
We estimate Eq. (3.7) using non-linear least squares (nls). The standard errors are adjusted for
clustering on I / O-code-year combinations in all specifications. Since market access and supplier
access variables tend to be highly correlated, in addition to the full specification, we also estimatemodels with either only supplier access or market access variables.
4. Results
The results from estimating Eq. (3.7) using nls, presented in Table 2, confirm the importance of
proximity to markets and suppliers. The coefficients on SA and MA are larger when they are
included separately (in columns 2 and 3) than when included jointly (in column 1), which is likely
due to the correlation between the terms. Note that even though some of the access variables are
individually insignificant in column (1), Wald tests indicate they are jointly significant with a p-value
equal to 0.03. Using estimates from column 1 with the full specification, the results indicate that
increasing SA by one standard deviation increases entry of foreign firms by 1.2 firms and a one
standard deviation increase in MA increases entry of foreign firms by about 0.8 of a firm. Evaluated
at the mean number of foreign firms (equal to 6),22 this is equivalent to a 20% and 13% increase in the
number of foreign firms in an industry/province, respectively.23
Interestingly, both outer terms on market access and supplier access are positive and less than
one. Since both own and outer supplier access have been adjusted for distance, the parameter on
SA(O) allows us to compare the relative magnitude of the two effects. A coefficient below one
suggests that the presence of suppliers in other provinces is less important than the ability to
source within the own province. This is indeed the case with β SA(O)
equal to 0.16 and β MA(O)
equal to 0.32 in column 1, which implies that outer supplier access is approximately 16% of the
total supplier access effect, and the outer market access effect is approximately 32% of the total
market access effect. This finding suggests that firms may face some difficulties with accessing
22 This is the mean number of foreign firms when n >0. Alternatively, we could evaluate the percentage increase at the
mean number of firms including observations when n =0, equal to 1.83. Of course this does not affect the relative
magnitude of the effects but would inflate the percentage increase.23 Our measure of market access captures the expenditure term in Eq. (2.5) and the transport costs but so far has omitted
the competition effect represented by the price index. Although being close to a large market is beneficial due to higher
demand from consumers and downstream firms, a large market is also likely to comprise competitor firms. The larger the
number of competing firms within the same industry the lower the price index and thus the lower the demand. In
unreported regressions, we incorporated a consumer price index (CPI) varying by province and time into the market
access calculation. Multiplying the market access terms in Eqs. (3.3) and (3.4) by CPI, we found that the coefficients on
the market access terms were almost identical to the basic specification in columns 1 and 3 of Table 2. However, we note
that CPI is not an ideal proxy for the competition effect.
139 M. Amiti, B. Smarzynska Javorcik / Journal of Development Economics 85 (2008) 129 – 149

7/26/2019 Amiti and Smarzynska Javorcik (2008)_Trade Cost and Location of Foreign Firms in China
http://slidepdf.com/reader/full/amiti-and-smarzynska-javorcik-2008trade-cost-and-location-of-foreign-firms 12/21
inputs and selling their products in neighboring provinces due to interprovincial barriers to trade
or differences in transport and distribution costs.
Since foreign investors may also import some of their inputs or export their output, the model
controls for the inverse of the average tariff charged on inputs used by industry i and the inverse of
the average tariff imposed by the rest of the world on China's exports of industry i. As hypothesized,
Table 2
Determinants of foreign entry
Dependent variable: Δ(n) pt i
(1) (2) (3) (4) (5) (6)Δln(SA) pt
i 1.107⁎
(0.576)
1.462⁎⁎⁎
(0.535)
0.993⁎
(0.550)
1.270⁎⁎
(0.507)
Δ(SA(O)) pt i 0.157
(0.125)
0.174⁎
(0.097)
0.144
(0.127)
0.154
(0.097)
Δln(MA) pt i 0.983
(0.797)
1.635⁎⁎
(0.701)
0.837
(0.757)
1.402⁎⁎
(0.668)
Δ(MA(O)) pt i 0.318
(0.398)
0.306
(0.216)
0.285
(0.403)
0.274
(0.216)
Δln(population) pt 1.005⁎⁎
(0.472)
1.025⁎⁎
(0.473)
0.961⁎⁎
(0.473)
0.249
(0.202)
0.246
(0.202)
0.258
(0.203)
Δln(inv_china_tariff)t i 1.122⁎⁎
(0.495)
1.109⁎⁎
(0.496)
1.097⁎⁎
(0.476)
0.578
(0.454)
0.581
(0.454)
0.521
(0.455)
Δln(inv_world_tariff)t i 0.246
(0.202)
0.247
(0.202)
0.260
(0.203)
1.119⁎⁎
(0.494)
1.101⁎⁎
(0.493)
1.065⁎⁎
(0.466)
Δln(wage) pt −0.459⁎⁎⁎
(0.086)
−0.460⁎⁎⁎
(0.086)
−0.465⁎⁎⁎
(0.087)
−0.486⁎⁎⁎
(0.090)
−0.487⁎⁎⁎
(0.090)
−0.493⁎⁎⁎
(0.090)
Δln(elect_price) pt −0.377⁎⁎
(0.183)
−0.379⁎⁎
(0.182)
−0.427⁎⁎
(0.186)
−0.272⁎
(0.165)
−0.275⁎
(0.165)
−0.312⁎
(0.168)
Δ(seaberths) pt 0.010⁎⁎⁎
(0.003)
0.010⁎⁎⁎
(0.003)
0.010⁎⁎⁎
(0.003)
0.006⁎⁎
(0.003)
0.006⁎⁎
(0.003)
0.006⁎⁎
(0.003)
Δ(riverberths) pt −0.0003⁎⁎⁎
(0.0001)
−0.0003⁎⁎⁎
(0.0001)
−0.0003⁎⁎
(0.0001)
−0.0003⁎⁎
(0.0001)
−0.0003⁎⁎
(0.0001)
−0.0003⁎⁎
(0.0001)
Δln(rail) pt 0.726
⁎⁎⁎
(0.175)0.734
⁎⁎⁎
(0.175)0.713
⁎⁎⁎
(0.176)0.746
⁎⁎⁎
(0.176)0.754
⁎⁎⁎
(0.176)0.734
⁎⁎⁎
(0.177)
ln(distance_port) p −0.092⁎⁎⁎
(0.014)
−0.092⁎⁎⁎
(0.014)
−0.092⁎⁎⁎
(0.014)
−0.046⁎⁎⁎
(0.011)
−0.045⁎⁎⁎
(0.011)
−0.043⁎⁎⁎
(0.011)
Δln(openness) pt 0.185⁎⁎⁎
(0.070)
0.188⁎⁎⁎
(0.070)
0.179⁎⁎
(0.070)
ln(total foreign
firms) p,t − 1
0.043⁎⁎⁎
(0.011)
0.044⁎⁎⁎
(0.011)
0.046⁎⁎⁎
(0.011)
Year2000 0.051⁎
(0.026)
0.048⁎
(0.026)
0.057⁎⁎
(0.026)
0.014
(0.032)
0.011
(0.032)
0.022
(0.032)
Year2001 0.062⁎⁎
(0.026)
0.059⁎⁎
(0.026)
0.070⁎⁎⁎
(0.026)
0.043⁎
(0.024)
0.039
(0.024)
0.051⁎⁎
(0.024)
H 0: All market and supplier access terms insignificant
Wald Statistic 10.86 8.61 5.47 9.76 7.81 4.52
p-value 0.03 0.01 0.06 0.04 0.02 0.10
RSS 108,323.3 108,349.9 108,393.5 108,207.5 108,229.0 108,267.7
Observations 44,805 44,805 44,805 44,805 44,805 44,805
Notes: (a)⁎ significant at 10%;⁎⁎ significant at 5%;⁎⁎⁎ significant at 1%. (b) Robust standard errorscorrected for clustering
in parentheses. (c) MA(O) and SA(O) terms enter non-linearly as in Eq. (3.7).
140 M. Amiti, B. Smarzynska Javorcik / Journal of Development Economics 85 (2008) 129 – 149
7/26/2019 Amiti and Smarzynska Javorcik (2008)_Trade Cost and Location of Foreign Firms in China
http://slidepdf.com/reader/full/amiti-and-smarzynska-javorcik-2008trade-cost-and-location-of-foreign-firms 13/21
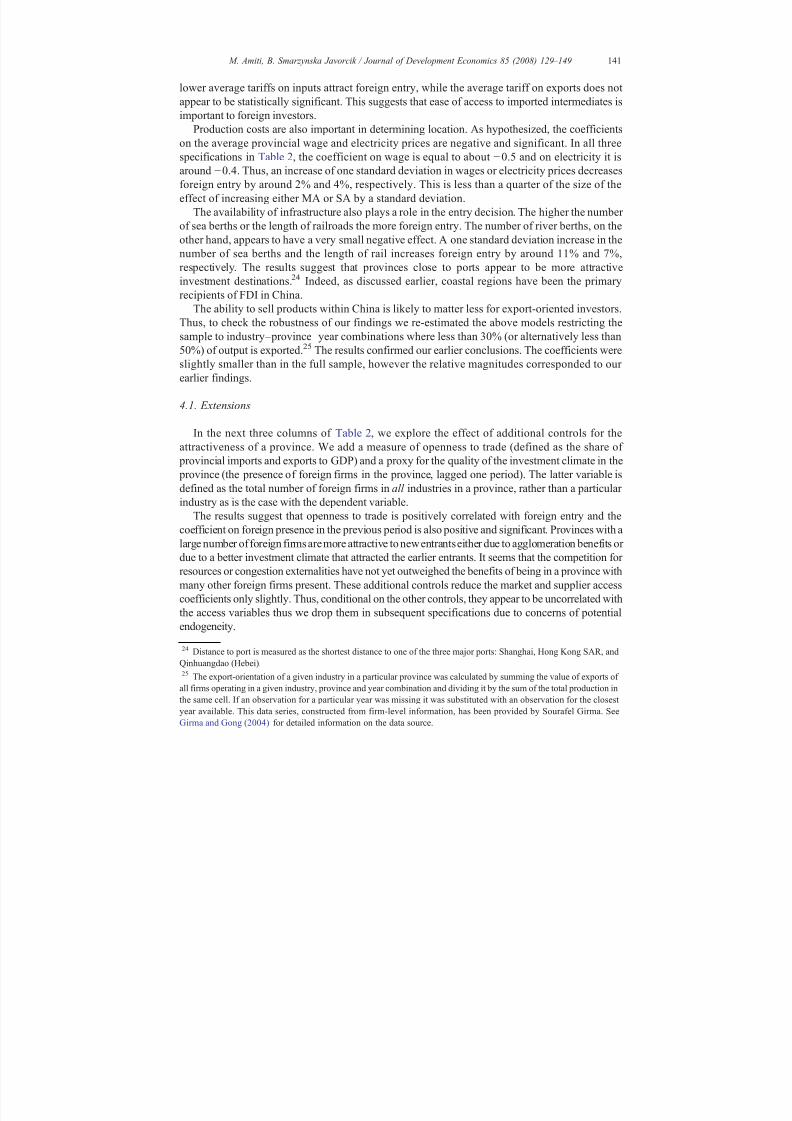
lower average tariffs on inputs attract foreign entry, while the average tariff on exports does not
appear to be statistically significant. This suggests that ease of access to imported intermediates is
important to foreign investors.
Production costs are also important in determining location. As hypothesized, the coefficientson the average provincial wage and electricity prices are negative and significant. In all three
specifications in Table 2, the coefficient on wage is equal to about −0.5 and on electricity it is
around −0.4. Thus, an increase of one standard deviation in wages or electricity prices decreases
foreign entry by around 2% and 4%, respectively. This is less than a quarter of the size of the
effect of increasing either MA or SA by a standard deviation.
The availability of infrastructure also plays a role in the entry decision. The higher the number
of sea berths or the length of railroads the more foreign entry. The number of river berths, on the
other hand, appears to have a very small negative effect. A one standard deviation increase in the
number of sea berths and the length of rail increases foreign entry by around 11% and 7%,
respectively. The results suggest that provinces close to ports appear to be more attractiveinvestment destinations.24 Indeed, as discussed earlier, coastal regions have been the primary
recipients of FDI in China.
The ability to sell products within China is likely to matter less for export-oriented investors.
Thus, to check the robustness of our findings we re-estimated the above models restricting the
sample to industry– province–year combinations where less than 30% (or alternatively less than
50%) of output is exported.25 The results confirmed our earlier conclusions. The coefficients were
slightly smaller than in the full sample, however the relative magnitudes corresponded to our
earlier findings.
4.1. Extensions
In the next three columns of Table 2, we explore the effect of additional controls for the
attractiveness of a province. We add a measure of openness to trade (defined as the share of
provincial imports and exports to GDP) and a proxy for the quality of the investment climate in the
province (the presence of foreign firms in the province, lagged one period). The latter variable is
defined as the total number of foreign firms in all industries in a province, rather than a particular
industry as is the case with the dependent variable.
The results suggest that openness to trade is positively correlated with foreign entry and the
coefficient on foreign presence in the previous period is also positive and significant. Provinces with a
large number of foreign firms are more attractive to new entrantseither due to agglomeration benefits or due to a better investment climate that attracted the earlier entrants. It seems that the competition for
resources or congestion externalities have not yet outweighed the benefits of being in a province with
many other foreign firms present. These additional controls reduce the market and supplier access
coefficients only slightly. Thus, conditional on the other controls, they appear to be uncorrelated with
the access variables thus we drop them in subsequent specifications due to concerns of potential
endogeneity.
25 The export-orientation of a given industry in a particular province was calculated by summing the value of exports of all firms operating in a given industry, province and year combination and dividing it by the sum of the total production in
the same cell. If an observation for a particular year was missing it was substituted with an observation for the closest
year available. This data series, constructed from firm-level information, has been provided by Sourafel Girma. See
Girma and Gong (2004) for detailed information on the data source.
24 Distance to port is measured as the shortest distance to one of the three major ports: Shanghai, Hong Kong SAR, and
Qinhuangdao (Hebei).
141 M. Amiti, B. Smarzynska Javorcik / Journal of Development Economics 85 (2008) 129 – 149

7/26/2019 Amiti and Smarzynska Javorcik (2008)_Trade Cost and Location of Foreign Firms in China
http://slidepdf.com/reader/full/amiti-and-smarzynska-javorcik-2008trade-cost-and-location-of-foreign-firms 14/21
4.2. Sensitivity
Now, we turn to the robustness of our assumptions on border barriers, transport costs, and entry
and exit.
4.3. Border barriers and transport costs
We allow for heterogeneity across industries in trade costs by estimating coefficients on SA and MA
by industry. Table 3 reports coefficients on SA and MA for 2 digit industries. The coefficients on all of
the access variables are positive. We see that there is indeed large variation across industries, with the
largest effects in wood, furniture and toys, textiles and electric machinery and electronics industries. As
shown in Berthelon and Freund (2004), trade costs and elasticities vary considerably across industries;
and so do incentives on which industries local governments want to protect (see Naughton, 2003).
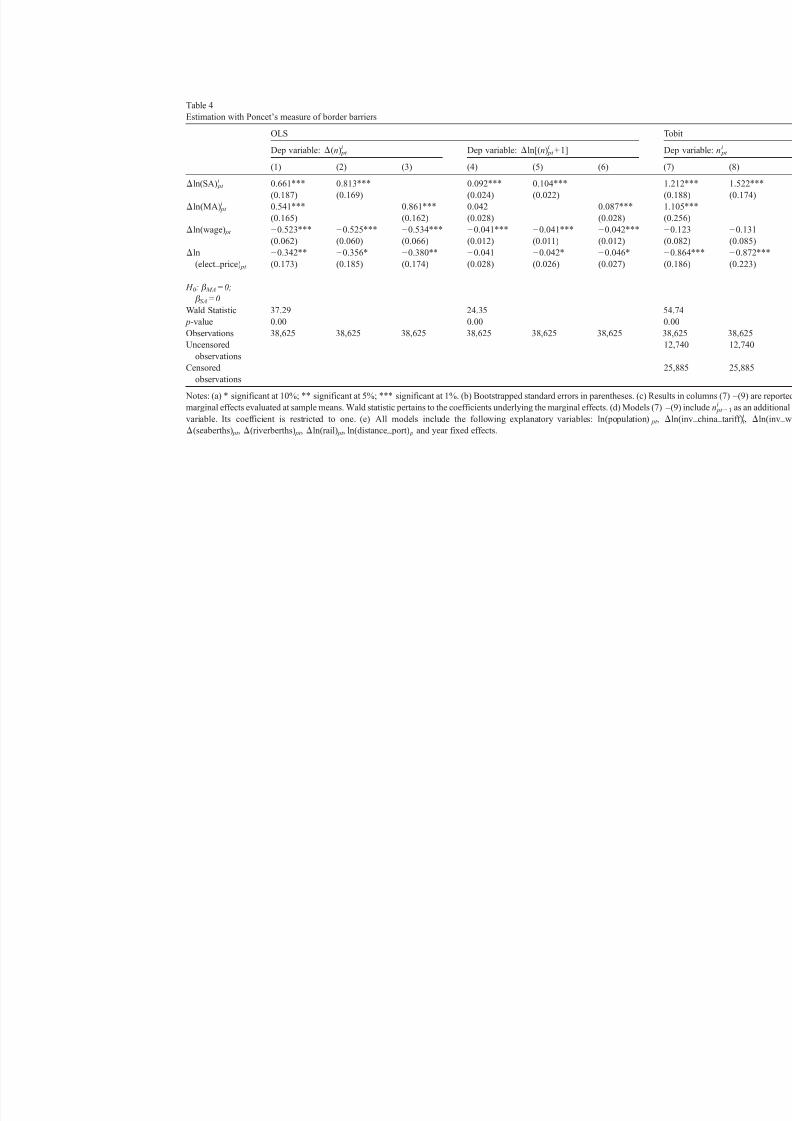
An alternative way to account for provincial border barriers is to incorporate Poncet's border barrier measures in our supplier and market access measures.26 Poncet's estimates are available
for 25 out of 29 provinces.27 We use the 1997 estimates, except for two provinces where the data
are not available and thus we substitute the 1992 estimates. In the case of supplier access, we
divide the access to suppliers in other provinces by the border barrier estimate in the sourcing
province. Therefore, higher protectionism in the sourcing province is associated with less access
to suppliers in other provinces. In the case of market access, we adjust the potential demand from
each province by its border barrier estimate. Thus, greater protectionism in other provincial
markets is associated with a lower value of the market access variable. As border barriers are
taken into account explicitly, the measures of market and supplier access encompass both own
and other provinces. From Table 4, we see that the coefficients on supplier and market access are positive and significant and the magnitudes of the other coefficients unchanged.28
4.4. Entry and exit
Now we consider our assumptions on entry and exit. The free entry and exit condition provides
an implicit solution for the number of firms. However, given the nonlinearities in the model we
could not get a closed form solution, so we assumed that the equilibrium number of firms is a
function of log profits, and hence net entry is a function of the difference of log profits. It could be
argued that the log of profits implicitly defines ln(n) rather than n so that the proportional change in
the number of firms is related to the log difference in profits. This would be problematic given thelarge numbers of zeros in industry/province/time cells. However, given that the log is a monotonic
transformation the expected signs on the coefficients should be unaffected. Therefore, as an
26 Only themarket andsupplier access, andthe production cost variables are presented for all subsequent specificationsto save
space. However, all specifications include all of the same controls as the basic specification in columns 1, 2 and 3 of Table 2.27 They are not available for Anhui, Chongqing, Hainan and Heilongjiang. The higher the estimated value obtained by
Poncet, the lower the barriers to trade. To ease the interpretation, we think of the inverse of Poncet's measure as an index
of provincial protectionism.28 Additionally, we explored two alternative assumptions on border barriers to check for robustness of results: (i) no border
effect, with β SA(O)=β MA(O)= 1, thus SA= SA( I )+SA(O) and MA=MA( I )+MA(O). This has the effect of increasing the
size of the coefficients on SA and MA but leaves the other coefficients almost unchanged; and (ii) infinite border barriers,
thus setting β SA(O)=β MA(O)= 0, effectively only including supplier and market access within a province. Again, both the
supplier access and market access terms are positive and significant but the magnitudes of the effects are much smaller. The
estimations that include outer provinces produce much higher coefficients on supplier and market access than those that
exclude outer effects, which confirms our finding that access to other provinces is important for entry.
142 M. Amiti, B. Smarzynska Javorcik / Journal of Development Economics 85 (2008) 129 – 149

7/26/2019 Amiti and Smarzynska Javorcik (2008)_Trade Cost and Location of Foreign Firms in China
http://slidepdf.com/reader/full/amiti-and-smarzynska-javorcik-2008trade-cost-and-location-of-foreign-firms 15/21
additional robustness check we also estimate Eq. (3.7) with the log difference of (1+ n p, t i ) as the
dependent variable. The results are presented in columns 4, 5 and 6 of Table 4. All the coefficients
have the expected signs. The magnitudes are smaller now because it is a log–log specification, so
the coefficients can be interpreted as elasticities.
Next we test whether our results are robust to taking into account the corner solution, that is the
situation where the expected profits are negative or falling but since no foreign firms are present in a
particular industry in a given province this has no implications for net entry (i.e. n p,t i = n p, t −1
i = 0). To
do so, we estimate a Tobit specification with n p, t i as the dependent variable and n p, t −1
i as an
explanatory variable with its coefficient constrained to equal one. All other explanatory variables
enter the model in first differences, as specified in Eq. (3.7).29 The results, presented in columns 7,
8 and 9 of Table 4, are expressed in terms of marginal effects. These specifications confirm our
original results. All coefficients have the expected signs, and the sizes of the coefficients on the
access variables are larger than those on production costs.
4.5. Endogeneity of wages
The Chinese hukou system, restricting the movement of labor across provinces, was weakened
during the 1990s raising the concern that provincial wages could potentially be endogenous. It is
possible that workers and firms may be attracted to the same provinces, with the increased labor
supply reducing wages and thus causing a spurious negative correlation between wages and firm
entry. Further, provincial wages could be correlated with unobserved provincial income shocks
that attract foreign firms thus leading to a positive correlation between firm entry and wages. Given
the short time period covered in our analysis, we address these issues by estimating a model with
provincial fixed effects. This modification has no effect on the signs or the significance pattern of
the variables of interest. Moreover, in all three specifications presented in the first three columns of Table 5, the coefficient on wages remains negative and statistically significant.
Table 3
Foreign entry by industry
Dependent variable: Δ(n) pt i
IndustryFood,
beverage
and tobacco
Textiles Wood,
furniture
and toys
Chemicals,
rubber and
plastic
Mineral and
metal products
Machinery
and transport
equipment
Electric machinery
and electronics
MA( I ) pt i 2.25
(2.52)
7.73⁎
(4.50)
3.52
(3.18)
0.85
(0.99)
2.33
(1.45)
0.42
(0.45)
8.31⁎⁎⁎
(2.02)
MA(O) pt i 0.19
(0.27)
0.14
(0.14)
0.19
(0.98)
0.16
(0.24)
0.10
(0.10)
0.28
(0.49)
0.60⁎⁎⁎
(0.27)
SA( I ) pt i 2.20⁎
(1.37)
3.63⁎⁎
(1.54)
3.53⁎
(2.14)
0.08
(1.07)
0.87
(0.67)
1.05⁎
(0.56)
6.10⁎⁎
(2.78)
SA(O) pt i 0.39⁎
(0.21)
0.12
(0.09)
0.12
(0.11)
0.33
(5.82)
0.16
(0.19)
0.17
(0.18)
0.64⁎
(0.37) N 6177 4611 3654 7395 6090 10,701 6177
Notes: (a) ⁎ significant at 10%; ⁎⁎ significant at 5%; ⁎⁎⁎ significant at 1%. (b) Robust standard errors corrected for
clustering in parentheses. (c) Specification is the same as in columns 2 and 3 of Table 2. Only the market access and
supplier access variables are reported to save space.
29 The reason we do not use net entry as the dependent variable is that we want to distinguish between the corner solution
and the situation in which the number of new entrants is exactly offset by the number of exits, i.e. n p,t i = n p,t − 1
i > 0.
143 M. Amiti, B. Smarzynska Javorcik / Journal of Development Economics 85 (2008) 129 – 149
7/26/2019 Amiti and Smarzynska Javorcik (2008)_Trade Cost and Location of Foreign Firms in China
http://slidepdf.com/reader/full/amiti-and-smarzynska-javorcik-2008trade-cost-and-location-of-foreign-firms 16/21
Table 4
Estimation with Poncet's measure of border barriers
OLS T
Dep variable: Δ(n) pt i Dep variable: Δln[(n) pt
i + 1] D
(1) (2) (3) (4) (5) (6) (
Δln(SA) pt i 0.661⁎⁎⁎
(0.187)
0.813⁎⁎⁎
(0.169)
0.092⁎⁎⁎
(0.024)
0.104⁎⁎⁎
(0.022)
1
(
Δln(MA) pt i 0.541⁎⁎⁎
(0.165)
0.861⁎⁎⁎
(0.162)
0.042
(0.028)
0.087⁎⁎⁎
(0.028)
1
(
Δln(wage) pt −0.523⁎⁎⁎
(0.062)
−0.525⁎⁎⁎
(0.060)
−0.534⁎⁎⁎
(0.066)
−0.041⁎⁎⁎
(0.012)
−0.041⁎⁎⁎
(0.011)
−0.042⁎⁎⁎
(0.012)
−
(
Δln
(elect_price) pt
−0.342⁎⁎
(0.173)
−0.356⁎
(0.185)
−0.380⁎⁎
(0.174)
−0.041
(0.028)
−0.042⁎
(0.026)
−0.046⁎
(0.027)
−
(
H 0: β MA= 0;
β SA= 0
Wald Statistic 37.29 24.35 5
p-value 0.00 0.00 0
Observations 38,625 38,625 38,625 38,625 38,625 38,625 3
Uncensored
observations
1
Censored
observations
2
Notes: (a) ⁎ significant at 10%; ⁎⁎ significant at 5%; ⁎⁎⁎ significant at 1%. (b) Bootstrapped standard errors in parentheses. (c) Resu
marginal effects evaluated at sample means. Wald statistic pertains to the coefficients underlying the marginal effects. (d) Models (7)–
variable. Its coefficient is restricted to one. (e) All models include the following explanatory variables: ln(population) pt , Δ
Δ(seaberths) pt , Δ(riverberths) pt , Δln(rail) pt , ln(distance_port) p and year fixed effects.

7/26/2019 Amiti and Smarzynska Javorcik (2008)_Trade Cost and Location of Foreign Firms in China
http://slidepdf.com/reader/full/amiti-and-smarzynska-javorcik-2008trade-cost-and-location-of-foreign-firms 17/21
Although the provincial fixed effects help reduce the endogeneity problem, it may still persist if
the income shocks are time varying. A further concern is reverse causality, that is the possibility that
the entry of foreign firms may affect the provincial wage. This possibility is attenuated by the fact that
while wages entering the model are province specific, foreign entry is measured at the province-
industry level. Nevertheless, as an additional robustness check we instrument for provincial wages
with logarithms of total provincial population and population grouped by educational attainment
(primary, secondary and tertiary education) in years 1984, 1987 and 1990.30 The F -statistic indicates
that these instruments provide a good fit in the first stage regression. The Sargan overidentification
test (with the p-value of 0.18) also supports the validity of the instruments. The two stage least
squares estimates in columns 4–
6 produce results which are almost identical to the OLS estimatesexcept the wage coefficient now has a slightly larger effect on foreign entry. The wage coefficient
remains negative and statistically significant in all of the specifications.
Table 5
Estimation with Poncet's measure of border barriers — additional robustness checks
Dependent variable: Δ(n) pt i
Model with provincial fixed effectsOLS 2SLS
(1) (2) (3) (4) (5) (6)
Δln(SA) pt i 0.483⁎⁎⁎
(0.167)
0.573⁎⁎⁎
(0.160)
0.483⁎⁎⁎
(0.183)
0.573⁎⁎⁎
(0.169)
Δln(MA) pt i 0.352⁎⁎
(0.159)
0.500⁎⁎⁎
(0.119)
0.352⁎⁎
(0.165)
0.552⁎⁎⁎
(0.157)
Δln(wage) pt −0.534⁎⁎⁎
(0.079)
−0.535⁎⁎⁎
(0.084)
−0.488⁎⁎⁎
(0.076)
−0.575⁎
(0.343)
−0.576⁎
(0.343)
−0.562⁎
(0.333)
Δln(elect_price) pt −0.677⁎⁎⁎
(0.202)
−0.701⁎⁎⁎
(0.205)
−0.768⁎⁎⁎
(0.188)
−0.682⁎⁎⁎
(0.219)
−0.706⁎⁎⁎
(0.217)
−0.732⁎⁎⁎
(0.218)
Sargan statistic 4.92 5.09 5.28
p-value 0.18 0.17 0.15
H 0: β MA= 0; β SA= 0
Wald Statistic 20.15 21.19
p-value 0.00 0.00
Coefficients on instrumental variables in stage I
dep var=Δln(wage) pt ln(tertiary) pt − k 0.094⁎⁎⁎ (0.003) 0.094⁎⁎⁎ (0.003) 0.094⁎⁎⁎ (0.003)
ln(secondary) pt − k −0.005 (0.007) −0.005 (0.007) −0.005 (0.007)
ln(primary) pt −
k −
0.139⁎⁎⁎
(0.006) −
0.139⁎⁎⁎
(0.006) −
0.139⁎⁎⁎
(0.006)ln(population) pt − k 2.951⁎⁎⁎ (0.052) 2.952⁎⁎⁎ (0.052) 2.951⁎⁎⁎ (0.052)
F -statisitcs 640.36 643.14 640.82
p-value 0.00 0.00 0.00
Observations 38,625 38,625 44,805 38,625 38,625 38,625
Notes: (a)⁎ significant at 10%; ⁎⁎ significant at 5%; ⁎⁎⁎ significant at 1%. (b) Bootstrapped standard errors in parentheses.
(c) All models include the following explanatory variables: Δln(population) pt , Δln(inv_china_tariff) t i, Δln
(inv_world_tariff)t i, Δ(seaberths) pt , Δ(riverberths) pt , Δln(rail) pt , as well as year and provincial fixed effects. (d)
Instrumental variables in models (4)–(6) include the log of the number of people with tertiary, secondary and primary
education in a given province as well as the log of the total population of the province. They pertain to years 1984, 1987 and
1990. The first stage also includes other explanatory variables included in the second stage.
30 The choice of years was driven by data availability for the longest possible lags.
145 M. Amiti, B. Smarzynska Javorcik / Journal of Development Economics 85 (2008) 129 – 149

7/26/2019 Amiti and Smarzynska Javorcik (2008)_Trade Cost and Location of Foreign Firms in China
http://slidepdf.com/reader/full/amiti-and-smarzynska-javorcik-2008trade-cost-and-location-of-foreign-firms 18/21
5. Conclusion
This study examines factors driving entry of foreign firms in China, using a comprehensive data
set covering nearly all manufacturing industries at the provincial level during the period 1998–
2001. The analysis is based on a new economic geography model and thus focuses on the
importance of supplier and market access effects both within and outside the province of entry,
relative to production costs. The findings suggest that access to customers and suppliers of
intermediate inputs are the key determinants of FDI inflows. The results show that increasing
supplier access by one standard deviation is associated with a 20% increase in entry of foreign
firms, and a one standard deviation increase in market access is associated with a 13% increase in
the foreign entry, whereas a one standard deviation increase in production costs reduces entry of
foreign firms by between 2% and 4%. The analysis also shows that the presence of customers and
suppliers in the province of entry matters much more than market and supplier access to the rest of
China. This may be due to the underdeveloped transport infrastructure and informal barriers totrade and is consistent with the fragmentation of the Chinese market.
Acknowledgements
We would like to thank Caroline Freund, Mary Hallward-Driemeier, Will Martin, Stephen
Redding, John Romalis, Tony Venables, Shang-Jin Wei, and participants at the Workshop on
National Market Integration (World Bank and Development Research Council) in Beijing,
September 2003, the Workshop on China's Economic Geography and Regional Development in
Hong Kong, December 2003, and the World Bank/IMF seminars for helpful comments and
suggestions. We also thank the editor and two anonymous referees for their suggestions. We aregrateful to the China National Bureau of Statistics (NBS) and the China Customs Office for
supplying us with the data and to Sourafel Girma for providing some additional data.
Appendix A
Table 1A
Industries with the Highest Net Entry of Foreign Investment Enterprises (FIEs)
Rank Year Industry code Industry description Net entry
1 2001 1810 Manufacture of clothing 2602 2000 1810 Manufacture of clothing 160
3 2001 4160 Manufacture of electronic elements 131
4 2000 4160 Manufacture of electronic elements 83
5 2001 2230 Manufacture of paper products 79
6 2001 3070 Manufacture of household plastic products 70
7 2000 3727 Manufacture of automobile fittings and parts 69
8 2001 3727 Manufacture of automobile fittings and parts 64
9 2001 4073 Manufacture of lamp and lanterns 59
10 2001 1781 Manufacture of cotton knitting 58
11 1999 3090 Manufacture of other plastic products 51
12 2001 1390 Processing of other food 48
13 2001 1790 Other textile industry 4814 2001 3434 Manufacture of abrasive tools 48
15 2001 2312 Printing of packing, decorating 47
146 M. Amiti, B. Smarzynska Javorcik / Journal of Development Economics 85 (2008) 129 – 149
7/26/2019 Amiti and Smarzynska Javorcik (2008)_Trade Cost and Location of Foreign Firms in China
http://slidepdf.com/reader/full/amiti-and-smarzynska-javorcik-2008trade-cost-and-location-of-foreign-firms 19/21
Fig. 1.
147 M. Amiti, B. Smarzynska Javorcik / Journal of Development Economics 85 (2008) 129 – 149

7/26/2019 Amiti and Smarzynska Javorcik (2008)_Trade Cost and Location of Foreign Firms in China
http://slidepdf.com/reader/full/amiti-and-smarzynska-javorcik-2008trade-cost-and-location-of-foreign-firms 20/21
References
Amiti, Mary, 2005. Location of vertically linked industries: agglomeration versus comparative advantage. European
Economic Review 49 (4), 809–832.
Amiti, Mary, Wen, Mei, 2001. Spatial distribution of manufacturing in China. In: Lloyd, P.J., Zhang, X.G. (Eds.),Modelling the Chinese Economy. Edward Elgar.
Amiti, Mary, Cameron, Lisa, (in press). Economic Geography and Wages. Review of Economics and Statistics.
Bai, Chong-En, Du, Yingjuan, Tao, Zhigang, Tong, Sarah Y., 2004. Local protection and regional specialization: evidence
from China's industries. Journal of International Economics 63, 397–417.
Behrens, Kristian, Lamorgese, Andrea, Ottaviano, Gianmarco I.P., 2005. Testing the Home Market Effect in a Multi-
Country World: The Theory. Unpublished mimeo — revised version of CEPR Discussion paper 4468.
Berthelon, Freund, 2004. On the conservation of distance. World Bank Policy Research Working Paper, vol. 3293.
Caves, Richard E., 1982. Multinational Enterprise and Economic Analysis. Cambridge University Press, New York.
Cheng, Leonard K., Kwan, Yum K., 2000. What are the determinants of the location of foreign direct investment? The
Chinese experience. Journal of International Economics 51, 379–400.
Davis, Don, Weinstein, David, 1999. Economic geography and regional production structure: an empirical investigation.
European Economic Review 43 (2), 379–407.
Davis, Don, Weinstein, David, 2003. Market access, economic geography and comparative advantage: an empirical
assessment. Journal of International Economics 59 (1), 1–23.
Dean, Judith M., Lovely, Mary E., Wang, Hua, 2002. Foreign Direct Investment and Pollution Havens: Evaluating the
Evidence from China, mimeo, US International Trade Commission, Washington, DC.
Desai, Mihir A., Foley, Fritz C., Hines Jr., James R., 2004. Foreign direct investment in a world of multiple taxes. Journal
of Public Economics 88, 2727–2744.
Feenstra, Robert C., Markusen, James R., Rose, Andrew K., 2001. Using the gravity equation to differentiate among
alternative theories of trade. Canadian Journal of Economics 34 (2), 430–447.
Girma, Sourafel, Gong, Yundan, 2004. Are There FDI-generated Externalities to Chinese State-owned Enterprises?
mimeo, University of Leicester.
Hanson, Gordon H., 2005. Market potential, increasing returns, and geographic concentration. Journal of Interntional
Economics 67, 1–24.
Hanson, Gordon H., Xiang, Chong, 2004. The home-market effect and bilateral trade patterns. American Economic
Review 94 (4), 1108–1129.
Head, Keith, Ries, John, 1991. Increasing returns versus national product differentiation as an explanation for the pattern of
U.S.–Canada trade. American Economic Review 91 (4), 858–876.
Head, Keith, Ries, John, 1996. Inter-city competition for foreign investment: static and dynamic effects of China's
incentive areas. Journal of Urban Economics 40, 38–60.
Head, Keith, Mayer, Thierry, 2004. Market potential and the location of Japanese investment in the European Union.
Review of Economics and Statistics 86 (4), 959–972.
Huang, Lin, Wei, Shang-Jin, 2002. One China, Many Kingdoms? Using Individual Product Prices to Understand Local
Protectionism in China, mimeo, International Monetary Fund, Washington, DC.
Javorcik, Beata S., 2004. Does foreign direct investment increase the productivity of domestic firms? In search of spillovers through backward linkages. American Economic Review 94, 605–627.
Krugman, Paul, Venables, Anthony J., 1995. Globalization and the inequality of nations. Quarterly Journal of Economics
110, 857–880.
Kumar, Anjali, 1994. China: Internal Market Development and Regulation. World Bank Country Study. World Bank,
Washington, DC.
Leamer, Ed., 1997. Access to western markets and eastern effort. In: Zecchini, S. (Ed.), Lessons from the Economic
Transition, Central and Eastern Europe in the 1990s. Kluwer Academic Publishers, Dordrecht, pp. 503–526.
Markusen, James R., 1995. The boundaries of multinational enterprises and the theory of international trade. Journal of
Economic Perspectives 9 (2), 169–189.
Markusen, James R., Venables, Anthony J., 1998. Multinational firms and new trade theory. Journal of International
Economics 46, 183–203.
Markusen, James R., Venables, Anthony J., 2000. The theory of endowment, intra-industry and multinational trade.Journal of International Economics 52, 209–234.
Naughton, Barry, 2003. How much can regional integration do to unify China's market? In: Hope, Nicholas, Yang, Dennis,
Li, Mu Yank (Eds.), How Far Across the River? Chinese Policy Reform at the Millennium. Stanford University Press,
Stanford, pp. 204–232.
148 M. Amiti, B. Smarzynska Javorcik / Journal of Development Economics 85 (2008) 129 – 149

7/26/2019 Amiti and Smarzynska Javorcik (2008)_Trade Cost and Location of Foreign Firms in China
http://slidepdf.com/reader/full/amiti-and-smarzynska-javorcik-2008trade-cost-and-location-of-foreign-firms 21/21
Poncet, Sandra, 2003. Measuring Chinese domestic and international integration. China Economic Review 14,
1–21.
Poncet, Sandra, 2005. A fragmented China: measure and determinants of Chinese domestic market disintegration. Review
of International Economics 13 (3), 409–430.
Puga, Diego, 1999. The rise and fall of regional inequalities. European Economic Review 43, 303–
334.Redding, Stephen, Venables, Anthony J., 2004. Economic geography and international inequality. Journal of International
Economics 62 (1), 53–82.
Young, Alwyn, 2000. The Razor's edge: distortions and incremental reform in the People's Republic of China. Quarterly
Journal of Economics 115, 1091–1135.
World Investment Report: Transnational Corporations and Export Competitiveness. United Nations, New York.
149 M. Amiti, B. Smarzynska Javorcik / Journal of Development Economics 85 (2008) 129 – 149