Based on CCIA-BML certified exports CCIA-BML Exports ... 2018_1.pdf · the CCIA-BML exports data,...
12
Based on CCIA-BML certified exports CCIA-BML Exports Report in 2018 CCIA-BML - Center for Economic Research 2-8-2019
Transcript of Based on CCIA-BML certified exports CCIA-BML Exports ... 2018_1.pdf · the CCIA-BML exports data,...
Based on CCIA-BML certified exports
CCIA-BML Exports Report in 2018
CCIA-BML - Center for Economic Research 2-8-2019
Lana El Tabch Center for Economic Research at the CCIA-BML 1
Table of Contents
A. CCIA-BML certified exports in 2018 .......................................................................... 3
B. CCIA-BML certified exports by weight ...................................................................... 5
C. Top export markets of CCIA-BML certified exports ................................................... 6
D. Evolution of Lebanon’s main export markets over the past four years based on
CCIA-BML certified exports ............................................................................................. 7
E. Geographical distribution of CCIA-BML certified exports .......................................... 8
F. Main Lebanese products exported based on CCIA-BML certified exports ................ 9
Lana El Tabch Center for Economic Research at the CCIA-BML 2
The present report illustrates Lebanese exports data compiled solely based on
the certificates of origin issued by the Chamber of Commerce, Industry and
Agriculture of Beirut and Mount Lebanon (CCIA-BML). This data is therefore not
to be confused with the Customs data that tallies Lebanese exports on a national
scale. All the tables and charts of the report hence refer exclusively to the CCIA-
BML certified exports.
Lana El Tabch Center for Economic Research at the CCIA-BML 3
CCIA-BML Exports Report
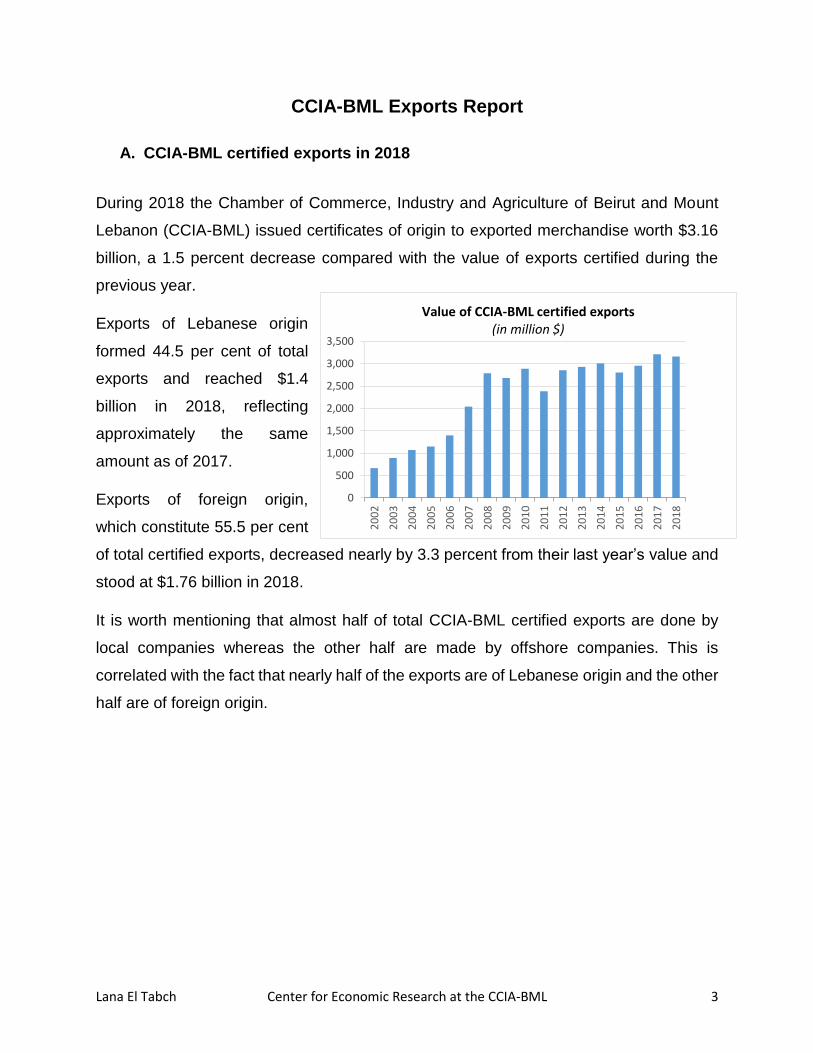
A. CCIA-BML certified exports in 2018
During 2018 the Chamber of Commerce, Industry and Agriculture of Beirut and Mount
Lebanon (CCIA-BML) issued certificates of origin to exported merchandise worth $3.16
billion, a 1.5 percent decrease compared with the value of exports certified during the
previous year.
Exports of Lebanese origin
formed 44.5 per cent of total
exports and reached $1.4
billion in 2018, reflecting
approximately the same
amount as of 2017.
Exports of foreign origin,
which constitute 55.5 per cent
of total certified exports, decreased nearly by 3.3 percent from their last year’s value and
stood at $1.76 billion in 2018.
It is worth mentioning that almost half of total CCIA-BML certified exports are done by
local companies whereas the other half are made by offshore companies. This is
correlated with the fact that nearly half of the exports are of Lebanese origin and the other
half are of foreign origin.
0
500
1,000
1,500
2,000
2,500
3,000
3,500
20
02
20
03
20
04
20
05
20
06
20
07
20
08
20
09
20
10
20
11
20
12
20
13
20
14
20
15
20
16
20
17
20
18
Value of CCIA-BML certified exports (in million $)
Lana El Tabch Center for Economic Research at the CCIA-BML 4
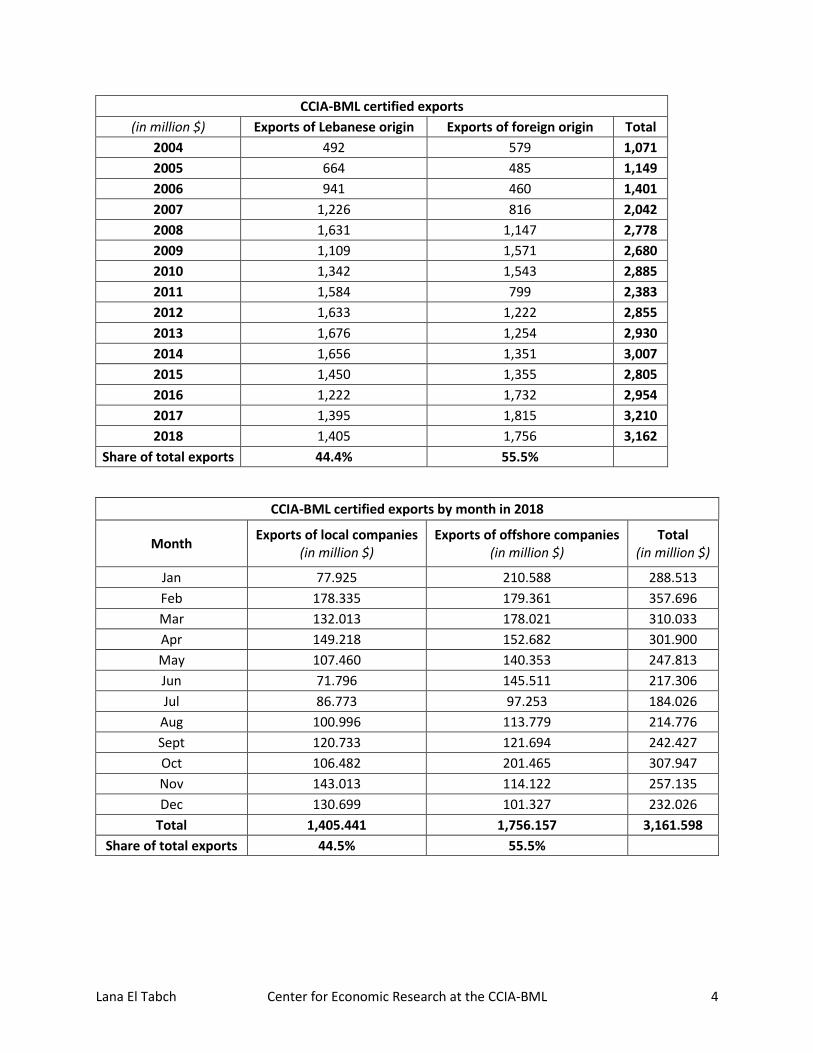
CCIA-BML certified exports
(in million $) Exports of Lebanese origin Exports of foreign origin Total
2004 492 579 1,071
2005 664 485 1,149
2006 941 460 1,401
2007 1,226 816 2,042
2008 1,631 1,147 2,778
2009 1,109 1,571 2,680
2010 1,342 1,543 2,885
2011 1,584 799 2,383
2012 1,633 1,222 2,855
2013 1,676 1,254 2,930
2014 1,656 1,351 3,007
2015 1,450 1,355 2,805
2016 1,222 1,732 2,954
2017 1,395 1,815 3,210
2018 1,405 1,756 3,162
Share of total exports 44.4% 55.5%
CCIA-BML certified exports by month in 2018
Month Exports of local companies
(in million $) Exports of offshore companies
(in million $) Total
(in million $)
Jan 77.925 210.588 288.513
Feb 178.335 179.361 357.696
Mar 132.013 178.021 310.033
Apr 149.218 152.682 301.900
May 107.460 140.353 247.813
Jun 71.796 145.511 217.306
Jul 86.773 97.253 184.026
Aug 100.996 113.779 214.776
Sept 120.733 121.694 242.427
Oct 106.482 201.465 307.947
Nov 143.013 114.122 257.135
Dec 130.699 101.327 232.026
Total 1,405.441 1,756.157 3,161.598
Share of total exports 44.5% 55.5%
Lana El Tabch Center for Economic Research at the CCIA-BML 5
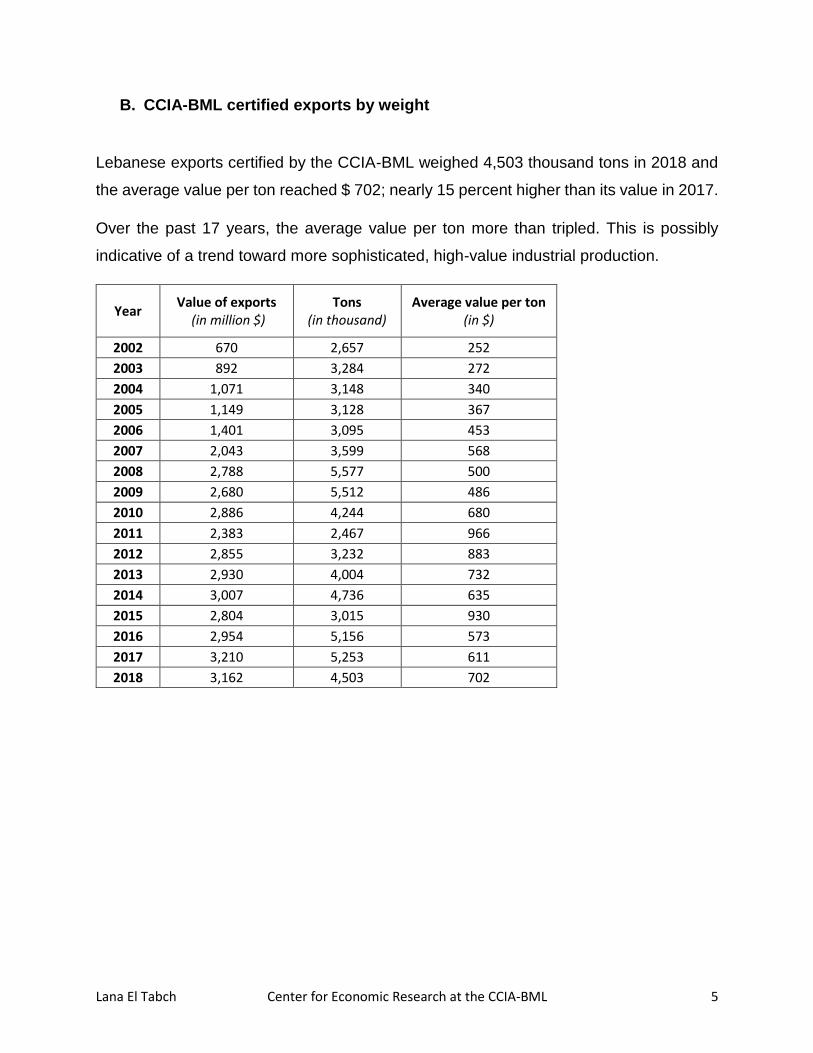
B. CCIA-BML certified exports by weight
Lebanese exports certified by the CCIA-BML weighed 4,503 thousand tons in 2018 and
the average value per ton reached $ 702; nearly 15 percent higher than its value in 2017.
Over the past 17 years, the average value per ton more than tripled. This is possibly
indicative of a trend toward more sophisticated, high-value industrial production.
Year Value of exports
(in million $) Tons
(in thousand) Average value per ton
(in $)
2002 670 2,657 252
2003 892 3,284 272
2004 1,071 3,148 340
2005 1,149 3,128 367
2006 1,401 3,095 453
2007 2,043 3,599 568
2008 2,788 5,577 500
2009 2,680 5,512 486
2010 2,886 4,244 680
2011 2,383 2,467 966
2012 2,855 3,232 883
2013 2,930 4,004 732
2014 3,007 4,736 635
2015 2,804 3,015 930
2016 2,954 5,156 573
2017 3,210 5,253 611
2018 3,162 4,503 702
Lana El Tabch Center for Economic Research at the CCIA-BML 6
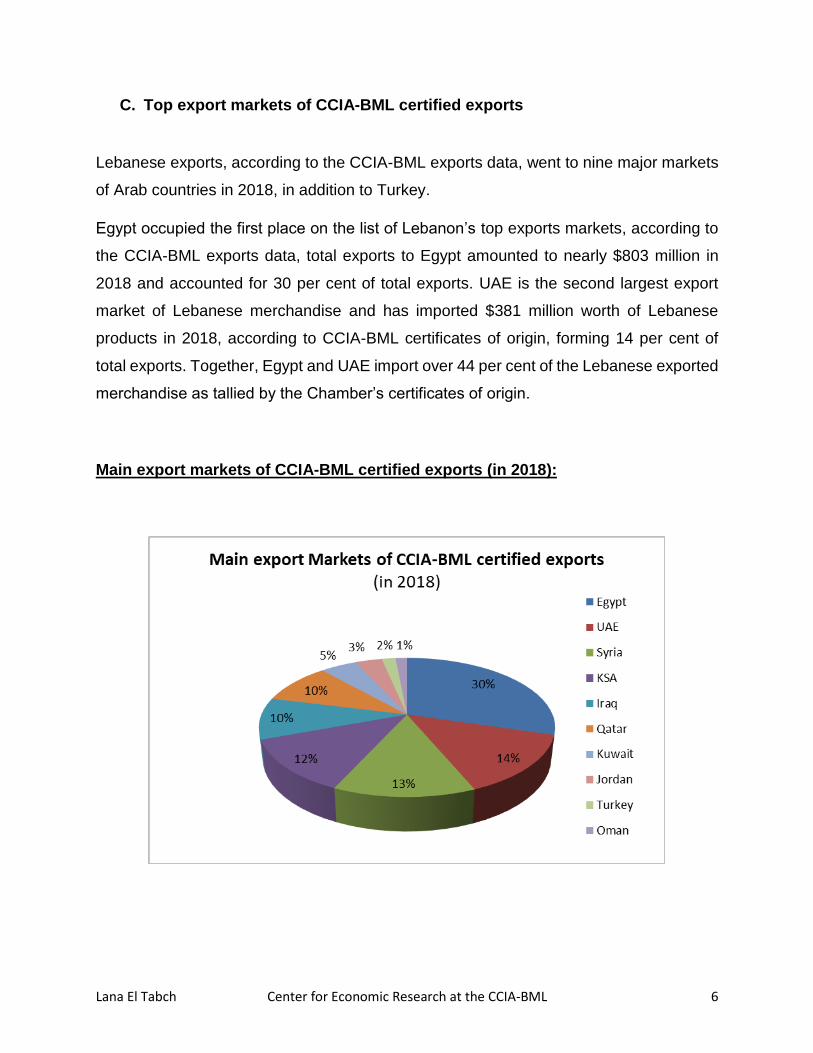
C. Top export markets of CCIA-BML certified exports
Lebanese exports, according to the CCIA-BML exports data, went to nine major markets
of Arab countries in 2018, in addition to Turkey.
Egypt occupied the first place on the list of Lebanon’s top exports markets, according to
the CCIA-BML exports data, total exports to Egypt amounted to nearly $803 million in
2018 and accounted for 30 per cent of total exports. UAE is the second largest export
market of Lebanese merchandise and has imported $381 million worth of Lebanese
products in 2018, according to CCIA-BML certificates of origin, forming 14 per cent of
total exports. Together, Egypt and UAE import over 44 per cent of the Lebanese exported
merchandise as tallied by the Chamber’s certificates of origin.
Main export markets of CCIA-BML certified exports (in 2018):
Lana El Tabch Center for Economic Research at the CCIA-BML 7
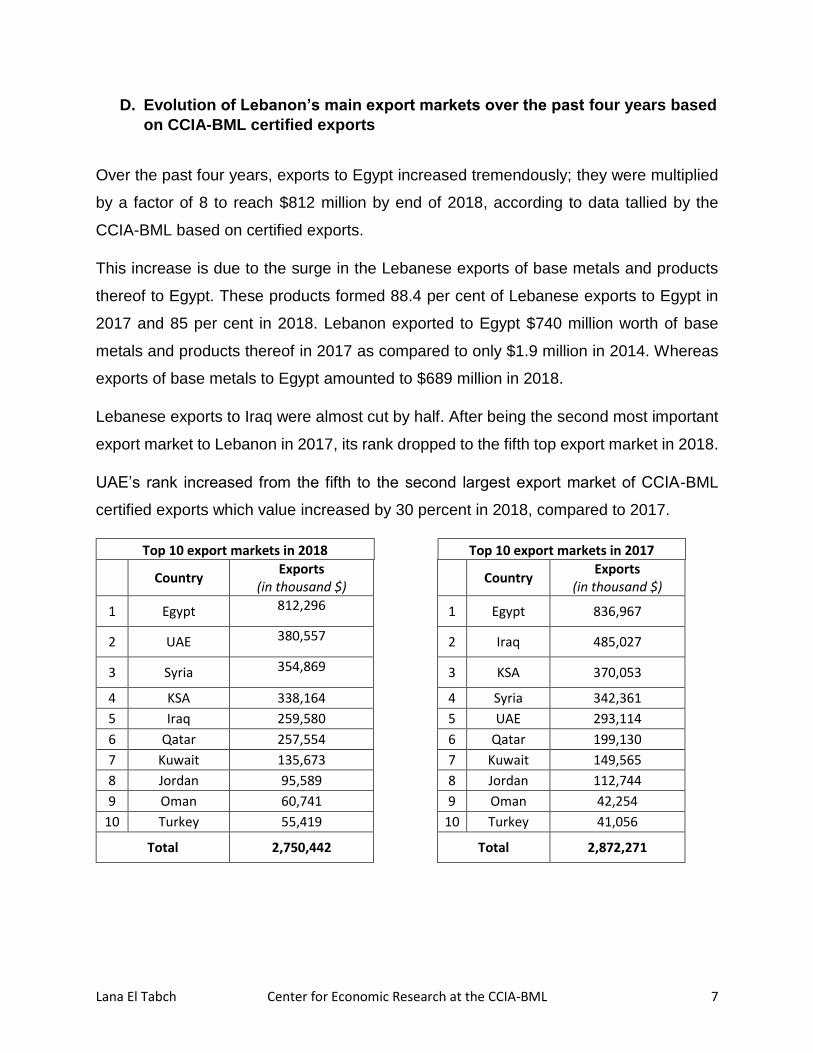
D. Evolution of Lebanon’s main export markets over the past four years based
on CCIA-BML certified exports
Over the past four years, exports to Egypt increased tremendously; they were multiplied
by a factor of 8 to reach $812 million by end of 2018, according to data tallied by the
CCIA-BML based on certified exports.
This increase is due to the surge in the Lebanese exports of base metals and products
thereof to Egypt. These products formed 88.4 per cent of Lebanese exports to Egypt in
2017 and 85 per cent in 2018. Lebanon exported to Egypt $740 million worth of base
metals and products thereof in 2017 as compared to only $1.9 million in 2014. Whereas
exports of base metals to Egypt amounted to $689 million in 2018.
Lebanese exports to Iraq were almost cut by half. After being the second most important
export market to Lebanon in 2017, its rank dropped to the fifth top export market in 2018.
UAE’s rank increased from the fifth to the second largest export market of CCIA-BML
certified exports which value increased by 30 percent in 2018, compared to 2017.
Top 10 export markets in 2018 Top 10 export markets in 2017
Country
Exports (in thousand $)
Country Exports
(in thousand $)
1 Egypt 812,296
1 Egypt 836,967
2 UAE 380,557
2 Iraq 485,027
3 Syria 354,869
3 KSA 370,053
4 KSA 338,164 4 Syria 342,361
5 Iraq 259,580 5 UAE 293,114
6 Qatar 257,554 6 Qatar 199,130
7 Kuwait 135,673 7 Kuwait 149,565
8 Jordan 95,589 8 Jordan 112,744
9 Oman 60,741 9 Oman 42,254
10 Turkey 55,419 10 Turkey 41,056
Total 2,750,442
Total 2,872,271
Lana El Tabch Center for Economic Research at the CCIA-BML 8
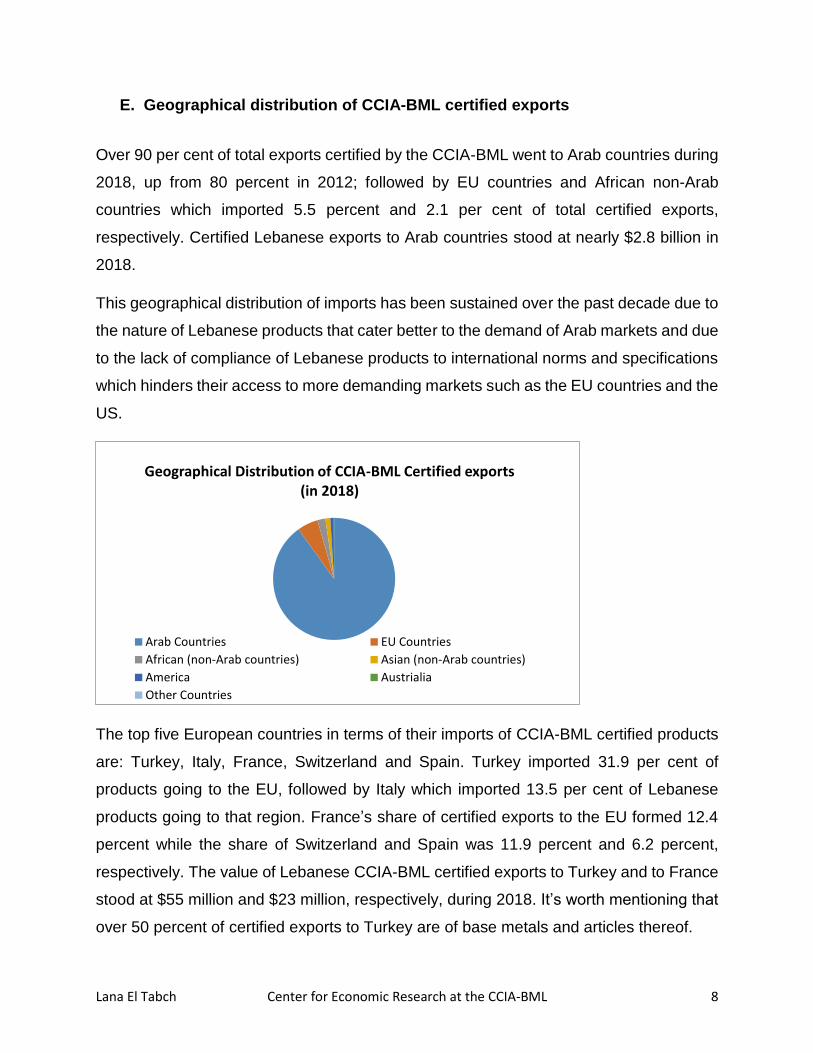
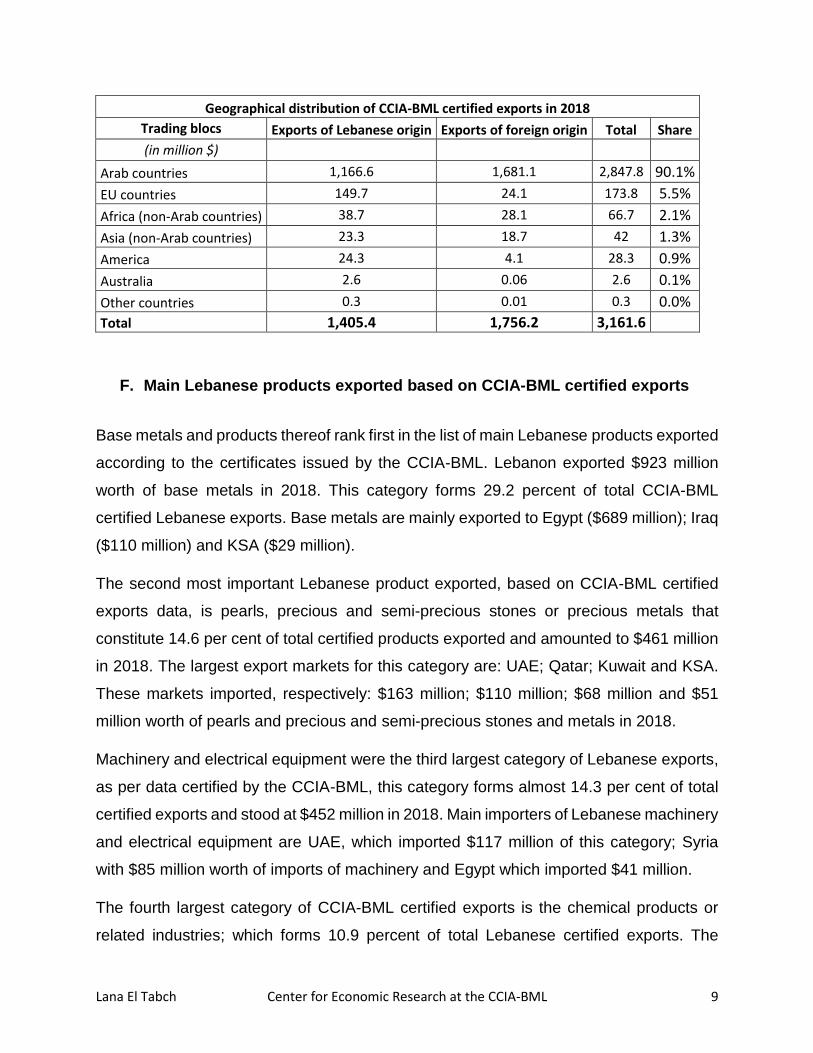
E. Geographical distribution of CCIA-BML certified exports
Over 90 per cent of total exports certified by the CCIA-BML went to Arab countries during
2018, up from 80 percent in 2012; followed by EU countries and African non-Arab
countries which imported 5.5 percent and 2.1 per cent of total certified exports,
respectively. Certified Lebanese exports to Arab countries stood at nearly $2.8 billion in
2018.
This geographical distribution of imports has been sustained over the past decade due to
the nature of Lebanese products that cater better to the demand of Arab markets and due
to the lack of compliance of Lebanese products to international norms and specifications
which hinders their access to more demanding markets such as the EU countries and the
US.
The top five European countries in terms of their imports of CCIA-BML certified products
are: Turkey, Italy, France, Switzerland and Spain. Turkey imported 31.9 per cent of
products going to the EU, followed by Italy which imported 13.5 per cent of Lebanese
products going to that region. France’s share of certified exports to the EU formed 12.4
percent while the share of Switzerland and Spain was 11.9 percent and 6.2 percent,
respectively. The value of Lebanese CCIA-BML certified exports to Turkey and to France
stood at $55 million and $23 million, respectively, during 2018. It’s worth mentioning that
over 50 percent of certified exports to Turkey are of base metals and articles thereof.
Geographical Distribution of CCIA-BML Certified exports (in 2018)
Arab Countries EU Countries
African (non-Arab countries) Asian (non-Arab countries)
America Austrialia
Other Countries
Lana El Tabch Center for Economic Research at the CCIA-BML 9
Geographical distribution of CCIA-BML certified exports in 2018
Trading blocs Exports of Lebanese origin Exports of foreign origin Total Share
(in million $)
Arab countries 1,166.6 1,681.1 2,847.8 90.1%
EU countries 149.7 24.1 173.8 5.5%
Africa (non-Arab countries) 38.7 28.1 66.7 2.1%
Asia (non-Arab countries) 23.3 18.7 42 1.3%
America 24.3 4.1 28.3 0.9%
Australia 2.6 0.06 2.6 0.1%
Other countries 0.3 0.01 0.3 0.0%
Total 1,405.4 1,756.2 3,161.6
F. Main Lebanese products exported based on CCIA-BML certified exports
Base metals and products thereof rank first in the list of main Lebanese products exported
according to the certificates issued by the CCIA-BML. Lebanon exported $923 million
worth of base metals in 2018. This category forms 29.2 percent of total CCIA-BML
certified Lebanese exports. Base metals are mainly exported to Egypt ($689 million); Iraq
($110 million) and KSA ($29 million).
The second most important Lebanese product exported, based on CCIA-BML certified
exports data, is pearls, precious and semi-precious stones or precious metals that
constitute 14.6 per cent of total certified products exported and amounted to $461 million
in 2018. The largest export markets for this category are: UAE; Qatar; Kuwait and KSA.
These markets imported, respectively: $163 million; $110 million; $68 million and $51
million worth of pearls and precious and semi-precious stones and metals in 2018.
Machinery and electrical equipment were the third largest category of Lebanese exports,
as per data certified by the CCIA-BML, this category forms almost 14.3 per cent of total
certified exports and stood at $452 million in 2018. Main importers of Lebanese machinery
and electrical equipment are UAE, which imported $117 million of this category; Syria
with $85 million worth of imports of machinery and Egypt which imported $41 million.
The fourth largest category of CCIA-BML certified exports is the chemical products or
related industries; which forms 10.9 percent of total Lebanese certified exports. The
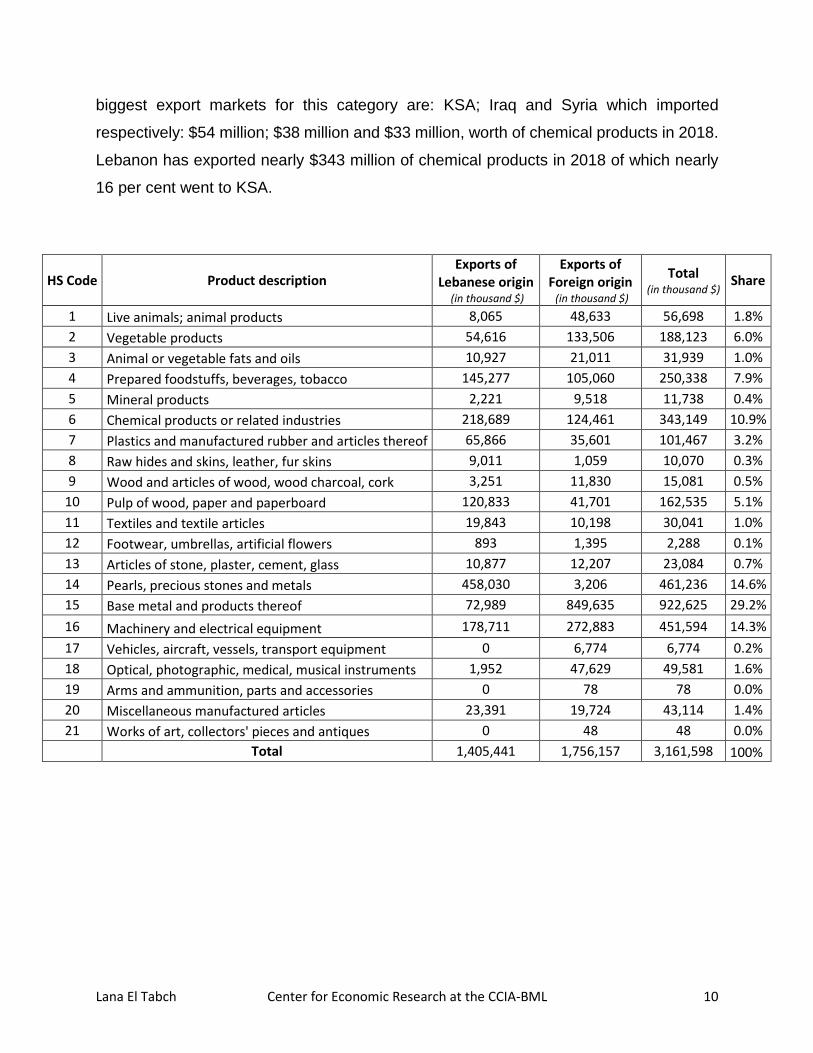
Lana El Tabch Center for Economic Research at the CCIA-BML 10
biggest export markets for this category are: KSA; Iraq and Syria which imported
respectively: $54 million; $38 million and $33 million, worth of chemical products in 2018.
Lebanon has exported nearly $343 million of chemical products in 2018 of which nearly
16 per cent went to KSA.
HS Code Product description Exports of
Lebanese origin (in thousand $)
Exports of Foreign origin (in thousand $)
Total (in thousand $)
Share
1 Live animals; animal products 8,065 48,633 56,698 1.8%
2 Vegetable products 54,616 133,506 188,123 6.0%
3 Animal or vegetable fats and oils 10,927 21,011 31,939 1.0%
4 Prepared foodstuffs, beverages, tobacco 145,277 105,060 250,338 7.9%
5 Mineral products 2,221 9,518 11,738 0.4%
6 Chemical products or related industries 218,689 124,461 343,149 10.9%
7 Plastics and manufactured rubber and articles thereof 65,866 35,601 101,467 3.2%
8 Raw hides and skins, leather, fur skins 9,011 1,059 10,070 0.3%
9 Wood and articles of wood, wood charcoal, cork 3,251 11,830 15,081 0.5%
10 Pulp of wood, paper and paperboard 120,833 41,701 162,535 5.1%
11 Textiles and textile articles 19,843 10,198 30,041 1.0%
12 Footwear, umbrellas, artificial flowers 893 1,395 2,288 0.1%
13 Articles of stone, plaster, cement, glass 10,877 12,207 23,084 0.7%
14 Pearls, precious stones and metals 458,030 3,206 461,236 14.6%
15 Base metal and products thereof 72,989 849,635 922,625 29.2%
16 Machinery and electrical equipment 178,711 272,883 451,594 14.3%
17 Vehicles, aircraft, vessels, transport equipment 0 6,774 6,774 0.2%
18 Optical, photographic, medical, musical instruments 1,952 47,629 49,581 1.6%
19 Arms and ammunition, parts and accessories 0 78 78 0.0%
20 Miscellaneous manufactured articles 23,391 19,724 43,114 1.4%
21 Works of art, collectors' pieces and antiques 0 48 48 0.0%
Total 1,405,441 1,756,157 3,161,598 100%
Lana El Tabch Center for Economic Research at the CCIA-BML 11
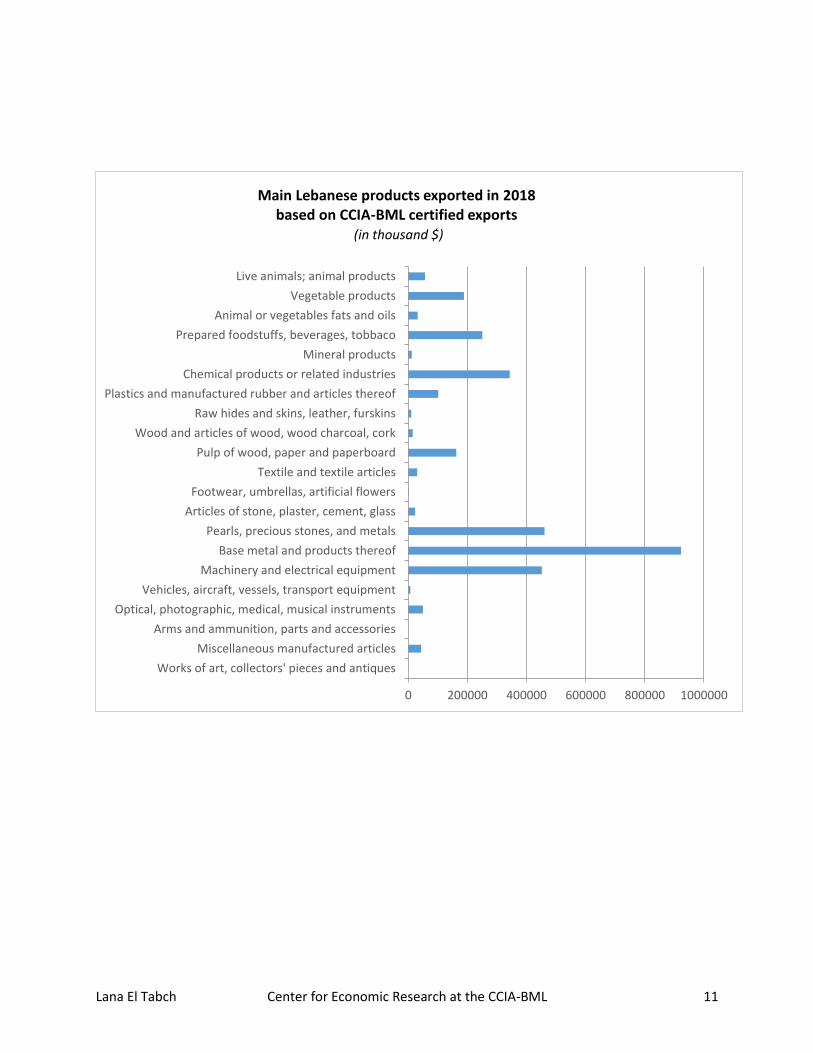
0 200000 400000 600000 800000 1000000
Works of art, collectors' pieces and antiques
Miscellaneous manufactured articles
Arms and ammunition, parts and accessories
Optical, photographic, medical, musical instruments
Vehicles, aircraft, vessels, transport equipment
Machinery and electrical equipment
Base metal and products thereof
Pearls, precious stones, and metals
Articles of stone, plaster, cement, glass
Footwear, umbrellas, artificial flowers
Textile and textile articles
Pulp of wood, paper and paperboard
Wood and articles of wood, wood charcoal, cork
Raw hides and skins, leather, furskins
Plastics and manufactured rubber and articles thereof
Chemical products or related industries
Mineral products
Prepared foodstuffs, beverages, tobbaco
Animal or vegetables fats and oils
Vegetable products
Live animals; animal products
Main Lebanese products exported in 2018 based on CCIA-BML certified exports
(in thousand $)