Barbados in the Cruise Tourism Global Value Chain · Barbados in the Cruise Tourism Global Value...
53
Barbados in the Cruise Tourism Global Value Chain FINAL DRAFT FOR REVIEW August 2017 Prepared by Jack Daly, Karina Fernandez-Stark Contributing researcher: Vivian Couto Duke Global Value Chain Center, Duke University
-
Upload
truongkhanh -
Category
Documents
-
view
231 -
download
5
Transcript of Barbados in the Cruise Tourism Global Value Chain · Barbados in the Cruise Tourism Global Value...
Barbados in the Cruise Tourism
Global Value Chain FINAL DRAFT FOR REVIEW
August 2017
Prepared by
Jack Daly, Karina Fernandez-Stark
Contributing researcher: Vivian Couto
Duke Global Value Chain Center,
Duke University

ii
This research was prepared by the Duke University Global Value Chain Center on behalf of the
Organization of American States (OAS). This study is part of the establishment of Small Business
Development Centers in the Caribbean. The report is based on both primary and secondary
information sources. In addition to interviews with firms operating in the sector and supporting
institutions, the report draws on secondary research and information sources. The project report is
available at www.gvcc.duke.edu.
Acknowledgements The Duke University Global Value Chain Center would like to thank all of the interviewees, who
gave generously of their time and expertise, as well as Renee Penco of the Organization of
American States (OAS) for her extensive support.
The Duke University Global Value Chain Center undertakes client-sponsored research that
addresses economic and social development issues for governments, foundations and international
organizations. We do this principally by utilizing the global value chain (GVC) framework, created
by Founding Director Gary Gereffi, and supplemented by other analytical tools. As a university-
based research center, we address clients’ real world questions with transparency and rigor.
www.gvcc.duke.edu
Duke University Global Value Chain Center
© August 2017

iii
Barbados in the Cruise Tourism GVC Acronyms .................................................................................................................................................................... v
Executive Summary .................................................................................................................................................. vi
1. Introduction ..................................................................................................................................................... 1
2. The Cruise Tourism Global Value Chain .................................................................................................. 1
2.1. Global Cruise Tourism Industry .......................................................................................................... 3
2.2. The Cruise Tourism Global Value Chain .......................................................................................... 5
2.3. Lead Firms and Governance ................................................................................................................. 7
3. Barbados and the Cruise Tourism GVC ................................................................................................. 12
3.1. Barbados’ Current Participation in the Cruise Tourism GVC ................................................... 15
3.1.1. Industry Organization ................................................................................................................. 16
3.1.2. Barbados Distribution Intermediaries ..................................................................................... 18
3.1.3. Port Call Inputs ............................................................................................................................. 19
3.2. Upgrading and Industry Evolution in Barbados Cruise Tourism GVC ..................................... 20
3.3. Industry Institutionalization ................................................................................................................ 22
3.4. Advantages and Constraints ............................................................................................................... 23
3.4.1. Advantages ..................................................................................................................................... 24
3.4.2. Constraints .................................................................................................................................... 25
4. Lessons for Barbados Upgrading in Cruise Tourism from Global Experiences ............................. 27
4.1. Case Studies ........................................................................................................................................... 28
4.1.1. St. Maarten ..................................................................................................................................... 29
4.1.2. Puerto Rico .................................................................................................................................... 31
5. Recommended Upgrading Trajectories for Barbados .......................................................................... 34
6. Appendix ......................................................................................................................................................... 36
7. References ...................................................................................................................................................... 40
Tables Table 1. Regional Rankings for Tourism’s Direct Contribution to Economies, 2016 .............................. 2
Table 2. Cruise Line Deployments by Regions (% of Available Lower Berth Days) ................................ 4
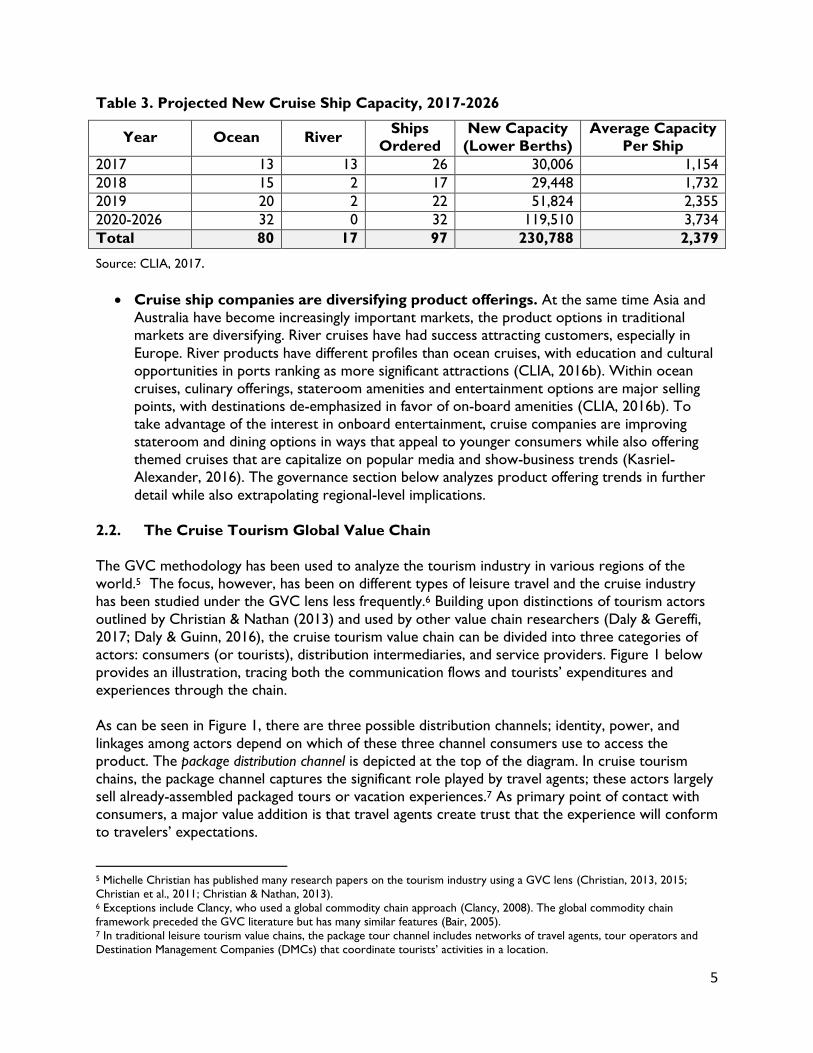
Table 3. Projected New Cruise Ship Capacity, 2017-2026 ............................................................................ 5
Table 4. Profiles of Leading Cruise Companies ................................................................................................. 8
Table 5. Sources of Revenue for Leading Cruise Companies, 2014-2016 .................................................. 9
Table 6. Relative Contribution of Tourism to Barbados Economy ............................................................ 13
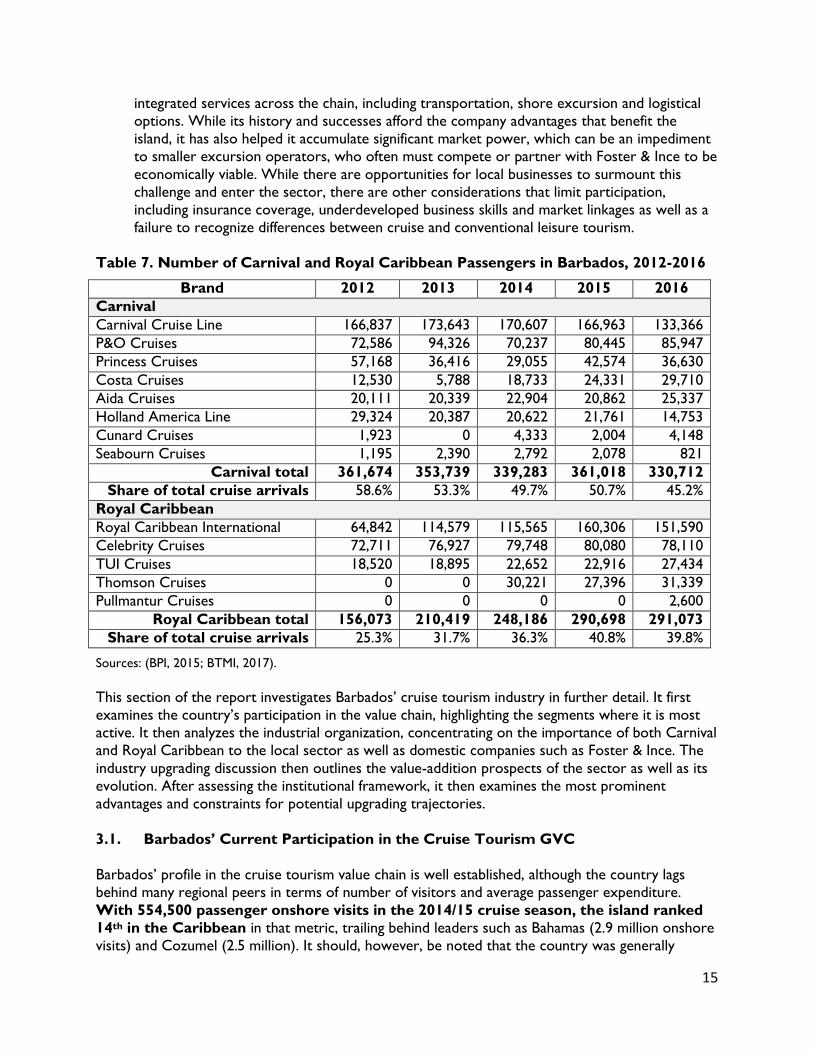
Table 7. Number of Carnival and Royal Caribbean Passengers in Barbados, 2012-2016 ..................... 15
Table 8. Shore Excursion Purchases from Cruise Passenger in Barbados ................................................ 18
Table 9. Cruise Passenger Expenditures in Barbados by Category, 2014/15 season ............................. 19
Table 10. Key Stakeholders in the Cruise Tourism GVC............................................................................. 23
Table 11. Advantages and Constraints of Cruise Tourism in Barbados .................................................... 24
Table 12. Selected Upgrading Strategies in the Cruise Tourism GVC ...................................................... 27
Table 13. Profiles of Cruise Tourism in Barbados, St. Maarten and Puerto Rico ................................... 28
Table 14. Cruise Ship Incentives in Puerto Rico ............................................................................................. 33
Table A-1. Carnival Cruise Line Revenue by Regions, 2014-2016 ............................................................. 36
Table A-2. Global Demand for Cruises, 2015-2016 (thousands) ............................................................... 36
Table A-3. Cruise Passenger Spend Per Category, 2014/2015 ................................................................... 36
Table A-4. Cruise Company Expenditures in Caribbean Ports, 2014/15 Season ................................... 37
Table A-5. Passenger Onshore Visits and Expenditures in Caribbean, 2014/15 season ....................... 37
Table A-6. Selected Indicators of the Cruise Tourism GVC in St. Maarten ............................................ 38
iv
Table A-7. Selected Indicators of the Cruise Tourism GVC in Puerto Rico ........................................... 39
Figures
Figure E-1. Barbados Participation in Cruise Tourism GVC ........................................................................ viii
Figure 1. Cruise Tourism Global Value Chain ................................................................................................... 6
Figure 2. Passenger Visits and Average Expenditures for Cruises in Barbados ....................................... 14
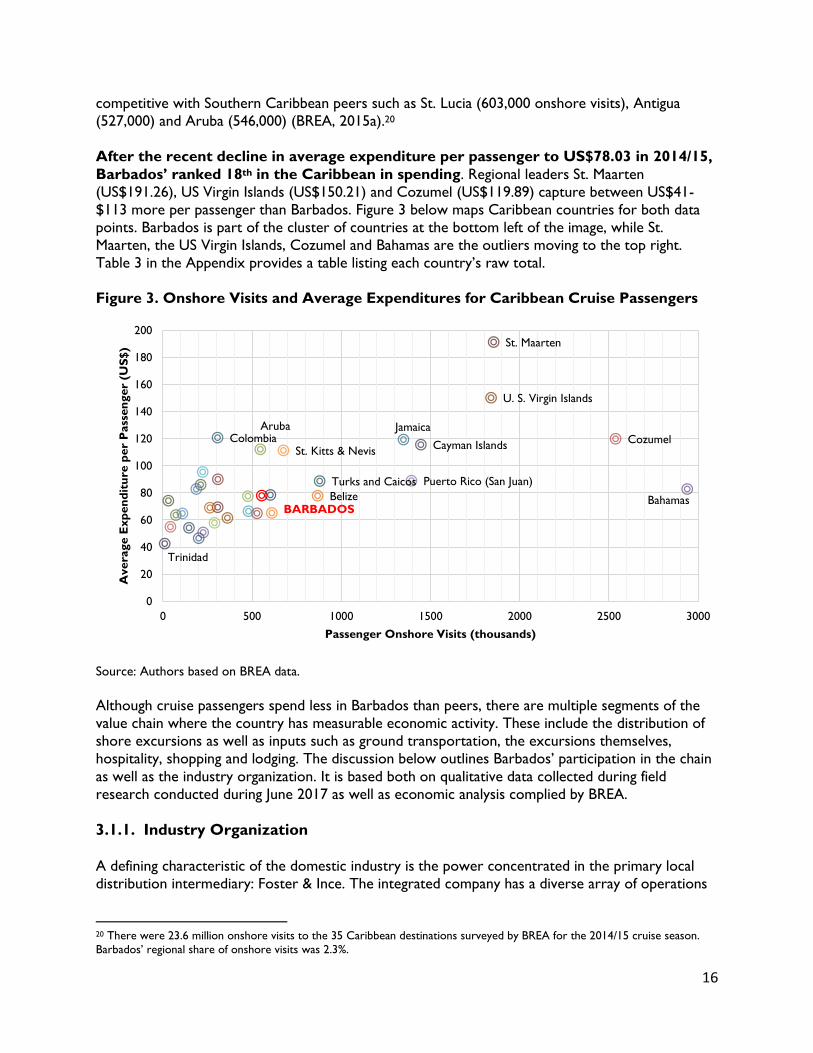
Figure 3. Onshore Visits and Average Expenditures for Caribbean Cruise Passengers ........................ 16
Figure 4. Barbados Participation in Cruise Tourism Industry ...................................................................... 17
Figure 5. Number of Cruise Passengers and Port Calls in Barbados, 2010-2016 ................................... 21
Figure 6. Economic Profile for Cruise Tourism in St. Maarten ................................................................... 29
Figure 7. Puerto Rico’s Cruise Tourism Profile .............................................................................................. 32
Boxes
Box 1. Significant Differences between Cruise and Conventional Tourism ................................. 11
Box 2. Pronounced Geographic Component in Cruise Human Capital ........................................ 12
v
Acronyms
ABTA Association of British Travel Agents
BIDC Barbados Investment & Development Center BPI Barbados Port Inc.
BTII Barbados Tourism Investments Inc.
BTMI Barbados Tourism Marketing Inc.
BTPA Barbados Tourism Product Authority
GVCC Global Value Chain Center
GVC Global Value Chains
DMC Destination Management Companies
GDP Gross Domestic Product
ILO International Labor Organization
ISTU Independent Sea-port Taxi Union
IT Information Technology
MTI Ministry of Tourism and International Transport
SBC Small Business Center
SME Small and Medium-sized Enterprise
STA St. Maarten Tourism Authority
WTTC World Travel & Tourism Council
vi
Executive Summary
This report uses the Duke Global Value Chain (GVCC) framework to examine Barbados’ position
in the cruise tourism global value chain (GVC) and identify opportunities for small businesses within
the sector. While cruise tourism remains a small niche within the broader tourism industry—its 24
million passengers constitute just 2% of worldwide travelers—it is a critical economic activity in the
Caribbean. More than two-thirds of the tourists in the region are cruise-ship passengers. Although
cruise ship tourism is not as lucrative as other forms—tourists on cruise ships spend as little as
one-tenth the consumption of stay-over visitors—it still accounts for an aggregated US$3.1 billion
in expenditures in 2014-15 and supported roughly 75,000 jobs in the Caribbean.
Barbados conforms to this regional trend. Cruise tourism has a large footprint on the island,
contributing 54% of the 1.3 million tourists who visited the country in 2015. While the total
number of cruise passengers arriving in the Bridgetown port has increased in recent years, the
average amount of money they are spending is declining. This report identifies some of constraints
associated with Barbados’ cruise tourism products and outlines potential upgrading strategies to
boost passenger expenditures.
The Cruise Tourism GVC
Cruise tourism can be separated into three categories of actors: consumers, distribution
intermediaries, and service providers. Consumers historically have come from the United States,
with the Caribbean being the primary source of supply. Global demand for cruises increased from
17.8 million passengers in 2009 to 24.2 million in 2016, which is a total jump of 36%. One of the
emerging trends in the industry is its shift away from its traditional North American-Caribbean axis,
with Asia-Pacific supply and demand driving much of the change.
Distribution intermediaries describes the category of actors that coordinate, package and sell
individual services. These businesses include travel agents and cruise companies as well as Shore
Excursion aggregators that bundle domestic activities. The industry is notable for its consolidation.
Three companies—Royal Caribbean, Carnival and Norwegian—control more than 80% of the
market. Most recently, these companies are investing in larger ships with enhanced onboard
entertainment while also diversifying their onshore product offerings.
Popular service providers in the cruise tourism GVC include excursions to local attractions,
dining at local restaurants and bars, and shopping. Estimates suggest 94% of all visitors get off the
ship in Caribbean locations. For smaller businesses that wish to integrate into the chain, the most
straight-forward strategy is to connect with domestic Shore Excursion aggregators, although
lobbying cruise lines directly is also a possibility. Even when that approach is successful, cruise
companies still retain significant control, capturing as much as 70% of the value of consumers’ shore
excursions through commissions and sub-contracting relationships with Shore Excursion
aggregators and other ground handlers.
Beyond the general industry trends, a number of strategies among the leading firms can be
observed, including many that have relevance for local businesses in individual locations. These
include the following:
Ocean-bound cruises are enhancing on-board amenities. Cruise companies are
improving entertainment on the ship to keep consumers on board, even during port calls.
vii
While passenger tickets generally account for 70-75% of the revenue for the three leading
companies, the share of onboard entertainment revenue has trended upward in recent
years for all cruise lines. There is geographic disparity as well—Carnival reported that
passenger income represented 72% of its revenue for North American operations in 2016
and 82% for European consumers.
Cruises are expanding shore offerings in integration efforts designed to capture
increasing shares of passengers’ money. Cruise companies’ drive toward integration
also includes the development of resorts and private ports in locations throughout the
Caribbean. Norwegian owns Great Stirrup Cay, which is a private island in the Bahamas, and
developed the Harvest Caye destination in Belize. Carnivals owns Mahogany Bay in
Honduras while Royal Caribbean has a similar venture in Mexico.
Cruise companies attempt to contain costs through reduction of port fees and
other taxes. Cruise companies use their negotiating power to drive down costs at ports.
Expenditures at each location include passenger-based fees, navigation fees, port taxes, and
charges for utilities, such as water, power and sanitary services. The leverage of individual
countries to negotiate higher fees is limited by the substitutability of ports and the low
levels of sunk costs made by cruise companies in the form of capital investments. Attempts
by individual countries to increase fees have largely been unsuccessful.
In considering new locations, cruise companies prioritize overall itineraries, not
individual destinations. Cruise companies’ negotiating power is further strengthened by
their emphasis on selecting destinations based on overall itineraries rather than individual
attractions—each piece must fit into a coherent package (Rodrique & Notteboom, 2013).
While there is not complete substitutability of port calls, cruise companies must balance the
selection of destinations against operational considerations such as the sequencing of stops,
the sailing schedule of ships, and the size and quality of port infrastructure. The overall
implication is that the power of individual locations is often constrained by factors other
than quality of tourism attractions.
Barbados in Cruise Tourism GVC
Tourism is among the most significant economic activities in Barbados. In 2016, tourism’s direct
contribution to GDP was 12.9%, and it accounted for 62.1% of the country’s exports. The industry
provided direct employment for 17,000 people and indirectly supported the jobs of as many as
51,000, which is roughly 40% of the country’s total labor force. Cruise tourism’s contribution to the
broader tourism portfolio depends on the metric: it provided more than half of the country’s
overall visitors in 2016 at the same time the number of port calls reached a recent historical apex.
On the other hand, cruise tourism only accounted for roughly 9% of total tourism employment.
The most prominent recent trend associated with cruise tourism on the island has been the fact
that more passengers are coming onshore yet spending less money. The total number of onshore
visits from cruise customers increased 33% in the period from the 2005/06 cruise season to
2014/15, from 405,300 to 554,400. However, the average expenditure per passenger fell 30% during
that same period, from US$111.82 to US$78.03. At the same time expenditures have declined, the
perception of Barbados’ tourism products have slipped. The most dramatic regression is associated
with satisfaction of purchased tours (Barbados ranked 24th of 35 in the 2014/15 season compared
with 10th in previous years), although the quality of port infrastructure also remains a concern.
viii
Barbados is notable for the low volume of cruise passengers who purchased organized shore
excursions. Domestic stakeholders estimated that 30-40% of passengers have pre-purchased tours
while 60-70% do not. Surveys conducted in the 2014/15 cruise season suggested 46% of visitors
ultimately purchased organized tours, whether through the cruise line, travel agents or local
providers. That percentage put Barbados behind 29 of 35 destinations in the Caribbean; the country
also ranked last in percentage of tours purchased from onshore tour operators.
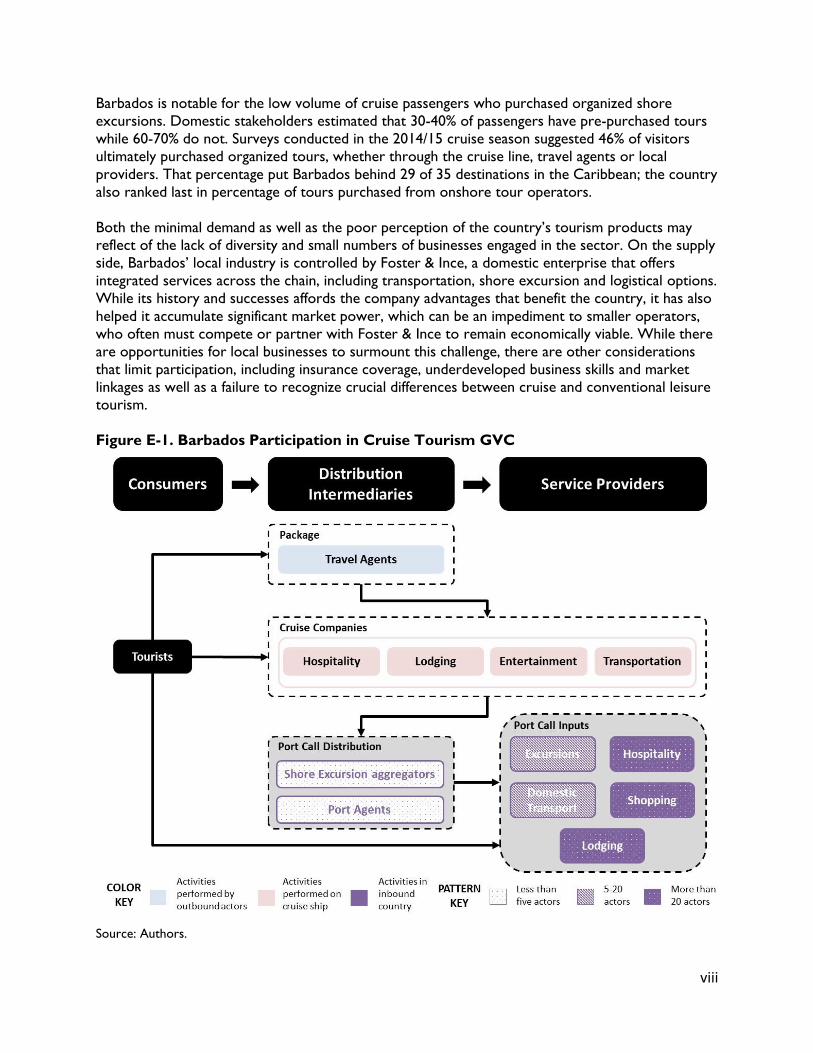
Both the minimal demand as well as the poor perception of the country’s tourism products may
reflect of the lack of diversity and small numbers of businesses engaged in the sector. On the supply
side, Barbados’ local industry is controlled by Foster & Ince, a domestic enterprise that offers
integrated services across the chain, including transportation, shore excursion and logistical options.
While its history and successes affords the company advantages that benefit the country, it has also
helped it accumulate significant market power, which can be an impediment to smaller operators,
who often must compete or partner with Foster & Ince to remain economically viable. While there
are opportunities for local businesses to surmount this challenge, there are other considerations
that limit participation, including insurance coverage, underdeveloped business skills and market
linkages as well as a failure to recognize crucial differences between cruise and conventional leisure
tourism.
Figure E-1. Barbados Participation in Cruise Tourism GVC
Source: Authors.
ix
Given its importance to the Barbadian economy, tourism is a source of interest for multiple
government institutions. To boost the sector’s competitiveness and assist small businesses
attempting to enter the sector, stakeholders can attempt to harness the following advantages:
1. Familiarity of Barbados among cruise consumers: An estimated 50% of cruise
passengers visiting Barbados in the 2014/15 season had been to the island previously, which is
one of the highest percentages in all the Caribbean—the regional average is 37%.
2. Favorable language and crime profile: The United States, Britain and Canada are
Barbados’ largest source of overall visitors. Barbados’ English language skills make the island
an easy destination to visit for these passengers, especially since there are direct flights from
those markets. Furthermore, the island’s comparatively low crime rates also strengthen the
country’s appeal.
3. Bridgetown serving as home port for Carnival: Carnival Cruise Lines brands have used
Barbados as a home port in recent years. During the 2014/15 cruise season, an estimated
119,760 passengers embarked and disembarked at Bridgetown, providing Barbados with an
opportunity to showcase more of its tourism product offerings while also engaging
accommodation providers in the cruise tourism GVC.
4. Extensive industry experience among some private sector actors: Barbados’ roots
in the cruise sector trace back to the 1970s. Some of the most prominent local businesses
have been actively engaged in the industry for a similar duration, affording the companies a
high degree of experience, technical proficiency and familiarity with leading cruise companies.
5. Established government institutions: Barbados has multiple government institutions
devoting attention to the sector. The split of the Barbados Tourism Authority into BTMI and
BTPA created two agencies that can service the sector with initiatives.
At the same time, Barbados has location-specific impediments that limit the country’s
competitiveness. The most pronounced include the following:
1. Lack of new tourism products: Many of the tourism attractions that are featured
regularly as shore excursions are long-standing options that have been marketed for
extended periods. The result is that cruise passengers appear to have tired of some of the
products, which is partially reflected by the fall in satisfaction with purchased tours.
2. Aging and aesthetically limited infrastructure: The Bridgetown Port, which opened in
1961, has both functional and aesthetic limitations. The Sugar Point development was
formulated to address its shortcomings and provide capital improvements; however, there
are financing challenges that may prevent the project from proceeding as planned.
3. Uncompetitive shopping environment. Beyond the quality of tours, Barbados’ lowest
survey marks are associated with its shopping experiences, overall prices and courtesy of
store employees. Local stakeholders in the handicrafts and cruise industry lamented lack of
marketing associated with general shopping and Barbados being a duty-free environment.
Additionally, Pelican Village is relatively old and in need of general reinvigoration.
x
4. High degree of power among limited number of domestic distribution
intermediaries: Foster & Ince holds significant power, with observers of the local industry
estimating that it controls 60-65% of shore excursions offered by cruise lines coming to
Barbados while also handling roughly 95% of port agency responsibilities for the ships.
Although Foster & Ince’s technical acumen provides the country with advantages, its
command presents obstacles for small businesses attempting to integrate into the chain.
5. Limited implementation of strategic objectives by government institutions: The
Master Plan identified actions that would enhance the competitiveness of the cruise sector
with implementation timelines of 2014-18. There has been little progress toward the
articulated goals; moreover, a repeated theme of interviews with stakeholders is that top-
down implementation and vision for the industry could be enhanced.
6. Uneven focus on small business development and human capital development:
Government expenditures related to the cruise sector have concentrated on trips to trade
events and incentives provided to Royal Caribbean to guarantee a minimum number of
passengers. There are human capital considerations and soft skills that warrant further
development. Specifically, Barbadian small businesses need to fully understand the nuances of
the cruise sector compared with conventional stay-over tourism. These include: 1) Insurance
requirements; 2) The importance of business plans and completing required paperwork to
submit proposals to cruise lines; 3) Volume vs. value dynamics; and 4) Overall consistency.
Barbados’ upgrading path in the cruise tourism GVC should serve to address these challenges. The
most immediate upgrading trajectories that will accomplish these aims include:
Short-Term Process Upgrading to Strengthen Backward Linkages with SMEs: Barbados’
government has taken important steps in recent years to boost the competitiveness of the cruise
sector. The focus moving forward should be to continue to bolster the capabilities of Barbadian
businesses with the goal of increasing backward linkages. Both passengers and cruise companies
have indicated there is a clear need for Barbados to refresh onshore experiences. This provides
opportunity for new SMEs to engage in the sector. There are different strategic areas the
government can concentrate its efforts to allow for this upgrading trajectory to emerge, including:
1) Human capital development within SMEs; and 2) Cultivating greater links between cruise
companies and SMEs; and 3) Expanding cruise passengers’ access to SMEs.
Short-to-Medium Term Product Upgrading to Improve Infrastructure: The products
available to cruise consumers visiting Barbados require reinvigoration. Some of the potential
improvements have been identified by government stakeholders, with the Sugar Point development
being the most obvious example. In the absence of immediate funding for infrastructure, Barbados
can concentrate on economical upgrades that nonetheless enhance tourism products.
Short-to-Medium Term Functional Upgrading to Increase Number of Stay-Over
Visitors from Cruises: Barbados has engaged in product and functional upgrading through its
position as a home port for Carnival Cruise Lines. However, the benefits associated with this
upgrading have been muted since only 8% of home port passengers spend at least one night in
Barbados. Increasing the number of both home-port passengers who stay on the island for an
extended period can further engage businesses and categories of actors who do not currently
participate in the cruise tourism chain.

1
1. Introduction
The cruise sector constitutes a small but growing pocket of the global tourism industry. What was
once an activity characterized by American consumers sailing to Caribbean locations to soak up the
sun has expanded to new destinations, first in Europe and then in the Asia-Pacific region. At the
same time that the geographic profile has diversified, the ships themselves have become larger with
more elaborate entertainment features as leading companies attempt to capture more revenue
from their consumers. The pursuit of new destinations and onboard amenities led to 25.3 million
global passengers in 2015, supporting some 956,000 jobs and generating an estimated $117 billion in
total worldwide economic output (CLIA, 2017).
As a 166-square mile island in the southern Caribbean, Barbados’ tourism industry relies heavily on
visitors arriving by ship. Cruise passengers accounted for 54% of total arrivals to the country in
2015. Growth in the number of arrivals has been strong, with a 200% increase in the 20-plus years
since a new cruise terminal opened in 1994 (Business Barbados, 2017). But while the overall
number of passengers has increased steadily, and those visitors are spending less money on the
island, thereby muting the sector’s economic benefits.
This report uses the Duke GVCC Global Value Chains (GVC) framework to assess how Barbados
can increase domestic linkages to the cruise tourism industry with the goal of boosting passenger
expenditures, thereby providing increased benefits for its small and medium-sized enterprises
(SMEs). It first examines the global sector, identifying key trends, important actors and the ways
these features influence local enterprises in individual locations. It then shifts its focus to Barbados,
where companies such as Carnival Cruise Lines and Royal Caribbean have strong presences,
delivering more than 85% of the island’s 730,000 cruise passengers in 2016. After an analysis of the
domestic landscape for both the private and public sector, it identifies advantages and constraints
that influence the country’s participation in the chain.
After the analysis of Barbados’ role in the sector, the paper then examines St. Maarten’s and Puerto
Rico’s experiences to extract useful lessons for the country’s growth. St. Maarten is notable for the
critical infrastructure improvements it has made through partnership arrangements between its
government and cruise lines that have allowed the country to increase average passenger
expenditures. Puerto Rico, meanwhile, has changed its incentive regime to assist domestic
businesses in the sector. The report then concludes by identifying upgrading trajectories for
Barbados.
2. The Cruise Tourism Global Value Chain
Tourism is a dynamic source of economic growth throughout the world. The industry indirectly
supported an estimated 292 million jobs in 2015 and indirectly accounted for 10.2% of global GDP.1
Its direct effect to global GDP was estimated at 3.1%, and tourism’s growth rate—also 3.1%—was
higher than many other sectors, including agriculture, manufacturing, retail and financial services.2
Because of the expansion, tourism generated close to 7% of the world’s total exports in 2015
1 Unless otherwise specified, the global and regional statistics cited in this section are compiled by the World Travel & Tourism
Council (WTTC). The WTTC data can be accessed through the WTTC website: http://www.wttc.org/datagateway/. 2 The WTTC defines direct contribution to GDP is as follows: “GDP generated by industries that deal directly with tourists,
including hotels, travel agents, airlines and other passenger transport services, as well as the activities of restaurant and leisure
industries that deal directly with tourists (WTTC, 2017a).”
2
(UNWTO, 2016). The vitality of the industry is not confined to any one region; while Europe
remains the most visited continent in the world, Asia Pacific and Africa had the highest growth rates
in visitors over the decade from 2006-2015.
With its idyllic beach settings and unique cultural experiences, tourism is a significant economic
activity in the Caribbean. All forms of tourism accounted for 15% of the Caribbean’s GDP in 2016,
which was the largest share of any region in the world (WTTC, 2017c). Buoyed by a 7% growth in
visitor arrivals in 2015 (CTO, 2015), tourism also accounted for the highest share of total
employment, capital investments and visitor exports in the Caribbean of anywhere in the world
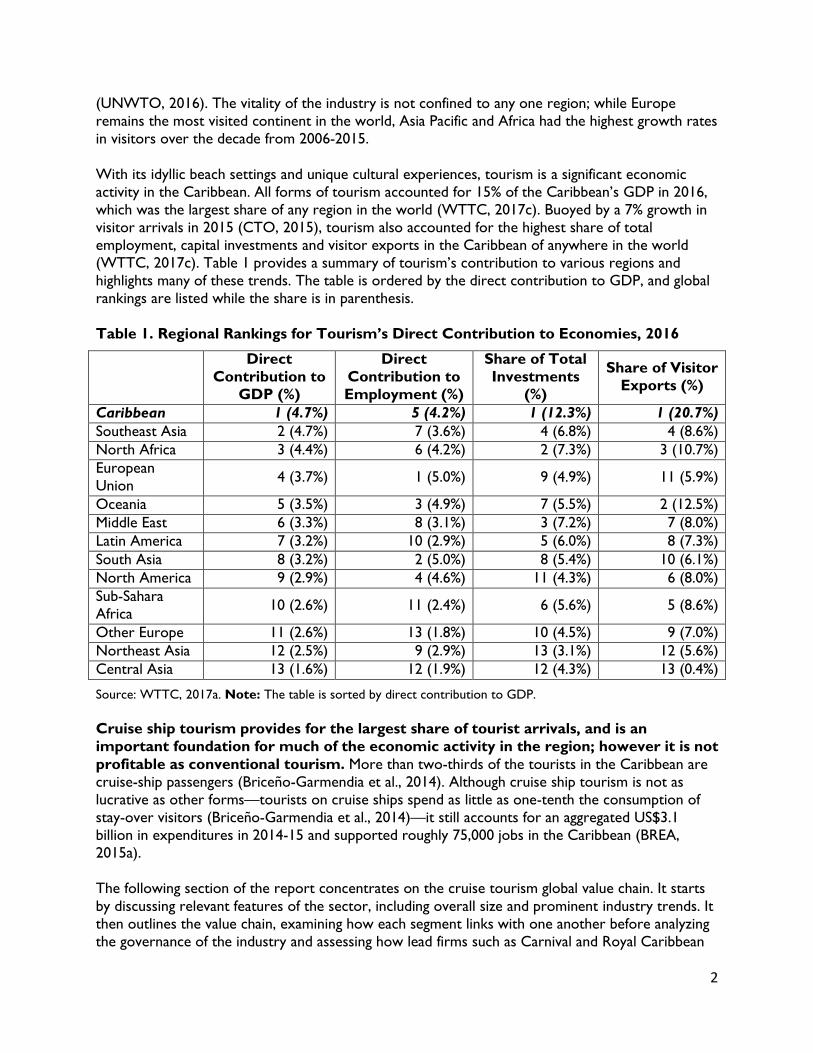
(WTTC, 2017c). Table 1 provides a summary of tourism’s contribution to various regions and
highlights many of these trends. The table is ordered by the direct contribution to GDP, and global
rankings are listed while the share is in parenthesis.
Table 1. Regional Rankings for Tourism’s Direct Contribution to Economies, 2016
Direct
Contribution to
GDP (%)
Direct
Contribution to
Employment (%)
Share of Total
Investments
(%)
Share of Visitor
Exports (%)
Caribbean 1 (4.7%) 5 (4.2%) 1 (12.3%) 1 (20.7%)
Southeast Asia 2 (4.7%) 7 (3.6%) 4 (6.8%) 4 (8.6%)
North Africa 3 (4.4%) 6 (4.2%) 2 (7.3%) 3 (10.7%)
European
Union 4 (3.7%) 1 (5.0%) 9 (4.9%) 11 (5.9%)
Oceania 5 (3.5%) 3 (4.9%) 7 (5.5%) 2 (12.5%)
Middle East 6 (3.3%) 8 (3.1%) 3 (7.2%) 7 (8.0%)
Latin America 7 (3.2%) 10 (2.9%) 5 (6.0%) 8 (7.3%)
South Asia 8 (3.2%) 2 (5.0%) 8 (5.4%) 10 (6.1%)
North America 9 (2.9%) 4 (4.6%) 11 (4.3%) 6 (8.0%)
Sub-Sahara
Africa 10 (2.6%) 11 (2.4%) 6 (5.6%) 5 (8.6%)
Other Europe 11 (2.6%) 13 (1.8%) 10 (4.5%) 9 (7.0%)
Northeast Asia 12 (2.5%) 9 (2.9%) 13 (3.1%) 12 (5.6%)
Central Asia 13 (1.6%) 12 (1.9%) 12 (4.3%) 13 (0.4%)
Source: WTTC, 2017a. Note: The table is sorted by direct contribution to GDP.
Cruise ship tourism provides for the largest share of tourist arrivals, and is an
important foundation for much of the economic activity in the region; however it is not
profitable as conventional tourism. More than two-thirds of the tourists in the Caribbean are
cruise-ship passengers (Briceño-Garmendia et al., 2014). Although cruise ship tourism is not as
lucrative as other forms—tourists on cruise ships spend as little as one-tenth the consumption of
stay-over visitors (Briceño-Garmendia et al., 2014)—it still accounts for an aggregated US$3.1
billion in expenditures in 2014-15 and supported roughly 75,000 jobs in the Caribbean (BREA,
2015a).
The following section of the report concentrates on the cruise tourism global value chain. It starts
by discussing relevant features of the sector, including overall size and prominent industry trends. It
then outlines the value chain, examining how each segment links with one another before analyzing
the governance of the industry and assessing how lead firms such as Carnival and Royal Caribbean
3
have leverage over smaller actors in the chain. The global section concludes by briefly examining
human capital characteristics of the industry.
2.1. Global Cruise Tourism Industry
The cruise sector is a niche within the broader tourism industry. In 2015, there were almost 1.2
billion worldwide travelers compared with just 23.19 million cruise ship passengers, which means
the cruise industry has less than 2% of the volume of participants as conventional tourism (CLIA,
2017; UNWTO, 2016). The economic contribution of cruise tourism to local economies is similarly
muted. Estimates vary in terms of the discrepancy between the economic benefits associated with
cruise tourism and stay-over visitors; however, the body of research clearly indicates cruise tourism
does not generate the same financial returns. Cruise passengers spend 30% less than conventional
tourism (Brida & Zapata, 2010); other estimates have suggested cruise tourism only generates 10%
of the overall revenue (Briceño-Garmendia et al., 2014). While the industry is relatively small with
limited economic benefits transferring to local economies, there are favorable growth trends.
Global demand for cruises increased from 17.8 million passengers in 2009 to 24.2 million in 2016,
which is a total jump of 36% (CLIA, 2016a).
If these are two of broad characteristics of the cruise industry—a small yet increasing facet of the
tourism industry—there are also pronounced characteristics and trends that can be observed.
These include the following:
The cruise market is diversifying away from its traditional North America-
Caribbean foundation, with Asia-Pacific supply and demand driving much of the
change. The cruise industry’s roots can be traced to the late 1960s and early 1970s.
Carnival Cruise Lines incorporated in 1968 with Miami as its home port. North America
demand for Caribbean cruises remained the industry’s defining characteristics in its incipient
phases. As recently as 2005, North American consumers still accounted for 70% of cruise
consumers while the Caribbean region attracted approximately 50% of all available lower
berth days on all cruise ships (Gui & Russo, 2011).3
By 2016, however, the North American and Caribbean position had deteriorated to a
degree—North American customers represented roughly 50% of all cruise consumers, while
the Caribbean accounted for 34% of all cruise bed nights, which was a 3.6% decline from five
years earlier. Interest in cruises in Asia and Australia drove much of the change. Chinese
demand for cruises jumped from 700,000 customers in 2015 to 986,000 in 2016, and Asia had
the highest growth in available of lower berth days (5.6%) in the period from 2012-2016.
Meanwhile, Australia’s demand for cruises increased six-fold in the period from 2004 to 2014,
and the country has the highest market penetration of citizens taking cruises of anywhere in
the world (4.2%) (CLIA, 2017; Dowling & Weeden, 2017).
3 Lower berths refer to beds available on a ship cruise ship.
4
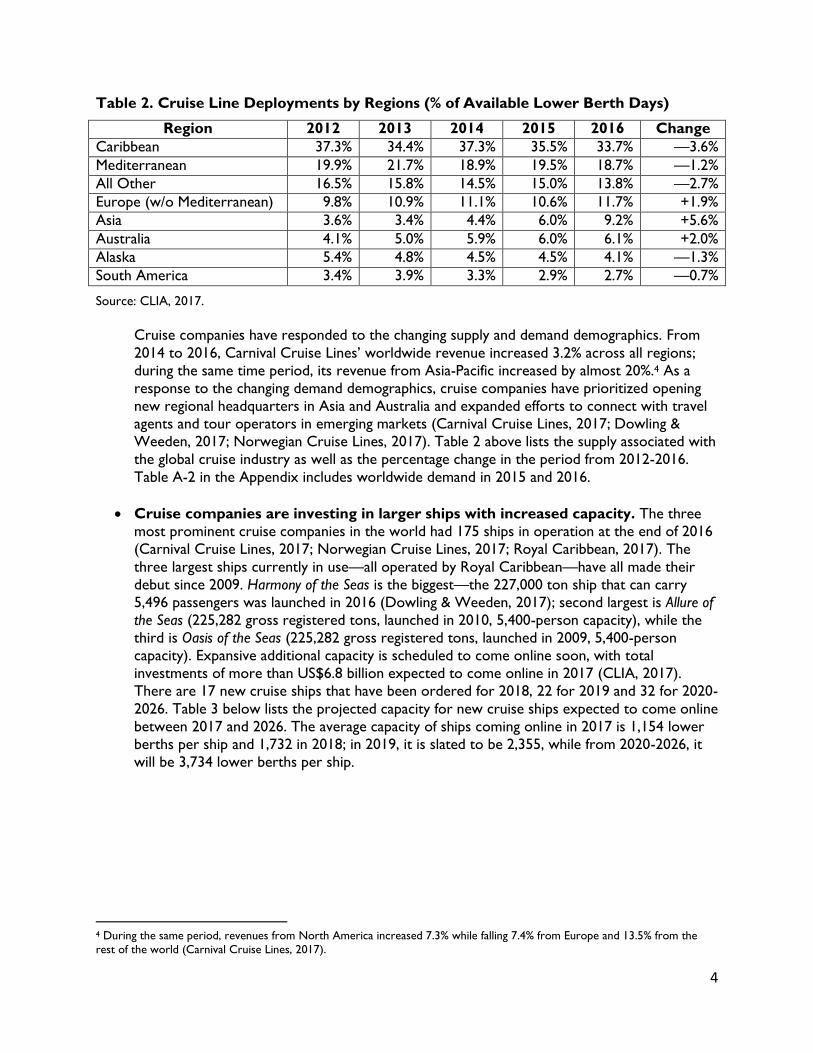
Table 2. Cruise Line Deployments by Regions (% of Available Lower Berth Days)
Region 2012 2013 2014 2015 2016 Change
Caribbean 37.3% 34.4% 37.3% 35.5% 33.7% —3.6%
Mediterranean 19.9% 21.7% 18.9% 19.5% 18.7% —1.2%
All Other 16.5% 15.8% 14.5% 15.0% 13.8% —2.7%
Europe (w/o Mediterranean) 9.8% 10.9% 11.1% 10.6% 11.7% +1.9%
Asia 3.6% 3.4% 4.4% 6.0% 9.2% +5.6%
Australia 4.1% 5.0% 5.9% 6.0% 6.1% +2.0%
Alaska 5.4% 4.8% 4.5% 4.5% 4.1% —1.3%
South America 3.4% 3.9% 3.3% 2.9% 2.7% —0.7%
Source: CLIA, 2017.
Cruise companies have responded to the changing supply and demand demographics. From
2014 to 2016, Carnival Cruise Lines’ worldwide revenue increased 3.2% across all regions;
during the same time period, its revenue from Asia-Pacific increased by almost 20%.4 As a
response to the changing demand demographics, cruise companies have prioritized opening
new regional headquarters in Asia and Australia and expanded efforts to connect with travel
agents and tour operators in emerging markets (Carnival Cruise Lines, 2017; Dowling &
Weeden, 2017; Norwegian Cruise Lines, 2017). Table 2 above lists the supply associated with
the global cruise industry as well as the percentage change in the period from 2012-2016.
Table A-2 in the Appendix includes worldwide demand in 2015 and 2016.
Cruise companies are investing in larger ships with increased capacity. The three
most prominent cruise companies in the world had 175 ships in operation at the end of 2016
(Carnival Cruise Lines, 2017; Norwegian Cruise Lines, 2017; Royal Caribbean, 2017). The
three largest ships currently in use—all operated by Royal Caribbean—have all made their
debut since 2009. Harmony of the Seas is the biggest—the 227,000 ton ship that can carry
5,496 passengers was launched in 2016 (Dowling & Weeden, 2017); second largest is Allure of
the Seas (225,282 gross registered tons, launched in 2010, 5,400-person capacity), while the
third is Oasis of the Seas (225,282 gross registered tons, launched in 2009, 5,400-person
capacity). Expansive additional capacity is scheduled to come online soon, with total
investments of more than US$6.8 billion expected to come online in 2017 (CLIA, 2017).
There are 17 new cruise ships that have been ordered for 2018, 22 for 2019 and 32 for 2020-
2026. Table 3 below lists the projected capacity for new cruise ships expected to come online
between 2017 and 2026. The average capacity of ships coming online in 2017 is 1,154 lower
berths per ship and 1,732 in 2018; in 2019, it is slated to be 2,355, while from 2020-2026, it
will be 3,734 lower berths per ship.
4 During the same period, revenues from North America increased 7.3% while falling 7.4% from Europe and 13.5% from the
rest of the world (Carnival Cruise Lines, 2017).
5
Table 3. Projected New Cruise Ship Capacity, 2017-2026
Year Ocean River Ships
Ordered
New Capacity
(Lower Berths)
Average Capacity
Per Ship
2017 13 13 26 30,006 1,154
2018 15 2 17 29,448 1,732
2019 20 2 22 51,824 2,355
2020-2026 32 0 32 119,510 3,734
Total 80 17 97 230,788 2,379
Source: CLIA, 2017.
Cruise ship companies are diversifying product offerings. At the same time Asia and
Australia have become increasingly important markets, the product options in traditional
markets are diversifying. River cruises have had success attracting customers, especially in
Europe. River products have different profiles than ocean cruises, with education and cultural
opportunities in ports ranking as more significant attractions (CLIA, 2016b). Within ocean
cruises, culinary offerings, stateroom amenities and entertainment options are major selling
points, with destinations de-emphasized in favor of on-board amenities (CLIA, 2016b). To
take advantage of the interest in onboard entertainment, cruise companies are improving
stateroom and dining options in ways that appeal to younger consumers while also offering
themed cruises that are capitalize on popular media and show-business trends (Kasriel-
Alexander, 2016). The governance section below analyzes product offering trends in further
detail while also extrapolating regional-level implications.
2.2. The Cruise Tourism Global Value Chain
The GVC methodology has been used to analyze the tourism industry in various regions of the
world.5 The focus, however, has been on different types of leisure travel and the cruise industry
has been studied under the GVC lens less frequently.6 Building upon distinctions of tourism actors
outlined by Christian & Nathan (2013) and used by other value chain researchers (Daly & Gereffi,
2017; Daly & Guinn, 2016), the cruise tourism value chain can be divided into three categories of
actors: consumers (or tourists), distribution intermediaries, and service providers. Figure 1 below
provides an illustration, tracing both the communication flows and tourists’ expenditures and
experiences through the chain.
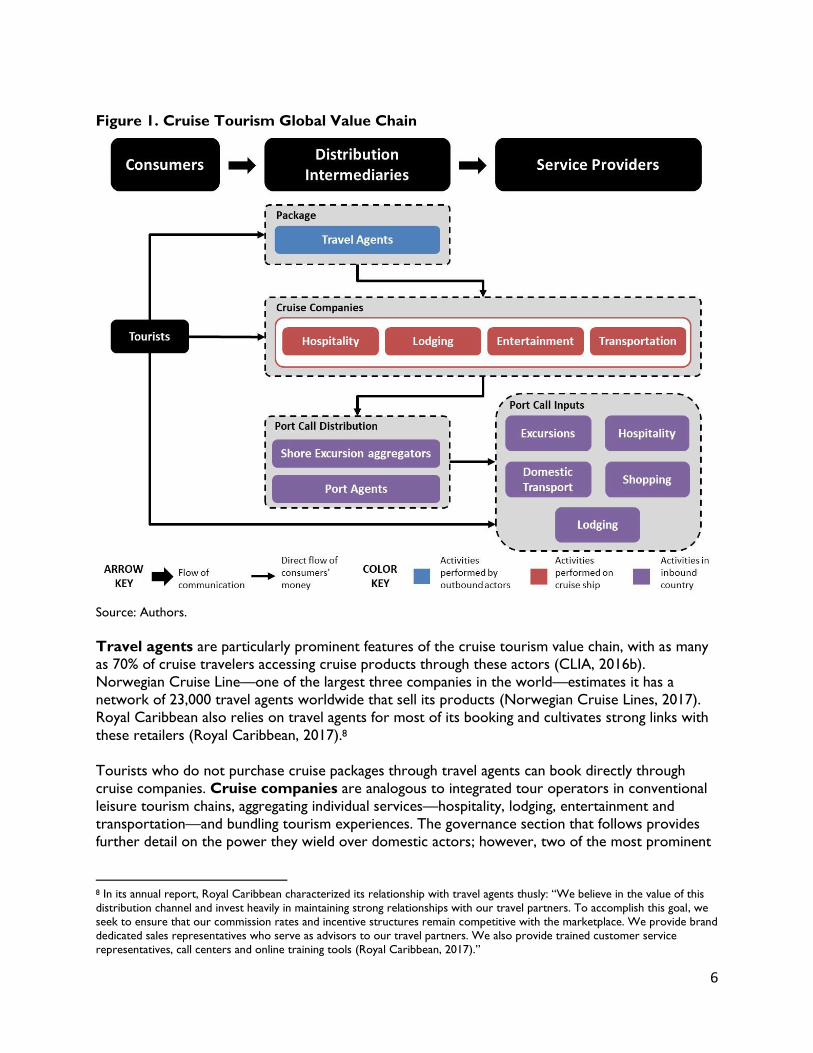
As can be seen in Figure 1, there are three possible distribution channels; identity, power, and
linkages among actors depend on which of these three channel consumers use to access the
product. The package distribution channel is depicted at the top of the diagram. In cruise tourism
chains, the package channel captures the significant role played by travel agents; these actors largely
sell already-assembled packaged tours or vacation experiences.7 As primary point of contact with
consumers, a major value addition is that travel agents create trust that the experience will conform
to travelers’ expectations.
5 Michelle Christian has published many research papers on the tourism industry using a GVC lens (Christian, 2013, 2015;
Christian et al., 2011; Christian & Nathan, 2013). 6 Exceptions include Clancy, who used a global commodity chain approach (Clancy, 2008). The global commodity chain
framework preceded the GVC literature but has many similar features (Bair, 2005). 7 In traditional leisure tourism value chains, the package tour channel includes networks of travel agents, tour operators and
Destination Management Companies (DMCs) that coordinate tourists’ activities in a location.
6
Figure 1. Cruise Tourism Global Value Chain
Source: Authors.
Travel agents are particularly prominent features of the cruise tourism value chain, with as many
as 70% of cruise travelers accessing cruise products through these actors (CLIA, 2016b).
Norwegian Cruise Line—one of the largest three companies in the world—estimates it has a
network of 23,000 travel agents worldwide that sell its products (Norwegian Cruise Lines, 2017).
Royal Caribbean also relies on travel agents for most of its booking and cultivates strong links with
these retailers (Royal Caribbean, 2017).8
Tourists who do not purchase cruise packages through travel agents can book directly through
cruise companies. Cruise companies are analogous to integrated tour operators in conventional
leisure tourism chains, aggregating individual services—hospitality, lodging, entertainment and
transportation—and bundling tourism experiences. The governance section that follows provides
further detail on the power they wield over domestic actors; however, two of the most prominent
8 In its annual report, Royal Caribbean characterized its relationship with travel agents thusly: “We believe in the value of this
distribution channel and invest heavily in maintaining strong relationships with our travel partners. To accomplish this goal, we
seek to ensure that our commission rates and incentive structures remain competitive with the marketplace. We provide brand
dedicated sales representatives who serve as advisors to our travel partners. We also provide trained customer service
representatives, call centers and online training tools (Royal Caribbean, 2017).”
7
characteristics when considering the dynamics of the chain are as follows: 1) Cruise companies are
increasingly integrated, offering expanded hospitality, shopping and entertainment options in
addition to lodging and transportation on the ship as well as pursuing direct ownership over shore
attractions; and 2) Cruise companies often control consumers’ access to services in ports, capturing
as much as 70% of the value of consumers’ shore excursions through commissions and sub-
contracting relationships with Shore Excursion aggregators, Gate Agents and other ground handlers
(Cheong, 2013).
Shore Excursion aggregators and Port Agents are the two most important domestic
distribution intermediaries. Shore Excursion aggregators are similar to DMCs in traditional leisure
tourism, interacting directly with the tourist while providing transportation, hospitality, excursion
or shopping offerings. While they may be integrated and offer individual excursions themselves,
these businesses can bundle various services into cohesive packages. They may also coordinate any
transfer to local airports if passengers are permanently disembarking. Port Agents generally are not
oriented toward customers, although they may provide transportation between airports and sea
ports in locations where cruises commence and conclude. Although this provides value, their
primary services relate to the ship itself when docked. In addition to booking berths and organizing
the clearance of the ship through customs, Port Agents interact directly with the crew, handling any
services that are required during the port call. They may also handle provisions and the loading of
cargo containers. In smaller destinations, Shore Excursion aggregators and Port Agents are regularly
integrated, although separate departments often concentrate on the different activities (Field
Research, 2017).
Tourists do have the ability to direct their own sight-seeing activities once off the ship, a fact that is
illustrated in Figure 2 with the bottom arrow linking directly with port call inputs. However, existing
research indicates this distribution channel remains underdeveloped, with individual studies
indicating that more than 50% of land-based activities being controlled by cruise companies (Brida &
Zapata, 2010; Diedrich, 2010; IFC, 2014, 2016). In total, estimates suggest 94% of all visitors get off
the ship in Caribbean locations (BREA, 2015a). Popular activities for cruise tourists in ports include
excursions to local attractions, dining at local restaurants and bars, and shopping. In an economic
analysis of consumer spending during the 2014/15 cruise season in 35 Caribbean locations, visitors
spent at average of $103.83 at each destination (BREA, 2015a). The only two categories that the
majority of tourists participated in were shore excursions (53% of all disembarking passengers) and
food and beverage at local establishments (51%). Table A-3 in the Appendix provides a detailed
summary—watches and jewelry had the highest average spending (US187 per passenger).
2.3. Lead Firms and Governance
After a wave of consolidation in the late 1990s and early 2000s, the cruise ship industry today is
highly concentrated around three leading companies—Royal Caribbean, Carnival and Norwegian—
that control more than 80% of the market (Dowling & Weeden, 2017). With a diverse array of
brands that appeal to different geographic locations and market segments,9 the companies
generated more than US$29 billion in sales in 2016. Carnival Cruise Lines is the largest of the three
as measured by employees, annual revenues, number of ships and passenger capacity. The
9 Carnival Cruise Lines, for instance, has Carnival, Princess, P&O, Holland America, Aida, Seabourn, Cunard and others under
its corporate umbrella. The Carnival brand has 25 ships and targets mass markets in North America. Princess Cruises has 18
ships and has more expansive upmarket and geographic options. Holland America has 14 smaller ships that provide a more
intimate experience. Seabourn focuses on the luxury market while Costa and Aida have more narrow European focuses.

8
company’s 2016 sales were roughly double those of Royal Caribbean and almost four times greater
than Norwegian. It also has more employees and ships than its two closest competitors combined.
Table 4 below provides brief profiles of the leading companies. Together, the trio employ close to
190,000 workers.
Table 4. Profiles of Leading Cruise Companies
Carnival Cruise
Lines
Royal Caribbean
Cruise Lines
Norwegian Cruise
Lines
Headquarters Doral, Fla. Miami Miami
Founded 1972 1968 1966
Brands
Carnival Cruise Line,
Holland America Line,
Princess Cruises
(Princess), Seabourn,
Aida, Costa, Cunard,
P&O Cruises
Royal Caribbean
International, Celebrity
Cruises, Azamara Club
Cruises
Norwegian Cruise
Line,
Oceania Cruises,
Regent Seven Seas
Cruises
2016 Sales
(US$, millions) $16,389 $8,196 $4,874
Employees 91,300 66,100 30,000
Ships 102 49 24
Lower Berths 226,000 123,270 46,000
Sources: Company annual reports.
There are a number of entrenched advantages in cruise tourism that accentuate the power of lead
firms. One is the high capital costs associated with building new ships—Royal Caribbean’s Harmony
of the Seas, the world’s largest cruise ship, was completed in 2016 with a price tag of US$1.35
billion (Smith, 2015). Another is the substitutability of destinations. In many locations, the low levels
of sunk costs for cruise companies in terms of capital investments—port facilities are generally
financed by the government, although this evolving to a degree—as well as the selection of new
locations based on geographic considerations as much as local attractions (see industry trend #3
below) increase the leverage of the big companies. These characteristics are reinforced by current
industry trends, the most prominent of which are detailed below. Aggregated, these features point
to a relationship between major actors and small businesses that is increasingly ambivalent—a zero-
sum rather than a positive-sum game.
1. Ocean-bound cruises are enhancing on-board amenities. The “internalization”
strategy of cruise lines involves improving entertainments on the ship to keep consumers on
board, even during port calls (Clancy, 2008). The Global Cruise Tourism Industry section of
this report details the geographical distinctions associated with cruise products—ocean-
bound cruises popular in locations such as the Caribbean emphasize attractions on the ship
itself while river and other European attractions focus more on shore excursions. The
implication of this trend is that cruise lines themselves have limited motivation to encourage
customers to disembark during port calls, which means local businesses must have a
compelling value proposition.

9
Table 5. Sources of Revenue for Leading Cruise Companies, 2014-2016
2016 2015 2014
Carnival
Passenger Tickets 73.8% 73.8% 74.8%
Onboard 24.8% 24.7% 23.8%
Tour & Other10 1.4% 1.4% 1.4%
Royal Caribbean
Passenger Tickets 72.0% 73.0% 73.0%
Onboard 28.0% 27.0% 27.0%
Norwegian
Passenger Tickets 69.5% 72.0% 69.6%
Onboard 30.5% 28.0% 30.4%
Source: Company annual reports.
The revenue sources of leading cruise companies reinforce this point. Table 5 above
presents a broad global overview of the share of passenger ticket revenue compared with
onboard entertainment. While passenger tickets generally account for 70-75% of the
revenue for the three leading companies, the share of onboard entertainment revenue has
trended upward in the last three years for each. There is also geographic and longitudinal
variance. For the Carnival Cruise Company, passenger income represented 72% of its
revenue for North American consumers in 2016 versus 82% for European consumers,
which reinforces the idea that European consumers are more likely to spend money off the
ship. Across all geographies, Carnival’s onboard entertainment revenues had increased 7.6%
at the end of 2016 compared to two years earlier with 1.7% for passenger ticket revenue.
Consumer spending on entertainment rose by US$55 million in 2016 alone (Carnival Cruise
Lines, 2017).
2. Cruises are expanding shore offerings in integration efforts designed to capture
increasing shares of passengers’ money. Cruise companies’ drive toward integration
also includes the development of resorts and private ports in locations throughout the
Caribbean where they receive all revenues. Norwegian owns Great Stirrup Cay, which is a
private island in the Bahamas, and developed the Harvest Caye destination in Belize, which
opened in 2016 (Norwegian Cruise Lines, 2017). Carnival owns Mahogany Bay in Honduras
while Royal Caribbean has a similar venture in Mexico. Cruise ships dock at ports adjacent
to these locations, most of which are remote and have limited connections with the
broader local economy (Rodrigue & Notteboom, 2013).
3. Cruise companies are attempting to contain costs through reduction of port
fees and other taxes. If internalization is an industry-wide strategy for increasing revenue,
cruise companies also use their negotiating power to drive down costs at ports.
Expenditures at each location include passenger-based fees, navigation fees, port taxes, and
charges for utilities, such as water, power and sanitary services (BREA, 2015a). Other
categories of costs for the cruise companies include food and beverage purchases as well as
payments to local tour operators. In the nine Caribbean countries where companies were
10 Carnival includes revenues from the following sources in its Tour & Other category: hotel and transportation operations;
land packages; and long-term leasing of ships (Carnival Cruise Lines, 2017).
10
estimated to have spent more than US$10 million during the 2014/15 cruise season, port
and navigation fees were the largest single expenditure, often accounting for 90-95% of the
total costs. Table A-4 in the Appendix provides further information and includes notes on
significant expenses for cruise companies in each location. In total, cruise companies spent
$400.8 million in 35 Caribbean destinations in the 2014/15 season (BREA, 2015a).
The leverage of individual countries to negotiate higher port fees is limited by the
substitutability of ports and the low levels of sunk costs made by cruise companies in the
form of capital investments in individual locations (Clancy, 2008). Almost all destinations in
the Caribbean charge less than US$10 per passenger (Wood, 2004), although Bermuda is
one prominent exception, implementing a tax of US$60 per passenger plus an additional
surcharge in high season (Cheong, 2013). Attempts by individual countries to increase fees
have largely been ineffective, and collective negotiation by regional organizations has also
been unsuccessful (Clancy, 2008).
4. In considering new locations, cruise companies prioritize overall itineraries, not
necessarily individual destinations. Cruise companies’ negotiating power is further
strengthened by their emphasis on selecting destinations based on overall itineraries rather
than individual attractions—each separate piece must fit into a coherent package (Rodrigue
& Notteboom, 2013). While there is not complete substitutability of port call locations,
cruise companies must balance the selection of destinations against operational
considerations such as the sequencing of stops, the sailing schedule of ships, and the size and
quality of port infrastructure. Despite the fact this nuance might afford individual locations
increased leverage based on geographic considerations, the overall implication reinforces
the governance structure of the industry—potential port calls’ power is often constrained
by factors other than quality of tourism attractions.
5. FCCA, CLIA and others act as critical supporting institutions. The Florida-
Caribbean Cruise Association (FCCA) and the Cruise Lines International Association
(CLIA) are two industry organizations that wield sizeable influence in the sector. The FCCA,
which was created in 1972 and is based in Florida, is composed of 19-member cruise lines,
including the three global leaders (FCCA). The organization regularly organizes trade shows
that offer smaller businesses educational forums and access to decision-makers from the
cruise companies. CLIA represents a broader base, including cruise lines, travel agents and
local distribution intermediaries. There are also other important supporting institutions and
companies. Aon, the insurance company, is one of the more significant—the US-based firm
has developed a Tour Operators Liability Insurance Program and regularly offers training
sessions in destinations to improve the competitiveness of local small businesses (Field
Research, 2017).
The resources that organizations such as FCCA, CLIA and Aon provide to actors in the
cruise tourism value chain can provide valuable background on some of the nuances of the
industry compared with conventional leisure tourism. Box 1 below highlights some of the
ways cruise tourism is differentiated from more conventional leisure tourism where visitors
spend nights in local locations.
11
Box 1. Significant Differences between Cruise and Conventional Tourism
While there are numerous similarities between cruise and conventional stay-over tourism, there
are nuances that distinguish the dynamics in the cruise tourism chain. These differences, in turn,
have implications for small businesses wishing to participate in the sector. Some of the more
pronounced include:
INSURANCE: While there are insurance considerations in conventional tourism, cruise
lines demand shore excursion providers have high liability coverage to serve to act as
protection from lawsuits.
CONSISTENCY: Cruise passengers are rarely onshore for more than eight hours, and
individual excursions typically last for 2-4 hours. The condensed time window places a
premium on consistency: Whereas businesses engaging stay-over visitors may have multiple
opportunities to correct mistakes, cruise businesses that do not meet customers’ standards
have little chance to change opinions. According to industry stakeholders, cruise companies
are then quick to offer refunds to passengers without discussing with their domestic
partners.
VOLUME vs. VALUE CONSIDERATIONS: The strategies for businesses in
conventional tourism chains often concentrates on either generating high volumes of visitors
or establishing a high value that allows them to charge premium prices. In cruise tourism,
high-priced shore excursions face challenges since: 1) Cruise lines often mark-up individual
excursions by as much as 100%, inflating the price further; 2) Transportation considerations
give economies-of-scale advantages to larger groups. As such, natural environment
attractions and other excursions in other settings that are best experienced by low numbers
of visitors are at a disadvantage when being evaluated by cruise companies.
Source: (Field Research, 2017) .
6. Cruise ships are often exempt from national regulations, influencing their labor,
environmental and tax strategies. Most cruise operators sail under “Flags of
Convenience,” which allows companies to circumvent tax liabilities, safety standards and
inspections as well as environmental laws (Cheong, 2013).11 Despite the fact there is
established international maritime law with conventions under both the International Labor
Organization (ILO) and International Maritime Organization, it has proven near impossible
for states to enforce domestic and international laws on cruise lines when they are in
international waters (Hil, 2015) .12 There are important consequences of this for labor
conditions. Cruise ship workers typically work on six-month contracts, with an excessive
workweek of 80 or more hours, seven days a week. Workers have little guarantees of
future employment. Additionally, cruise workers are required to pay for transportation to
the ship, any visas or work permits and medical or legal permits (Hil, 2015). Salaries range
11 Flags of Convenience is a business practice whereby a merchant ship is registered in a country other than that of the ship's
owners, and the ship flies that country's civil ensign. In these cases, the ship is governed by laws of the country where it is
registered, as well as international conventions enforced by that country. For vessels that are registered in the United States, it
is worth noting that the country has never ratified the United Nations Convention on the Law of the Sea (UNCLOS). 12 In recent cases, cruise companies have re-routed ships that have been fined in particular ports without addressing abuses. For
example, Royal Caribbean’s Oasis of the Seas underwent labor inspections while docked in Rotterdam, in the Netherlands and
Dutch labor inspectors ultimately fined Royal Caribbean €600,000 ($760,000) for violating Dutch labor laws and the
International Maritime Convention, citing that at least 85 employees, mainly from the Philippines and South America, lacked
proper work permits and were working excessive hours (Hil, 2015).
12
from around US$800-US$8,000 per month, depending on the position and line (Morello,
2015). While officers, entertainers, and many retail workers that engage directly with
customers earn equitable wages by North American standards, the majority of the ship’s
workers do not, earning most of their income through tips (Morello, 2015). Cruise
companies also source workers from developing countries that are undergoing rapid
development and producing fewer workers whose skills and goals align with the needs of
cruise operators (Terry, 2009).13 Box 2 below has further details on the geographic
component to cruise tourism’s labor market.
Box 2. Pronounced Geographic Component in Cruise Human Capital
Operating a cruise is a labor-intensive activity, with passenger-to-crew ratios on mass market
cruises as high as 2:1 and luxury cruises closer to 1:1. Globally, the industry supports as many as
940,000 jobs and generates approximately US$39 billion in wages and salaries. There is a wide
variance in the skill levels associated with each group of workers across the cruise tourism value
chain. The highest employment opportunities are regularly found in the service-provider segment
of each chain, although these jobs are often lower skilled.
There is a geographical segmentation to cruise labor. The highest-pay jobs are usually held by
officers and crew from developed countries while workers from Asian countries such as the
Philippines often dominate lower-paid positions. Nations such as Indonesia have cruise training
schools, which provide companies such as Carnival with fertile recruiting ground. Cruise ships that
traverse the Caribbean can be expected to conform to this pattern—oftentimes they have very few
Caribbean nationals working the ships.
Sources: (Clancy, 2008; CLIA, 2016a; Wood, 2004).
3. Barbados and the Cruise Tourism GVC
Tourism is among the most significant economic activities in Barbados. With its warm weather and
striking beaches as well as its historical ties to the United Kingdom and its close geographic
proximity to the United States, the country attracts large number of British and American
travelers.14 In 2016, tourism’s direct contribution to GDP was 12.9%, and it accounted for 62.1% of
Barbados’ total exports (WTTC, 2017b). The industry provided direct employment for 17,000
people and indirectly supported as many as 51,000 jobs; accounting for roughly 40% of the
country’s total labor force (WTTC, 2017b). Barbados ranks ahead of the regional average in terms
of the relative contribution of tourism to the overall economy in many key indicators. Table 6
below provides a summary.
Cruise tourism is a significant component of the overall tourism industry in Barbados, although its
exact importance depends on the metric. On the one hand, 54% of the 1.3 million tourists
who visited the island in 2015 were cruise ship passengers.15 In total, 731,137 passengers
entered the port in Bridgetown (BPI, 2017) . While that figure is down slightly from 2010 (745,175),
it represents an 18% increase from 2012, when 617,438 cruise ship passengers visited Barbados.
The number of port calls has followed a similar trend line, falling in 2012 before trending upward in
13 Filipinos represent roughly 30% of the total labor force on cruise ships (Terry, 2009). 14 It is also worth noting that Barbados is one of the few Caribbean locations with direct flights to Canada and the UK. 15 2015 is the final year that international arrival data was made available to Duke GVCC.
13
recent years (BPI, 2017). The total in 2016 (424) represents a recent historical apex. On the other
side, cruise tourism indirectly employed as many as 1,845 Barbadians (Field Research,
2017), which is only roughly 9% of the total tourism workforce.
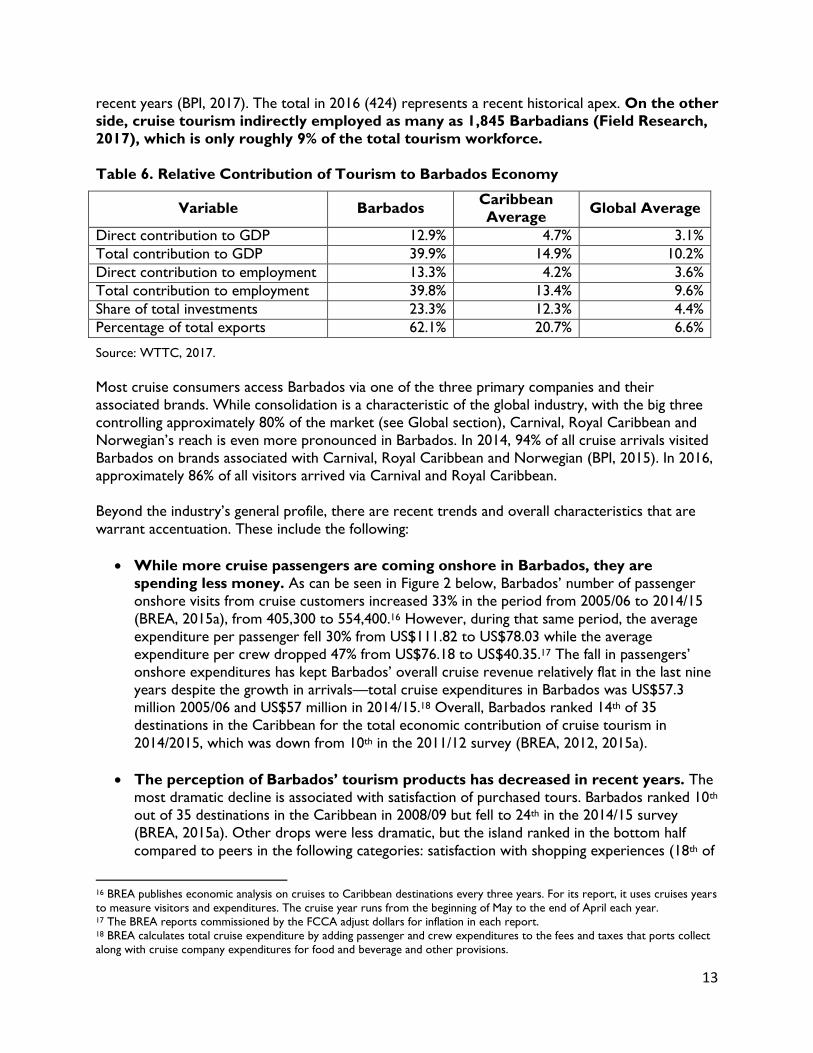
Table 6. Relative Contribution of Tourism to Barbados Economy
Variable Barbados Caribbean
Average Global Average
Direct contribution to GDP 12.9% 4.7% 3.1%
Total contribution to GDP 39.9% 14.9% 10.2%
Direct contribution to employment 13.3% 4.2% 3.6%
Total contribution to employment 39.8% 13.4% 9.6%
Share of total investments 23.3% 12.3% 4.4%
Percentage of total exports 62.1% 20.7% 6.6%
Source: WTTC, 2017.
Most cruise consumers access Barbados via one of the three primary companies and their
associated brands. While consolidation is a characteristic of the global industry, with the big three
controlling approximately 80% of the market (see Global section), Carnival, Royal Caribbean and
Norwegian’s reach is even more pronounced in Barbados. In 2014, 94% of all cruise arrivals visited
Barbados on brands associated with Carnival, Royal Caribbean and Norwegian (BPI, 2015). In 2016,
approximately 86% of all visitors arrived via Carnival and Royal Caribbean.
Beyond the industry’s general profile, there are recent trends and overall characteristics that are
warrant accentuation. These include the following:
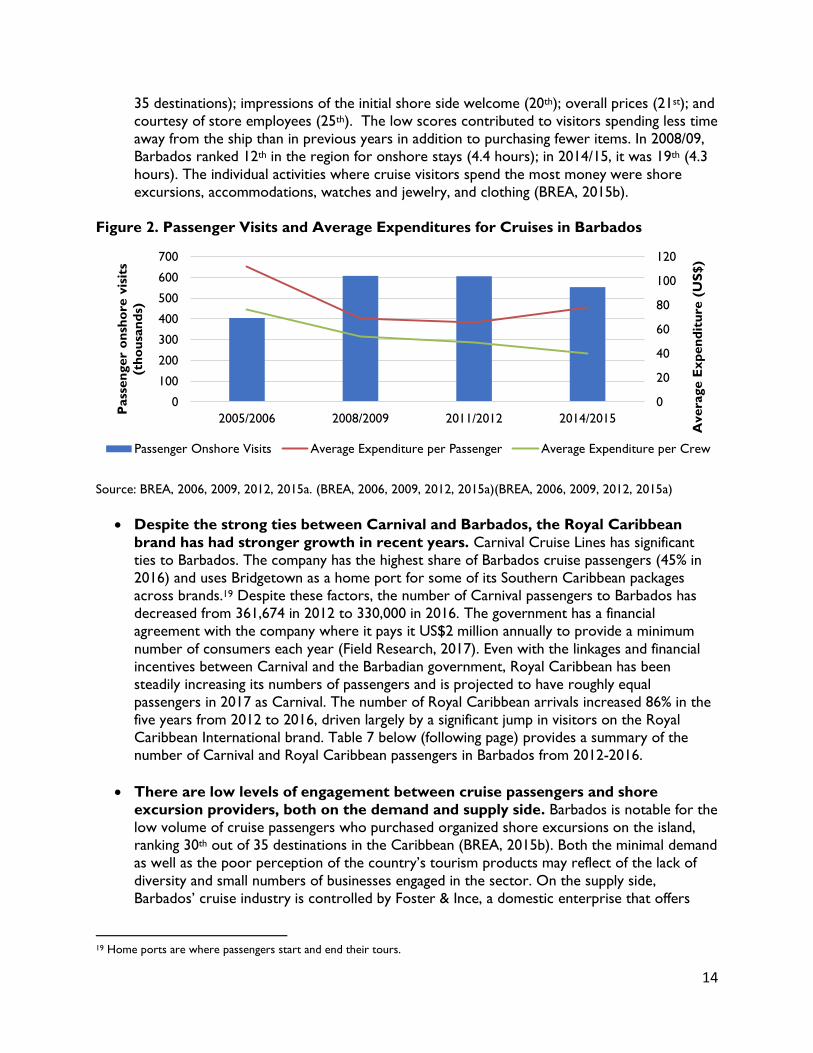
While more cruise passengers are coming onshore in Barbados, they are
spending less money. As can be seen in Figure 2 below, Barbados’ number of passenger
onshore visits from cruise customers increased 33% in the period from 2005/06 to 2014/15
(BREA, 2015a), from 405,300 to 554,400.16 However, during that same period, the average
expenditure per passenger fell 30% from US$111.82 to US$78.03 while the average
expenditure per crew dropped 47% from US$76.18 to US$40.35.17 The fall in passengers’
onshore expenditures has kept Barbados’ overall cruise revenue relatively flat in the last nine
years despite the growth in arrivals—total cruise expenditures in Barbados was US$57.3
million 2005/06 and US$57 million in 2014/15.18 Overall, Barbados ranked 14th of 35
destinations in the Caribbean for the total economic contribution of cruise tourism in
2014/2015, which was down from 10th in the 2011/12 survey (BREA, 2012, 2015a).
The perception of Barbados’ tourism products has decreased in recent years. The
most dramatic decline is associated with satisfaction of purchased tours. Barbados ranked 10th
out of 35 destinations in the Caribbean in 2008/09 but fell to 24th in the 2014/15 survey
(BREA, 2015a). Other drops were less dramatic, but the island ranked in the bottom half
compared to peers in the following categories: satisfaction with shopping experiences (18th of
16 BREA publishes economic analysis on cruises to Caribbean destinations every three years. For its report, it uses cruises years
to measure visitors and expenditures. The cruise year runs from the beginning of May to the end of April each year. 17 The BREA reports commissioned by the FCCA adjust dollars for inflation in each report. 18 BREA calculates total cruise expenditure by adding passenger and crew expenditures to the fees and taxes that ports collect
along with cruise company expenditures for food and beverage and other provisions.
14
35 destinations); impressions of the initial shore side welcome (20th); overall prices (21st); and
courtesy of store employees (25th). The low scores contributed to visitors spending less time
away from the ship than in previous years in addition to purchasing fewer items. In 2008/09,
Barbados ranked 12th in the region for onshore stays (4.4 hours); in 2014/15, it was 19th (4.3
hours). The individual activities where cruise visitors spend the most money were shore
excursions, accommodations, watches and jewelry, and clothing (BREA, 2015b).
Figure 2. Passenger Visits and Average Expenditures for Cruises in Barbados
Source: BREA, 2006, 2009, 2012, 2015a. (BREA, 2006, 2009, 2012, 2015a)(BREA, 2006, 2009, 2012, 2015a)
Despite the strong ties between Carnival and Barbados, the Royal Caribbean
brand has had stronger growth in recent years. Carnival Cruise Lines has significant
ties to Barbados. The company has the highest share of Barbados cruise passengers (45% in
2016) and uses Bridgetown as a home port for some of its Southern Caribbean packages
across brands.19 Despite these factors, the number of Carnival passengers to Barbados has
decreased from 361,674 in 2012 to 330,000 in 2016. The government has a financial
agreement with the company where it pays it US$2 million annually to provide a minimum
number of consumers each year (Field Research, 2017). Even with the linkages and financial
incentives between Carnival and the Barbadian government, Royal Caribbean has been
steadily increasing its numbers of passengers and is projected to have roughly equal
passengers in 2017 as Carnival. The number of Royal Caribbean arrivals increased 86% in the
five years from 2012 to 2016, driven largely by a significant jump in visitors on the Royal
Caribbean International brand. Table 7 below (following page) provides a summary of the
number of Carnival and Royal Caribbean passengers in Barbados from 2012-2016.
There are low levels of engagement between cruise passengers and shore
excursion providers, both on the demand and supply side. Barbados is notable for the
low volume of cruise passengers who purchased organized shore excursions on the island,
ranking 30th out of 35 destinations in the Caribbean (BREA, 2015b). Both the minimal demand
as well as the poor perception of the country’s tourism products may reflect of the lack of
diversity and small numbers of businesses engaged in the sector. On the supply side,
Barbados’ cruise industry is controlled by Foster & Ince, a domestic enterprise that offers
19 Home ports are where passengers start and end their tours.
0
20
40
60
80
100
120
0
100
200
300
400
500
600
700
2005/2006 2008/2009 2011/2012 2014/2015
Avera
ge E
xp
en
dit
ure
(U
S$)
Pass
en
ger
on
sho
re v
isit
s
(th
ou
san
ds)
Passenger Onshore Visits Average Expenditure per Passenger Average Expenditure per Crew
15
integrated services across the chain, including transportation, shore excursion and logistical
options. While its history and successes afford the company advantages that benefit the
island, it has also helped it accumulate significant market power, which can be an impediment
to smaller excursion operators, who often must compete or partner with Foster & Ince to be
economically viable. While there are opportunities for local businesses to surmount this
challenge and enter the sector, there are other considerations that limit participation,
including insurance coverage, underdeveloped business skills and market linkages as well as a
failure to recognize differences between cruise and conventional leisure tourism.
Table 7. Number of Carnival and Royal Caribbean Passengers in Barbados, 2012-2016
Brand 2012 2013 2014 2015 2016
Carnival
Carnival Cruise Line 166,837 173,643 170,607 166,963 133,366
P&O Cruises 72,586 94,326 70,237 80,445 85,947
Princess Cruises 57,168 36,416 29,055 42,574 36,630
Costa Cruises 12,530 5,788 18,733 24,331 29,710
Aida Cruises 20,111 20,339 22,904 20,862 25,337
Holland America Line 29,324 20,387 20,622 21,761 14,753
Cunard Cruises 1,923 0 4,333 2,004 4,148
Seabourn Cruises 1,195 2,390 2,792 2,078 821
Carnival total 361,674 353,739 339,283 361,018 330,712
Share of total cruise arrivals 58.6% 53.3% 49.7% 50.7% 45.2%
Royal Caribbean
Royal Caribbean International 64,842 114,579 115,565 160,306 151,590
Celebrity Cruises 72,711 76,927 79,748 80,080 78,110
TUI Cruises 18,520 18,895 22,652 22,916 27,434
Thomson Cruises 0 0 30,221 27,396 31,339
Pullmantur Cruises 0 0 0 0 2,600
Royal Caribbean total 156,073 210,419 248,186 290,698 291,073
Share of total cruise arrivals 25.3% 31.7% 36.3% 40.8% 39.8%
Sources: (BPI, 2015; BTMI, 2017).
This section of the report investigates Barbados’ cruise tourism industry in further detail. It first
examines the country’s participation in the value chain, highlighting the segments where it is most
active. It then analyzes the industrial organization, concentrating on the importance of both Carnival
and Royal Caribbean to the local sector as well as domestic companies such as Foster & Ince. The
industry upgrading discussion then outlines the value-addition prospects of the sector as well as its
evolution. After assessing the institutional framework, it then examines the most prominent
advantages and constraints for potential upgrading trajectories.
3.1. Barbados’ Current Participation in the Cruise Tourism GVC
Barbados’ profile in the cruise tourism value chain is well established, although the country lags
behind many regional peers in terms of number of visitors and average passenger expenditure.
With 554,500 passenger onshore visits in the 2014/15 cruise season, the island ranked
14th in the Caribbean in that metric, trailing behind leaders such as Bahamas (2.9 million onshore
visits) and Cozumel (2.5 million). It should, however, be noted that the country was generally
16
competitive with Southern Caribbean peers such as St. Lucia (603,000 onshore visits), Antigua
(527,000) and Aruba (546,000) (BREA, 2015a).20
After the recent decline in average expenditure per passenger to US$78.03 in 2014/15,
Barbados’ ranked 18th in the Caribbean in spending. Regional leaders St. Maarten
(US$191.26), US Virgin Islands (US$150.21) and Cozumel (US$119.89) capture between US$41-
$113 more per passenger than Barbados. Figure 3 below maps Caribbean countries for both data
points. Barbados is part of the cluster of countries at the bottom left of the image, while St.
Maarten, the US Virgin Islands, Cozumel and Bahamas are the outliers moving to the top right.
Table 3 in the Appendix provides a table listing each country’s raw total.
Figure 3. Onshore Visits and Average Expenditures for Caribbean Cruise Passengers
Source: Authors based on BREA data.
Although cruise passengers spend less in Barbados than peers, there are multiple segments of the
value chain where the country has measurable economic activity. These include the distribution of
shore excursions as well as inputs such as ground transportation, the excursions themselves,
hospitality, shopping and lodging. The discussion below outlines Barbados’ participation in the chain
as well as the industry organization. It is based both on qualitative data collected during field
research conducted during June 2017 as well as economic analysis complied by BREA.
3.1.1. Industry Organization
A defining characteristic of the domestic industry is the power concentrated in the primary local
distribution intermediary: Foster & Ince. The integrated company has a diverse array of operations
20 There were 23.6 million onshore visits to the 35 Caribbean destinations surveyed by BREA for the 2014/15 cruise season.
Barbados’ regional share of onshore visits was 2.3%.
Aruba
Bahamas BARBADOS
Belize
Cayman Islands Colombia Cozumel
Jamaica
Puerto Rico (San Juan)
St. Kitts & Nevis
St. Maarten
Trinidad
Turks and Caicos
U. S. Virgin Islands
0
20
40
60
80
100
120
140
160
180
200
0 500 1000 1500 2000 2500 3000
Avera
ge E
xp
en
dit
ure
per
Pass
en
ger
(US
$)
Passenger Onshore Visits (thousands)
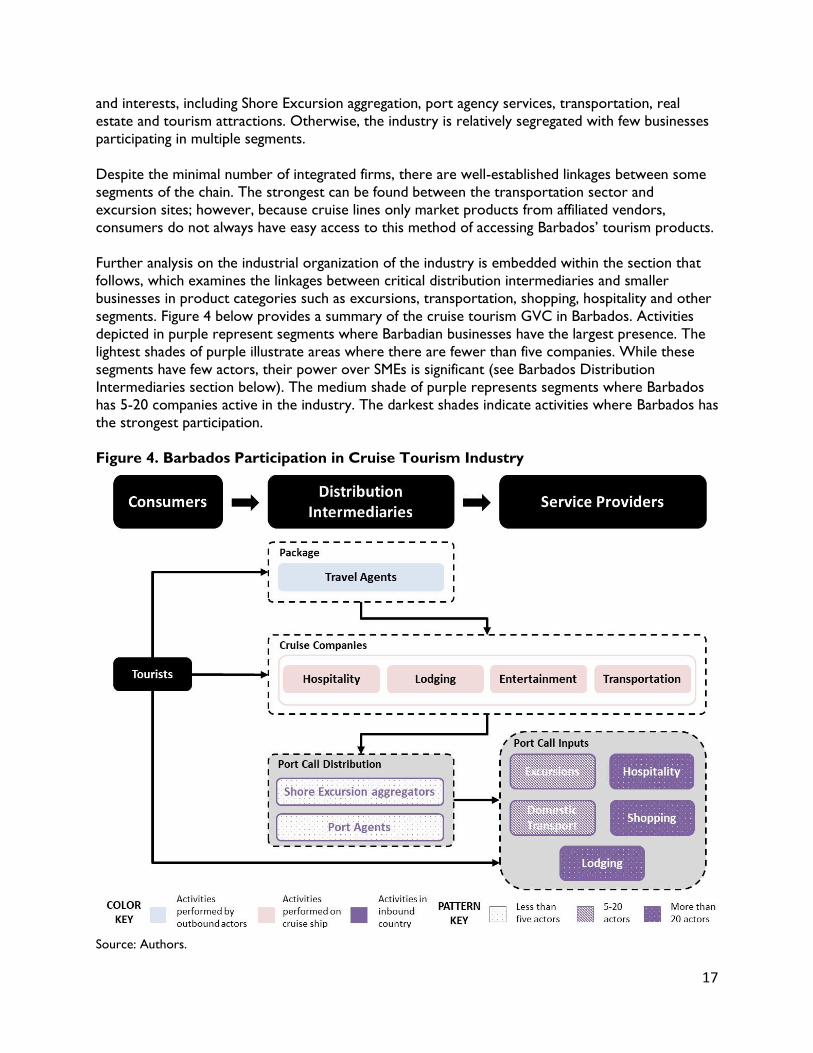
17
and interests, including Shore Excursion aggregation, port agency services, transportation, real
estate and tourism attractions. Otherwise, the industry is relatively segregated with few businesses
participating in multiple segments.
Despite the minimal number of integrated firms, there are well-established linkages between some
segments of the chain. The strongest can be found between the transportation sector and
excursion sites; however, because cruise lines only market products from affiliated vendors,
consumers do not always have easy access to this method of accessing Barbados’ tourism products.
Further analysis on the industrial organization of the industry is embedded within the section that
follows, which examines the linkages between critical distribution intermediaries and smaller
businesses in product categories such as excursions, transportation, shopping, hospitality and other
segments. Figure 4 below provides a summary of the cruise tourism GVC in Barbados. Activities
depicted in purple represent segments where Barbadian businesses have the largest presence. The
lightest shades of purple illustrate areas where there are fewer than five companies. While these
segments have few actors, their power over SMEs is significant (see Barbados Distribution
Intermediaries section below). The medium shade of purple represents segments where Barbados
has 5-20 companies active in the industry. The darkest shades indicate activities where Barbados has
the strongest participation.
Figure 4. Barbados Participation in Cruise Tourism Industry
Source: Authors.
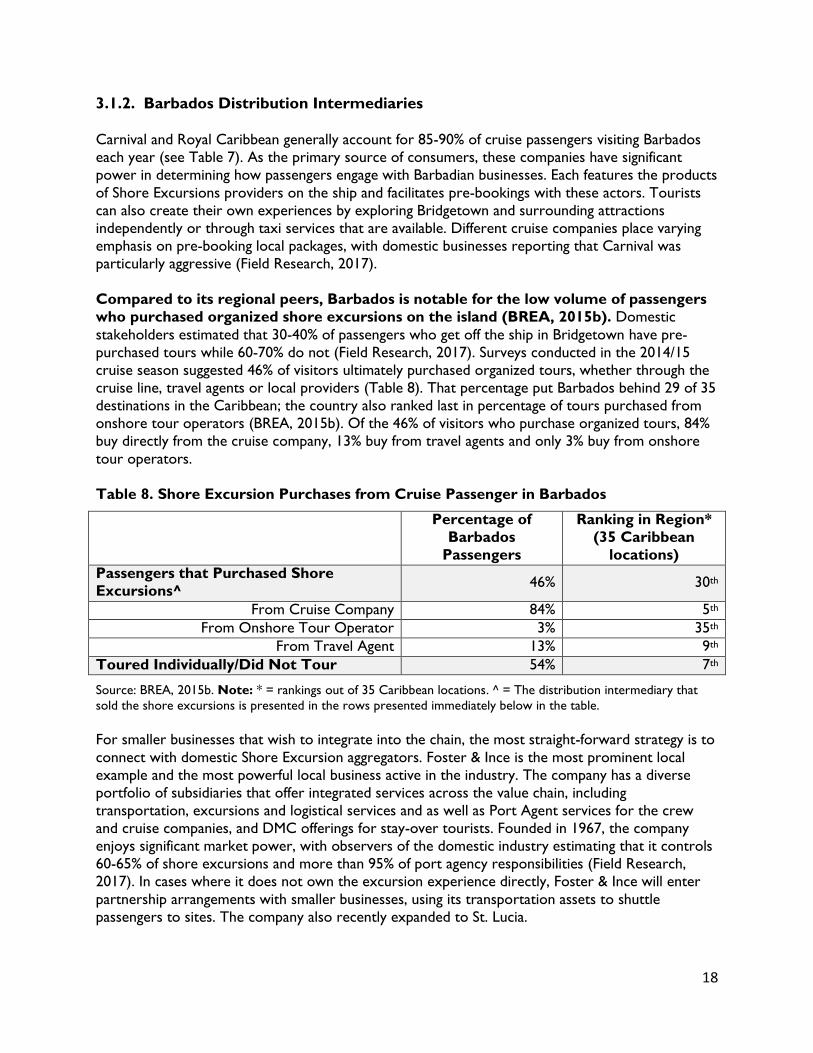
18
3.1.2. Barbados Distribution Intermediaries
Carnival and Royal Caribbean generally account for 85-90% of cruise passengers visiting Barbados
each year (see Table 7). As the primary source of consumers, these companies have significant
power in determining how passengers engage with Barbadian businesses. Each features the products
of Shore Excursions providers on the ship and facilitates pre-bookings with these actors. Tourists
can also create their own experiences by exploring Bridgetown and surrounding attractions
independently or through taxi services that are available. Different cruise companies place varying
emphasis on pre-booking local packages, with domestic businesses reporting that Carnival was
particularly aggressive (Field Research, 2017).
Compared to its regional peers, Barbados is notable for the low volume of passengers
who purchased organized shore excursions on the island (BREA, 2015b). Domestic
stakeholders estimated that 30-40% of passengers who get off the ship in Bridgetown have pre-
purchased tours while 60-70% do not (Field Research, 2017). Surveys conducted in the 2014/15
cruise season suggested 46% of visitors ultimately purchased organized tours, whether through the
cruise line, travel agents or local providers (Table 8). That percentage put Barbados behind 29 of 35
destinations in the Caribbean; the country also ranked last in percentage of tours purchased from
onshore tour operators (BREA, 2015b). Of the 46% of visitors who purchase organized tours, 84%
buy directly from the cruise company, 13% buy from travel agents and only 3% buy from onshore
tour operators.
Table 8. Shore Excursion Purchases from Cruise Passenger in Barbados
Percentage of
Barbados
Passengers
Ranking in Region*
(35 Caribbean
locations)
Passengers that Purchased Shore
Excursions^ 46% 30th
From Cruise Company 84% 5th
From Onshore Tour Operator 3% 35th
From Travel Agent 13% 9th
Toured Individually/Did Not Tour 54% 7th
Source: BREA, 2015b. Note: * = rankings out of 35 Caribbean locations. ^ = The distribution intermediary that
sold the shore excursions is presented in the rows presented immediately below in the table.
For smaller businesses that wish to integrate into the chain, the most straight-forward strategy is to
connect with domestic Shore Excursion aggregators. Foster & Ince is the most prominent local
example and the most powerful local business active in the industry. The company has a diverse
portfolio of subsidiaries that offer integrated services across the value chain, including
transportation, excursions and logistical services and as well as Port Agent services for the crew
and cruise companies, and DMC offerings for stay-over tourists. Founded in 1967, the company
enjoys significant market power, with observers of the domestic industry estimating that it controls
60-65% of shore excursions and more than 95% of port agency responsibilities (Field Research,
2017). In cases where it does not own the excursion experience directly, Foster & Ince will enter
partnership arrangements with smaller businesses, using its transportation assets to shuttle
passengers to sites. The company also recently expanded to St. Lucia.
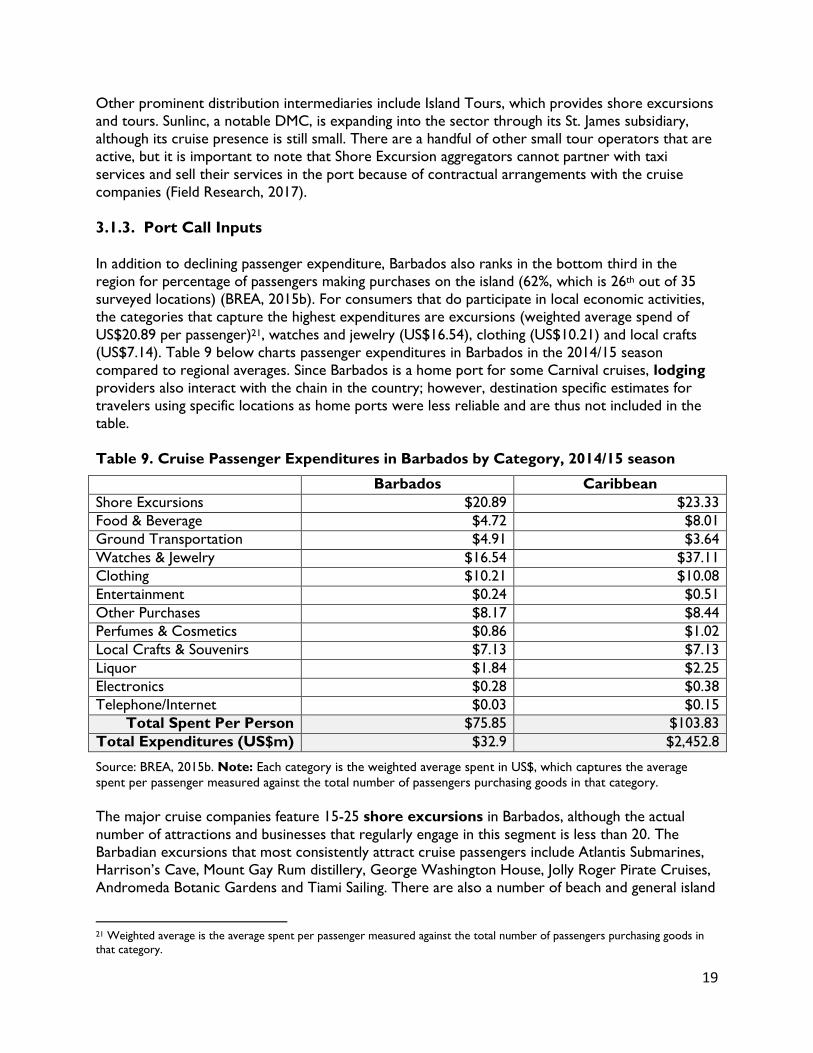
19
Other prominent distribution intermediaries include Island Tours, which provides shore excursions
and tours. Sunlinc, a notable DMC, is expanding into the sector through its St. James subsidiary,
although its cruise presence is still small. There are a handful of other small tour operators that are
active, but it is important to note that Shore Excursion aggregators cannot partner with taxi
services and sell their services in the port because of contractual arrangements with the cruise
companies (Field Research, 2017).
3.1.3. Port Call Inputs
In addition to declining passenger expenditure, Barbados also ranks in the bottom third in the
region for percentage of passengers making purchases on the island (62%, which is 26th out of 35
surveyed locations) (BREA, 2015b). For consumers that do participate in local economic activities,
the categories that capture the highest expenditures are excursions (weighted average spend of
US$20.89 per passenger)21, watches and jewelry (US$16.54), clothing (US$10.21) and local crafts
(US$7.14). Table 9 below charts passenger expenditures in Barbados in the 2014/15 season
compared to regional averages. Since Barbados is a home port for some Carnival cruises, lodging
providers also interact with the chain in the country; however, destination specific estimates for
travelers using specific locations as home ports were less reliable and are thus not included in the
table.
Table 9. Cruise Passenger Expenditures in Barbados by Category, 2014/15 season
Barbados Caribbean
Shore Excursions $20.89 $23.33
Food & Beverage $4.72 $8.01
Ground Transportation $4.91 $3.64
Watches & Jewelry $16.54 $37.11
Clothing $10.21 $10.08
Entertainment $0.24 $0.51
Other Purchases $8.17 $8.44
Perfumes & Cosmetics $0.86 $1.02
Local Crafts & Souvenirs $7.13 $7.13
Liquor $1.84 $2.25
Electronics $0.28 $0.38
Telephone/Internet $0.03 $0.15
Total Spent Per Person $75.85 $103.83
Total Expenditures (US$m) $32.9 $2,452.8
Source: BREA, 2015b. Note: Each category is the weighted average spent in US$, which captures the average
spent per passenger measured against the total number of passengers purchasing goods in that category.
The major cruise companies feature 15-25 shore excursions in Barbados, although the actual
number of attractions and businesses that regularly engage in this segment is less than 20. The
Barbadian excursions that most consistently attract cruise passengers include Atlantis Submarines,
Harrison’s Cave, Mount Gay Rum distillery, George Washington House, Jolly Roger Pirate Cruises,
Andromeda Botanic Gardens and Tiami Sailing. There are also a number of beach and general island
21 Weighted average is the average spent per passenger measured against the total number of passengers purchasing goods in
that category.
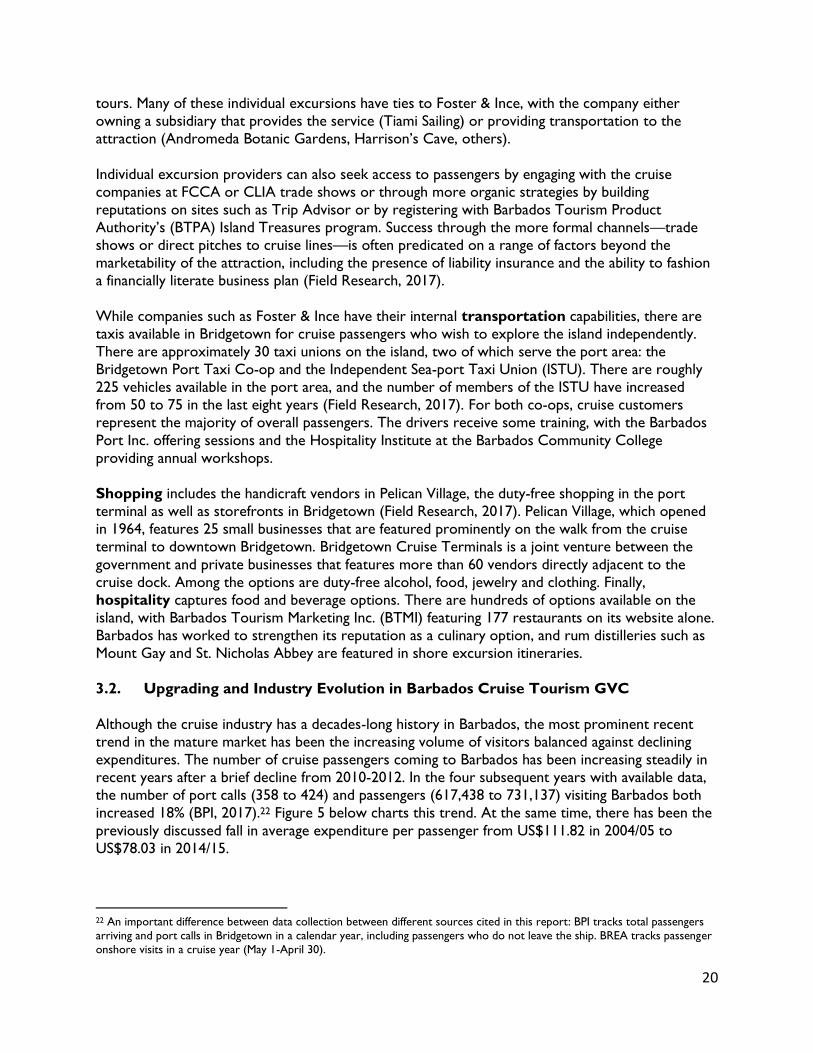
20
tours. Many of these individual excursions have ties to Foster & Ince, with the company either
owning a subsidiary that provides the service (Tiami Sailing) or providing transportation to the
attraction (Andromeda Botanic Gardens, Harrison’s Cave, others).
Individual excursion providers can also seek access to passengers by engaging with the cruise
companies at FCCA or CLIA trade shows or through more organic strategies by building
reputations on sites such as Trip Advisor or by registering with Barbados Tourism Product
Authority’s (BTPA) Island Treasures program. Success through the more formal channels—trade
shows or direct pitches to cruise lines—is often predicated on a range of factors beyond the
marketability of the attraction, including the presence of liability insurance and the ability to fashion
a financially literate business plan (Field Research, 2017).
While companies such as Foster & Ince have their internal transportation capabilities, there are
taxis available in Bridgetown for cruise passengers who wish to explore the island independently.
There are approximately 30 taxi unions on the island, two of which serve the port area: the
Bridgetown Port Taxi Co-op and the Independent Sea-port Taxi Union (ISTU). There are roughly
225 vehicles available in the port area, and the number of members of the ISTU have increased
from 50 to 75 in the last eight years (Field Research, 2017). For both co-ops, cruise customers
represent the majority of overall passengers. The drivers receive some training, with the Barbados
Port Inc. offering sessions and the Hospitality Institute at the Barbados Community College
providing annual workshops.
Shopping includes the handicraft vendors in Pelican Village, the duty-free shopping in the port
terminal as well as storefronts in Bridgetown (Field Research, 2017). Pelican Village, which opened
in 1964, features 25 small businesses that are featured prominently on the walk from the cruise
terminal to downtown Bridgetown. Bridgetown Cruise Terminals is a joint venture between the
government and private businesses that features more than 60 vendors directly adjacent to the
cruise dock. Among the options are duty-free alcohol, food, jewelry and clothing. Finally,
hospitality captures food and beverage options. There are hundreds of options available on the
island, with Barbados Tourism Marketing Inc. (BTMI) featuring 177 restaurants on its website alone.
Barbados has worked to strengthen its reputation as a culinary option, and rum distilleries such as
Mount Gay and St. Nicholas Abbey are featured in shore excursion itineraries.
3.2. Upgrading and Industry Evolution in Barbados Cruise Tourism GVC
Although the cruise industry has a decades-long history in Barbados, the most prominent recent
trend in the mature market has been the increasing volume of visitors balanced against declining
expenditures. The number of cruise passengers coming to Barbados has been increasing steadily in
recent years after a brief decline from 2010-2012. In the four subsequent years with available data,
the number of port calls (358 to 424) and passengers (617,438 to 731,137) visiting Barbados both
increased 18% (BPI, 2017).22 Figure 5 below charts this trend. At the same time, there has been the
previously discussed fall in average expenditure per passenger from US$111.82 in 2004/05 to
US$78.03 in 2014/15.
22 An important difference between data collection between different sources cited in this report: BPI tracks total passengers
arriving and port calls in Bridgetown in a calendar year, including passengers who do not leave the ship. BREA tracks passenger
onshore visits in a cruise year (May 1-April 30).

21
Figure 5. Number of Cruise Passengers and Port Calls in Barbados, 2010-2016
Source: BPI, 2017.
The following section analyzes some of the underlying features that are driving these trends. It uses
the conception of upgrading advanced in the GVC literature to frame the developments in
Barbados’ cruise sector.23 It also focuses on advances made in the last decade. While the opening of
the cruise terminal in 1994 was a noteworthy product upgrade that has helped the country increase
its annual cruise passenger arrivals close to 200% over the last two-plus decades (BPI, 2017), there
have not been substantive infrastructure improvements in more recent years.
PRODUCT AND FUNCTIONAL UPGRADING: Carnival Cruise Lines adding
Barbados as a destination where some of its itineraries commence and conclude.
Barbados has been a home port for Carnival brands such as Carnival, P&O Cruises, Aida and
Seabourn for the last five years (Field Research, 2017). The arrangement, which has been
partially facilitated through an agreement where the government pays Carnival US$2 million
each year for a minimum number of passengers, has supported both functional and product
upgrading—functional upgrading because accommodation and logistical services businesses
participate in the cruise tourism GVC in areas where they were previously excluded; product
because stay-over passengers have opportunity during longer stays to engage with higher
number of domestic attractions and increase spillovers into conventional land-based leisure
tourism activities, which have elevated economic benefits for the local economy.
23 Upgrading in the GVC literature describes how actors can improve competitiveness and increase benefits from participating
in global industries. There are both economic and social dimensions to upgrading: economic upgrading describes how firms or
countries can add value to production or move into higher value activities, while social upgrading encapsulates improvements in
measurable standards and the enabling rights of workers (Barrientos et al., 2011). Economic upgrading includes a variety of
different forms. Product upgrading describes the shift into the production into higher value products or services. Process
upgrading includes improvements in the efficiency of the production systems such as incorporating more sophisticated
technology. Functional upgrading is when actors acquire new functions or abandon existing ones to increase overall
competitiveness. Chain upgrading is when firms or countries move into new—but often related—production activities by
leveraging existing capabilities. Finally, end-market upgrading describes incursion into new market segments (Gereffi &
Fernandez-Stark, 2016).
0
100,000
200,000
300,000
400,000
500,000
600,000
700,000
800,000
320
340
360
380
400
420
440
2010 2011 2012 2013 2014 2015 2016
Nu
mb
er
of
pass
en
gers
Nu
mb
er
of
po
rt c
alls
Passengers Port calls

22
INTERSECTORAL UPGRADING: Increased linkages between cruise tourism and
rum sector. Mount Gay Rum is featured on Carnival and Royal Caribbean’s shore
excursions in Barbados, while St. Nicholas Abbey and other distilleries report regular cruise
customers (Field Research, 2017). The linkages have provided benefits for both value chains,
allowing the cruise industry to augment its product offerings while the domestic rum industry
strengthens its international reputation and individual sites use increased revenue to facilitate
process upgrades.
3.3. Industry Institutionalization
Given its importance to the Barbadian economy, tourism is a source of interest for multiple
government institutions. The Ministry of Tourism and International Transport (MTI) is the lead
agency; it coordinates policy and strategic initiatives for the industry. In 2014, MTI commissioned a
six-volume Master Plan authored by HLA Consultants that offered goals, strategic imperatives and
timelines for improving the island’s tourism’s competitiveness.24 Although that document focused
on the entire industry, one of its strategic aims was enhancing cruise tourism products and
experiences and its recommendations were designed to accomplish that goal (Environment Planning
Group & HLA Consultants, 2014).
In 2014, MTI split the Barbados Tourism Authority into BTMI and the Barbados Tourism Product
Authority (BTPA). BTMI’s mandate is to promote the tourism industry, while BTPA concentrates
on licensing, registration and capacity building with the goal of ameliorating the product stagnation
that is reflected on the rankings of cruise passengers’ impressions of excursions on the island (Field
Research, 2017). BTMI also has a unit that focuses specifically on the cruise sector; it has
undertaken strategic initiatives such as formulating a marketing plan that analyzes the strengths and
weaknesses of the country’s cruise products while also offering a development plan to address
some of the shortcomings and an implementation timeline.
There are other agencies that regularly interact with the sector. With its day-to-day management of
the port facilities, Barbados Port Inc. is a particularly significant actor. The agency participates in
long-term planning and has helped formulate the Sugar Point development plan, which is the name
for a series of ambitious infrastructure improvements to the port (BPI, n.d.). It also coordinates
with the Ministry of Finance to set the tax rate on the head count for cruise passenger arrivals ($6
per passenger) as well as engaging with the cruise ship companies about logistical and environmental
considerations (Field Research, 2017).
Barbados Tourism Investments Inc. (BTII) acts as a facilitator for investments. The government
organization has roughly US$1 billion in tourism investments, supporting the sector through: 1) loan
facilitation, customs support and fiscal incentives; 2) public-private partnerships; and 3) straight
investments (Field Research, 2017). However, BTII’s current portfolio is oriented toward
conventional land-based tourism, with investments in the accommodation and tourism attraction
segments of the chain. It has not engaged on the Sugar Point development (Field Research, 2017).
Table 10 below lists the key stakeholders in the cruise tourism in Barbados as well as their primary
role.
24 The Master Plan can be accessed through the Barbados Hotel & Tourism Association website:
http://www.bhta.org/index/resources/tourism-master-plan.html
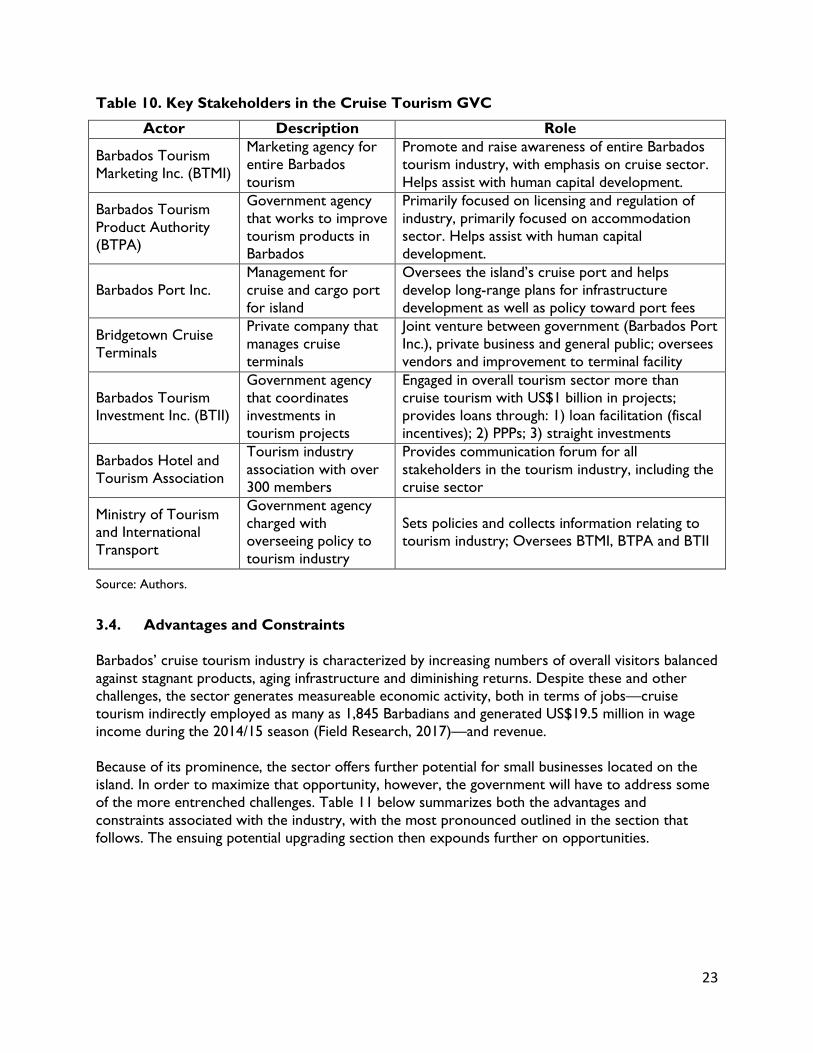
23
Table 10. Key Stakeholders in the Cruise Tourism GVC
Actor Description Role
Barbados Tourism
Marketing Inc. (BTMI)
Marketing agency for
entire Barbados
tourism
Promote and raise awareness of entire Barbados
tourism industry, with emphasis on cruise sector.
Helps assist with human capital development.
Barbados Tourism
Product Authority
(BTPA)
Government agency
that works to improve
tourism products in
Barbados
Primarily focused on licensing and regulation of
industry, primarily focused on accommodation
sector. Helps assist with human capital
development.
Barbados Port Inc.
Management for
cruise and cargo port
for island
Oversees the island’s cruise port and helps
develop long-range plans for infrastructure
development as well as policy toward port fees
Bridgetown Cruise
Terminals
Private company that
manages cruise
terminals
Joint venture between government (Barbados Port
Inc.), private business and general public; oversees
vendors and improvement to terminal facility
Barbados Tourism
Investment Inc. (BTII)
Government agency
that coordinates
investments in
tourism projects
Engaged in overall tourism sector more than
cruise tourism with US$1 billion in projects;
provides loans through: 1) loan facilitation (fiscal
incentives); 2) PPPs; 3) straight investments
Barbados Hotel and
Tourism Association
Tourism industry
association with over
300 members
Provides communication forum for all
stakeholders in the tourism industry, including the
cruise sector
Ministry of Tourism
and International
Transport
Government agency
charged with
overseeing policy to
tourism industry
Sets policies and collects information relating to
tourism industry; Oversees BTMI, BTPA and BTII
Source: Authors.
3.4. Advantages and Constraints
Barbados’ cruise tourism industry is characterized by increasing numbers of overall visitors balanced
against stagnant products, aging infrastructure and diminishing returns. Despite these and other
challenges, the sector generates measureable economic activity, both in terms of jobs—cruise
tourism indirectly employed as many as 1,845 Barbadians and generated US$19.5 million in wage
income during the 2014/15 season (Field Research, 2017)—and revenue.
Because of its prominence, the sector offers further potential for small businesses located on the
island. In order to maximize that opportunity, however, the government will have to address some
of the more entrenched challenges. Table 11 below summarizes both the advantages and
constraints associated with the industry, with the most pronounced outlined in the section that
follows. The ensuing potential upgrading section then expounds further on opportunities.
24
Table 11. Advantages and Constraints of Cruise Tourism in Barbados
Advantages Constraints
Familiarity of Barbados among cruise
consumers
Favorable language and crime profile
Bridgetown serves as Carnival home port
Extensive industry experience among some
private sector actors
Established government institutions
Low passenger spending
Lack of new tourism products
Aging and aesthetically limited infrastructure
Uncompetitive shopping experience
Concentrated domestic market for shore
excursion aggregation
Limited implementation of strategic
objectives by government institutions
Uneven focus on small business development
Opportunities Threats
Large number of cruise passengers arriving
to the country
Bridgetown serving as home port
Government linkages with Carnival
(incentives)
Linkages with rum industry
Emerging destinations (Cuba, South Asia)
Low coordination exacerbates competition
among Caribbean countries
Less passengers disembarking from ships due
to onboard entertainment
Cruise companies acquiring private islands in
the Caribbean
Source: Authors.
3.4.1. Advantages
Barbados’ advantages in the cruise industry revolve around its reputation for safety and friendliness,
its international airport, its brand awareness in key source markets, its strong links with Carnival
Cruise Lines as well as its long-standing history in the sector. The following sub-section expounds
upon these features.
1. Familiarity of Barbados among cruise consumers: An estimated 50% of cruise
passengers visiting Barbados in the 2014/15 season had been to the island previously, which
is one of the highest percentages in all of the Caribbean—the regional average is 37%, and
only Cabo San Lucas (66%), the US Virgin Islands (63%), Puerto Vallarta (60%), Cozumel
(60%), St. Maarten (58%) and the Bahamas (51%) had higher repeat visitor percentages
(BREA, 2015).
2. Favorable language and crime profile: The United States, Britain and Canada are
Barbados’ largest source of overall visitors, with the US being the No. 1 market for cruise
arrivals. Barbados’ English language skills make the island an easy destination to visit for
these passengers, especially since there are direct flights available from Canada and the UK
as well as the US. Furthermore, the island’s comparatively low crime rates—it had the
lowest murder and robbery rates per capita in 2016 of any islands in the Eastern Caribbean
(OSAC, 2017)—also strengthen the country’s appeal.
3. Bridgetown serving as home port for Carnival: Carnival Cruise Lines brands have
used Barbados as a home port in recent years. During the 2014/15 cruise season, an
estimated 119,760 passengers embarked and disembarked at Bridgetown, providing
25
Barbados with an opportunity to showcase more of its tourism product offerings while also
engaging accommodation providers in the cruise GVC. General estimates suggest the
country’s position as a home port generated as much as US$10.3 million during the 2014/15
cruise season, although there is reason to question such evaluations—the methodology
used by BREA only allows for generalized estimates across the region, and local research
suggests 92% of home-port passengers did not stay even one night on the island (BREA,
2015b; Field Research, 2017).
4. Extensive industry experience among some private sector actors: Barbados’ roots
in the cruise sector trace back to the 1970s. Some of the most prominent local businesses
such as Foster & Ince and Atlantis Submarines have been actively engaged in the industry for
a similar duration, affording the companies a high degree of experience, technical proficiency
and familiarity with leading cruise companies.
5. Established government institutions: Barbados has multiple government institutions
devoting attention to the cruise sector. The split of the Barbados Tourism Authority into
BTMI and BTPA created two agencies that can service the sector with initiatives. BTMI has
led strategic reviews while also engaging global stakeholders such as FCCA and Aon in
efforts to increase the capabilities of small domestic businesses. BTPA, meanwhile, has
created the Island Treasures database to link local enterprises with international consumers.
While these efforts are in their nascent stage, they represent meaningful initial steps.
3.4.2. Constraints
Although the island has a number of strengths and advantages in the cruise sector, there are
multiple challenges, some of which have become particularly pronounced in recent years.
The most immediate of these are expounded upon in the sub-section that follows. Aggregated,
these challenges contribute to the one of the most significant features of Barbadian cruise tourism
sector: the decline in shore expenditures by cruise passengers.
1. Lack of new tourism products: Many of the tourism attractions that are featured
regularly as shore excursions are long-standing options that have been marketed for
extended periods. The result is that cruise passengers appear to have tired of some of the
products. In recent years, Barbados’ ranking in the satisfaction with purchased tours has
dropped from 10th out of 35 destinations in the Caribbean in 2008/09 to 24th in the 2014/15
survey (BREA, 2009, 2015a). The island appears to make no better than an average
impression on visitors, with it ranking in the middle of peers for likeliness of visitors to
return or recommend a visit to family or friends (BREA, 2015a).
2. Aging and aesthetically limited infrastructure: The Bridgetown Port, which opened in
1961, serves both cargo and cruise customers. The functional and aesthetic limitations of
the facility have been widely noted by domestic stakeholders as well as cruise customers—
Barbados ranks 20th in the region for its initial shore-side welcome (BREA, 2015b). The
Sugar Point development was formulated to address these shortcomings; however, there
are financing challenges that may prevent the US$300-500 million project from proceeding
26
as planned (Edward, 2016; Field Research, 2017; Maddon, 2017).25
3. Uncompetitive shopping environment. Beyond the quality of tours, Barbados’ lowest
marks are associated with its shopping experiences (18th of 35 countries), overall prices
(21st) and courtesy of store employees (25th) (BREA, 2015b). Local stakeholders in the
handicrafts and cruise industry lamented lack of marketing associated with general shopping
and Barbados being a duty-free environment. Additionally, Pelican Village, which is the
shopping area located close to the port and downtown Bridgetown featuring the products
of 25 local handicraft makers, is relatively old, located on the opposite side of the road of
the walkway from the port to downtown and in need of general reinvigoration (Field
Research, 2017).
4. High degree of power among limited number of domestic distribution
intermediaries: More than one local stakeholder compared Foster & Ince’s control of the
local industry to a “monopoly” (Field Research, 2017). The integrated company holds
significant power, with observers of the local industry estimating that it controls 60-65% of
shore excursions offered by cruise lines coming to Barbados while also handling roughly
95% of port agency responsibilities for the ships (Field Research, 2017). Although Foster &
Ince’s technical acumen provides the country with advantages (see above), its command of
the domestic sector presents obstacles for small businesses attempting to integrate into the
chain.
5. Limited implementation of strategic objectives by government institutions: The
Master Plan sponsored by MTI identified actions that would enhance the competitiveness of
the cruise sector with implementation timelines of 2014-18. Those included: 1) Improving
the cruise visitor experience at Bridgetown Port; 2) Creating a Southern Caribbean Cruise
Association; and 3) Targeting new source markets for cruise tourism (Environment Planning
Group & HLA Consultants, 2014). While this report is agnostic about the efficacy of such
strategies, it is worth noting there has been little progress toward the articulated goals.
Moreover, a repeated theme of interviews with stakeholders is that while there is overall
government commitment to the sector, top-down commitment and vision for the industry
could be enhanced.
6. Uneven focus on small business and human capital development: Government
expenditures related to the cruise sector have concentrated on incentives provided to
Royal Caribbean to guarantee a minimum number of passengers and trips by BTMI and
other stakeholders to FCCA and other trade events (Field Research, 2017). While such line
items hold value, there are human capital considerations and soft skills that warrant further
development. Specifically, external and internal stakeholders have identified the need for
Barbadian small businesses to fully understand the nuances of the cruise sector compared
with conventional stay-over tourism. These include: 1) Insurance requirements; 2) The
importance of developing business plans and completing required paperwork to submit
proposals to cruise lines; 3) Volume vs. value dynamics; and 4) Overall consistency (see Box
1). BTMI has engaged with industry stakeholders such as FCCA and Aon to help bridge
these gaps, although further work remains.
25 The Sugar Point port project includes the construction of separate cruise piers as well as food, entertainment and shopping
facilities and a possible hotel (Edward, 2016).
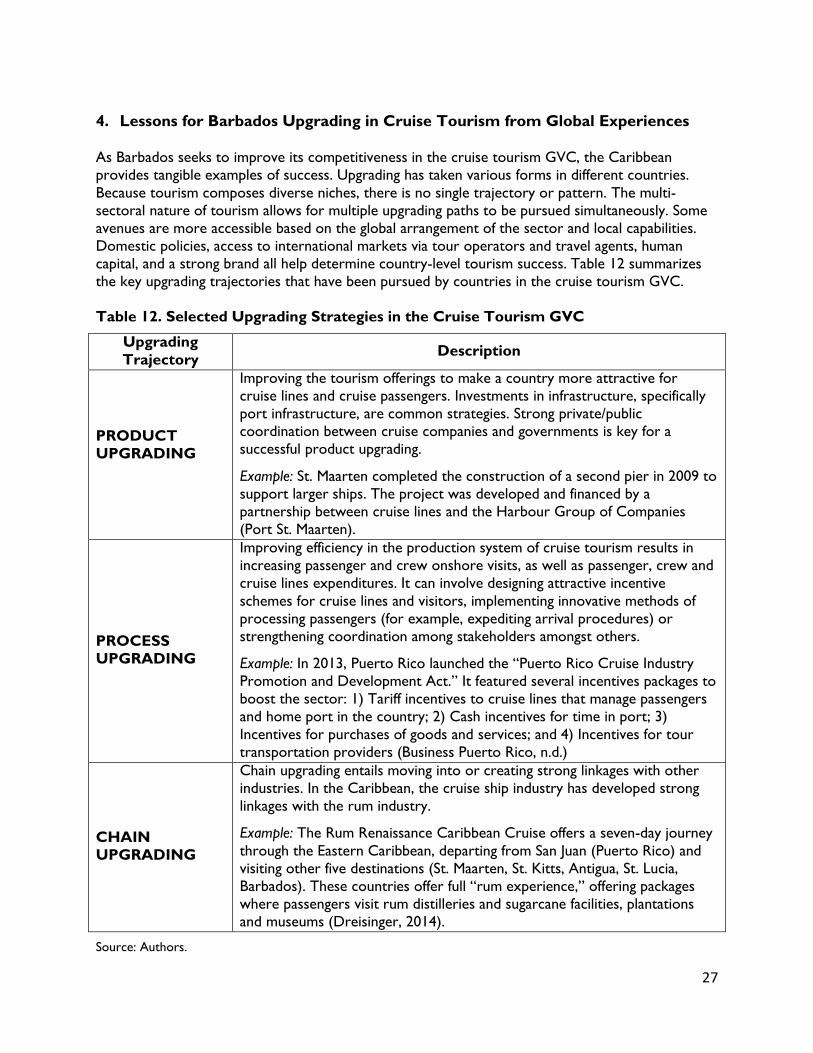
27
4. Lessons for Barbados Upgrading in Cruise Tourism from Global Experiences
As Barbados seeks to improve its competitiveness in the cruise tourism GVC, the Caribbean
provides tangible examples of success. Upgrading has taken various forms in different countries.
Because tourism composes diverse niches, there is no single trajectory or pattern. The multi-
sectoral nature of tourism allows for multiple upgrading paths to be pursued simultaneously. Some
avenues are more accessible based on the global arrangement of the sector and local capabilities.
Domestic policies, access to international markets via tour operators and travel agents, human
capital, and a strong brand all help determine country-level tourism success. Table 12 summarizes
the key upgrading trajectories that have been pursued by countries in the cruise tourism GVC.
Table 12. Selected Upgrading Strategies in the Cruise Tourism GVC
Upgrading
Trajectory Description
PRODUCT
UPGRADING
Improving the tourism offerings to make a country more attractive for
cruise lines and cruise passengers. Investments in infrastructure, specifically
port infrastructure, are common strategies. Strong private/public
coordination between cruise companies and governments is key for a
successful product upgrading.
Example: St. Maarten completed the construction of a second pier in 2009 to
support larger ships. The project was developed and financed by a
partnership between cruise lines and the Harbour Group of Companies
(Port St. Maarten).
PROCESS
UPGRADING
Improving efficiency in the production system of cruise tourism results in
increasing passenger and crew onshore visits, as well as passenger, crew and
cruise lines expenditures. It can involve designing attractive incentive
schemes for cruise lines and visitors, implementing innovative methods of
processing passengers (for example, expediting arrival procedures) or
strengthening coordination among stakeholders amongst others.
Example: In 2013, Puerto Rico launched the “Puerto Rico Cruise Industry
Promotion and Development Act.” It featured several incentives packages to
boost the sector: 1) Tariff incentives to cruise lines that manage passengers
and home port in the country; 2) Cash incentives for time in port; 3)
Incentives for purchases of goods and services; and 4) Incentives for tour
transportation providers (Business Puerto Rico, n.d.)
CHAIN
UPGRADING
Chain upgrading entails moving into or creating strong linkages with other
industries. In the Caribbean, the cruise ship industry has developed strong
linkages with the rum industry.
Example: The Rum Renaissance Caribbean Cruise offers a seven-day journey
through the Eastern Caribbean, departing from San Juan (Puerto Rico) and
visiting other five destinations (St. Maarten, St. Kitts, Antigua, St. Lucia,
Barbados). These countries offer full “rum experience,” offering packages
where passengers visit rum distilleries and sugarcane facilities, plantations
and museums (Dreisinger, 2014).
Source: Authors.
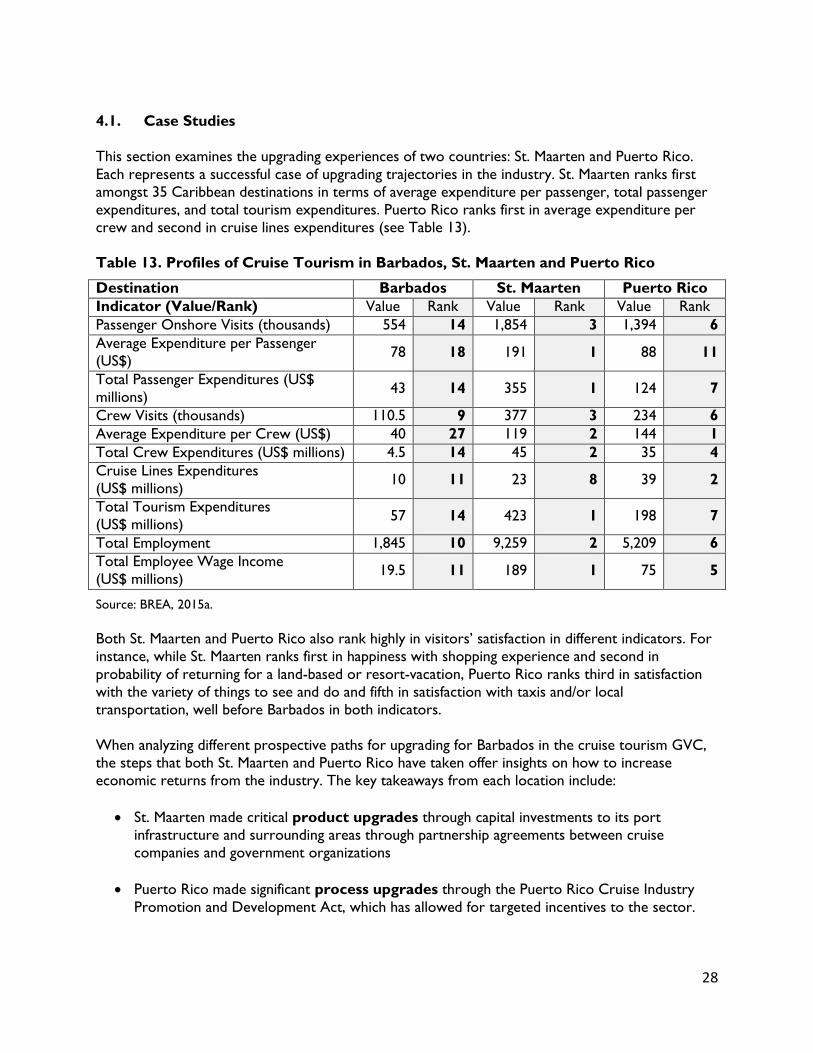
28
4.1. Case Studies
This section examines the upgrading experiences of two countries: St. Maarten and Puerto Rico.
Each represents a successful case of upgrading trajectories in the industry. St. Maarten ranks first
amongst 35 Caribbean destinations in terms of average expenditure per passenger, total passenger
expenditures, and total tourism expenditures. Puerto Rico ranks first in average expenditure per
crew and second in cruise lines expenditures (see Table 13).
Table 13. Profiles of Cruise Tourism in Barbados, St. Maarten and Puerto Rico
Destination Barbados St. Maarten Puerto Rico
Indicator (Value/Rank) Value Rank Value Rank Value Rank
Passenger Onshore Visits (thousands) 554 14 1,854 3 1,394 6
Average Expenditure per Passenger
(US$) 78 18 191 1 88 11
Total Passenger Expenditures (US$
millions) 43 14 355 1 124 7
Crew Visits (thousands) 110.5 9 377 3 234 6
Average Expenditure per Crew (US$) 40 27 119 2 144 1
Total Crew Expenditures (US$ millions) 4.5 14 45 2 35 4
Cruise Lines Expenditures
(US$ millions) 10 11 23 8 39 2
Total Tourism Expenditures
(US$ millions) 57 14 423 1 198 7
Total Employment 1,845 10 9,259 2 5,209 6
Total Employee Wage Income
(US$ millions) 19.5 11 189 1 75 5
Source: BREA, 2015a.
Both St. Maarten and Puerto Rico also rank highly in visitors’ satisfaction in different indicators. For
instance, while St. Maarten ranks first in happiness with shopping experience and second in
probability of returning for a land-based or resort-vacation, Puerto Rico ranks third in satisfaction
with the variety of things to see and do and fifth in satisfaction with taxis and/or local
transportation, well before Barbados in both indicators.
When analyzing different prospective paths for upgrading for Barbados in the cruise tourism GVC,
the steps that both St. Maarten and Puerto Rico have taken offer insights on how to increase
economic returns from the industry. The key takeaways from each location include:
St. Maarten made critical product upgrades through capital investments to its port
infrastructure and surrounding areas through partnership agreements between cruise
companies and government organizations
Puerto Rico made significant process upgrades through the Puerto Rico Cruise Industry
Promotion and Development Act, which has allowed for targeted incentives to the sector.
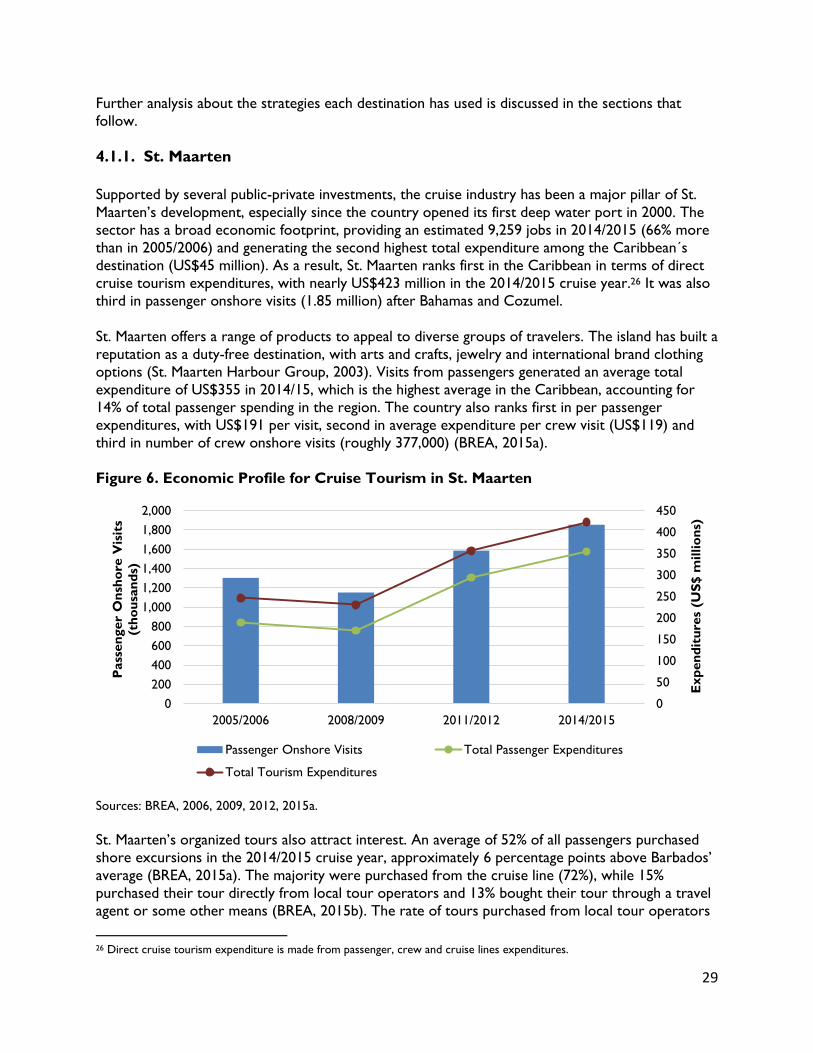
29
Further analysis about the strategies each destination has used is discussed in the sections that
follow.
4.1.1. St. Maarten
Supported by several public-private investments, the cruise industry has been a major pillar of St.
Maarten’s development, especially since the country opened its first deep water port in 2000. The
sector has a broad economic footprint, providing an estimated 9,259 jobs in 2014/2015 (66% more
than in 2005/2006) and generating the second highest total expenditure among the Caribbean´s
destination (US$45 million). As a result, St. Maarten ranks first in the Caribbean in terms of direct
cruise tourism expenditures, with nearly US$423 million in the 2014/2015 cruise year.26 It was also
third in passenger onshore visits (1.85 million) after Bahamas and Cozumel.
St. Maarten offers a range of products to appeal to diverse groups of travelers. The island has built a
reputation as a duty-free destination, with arts and crafts, jewelry and international brand clothing
options (St. Maarten Harbour Group, 2003). Visits from passengers generated an average total
expenditure of US$355 in 2014/15, which is the highest average in the Caribbean, accounting for
14% of total passenger spending in the region. The country also ranks first in per passenger
expenditures, with US$191 per visit, second in average expenditure per crew visit (US$119) and
third in number of crew onshore visits (roughly 377,000) (BREA, 2015a).
Figure 6. Economic Profile for Cruise Tourism in St. Maarten
Sources: BREA, 2006, 2009, 2012, 2015a.
St. Maarten’s organized tours also attract interest. An average of 52% of all passengers purchased
shore excursions in the 2014/2015 cruise year, approximately 6 percentage points above Barbados’
average (BREA, 2015a). The majority were purchased from the cruise line (72%), while 15%
purchased their tour directly from local tour operators and 13% bought their tour through a travel
agent or some other means (BREA, 2015b). The rate of tours purchased from local tour operators
26 Direct cruise tourism expenditure is made from passenger, crew and cruise lines expenditures.
0
50
100
150
200
250
300
350
400
450
0
200
400
600
800
1,000
1,200
1,400
1,600
1,800
2,000
2005/2006 2008/2009 2011/2012 2014/2015
Exp
en
dit
ure
s (U
S$ m
illio
ns)
Pass
en
ger
On
sho
re V
isit
s
(th
ou
san
ds)
Passenger Onshore Visits Total Passenger Expenditures
Total Tourism Expenditures
30
in St. Maarten is 12 percentage points above the Barbados’ average, which suggests that St. Maarten’
cruise industry has stronger linkages with local SMEs.
Aggregated, the vibrant individual segments of the cruise value chain in St. Maarten promote
spillovers into more traditional leisure tourism and functional upgrading. In the 2014/2015 cruise
season, 62% of visitors said they were likely to return to the island for a land-based or resort
vacation, which was the second-highest ranking in the region (BREA, 2015a). Table A-5 in the
Appendix provides further detail on upgrading observed in St. Maarten. From 2005/06 to 2014/15
passenger and crew onshore visits increased by 42% and 26%, respectively, while average
expenditure per passenger grew from US$145 to US$191. The higher passenger expenditures
supported increases in the total number of jobs (up 66% in the period from 2005/06) and wages (up
90%); overall, St. Maarten ranks first in the Caribbean in income impact and the second highest
employment impact (BREA, 2015a).
Upgrading Trajectories and Policies
St. Maarten entry and upgrading in the cruise tourism GVC took place after significant capital
investments and attention to the sector from the government. Broadly, three upgrading trajectories
can be observed: 1) Product upgrading, with the construction of various infrastructure
improvements; 2) Process upgrading, with establishment and strengthening of agencies and other
bodies designed to enhance visitors’ land-based experiences; and 3) Functional upgrading, with the
development and exports of IT services related to the cruise and tourism industry. The following
section explores the development of the St. Maarten industry in greater detail, providing relevant
details on government policy that supported the upgrading.
Product upgrading with construction of various infrastructure improvements. St.
Maarten opened its only deep-water port in 2000.27 Nine years later, the island completed
significant investments in a second pier and the development of a successful waterfront
boardwalk and pedestrian shopping district. The project started in 2002 when the cruise lines
operating in St. Maarten partnered with the government owned company Port St. Maarten
Harbor Group of Companies (PSGC) and co-financed the second pier, which now
accommodates the largest cruise vessels in the world.28 The St. Maarten Harbour Group of
Companies invest not only in the port itself, but also in its surrounding community—in 2013,
the group finalized the construction of the Simpson Bay Lagoon Causeway, a US$50 million
bridge built over an adjacent lagoon to alleviate traffic congestions for tours and improve the
area that surrounds the main street of the island. The causeway was also built with the
intention of lessening the impact of the cruise industry operations on the environment.
Process upgrading with establishment and strengthening of agencies, instruments
and other bodies designed to enhance visitors’ land-based experiences. The
construction of the second pier was accompanied by the installment of two booths for
passenger screening, which expedites passenger disembarking. These developments enhance
St. Maarten’s ability to maintain long-term business relationships with major cruise lines while
also nurturing cooperation between local stakeholders and global companies. More recently,
27 Unless otherwise cited, the information in this section has been retrieved from the Port St. Maarten website:
http://www.portstmaarten.com/. 28 The PSGC is a wholly government-owned group of companies, which owns and operates a diverse range of maritime-related
facilities across the island.
31
the government established in 2016 the St. Maarten Tourism Authority (STA). The
organization consists of a board with industry representatives and supervisory council whose
main responsibilities are destination marketing and product development (St. Maarten Today,
2016). STA’s primary purpose is to assist temporarily in carrying out the tourism policy of the
Government of St. Maarten as a tourist destination; to support the growth of St. Maarten’s
land- and sea-based tourism by providing the public and private sectors with focused,
sustainable and productive marketing; and to enhance overall visitor experience. In addition,
the St. Maarten port launched a survey of customer satisfaction in 2017 to better understand
at a local level what is important to the customer and enhance destination experiences.
Functional upgrading with the development and exports of IT services related to
the cruise and tourism industry. The upgrading in the cruise tourism GVC of St. Maarten
has been further accomplished by the development and implementation of the GLS software
at St. Maarten’s cargo handling in cooperation of a Dutch-based IT firm, which led to the birth
of the SMHC Consultancy Company. This firm provides the Caribbean area with port
consultancy software and services, such as fueling operations and terminal management, as
well as skill outsourcing of St. Maarten’s highly trained mechanics to other regional ports
having similar equipment, which entails services exports.
Port St. Maarten is prepared to handle larger sized-vessels that cruise companies are adding to their
fleets (see Global section). Additionally, the St. Maarten Port will develop a new attraction, “The
Dutch Village” and expand both shopping and dining facilities to include more refined offerings; it
will be constructed on 14,000 square meters and include cobble stone streets, water gates and
bridges, as well as an authentic windmill. There will also be a fashion outlet with four stores, a trade
house with five shops, an arts and crafts and building with ground floor shopping, a first-floor
restaurant and a bar and lounge on the second floor, a chapel and an ocean side restaurant. The
project is estimated at US$40 million and it will be financed by the private developers of the Blue
Mall and St. Maarten Port Services, as well as by stores involved in the project (St. Maarten Today,
2012).
4.1.2. Puerto Rico
The cruise industry is a major part of Puerto Rico’s tourism profile and one of the biggest
contributors to the local economy. Located in the center of the Caribbean in relatively close
proximity to the eastern United States, the location offers a good port/harbor network and a highly
attractive colonial and Hispanic cultural legacy (WTO, 2008). Puerto Rico ranks first in average
expenditure per crew and second in cruise line expenditures, with US$149 and US$39 million,
respectively, in 2014/15. Half of crew expenditures were concentrated on retail purchases of
clothing, electronics and food and beverages, followed by jewelry, ground transportation and
cosmetics. Additionally, its position as a major home port supports strong linkages with the local
economy. Cruise line expenditures on the purchase of ship supplies is higher than in most other
destinations, accounting for about one-third of the total expenditures made by cruise lines in the
region (BREA, 2015a).
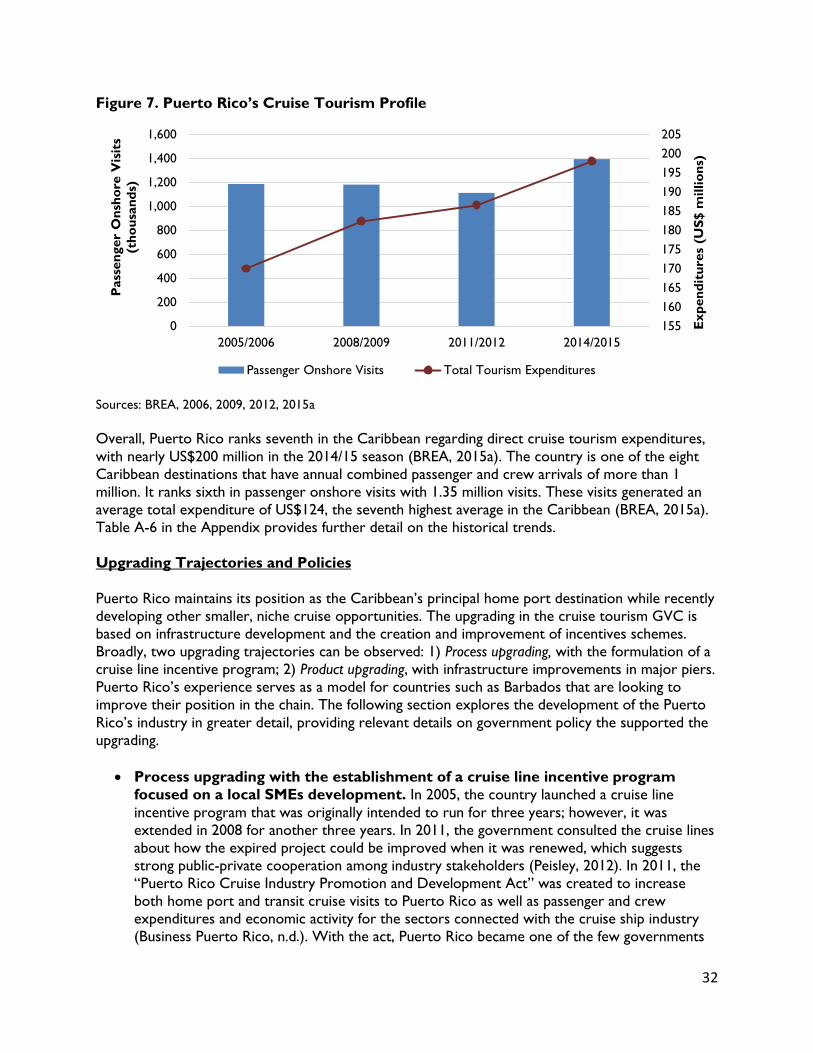
32
Figure 7. Puerto Rico’s Cruise Tourism Profile
Sources: BREA, 2006, 2009, 2012, 2015a
Overall, Puerto Rico ranks seventh in the Caribbean regarding direct cruise tourism expenditures,
with nearly US$200 million in the 2014/15 season (BREA, 2015a). The country is one of the eight
Caribbean destinations that have annual combined passenger and crew arrivals of more than 1
million. It ranks sixth in passenger onshore visits with 1.35 million visits. These visits generated an
average total expenditure of US$124, the seventh highest average in the Caribbean (BREA, 2015a).
Table A-6 in the Appendix provides further detail on the historical trends.
Upgrading Trajectories and Policies
Puerto Rico maintains its position as the Caribbean’s principal home port destination while recently
developing other smaller, niche cruise opportunities. The upgrading in the cruise tourism GVC is
based on infrastructure development and the creation and improvement of incentives schemes.
Broadly, two upgrading trajectories can be observed: 1) Process upgrading, with the formulation of a
cruise line incentive program; 2) Product upgrading, with infrastructure improvements in major piers.
Puerto Rico’s experience serves as a model for countries such as Barbados that are looking to
improve their position in the chain. The following section explores the development of the Puerto
Rico’s industry in greater detail, providing relevant details on government policy the supported the
upgrading.
Process upgrading with the establishment of a cruise line incentive program
focused on a local SMEs development. In 2005, the country launched a cruise line
incentive program that was originally intended to run for three years; however, it was
extended in 2008 for another three years. In 2011, the government consulted the cruise lines
about how the expired project could be improved when it was renewed, which suggests
strong public-private cooperation among industry stakeholders (Peisley, 2012). In 2011, the
“Puerto Rico Cruise Industry Promotion and Development Act” was created to increase
both home port and transit cruise visits to Puerto Rico as well as passenger and crew
expenditures and economic activity for the sectors connected with the cruise ship industry
(Business Puerto Rico, n.d.). With the act, Puerto Rico became one of the few governments
155
160
165
170
175
180
185
190
195
200
205
0
200
400
600
800
1,000
1,200
1,400
1,600
2005/2006 2008/2009 2011/2012 2014/2015
Exp
en
dit
ure
s (U
S$ m
illio
ns)
Pass
en
ger
On
sho
re V
isit
s
(th
ou
san
ds)
Passenger Onshore Visits Total Tourism Expenditures
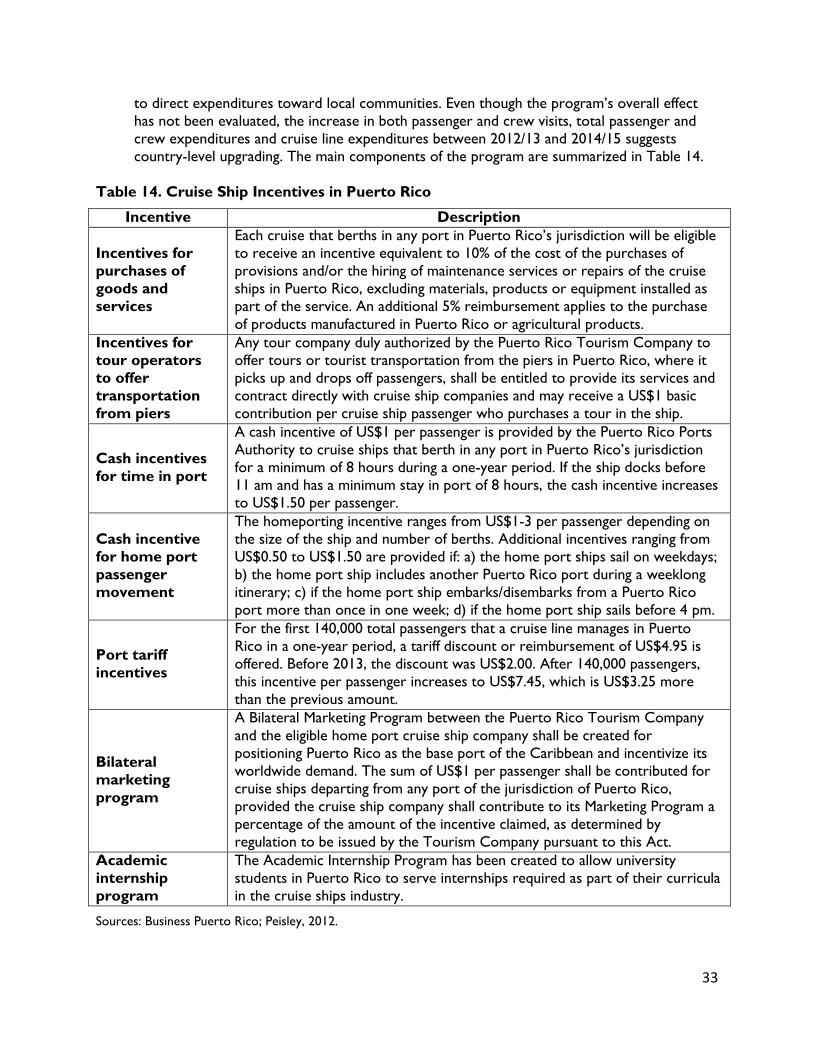
33
to direct expenditures toward local communities. Even though the program’s overall effect
has not been evaluated, the increase in both passenger and crew visits, total passenger and
crew expenditures and cruise line expenditures between 2012/13 and 2014/15 suggests
country-level upgrading. The main components of the program are summarized in Table 14.
Table 14. Cruise Ship Incentives in Puerto Rico
Incentive Description
Incentives for
purchases of
goods and
services
Each cruise that berths in any port in Puerto Rico’s jurisdiction will be eligible
to receive an incentive equivalent to 10% of the cost of the purchases of
provisions and/or the hiring of maintenance services or repairs of the cruise
ships in Puerto Rico, excluding materials, products or equipment installed as
part of the service. An additional 5% reimbursement applies to the purchase
of products manufactured in Puerto Rico or agricultural products.
Incentives for
tour operators
to offer
transportation
from piers
Any tour company duly authorized by the Puerto Rico Tourism Company to
offer tours or tourist transportation from the piers in Puerto Rico, where it
picks up and drops off passengers, shall be entitled to provide its services and
contract directly with cruise ship companies and may receive a US$1 basic
contribution per cruise ship passenger who purchases a tour in the ship.
Cash incentives
for time in port
A cash incentive of US$1 per passenger is provided by the Puerto Rico Ports
Authority to cruise ships that berth in any port in Puerto Rico’s jurisdiction
for a minimum of 8 hours during a one-year period. If the ship docks before
11 am and has a minimum stay in port of 8 hours, the cash incentive increases
to US$1.50 per passenger.
Cash incentive
for home port
passenger
movement
The homeporting incentive ranges from US$1-3 per passenger depending on
the size of the ship and number of berths. Additional incentives ranging from
US$0.50 to US$1.50 are provided if: a) the home port ships sail on weekdays;
b) the home port ship includes another Puerto Rico port during a weeklong
itinerary; c) if the home port ship embarks/disembarks from a Puerto Rico
port more than once in one week; d) if the home port ship sails before 4 pm.
Port tariff
incentives
For the first 140,000 total passengers that a cruise line manages in Puerto
Rico in a one-year period, a tariff discount or reimbursement of US$4.95 is
offered. Before 2013, the discount was US$2.00. After 140,000 passengers,
this incentive per passenger increases to US$7.45, which is US$3.25 more
than the previous amount.
Bilateral
marketing
program
A Bilateral Marketing Program between the Puerto Rico Tourism Company
and the eligible home port cruise ship company shall be created for
positioning Puerto Rico as the base port of the Caribbean and incentivize its
worldwide demand. The sum of US$1 per passenger shall be contributed for
cruise ships departing from any port of the jurisdiction of Puerto Rico,
provided the cruise ship company shall contribute to its Marketing Program a
percentage of the amount of the incentive claimed, as determined by
regulation to be issued by the Tourism Company pursuant to this Act.
Academic
internship
program
The Academic Internship Program has been created to allow university
students in Puerto Rico to serve internships required as part of their curricula
in the cruise ships industry.
Sources: Business Puerto Rico; Peisley, 2012.
34
Product upgrading with infrastructure improvements in major piers and
development of pre- and post-cruise tours. The growth in cruise ship passengers
experienced by the San Juan port in the last five years is a result of several other sets of
strategies and investments. One of the most important was improvement to the San Juan
port that allowed Disney cruise ships to dock at the facility. An additional critical expansion
was the US$8 million reform of Pier 3, which favored the visit of largest cruise ships
(Business View Caribbean, 2016).
5. Recommended Upgrading Trajectories for Barbados
Barbados’ upgrading path in the cruise tourism GVC can follow some of these examples. It is worth
accentuating that upgrading in tourism is rarely linear; the government can pursue multiple
strategies at the same time. The overarching goal of these efforts is to increase both passenger
arrivals and expenditures, thereby providing increased economic benefits for small businesses. The
most immediate upgrading trajectories that will accomplish these aims include:
1. Short-Term Process Upgrading to Strengthen Backward Linkages with SMEs to
Cruise Tourism: Barbados’ government has taken important steps in recent years to boost
the competitiveness of the cruise sector. The former Barbados Tourism Authority was split
into BTMI and BTPA, with BTMI having a unit that focuses exclusively on the cruise sector.
While those and previous efforts have allowed the government to continue to engage
important stakeholders such as Carnival, the FCCA and others, the focus moving forward
should be to continue to bolster the capabilities of Barbadian businesses with the goal of
increasing backward linkages with the local economy. Both passengers and cruise companies
have indicated there is a clear need for Barbados to refresh its onshore experiences. This
provides opportunity for new SMEs to engage in the sector. The Small Business Centre (SBC)
that is a division of the Barbados Investment & Development Center (BIDC) can be an active
participant—it engages with local entrepreneurs and businesses with workshops and other
services designed to enhance their efficiency and innovation potential. There are different
strategic areas the government can concentrate its efforts to allow for this upgrading
trajectory to emerge, including the following: 1) Human capital development within SMEs; and
2) Cultivating greater links between cruise companies and SMEs; and 3) Expanding cruise
passengers’ access to SMEs.
2. Short-to-Medium Term Product Upgrading to Improve Infrastructure: The
products available to cruise consumers visiting Barbados require reinvigoration. Some of the
potential improvements have been identified by government stakeholders, with the Sugar
Point development being the most prominent example. In the absence of immediate funding
for port infrastructure, Barbados can concentrate on more economical upgrades that
nonetheless enhance tourism products. Physical improvements or improved product offerings
in retail spaces are the focus for this upgrading trajectory.
3. Short-to-Medium Term Functional Upgrading to Increase Number of Stay-Over
Visitors from Cruises: Barbados has engaged in product and functional upgrading through
its position as a home port for Carnival Cruise Lines. However, the benefits associated with
this upgrading have been muted since only 8% of home port passengers spend at least one
night in Barbados (Field Research, 2017). Increasing the number of both home port
passengers who stay on the island for an extended period can further engage businesses and

35
categories of actors who do not currently participate in the cruise tourism chain because of
time constraints. Additionally, expanding the number of visitors who return to Barbados after
cruises can drive further economic spillovers into the conventional leisure tourism chain as
well as strengthening linkages with related industries (rum, agriculture, etc.).
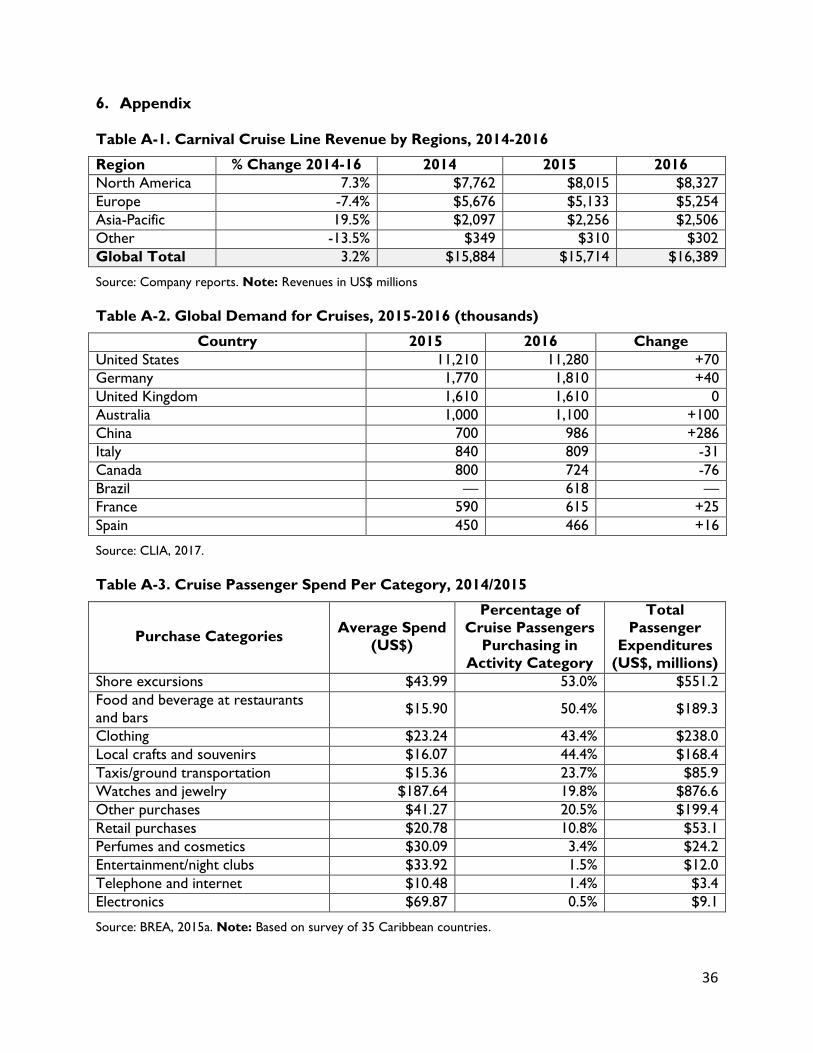
36
6. Appendix Table A-1. Carnival Cruise Line Revenue by Regions, 2014-2016
Region % Change 2014-16 2014 2015 2016
North America 7.3% $7,762 $8,015 $8,327
Europe -7.4% $5,676 $5,133 $5,254
Asia-Pacific 19.5% $2,097 $2,256 $2,506
Other -13.5% $349 $310 $302
Global Total 3.2% $15,884 $15,714 $16,389
Source: Company reports. Note: Revenues in US$ millions
Table A-2. Global Demand for Cruises, 2015-2016 (thousands)
Country 2015 2016 Change
United States 11,210 11,280 +70
Germany 1,770 1,810 +40
United Kingdom 1,610 1,610 0
Australia 1,000 1,100 +100
China 700 986 +286
Italy 840 809 -31
Canada 800 724 -76
Brazil — 618 —
France 590 615 +25
Spain 450 466 +16
Source: CLIA, 2017.
Table A-3. Cruise Passenger Spend Per Category, 2014/2015
Purchase Categories Average Spend
(US$)
Percentage of
Cruise Passengers
Purchasing in
Activity Category
Total
Passenger
Expenditures
(US$, millions)
Shore excursions $43.99 53.0% $551.2
Food and beverage at restaurants
and bars $15.90 50.4% $189.3
Clothing $23.24 43.4% $238.0
Local crafts and souvenirs $16.07 44.4% $168.4
Taxis/ground transportation $15.36 23.7% $85.9
Watches and jewelry $187.64 19.8% $876.6
Other purchases $41.27 20.5% $199.4
Retail purchases $20.78 10.8% $53.1
Perfumes and cosmetics $30.09 3.4% $24.2
Entertainment/night clubs $33.92 1.5% $12.0
Telephone and internet $10.48 1.4% $3.4
Electronics $69.87 0.5% $9.1
Source: BREA, 2015a. Note: Based on survey of 35 Caribbean countries.
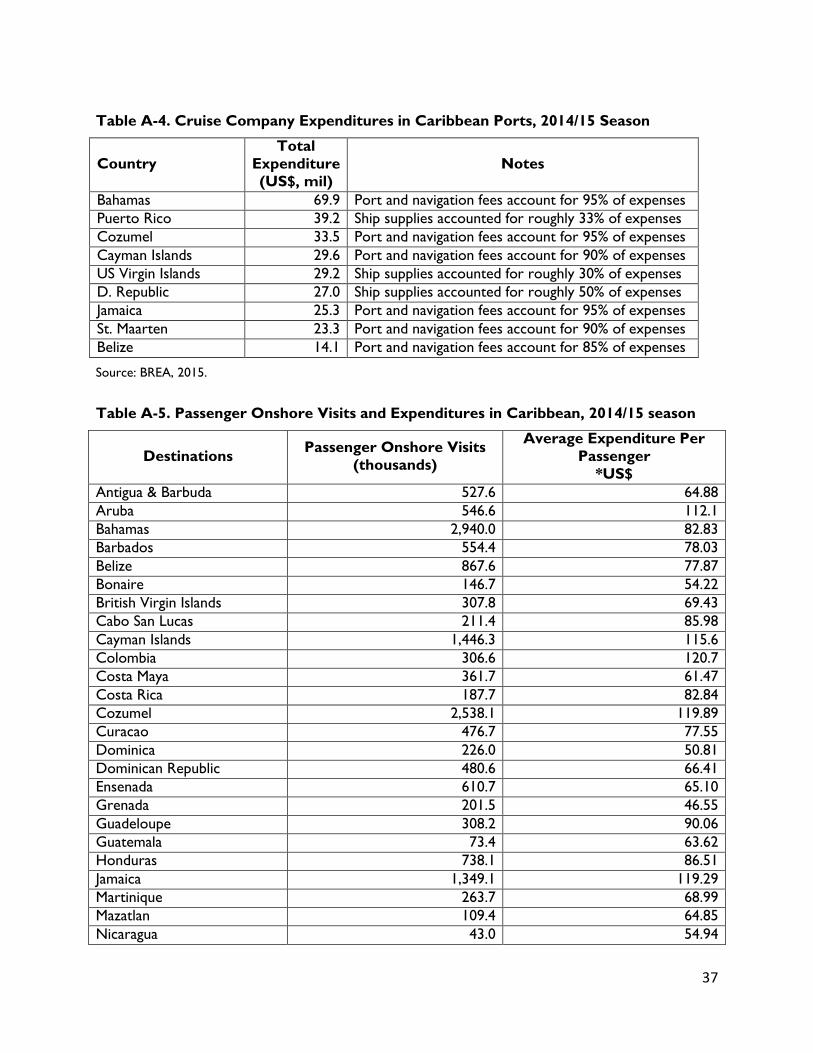
37
Table A-4. Cruise Company Expenditures in Caribbean Ports, 2014/15 Season
Country
Total
Expenditure
(US$, mil)
Notes
Bahamas 69.9 Port and navigation fees account for 95% of expenses
Puerto Rico 39.2 Ship supplies accounted for roughly 33% of expenses
Cozumel 33.5 Port and navigation fees account for 95% of expenses
Cayman Islands 29.6 Port and navigation fees account for 90% of expenses
US Virgin Islands 29.2 Ship supplies accounted for roughly 30% of expenses
D. Republic 27.0 Ship supplies accounted for roughly 50% of expenses
Jamaica 25.3 Port and navigation fees account for 95% of expenses
St. Maarten 23.3 Port and navigation fees account for 90% of expenses
Belize 14.1 Port and navigation fees account for 85% of expenses
Source: BREA, 2015.
Table A-5. Passenger Onshore Visits and Expenditures in Caribbean, 2014/15 season
Destinations Passenger Onshore Visits
(thousands)
Average Expenditure Per
Passenger
*US$
Antigua & Barbuda 527.6 64.88
Aruba 546.6 112.1
Bahamas 2,940.0 82.83
Barbados 554.4 78.03
Belize 867.6 77.87
Bonaire 146.7 54.22
British Virgin Islands 307.8 69.43
Cabo San Lucas 211.4 85.98
Cayman Islands 1,446.3 115.6
Colombia 306.6 120.7
Costa Maya 361.7 61.47
Costa Rica 187.7 82.84
Cozumel 2,538.1 119.89
Curacao 476.7 77.55
Dominica 226.0 50.81
Dominican Republic 480.6 66.41
Ensenada 610.7 65.10
Grenada 201.5 46.55
Guadeloupe 308.2 90.06
Guatemala 73.4 63.62
Honduras 738.1 86.51
Jamaica 1,349.1 119.29
Martinique 263.7 68.99
Mazatlan 109.4 64.85
Nicaragua 43.0 54.94
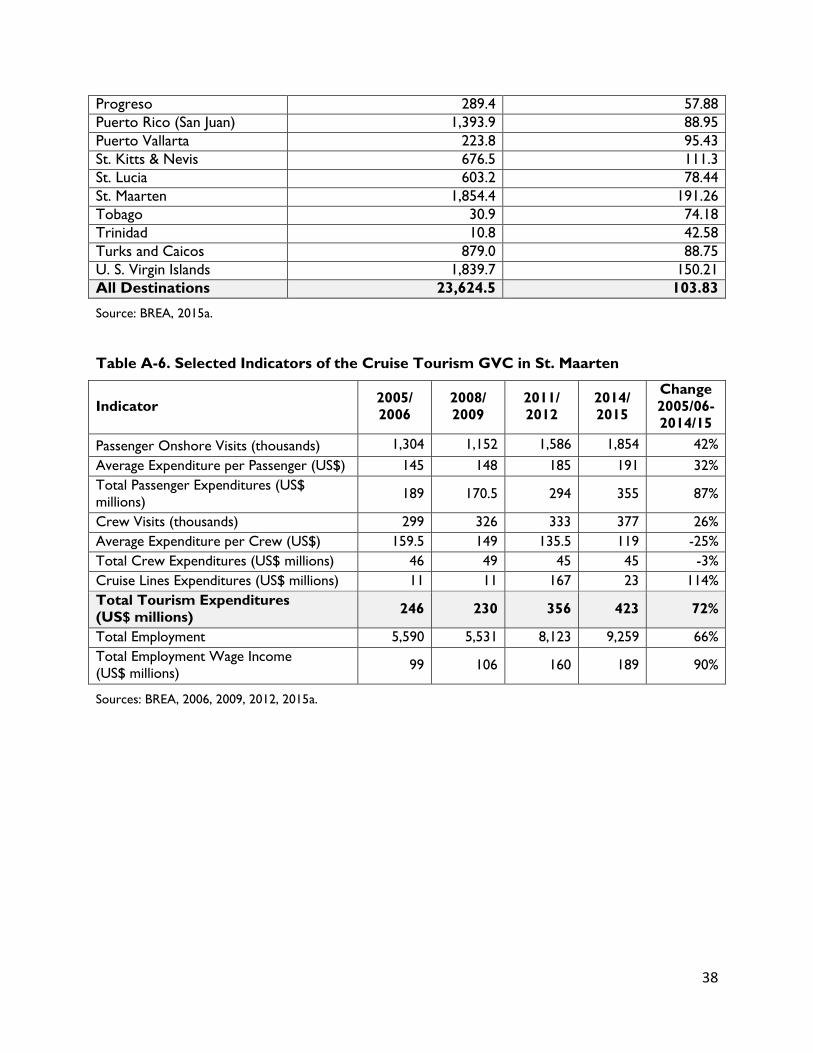
38
Progreso 289.4 57.88
Puerto Rico (San Juan) 1,393.9 88.95
Puerto Vallarta 223.8 95.43
St. Kitts & Nevis 676.5 111.3
St. Lucia 603.2 78.44
St. Maarten 1,854.4 191.26
Tobago 30.9 74.18
Trinidad 10.8 42.58
Turks and Caicos 879.0 88.75
U. S. Virgin Islands 1,839.7 150.21
All Destinations 23,624.5 103.83
Source: BREA, 2015a.
Table A-6. Selected Indicators of the Cruise Tourism GVC in St. Maarten
Indicator 2005/
2006
2008/
2009
2011/
2012
2014/
2015
Change
2005/06-
2014/15
Passenger Onshore Visits (thousands) 1,304 1,152 1,586 1,854 42%
Average Expenditure per Passenger (US$) 145 148 185 191 32%
Total Passenger Expenditures (US$
millions) 189 170.5 294 355 87%
Crew Visits (thousands) 299 326 333 377 26%
Average Expenditure per Crew (US$) 159.5 149 135.5 119 -25%
Total Crew Expenditures (US$ millions) 46 49 45 45 -3%
Cruise Lines Expenditures (US$ millions) 11 11 167 23 114%
Total Tourism Expenditures
(US$ millions) 246 230 356 423 72%
Total Employment 5,590 5,531 8,123 9,259 66%
Total Employment Wage Income
(US$ millions) 99 106 160 189 90%
Sources: BREA, 2006, 2009, 2012, 2015a.
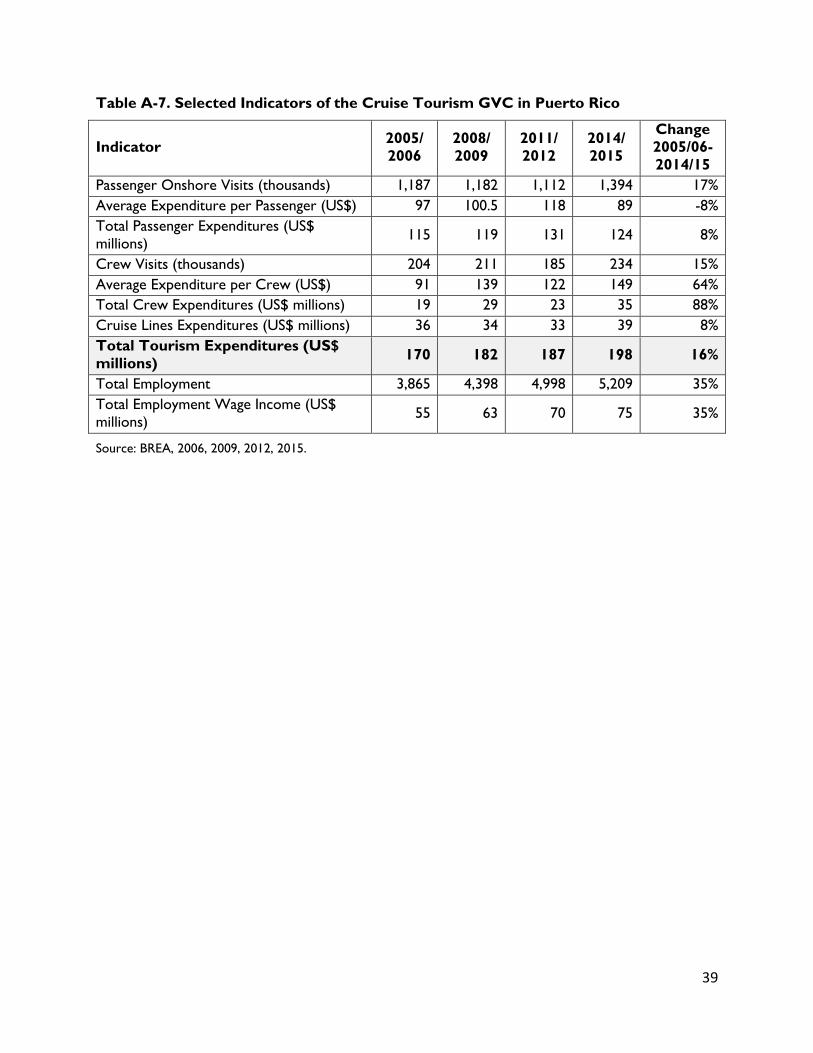
39
Table A-7. Selected Indicators of the Cruise Tourism GVC in Puerto Rico
Indicator 2005/
2006
2008/
2009
2011/
2012
2014/
2015
Change
2005/06-
2014/15
Passenger Onshore Visits (thousands) 1,187 1,182 1,112 1,394 17%
Average Expenditure per Passenger (US$) 97 100.5 118 89 -8%
Total Passenger Expenditures (US$
millions) 115 119 131 124 8%
Crew Visits (thousands) 204 211 185 234 15%
Average Expenditure per Crew (US$) 91 139 122 149 64%
Total Crew Expenditures (US$ millions) 19 29 23 35 88%
Cruise Lines Expenditures (US$ millions) 36 34 33 39 8%
Total Tourism Expenditures (US$
millions) 170 182 187 198 16%
Total Employment 3,865 4,398 4,998 5,209 35%
Total Employment Wage Income (US$
millions) 55 63 70 75 35%
Source: BREA, 2006, 2009, 2012, 2015.
40
7. References
Bair, Jennifer. (2005). "Global Capitalism and Commodity Chains: Looking Back, Going Forward." Competition & Change, 9(2): 153-180.
Barrientos, Stephanie, Gary Gereffi and Arianna Rossi. (2011). "Economic and Social Upgrading in Global Production Networks: A New Paradigm for a Changing World." International Labour Review, 150(3-4): 319-340.
BPI. (2015). Annual Report 2014. Bridgetown: Barbados Port Inc. http://www.barbadosport.com/sites/default/files/annual_reports/BPI_Annual_Report_2014.pdf.
---. (2017). Barbados Port Handbook 2017-18. Bridgetown: Barbados Port Inc. ---. (n.d.). Sugar Point Barbados. Retrieved August 9, 2017 from
http://www.barbadosport.com/content/sugar-point-barbados. BREA. (2006). Economic Contribution of Cruise Tourism to the Destination Economies: A Survey-based
Analysis of the Impacts of Passenger, Crew and Cruise Line Spending: Florida-Caribbean Cruise Association. http://www.f-cca.com/downloads/2006-Caribbean-Cruise-Analysis.pdf.
---. (2009). Economic Contribution of Cruise Tourism to the Destination Economies: A Survey-based Analysis of the Impacts of Passenger, Crew and Cruise Line Spending: Florida-Caribbean Cruise Association. http://www.f-cca.com/downloads/2009-FCCA-Cruise-Analysis-Vol-I-and-2.pdf.
---. (2012). Economic Contribution of Cruise Tourism to the Destination Economies: A Survey-based Analysis of the Impacts of Passenger, Crew and Cruise Line Spending: Florida-Caribbean Cruise Association. http://www.f-cca.com/downloads/2012-Cruise-Analysis-vol-1.pdf.
---. (2015a). Economic Contribution of Cruise Tourism to the Destination Economies: A Survey-based Analysis of the Impacts of Passenger, Crew and Cruise Line Spending Florida-Caribbean Cruise Association. http://www.f-cca.com/downloads/2015-cruise-analysis-volume-1.pdf.
---. (2015b). Economic Contribution of Cruise Tourism to the Destination Economies: Destination Reports: Florida-Caribbean Cruise Association. http://www.f-cca.com/downloads/2015-cruise-analysis-volume-2.pdf.
Briceño-Garmendia, Cecilia, Heinrich Bofinger, Diana Cubas, and Maria Florencia Millán-Placci. (2014). Want to Keep Tourists Away? Keep Flying Solo: A Lesson from Small Caribbean States. Washington, DC: World Bank. https://openknowledge.worldbank.org/handle/10986/22311.
Brida, Juan Gabriel and Sandra Zapata. (2010). "Economic Impacts of Cruise Tourism: The Case of Costa Rica." Anatolia: An International Journal of Tourism and Hospitality Research, 21(2): 322-338.
BTMI. (2017). Cruise Department Marketing Plan. Barbados Tourism Marketing Inc. Business Barbados. (2017). Barbados Premier Business & Investment Publication: 2017 Edition.
Bridgetown: Business Barbados. Business Puerto Rico. (n.d.). Hospitality and Hotel Development. from
http://businessinpuertorico.com/en/incentives/incentives-by-industry/tourism. Business View Caribbean. (2016). Puerto Rico Anticipates Record-Breaking Cruise Season. Retrieved July
18, 2017, from http://businessviewcaribbean.com/puerto-rico-anticipates-record-breaking-cruise-season/.
Carnival Cruise Lines. (2017). 2016 Annual Report. http://phx.corporate-ir.net/phoenix.zhtml?c=140690&p=irol-reportsannual.
Cheong, Caroline. (2013). Impacts and Trends: A Literature Review. New York: World Monuments Fund. https://www.wmf.org/sites/default/files/article/pdfs/Charleston-Report.pdf.
Christian, Michelle. (2013). Global Value Chains, Economic Upgrading, and Gender in the Tourism Industry. In C. S. a. J. G. Reis (Ed.), Case Studies of the Horticulture, Tourism, and Call Center Industries. Washington DC: World Bank.
41
Christian, Michelle. (2015). "Tourism Global Production Networks and Uneven Social Upgrading in Kenya and Uganda’." Tourism Geographies, 18(1): 38-58.
Christian, Michelle, Karina Fernandez-Stark, Ghada Ahmed, and Gary Gereffi. (2011). The Tourism Global Value Chain: Economic Upgrading and Workforce Developmen. Durham NC: Duke University Center on Globalization, Governance & Competitiveness. http://www.cggc.duke.edu/pdfs/2011-11-11_CGGC_Tourism-Global-Value-Chain.pdf.
Christian, Michelle and Dev Nathan. (2013). Tourism Overview: Changing End Markets and Hyper Competition. Manchester: School of Environment and Development at the University of Manchester. http://www.capturingthegains.org/publications/workingpapers/wp_201326.htm.
Clancy, Michael. (2008). "Cruisin' to Exclusion: Commodity Chains, the Cruise Industry, and Development in the Caribbean." Globalizations, 5(3): 405-418.
CLIA. (2016a). Annual Report. Washington, DC: Cruise Lines International Association. http://www.cruising.org/docs/default-source/research/clia_2016_annualreport.pdf?sfvrsn=0.
---. (2016b). Cruise Industry Outlook. Washington, DC: Cruise Lines International Association. https://www.cruising.org/docs/default-source/research/2016_clia_sotci.pdf.
---. (2017). Cruise Industry Outlook. Washington, DC: Cruise Lines International Association. https://www.cruising.org/docs/default-source/research/clia-2017-state-of-the-industry.pdf?sfvrsn=0.
CTO. (2015). UK & European Travel Industry Trends & Insight Report. St. Michael, Barbados: Caribbean Tourism Office. http://content.yudu.com/A3xojy/Caribbean-Insight-15/resources/index.htm?referrerUrl=.
Daly, Jack and Gary Gereffi. (2017). Tourism Global Value Chains and Africa. Helsinki, Finland: United Nations University. https://www.wider.unu.edu/sites/default/files/wp2017-17.pdf.
Daly, Jack and Andrew Guinn. (2016). Primates and Beyond: Tourism Value Chains in East Africa. Durham, NC: Duke University Center on Globalization, Governance & Competitiveness. http://www.cggc.duke.edu/pdfs/2016-09-29_IGC_Tourism-Report_Final.pdf.
Diedrich, Amy. (2010). "Cruise ship tourism in Belize: The implications of developing cruise ship tourism in an ecotourism destination." Ocean & Coastal Management, 53: 234-244.
Dowling, Ross and Clare Weeden (2017). Cruise Ship Tourism, 2nd Edition, (Vol. 2, Dreisinger, Baz. (2014). On a Caribbean Rum Trail. New York Times. Retrieved August 9, 2017, from
https://www.nytimes.com/2014/02/23/travel/on-a-caribbean-rum-trail.html. Edward, Geralyn. (2016). Sugar Point Deal May Turn Sour. Daily Nation. Retrieved August 9, 2017, from
https://www.pressreader.com/barbados/daily-nation-barbados/20160202/281831462764970. Environment Planning Group and HLA Consultants. (2014). Barbados Tourism Master Plan 2014-2023.
Bridgetown, Barbados: Ministry of Tourism and International Transport. http://www.bhta.org/index/resources/tourism-master-plan.html.
FCCA. About the FCCA. from http://www.f-cca.com/about.html. Field Research. (2017). Barbados Field Research. Personal communication with J. Daly, V. Couto, K.
Fernandez-Stark & D. Hamrick. May Gereffi, Gary and Karina Fernandez-Stark. (2016). Global Value Chain Analysis: A Primer. Durham, NC:
Duke University Center on Globalization, Governance & Competitiveness. http://www.cggc.duke.edu/pdfs/Duke_CGGC_Global_Value_Chain_GVC_Analysis_Primer_2nd_Ed_2016.pdf.
Gui, Lorenzo and Antonio Paolo Russo. (2011). "Cruise ports: a strategic nexus between regions and global lines—evidence from the Mediterranean." Maritime Policy & Management, 38(2): 129-150.
Hil, Nicola. (2015). Floating Abominations: Exposing the Cruise Ship Industry. from https://www.tourismconcern.org.uk/floating-abominations-exposing-the-cruise-ship-industry/.
42
IFC. (2014). Assessment of the Economic Impact of Cruise Ships to Vanuatu. Washington, DC: International Finance Corporation. https://openknowledge.worldbank.org/handle/10986/23836.
---. (2016). Assessment of the Economic Impact of Cruise Tourism in Papua New Guinea and Solomon Islands. Washington DC: International Finance Corporation. https://openknowledge.worldbank.org/handle/10986/25394.
Kasriel-Alexander, Daphne. (2016). Future Watch: The Reinvention of Cruising. London, United Kingdom: Euromonitor International. http://www.euromonitor.com/.
Maddon, Marlon. (2017). Sugar Point terminal not abandoned, says Sealy. Barbados Today. February 28 Retrieved August 9, 2017, from https://www.barbadostoday.bb/2017/02/28/sugar-point-terminal-not-abandoned-says-sealy/.
Morello, Robert. (2015). The Average Salary of Cruise Ship Workers. Houston Chronicle. Retrieved August 9, 2017, from http://work.chron.com/average-salary-cruise-ship-workers-1932.html.
Norwegian Cruise Lines. (2017). 2016 Annual Report. http://www.nxtbook.com/nxtbooks/ncl/annualreport_2016/.
OSAC. (2017). Overall Crime and Safety Situation: Overseas Security Advisory Council. https://www.osac.gov/pages/ContentReportDetails.aspx?cid=21723.
Peisley, Tony. (2012). Port Fees: Who Pays Who? : Ashcroft and Associates. http://www.ashcroftandassociates.com/images/CIS-2012-Article-2.pdf.
Port St. Maarten. Passenger Port. from http://www.portstmaarten.com. Rodrigue, Jean-Paul and Theo Notteboom. (2013). "The geography of cruises: Itineraries, not
destinations." Applied Geography, 38: 31-42. Royal Caribbean. (2017). 2016 Annual Report. http://www.rclcorporate.com/content/uploads/2016-
Form-10-K-RCL-ir.pdf. Smith, Oliver. (2015). New Cruise Ship Will be World's Largest. Daily Telegraph. Retrieved August 9,
2017, from http://www.telegraph.co.uk/travel/cruises/news/New-cruise-ship-will-be-worlds-largest/.
St. Maarten Harbour Group. (2003). "St maarten--the friendly island." International Cruise & Ferry Review,,: 157.
St. Maarten Today. (2012). Blue Mall’s developers and Port Services collaborating on Dutch Village. St. Maarten Today. Retrieved August 9, 2017, from http://www.todaysxm.com/blue-malls-developers-and-port-services-collaborating-on-dutch-village/.
St. Maarten Today. (2016). St. Maarten Port reports five percent fewer cruise arrivals in 2015. St. Maarten Today. Retrieved August 9, 2017, from http://www.todaysxm.com/st-maarten-port-reports-five-percent-fewer-cruise-arrivals-in-2015/.
Terry, William. (2009). "Working on the Water: On Legal Space and Seafarer Protection in the Cruise Industry." Economic Geography, 85(4): 463–482.
UNWTO. (2016). Tourism Highlights. Madrid, Spain: United Nations World Tourism Organization. http://www.e-unwto.org/doi/pdf/10.18111/9789284418145.
Wood, Robert. (2004). Cruise Ships Deterritorialized Destinations. In L. Lumsdon & S. Page (Eds.), Tourism and Transport Issues and Agenda for the New Millennium (pp. 133-145). Amsterdam: Elsevier.
WTO. (2008). Cruise Tourism: Current Situation and Trends. Madrid (España): World Tourism Organization.
WTTC. (2017a). Global Economic Impact & Issues. London, United Kingdom: World Travel & Tourism Council. https://www.wttc.org/-/media/files/reports/economic-impact-research/2017-documents/global-economic-impact-and-issues-2017.pdf.

43
---. (2017b). Travel & Tourism: Economic Impact Barbados. London, United Kingdom: World Travel & Tourism Council. https://www.wttc.org/-/media/files/reports/economic-impact-research/countries-2017/barbados2017.pdf.
---. (2017c). Travel & Tourism: Economic Impact Caribbean. London, United Kingdom: World Travel & Tourism Council. https://www.wttc.org/-/media/files/reports/economic-impact-research/regions-2017/caribbean2017.pdf.